1. Introduction
The global transition toward a low-carbon energy system is currently facing a critical paradox. While the accelerated deployment of renewable energy technologies, such as solar photovoltaics (PV), wind turbines, and lithium-ion batteries (LIBs) for electric vehicles and grid storage, is essential for mitigating climate change, it frequently relies on a traditional linear “take-make-dispose” economic model. This linear trajectory threatens to replace a fossil fuel crisis with a critical raw material shortage, generating unprecedented volumes of complex e-waste at the end-of-life (EoL) of these technologies. Consequently, there is a growing consensus among policymakers and industry leaders that the energy transition must be strictly coupled with the principles of the circular economy (CE) to ensure long-term resource security and environmental sustainability.
The urgency of this transition is further amplified by recent institutional mandates and global assessments. At the European level, ambitious legislative frameworks such as the revised Renewable Energy Directive [
1] and the Net-Zero Industry Act (Regulation 2024/1735) [
2] are driving an unprecedented scale-up of clean energy infrastructure to secure energy independence and reach net-zero targets. However, as highlighted by the Circularity Gap Report (2025) [
3], the global economy is simultaneously experiencing a decline in overall circularity. This stark contrast underscores the critical need to embed circular principles into the rapidly expanding renewable energy sector, ensuring that the mass deployment of new technologies does not exacerbate global resource depletion.
Despite significant technological advancements in recycling and material recovery, the successful implementation of circularity in the energy sector is fundamentally a business and financial challenge. The shift from traditional energy production to circular ecosystems requires the adoption of innovative CBMs. As highlighted by [
4,
5], shifting toward circular ecosystems involves profound changes in value creation and multi-stakeholder collaboration. In practice, this materializes through paradigm-shifting strategies such as the “Battery-as-a-Service” (BaaS) and leasing models, which decouple economic growth from resource consumption by shifting the focus from product ownership to access and lifecycle management [
6,
7]. Furthermore, circularity extends to the repurposing of legacy infrastructure, such as transforming decommissioned coal mines into pumped hydro energy storage, thereby retaining the value of existing assets [
8].
The evolution of these CBMs is no longer driven solely by corporate innovation but is increasingly mandated by stringent regulatory frameworks. This shift is now being codified into law; for instance, the new EU Battery Regulation (Regulation 2023/1542) [
9] and the expanded Ecodesign for Sustainable Products Regulation (Regulation 2024/1781) [
10] enforce strict lifecycle standards. These regulations compel energy and mobility stakeholders to adopt models that guarantee component traceability, establish secondary markets for reuse, and mandate minimum recycled content, thereby legally binding the industry to circular material flows [
11].
Despite technological progress, implementing circularity in the energy sector remains a profound business and managerial challenge rather than purely an engineering one. Historically, the literature has approached the circular economy predominantly from an engineering perspective, focusing on thermodynamic optimization, life-cycle assessments, and technical material recovery. However, this techno-centric view frequently overlooks the financial viability, market adoption constraints, and the necessity of integrated governance architectures. To bridge this conceptual gap, it is imperative to define circular business models (CBMs) not merely as waste-management strategies, but as strategic frameworks that decouple value creation from resource consumption by shifting from product ownership to performance-based access (e.g., servitization). Consequently, green finance must be understood as the specific ecosystem of capital instruments, such as targeted subsidies, green bonds, and ESG-linked debt, designed to de-risk these high-CAPEX sustainable investments and support their commercial scaling.
Furthermore, the transition to these CBMs is not geographically uniform; it is deeply embedded within Regional Innovation Systems (RIS). Regional policy frameworks, local actor constellations, and targeted subsidies dictate how circular innovations are scaled, highlighting the critical need for an approach that considers the socio-economic embeddedness of the energy transition. A systemic integration of green finance and regional innovation policies is required to prevent the fragmentation of financial flows and to ensure that capital translates into tangible decarbonization outcomes.
However, the transition toward these innovative CBMs is significantly hindered by a persistent “financing gap” and high initial capital expenditures (CAPEX). Circular energy projects, particularly decentralized or small-scale facilities, often struggle to achieve financial viability without targeted economic enablers. For instance, small-scale biogas plants face severe profitability barriers and rely heavily on feed-in tariffs to survive the initial investment phase [
12]. It was demonstrated that the economic feasibility of circular bioenergy systems is often strictly dependent on the implementation of a carbon tax, which internalizes the environmental benefits into the financial baseline [
13]. Beyond subsidies, the sustainability of corporate debt is a major concern; many circular energy firms are over-leveraged, making the interest coverage ratio (ICR) a critical metric for their survival [
14]. To overcome these hurdles, the sector is increasingly turning to green financing mechanisms, including ESG (environmental, social, and governance) integrated frameworks [
15] and alternative funding avenues like equity crowdfunding [
16] to attract capital tailored to the longer payback periods of circular projects. The European Union has pioneered this standardization through the EU Taxonomy (Delegated Regulation 2023/2486) [
17] and the European Sustainability Reporting Standards (ESRS) [
18]. Specifically, compliance with standards such as ESRS E5 (Resource Use and CE) forces energy companies to transparently disclose their material flows and circularity metrics.
Even when capital is available, severe regulatory and institutional barriers continue to hinder market scalability. The lack of industrial standardization for remanufactured components creates significant insurability and perceived investment risks, particularly in the wind energy sector [
19]. Furthermore, complex regulatory landscapes, such as the EU’s ambiguous classifications of battery waste versus secondary resources, create friction in cross-border circular supply chains [
11]. This is compounded by a “technological-regulatory gap,” where digital enablers like blockchain and smart contracts, which could vastly improve traceability in circular networks, lack legal recognition in traditional energy markets [
20].
1.1. Research Gap and Objectives
While existing literature extensively covers the engineering aspects of renewable technologies and waste management, a significant research gap remains at the intersection of energy technology, business model innovation, and financial strategy. Previous reviews have generally treated CBMs, regulatory barriers, and green finance as isolated subjects, lacking a cohesive discussion on how financial mechanisms actively shape the circular transition. There is a pressing need for a comprehensive synthesis that examines how sustainable business models are evolving in the energy sector and what specific financial and regulatory instruments are required to scale them.
To advance beyond a descriptive synthesis, this study introduces an integrated conceptual framework that explicitly connects circular strategies to specific financial requirements. We argue that the ‘commercialization gap’, the persistent chasm between technical feasibility and economic implementation, must be treated not merely as an observation, but as the core challenge driven by misaligned capital structures and institutional rigidities. By positioning this gap as our central argument, we aim to demonstrate how varying levels of the 10R hierarchy dictate specific business model configurations, which in turn require highly specific green policy instruments and financing mechanisms to achieve economic viability.
To address this gap, this systematic literature review (SLR) investigates the connection of circularity, business models, and green finance within the energy value chain. By systematically analyzing the current academic literature, this study seeks to answer the following primary research questions:
RQ1: How have circular business models evolved within the energy value chain?
RQ2: Which green financing instruments (e.g., green bonds, ESG, sustainable finance) are most prevalent in supporting these models?
RQ3: What are the critical financial and regulatory barriers hindering the circular transition in the energy sector?
By addressing these questions, this review aims to provide a holistic, evidence-based framework to help policymakers, investors, and energy stakeholders navigate the financial and regulatory complexities of the circular energy transition.
This review goes beyond traditional recycling metrics by evaluating circular strategies through the lens of the 10R hierarchy (from refuse and rethink to recover) [
21]. By doing so, this study identifies how high-order R-strategies can be technically and economically prioritized and financed in the energy sector to achieve true systemic circularity.
1.2. Conceptual Framework: Circular Business Models and Green Finance
To ensure a rigorous analysis, it is essential to define the two core pillars of this study:
Circular Business Models (CBMs): Unlike linear models based on a “take-make-dispose” logic, CBMs are designed to create, deliver, and capture value by slowing, closing, or narrowing material and energy loops. In the energy sector, this translates to strategies ranging from the life extension of infrastructure to the recovery of critical raw materials from decommissioned renewable energy assets.
Green Finance: This encompasses any structured financial activity, including products and services such as green bonds, sustainability-linked loans, and venture capital, specifically created to ensure a positive environmental outcome. In the context of this research, green finance acts as the “enabler” that bridges the high upfront capital requirements of circular energy transitions with long-term institutional investment.
The synergy between these two concepts, termed the “Regulatory-Technical Nexus” in this paper, represents the focal point for achieving the EU’s 2050 climate neutrality goals.
1.3. Structure of the Paper
The remainder of this paper is organized as follows.
Section 2 details the materials and methods, outlining the PRISMA-based literature selection and quality assessment.
Section 3 presents the results, including a bibliometric mapping and a qualitative synthesis of circular strategies evaluated through the 10R framework.
Section 4 provides a critical discussion of the findings, confronting conflicting studies and exploring geopolitical disparities. Finally,
Section 5 synthesizes the conclusions, aligning them with the research questions, and outlines actionable recommendations for future research.
2. Materials and Methods
In order to systematically investigate how CBMs and green financing mechanisms are evolving within the energy sector, a multi-stage review of the specialized literature was conducted in accordance with the PRISMA 2020 (Preferred Reporting Items for Systematic Reviews and Meta-Analyses) guidelines [
22]. While the review was not formally registered in a database such as PROSPERO, the authors strictly followed the PRISMA 2020 guidelines to ensure transparency and reproducibility (see
Supplementary Materials, File S1: PRISMA 2020 Checklist). The period selected for this study spans from
2015 to 2024, capturing the decade of intensified transition following the Paris Agreement and the subsequent surge in CE policy frameworks [
23]. The methodological process was structured into four main phases:
- (1)
Identification: An initial assessment of several high-impact academic repositories, including ScienceDirect, Scopus, Web of Science, Springer, and Google Scholar, was performed. The focus was to identify databases where journals and articles integrating circularity, energy transition, and economic enablers were most likely to be indexed.
The most relevant databases were selected based on their scientific prestige, the density of energy-related publications, and the quality of the peer-review process. While Google Scholar provides broad coverage, it was excluded as a primary source due to its lack of stringent quality-control filters [
24]. Consequently, Web of Science (WoS) and Scopus were chosen as the representative databases, as they index the most prestigious journals in the fields of sustainable energy and environmental economics. Furthermore, ScienceDirect and Springer were found to overlap significantly with WoS and Scopus [
25], reinforcing the selection of these two primary platforms.
The identification of core articles was performed using a tri-dimensional search strategy [
26] designed to isolate research at the interdisciplinary intersection of three
critical pillars: (i) the CE framework, including closed-loop systems and resource efficiency; (ii) energy sector applications, specifically renewable energy and storage technologies; and (iii) economic enablers, focusing on business model innovation and green financing mechanisms.
In both the Web of Science and Scopus databases, the search was executed against titles, abstracts, and author keywords. The syntax utilized wildcards (the asterisk symbol) to ensure that variations of terms (e.g., finance, financial, or financing) were captured. The final query was constructed as follows:
((“circular economy” OR “circularity” OR “closed-loop”) AND (“energy transition” OR “renewable energy” OR “sustainable energy” OR “battery” OR “hydrogen” OR “solar” OR “wind”) AND (“business model*” OR “CBM” OR “green financ*” OR “sustainable financ*” OR “green bond*” OR “investment*” OR “enablers”))
Searches were conducted independently by two reviewers (L.A.B. and M.V.) and last updated on 15 March 2026.
To maintain the analytical rigor required for Energies, specific inclusion and exclusion filters were applied. The study was limited to peer-reviewed original research and review articles published in English between 2015 and 2024, excluding conference proceedings, book chapters, and editorials to ensure data validity. Subject area filtering further refined the results; in Web of Science, the focus was placed on categories such as Energy Fuels, Environmental Sciences, Environmental Studies, Business, Management, Economics, Business Finance, and Green Sustainable Science Technology. In Scopus, we looked at Environmental Science, Energy, Business Management, Accounting, and Social Sciences in order to capture critical insights into sustainability governance and regulatory barriers essential for addressing the study’s third research question (RQ3).
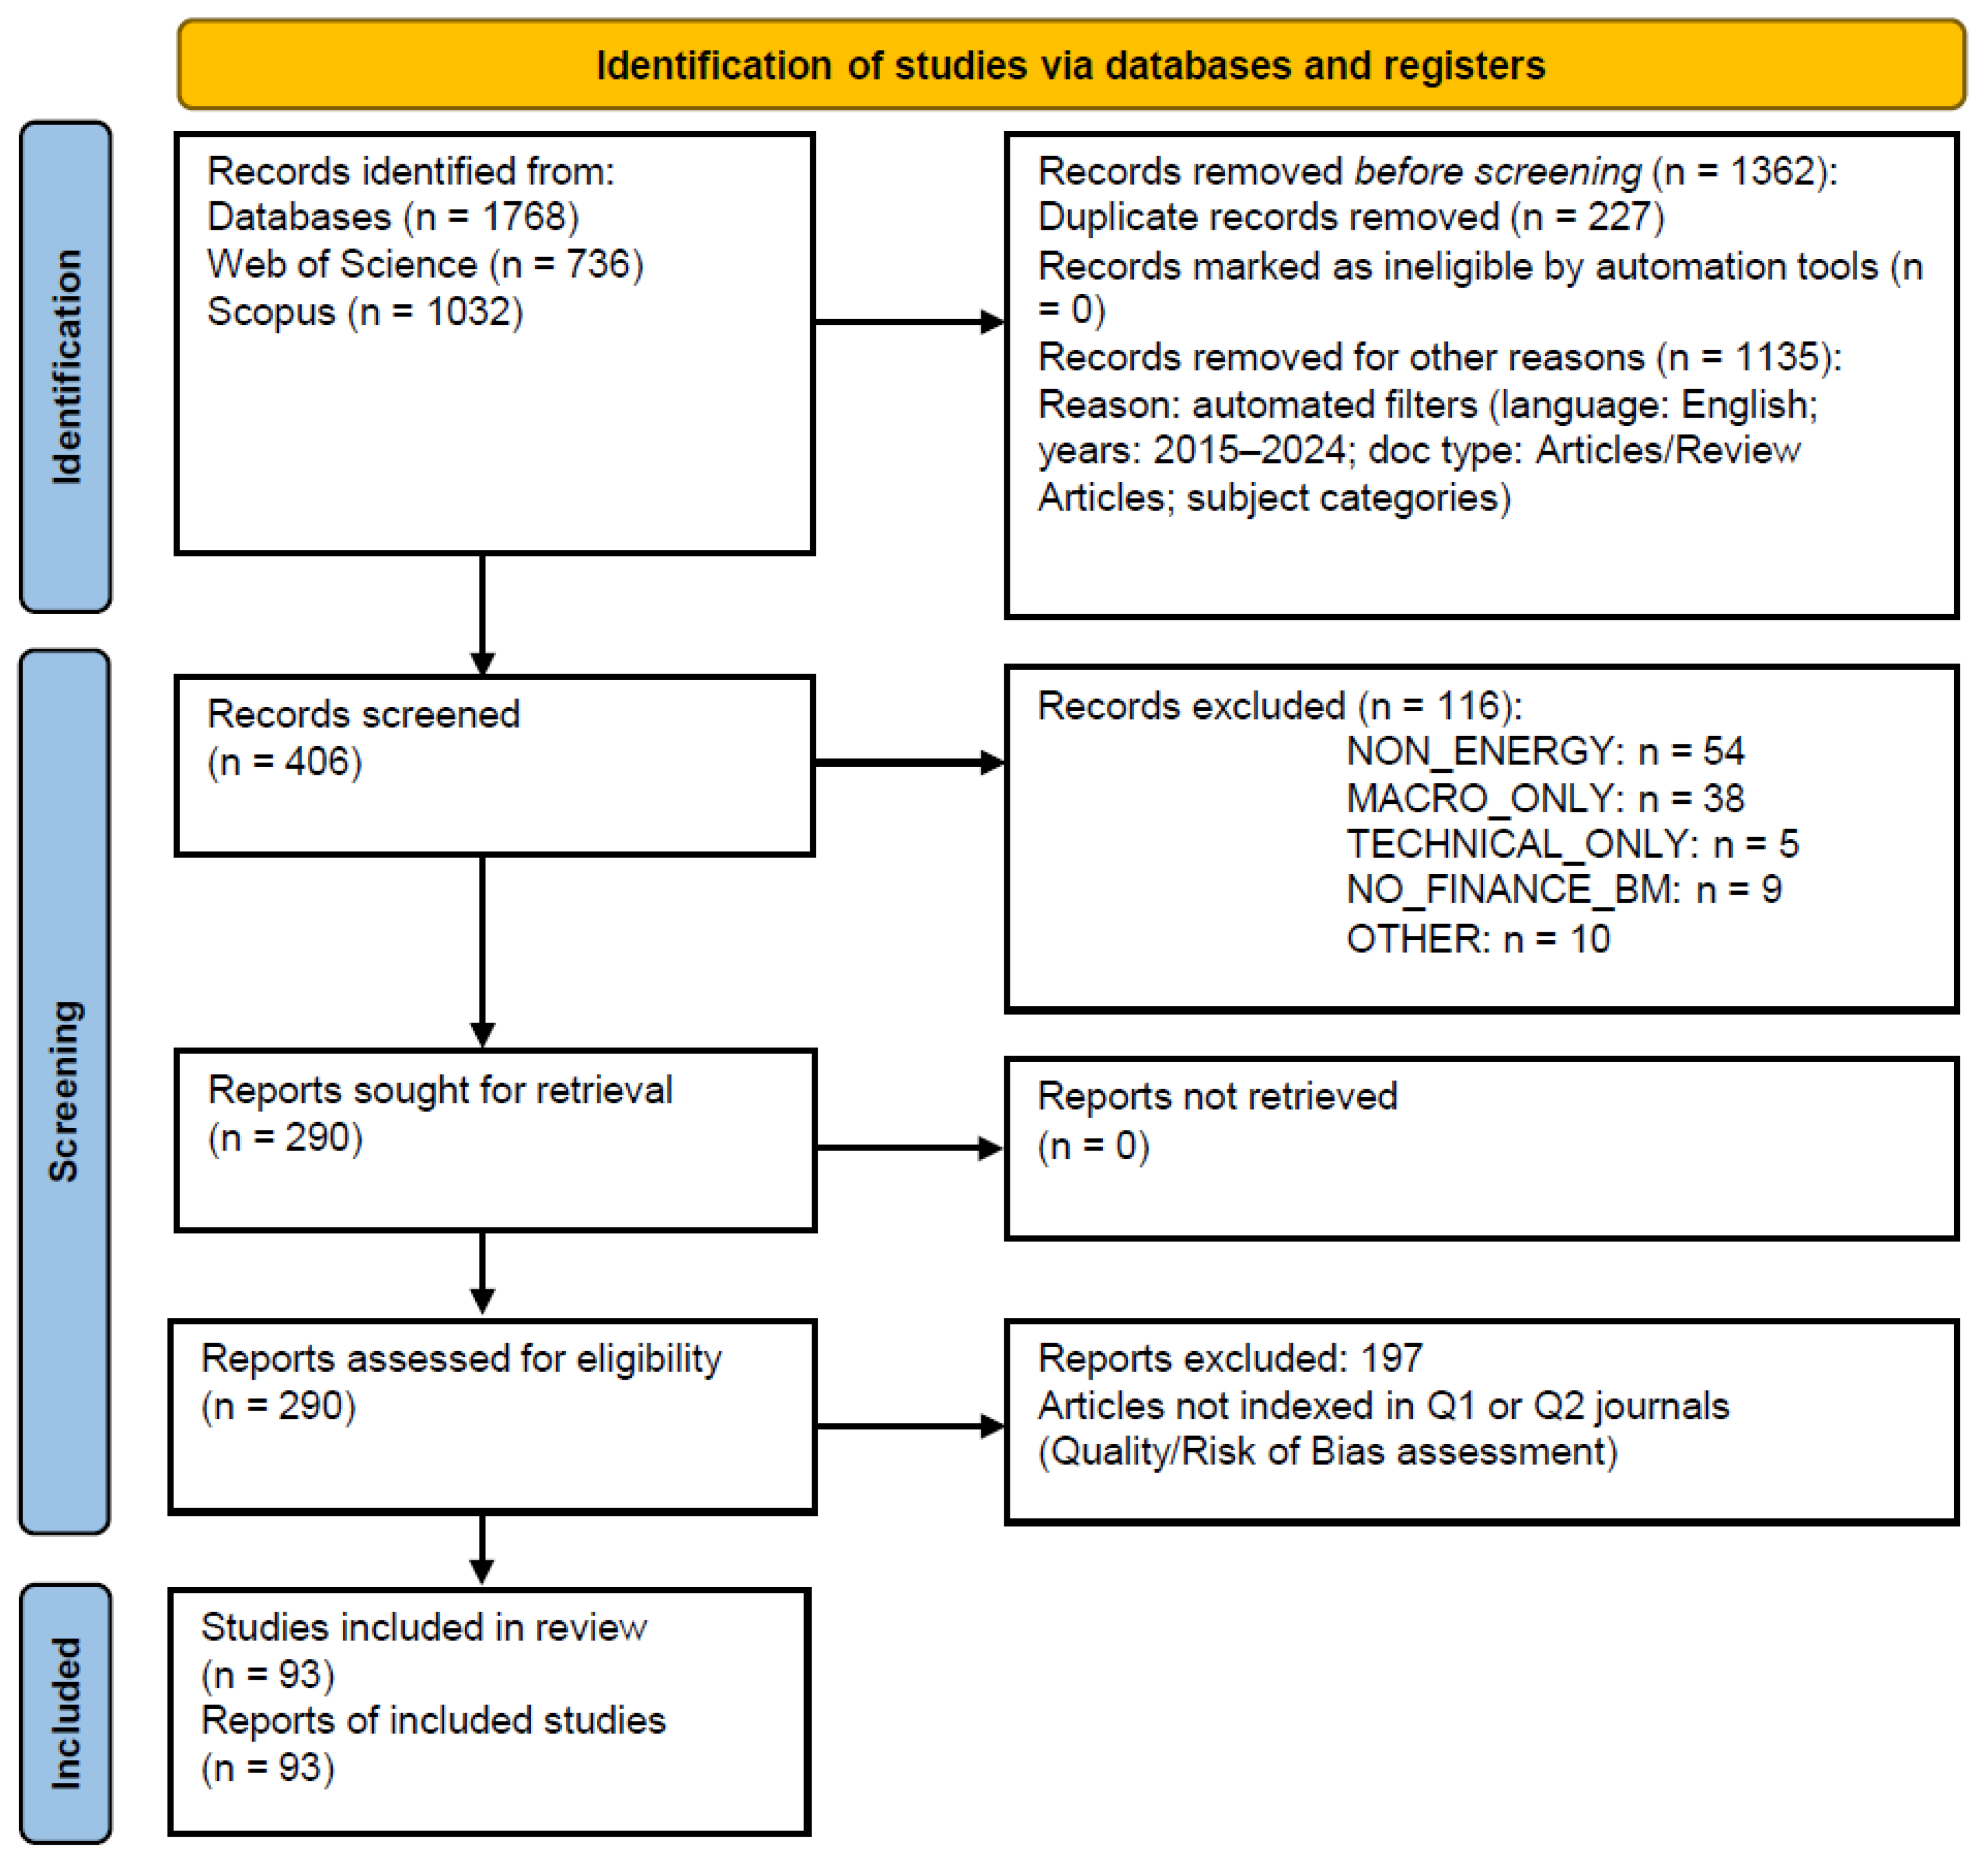
The initial search yielded a total of 1.768 records (736 from Web of Science and 1.032 from Scopus). These were first refined using automated database filters (language: English; publication years: 2015–2024; document type: article or review article; keywords/categories, limited to the ones mentioned above). The remaining records were then exported to Zotero, where duplicate entries were identified and removed, resulting in 406 unique records for screening. Following the eligibility criteria, 93 articles were ultimately included in the systematic review.
- (2)
Screening: The screening process was conducted in two distinct phases to ensure the high analytical quality required for this review. Initially, the 406 unique records were screened based on title and abstract, leading to the exclusion of 116 articles that did not align with the core themes of circularity or energy transition.
The exclusion process was guided by a rigorous set of criteria to ensure thematic alignment with the financial and business dimensions of the energy sector. As detailed in
Figure 1, the exclusion categories, ranging from a lack of empirical financial data to a strictly technical focus devoid of business model analysis, were codified using specific tags within the study’s Excel database to maintain a transparent audit trail of the selection process.
- (3)
Eligibility: Subsequently, to ensure the methodological robustness of the qualitative synthesis, a quality-based filter was applied, focusing on high-impact research journals (indexed in Scimago/JCR quartiles Q1 and Q2). To ensure the reliability of the financial and regulatory data (RQ2, RQ3), the sample was refined to include only high-impact journals specialized in cleaner production, energy policy, and environmental economics. prioritizing top-tier publications such as Renewable and Sustainable Energy Reviews, Applied Energy, and Journal of Cleaner Production. These were supplemented by specialized sources like Resources, Conservation and Recycling, and Energies to capture a comprehensive, multidisciplinary perspective. This selection strategy guarantees that the synthesis is built upon peer-reviewed evidence characterized by high scientific rigor and technical relevance to the current energy landscape.
While the application of the PRISMA framework ensures procedural transparency, the strategic decisions regarding database selection and quality-based filters inherently introduce selection bias. By excluding Google Scholar as a primary database and restricting the inclusion criteria strictly to high-impact (Q1 and Q2) journals, this review deliberately biased the sample toward mainstream, highly vetted academic literature. We acknowledge that this rigorous quality filter may have excluded valuable non-peer-reviewed industry reports, institutional working papers, regional policy documents, or niche studies from lower-quartile journals.
Furthermore, the resulting concentration of the final 93 articles within a limited number of specialized journals (e.g., Journal of Cleaner Production, Energies) is not entirely coincidental. Following Bradford’s Law of Scattering, interdisciplinary topics such as the circular energy transition naturally consolidate within a few ‘core hub’ journals that bridge the gap between engineering and environmental economics. While this guarantees the scientific rigor of the selected studies, we acknowledge it as a limitation, as it may underrepresent alternative perspectives published in purely financial or localized policy journals.
- (4)
Included: The systematic selection process culminated in a final sample of 93 high-impact peer-reviewed articles. These studies constitute the final sample for the thematic synthesis, providing the empirical and theoretical data required to address the evolution of CBMs (RQ1), their financial viability (RQ2), and the persistent regulatory barriers in the energy sector (RQ3).
To ensure a systematic analysis of the 93 retained studies, a comprehensive Data Extraction Matrix was developed (see
Supplementary Materials, File S2: DATA EXTRACTION MATRIX 3.0 and PIVOT TABLE). Each article was codified based on specific parameters aligned with the research objectives: (i) bibliographic metadata (year, journal, and country), (ii) circularity focus (categorized by the 10R framework [
21]), (iii) financial mechanisms (e.g., green bonds, ESG metrics, levelized cost of energy (LCoE)), and (iv) the specific energy sub-sector addressed (e.g., wind, solar, second-life batteries).
The qualitative synthesis utilized the 10R hierarchy (from refuse to recover) [
21] as a primary lens for assessing the depth of circularity in each business model. Furthermore, following the methodology proposed by Geissdoerfer et al. [
27], the CBMs were categorized into distinct archetypes (e.g., product-as-a-service, life extension, and resource recovery) to evaluate their operational feasibility in the energy transition context.
The analysis involved a two-fold approach: a bibliometric descriptive analysis to identify trends and a thematic synthesis to map the interconnections between financial enablers (RQ2) and regulatory barriers (RQ3). This approach allowed for the identification of research gaps and the formulation of a conceptual roadmap for future green financing in the circular energy economy.
Finally, a critical limitation inherent to systematic literature reviews is the risk of publication bias: the tendency of academic journals to publish studies with statistically significant or economically optimistic results (e.g., high ROI for circular business models) while underreporting negative or failed implementations. Because the current study is designed as a qualitative and thematic synthesis rather than a quantitative meta-analysis, the generation of statistical tools such as funnel plots to formally quantify this bias was not feasible. However, to mitigate reporting bias, our screening process actively sought to include and highlight studies that reported significant implementation barriers, economic trade-offs, and negative financial outcomes (e.g., the negative commodity value of LFP battery recycling without subsidies). The exact publication dates and metrics of all 93 included studies (ranging from 2015 to 2024) have been compiled in the
Supplementary Database to allow for transparent replication of our thematic synthesis.
3. Results
3.1. Bibliometric and Descriptive Analysis
To identify the conceptual evolution and thematic clusters of the circular energy transition, a bibliometric analysis was performed on the initial dataset of 290 eligible articles sought for retrieval. This stage employed VOSviewer (v.1.6.20) to generate co-occurrence networks of keywords and co-authorship maps. The analysis focused on three bibliometric dimensions: (i) the temporal evolution of the research focus (2015–2024) to track the transition from theoretical concepts to operational maturity, (ii) journal distribution to identify core knowledge hubs, and (iii) keyword co-occurrence patterns to map the intersections between CBMs (RQ1) and green financing (RQ2).
The
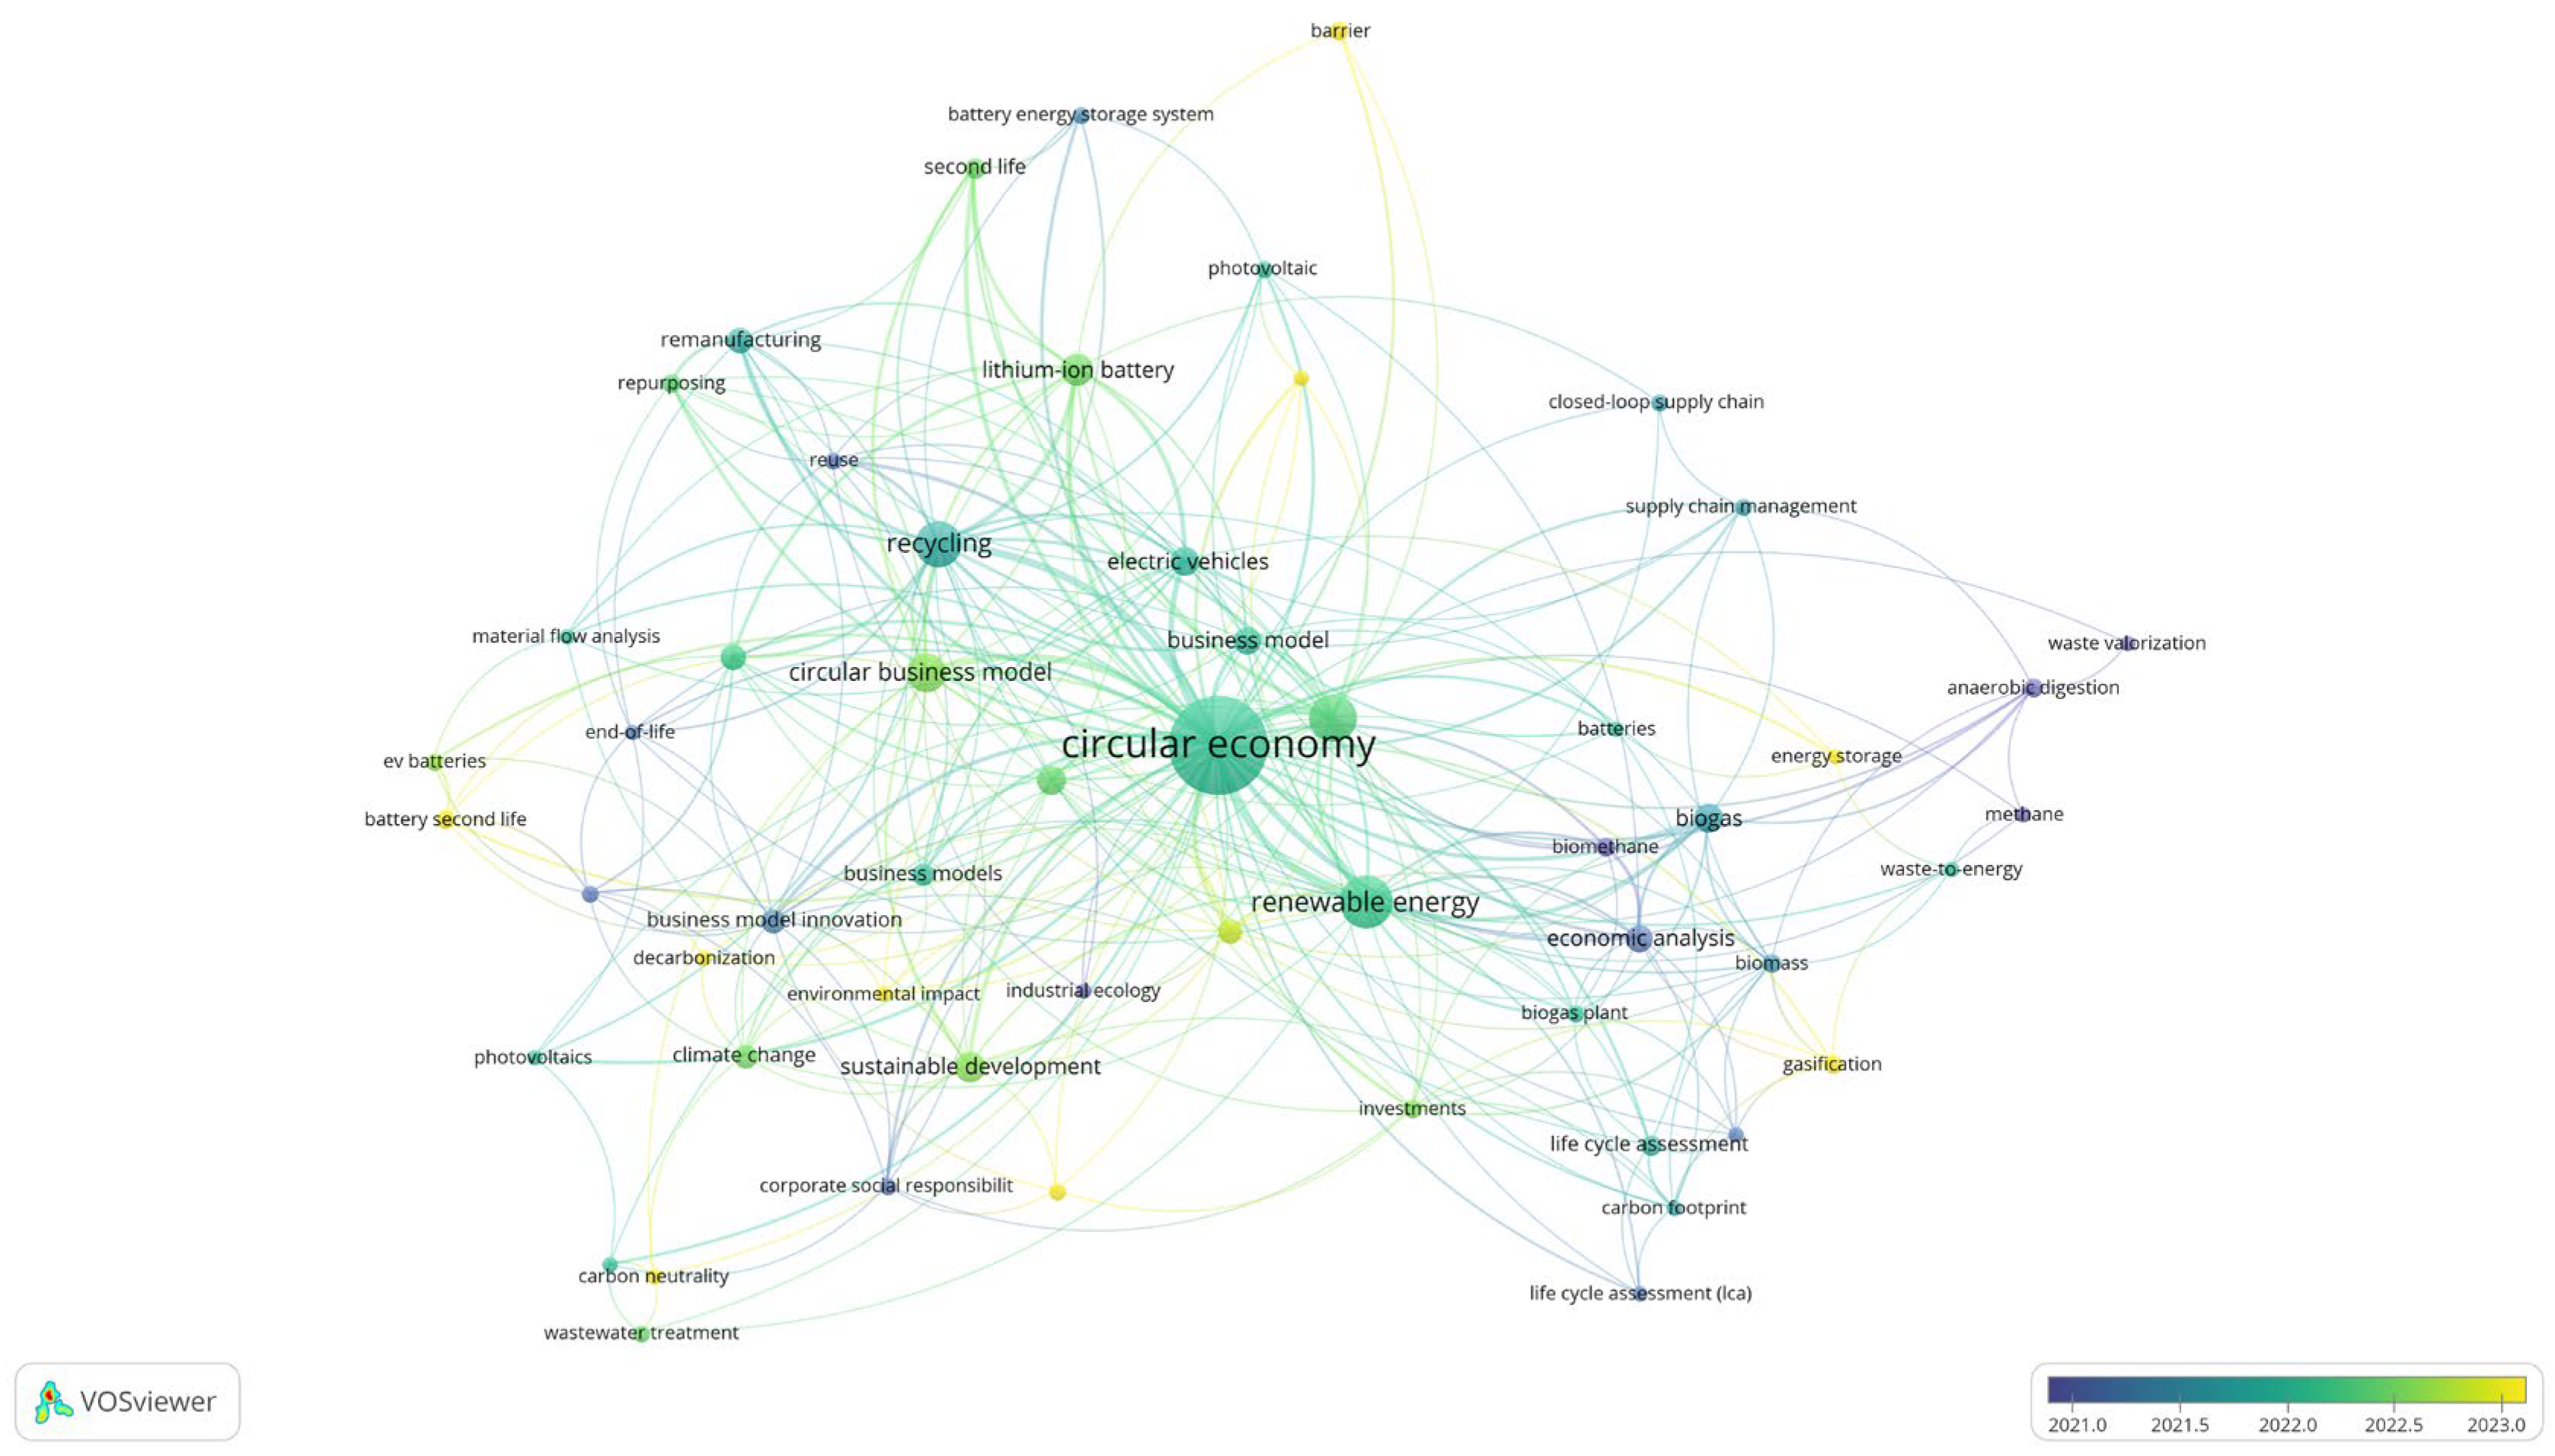
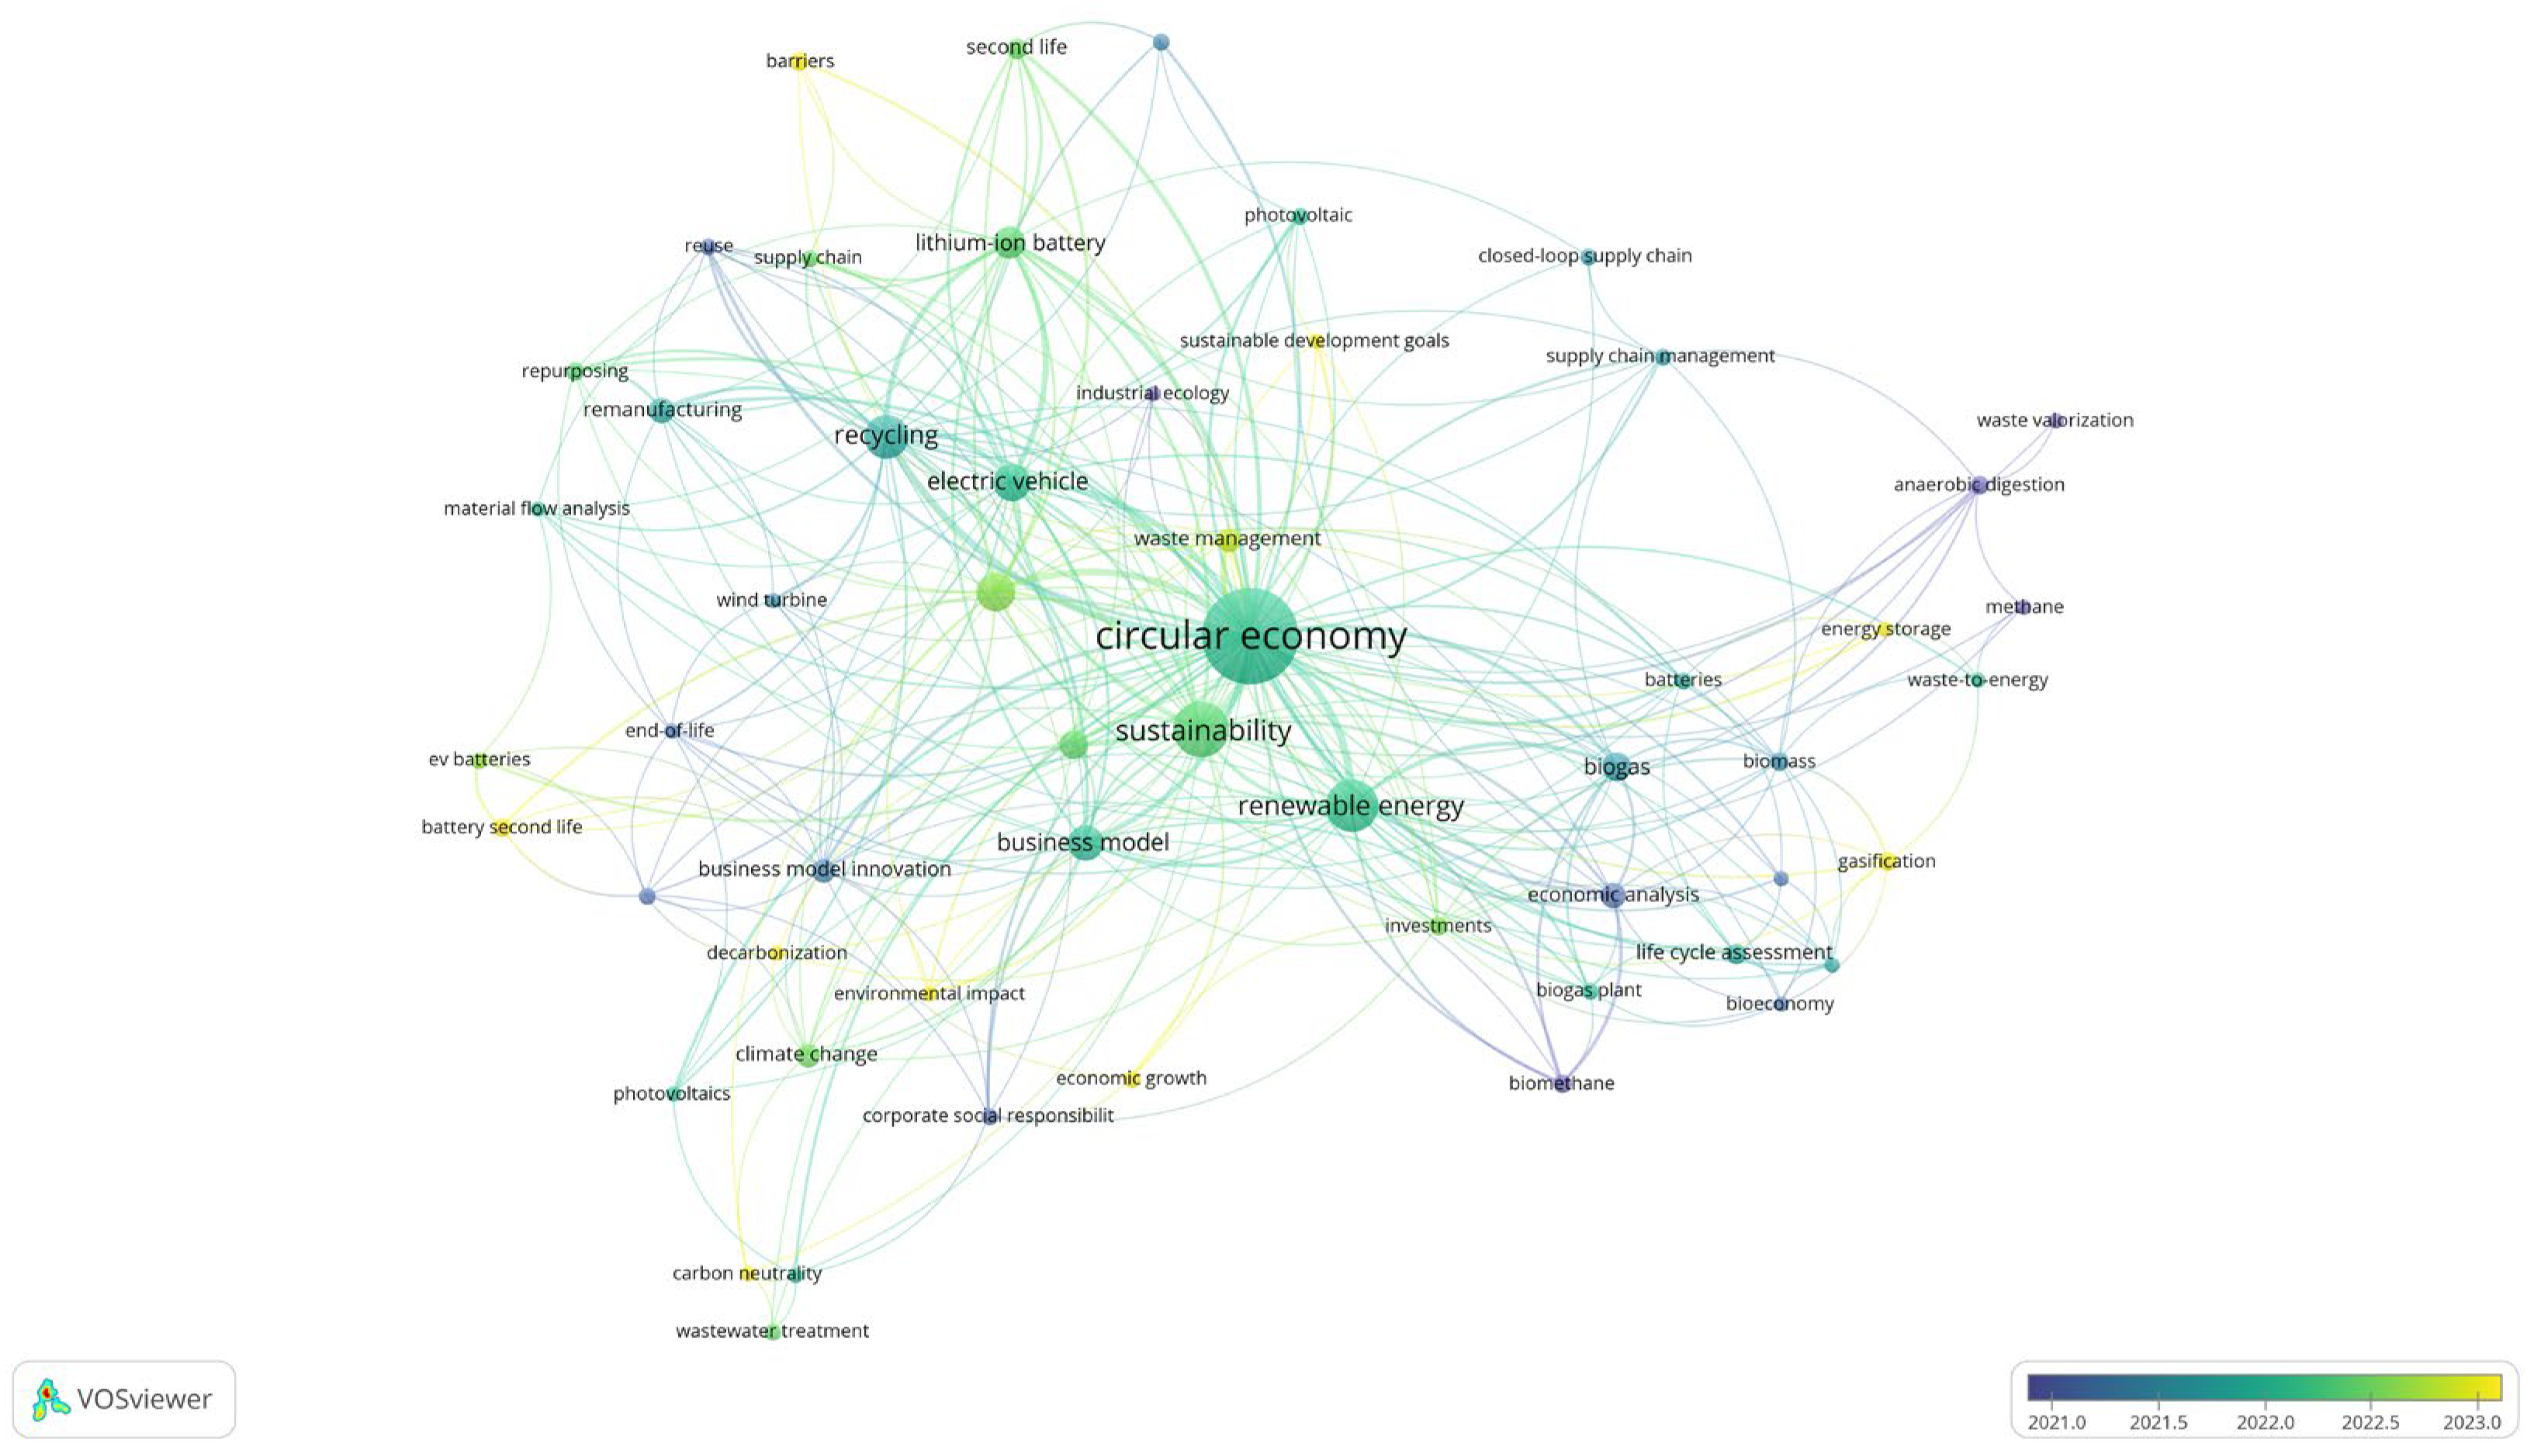
first dimension of the analysis reveals a chronological shift in research priorities. As illustrated in the overlay visualization (
Figure 2), the field has evolved from foundational technical concepts to operational challenges.
The overlay visualization (
Figure 2) illustrates the chronological evolution of the conceptual landscape. A clear shift is observed from established environmental concepts, such as “sustainability” and “recycling” (teal/green), towards operational and strategic imperatives (yellow). Notably, “circular business model” and “business model innovation” have gained significant traction recently, bridging the gap between technical circularity and economic viability. The emergence of “barrier” as a peripheral yet distinct yellow node underscores a nascent but critical shift in the literature towards identifying implementation hurdles. Furthermore, the cluster involving “battery second life” and “EV batteries” indicates that energy storage has become a primary testing ground for these new circular business configurations.
This temporal mapping visually underscores that the most recent literature (the yellow frontier) is precisely where our research questions (RQ1–RQ3) are situated: at the intersection of business model innovation, financial viability, and the removal of systemic barriers. The peripheral position of these emerging nodes suggests a transition from foundational theory toward the practical challenges of implementation and economic scalability.
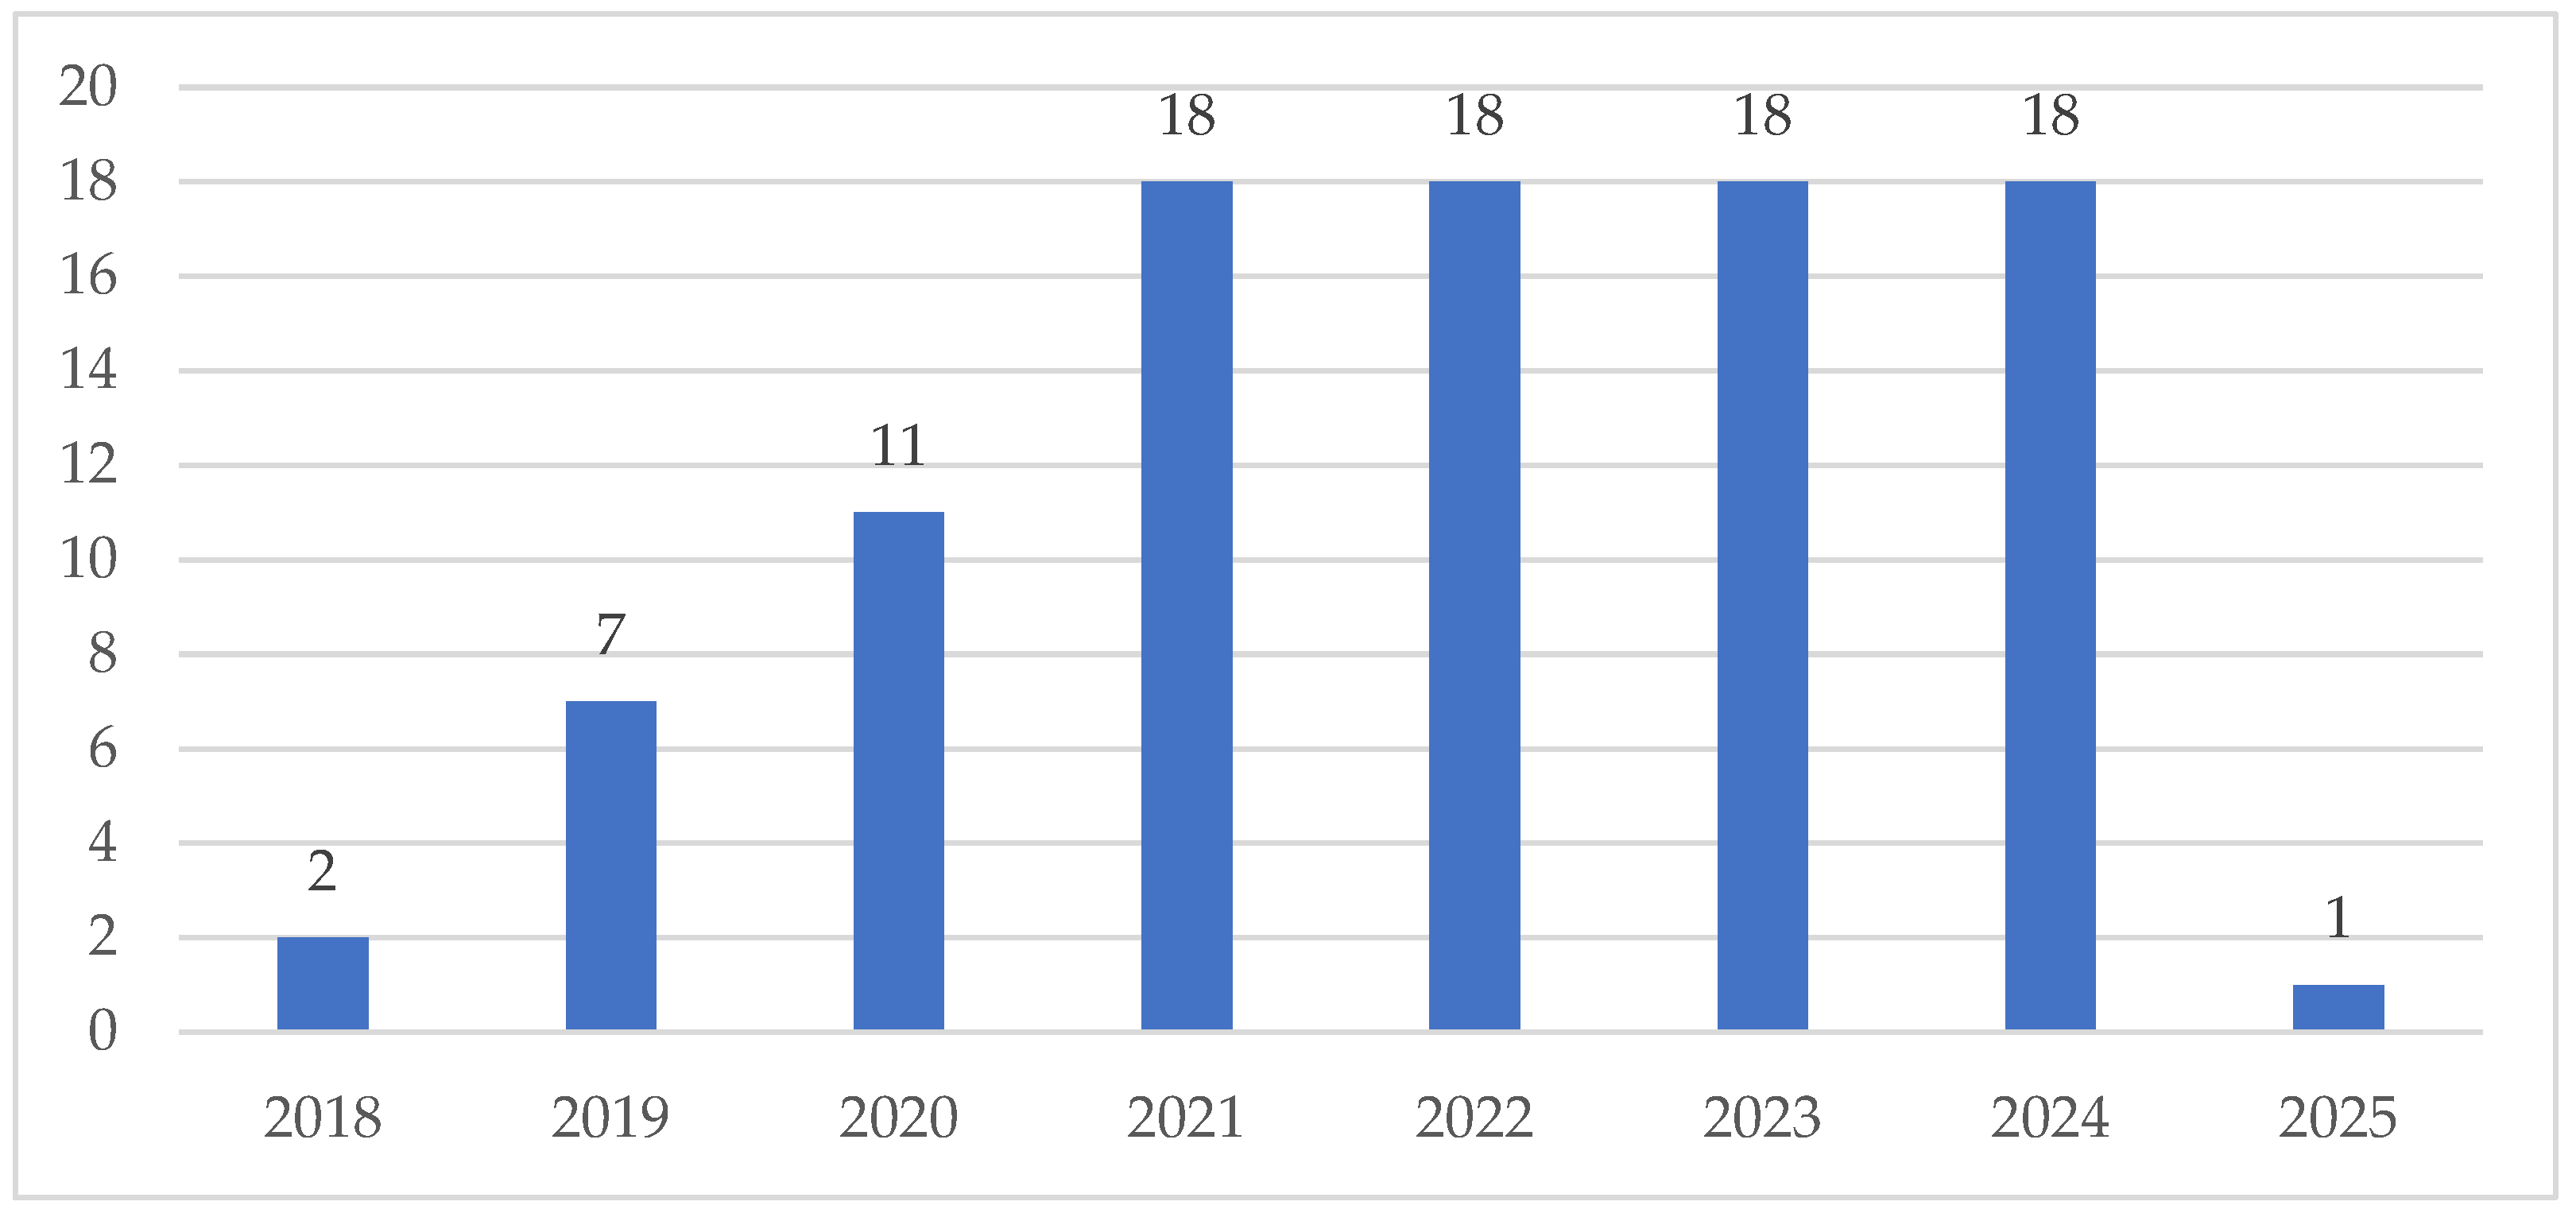
Complementing this conceptual shift, the temporal distribution of the 93 selected articles (
Figure 3) reveals a field that has gained exponential momentum. While the 2014–2018 period shows sporadic interest, a pivotal surge is observed starting in 2019, peaking in 2023. This recent proliferation of literature directly correlates with the introduction of major macro-environmental policy frameworks, most notably the European Green Deal (2019) and the subsequent Circular Economy Action Plan (2020). These initiatives catalyzed academic and industrial interest in decoupling energy generation from resource extraction.
This trajectory aligns with the introduction of major European strategic frameworks, such as the EU Green Deal and the CEAP. Notably, more than 70% of the analyzed literature was published after 2020, which confirms that circular energy models have transitioned from theoretical niches to a mainstream priority for both policymakers and financial investors, driven by the urgent need for resource security and decarbonization.
The
second dimension of the bibliometric analysis identifies the primary dissemination platforms for circular energy research.
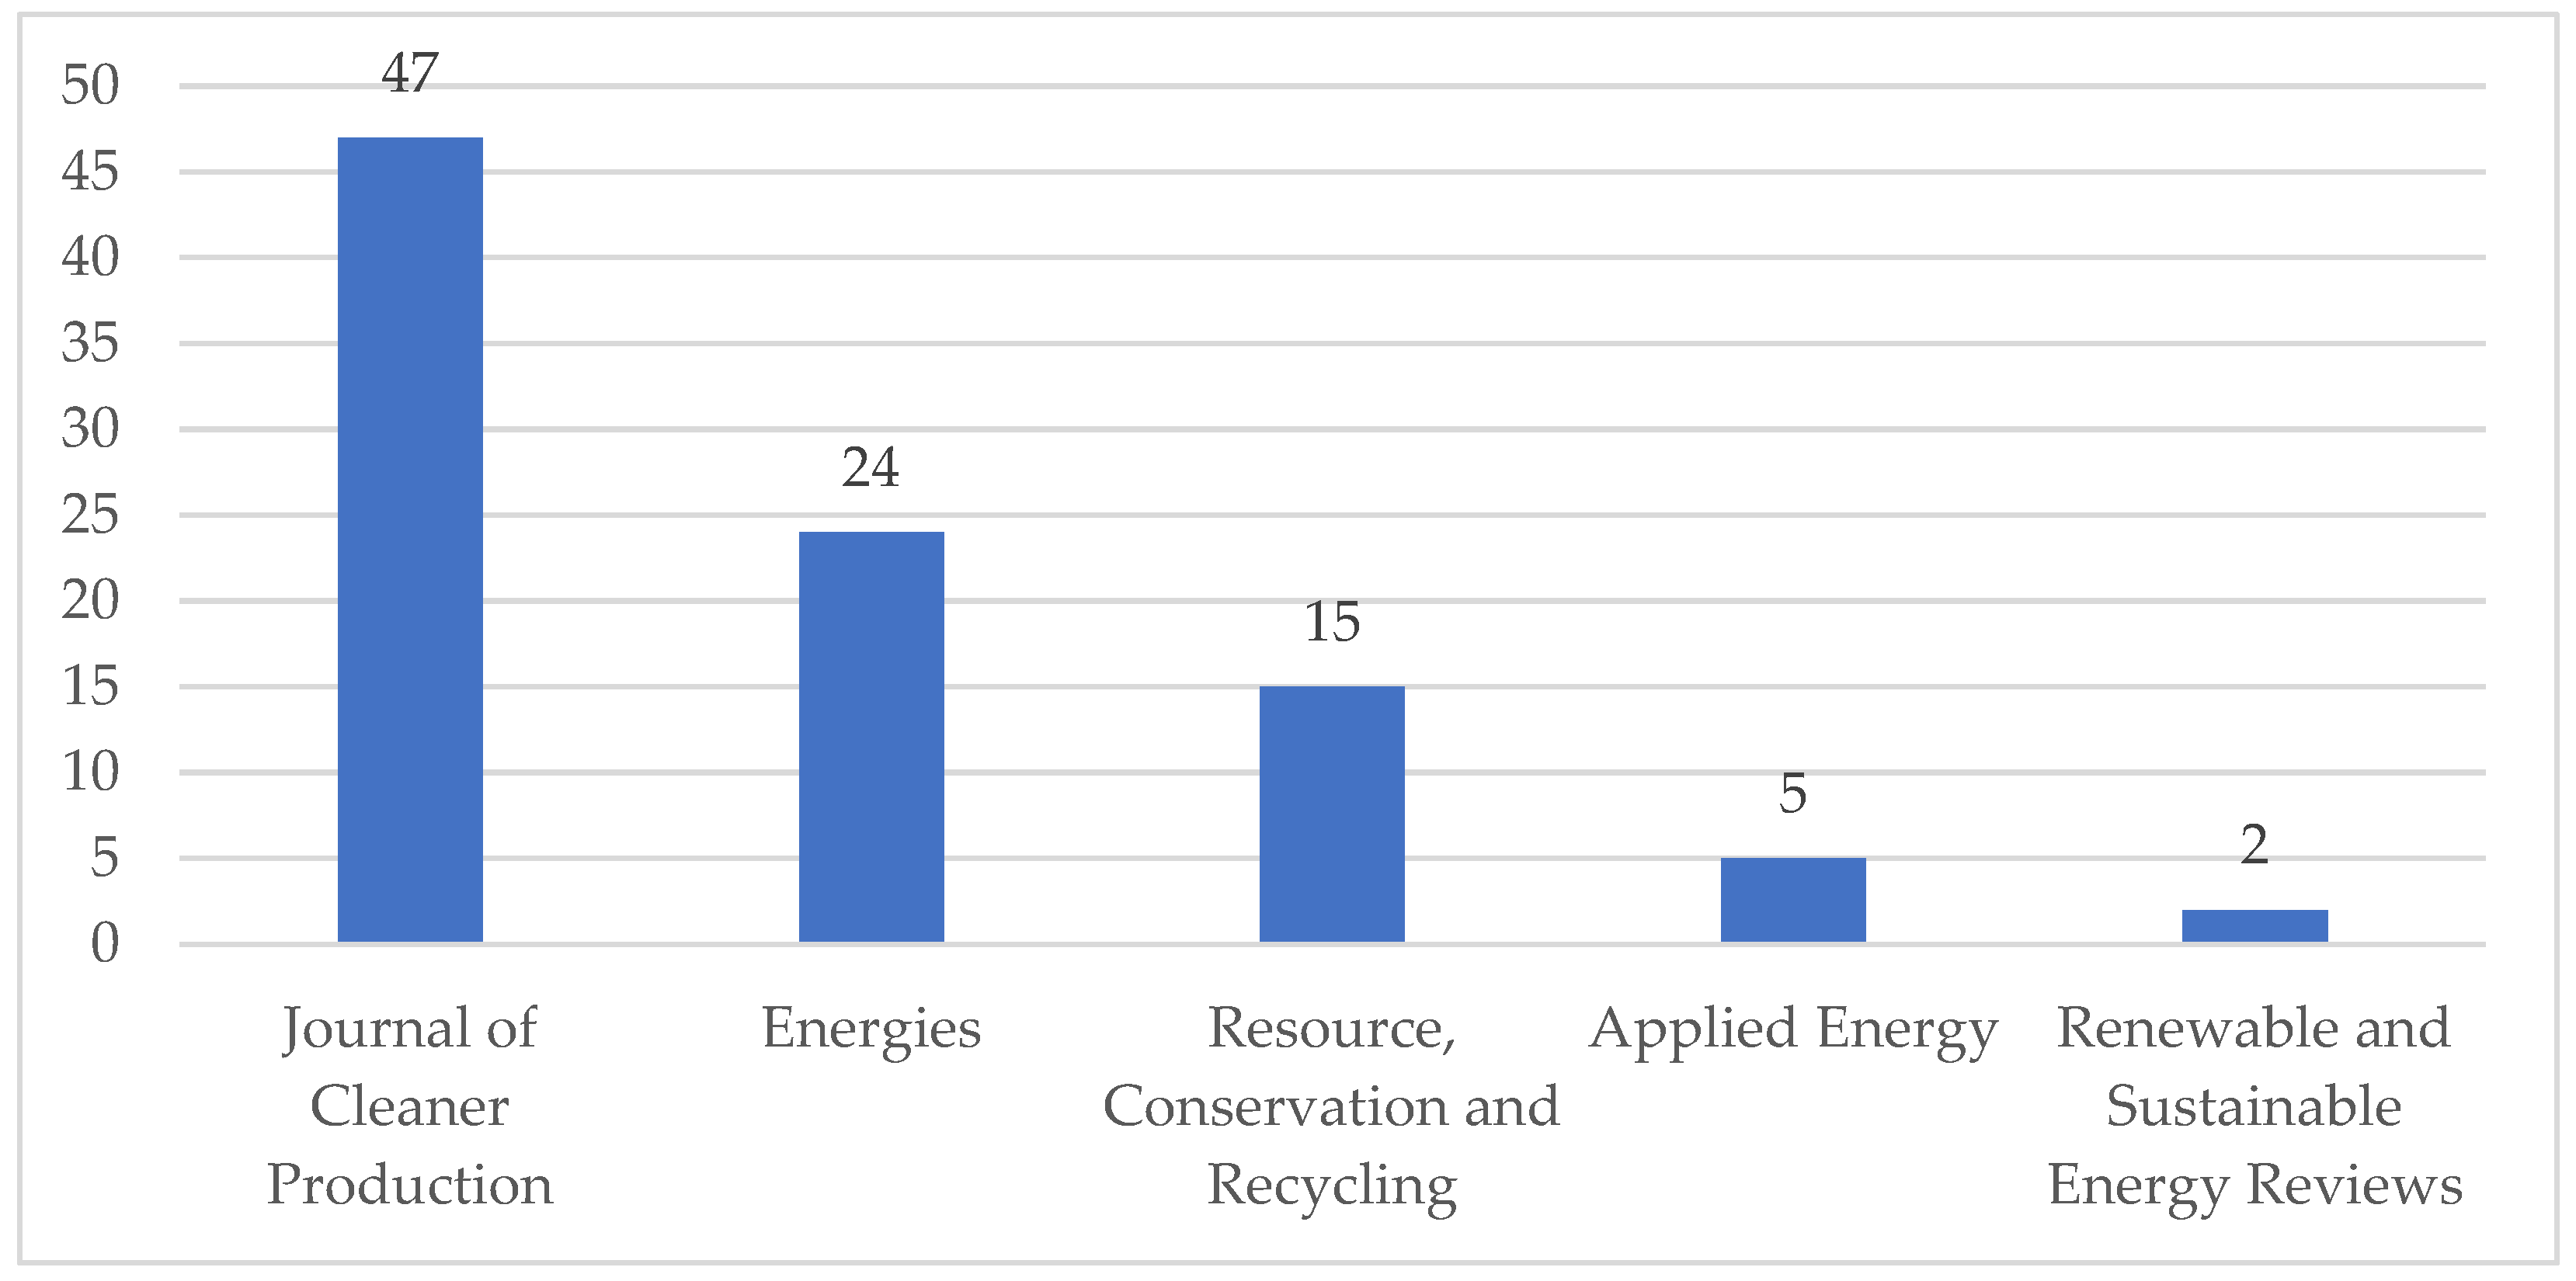
Figure 4 illustrates the distribution of the final sample (n = 93) across the leading academic journals. The concentration of studies in high-impact journals—most notably high-volume hubs like
Journal of Cleaner Production (47 articles) and
Energies (24 articles)—confirms that the qualitative synthesis is built upon highly rigorous and peer-reviewed research. Notably, while the initial dataset (n = 290) included a significant volume of articles from broad-scope journals like
Sustainability, the final refined sample shows a deliberate shift towards journals specialized in cleaner production, resource management, and energy policy.
This strategic selection ensures that the evidence used to answer RQ1–RQ3 is derived from sources with the highest thematic relevance to CBMs and economic scalability.
The dominance of these journals reflects their role as “knowledge hubs” that bridge the gap between technical engineering and economic management and further validates the intersection between technical innovation and the strategic imperatives of the circular energy transition.
This concentration also aligns with the temporal shift identified in
Figure 2: these specific journals have been at the forefront of publishing “yellow frontier” topics (e.g., business model innovation and barriers), further validating the selection of the final 93 core studies as the most representative evidence for answering RQ1–RQ3.
The concentration of studies in high-impact journals—most notably hubs like Journal of Cleaner Production (47 articles) and Energies (24 articles)—confirms that the qualitative synthesis is built upon highly rigorous evidence. The refined sample shows a deliberate shift towards journals specialized in cleaner production and energy policy.
Methodologically, the sample is highly heterogeneous. Approximately half of the studies employ quantitative methodologies (e.g., life cycle assessments, NPV, and interest coverage ratio evaluations), while the remaining studies utilize qualitative or mixed-methods approaches, including systematic literature reviews and case studies.
The
third dimension of the bibliometric mapping employs keyword co-occurrence analysis to identify the conceptual architecture and temporal evolution of the field. Although the initial document search covered the 2015–2024 period, the overlay visualization in
Figure 5 reflects a high concentration of recent research, with the average publication year for most core keywords ranging from 2021 to 2024. This confirms the exponential growth and contemporary relevance of CBMs in the energy sector, highlighting a shift from foundational theory to implementation.
The network architecture is organized into three primary thematic clusters, complemented by a specialized emerging sub-network:
Cluster A (Circular Business Models and Sustainability—RQ1): Located at the core of the network, this cluster is anchored by the largest nodes: “circular economy” and “sustainability”. The transition to “circular business models” (shown in a light-green hue) signifies a shift from theoretical frameworks toward practical value creation and innovation. This cluster acts as the central hub, connecting technical processes with business logic.
Cluster B (Green Financing and Economic Viability—RQ2): Represented by the links between “investments”, “economic analysis”, and “life cycle assessment”, this cluster highlights the economic backbone of circular transitions. The connectivity between these nodes and the central “circular economy” hub confirms that business model scalability is inherently dependent on the alignment with sustainable funding and economic performance metrics.
Cluster C (The Yellow Frontier: Barriers and Emerging Trends—RQ3): Identified by the distinct bright yellow nodes at the periphery—most notably “barriers”, “gasification”, and “carbon neutrality”—this cluster represents the most recent research focus (2023–2024). Its peripheral but strongly interconnected position underscores a critical shift: while technical circular solutions have been mapped, regulatory and systemic hurdles remain the primary bottleneck for the current energy transition. This “frontier” represents the transition from theoretical feasibility to the “hard” reality of market implementation and policy friction.
Finally, the specialized sub-network on the left, focusing on “electric vehicle”, “lithium-ion battery”, and “battery second life”, serves as a contemporary testing ground. The yellowish tint of these nodes indicates that the battery value chain is the current empirical frontier where business models (RQ1), financing needs (RQ2), and implementation barriers (RQ3) converge.
This macro-level mapping provides the necessary conceptual anchor for the granular qualitative synthesis conducted on the 93 core studies. To bridge the gap between bibliometric trends and thematic depth, a multi-dimensional coding framework was applied to the full-text analysis of these high-impact articles. This framework standardizes data extraction across three thematic pillars, directly aligned with the study’s research questions:
A Circularity Pillar (10R Framework): Strategies were systematically coded according to the 10R hierarchy (from R0—Refuse to R9—Recover), with a prioritized focus on Repurposing (R7) and Recycling (R8) as the dominant pathways in the energy transition.
A Business Model Pillar (CBM Taxonomy): Articles were mapped against a taxonomy of 14 Circular Business Model variants, emphasizing Servitization (e.g., BaaS, PaaS) and Resource Recovery models to address RQ1.
A Finance and Policy Pillar: Both quantitative indicators (e.g., LCoE, NPV, ROI) and regulatory instruments (e.g., Carbon Pricing, EPR, Green Bonds) were tracked to evaluate the economic viability and hurdles identified in RQ2 and RQ3.
By synchronizing this standardized terminology, the study ensures that the visual clusters identified in VOSviewer are rigorously harmonized with the granular qualitative findings presented in the following sections.
3.2. Qualitative Synthesis and Thematic Discussion
Following the macro-level mapping, this section provides a granular analysis of the 93 core studies. The qualitative synthesis moves beyond keyword frequency to examine how circularity is operationalized through specific business configurations, financial instruments, and regulatory responses. To bridge the gap between bibliometric trends and thematic depth, a multi-dimensional coding framework was applied to standardize data extraction across three thematic pillars: circularity (10R framework), business models (CBM Taxonomy), and finance and policy.
A structured overview of this distribution is synthesized in
Table 1, highlighting the predominant R-strategies, business archetypes, and economic indicators identified in the core sample.
This categorization serves as the foundational architecture for the detailed thematic discussion presented in the subsequent subsections.
The qualitative distribution of circularity strategies (
Table 1) reveals a predominant focus on systemic integration. Industrial symbiosis (CE-SYM) emerges as the leading category, representing 51.6% (n = 48) of the core studies. This finding suggests that circularity in the energy sector is primarily viewed through the lens of interconnected resource flows (e.g., waste-to-energy, heat recovery).
Furthermore, the significant presence of medium-loop strategies (R-MED, 25.8%) versus the minimal focus on low-loop recycling (R-LOW, 1.1%) indicates a strategic maturity in recent literature. Researchers are increasingly prioritizing the preservation of product value through repurposing and second-life applications, particularly in the battery and EV sectors, rather than mere material recovery. This alignment with the “higher” levels of the 10R hierarchy justifies the focus on innovative business models identified in the subsequent analysis of RQ1.
The analysis of business model configurations (Pillar 2) reveals a landscape dominated by Resource Recovery (BM-RR, 50.5%) and Product-Service Systems (BM-PSS, 33.3%). This binary focus suggests that the energy transition is moving along two parallel tracks:
The technical-operational track (BM-RR), which focuses on reclaiming critical materials from EoL assets (consistent with the R9/R8 strategies identified in Pillar 1).
The strategic-commercial track (BM-PSS), where servitization models like Battery-as-a-Service (BaaS) are gaining traction as solutions to high upfront costs.
Notably, the relatively low frequency of Life Extension models (BM-LE, 2.2%) contrasts with the high frequency of R-MED strategies in Pillar 1. This indicates a “commercialization gap”: while the technical potential for repurposing (e.g., second-life batteries) is widely researched, the corresponding business models for these activities are still in early stages of development.
The final thematic dimension (Pillar 3) underscores the institutionalization of circularity through financial and regulatory frameworks. The predominance of environmental, social, and governance (FM-ESG) criteria (50.5%, n = 47) indicates that CE initiatives in the energy sector are increasingly driven by capital market requirements and institutional investor pressure.
Furthermore, the significant role of subsidies and policy support (FM-SG, 18.3%) and carbon pricing (FM-CP, 14.0%) highlights the sector’s continued reliance on external economic signals to bridge the “circularity gap”. The relatively low focus on green bonds (FM-GB, 3.2%) suggests an untapped potential for specialized debt instruments tailored to circular energy assets, such as second-life battery infrastructure. Overall, the data from
Table 1 confirms that while CBMs (RQ1) are technically feasible, their large-scale adoption is contingent upon the harmonization of ESG reporting and robust carbon pricing mechanisms (RQ2 and RQ3).
To further explore the nuances of these findings, the following subsections provide a detailed qualitative synthesis of the core literature, organized by the three thematic pillars. This analysis moves beyond frequency distributions to investigate the operational mechanisms and strategic trade-offs identified in the transition to a circular energy paradigm.
3.2.1. The 10R Hierarchy: Strategic “Rethink” as a Financial Risk Mitigant
To clarify the analytical utility of the 10R framework, it is imperative to emphasize that it operates not merely as a taxonomic classification label but as a direct indicator of operational and financial complexity. Our synthesis reveals a clear causal logic: while most efforts in the energy sector remain clustered around lower-tier recycling (R9) and recovery (R8), these strategies map onto traditional Resource Recovery models reliant on CAPEX-intensive infrastructure and corporate debt.
Table 2 summarizes the distribution of R-strategies across the reviewed literature and their corresponding business model archetypes and financial characteristics:
3.2.2. Product-Service Systems and Technological Synergies
CE implementation in the energy sector remains highly uneven across technologies, geographical regions, and maturity levels. To illustrate how circular strategies manifest across energy applications, bioenergy and waste-to-energy (WtE) systems provide early prototypical models of CBMs’ evolution. Studies focusing on decentralized biogas plants and industrial symbiosis networks highlight how internal resource loops can decouple energy generation from primary resource extraction [
12]. These collaborative ecosystems demonstrate how circular configurations, such as heat recovery between co-located industries or valorization of organic residues, can transform traditional supply chains into resilient micro-grids.
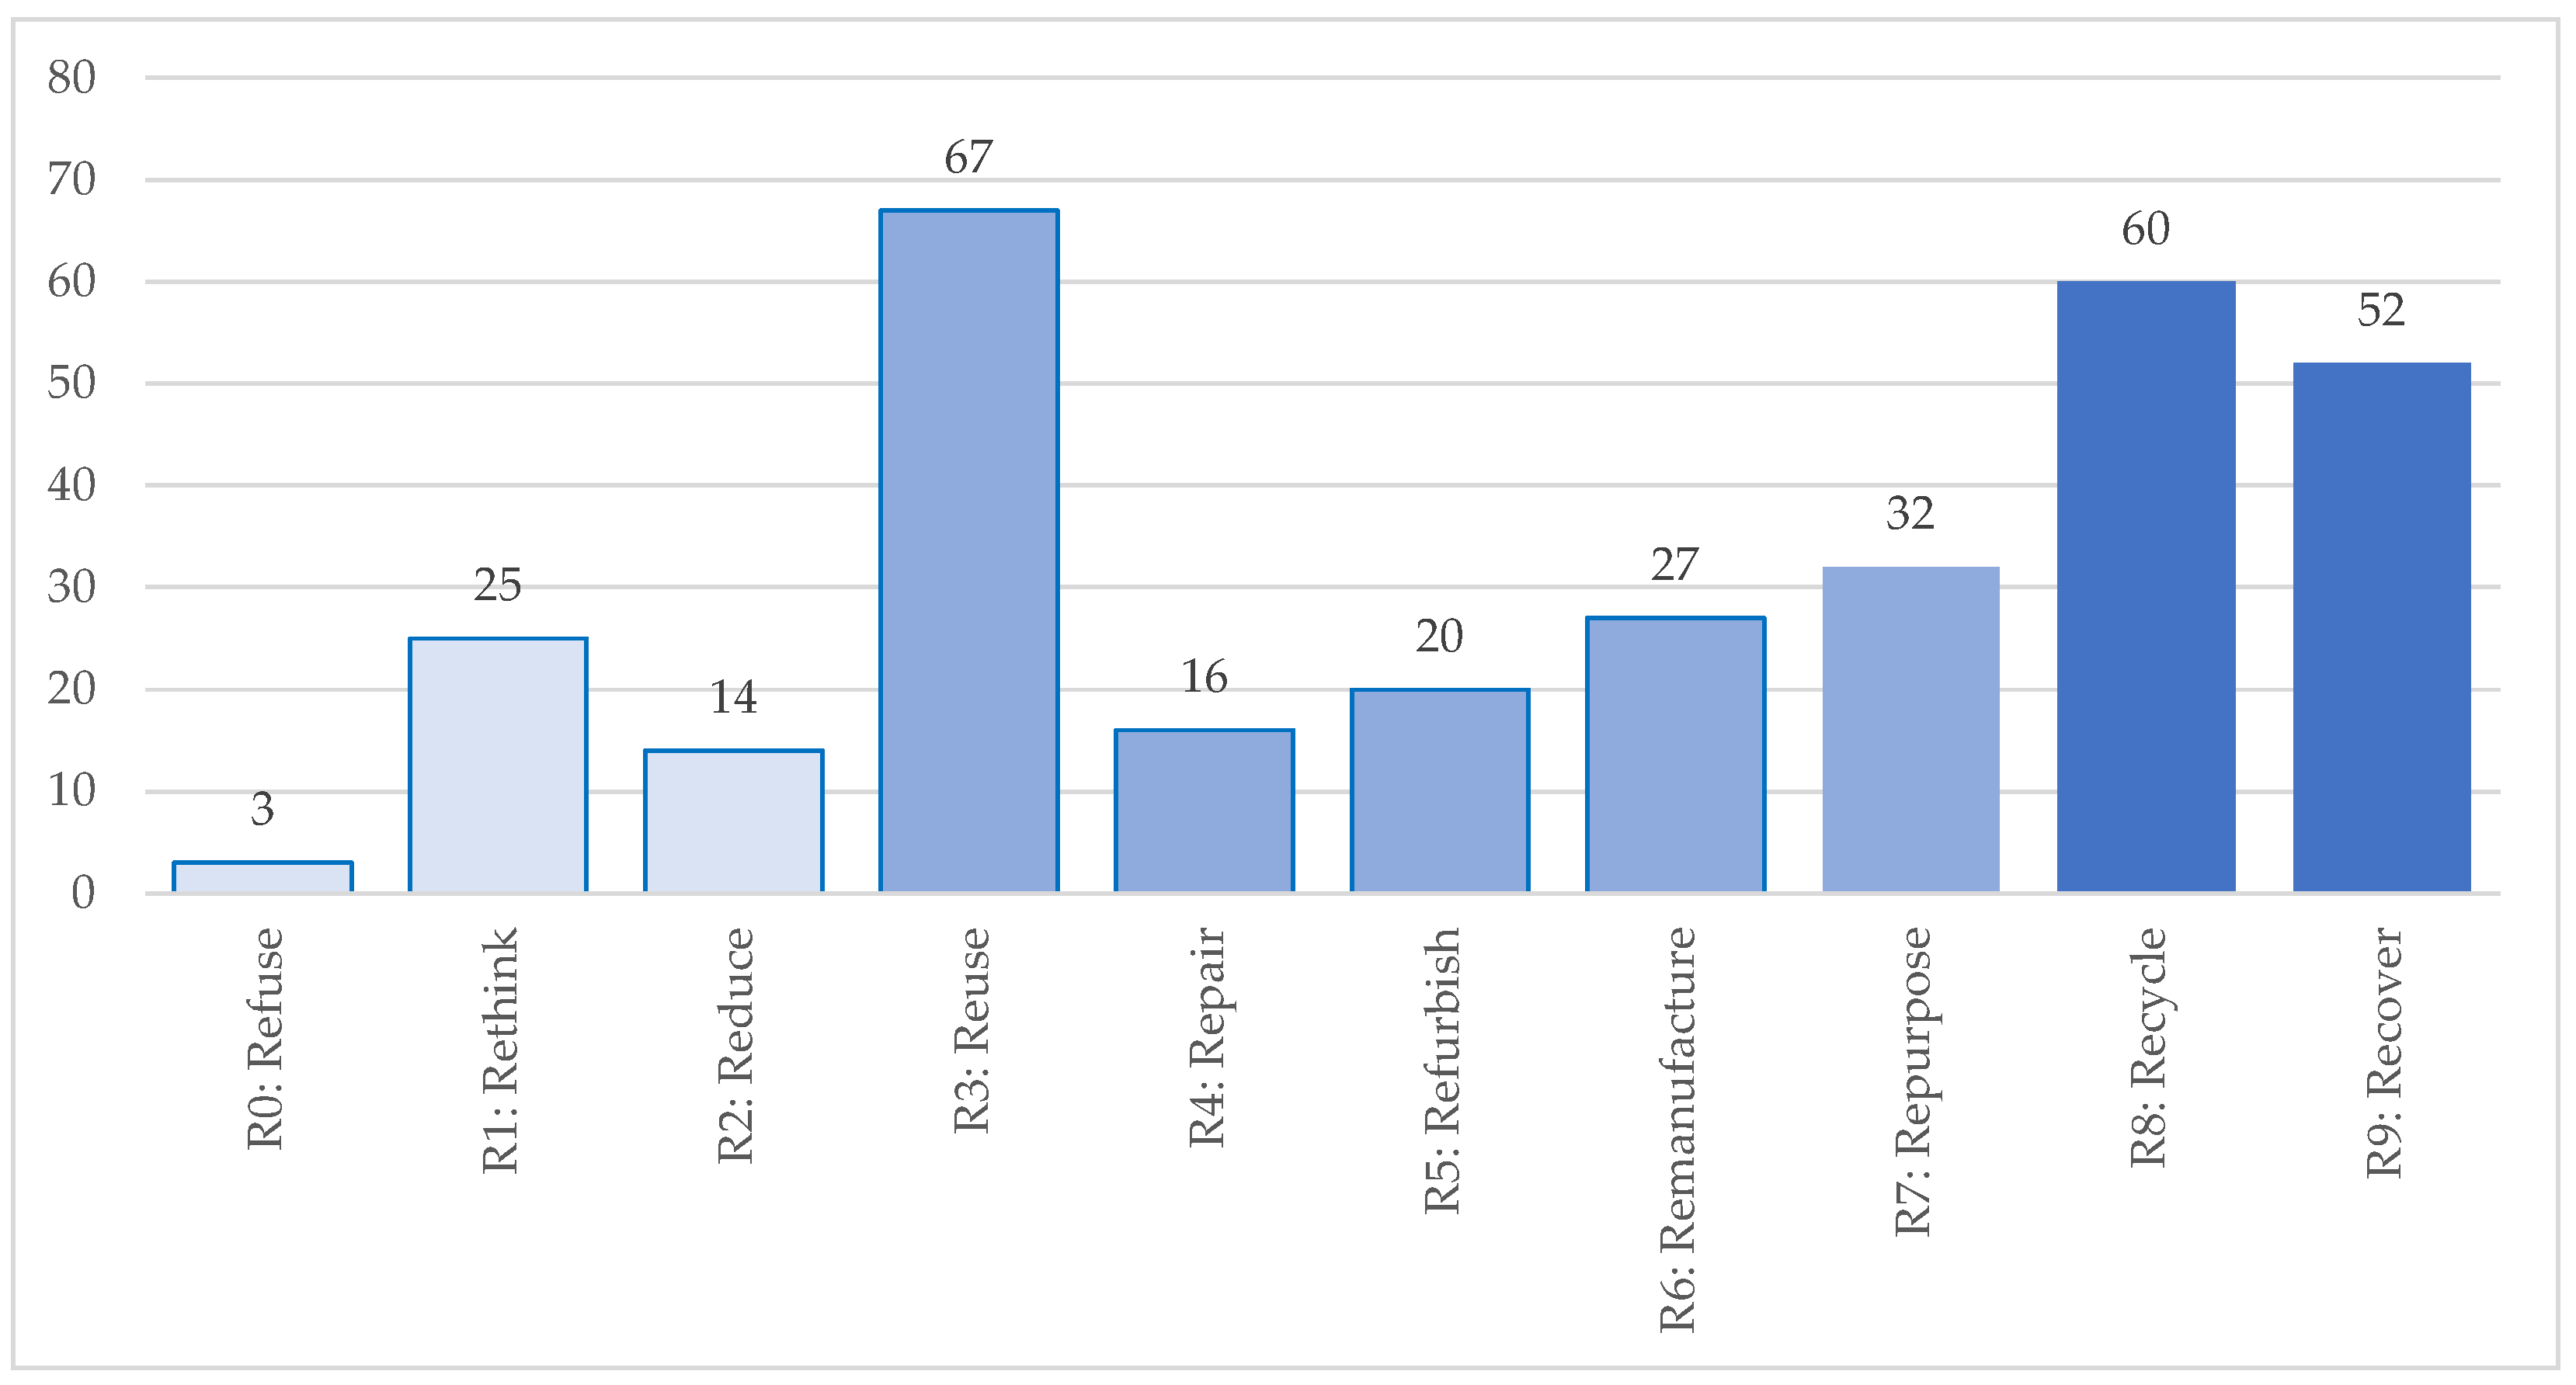
As shown in
Figure 6, the frequency distribution of circular strategies (10R hierarchy) across the reviewed literature reveals that circularity in the energy sector is still concentrated at the mid- and downstream levels. Reuse (R3), recycle (R8), and recover (R9) emerge as the most prevalent strategies, confirming that most existing initiatives remain focused on end-of-life management and resource recovery rather than design-stage prevention. In contrast, higher-order strategies such as refuse (R0), rethink (R1), and reduce (R2) occur far less frequently, indicating that proactive design for circularity is still in its early stages.
Nevertheless, moderate adoption levels of remanufacture (R6) and repurpose (R7) suggest the beginning of a conceptual shift toward more value-preserving and regenerative interventions, particularly in bioenergy, battery, and wind-turbine applications. This gradual trend aligns with the broader movement toward Industry 4.0-driven predictive maintenance and modular asset design, which enable longer product lifecycles and adaptive reuse.
Figure 6 thus reflects a mixed picture: downstream recovery remains dominant in current industrial practice, yet research trajectories increasingly emphasize upstream innovation and design-stage circularity, indicating that the sector is transitioning from reactive end-of-life management toward proactive, system-wide value retention.
Lighter blue shades in the figure represent early-stage circular strategies (R0–R2), medium shades indicate use-phase strategies (R3–R7), and darker tones correspond to end-of-life approaches (R8–R9). This color distinction underscores the current imbalance between widespread downstream recovery and the still-emerging wave of design-led interventions.
In fossil-derived systems, such as coal-fired power with carbon capture and storage (CCS), results confirm that profitability depends primarily on dynamic carbon pricing regimes, with 28% revenue gains attainable only under optimized, AI-assisted market conditions [
8,
28,
29]. However, policy uncertainty leads to unstable investment horizons. Intelligent computational optimization using mixed integer nonlinear programming greatly improves investment evaluation under economic–environmental–technical–policy (EETP) constraints [
28].
Repurposing of depleted hydrocarbon wells and mining infrastructure demonstrates strong CAPEX reductions, ranging from 40% to 74% relative to greenfield geothermal projects, and significant improvements in levelized cost of heat (LCOH) and payback (2–9 years) [
30,
31,
32,
33]. However, the lack of standardized regulatory frameworks and ownership ambiguity limits replication of such models.
In hydropower and water systems, small-scale pump as turbine solutions deliver up to 74% electromechanical cost savings and >8800 t CO
2 annual mitigation, but remain under optimized outside the best efficiency point [
30].
In biogas and biomethane, economic returns are dominated by feed-in tariffs and grant structures: positive NPVs occur mainly for 200–300 kW biogas plants, whereas biomethane upgrading remains unprofitable without targeted subsidies [
12,
14,
34,
35,
36,
37,
38,
39,
40,
41,
42]. New digestate valorization routes, such as pelletization improve profitability up to € 334,926/year [
40].
Similar techno-economic assessments highlight that coupling biogas upgrading with CO
2 utilization, such as formic acid synthesis, remains economically unfeasible without major catalyst cost reductions or high feed-in tariffs [
43].
Emerging microbial-granule technologies also demonstrate strong circular potential by reducing bioreactor energy costs up to 75% while enabling bio-oil and hydrogen recovery [
44]. These biological symbiosis systems exemplify how industrial wastewater can become a circular energy input [
44].
Wind power systems reveal material-intensive circularity gaps. Dynamic material flow analyses project up to 1.2 Mt of decommissioned material by 2050, with composite blades representing the principal sustainability bottleneck [
45,
46,
47,
48]. Remanufacturing and re-engineering may extend turbine life by 60%, at 20% of the original cost [
47]; yet incomplete life cycle assessments and weak EPR enforcement persist.
Solar PV loops remain immature: although crystalline Si and CdTe technologies show the highest potential for circularity, the sector suffers from a dual deficit: underdeveloped EoL dismantling infrastructure and non-harmonized recycling standards [
49,
50,
51,
52].
Geothermal case studies demonstrate solid technical viability: closed-loop exchange systems can repurpose abandoned wells with 15% differences in power performance but major reductions in drilling risk [
31,
32]. Multi-vector scenarios combining solar, wind, and geothermal show superior energy self-sufficiency (40–93%) when integrated with hydrogen storage [
33].
Comparable optimization studies for Northern Spain confirm that upcycling surplus industrial hydrogen can yield positive NPVs and strengthen multi-energy circular supply chains [
53]. Pumped-storage hydropower similarly provides large-scale low-impact storage potential and socioeconomic co-benefits, supporting fully renewable grids [
54].
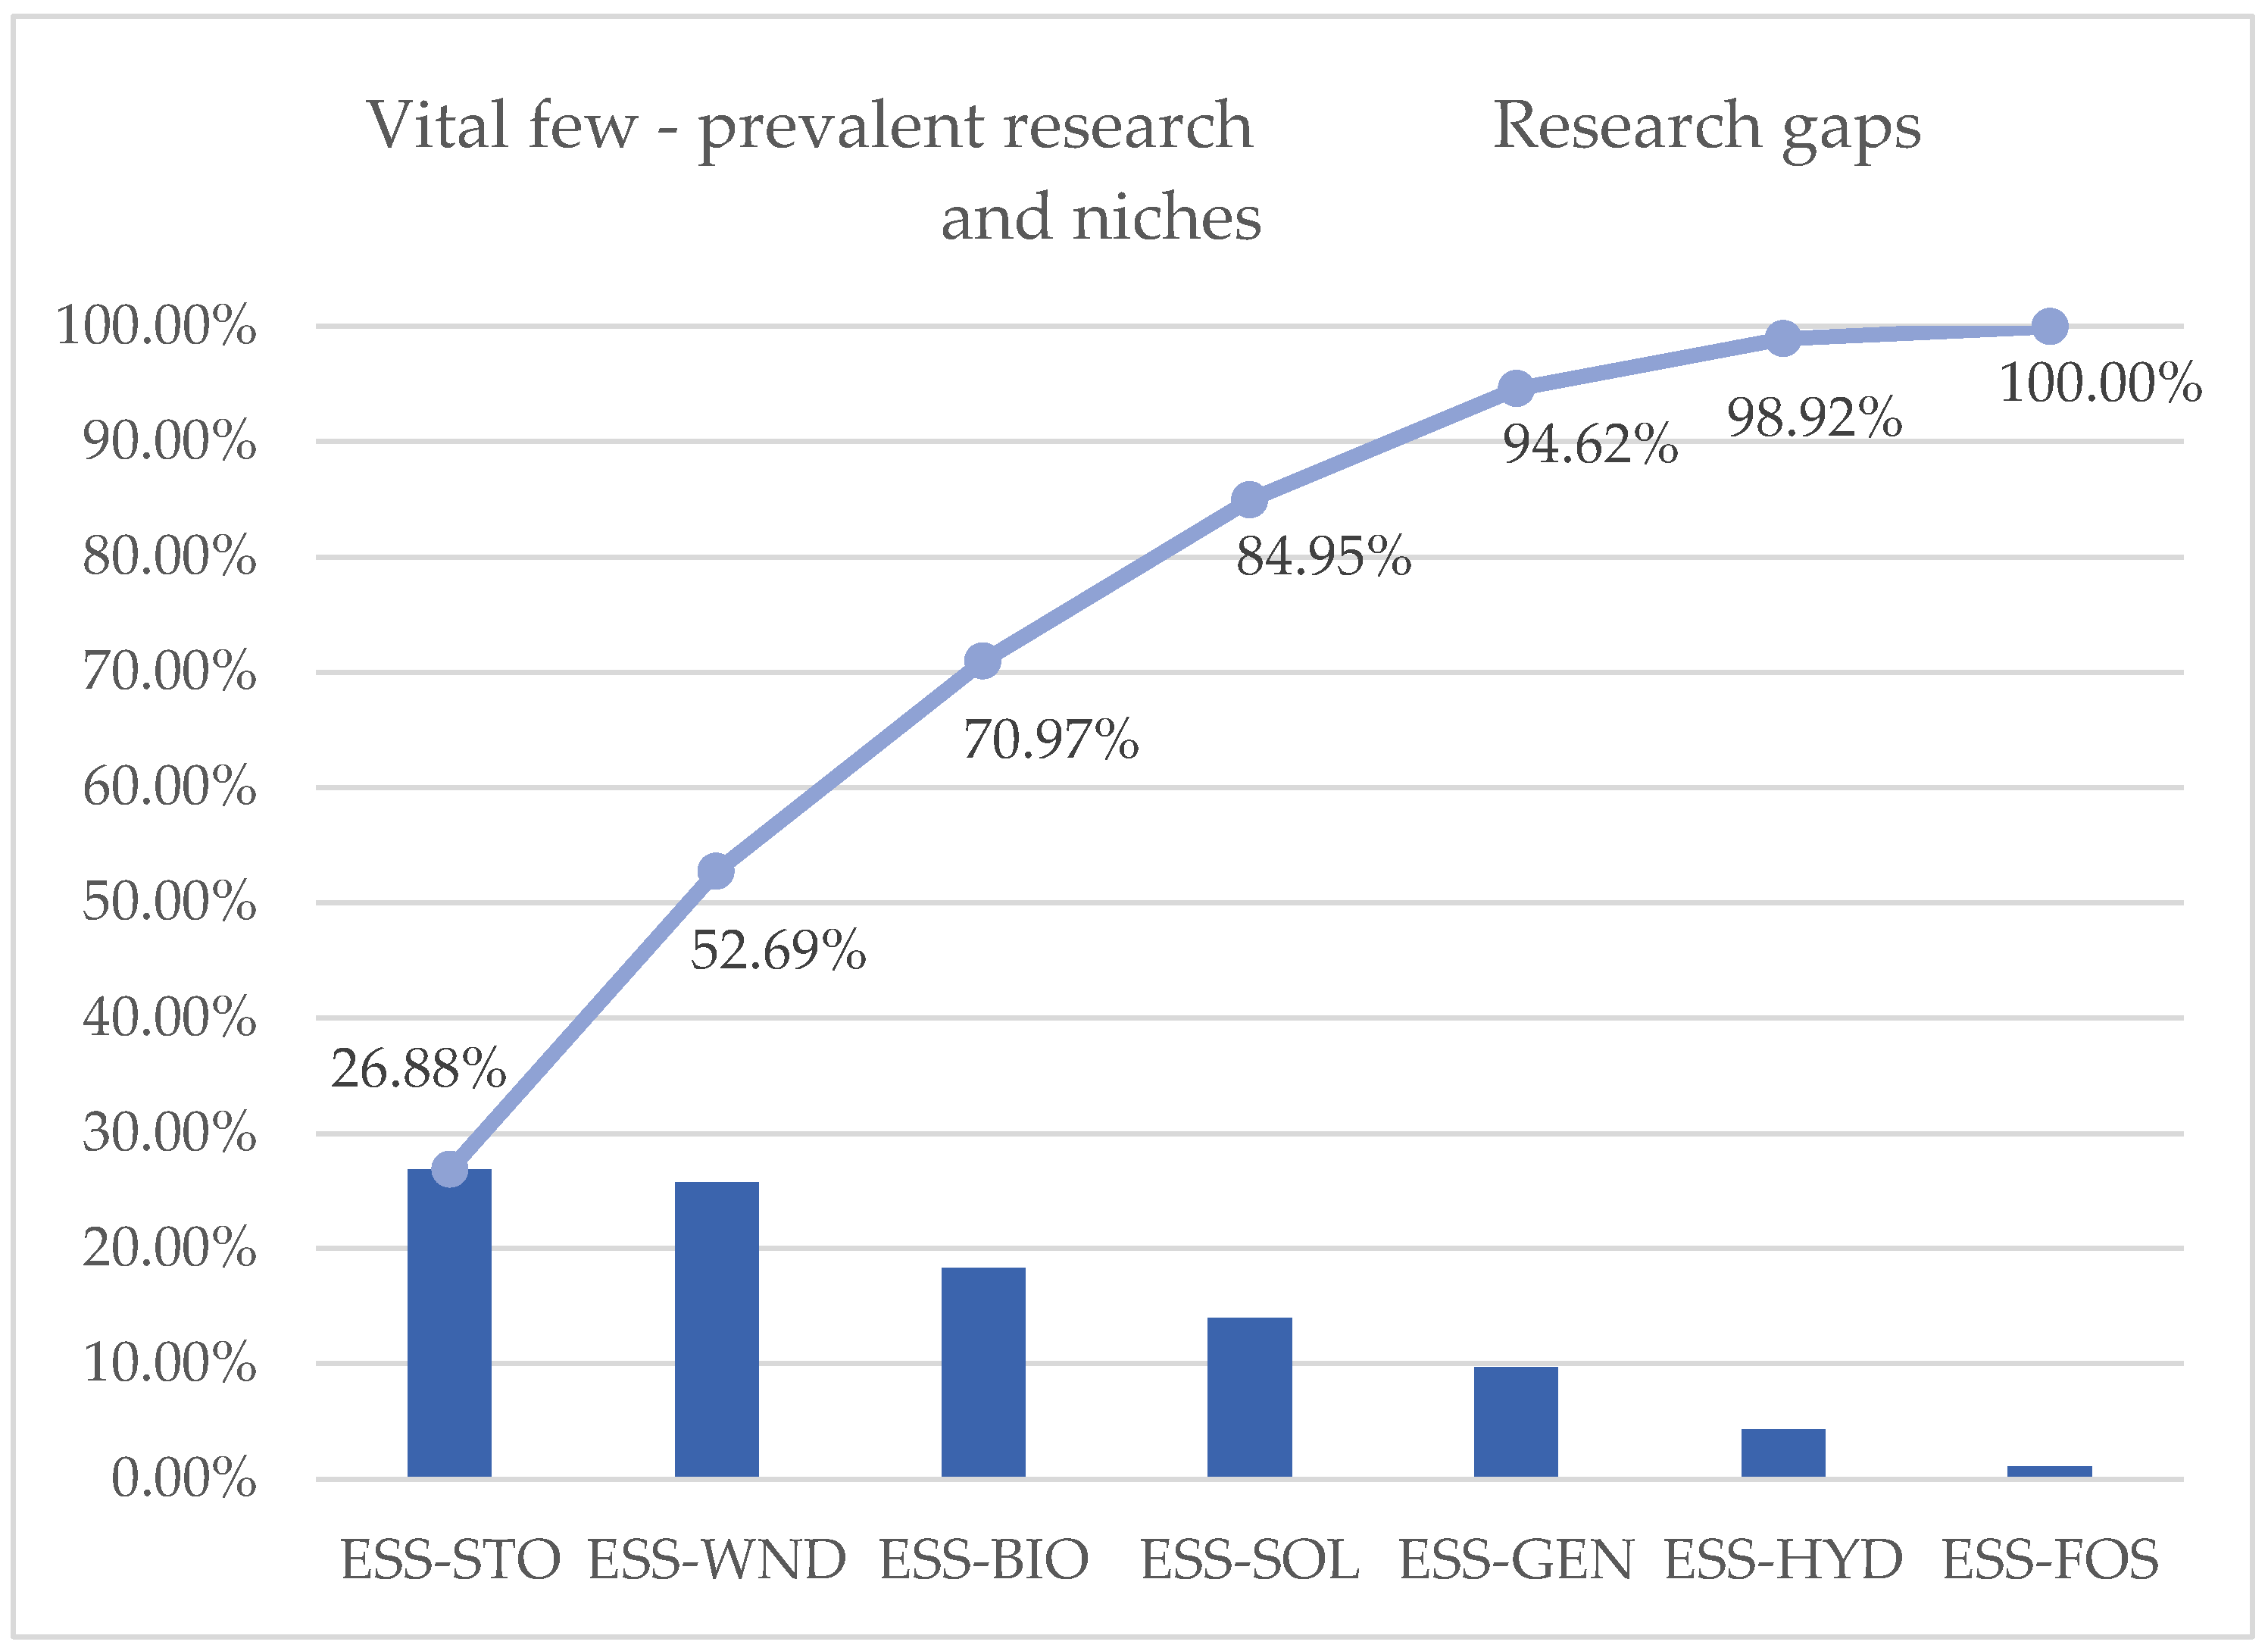
Overall, sectoral readiness disparities confirm that while bioenergy and WtE systems provided the initial blueprint for circular configurations, the highest CE penetration is now observed in material-intensive renewables. As illustrated in
Figure 7, a Pareto analysis [
55] of research distribution reveals that EV batteries/storage (ESS-STO) and wind energy (ESS-WND) dominate current scientific attention, together accounting for 52% of the literature (26% each). This concentration in the “vital few” sectors reflects the urgent need to address complex material recovery challenges, while mid-tier subsectors like biogas (18%) and solar PV (15%) represent established but mature research domains.
The analysis confirms a distinct research hierarchy: wind > EV batteries > biogas > solar > geothermal ≈ hydrogen, with emerging areas like multi-sector repurposing (ESS-GEN) and carbon capture (ESS-FOS) remaining specialized niches. This evidence-based distribution provides the framework needed to prioritize policy and financial interventions (RQ2, RQ3) in sectors offering the highest potential for systemic impact.
3.2.3. Product Life Extension, Reverse Logistics, and Industrial Symbiosis
Across early one third (≈28%) of the reviewed papers, Product Life Extension (PLE) models constitute the core of circular transition strategies.
As highlighted by recent qualitative research in the UK EV industry, the absence of a functioning market for end-of-first-life batteries and insufficient regulatory coordination remain key barriers to developing coherent low-carbon, closed-loop business models [
56].
The electric-vehicle (EV) battery ecosystem dominates research attention. System dynamics, optimization, and life cycle assessment (LCA) studies consistently report that multi-stage reuse, remanufacture, repurpose, and recycle cascades can extend total battery value by 20–64%, depending on reuse depth and policy maturity, and could raise material circularity to about 23% by 2030 [
5,
6,
7,
56,
57,
58,
59,
60,
61,
62,
63,
64,
65,
66,
67,
68,
69,
70,
71,
72,
73,
74]. Repurposing end-of-first-life batteries for stationary storage increases residual value and market adoption by ≈20%, while remanufacturing lowers lifecycle cost by ≈40% compared with new production [
63,
67].
Scenario-based projections further indicate that combining second-life use and recycling may offset up to 64% of primary raw-material demand by mid-century, conditional on effective policy and socio-technical reforms [
75].
Repurposing end-of-first-life batteries for stationary storage increases residual value and EV adoption by ~20% in emerging markets such as Ireland [
63], whereas remanufacturing can reduce cost by 40% compared with new battery production [
67].
Economic viability, however, remains contingent on extended producer responsibility (EPR) enforcement and dedicated subsidies [
11,
59,
64].
Technological enablers—automation, data sharing, and blockchain traceability—emerge as decisive for ROI optimization and risk mitigation [
11,
61,
66].
The battery chemistry transition from NMC to LFP improves financial returns in second-life applications (IRR ≈ 21%) due to lower depreciation sensitivity, although LFP recycling generates negative commodity value without incentives [
62,
76].
Comprehensive multi-stakeholder syntheses of the LIB value chain emphasize that collaboration between OEMs, recyclers, and policymakers is essential for achieving environmentally robust and financially viable battery supply chains [
77].
Multi-stakeholder integration is complex: more than 40 actors interact across the second life ecosystem, underlining governance and orchestration gaps [
5].
Game-theoretic analysis of recycling modes under China’s cap-and-trade policy confirms the fact that coordinated multi-channel participation—retailers, third-party recyclers, and echelon utilization firms—maximizes profitability and carbon reduction [
78].
Beyond the mobility sector, remanufacturing frameworks in sectors such as wind turbine components, medical equipment, and furniture confirm triple bottom line value creation (up to 50% material-cost savings and increased technical employment) though they remain primarily profit-driven with limited social-impact metrics [
79,
80]. This parallels findings in the EV-battery domain, where economic performance outpaces social-value integration [
79]. Coordinated remanufacturing across design, value-chain, and marketing functions thus becomes a prerequisite for scaling socially inclusive CBMs.
Industrial disassembly automation is identified as an essential prerequisite for profitable closed-loop flows in large components [
66,
81], enabling safe recovery of critical materials and ensuring regulatory compliance with growing EPR obligations.
3.2.4. Servitization and Circular Business Model Innovation
Servitization—leasing and pay-per-use business models—bridges economic efficiency and circular design. These findings are consistent with broader manufacturing evidence identifying distinct maturity clusters in CE implementation, from “recyclers” to “toxicity fighters”, depending on managerial capability [
82].
Cross-sectoral analysis reveals distinct business model specialization patterns across energy subsectors. Resource Recovery (BM-RR) dominates in biogas applications (11 of 17 studies) due to mature waste valorization processes, while EV batteries exhibit a strategic balance between traditional recovery (13 studies) and emerging servitization approaches (11 studies) such as Battery-as-a-Service (BaaS). Wind energy shows the most diversified business model portfolio, with significant adoption of both Product-Service Systems (9 studies) and Life Extension models (2 studies), reflecting the sector’s transition from ownership-based to service-oriented value propositions.
Notably, higher-order circular strategies like Circular Value Propositions (BM-CVP) and Life Extension (BM-LE) remain marginal across all sectors, confirming the identified “commercialization gap” between technical feasibility and scalable revenue models. This distribution directly addresses RQ1, demonstrating that while resource recovery serves as the industrial baseline, sectors with high material complexity are rapidly evolving toward servitization to overcome linear economic constraints.
Evidence from product, lighting, battery, and cooling as a service concepts shows that leasing can match or exceed ownership profitability for firms but may impose higher costs on heavy-use customers [
6,
7,
83,
84,
85,
86].
Despite marginal environmental improvement (<1%), servitization supports modular design, facilitating repair and recycling.
Cooling as a service proves particularly relevant for Global South contexts by removing upfront CAPEX and aligning energy efficiency with social equity [
85].
Digitalization further accelerates CE adoption: blockchain enables transparent tracking of material flows and distributed trading but faces interoperability and energy consumption issues [
11,
20,
61,
68,
87,
88].
Industry 4.0 transformations—AI-based optimization, IoT, and smart manufacturing—act as systemic enablers, yet maturity disparities between service and production sectors persist [
20,
87].
3.2.5. Financial Viability, Investment Metrics, and Green Finance Instruments
Despite technological feasibility, economic fragility pervades circular energy systems. Across case studies, profitability relies on public incentives: feed-in tariffs, tax exemptions, green bonds, and grants. Without these, most small-scale or emerging market projects present negative NPVs [
12,
34,
35,
36,
39,
41].
CAPEX reduction and faster payback are directly linked to policy alignment: in Italy, repurposed geothermal wells yield NPV > €6 M with PBT ≈ 2.3 years when supported by tariff parity with fossil heat [
32].
Carbon pricing emerges as the major market driver, with breakeven thresholds of 40–45 €/t CO
2 required for advanced oxy combustion or CCS technologies to surpass conventional investments [
28,
29,
89].
Hybrid waste-to-energy models exhibit high sensitivity to these prices; profitability switches from gasification to flameless oxy combustion once carbon costs reach ≥ 44 €/t CO
2 [
29].
Green finance frameworks—EU Taxonomy, ESG metrics, and CAPEX/OPEX green bonds—are gaining traction as classification tools but pose access barriers for SMEs that face high compliance costs and data requirements [
37,
90,
91,
92,
93].
Debt sustainability analyses highlight structural risk: in the Italian biogas sector, firms operate with negative net working capital and overreliance on loans; EBIT-based interest coverage ratios provide more prudent debt service evaluation than EBITDA metrics [
14].
Alternative finance instruments, notably equity crowdfunding, increase capital availability for renewable ventures in “green” economies, yielding higher deal values where renewable energy consumption is strong [
16]. However, the lack of long-term performance data undermines investor confidence.
At the macro-level, panel econometric analysis across EU-28 countries confirms that green investments produce tangible growth effects: a 1% increase in private investment in circular economy sectors (PICE) raises GDP per capita by ≈6%, reduces GHG emissions by ≈3%, and boosts renewable energy consumption by ≈5% [
94]. These findings reinforce that green finance is not only a support mechanism but a macroeconomic driver of sustainable development.
In parallel, corporate venture capital (CVC) is emerging as a key investment vehicle in the Asia-Pacific region, bridging innovation and financing for clean energy. Evidence shows that CVC actors prioritize strategic returns (access to disruptive technologies and new markets) alongside financial profitability, suggesting that private-equity linkages can accelerate circular innovation when policy uncertainty persists [
95].
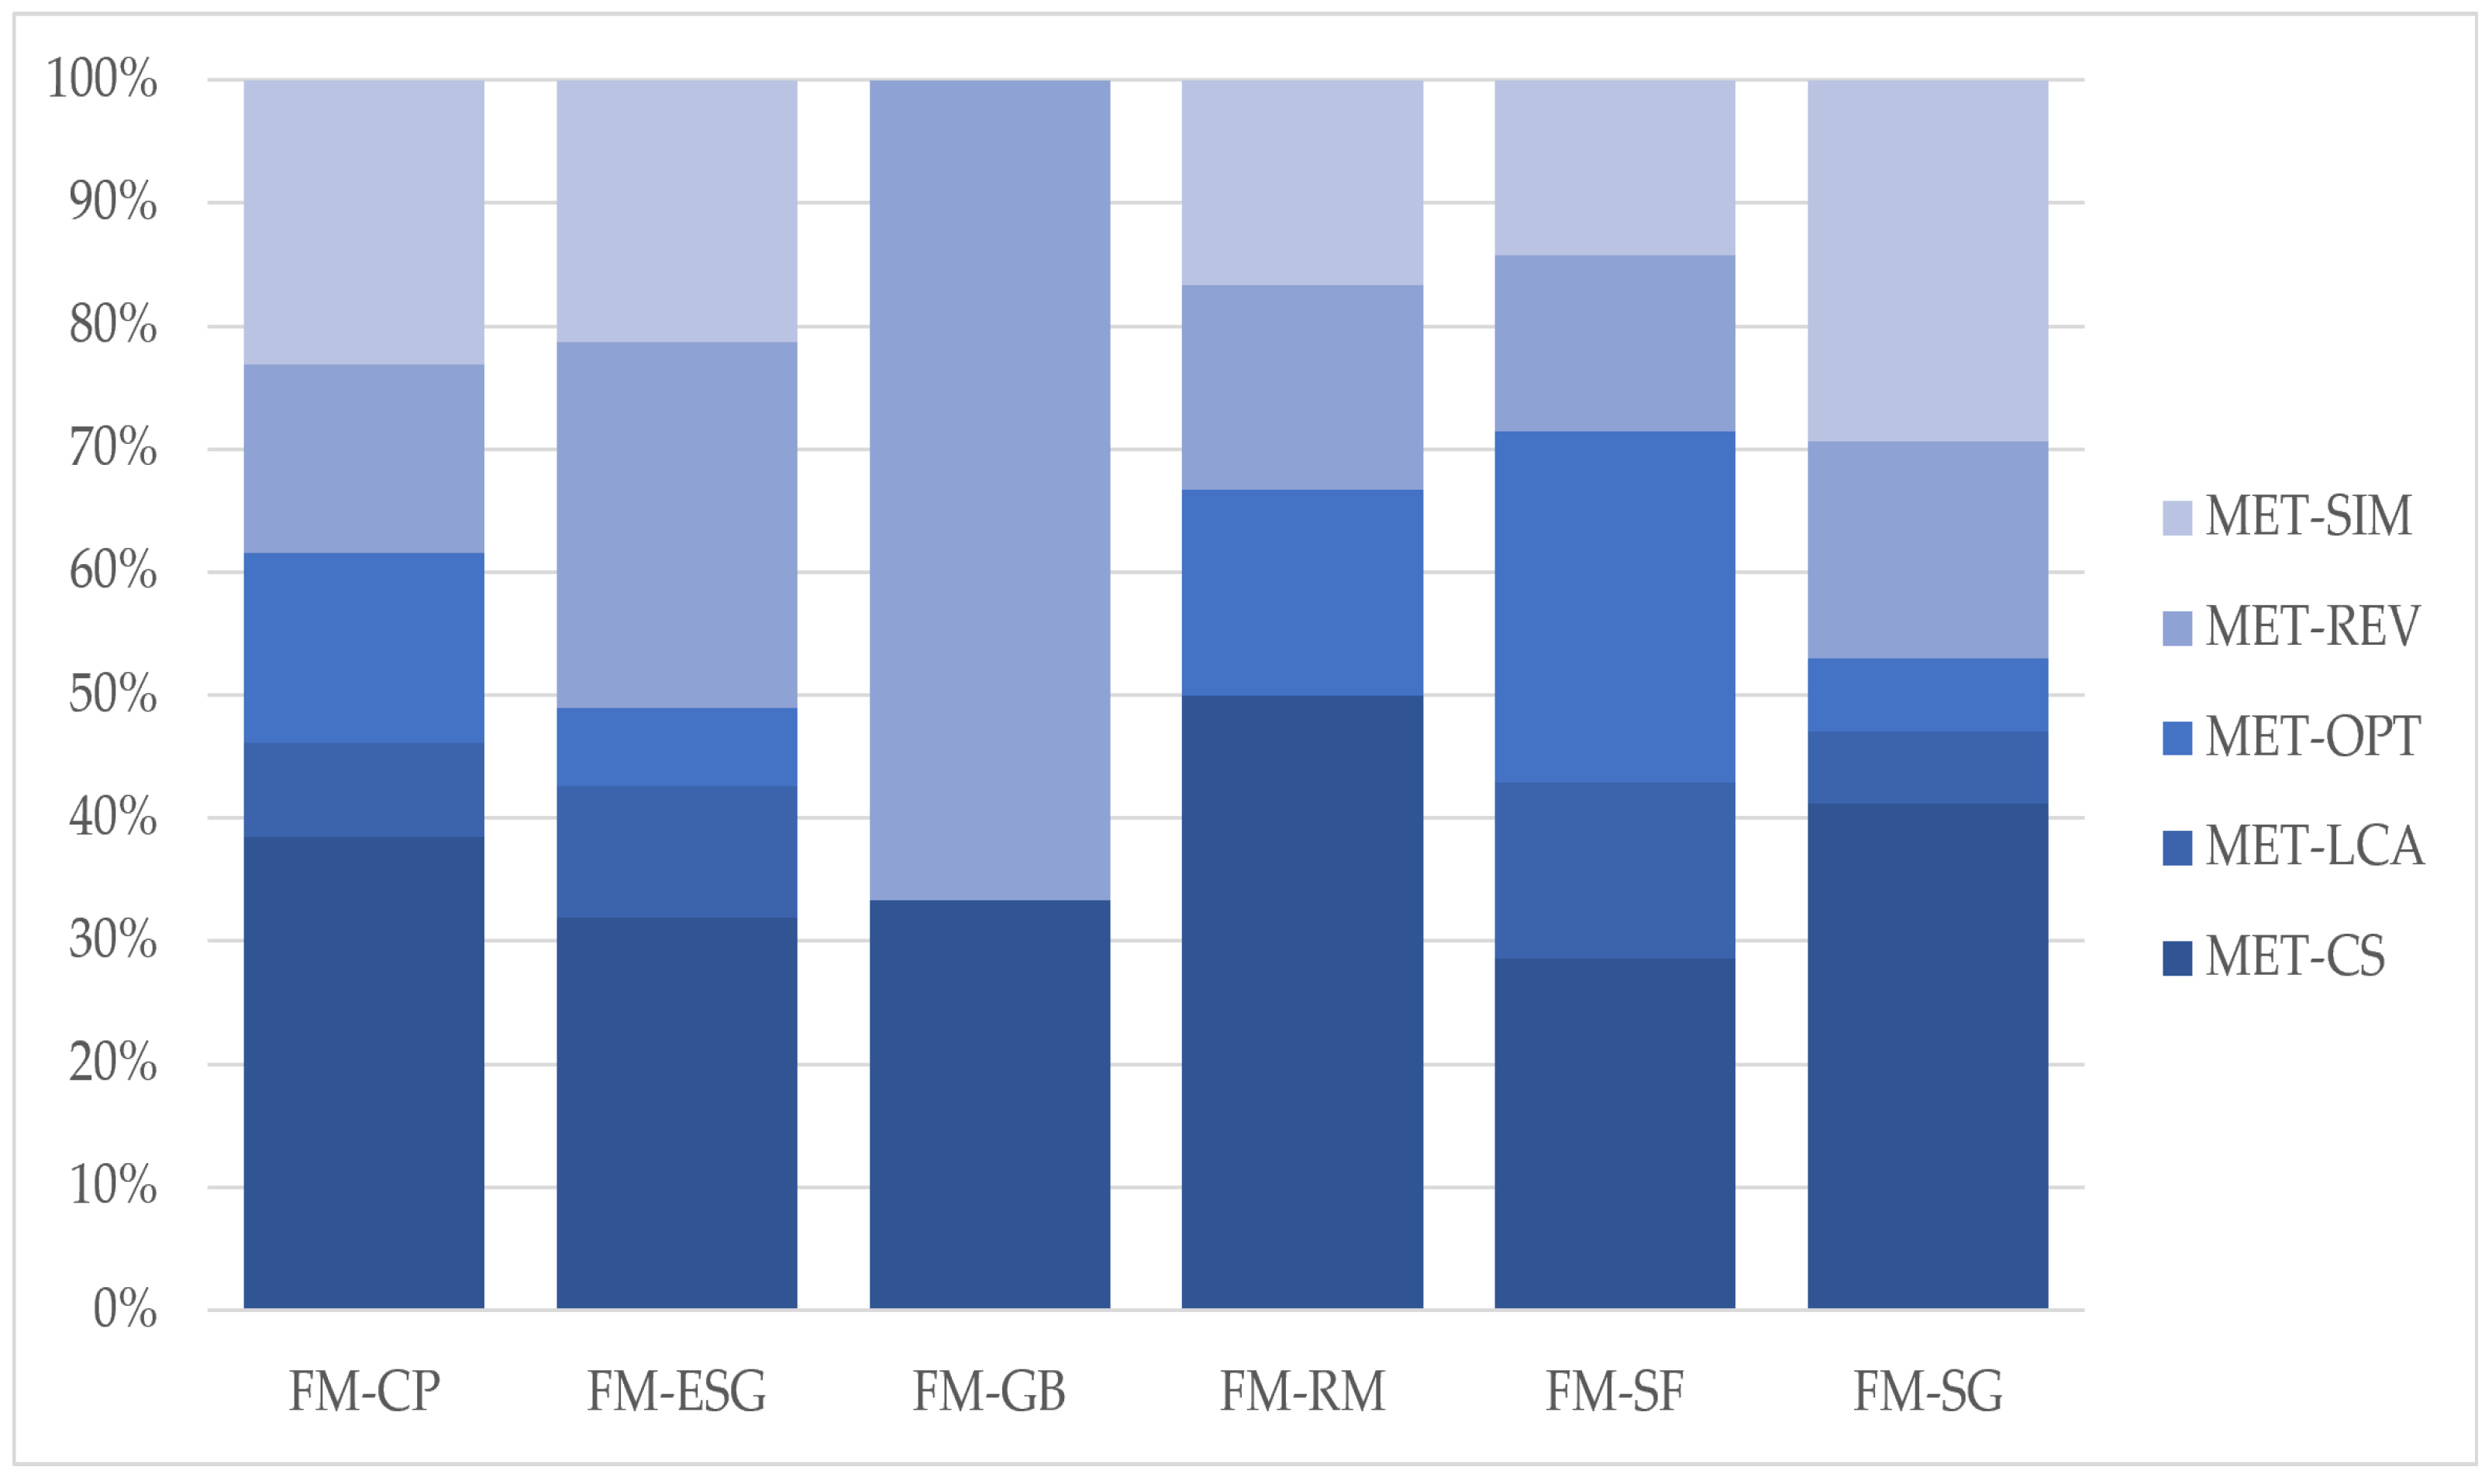
Complementing these financial findings,
Figure 8 presents the methodological mapping of the finance and policy pillar (Pillar 3). The distribution indicates that case studies (MET-CS) remain the predominant approach used to examine circularity in the energy sector, confirming the research community’s emphasis on empirical validation and proof-of-concept for CBMs. These include techno-economic assessments of localized projects such as waste-to-energy plants or small-scale biomethane facilities, illustrating how financial instruments perform under real-market conditions.
A clear association appears between ESG-related analyses (FM-ESG) and review (MET-REV) or simulation (MET-SIM) methodologies. This combination reflects the ongoing effort to consolidate diverse circular-performance indicators into coherent reporting frameworks aligned with the EU Taxonomy and the European Sustainability Reporting Standards (ESRS) [
15,
17,
18]. Simulation studies, in particular, model the financial de-risking of circular assets, typically assessing sensitivity to carbon pricing and electricity-price volatility, providing the forward-looking information required by green investors [
28,
29].
Although less frequent, optimization (MET-OPT) and life-cycle assessment (MET-LCA) methods signal the sector’s gradual progression toward value-chain-proactive design. LCA models quantify the environmental “break-even” of strategies such as battery repurposing (R7), while optimization tools are applied to identify the most profitable mix of green-finance instruments (e.g., combinations of green bonds and sustainable-finance packages) that can offset high CAPEX in circular infrastructure.
Overall, the methodological evidence in
Figure 8 confirms that the academic discourse in circular energy finance is increasingly case-driven and ESG-oriented. This pattern underscores the consolidation of Pillar 3 as the principal analytical lens through which the financial viability of circular investments is being evaluated.
3.2.6. Cross-Sector Synergies and Spatial Circularity
Systematic reviews linking CE and sustainability-oriented innovation confirm that coupling circular and renewable value chains can reduce GHG emissions by ≈37% [
96].
Synergistic, multi-technology configurations—eco industrial parks and virtual power plants—produce the most favorable combined financial and environmental outcomes.
Repurposing mined or industrial sites for renewable co-production (solar + hydrogen + geothermal) attains an IRR ≈ 16% with 9-year payback periods [
8,
33,
97].
Thermochemical recycling of plastics or hybrid gasification SOFC systems achieves >50% combined heat and power efficiency and near-zero direct CO
2 emissions [
98,
99].
Urban waste conversion to electricity and cogeneration in Mexico City and Shenzhen demonstrates that including waste heat in CCHP configurations more than doubles energy efficiency, enabling “zero waste city” strategies [
100,
101,
102].
In agricultural contexts, reusing digestate as fertilizer or pellets closes nutrient loops and supplements farm income [
40,
41]; in palm oil systems, nationwide biogas capture could save 19.5 Mt CO
2 annually, providing up to 540 MW of installed capacity [
39].
Integrated circular systems, however, require high spatial coordination. Studies show the mismatch between biomass supply regions and industrial demand centers as a critical infrastructure challenge; decentralized networks significantly enhance energy security and self-sufficiency [
103].
3.2.7. Policy Frameworks, Governance, and Social Dimensions
Effective policy coherence is regarded as a prerequisite for circular advancement. Fragmented or outdated frameworks, such as the 2006 EU Batteries Directive, impede industrial scaling [
11,
59,
88].
The EU Batteries Regulation and the introduction of the Digital Battery Passport are expected to transform transparency and data interoperability, yet implementation costs remain uncertain [
11].
In contrast, national policy asymmetry within federations like Australia perpetuates investor risk and stalls industrial development [
65].
CSR-aligned projects in Thailand demonstrate that integrating CE indicators into corporate strategies can produce positive social return on investment (SROI > 1) while strengthening local supply chains [
104].
Governance interactions between policies and business models reveal dynamic feedback: entrepreneurs adapt circular models to exploit policy frameworks, while technological innovations force policy adaptation in return [
88].
3.2.8. Quantitative Summary of Circular Performance
Effective policy coherence is a prerequisite for circular advancement, as fragmented or outdated frameworks, such as the 2006 EU Batteries Directive, continue to limit industrial scaling [
11,
59,
88].
The quantitative data summarized above highlight the financial and environmental outcomes achieved under coherent policy settings, illustrating how supportive governance directly influences circular performance across energy subsectors.
The data in
Table 3 consolidate the quantitative evidence extracted from the 93-article sample and confirm that circular energy projects can achieve both environmental and financial competitiveness when properly supported by policy and market incentives. Typical retrofits yield internal rates of return between 9% and 20%, but these values remain highly dependent on subsidy schemes and stable carbon pricing. Capital expenditure reductions of up to 75% are attainable through asset repurposing and remanufacturing, while integrated recovery systems deliver 60–90% carbon mitigation compared with linear counterparts. The most dynamic improvements are observed in electric-vehicle battery chains, where material circularity is projected to rise from 5% to 23% by 2030. Overall, the figures illustrate that circular solutions are no longer marginal pilot cases but economically meaningful strategies, provided that coherent governance frameworks and targeted financial instruments are in place.
3.2.9. Synthesis Summary
Across the 93 reviewed studies, a heterogeneous yet converging narrative emerges: circularity strengthens the energy transition’s environmental and economic resilience, but its scalability remains fundamentally dependent on aligned policy and finance conditions. The critical tensions and trade-offs underlying this finding are examined in the Discussion that follows.
4. Discussion
The synthesis of the 93 reviewed articles reveals a complex landscape where technical feasibility, business model innovation, and regulatory frameworks are deeply intertwined. While the transition to a CE in the energy sector is technically possible, several critical tensions and research gaps emerge.
4.1. The Interplay Between Digital Enablers and Systemic Transparency
A recurring theme in our findings is the role of digital technologies as catalysts for circularity [
23]. However, a significant gap exists between the conceptual potential of these technologies and their empirical validation. While AI and MINLP algorithms demonstrate high efficiency in optimizing CCS investments and energy peaks [
28,
53], consistent with our findings in
Section 3.2.1, there is a notable lack of high-resolution, real-world data to validate these models at scale [
20].
Furthermore, while blockchain is positioned as a solution for transparency in second-life battery markets [
61,
88], our analysis identifies a “transparency paradox”. Dominant market actors, particularly OEMs, often lack the incentives to share sensitive data (e.g., state of health) due to intellectual property concerns [
11,
58]. This suggests that for digital enablers to be effective, future research must focus on “incentive design”, creating frameworks where data sharing is economically beneficial for all stakeholders.
4.2. Economic Viability vs. Environmental Trade-Offs: The “Rebound Effect”
Our critical assessment of the literature reveals a persistent conflict in empirical findings regarding the actual environmental benefits of circular business models. While some studies project highly optimistic returns for second-life assets, they often conflict with comprehensive life cycle assessments that account for reverse logistics [
80]. For instance, the carbon footprint generated by the physical transportation of heavy end-of-life batteries or biomass can frequently negate the theoretical emissions savings of the circular loop if these systems are not regionally optimized [
38]. In the urban lighting and solar sectors, we observed that while frequent replacement can capture rapid efficiency gains (lower energy consumption), it often leads to higher material waste and unamortized capital costs [
51,
83,
105,
106]. Furthermore, a critical trade-off exists between short-term energy efficiency and long-term material circularity: frequent technological upgrades reduce operational carbon emissions but simultaneously generate premature e-waste and strand capital assets. This contradiction highlights that green finance metrics must be carefully calibrated to avoid inadvertently funding short-term efficiency at the expense of systemic material circularity.
Recent meta-analyses confirm that most LCAs neglect the interaction between circular product design and CBMs, leading to inconsistent sustainability claims [
80]. Agent-based macroeconomic simulations suggest that renewable-energy expansion can trigger a “material rebound”, which circular loops partly mitigate depending on recycling depth [
105].
Building on our analysis of cross-sector synergies (
Section 3.2.5), this economic-environmental tension is particularly pronounced in bioenergy systems, where the theoretical benefits of circular loops are systematically undermined by logistical realities. While our results confirm the profitability of integrated digestate valorization, the “transportation hotspot” identified across multiple studies reveals that biomass delivery can account for over 80% of the total carbon footprint [
38]. This finding challenges the conventional assumption that closing material loops automatically yields net environmental benefits.
More critically, our synthesis reveals that this rebound effect is not merely a technical optimization challenge but a fundamental limitation of current business model architectures. The dominance of Resource Recovery models (50.5% of studies) over spatially optimized industrial symbiosis approaches (8.6%) suggests that the energy sector is still prioritizing material flows over energy-transport efficiency. This necessitates a paradigm shift in research toward decentralized, localized value chains that prioritize positive energy return on investment (EROI) while maintaining the economic viability thresholds identified in our quantitative analysis (9–20% ROI range).
4.3. Regional Innovation Systems and Institutional Drivers
Recent transitions research has undergone a significant methodological evolution, shifting from simple linear assessments to sophisticated frameworks that account for regional heterogeneity. As demonstrated by Kilinc-Ata et al. (2026) [
106], the use of the Decoupling Consistency Index (DCI) and Logarithmic Mean Divisia Index (LMDI) allows for a more nuanced understanding of how economic growth and CO
2 emissions interact across different geopolitical blocs. This methodological sophistication is vital for regional innovation systems (RIS), as it reveals that while the EU has achieved absolute decoupling through sustained energy reduction and efficiency, resource-dependent regions like the GCC often face “partial decoupling” where efficiency gains are offset by rapid economic expansion. For RIS to be effective, regional policies must transition from broad targets to these types of granular, decomposition-based evaluations that identify exactly where energy intensity and economic drivers diverge.
The ‘commercialization gap’ identified in our synthesis is not merely a technical failure, but a consequence of institutional rigidities and misaligned financial incentives. To explain this theoretically, the transition must be viewed through the lens of regional innovation systems (RIS). RIS frameworks demonstrate that the success of circular business models depends heavily on local actor constellations, including the continuous interaction between regional businesses, research institutes, and local governments. The scaling of complex models like servitization requires regionalized green finance subsidies and localized supply chains to minimize logistical costs. Therefore, the commercialization gap persists because green finance is often deployed as a macro-level, one-size-fits-all instrument, failing to embed itself within the specific socio-economic and technological capabilities of regional innovation ecosystems.
Social innovation mechanisms are essential for embedding energy justice and inclusive employment within ESG practices [
104,
107,
108]. Without them, circular transitions risk reproducing inequalities between regions and stakeholders.
4.4. Geopolitical Disparities and Cross-Regional Applicability
A critical limitation of the current circular economy discourse is its heavy reliance on the European Union’s regulatory context, such as the EU Taxonomy and ESRS. To establish true global applicability, these mechanisms must be contrasted with the distinct trajectories of other major economies. China, for example, utilizes a highly centralized, state-led approach. By establishing Green Finance Reform and Innovation Pilot Zones and massive industrial parks, the Chinese government forcefully integrates circular supply chains and channels capital directly into urban energy structure transitions [
78,
101,
109]. In contrast, India is rapidly scaling its renewable energy capacity by incorporating green bonds directly into its national climate finance strategy, using private and institutional capital to accelerate the shift away from fossil fuels. Meanwhile, the United States relies far less on restrictive taxonomies and more on market-driven, demand-side policies (e.g., contracts for difference, advance market commitments) and the funding of regional innovation ecosystems (such as DOE-supported hubs) to de-risk investments and bridge the innovation valley of death. Most notably, the Inflation Reduction Act (IRA) has emerged as a landmark demand-side instrument, providing direct investment tax credits for battery recycling, second-life asset deployment, and clean energy manufacturing that effectively substitute for the regulatory mandates embedded in the EU Taxonomy. These geopolitical disparities prove that circular business models and green finance instruments cannot be universally transplanted; they must be intimately tailored to the specific political economy of the host region.
4.5. The Conceptual Nexus of Circular Energy Finance: An Integrative Framework
The preceding discussion sections reveal a consistent pattern: the barriers and enablers of the circular energy transition do not operate in isolation. Rather, they form a tripartite interdependence between business model architecture, financing mechanisms, and regulatory design. To synthesize these interactions explicitly, this section introduces the “Conceptual Nexus of Circular Energy Finance”—an integrative framework that maps the causal relationships between the three layers identified throughout this review.
The framework is structured around three mutually reinforcing layers:
The Business Layer defines the operational logic of circular value creation. As established in
Section 3.2.2, the dominant archetypes in the energy sector are Resource Recovery models (BM-RR, 50.5%) and Product-Service Systems (BM-PSS, 33.3%). These archetypes generate fundamentally different financial profiles: BM-RR models are CAPEX-intensive, requiring large upfront infrastructure investment with delayed revenue recovery, while BM-PSS models, such as Battery-as-a-Service (BaaS), convert capital expenditure into recurring operational revenue streams, improving cash flow predictability and reducing the probability of default.
The financial risk implications of this shift are threefold: first, Cash Flow Predictability—transitioning to “Energy-as-a-Service” replaces capital-intensive sales with stable, recurring revenue, reducing the probability of default (PD); second, Mitigation of Stranded Asset Risk—modular designs ensure assets do not become obsolete before financing is repaid; and third, Resource Resilience—high-level circularity decouples production from critical raw material (CRM) volatility, improving creditworthiness for ESG lenders. The choice of business model archetype, therefore, directly determines the type and structure of financing required.
The choice of business model archetype, therefore, directly determines the type and structure of financing required.
The Financing Layer translates business model requirements into investable instruments. Our synthesis (
Section 3.2.5) demonstrates that financial viability in the circular energy sector is rarely self-sustaining: across the 93 reviewed studies, profitability in the absence of targeted financial stimuli is the exception rather than the rule. ESG-linked corporate debt (FM-ESG, 50.5%) is the predominant mechanism, but its effectiveness depends critically on the availability of verifiable circularity metrics—a condition not yet consistently met. Green bonds (FM-GB, 3.2%) represent a significantly underutilized instrument, particularly for second-life battery infrastructure and wind remanufacturing assets. The quantitative evidence from
Table 3 confirms that CAPEX reductions of 40–75% through asset repurposing are achievable, but only when financing instruments are matched to the specific risk profile of the business model they support. Supply-chain financing, rather than isolated project finance, emerges as the critical structural requirement for scaling BM-PSS archetypes.
The Regulatory Layer sets the conditions under which capital flows toward circular solutions rather than linear alternatives. The EU Taxonomy (Delegated Regulation 2023/2486) and the European Sustainability Reporting Standards (ESRS E5) are the most prominent instruments identified in our review, establishing the transparency thresholds that allow institutional investors to distinguish genuinely circular assets from greenwashed alternatives. Carbon pricing is identified as the single most consequential policy lever: our synthesis confirms a threshold of ≥40 €/t CO2 as the breakeven condition for circular investments to outcompete linear ones across multiple subsectors. Below this threshold, the economic case for circularity collapses without supplementary subsidy support.
The central argument of this framework is that the three layers are not sequential but simultaneous: regulatory design shapes which business models are financially viable, the financial instruments available determine which business models can be scaled, and the scalability of business models in turn creates pressure for regulatory adaptation. This feedback dynamic explains what
Section 4.3 identified as the “commercialization gap”: the persistent chasm between technical feasibility and market implementation. The gap endures not because any single layer is absent, but because the three layers remain misaligned: green finance is deployed at a macro level while business models require regionalized instruments (
Section 4.3), and regulatory frameworks designed for linear energy systems struggle to accommodate the decentralized, service-based logic of circular archetypes (
Section 4.6).
For policy and investment practice, the Conceptual Nexus implies a specific sequencing priority: regulatory standardization must precede large-scale green finance deployment, because without verifiable circularity metrics at the asset level, through instruments such as Digital Battery Passports and standardized decommissioning protocols, capital cannot be efficiently allocated across the Business and Financing layers. This sequencing logic provides the structural rationale for the research agenda proposed in
Section 4.7.
4.6. Regulatory Gaps and the “Path Creation” in Emerging Markets
Our review underscores that the circular transition is not a “one-size-fits-all” process. In developed markets, the delay in large-scale recycling is paradoxically caused by the success of second-life applications, which “lock in” critical materials for decades [
7,
11,
63]. In contrast, emerging markets face a total lack of studies addressing the perspective of OEMs and the “path creation” needed for circularity [
110]. These findings complement our sectoral analysis (
Section 3.2.2), which identified that regulatory readiness varies significantly: wind > biogas > solar > geothermal.
Despite the technical viability of circular energy systems,
institutional barriers and
regional policy frictions remain the primary inhibitors of scale. Research highlights that the transition is often slowed by “administrative inertia”, where existing regulatory frameworks are designed for linear, centralized energy models and struggle to adapt to the decentralized, service-based nature of circular business models. Furthermore, institutional friction arises when there is a lack of coordination between national energy targets and local planning permits, creating a “policy-practice gap”. To mitigate this, regulatory frameworks must prioritize
institutional readiness, streamlining bureaucratic hurdles and aligning fiscal incentives (such as green taxes) with long-term circularity goals to ensure that the “green technology paradox” does not stall private investment in transitioning economies [
111,
112].
A significant barrier identified across all sectors is the lack of standardized market pricing for secondary raw materials and harmonized regulations for waste valorization [
91]. For instance, in the solar sector, current legislation fails to incentivize the recovery of high-value metals beyond aluminum [
50,
113]. To overcome social resistance, particularly in developing economies, we argue for a strategic rebranding of circular technologies from “green” to “job-creating” or “socio-economic stabilizers” [
104,
110]. Meta-analysis from an OEM perspective shows that in emerging markets, positioning wind technologies as “job-creating” rather than purely “green” significantly improves adoption [
110].
4.7. Future Research Directions
Building upon our analysis of circular transition patterns, we move beyond descriptive recommendations to propose a structured research agenda.
Table 4 identifies the primary barriers identified in this review and pairs them with specific, actionable research opportunities designed to bridge the gap between technical feasibility and business model maturity.
5. Conclusions
Before drawing final conclusions, certain limitations regarding the scope and nature of the reviewed literature must be acknowledged. First, our proposed conceptual framework operates at a relatively high level of abstraction, focusing primarily on the interpretative alignment between business models, finance, and regulation. While this high-level synthesis provides a necessary macro-perspective for the energy sector, its predominantly interpretative nature remains an inherent limitation of the study’s scope, and future research is needed to transition from this framework to project-level operationalization. Second, since this systematic review highlights that the current literature relies heavily on qualitative, case-study-based evidence, there is a critical need for future empirical research. Subsequent studies should employ stronger quantitative identification strategies, econometric modeling, and comparative cross-country datasets to provide generalizable evidence for the circular energy transition.
This review consolidates evidence from 93 high-impact studies to provide a comprehensive map of how the energy sector is transitioning toward CE. By integrating technical, economic, and governance dimensions, the synthesis provides direct answers to the core research questions formulated in this study:
Answering RQ1 (Evolution of Circular Business Models): The sector is experiencing a strategic maturity shift, moving away from low-order, reactive recycling towards proactive, high-value circularity. This evolution is driven by the adoption of Product-Service Systems (PSS) and servitization models (e.g., Battery-as-a-Service). However, a persistent ‘commercialization gap’ remains, where engineering capabilities for life-extension vastly outpace the development of scalable, profitable revenue models.
Answering RQ2 (Prevalent Green Financing Instruments): The literature indicates that circular energy systems remain economically fragile and highly dependent on targeted financial stimuli. The most prevalent mechanisms supporting these models include ESG-linked corporate debt, green bonds, and state subsidies. We found that financial viability is heavily reliant on stable carbon pricing (typically requiring ≥ 40 €/t CO2) and that capital allocation must shift from isolated project finance to integrated supply-chain financing.
Answering RQ3 (Critical Financial and Regulatory Barriers): The transition is severely bottlenecked by systemic, non-technical barriers. Chief among these is the ‘transparency paradox’, where corporate data protectionism prevents the effective use of digital enablers like blockchain in secondary markets. Additionally, fragmented cross-border regulations regarding waste-versus-resource classifications and a lack of standardized pricing for secondary raw materials continue to deter private green investments.
5.1. Limitations
While this systematic review provides a comprehensive synthesis of the circular energy transition, several limitations must be acknowledged to contextualize the findings.
5.1.1. Limitations of the Review Process
Firstly, the search strategy was confined to the Web of Science and Scopus databases. Although these are the most comprehensive repositories for high-impact peer-reviewed literature, the exclusion of “grey literature”, such as industrial white papers, government technical reports, and policy briefs from international energy agencies, may have resulted in the omission of the most recent practical implementations and pilot project data that have not yet reached academic publication.
Secondly, a language bias exists, as the review only included studies published in English. Given that significant advancements in circular economy practices and renewable energy manufacturing are occurring in non-English speaking regions (notably China and South America), relevant regional insights and regulatory frameworks may be underrepresented.
Thirdly, the application of a strict quality filter (limited to Scimago/JCR Q1 and Q2 journals) and the exclusion of conference proceedings ensures high scientific rigor but may lead to a “publication lag”. This potentially excludes emerging, fast-moving innovations in circular technology (like solid-state battery recycling) that are often first shared at international conferences.
5.1.2. Limitations of the Included Evidence
The evidence base itself exhibits a geographic and sectoral imbalance. A significant portion of the synthesized data is concentrated in European and North American contexts, which benefit from mature regulatory frameworks like the EU Taxonomy. Consequently, the findings regarding green financing (RQ3) may have limited generalizability to emerging economies where financial markets are less developed.
Furthermore, there is a lack of long-term longitudinal data in the included studies. Because the transition to a circular economy is a relatively recent priority for the energy sector, many of the reported financial outcomes (such as ROI and NPV for remanufactured components) are based on simulations or short-term pilot studies rather than decades of industrial operation. This introduces a degree of uncertainty regarding the long-term durability and economic performance of circular assets under varying market conditions.
Finally, the heterogeneity of metrics used across the 93 studies, ranging from qualitative thematic assessments to diverse quantitative life-cycle indicators, precluded the performance of a formal meta-analysis. This limits the ability to provide a single, unified statistical effect size for the impact of circularity on energy sector profitability.
5.1.3. Risk of Bias Assessment
A critical limitation of the current evidence base is the inherent selection and reporting bias within the included studies. As the circular economy in the energy sector is an emerging field with high policy relevance, there is a noted “success bias” in the literature. Studies tend to report on successful pilot projects or optimized simulations (e.g., specific wind farm repowering or EV battery second-life cases) that yield positive Net Present Values (NPV) or high Internal Rates of Return (IRR). Conversely, unsuccessful circular initiatives or business models that failed due to regulatory friction are significantly underrepresented, potentially leading to an over-optimistic synthesis of the economic viability of circular business models (CBMs).
Furthermore, the methodological diversity of the included studies introduces a risk of bias in the synthesis. While 50% of the studies utilized quantitative methods like life cycle assessment (LCA) or financial modeling, the lack of standardized reporting for “circularity metrics” makes it difficult to verify the underlying assumptions of each study. For instance, varying assumptions regarding the lifespan of remanufactured components or future carbon prices can significantly skew results.
At the review level, despite the use of two independent reviewers to mitigate selection bias, the reliance on high-impact (Q1/Q2) journals may have introduced a prestige bias. This exclusion of lower-tier journals and conference proceedings might have filtered out critical or contrarian views that often appear in more technical or regionally focused engineering outlets. Finally, because a formal meta-analysis was not feasible due to this data heterogeneity, the synthesis relies on thematic grouping, which, while rigorous, retains a degree of subjective interpretation by the authors during the qualitative mapping of the 10R hierarchy.
5.2. Policy Implications
To effectively catalyze the transition to a circular energy sector, policy interventions must shift from generalized environmental goals to targeted instruments that address the specific financial and technical risks associated with circular business models. Based on our findings, we propose a three-tiered policy framework:
5.2.1. Sector-Specific Regulatory Standards
Rather than a “one-size-fits-all” approach, regulators should implement subsector-specific mandates that recognize the unique lifecycle of renewable assets:
Wind Energy: Policymakers should establish standardized decommissioning and remanufacturing protocols. Current insurance and financing hurdles stem from a lack of “asset insurability” for refurbished components; standardizing these processes will allow remanufactured turbine parts to compete with new ones in the secondary market.
Solar PV: Implementation of Extended Producer Responsibility (EPR) schemes must be refined to target high-value metal recovery (silver, silicon) rather than just glass and aluminum. This can be achieved through “Circular Design” mandates that penalize non-recyclable laminate structures.
Bioenergy: A shift is required from simple feed-in tariffs to carbon-tax frameworks that explicitly reward the valorization of digestate and the systemic integration of industrial symbiosis.
5.2.2. De-Risking the “Finance-Circularity Nexus”
The high upfront CAPEX of circular models, such as Battery-as-a-Service (BaaS), requires specific fiscal de-risking:
Tax Incentives: Inspired by the U.S. Inflation Reduction Act (IRA), governments should provide
investment tax credits for second-life asset deployment, lowering the cost of entry for small-to-medium enterprises (SMEs) as discussed in
Section 4.4.
Blended Finance: Public-private partnerships should utilize “blended finance” structures where public funds provide first-loss guarantees for circular energy projects, thereby attracting institutional capital via Green Bonds.
Carbon Pricing: Maintaining carbon prices at thresholds above 40 €/t is essential to ensure that the “material rebound” effect is mitigated and that circular materials remain economically competitive against virgin extraction.
5.2.3. Digital Governance and Data Transparency
To resolve the “Transparency Paradox” identified in this review, policy must mandate a digital infrastructure for resource tracking:
Digital Product Passports (DPPs): Legislation should require the implementation of “Battery Passports” or digital twins for all large-scale energy storage and generation equipment. This ensures that recyclers and second-life operators have access to real-time degradation data, reducing the information asymmetry that currently inhibits the valuation of used assets.
Standardization of ESG Reporting: Harmonizing ESG disclosure requirements globally will prevent “greenwashing” and ensure that financing is directed toward projects with verifiable Social Return on Investment (SROI), particularly for regional job creation in remanufacturing hubs.
In summary, the circular transition of the energy sector is technically achievable and financially desirable, yet still constrained by regulatory fragmentation and inconsistent capital access. Achieving systemic circularity will depend on embedding financial instruments and digital transparency within inclusive governance structures that balance economic, environmental, and social performance.




 ,
,