1. Introduction
Photovoltaic (PV) installations are among the fastest growing renewable energy technologies, yet their long-term technical value depends not only on installed capacity but also on operational reliability, continuity of service, and the effectiveness of maintenance management [
1,
2]. Earlier studies have shown that PV systems are exposed to heterogeneous fault mechanisms, including module degradation, hotspot-related damage, junction box malfunction, and cable insulation deterioration [
3,
4]. Other reported failure categories include inverter disconnection, balance-of-system faults, weather-related defects, and reliability-oriented PV failure patterns [
5,
6]. Because these failures differ not only in frequency but also in consequences, maintenance prioritization cannot be reduced to a single technical symptom [
7,
8].
From a research landscape perspective, the topic of PV failure analysis can be structured into four closely related domains: module degradation and defect mechanisms, inverter and balance-of-system failures, fault detection and diagnostic methods, and maintenance- or reliability-oriented decision support [
1,
3]. Inverter-related failures, weather-related defects, control-related faults, and system-level reliability issues form the remaining part of this landscape [
5,
8]. Predictive maintenance research further highlights the need to connect technical failure categories with maintenance decisions [
9,
10]. The present work is positioned at the intersection of these domains. It is not a broad bibliometric review, a monitoring study, or a predictive maintenance algorithm paper; instead, it focuses on the maintenance priority layer, where different technical, safety, and service criteria must be integrated into a single decision framework.
Methodologically, classical Failure Mode and Effects Analysis (FMEA) remains attractive because of its simplicity and engineering interpretability, but its conventional Risk Priority Number (RPN) has well-known limitations [
11,
12]. It may assign similar priorities to technically dissimilar faults, underrepresent downtime-related or safety-critical events, and provide insufficient discrimination when several operational dimensions must be balanced simultaneously [
13,
14]. In PV systems, this limitation is particularly relevant because some failures are frequent but gradual, whereas others are less frequent yet much more disruptive in terms of outage duration, fire hazard, or repair urgency. This is also relevant to low-voltage electrical networks, where rapid arc extinction and dynamic thyristor-controlled hybrid switching have been investigated as protection mechanisms for reducing arc-fault consequences [
15].
To define the scope of the present study more precisely, the analysis is limited to maintenance-critical failure modes in grid-connected PV installations. Broader issues such as market diffusion, policy incentives, life-cycle carbon assessment, or portfolio-level energy planning are outside the study boundary. Within this scope, three research questions are addressed:
R1: Which representative PV failure modes should be prioritized from a maintenance perspective?;
R2: How does an optimized multi-criteria ranking differ from a classical FMEA ordering?;
and R3: Which criteria most strongly influence the final priority structure?
Accordingly, the aim of this study is to develop a hybrid Particle Swarm Optimization (PSO) Failure Mode and Effects Analysis (FMEA)-VIseKriterijumska Optimizacija I Kompromisno Resenje (VIKOR) framework for maintenance prioritization in photovoltaic installations.
The scientific contribution is threefold:
First, classical FMEA is embedded in an explicitly maintenance-oriented seven-criterion architecture rather than being used as a standalone RPN tool.
Second, the weighting structure is not assumed a priori, but optimized by PSO to improve ranking separation under the adopted constraints.
Third, the final ranking is interpreted against field-documented service cases, which strengthens the link between the decision model and real engineering consequences.
The additions are intended to move the work beyond a descriptive fault listing toward a reproducible and decision-relevant maintenance methodology.
The proposed framework is not intended to operate as a standalone real-time fault-detection system. It assumes that faults or failure categories have already been identified through inspection, monitoring, user reporting, service documentation, or diagnostic procedures. Its practical contribution lies in converting heterogeneous fault evidence into a transparent maintenance priority ranking that can support inspection planning, preventive maintenance scheduling, and corrective action targeting.
2. Materials and Methods
2.1. Methodological Framework
The study was designed as a hybrid decision support framework integrating Failure Mode and Effects Analysis (FMEA), Particle Swarm Optimization (PSO), and VIseKriterijumska Optimizacija I Kompromisno Resenje (VIKOR) [
11,
12,
16]. PSO was included as the optimization layer because particle swarm algorithms are established tools for parameter and weight optimization in engineering problems [
17,
18]. The VIKOR stage was used because it provides a compromise solution under conflicting criteria and can combine overall utility with the most unfavorable criterion [
16].
The methodological sequence consisted of:
identification of representative PV failure modes;
definition of a maintenance-oriented evaluation structure; baseline screening with classical FMEA;
optimization of criteria weights using PSO;
final compromise ranking using VIKOR;
sensitivity analysis of ranking stability. The framework was intentionally positioned as a methodological maintenance prioritization model demonstrated on representative PV failure modes.
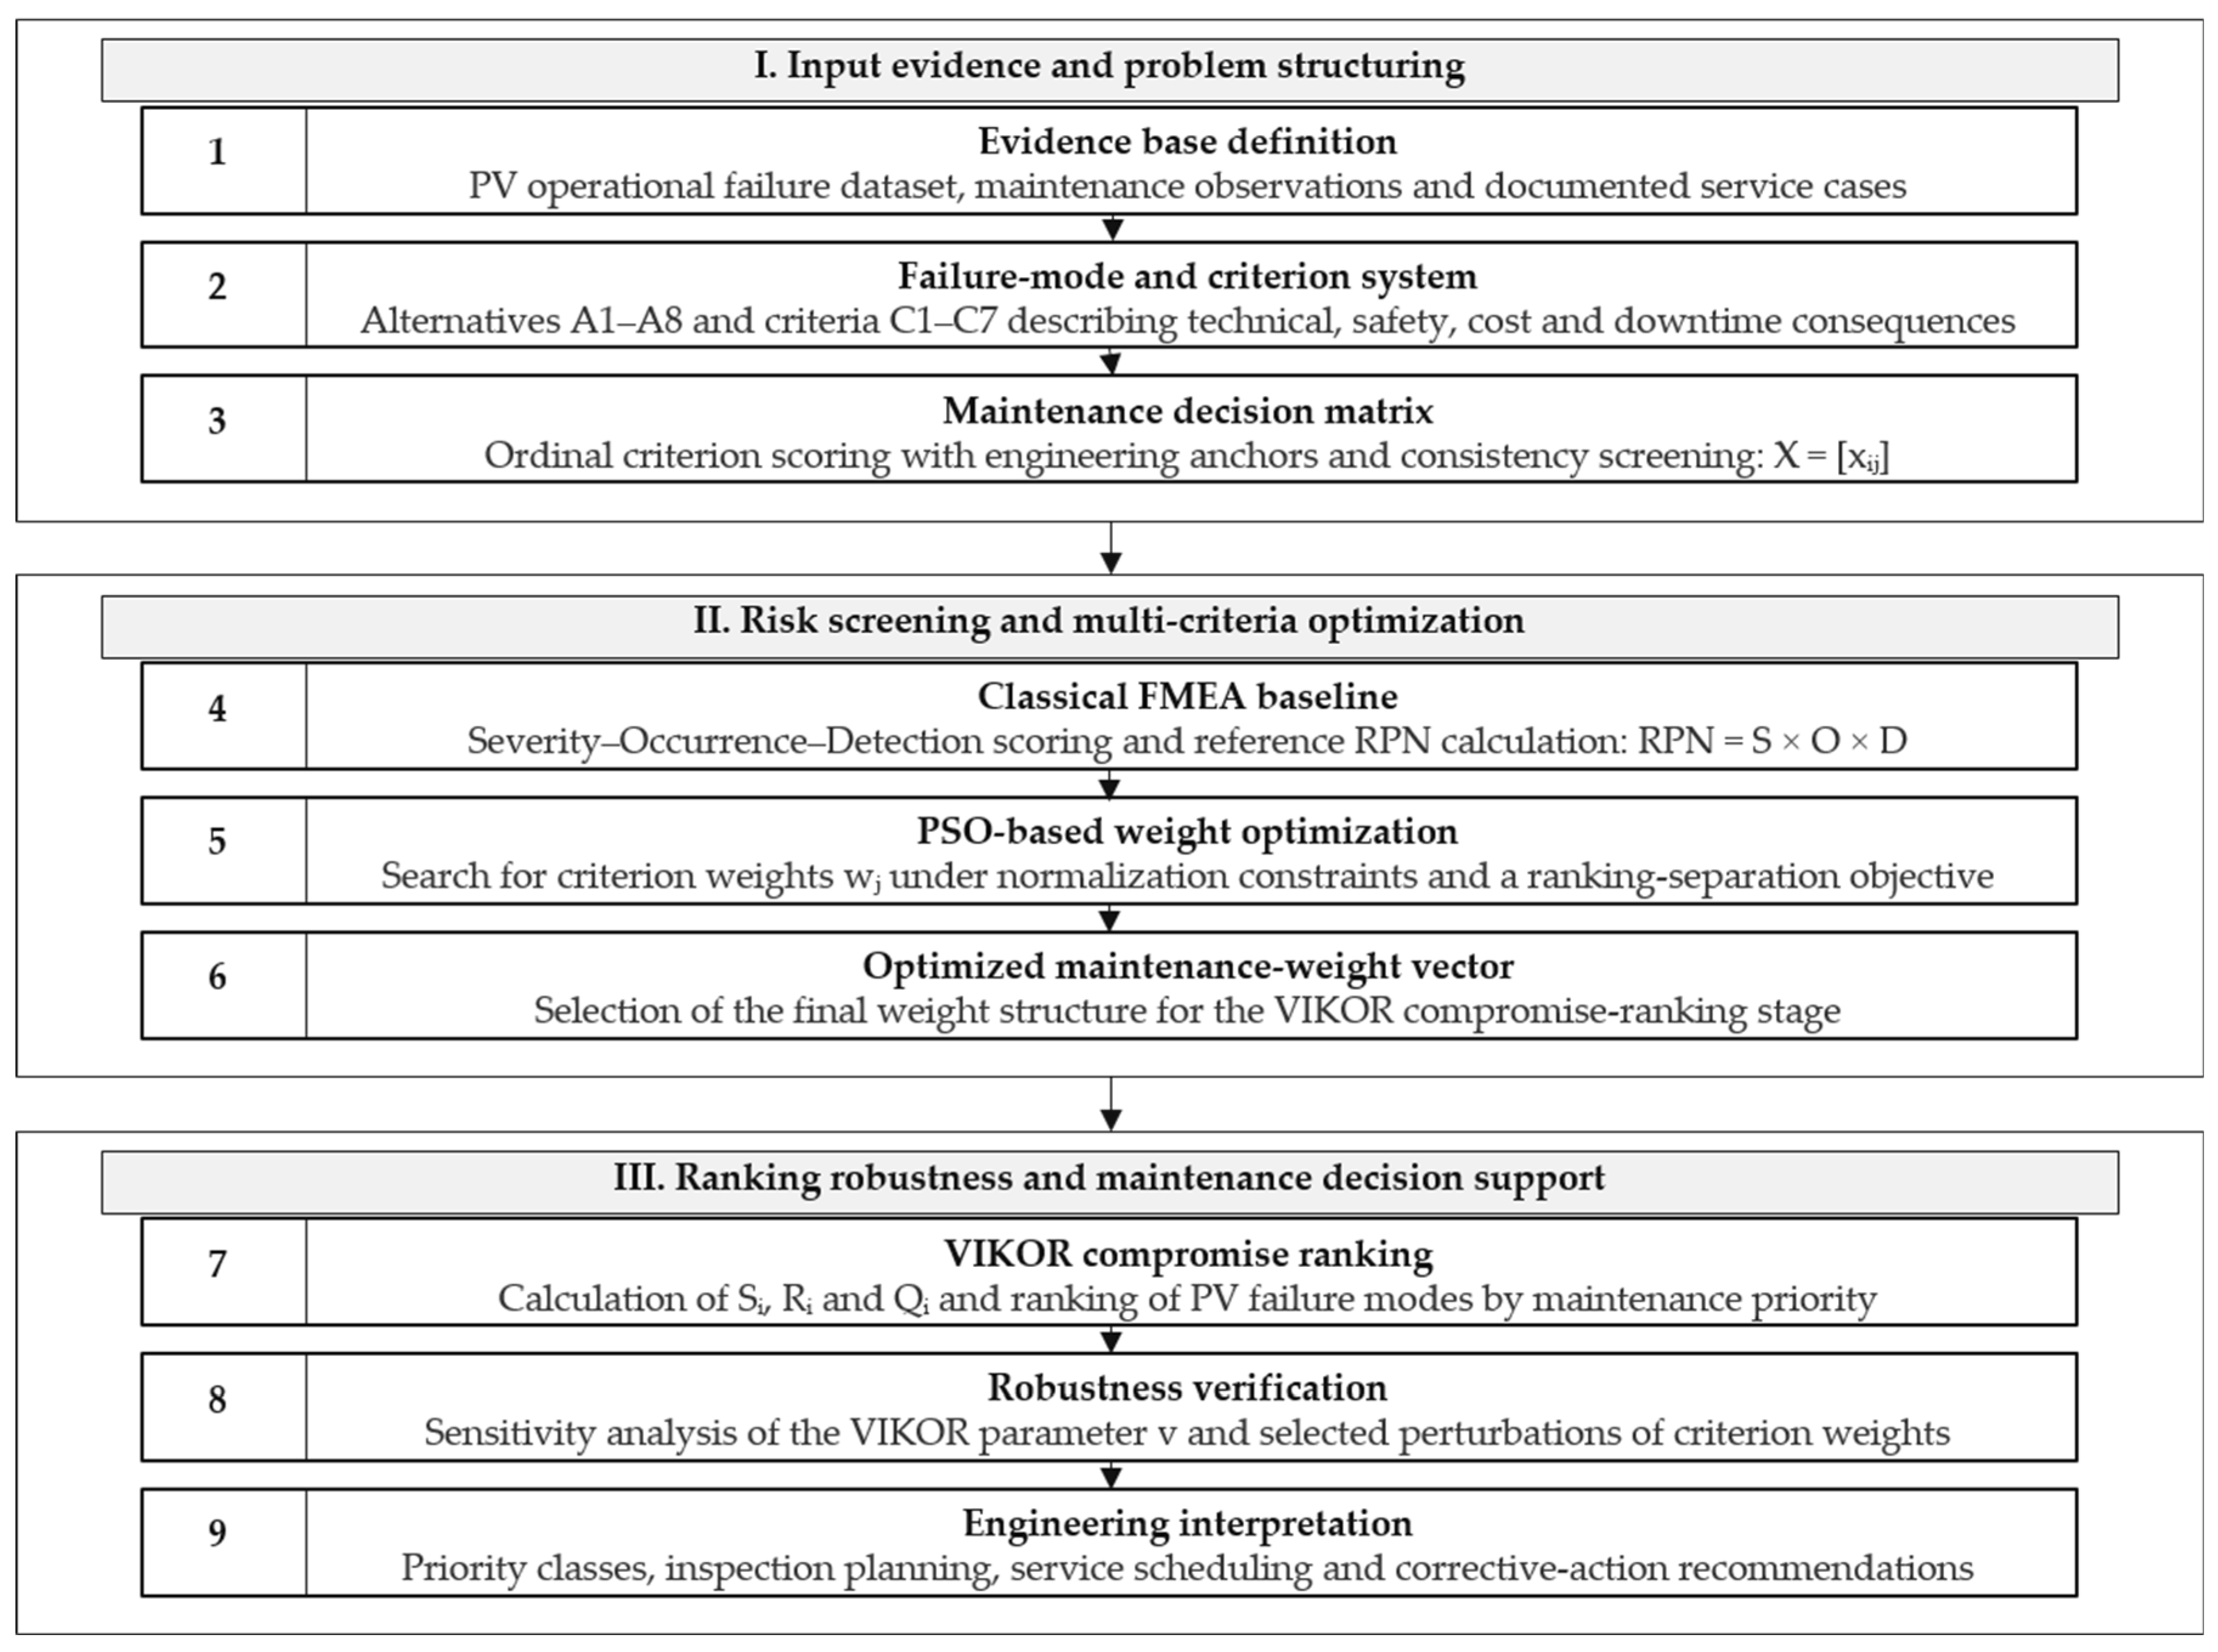
The complete analytical workflow is summarized in
Figure 1.
2.2. Failure Mode Identification
The analyzed failure modes were selected using a literature-grounded and service-informed maintenance perspective. The failure structure was aligned with categories repeatedly identified in PV failure studies, including shading and hotspot-related effects, junction box failures, aging, and cable insulation degradation [
1,
3]. It also reflected reported inverter disconnection, weather-related defects, balance-of-system faults, and control-related failures [
5,
8]. In addition, the selection was cross-checked against the authors’ semi-empirical evidence sources: a 50-case installation/user-level operational dataset and an independent database of 1000 documented PV service interventions. The service log indicators confirmed the practical relevance of inverter hardware failures, logger disconnections, DC fuse faults, melted MC4 connectors, mechanical module damage, DC automatic-switch faults, hot-spot-related claims, and arc-fault-related DC side damage. Therefore, the eight alternatives were not selected from literature alone, but from a triangulation of published PV failure categories, earlier survey-based observations [
9], and documented maintenance practices.
A1—partial shading and hotspot formation;
A2—junction box overheating/failure;
A3—cable insulation degradation;
A4—cell microcracking and interconnection failure;
A5—glass breakage due to hail impact;
A6—aging-related power degradation;
A7—inverter overvoltage shutdown/grid incompatibility;
A8—tracker/control automatics failure.
2.3. Evaluation Criteria and Scope Adaptation
Seven criteria were used to evaluate the selected failure modes:
C1—severity of energy loss,
C2—occurrence frequency,
C3—detectability difficulty,
C4—maintenance cost,
C5—safety impact,
C6—downtime effect,
C7—environmental exposure sensitivity.
All criteria were treated as cost-type criteria, meaning that higher values represented less favorable conditions. Ratings were assigned on a 10-point ordinal scale.
Because the objective of the study was not to select the technically least problematic failure mode, but to identify the most maintenance-critical failures, the subsequent ranking was interpreted in a criticality-oriented manner. Higher scores, therefore, intentionally represented increasing maintenance burden. In the VIKOR stage, the reference direction was defined relative to the critical maintenance priority profile rather than toward the least severe technical condition.
The criteria architecture was not copied directly from the earlier Analytic Hierarchy Process (AHP)-based risk table reported in the PV failure literature, but its logic was adapted to the needs of maintenance prioritization [
1]. Design and performance considerations informed the interpretation of severity and detectability; operation-informed occurrence and outage-related consequences; financial aspects were represented by maintenance costs and downtime effects; and environmental factors were retained as environmental exposure sensitivity. The previously separated social dimension was not retained as a standalone criterion because the present article focuses on maintenance-critical technical prioritization rather than stakeholder acceptance or land-use nuisance.
The seven criteria were selected to represent the main engineering dimensions that determine maintenance urgency. C1 captures the expected production consequence of a failure mode; C2 reflects how often the event is expected or observed to occur; C3 represents the difficulty of detecting the fault before escalation; C4 reflects direct intervention, replacement, or repair cost; C5 captures electrical, thermal, and fire safety relevance; C6 represents service interruption and repair cycle duration; and C7 reflects exposure to environmental stressors such as humidity, hail, wind, temperature, soiling, or shading. This structure is consistent with FMEA logic, PV reliability literature, and maintenance management requirements, while remaining sufficiently compact for a reproducible multi-criteria ranking.
2.3.1. Scoring Anchors and Consistency Protocol
To improve scoring consistency, the 10-point scale was interpreted using fixed engineering anchors. For the severity of energy loss, a score of 1 represented a negligible impact on system output, while 10 denoted a major production interruption. For detectability difficulty, lower values represented faults readily identified during routine inspection or monitoring, whereas higher values denoted hidden or progressive faults requiring dedicated diagnostics. For safety impact, a score of 10 indicated a strong electrical, thermal, or fire hazard potential.
In addition, scores in the upper range of the scale were reserved for failure modes combining severe production loss with at least one additional critical maintenance consequence, such as electrical safety implications, difficult detectability, or prolonged service interruption. This rule was introduced to ensure that high values were assigned not only to frequent events, but also to failures with high operational severity, safety relevance, or substantial service burden. In this way, the scoring logic remained consistent with the maintenance prioritization objective of the proposed framework and improved the reproducibility of future case studies (
Table 1).
To further reduce scoring subjectivity, the semi-quantitative assessment followed a three-step protocol. First, scoring anchors were derived from the combined reading of PV reliability literature, maintenance studies, and field-documented service observations. Second, preliminary scores were assigned criterion-by-criterion for each failure mode and then reconciled in a consistency check focused on internal logic across severity, detectability, downtime, and safety dimensions. Third, the final matrix was screened for dominance anomalies and implausible ties before the PSO–VIKOR stage was executed. The field images used later in the article were not treated as additional quantitative cases; they were used only to support the engineering interpretation of already ranked alternatives.
The anchors were used as a common scoring protocol for all seven criteria. They were not intended to convert the semi-empirical evidence into deterministic failure rates, but to make the expert-informed ordinal scoring more transparent and repeatable.
2.3.2. Semi-Empirical Maintenance Evidence Support
The semi-empirical evidence layer consisted of two separate and non-merged data sources collected in the same regional PV-service context in south-eastern Poland. The first source was a 50-case operational dataset at the installation/user level. It covered residential and small-commercial grid-connected PV installations and included user-reported operational problems, PV system failures, warranty repair indications, inverter disconnection events during grid voltage rises, and approximate repair duration patterns. The source period was treated as a retrospective operational evidence period rather than a controlled monitoring campaign; therefore, these data were used only as contextual installation/user-level evidence.
The operational and service evidence was collected retrospectively in south-eastern Poland over a multi-season maintenance period covering both high-production and low-production PV operating conditions.
The second source was an independent service log database comprising 1000 documented PV service interventions extracted from anonymized maintenance documentation available to the authors in the same regional service context in south-eastern Poland. The database covered documented service interventions from a retrospective maintenance period and included technician notes, repair or replacement categories, cost records, service duration information, and photographic evidence where available. Due to commercial confidentiality, the service provider and detailed record-level identifiers are not disclosed. This source was used at the intervention level to determine indicative frequencies, typical direct service costs, and typical downtime/service duration for selected maintenance-event categories.
Because the evidence was collected in south-eastern Poland, the interpretation of weather-sensitive failures should be regarded as regionally contextualized. The study did not perform a separate meteorological normalization of service events; weather-related exposure was represented only through criterion C7 and through documented categories such as hail impact, soiling or shading, humidity-related degradation, and temperature-related stress, where such information was available in the records.
Fault confirmation differed between the two evidence layers. In the 50-case operational dataset, the evidence was based mainly on user-reported installation-level information and selected repair or warranty indications. In the 1000-case service log database, events were confirmed through maintenance documentation, technician diagnosis, replacement or repair notes, and photographs where available. No continuous real-time Supervisory Control and Data Acquisition (SCADA), inverter log, Internet of Things (IoT), phasor measurement unit (PMU), or micro-PMU validation was performed in the present study; this limitation is explicitly acknowledged in the Discussion.
The two sources were not statistically merged. The 50-case dataset describes installation/user-level operational evidence, whereas the 1000-case service log database describes intervention-level service evidence. Therefore, percentages derived from the 50-case dataset and indicators expressed per 1000 service interventions should not be directly compared because they refer to different observational units and different event definitions (
Table 2).
Both evidence layers were used only to support the engineering interpretation of occurrence frequency (C2), maintenance cost (C4), downtime effect (C6), safety impact (C5), detectability difficulty (C3), and serviceability. They were not used as direct numerical inputs to the PSO or VIKOR calculations. The direct numerical input to the PSO-FMEA-VIKOR procedure was the semi-quantitative decision matrix developed on a 10-point ordinal scale using literature evidence, FMEA logic, engineering scoring anchors, and field/service observations.
2.4. Comparison of Multi-Criteria Decision Analysis Methods and Selection of VIKOR
The choice of a ranking method is not trivial in maintenance priority studies because different multi-criteria decision analysis (MCDA) families embody different compensation logics, threshold assumptions, and levels of decision transparency. In energy and infrastructure applications, the Analytic Hierarchy Process (AHP), the Technique for Order Preference by Similarity to Ideal Solution (TOPSIS), and VIseKriterijumska Optimizacija I Kompromisno Resenje (VIKOR) are widely used decision support methods [
16,
19,
20]. Outranking and ratio-based methods such as PROMETHEE II, ELECTRE, MOORA, and ARAS provide alternative decision logics [
21,
22]. WASPAS, EDAS, MARCOS, and fuzzy extensions further broaden the MCDA toolbox [
23,
24,
25]. Recent energy planning studies also confirm that the suitability of a specific MCDA method depends on the problem structure, the need for pairwise comparisons, the importance of compromise ranking, the treatment of uncertainty, and the desired balance between methodological simplicity and analytical discrimination [
26,
27,
28].
Recent PV-oriented applications show that AHP and TOPSIS have been used for PV end-of-life management and off-grid PV microgrid siting [
29,
30]. Other PV-related applications include solar energy implementation assessment and PV panel cleaning method selection [
31,
32]. VIKOR and PROMETHEE have been applied to solar panel selection, photovoltaic solar plant location analysis, and solar panel cooling system evaluation [
33,
34,
35]. ELECTRE and MOORA have been reported in PV technology and solar power plant location selection problems [
36,
37,
38]. ARAS and WASPAS have also been used in renewable energy and photovoltaic location selection contexts [
39,
40]. EDAS and related MCDA methods have been used in smart solar panel evaluation and renewable energy community configuration studies [
41,
42].
In the present study, VIKOR was selected as the final ranking engine because the decision problem is characterized by conflicting maintenance criteria and by the need to balance overall utility with the most unfavorable criterion. This property is important for PV maintenance because some failures are frequent but comparatively manageable, whereas others are less frequent yet highly disruptive due to safety consequences, poor detectability, or long downtime. AHP was considered more useful as a conceptual weighting benchmark, TOPSIS as a proximity-to-ideal method, and PROMETHEE II/ELECTRE as valuable outranking families; however, the compromise logic of VIKOR was judged to be the most consistent with the maintenance priority objective adopted in this article. The comparative positioning of the main MCDA families is summarized in
Table 3.
2.5. FMEA-Based Preliminary Assessment
A baseline FMEA assessment was performed using severity (
S), occurrence (
O), and detection (
D) ratings. The Risk Priority Number for the
i-th failure mode was calculated as:
The use of FMEA in the present study is methodologically justified for four reasons. First, FMEA provides a transparent and reproducible baseline for structuring heterogeneous PV failure knowledge when long-term fault logs are incomplete or not fully standardized [
11,
12]. Second, the S–O–D triad remains highly interpretable for maintenance engineers and allows rapid pre-screening of alternatives before more advanced optimization is introduced [
13,
14]. Third, PV-oriented FMEA studies confirm that this approach is effective for identifying technically critical events such as module degradation and inverter-related failures [
13,
14]. Related reliability and prognostic studies further support the need to include overheating and service-critical faults [
49,
50]. Maintenance planning and criticality studies also justify combining FMEA with broader prioritization criteria [
51,
52]. Fourth, retaining FMEA as the first analytical layer makes it possible to show explicitly how the final PSO–VIKOR ranking diverges from the classical RPN logic.
The FMEA stage served as a reference layer rather than the final ranking method. Its purpose was to determine whether the same priorities would persist once broader operational criteria were introduced. The use of FMEA in PV contexts is well established [
11,
12], and the limitations of classical RPN formulations have also been widely discussed [
13,
14].
2.6. Decision Matrix
The multi-criteria evaluation structure was represented by the decision matrix
X = [
xij], where
m = 8 failure modes and
n = 7 criteria. Each element
xij denotes the rating of the
i-th failure mode under the
j-th criterion. The raw decision matrix is presented in
Table 4.
2.7. PSO-Based Weight Optimization
Because the final ranking depends on the adopted weighting structure, the criteria weights were optimized using PSO [
17,
18,
53]. The use of PSO for engineering model calibration and reliability-oriented updating is also supported by recent applications [
54]. In this algorithm, each particle represents a candidate weight vector
w = (
w1,
w2, …,
wn), subject to normalization and non-negativity constraints.
where
xkij and
vkij denote the position and velocity of particle
i in dimension
j at iteration
k,
pbestkij denotes the personal-best position,
gbestkj denotes the global-best position,
ω is the inertia coefficient,
c1 and
c2 are the cognitive and social coefficients, and
r1 and
r2 are random numbers uniformly distributed in [0, 1] [
17,
18,
53].
The PSO procedure was run using a swarm size of 50, a maximum of 200 iterations, inertia weight
ω = 0.70, and cognitive and social coefficients
c1 =
c2 = 1.50. Thirty independent runs were performed. These values were selected according to commonly used PSO practice and the parameter ranges recommended in the foundational PSO literature, where moderate inertia and balanced cognitive/social coefficients are used to maintain both exploration and convergence stability [
17,
18,
53]. The chosen swarm size and iteration limit were also sufficient for the seven-dimensional weight search problem, because repeated runs produced the same leading priority cluster, and no further ranking changes were observed after convergence.
The optimization target was formulated to maximize the average pairwise separation of the final VIKOR compromise values, thereby discouraging near-tied rankings that would be of limited operational use. This objective was selected because the purpose of the model was to support maintenance prioritization, where ambiguous near-ties are difficult to translate into inspection or service schedules. It was not used to enforce a predefined priority order; the ranking was subsequently checked against equal weight and literature/expert-weight scenarios. The optimized weights should therefore be interpreted as discrimination-oriented decision calibration parameters for the adopted matrix, not as universal empirical failure-rate coefficients. The optimization was performed subject to the following feasibility constraints:
where
wj denotes the weight assigned to criterion
j.
The constraint ensures that PSO searches within the feasible space of criterion-weight vectors rather than assigning arbitrary weights, and improves discrimination among maintenance priorities while preserving decision matrix consistency.
To avoid over-interpreting the optimized weights, the PSO result was evaluated together with the classical FMEA baseline, the VIKOR parameter sensitivity analysis, and the semi-empirical maintenance evidence. This combined interpretation reduces the risk that the final ranking is treated as a product of the optimization function alone.
The methodological appeal of PSO in this context is also consistent with broader engineering and energy system applications, where the algorithm has been successfully used for nonlinear calibration, control tuning, and predictive model optimization in complex search spaces [
48,
54,
55].
2.8. VIKOR Compromise Ranking
The final maintenance priority ranking was obtained using a criticality-oriented VIKOR procedure [
16,
19]. Because all criteria were scored so that higher values indicated higher maintenance burden, the reference direction was defined toward the most critical maintenance profile. In the present criticality-oriented interpretation,
Si and
Ri represent the aggregate and maximum normalized distances from the critical maintenance profile, respectively;
Qi integrates these two distances into a compromise priority index. For each criterion,
fj* denotes the most critical value and
fj− denotes the least critical value. The utility measure
Si, the regret measure
Ri, and the compromise index
Qi were calculated as follows:
where
wj is the normalized weight of criterion
j,
v is the compromise strategy parameter,
S* =
mini Si,
S− =
maxi Si,
R* =
mini Ri, and
R− =
maxi Ri. The parameter
v reflects the balance between group utility and individual regret; in this study,
v = 0.50 was adopted. Alternatives were ranked in ascending order of
Qi. Lower
Qi values, therefore, indicate stronger proximity to the critical maintenance priority profile, not proximity to the least problematic technical condition. The choice of VIKOR as the final ranking tool is consistent with its intended use in multi-criteria compromise decisions [
16,
19].
2.9. Sensitivity Analysis Procedure
To test ranking robustness, the VIKOR compromise parameter v was varied over three levels: 0.25, 0.50, and 0.75. This allowed evaluation of whether the most important priorities remained stable under moderate changes in decision strategy.
From the perspective of methodological reproducibility, the sensitivity analysis was intended as a minimal robustness check rather than a full uncertainty propagation exercise. The present article, therefore, tests the stability of the priority order against preference-aggregation changes, while more advanced extensions—such as Monte Carlo perturbation of scores or probabilistic failure rate integration—are identified as future work.
3. Results
3.1. Baseline FMEA Assessment
The classical FMEA screening indicated that aging-related power degradation (A6) achieved the highest RPN value, followed by partial shading and hotspot formation (A1), junction box overheating/failure (A2), and cell microcracking/interconnection failure (A4), as shown in
Table 5. The lowest RPN value was assigned to hail-induced glass damage (A5). The baseline ordering suggests that frequently occurring degradation-driven faults dominate the RPN structure, while failures with stronger downtime or safety implications may be underrepresented.
3.2. Optimized Criteria Weights
The PSO procedure converged consistently across repeated runs and produced a stable weighting structure (
Table 6). The greatest importance was assigned to the severity of energy loss, occurrence frequency, and safety impact, indicating that the final prioritization was driven mainly by operational significance and hazard potential rather than by direct maintenance cost alone. Because the optimized weights might otherwise be perceived as purely separation-driven, the PSO result was also compared with equal weight and literature/expert weight benchmarks.
To reduce the risk of interpreting PSO as weight fitting to a desired result, the optimized solution was compared with two benchmark weighting scenarios. The comparison was used as a robustness check rather than as an additional calibration stage (
Table 7).
3.3. Final VIKOR Ranking
The final VIKOR ranking identified inverter overvoltage shutdown/grid incompatibility (A7) as the highest-priority maintenance item within the adopted decision structure, followed by cable insulation degradation (A3) and junction box overheating/failure (A2), as reported in
Table 8. This result indicates that maintenance priority is not determined by occurrence alone. Once downtime, safety, and detectability are explicitly introduced, system-level interruptions and difficult-to-detect electrical degradation gain importance.
The engineering interpretation of the three leading alternatives is also consistent with the adopted criterion structure. A7 combines immediate production interruption with repeated serviceability problems at the grid interface level. A3 receives a high priority because cable insulation degradation may remain difficult to detect, while increasing electrical and fire risk exposure. A2 is ranked highly because junction box overheating can combine localized thermal escalation, safety relevance, and corrective maintenance urgency. In the criticality-oriented formulation used here, lower Q values indicate higher maintenance priority.
3.4. Comparison of Baseline and Optimized Rankings
The most significant shift occurred for inverter overvoltage shutdown/grid incompatibility (A7), which moved from the sixth position in the classical FMEA to the first place in the final ranking (
Table 9). Similarly, cable insulation degradation (A3) moved from fifth to second position, confirming the importance of safety and detectability in maintenance prioritization. By contrast, the ranking of cell microcracking dropped substantially, indicating that long-term degradation relevance does not automatically translate into immediate maintenance urgency.
Positive rank-shift values indicate that a failure mode received higher priority in the PSO–VIKOR ranking than in the classical FMEA ranking. Negative values indicate a lower priority after multi-criteria weighting and compromise ranking.
3.5. Sensitivity Analysis Results
The ranking remained fully stable for the two highest-priority alternatives, A7 and A3, while only moderate shifts appeared in the middle section of the ranking (
Table 10). The stability of the highest-ranked alternatives supports the robustness of the proposed prioritization framework.
This result is important because the top of the ranking carries the greatest operational consequence for maintenance planning. The stability of A7 and A3 indicates that the main managerial conclusion is not driven only by one arbitrary value of the compromise parameter, although broader probabilistic uncertainty propagation remains a task for future work.
3.6. Semi-Empirical Maintenance Evidence
The semi-empirical evidence layer supported the decision structure from both the operational and service perspectives. In the 50-case installation/user-level dataset, at least one PV system failure was identified in 30% of cases, frequent inverter disconnections during grid-voltage rise were reported in 60% of cases, and 60% of the recorded technical failures were associated with the inverter category. Inverter disconnection during grid voltage rise was treated as an operational interruption or serviceability event rather than as a hardware failure. This distinction explains why its reported frequency may exceed the percentage of cases classified as technical PV system failures. In addition, 47% of reported repairs required one to two weeks, which confirms that service interruption is not a negligible maintenance dimension in practical PV operation.
The independent 1000-case service log database showed strong heterogeneity at the intervention level. Some events, such as logger disconnection after router or network changes, were relatively frequent but had low direct repair costs, whereas inverter hardware failure, mechanical module damage, and electrically escalated DC-side events generated substantially higher direct service burden. The aggregated evidence used for the maintenance interpretation is summarized in
Table 11.
3.7. Empirical Service-Profile Comparison
To visualize the practical asymmetry between frequency, direct repair cost, and downtime, five documented service event categories with numerically usable indicators were normalized and compared. The purpose of this step was not to replace the PSO–FMEA–VIKOR ranking with a new empirical model, but to test whether maintenance burden in actual service practice behaves as a one-dimensional variable. The answer is clearly negative. The normalized comparison is summarized in
Table 12.
The pattern confirms that the most frequent event is not necessarily the most burdensome from the maintenance viewpoint. Logger disconnection dominated frequency, but its direct cost and outage burden were modest. Inverter hardware failure was rare, yet it generated the longest service cycle, whereas mechanical module damage had a low incidence but the highest direct intervention cost. This decoupling strongly supports the use of a multi-criteria framework instead of any ordering based on frequency alone. The comparison shows that practical maintenance burden is structurally multi-dimensional and cannot be inferred from event frequency alone.
3.8. Engineering Interpretation of Field-Documented Failures
Field-documented service cases were used to strengthen the practical interpretation of the ranking (
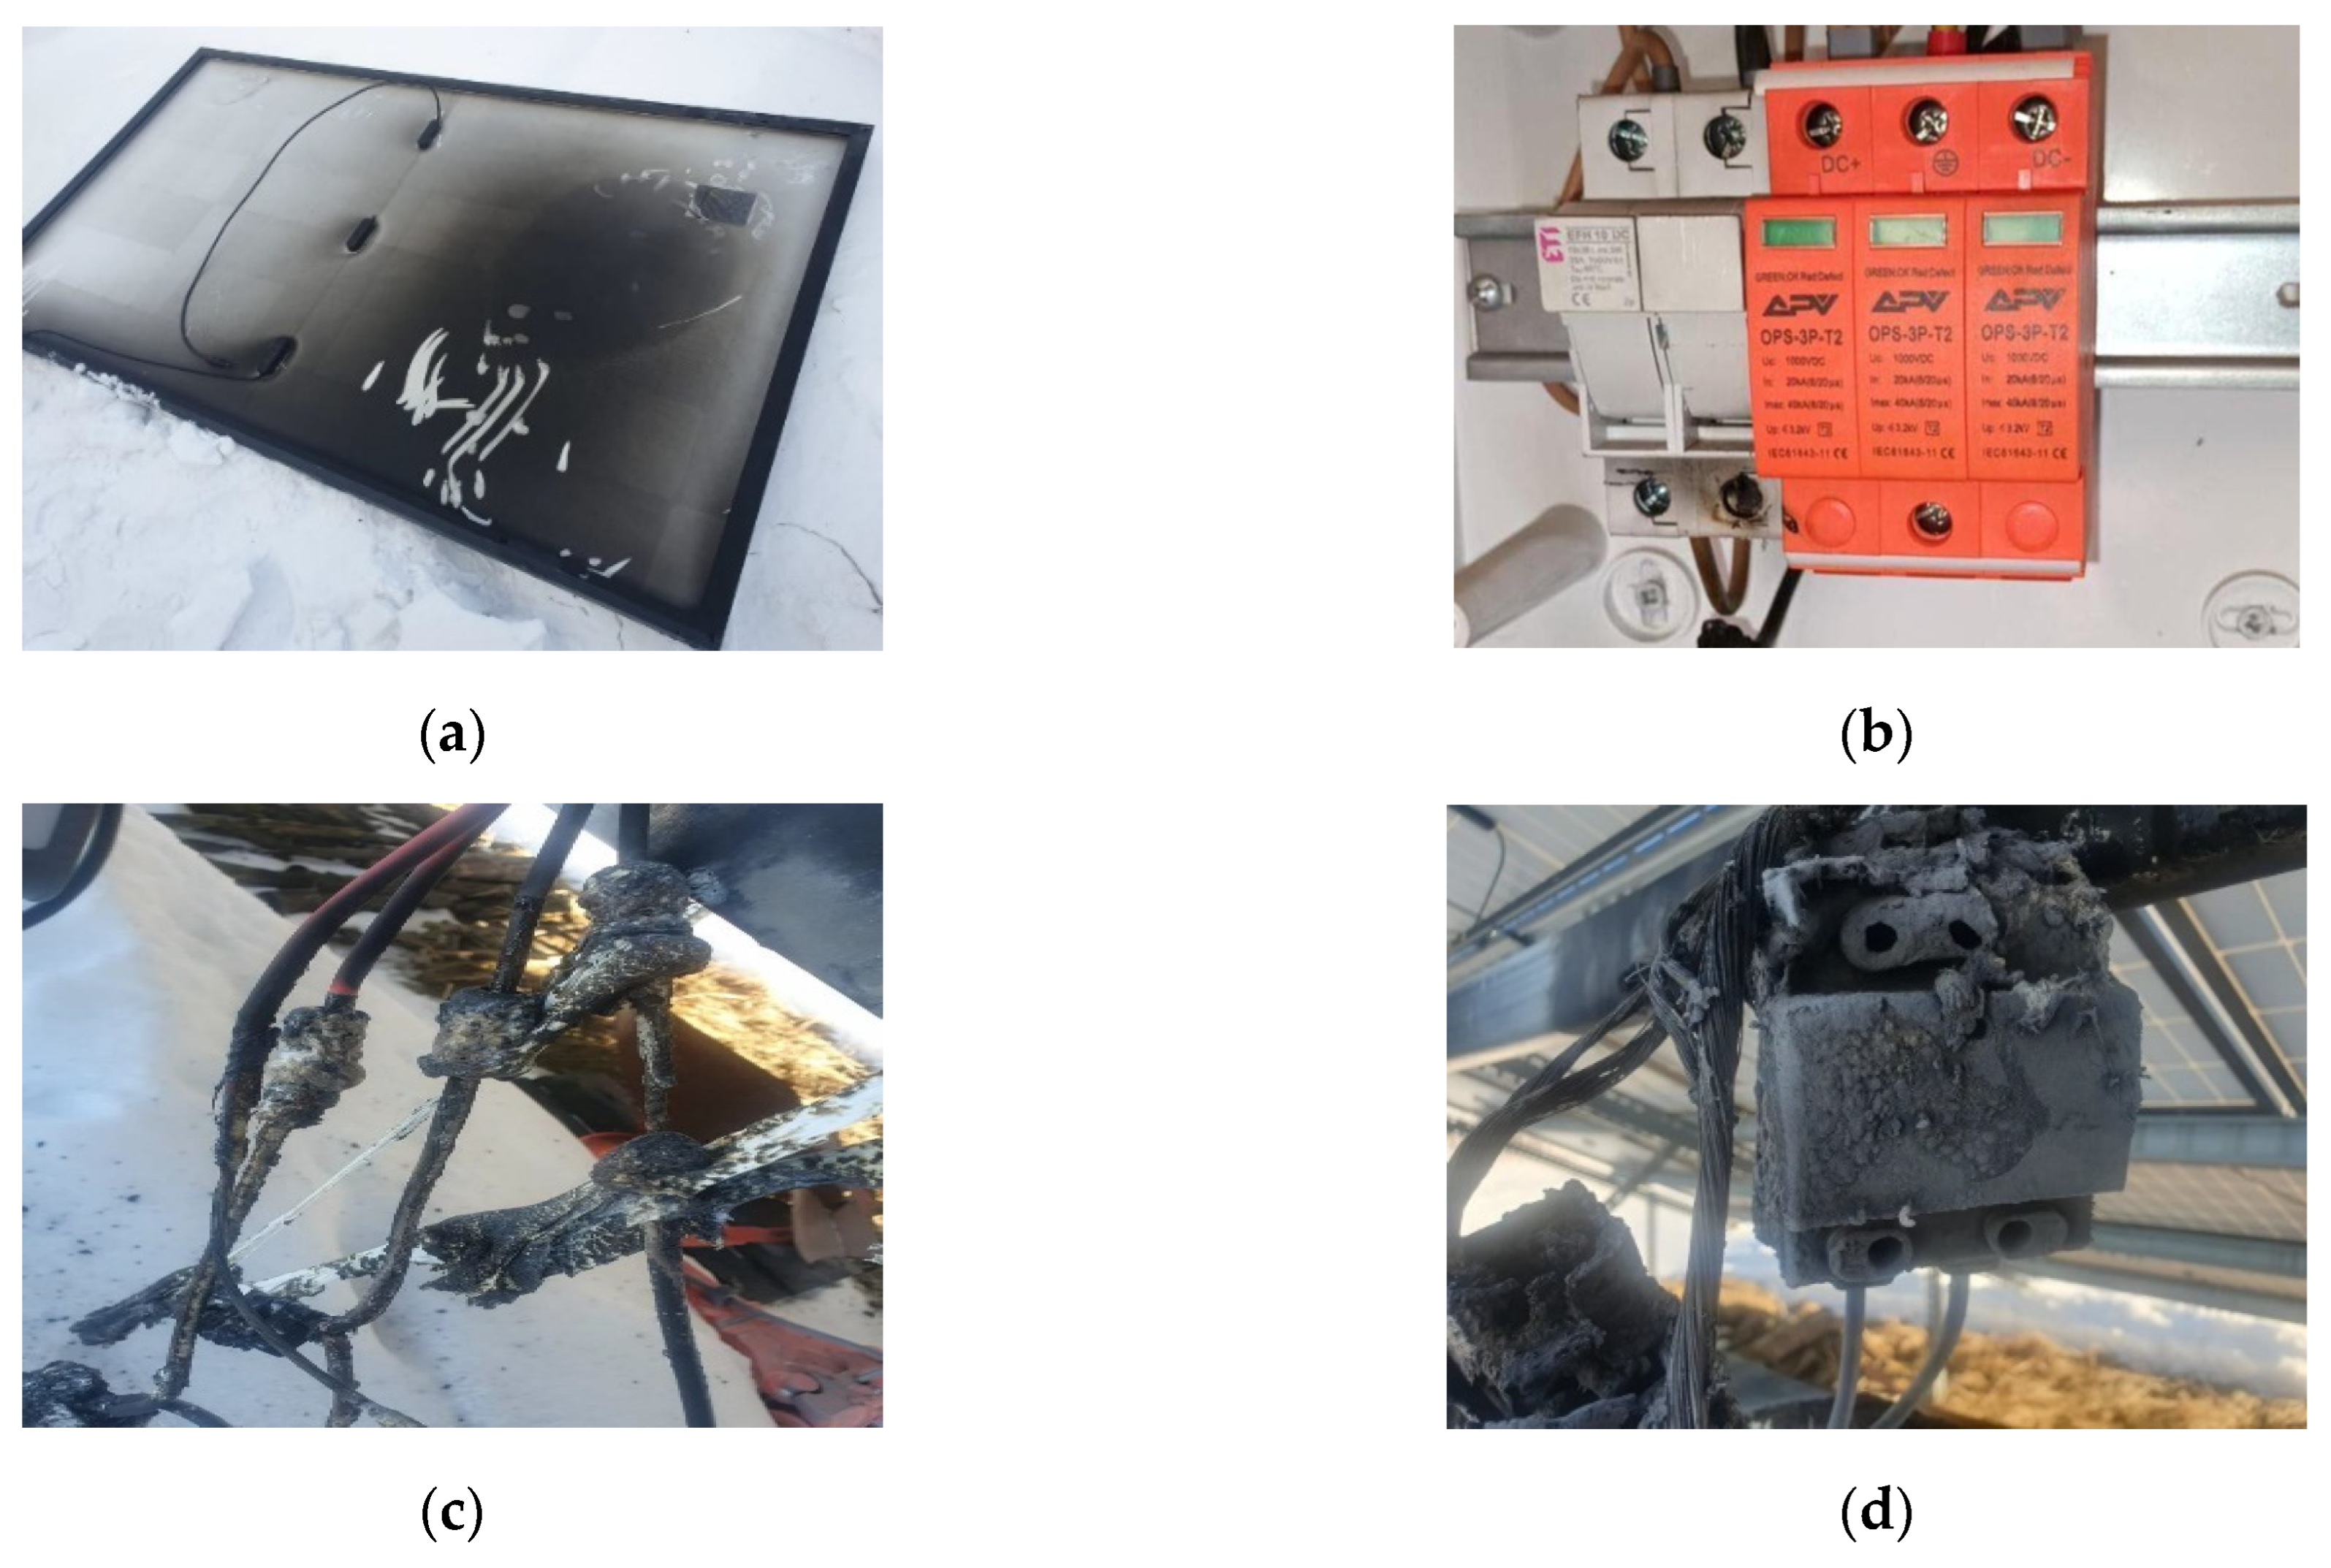
Table 13). Rather than treating images as illustrative additions only, they were used as engineering evidence of the kinds of faults that justify high scores for severity, safety impact, downtime effect, or detectability difficulty. In the present version of the manuscript, the selected images emphasize defects different from those already used in the authors’ earlier PV article, thereby broadening the practical fault portfolio considered here (
Figure 2).
The photographs were taken from the authors’ field archive and are used as technical documentation of PV failure manifestations. Their function is interpretative and diagnostic: they connect the numerical priority structure with observable failure consequences without replacing the decision matrix or the semi-empirical service-profile comparison.
The selected cases include a mechanically damaged PV module, a thermally damaged DC automatic switch terminal, an arc-fault-damaged PV installation, and an arc-fault-damaged electrical connector. Together, these cases show how maintenance-critical PV faults can combine visible component damage with service interruption and elevated fire or electrical risk. Their role in the article is interpretative: they help explain why electrical and thermally escalated faults receive high maintenance priority even when they are not the most frequent events.
4. Discussion
The results show that the priority structure of PV maintenance tasks changes substantially when the assessment moves from a classical RPN-based formulation to an optimized multi-criteria ranking framework. In the present study, inverter overvoltage shutdown/grid incompatibility, cable insulation degradation, and junction box overheating/failure emerged as the highest-priority items within the adopted failure set and criteria structure. This indicates that maintenance urgency in photovoltaic installations should not be interpreted as a direct function of occurrence frequency only, but rather as the outcome of combined production, safety, downtime, and detectability effects [
1,
2]. Module- and system-level PV failure studies further support this multi-dimensional interpretation [
3,
4]. Predictive-maintenance and FMEA-based studies similarly support interpreting PV maintenance as a multi-criteria decision problem [
10,
11]. The added service evidence makes this conclusion more credible from a maintenance management perspective, because it shows directly that event frequency, direct repair cost, and outage duration are only partially correlated in practice [
9].
The highest-ranked position of inverter overvoltage shutdown/grid incompatibility is technically justified. Inverter-related shutdown may immediately interrupt energy production across a large part of the installation. This interpretation is consistent with earlier PV-failure literature, where excessive grid voltage and resulting inverter disconnection were identified as important operational drawbacks affecting profitability and system operation [
1,
2]. More recent PV reliability reviews also emphasize inverter and grid interaction disturbances as important operational issues [
3,
4].
Cable insulation degradation also gained prominence after the transition from FMEA to the optimized ranking. This shift is important because cable faults may develop progressively, remain difficult to detect, and simultaneously contribute to overheating, leakage, and elevated fire risk. The broader PV failure literature identifies cable- and connection-related defects among the causes of performance loss and hazard escalation [
5,
6]. Fault-detection and reliability studies also emphasize the maintenance relevance of electrical connection defects and balance-of-system faults [
7,
8]. Operational evidence and hotspot-related PV studies further support the practical relevance of connection-related defects for maintenance prioritization [
9,
56,
57].
A major strength of the study is the use of field-documented evidence. The selected images and service case interpretations do not replace formal diagnostic datasets, but they strengthen the engineering realism of the model by illustrating how maintenance-critical failures manifest in practice. The chosen cases—mechanical module damage, DC automatic switch thermal damage, and arc-fault-related connector deterioration—support the argument that maintenance priority should emphasize not only frequency, but also escalation potential and service consequences. The relevance of rapid arc extinction in low-voltage networks is also supported by recent work on dynamic thyristor-controlled hybrid switching for fast arc suppression [
15].
The sensitivity analysis further supports the practical value of the framework. The two highest-priority alternatives remained stable across the entire tested range of the VIKOR parameter, which means that the final ranking is not excessively dependent on a single decision strategy. From a methodological perspective, the use of PSO for weight optimization is also justified, because PSO has repeatedly been shown to be efficient in uncertain engineering optimization and parameter-estimation tasks [
17,
18,
53]. Applications in model updating, geometry fitting, and ANN-based prediction further demonstrate its suitability for uncertain engineering problems [
54,
58,
59].
From a method selection standpoint, the expanded MCDA comparison presented in
Table 3 also clarifies why VIKOR was retained as the final ranking layer. AHP remains excellent for structuring criteria but is less convenient for direct ranking when the number of alternatives grows; TOPSIS is intuitive but does not explicitly emphasize the worst-performing criterion [
20,
21]. PROMETHEE II or ELECTRE may offer powerful outranking logic at the price of additional threshold choices [
22,
23]. For the present problem, where safety, detectability, and downtime may dominate even when overall occurrence is moderate, the compromise structure of VIKOR provides a defensible balance between interpretability and decision severity [
16]. Method comparison and energy planning studies confirm that the choice of MCDA technique should reflect both analytical discrimination and practical interpretability [
24,
45]. Further studies on fuzzy and energy-oriented MCDA applications reinforce this methodological positioning [
25,
46].
The broader decision-aiding literature extends beyond the subset summarized in
Table 3 and also includes point scoring methods, the MAJA procedure, filtration procedures, and interactive approaches. These families remain useful in engineering and project planning contexts, especially when the analyst expects staged screening or intensive participation of the decision maker, but they are less straightforward to operationalize for a compact full ranking of PV failure alternatives than VIKOR and mainstream outranking methods [
43,
44].
An additional cross-method check carried out on the same decision matrix and optimized weights showed that a classical TOPSIS ranking would favor more balanced alternatives and produce a different leading order than the VIKOR solution (
Table 14). This divergence is not a weakness of the present study; rather, it confirms that method choice is consequential. Distance-based logic tends to reward alternatives with evenly distributed scores, whereas the VIKOR compromise formulation more strongly penalizes failure modes with severe worst-criterion implications, especially where downtime and safety dominate maintenance urgency. For PV asset management, the latter logic is defensible because highly disruptive failures should not be obscured by otherwise moderate average performance.
The TOPSIS check used the same seven-criterion decision matrix and PSO-optimized weights as the VIKOR stage, but applied a distance-based closeness logic to the critical maintenance profile.
4.1. Practical Implementation Workflow for PV Operators
For practical deployment, the proposed framework can be implemented as a periodic maintenance prioritization module rather than as a real-time fault detector. A PV operator or maintenance company may apply the following workflow: (1) collect fault, alarm, inspection, service, warranty, and cost data from user reports, service books, inverter event logs, SCADA systems, or IoT sensors where available; (2) classify each event into an existing failure mode or create a new alternative if the event is recurrent and technically distinct; (3) assign or update scores for C1–C7 using the scoring anchors; (4) update or verify the criterion weights using PSO or a benchmark weighting scenario; (5) run the criticality-oriented VIKOR ranking; (6) translate the leading alternatives into inspection, preventive maintenance or corrective action schedules; and (7) periodically update the decision matrix when new service evidence becomes available. In this way, the framework can support both small PV service portfolios and utility-scale PV maintenance environments, provided that the input data are consistently classified and documented.
4.2. Adaptability to Unknown, Combined, or Evolving Faults
The current version of the framework uses predefined representative PV failure modes. This is appropriate for a transparent maintenance priority demonstration, but it does not automatically discover unknown faults. In practical applications, unseen or combined faults can be handled by adding new alternatives to the decision matrix once sufficient diagnostic or service evidence becomes available. A monitoring or pre-processing layer based on inverter logs, SCADA alarms, thermographic inspections, clustering, or anomaly detection could be placed before the MCDA stage. Such a layer would identify recurrent abnormal patterns, while the PSO–FMEA–VIKOR module would subsequently prioritize them from the maintenance perspective.
4.3. Limitations and Future Validation
Several limitations should be acknowledged. First, the 50-case operational dataset should be interpreted only as contextual installation/user-level evidence and not as a statistically representative fleet-level database. Second, although the 1000-case service log database provides stronger service-practice grounding, it is still an anonymized maintenance archive rather than a fully open fleet-level reliability dataset; detailed provider identifiers and record-level dates are not disclosed due to commercial confidentiality. Third, the present study does not include real-time validation using SCADA, inverter logs, IoT sensors, PMU, or micro-PMU measurements. Future validation should therefore use time-stamped inverter event logs, SCADA alarms, thermographic inspections, current and voltage monitoring, IoT-based temperature sensors, PMU or micro-PMU measurements, and long-term service records. Fourth, the decision matrix remains semi-quantitative and expert-informed, despite the use of scoring anchors and consistency checks. Future work should extend the framework toward probabilistic data fusion, Monte Carlo perturbation of scores, cross-method benchmarking, and long-term validation on larger operational datasets. Fifth, the regional character of the evidence should be considered when interpreting weather-sensitive failure modes, because local climatic and grid conditions in south-eastern Poland may differ from those of other PV markets.
5. Conclusions
This study proposed a hybrid Particle Swarm Optimization (PSO)–Failure Mode and Effects Analysis (FMEA)–VIKOR decision framework for maintenance prioritization in photovoltaic installations. By combining classical FMEA with a seven-criterion maintenance matrix, PSO-based weight calibration, and VIKOR compromise ranking, the method produced a more differentiated priority structure than the conventional Risk Priority Number (RPN) approach. The addition of semi-empirical operational and service log evidence further strengthened the practical grounding of the proposed framework by demonstrating that inverter-related interruptions, direct service costs, and downtime are not merely theoretical dimensions, but recurring managerial realities in operating PV systems. These evidence layers were used for engineering interpretation and plausibility checking, not as direct numerical inputs to the PSO or VIKOR calculations.
The final ranking identified inverter overvoltage shutdown/grid incompatibility, cable insulation degradation, and junction box overheating as the most maintenance-critical failures in the analyzed configuration. This ordering was technically more credible than the baseline FMEA ranking because it better captured downtime exposure, safety implications, and detectability-related service burden.
A key strength of the framework is that the criteria structure was not introduced arbitrarily but was adapted from established PV reliability and decision analysis literature and then operationalized through explicit scoring anchors and methodological clarification. The added field evidence did not serve as anecdotal decoration; it helped anchor the model in real service consequences.
From an engineering and asset-management perspective, the framework may support inspection planning, preventive maintenance scheduling, and corrective action targeting in grid-connected PV systems, while also supporting resilience-oriented maintenance management under resource-constrained operating conditions [
60]. Nevertheless, the present results should be interpreted as a maintenance-prioritization demonstration rather than as generalized fleet-level failure-rate estimates. Future work should extend the model toward larger operational datasets, SCADA- and inverter-log-based validation, dynamic updating of failure alternatives, probabilistic uncertainty analysis, and broader utility-scale deployment testing.