1. Introduction
The dual pressures of global energy transition and climate change mitigation have made the deep decarbonisation of the building sector a critical issue [
1,
2]. Buildings account for a significant share of global energy consumption and carbon emissions, with space heating and domestic hot water preparation representing the dominant end uses. In developed economies, heating-related energy use can account for more than three-quarters of total residential energy consumption [
3,
4,
5]. Although renewable energy technologies have made substantial progress over the past decades, the building heating sector remains heavily dependent on fossil fuels, contributing not only to carbon emissions but also exposing energy systems to price volatility and supply security risks [
6].
Solar energy, as the most abundant renewable resource, offers considerable potential for building heating applications [
7]. However, a fundamental seasonal mismatch exists between solar energy availability and heating demand: solar irradiance peaks in summer when heating loads are minimal, while heating demand peaks in winter when solar irradiance is at its lowest [
8]. This inherent contradiction severely limits the direct utilisation efficiency of solar heating systems. Without the integration of energy storage, the solar fraction of such systems is typically restricted to 20–40%, with the remaining demand still met by fossil fuels [
9].
Cross-seasonal thermal energy storage provides a fundamental solution to this challenge by enabling temporal energy shifting, i.e., storing surplus solar energy from the non-heating season for release during the heating season [
10,
11]. This capability transforms solar energy from a supplementary source into a potential primary supply for building heating, opening new pathways for deep decarbonisation of the sector. Cross-seasonal thermal energy storage can be broadly classified into three technological routes: sensible, latent, and thermochemical storage. Sensible heat storage, the most mature technology, stores heat through temperature changes in the storage medium. However, it suffers from relatively low energy density and significant thermal losses during extended storage periods, often requiring large storage volumes and high-performance insulation [
12,
13]. Latent heat storage using phase change materials offers higher energy density and near-isothermal charging/discharging characteristics, making it well-suited for short-term load following [
14,
15]. Nevertheless, the energy density of phase change materials remains insufficient to independently cover seasonal storage requirements, and challenges such as low thermal conductivity and complex encapsulation persist [
16,
17].
Thermochemical storage, based on reversible chemical reactions such as salt hydration/dehydration, achieves energy densities five to ten times higher than sensible storage with negligible standby losses, positioning it as one of the most promising technologies for cross-seasonal applications [
18,
19]. Representative material systems include zeolite/water, salt hydrates/water, and salt-porous matrix composites [
20]. Recent research has made significant progress in material development, reactor design, and system integration [
21,
22]. However, their practical application is still limited by the strongly coupled and dynamic nature of reaction kinetics, heat and mass transfer, and material structural evolution, which may lead to unstable charging/discharging behavior and cycling degradation [
23,
24]. In summary, each individual storage technology faces inherent performance limitations when applied to cross-seasonal scenarios: thermochemical storage excels at long-term energy shifting but often suffers from limited dynamic controllability and power responsiveness, while phase change materials offer good load-following capability but have insufficient energy density to fully cover seasonal imbalances. The inherent complementarity between thermochemical and phase change materials in terms of energy density and power density suggests that integrated composite storage systems can achieve performance beyond the reach of single technologies [
25]. Recent studies have begun exploring hybrid storage configurations, including sensible–latent combined systems [
26] and sorption–PCM-integrated systems [
27], providing preliminary validation of the feasibility of multi technology integration. In the broader context of thermal energy storage system integration and flexibility, Faizan and coauthors recently provided a critical review of TES integration with nuclear power, highlighting common challenges in demand supply matching those that are also relevant to seasonal solar storage [
28].
Nevertheless, several critical research gaps remain. First, at the system architecture level, most existing studies focus on material-level mixing or simple series-parallel connections. They lack a functional decoupling design that assigns distinct roles to each technology based on its intrinsic strengths rather than merely stacking them. Second, regarding control strategies, optimal coordination mechanisms that account for the distinct characteristics of different modules—for example, using thermochemical storage for seasonal shifting and phase change storage for weekly load buffering—have not been sufficiently developed or validated. Third, comprehensive techno-economic comparisons of different system configurations under realistic operating scenarios remain scarce, hindering the selection of appropriate system sizes and architectures for practical applications. Fourth, standardised engineering design methodologies that translate laboratory advances into practice, including modular unit sizing, dispatch logic, and multi-scenario evaluation, are still lacking. To address these gaps, this study constructs a hybrid storage system architecture in which thermochemical storage serves as the primary seasonal storage and phase change storage acts as the auxiliary power buffer. The primary novelty of this study lies in a novel modular system architecture based on functional decoupling, which goes beyond simple material mixing or series connections. The thermochemical storage module is responsible for long-term storage of surplus seasonal heat, leveraging its high energy density and low standby loss to enable summer storage for winter use. The phase change material module is responsible for rapid response to heating load variations, leveraging its high power density and cycling stability to perform intra-day peak shaving. Through functional decoupling and coordinated operation, the two modules are expected to achieve synergistic performance unattainable by either technology alone. This architectural innovation is intrinsically coupled with a weekly coordinated control strategy that, by orchestrating the synergistic operation of these decoupled modules, reduces the start-stop frequency of the thermochemical unit by approximately 85% compared to daily cycling, thereby achieving a synergistic performance unattainable by either technology in isolation.
The remainder of this paper is organised as follows.
Section 2 describes the system architecture and mathematical models.
Section 3 details the control strategy and multi-scenario configurations.
Section 4 presents the case study results, including energy performance, module sizing, and economic analysis.
Section 5 concludes with the main findings.
2. System Description and Modelling
A residential district in Beijing is selected as the case study to evaluate the proposed modular composite thermal storage system. The district has a total floor area of 50,000 m2, representing a typical medium-scale residential community in northern China. Following common practice for building heating design, the design heating load is set at 50 W/m2, yielding a total design load of 2500 kW. The system operation is divided into a heating season and a non-heating season, each corresponding to different charging and discharging strategies. The non-heating season runs from 15 March to 15 October, and the heating season runs from 15 October to 15 March of the following year.
2.1. Modular Composite Thermal Storage System Architecture
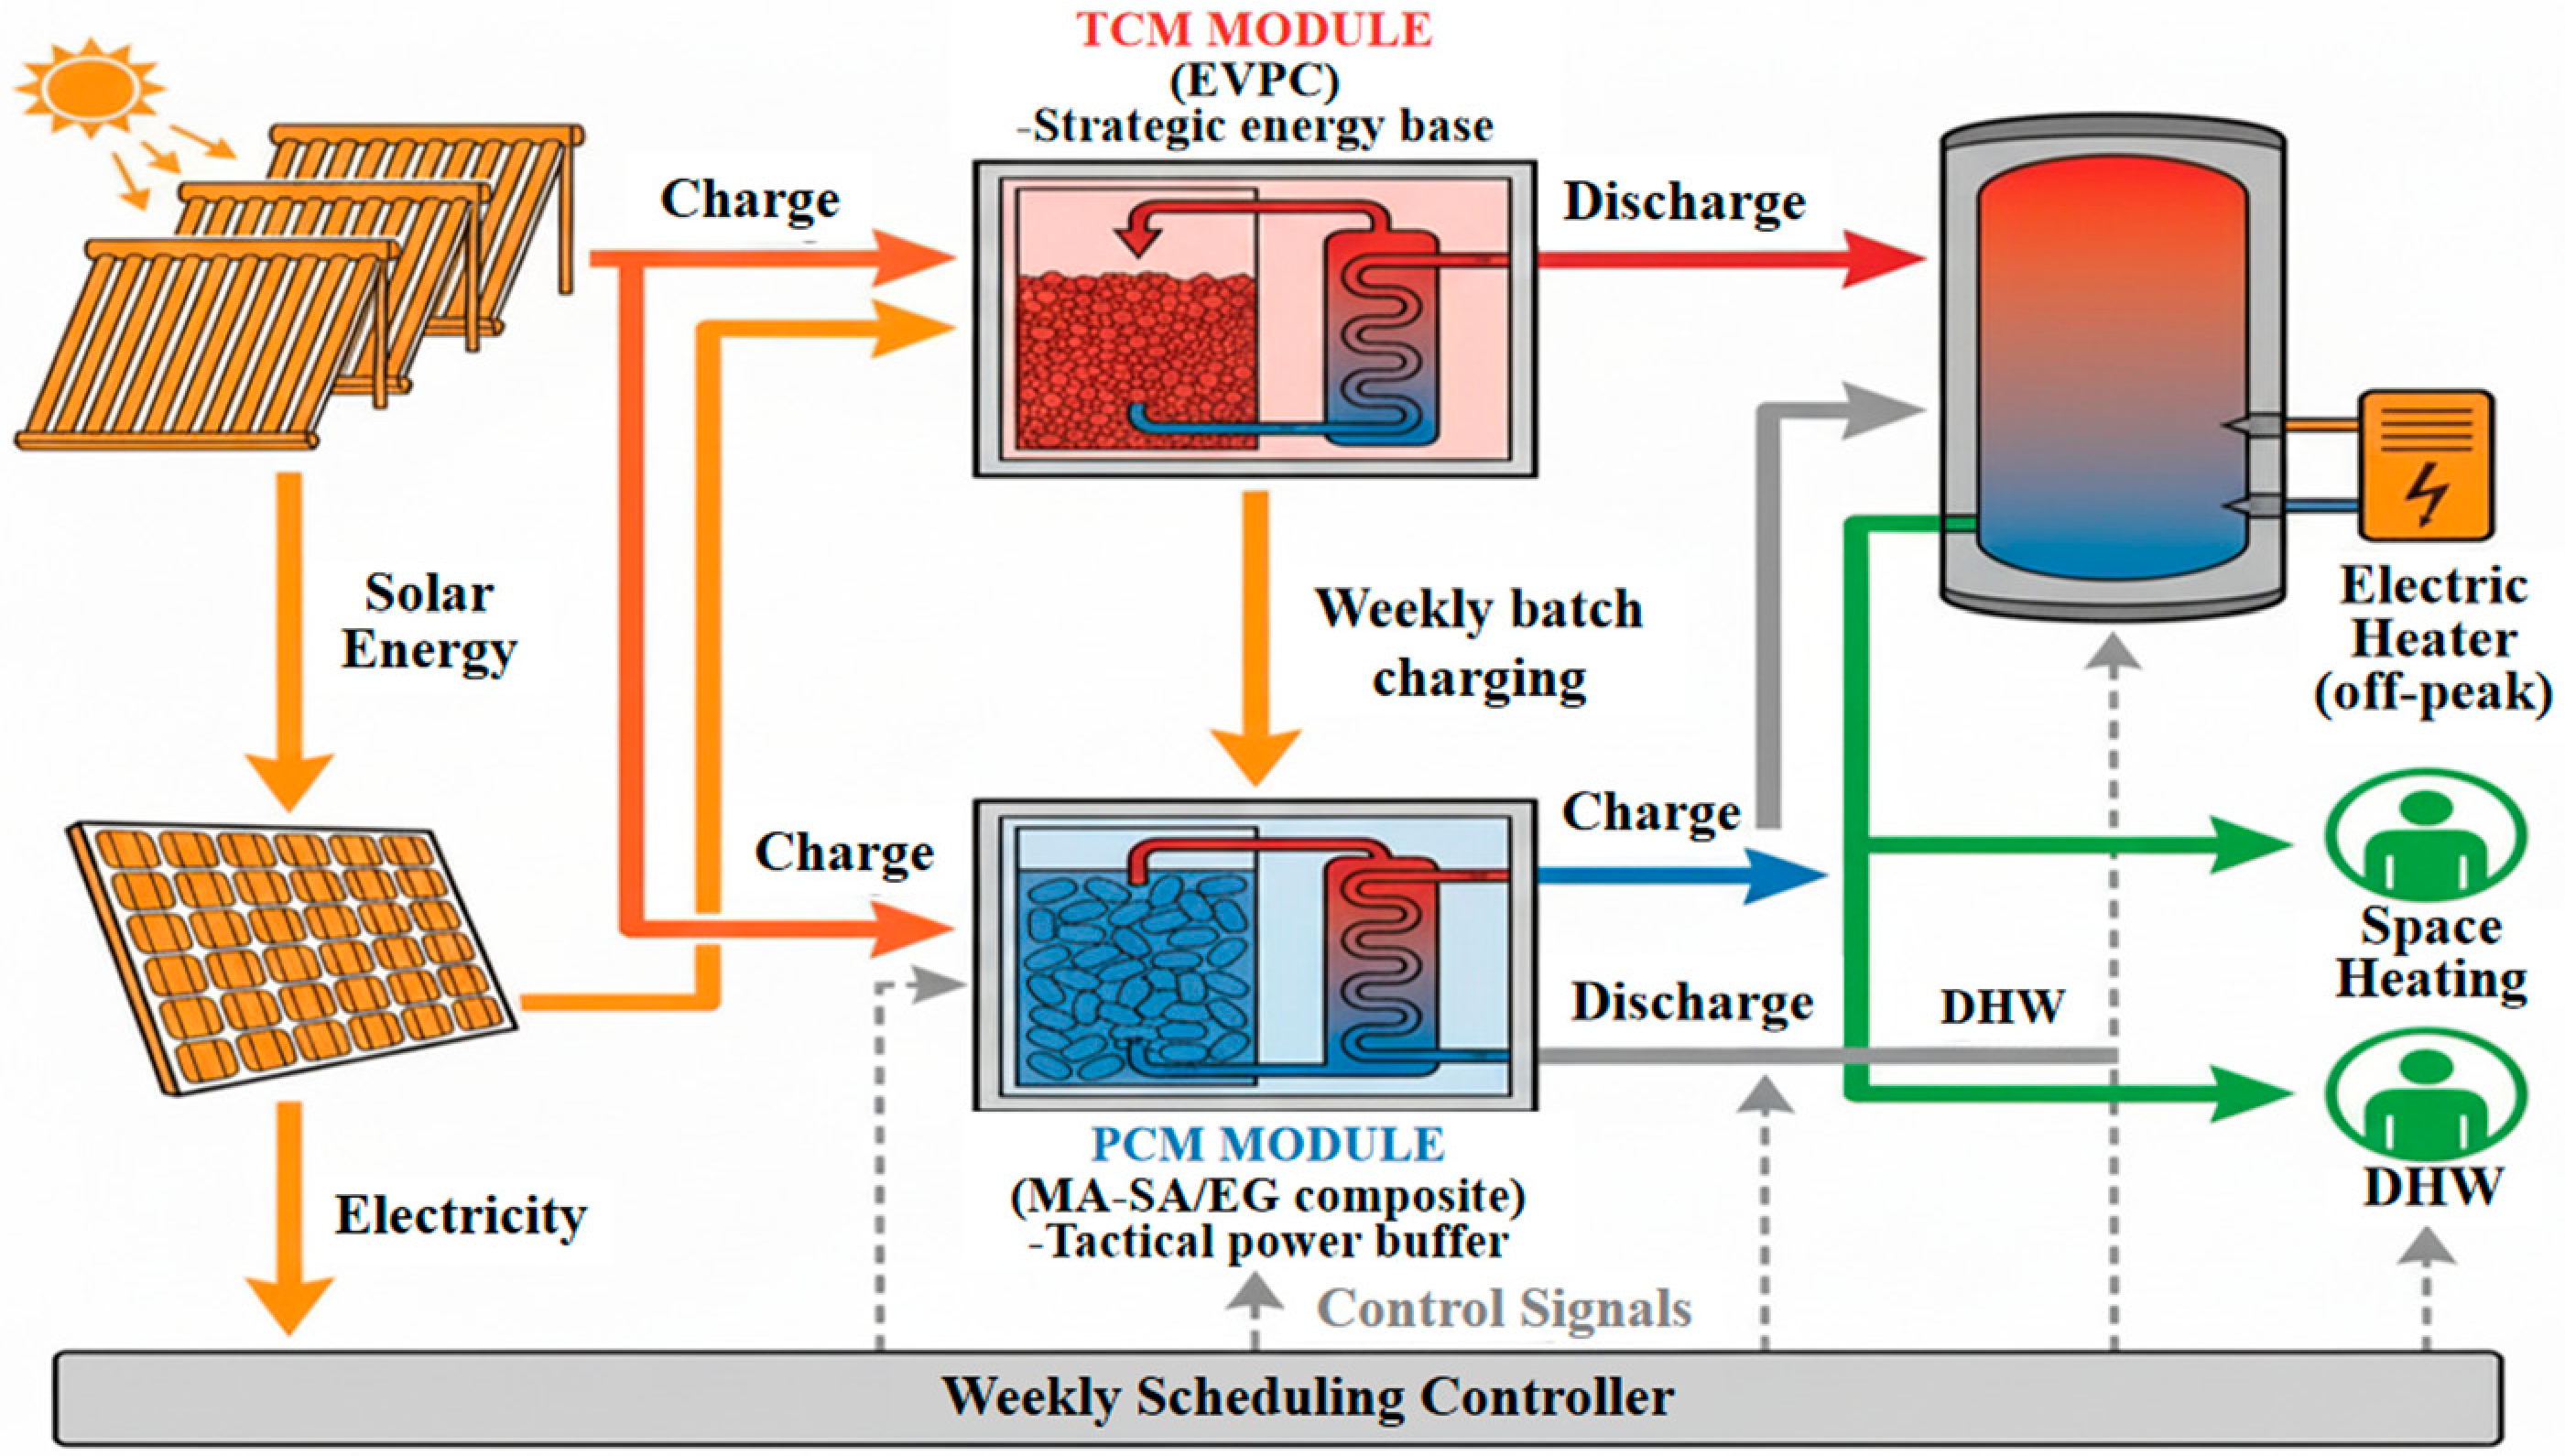
The modular composite cross-seasonal thermal storage system proposed in this study is illustrated in
Figure 1. It integrates thermochemical storage and phase change modulars storage into a unified system architecture, with each technology assigned a distinct operational role to achieve complementary advantages.
The modular composite cross-seasonal thermal storage system consists of five core components. A solar collector array serves as the primary heat source. During the non-heating season, it drives the dehydration reaction of the thermochemical storage module for charging while also meeting domestic hot water demand. During the heating season, it supplements heating or provides additional energy to the thermochemical module. The thermochemical storage module acts as the strategic energy base of the system, utilising a reversible hydration reaction to achieve long-term heat storage: solar energy is stored in chemical form during the non-heating season and released through hydration during the heating season. The phase change storage module functions as the tactical power buffer, using solid–liquid phase transition to achieve rapid charging and discharging, thereby addressing daily or weekly heating fluctuations and reducing the system’s dependence on the response speed of the heat source. A stratified hot water tank provides short-term thermal buffering, storing heat or directly supplying end-users; an auxiliary heat source supplies supplementary heat when stored energy is insufficient, and the electric heater can be operated during off-peak periods to reduce costs. Finally, the system serves residential end-users, such as floor radiant heating or radiators, with a hot water supply temperature of 35–50 °C.
2.2. Physical and Mathematical Models
2.2.1. Building Heating Load Model
The monthly heating load is calculated using the Degree-Day Method, which is widely adopted for preliminary building energy assessments due to its computational efficiency and acceptable accuracy. The monthly heating load is given by:
where
denotes the monthly heating load [W/m
2],
represents the design heating load,
is the difference between the indoor design temperature and the monthly average outdoor temperature,
is the difference between the indoor design temperature and the heating outdoor design temperature, and
indicates the number of heating days in the month.
Key parameters are determined according to common practice for building heating design. The design heating load is selected based on typical residential building standards. The indoor design temperature is set at 18–20 °C. The heating outdoor design temperature for Beijing is taken as −9 °C based on local meteorological data. Monthly average outdoor temperatures are obtained from long-term meteorological records.
2.2.2. Solar Resource Assessment Model
The solar thermal energy input depends on the irradiation received on the tilted collector surface and the collector efficiency. The monthly solar thermal input is calculated as:
where
denotes the monthly solar thermal energy input,
represents the solar collector area,
is the monthly solar irradiation on the tilted surface, and
is the efficiency of the collector. The collector efficiency is selected based on typical performance parameters of solar heating systems, accounting for system degradation and pipeline heat losses. Values of 32% in winter and 42% in summer are adopted.
The energy input for the PV system is calculated as:
where
denotes the monthly photovoltaic (PV) energy input,
is the installed PV capacity,
is the monthly solar irradiation on the horizontal plane, and
represents the system efficiency of the PV installation. Considering inverter efficiency, wiring losses, soiling, and temperature effects,
= 80% is adopted.
Solar resource data are obtained from a widely used satellite-based global solar database for the Beijing region, using monthly average irradiation values for the period 2001–2020. The conversion from horizontal to tilted irradiation is performed using a standard anisotropic model.
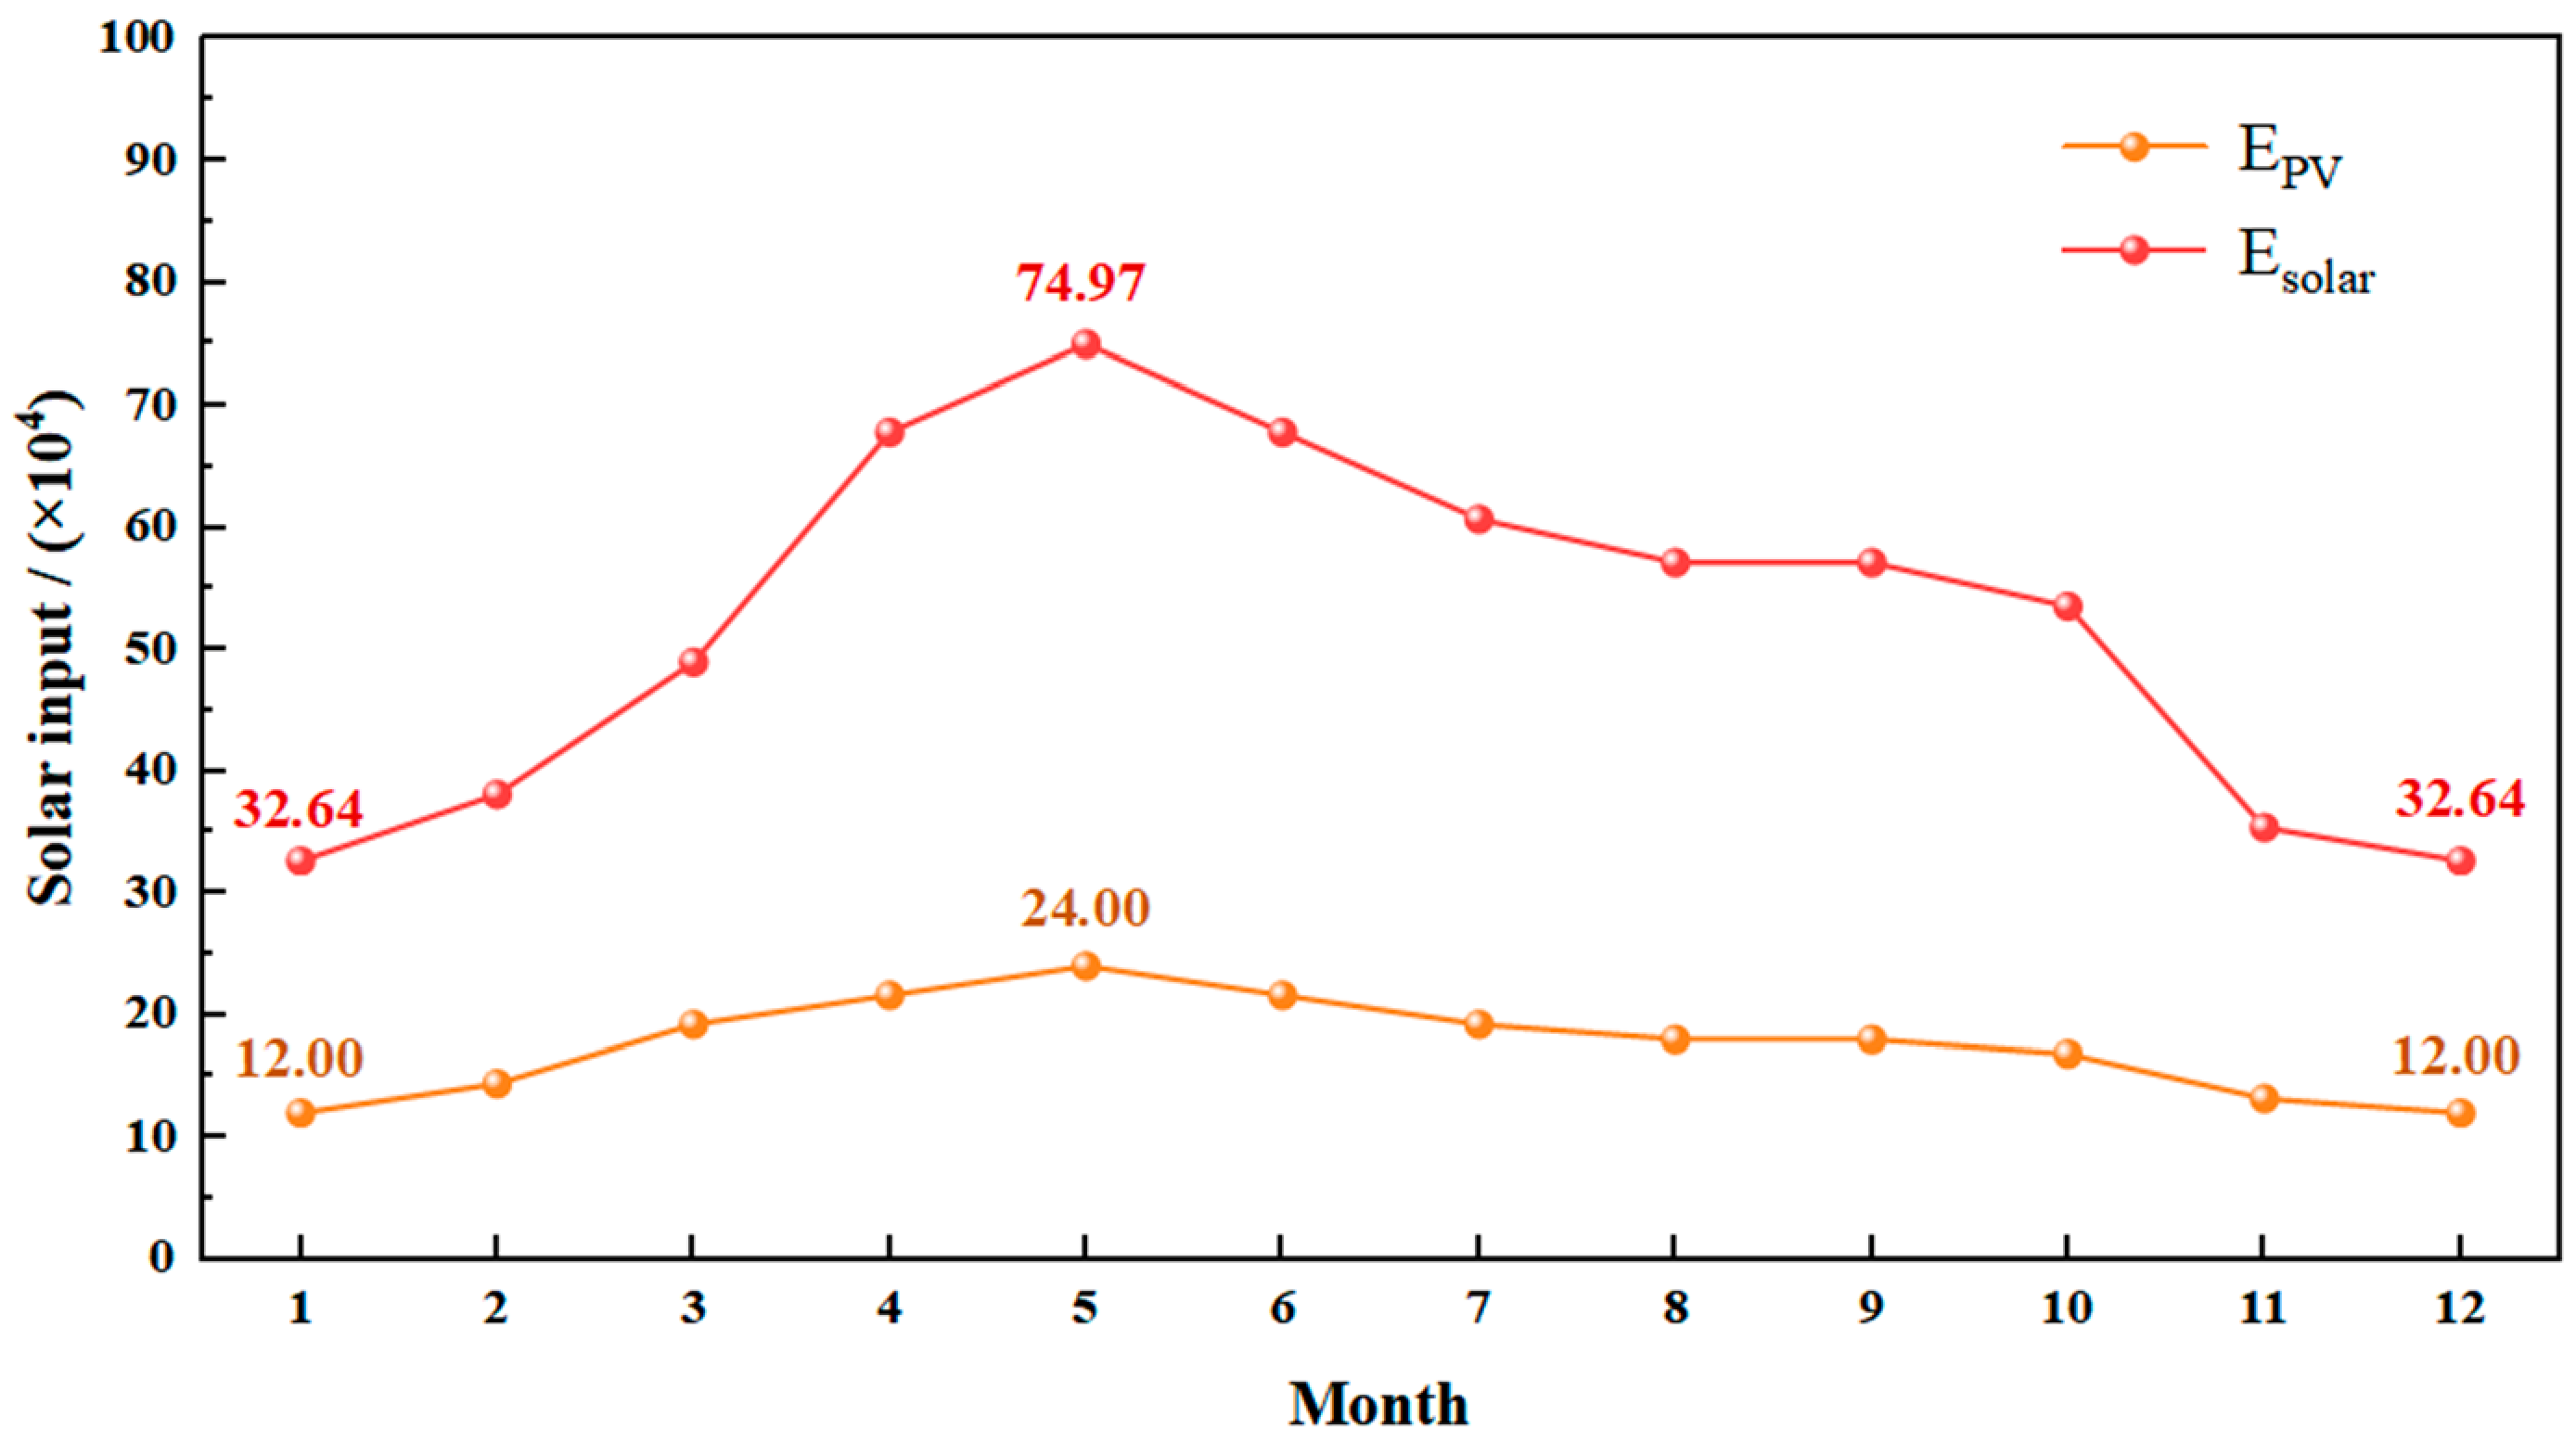
Based on the above equations, the monthly photovoltaic input and solar thermal input over the year are calculated and presented in
Figure 2. It can be observed that solar resources during the non-heating season are substantially higher than those during the heating season, reaching a peak in May and minimum values in January and December.
2.2.3. Phase Change Storage Module Model
In the current study, the myristic acid-stearic acid/expanded graphite composite (MA-SA/EG) is selected as the phase change material. Among phase change materials, organic fatty acids such as stearic acid and myristic acid offer several advantages over inorganic salt hydrates, including good chemical stability, low corrosivity, and favourable cycling performance [
29,
30]. By forming a eutectic mixture of stearic acid and myristic acid in a specific ratio, the phase change temperature can be precisely tuned to the 50–70 °C range, which aligns well with building heating requirements. Expanded graphite is employed as a porous carrier, and the molten fatty acids are infiltrated into its pore structure via vacuum impregnation to form a shape-stabilised composite. The incorporation of expanded graphite has been widely demonstrated to enhance thermal conductivity and shape stability while maintaining a high latent heat storage capacity in fatty-acid-based composite PCMs [
31]. Despite these enhancements, heat transfer limitations remain a key challenge for PCM modules. Advanced strategies such as electrohydrodynamic effects have been shown to further improve melting dynamics, and are considered promising for future system upgrades [
32]. However, for the present system-level study, the shape-stabilised composite provides a practical balance between thermal conductivity and ease of integration. Experimental results show that after 100 accelerated thermal cycles, the latent heat of the MA-SA/EG composite decreases by only 2.4%, while the phase change temperature fluctuation remains below 0.5 °C, demonstrating outstanding cycling stability and thermal responsiveness. The key thermophysical properties of the MA-SA/EG are shown in
Table 1.
The charging and discharging processes of the PCM module are modelled using the enthalpy method, where the latent heat is incorporated into an effective specific heat capacity. For a single PCM unit, the energy balance equation is:
where the effective specific heat capacity
within the phase change temperature interval is given by:
where
is the specific heat capacity (J/(kg·K),
is the latent heat of fusion (J/kg), and
is the liquid fraction. To maintain computational efficiency in system-level simulations, a lumped-parameter approach is adopted for the PCM module. The charging/discharging power is determined from the thermal balance:
where
is the thermal power (W),
is the total mass of PCM in the module (kg),
is the mass flow rate of the heat transfer fluid (kg/s),
is its specific heat capacity (J/(kg·K)), and
and
are the inlet and outlet temperatures of the heat transfer fluid (K).
2.2.4. Thermochemical Storage Module Model
The expanded vermiculite-potassium carbonate composite (EVPC) is adopted as the thermochemical material. Among thermochemical storage materials, potassium carbonate is advantageous due to its single-step hydration reaction, absence of harmful by-products, low corrosivity, and low cost, making it more suitable for engineering applications compared to chloride salts, sulfate salts, and strontium bromide (high cost) [
33,
34]. However, pure K
2CO
3 is prone to deliquescence and agglomeration, which hinder mass transfer. In this study, expanded vermiculite is used as a porous host, and the EVPC is prepared by solution impregnation. After high-temperature treatment, expanded vermiculite achieves a porosity of 79.68%, and its layered structure provides stable anchoring sites for K
2CO
3, effectively suppressing salt migration and agglomeration during hydration [
35]. The key parameters of the EVPC are shown in
Table 2.
The reversible hydration/dehydration reaction is:
The charging and discharging processes of the TCM module are governed by reaction kinetics. The reaction rate can be described using a shrinking core model or an equivalent kinetic equation. To maintain computational efficiency in system-level simulations, a performance map approach is adopted, where the charging/discharging power is expressed as a function of operating conditions (inlet temperature, vapour pressure) based on experimental data.
During the charging phase (dehydration), the thermal balance of the TCM module is:
During the discharging phase (hydration), the thermal balance is:
Here,
is the reaction conversion (degree of hydration),
and
are the dehydration and hydration reaction enthalpies (J/kg), and
and
are the masses of the active salt and the host matrix.
2.2.5. PCM and TCM Modular Design
The monthly energy supply–demand difference is derived from the difference between the combined photovoltaic and solar thermal inputs and the heat output. It is calculated as:
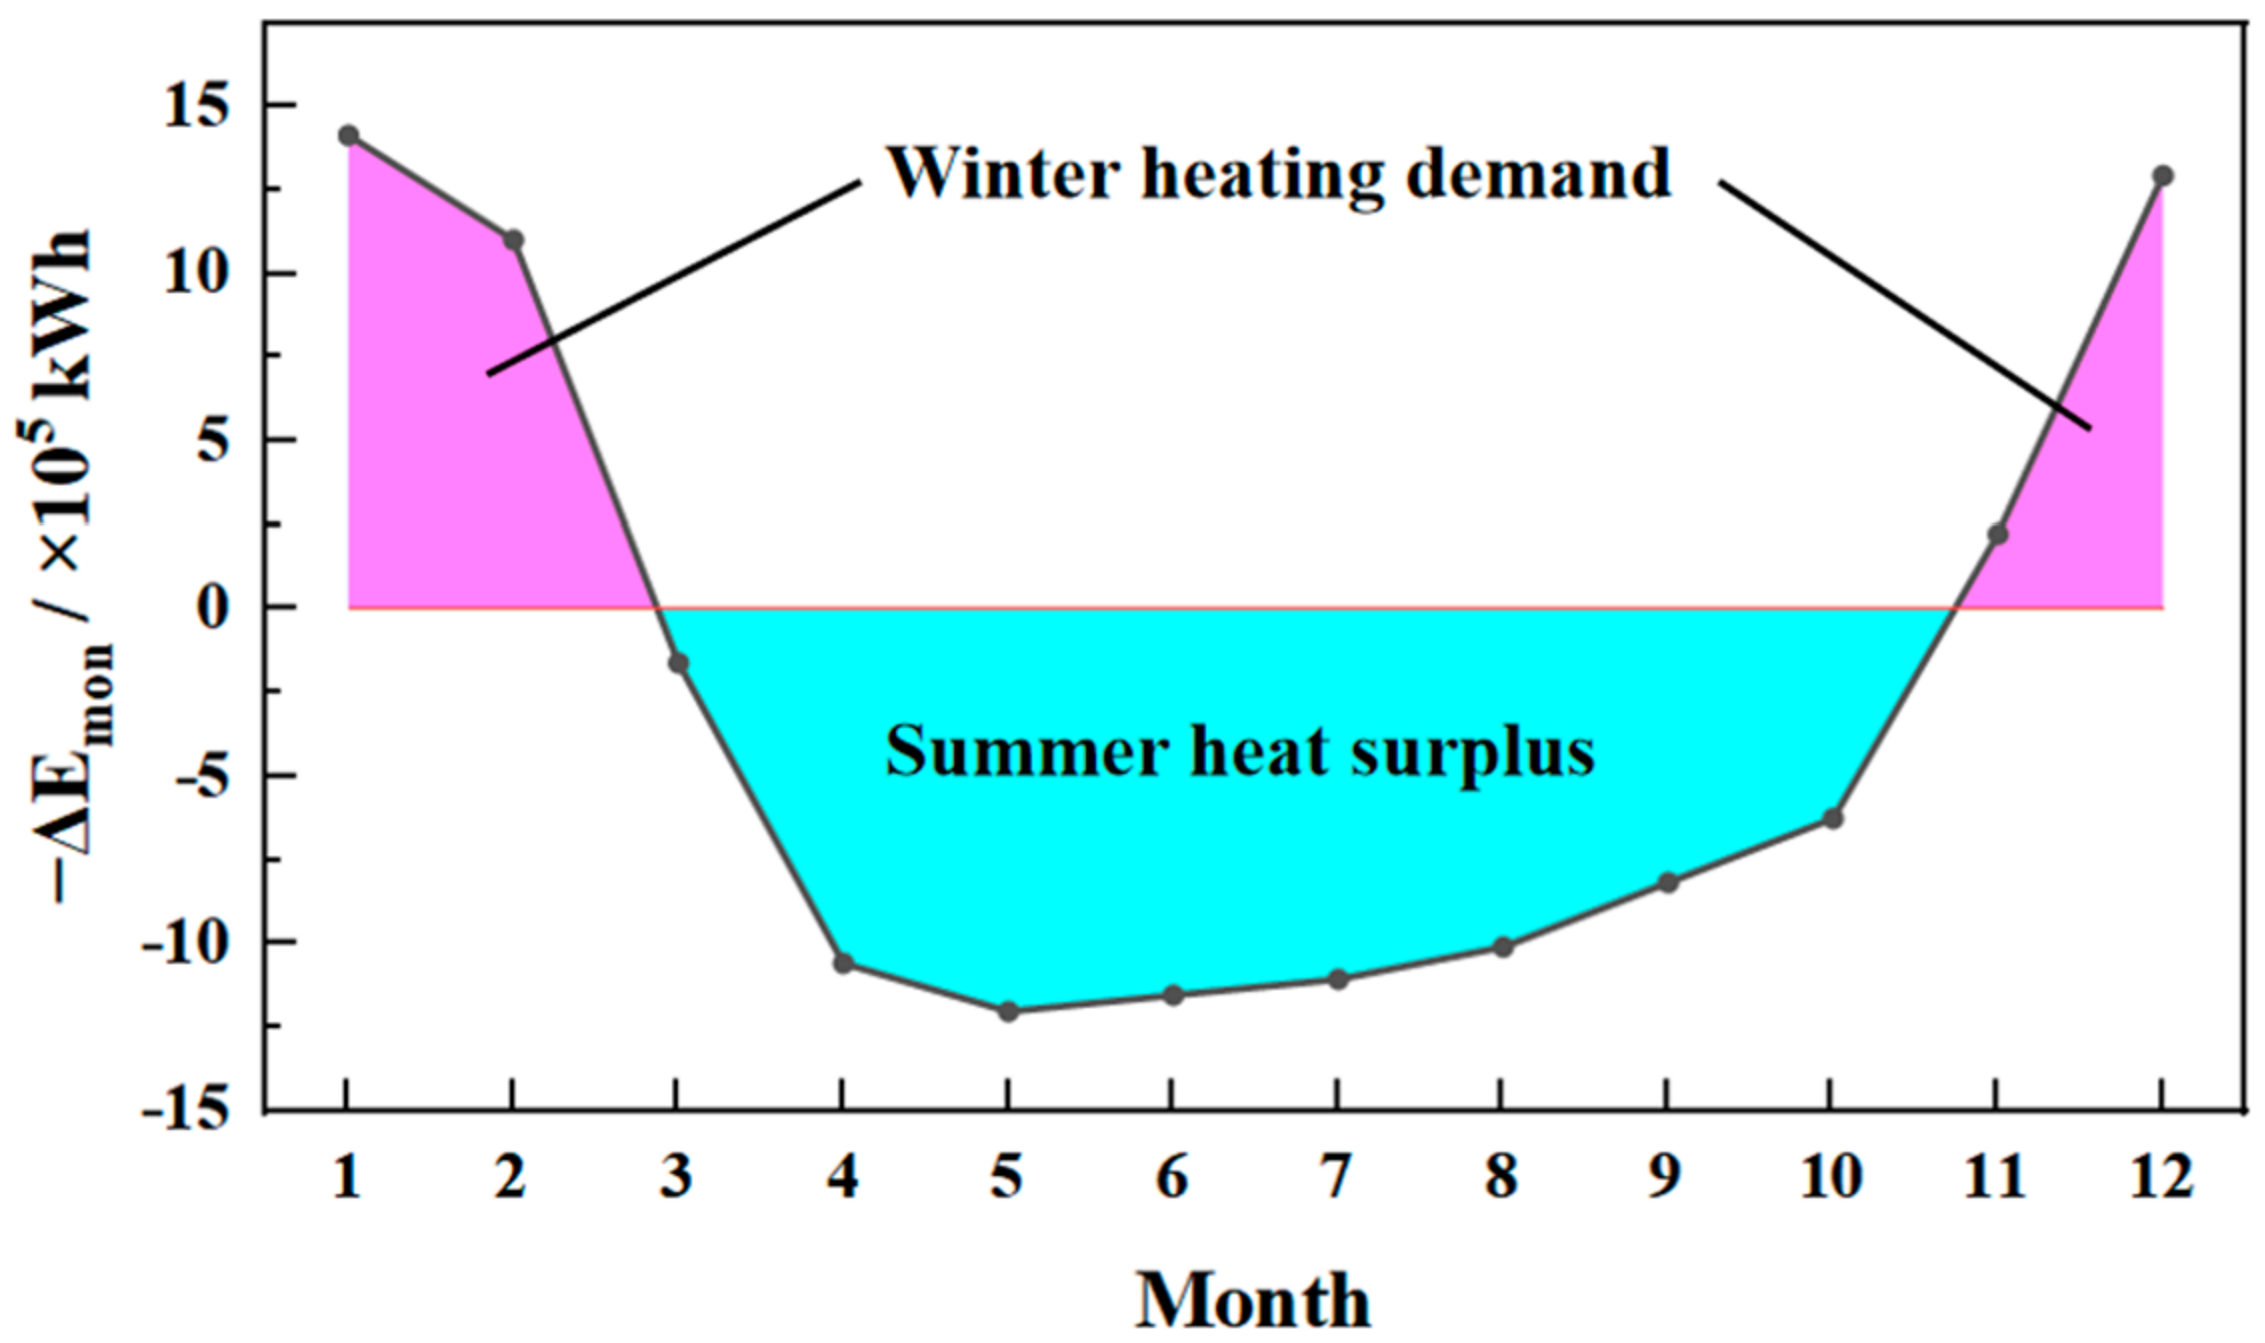
Through calculation, the total heating demand during the heating season is 5.888 × 10⁶ kWh per year, while the total solar thermal input during the heating season is 2.190 × 10⁶ kWh, leaving a seasonal deficit of 3.698 × 10⁶ kWh. During the non-heating season, the total heating demand is 0.420 × 10⁶ kWh, while the solar thermal input is 4.864 × 10⁶ kWh, resulting in a substantial surplus of 4.424 × 10⁶ kWh.
The supply and demand gap of Beijing are shown in
Figure 3. It shows high heat input in summer and high heat demand in winter. Negative values indicate an energy surplus available for storage, while positive values indicate a deficit that must be covered by the storage system or an auxiliary heat source.
The TCM capacity is sized to store the full non-heating season surplus (accounting for cycle efficiency) to achieve complete seasonal shifting without grid support. The PCM capacity is sized to cover the peak weekly heating demand, which is the maximum energy that needs to be buffered between two weekly TCM discharges. These sizing rules are engineering heuristics that ensure a feasible operation, and they do not necessarily yield the solution with the lowest cost. The required storage capacity is:
where
is the required TCM storage capacity (kWh),
is the cumulative energy surplus during the non-heating season (kWh), and
is the full-cycle efficiency of the TCM system, accounting for charging, storage, and discharging losses (taken as 85%). The required PCM storage capacity is:
where
is the required PCM storage capacity (kWh),
is the peak weekly heating demand during the heating season (kWh), and
is the charging–discharging efficiency of the PCM system (taken as 92%).
Based on the volumetric energy densities of the storage materials and considerations of transportation and installation, the volume of each standard module is set to 130 m
3. The rated capacity of a TCM unit is:
The rated capacity of a PCM unit is:
Here, and are the rated capacity (kWh), is the volume of the standard module (m3), and are the bulk density of the TCM and PCM composite (kg/m3), and and are the volumetric energy density of the TCM and PCM (kWh/m3).
In practice, the number of modules is rounded up according to the total capacity requirement, enabling flexible modular combinations.
It should be noted that the reported power buffer performance of the PCM module is considered apparent under the present modelling assumptions, and requires experimental validation.
4. Techno-Economic Analysis of the Case Study
4.1. Heat Storage Capacity for Different Scenarios
Based on the energy balance, the required storage capacities are calculated as follows. The TCM module is sized to store the entire non-heating season surplus, accounting for the full-cycle efficiency of 85%. This yields a required TCM capacity of:
For Scenario A, this capacity is used directly. The PCM module is sized to cover the peak weekly heating demand during the heating season. The highest demand occurs in January, with a monthly demand of 1.678 × 10
6 kWh, corresponding to a weekly demand of approximately 0.420 × 10
6 kWh. Accounting for a PCM charge–discharge efficiency of 92%, the required PCM capacity is:
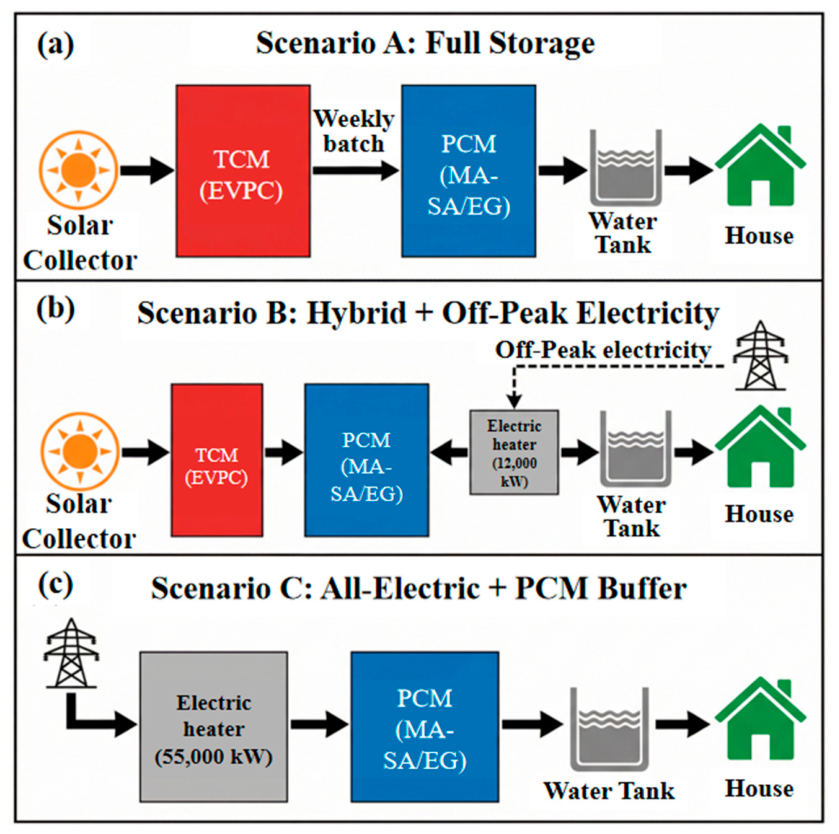
The three configurations share the same PCM capacity and boundary conditions, but differ in TCM capacity, grid dependency, and land requirement, as summarised in
Table 3.
4.2. Thermal Storage Surplus Analysis for Three Scenarios
4.2.1. Scenario A: Full Thermal Storage System
In Scenario A, the system operates according to the weekly operation control strategy described in
Section 3.2, with no grid supplementation.
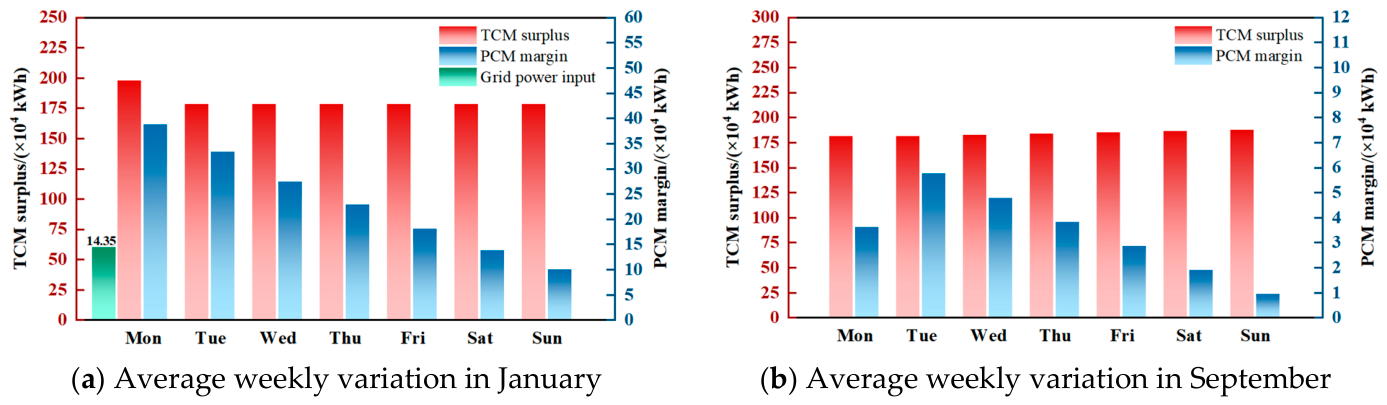
Figure 7 illustrates the weekly variation in the PCM state of charge during a week in January and a week in September. During the week in January (
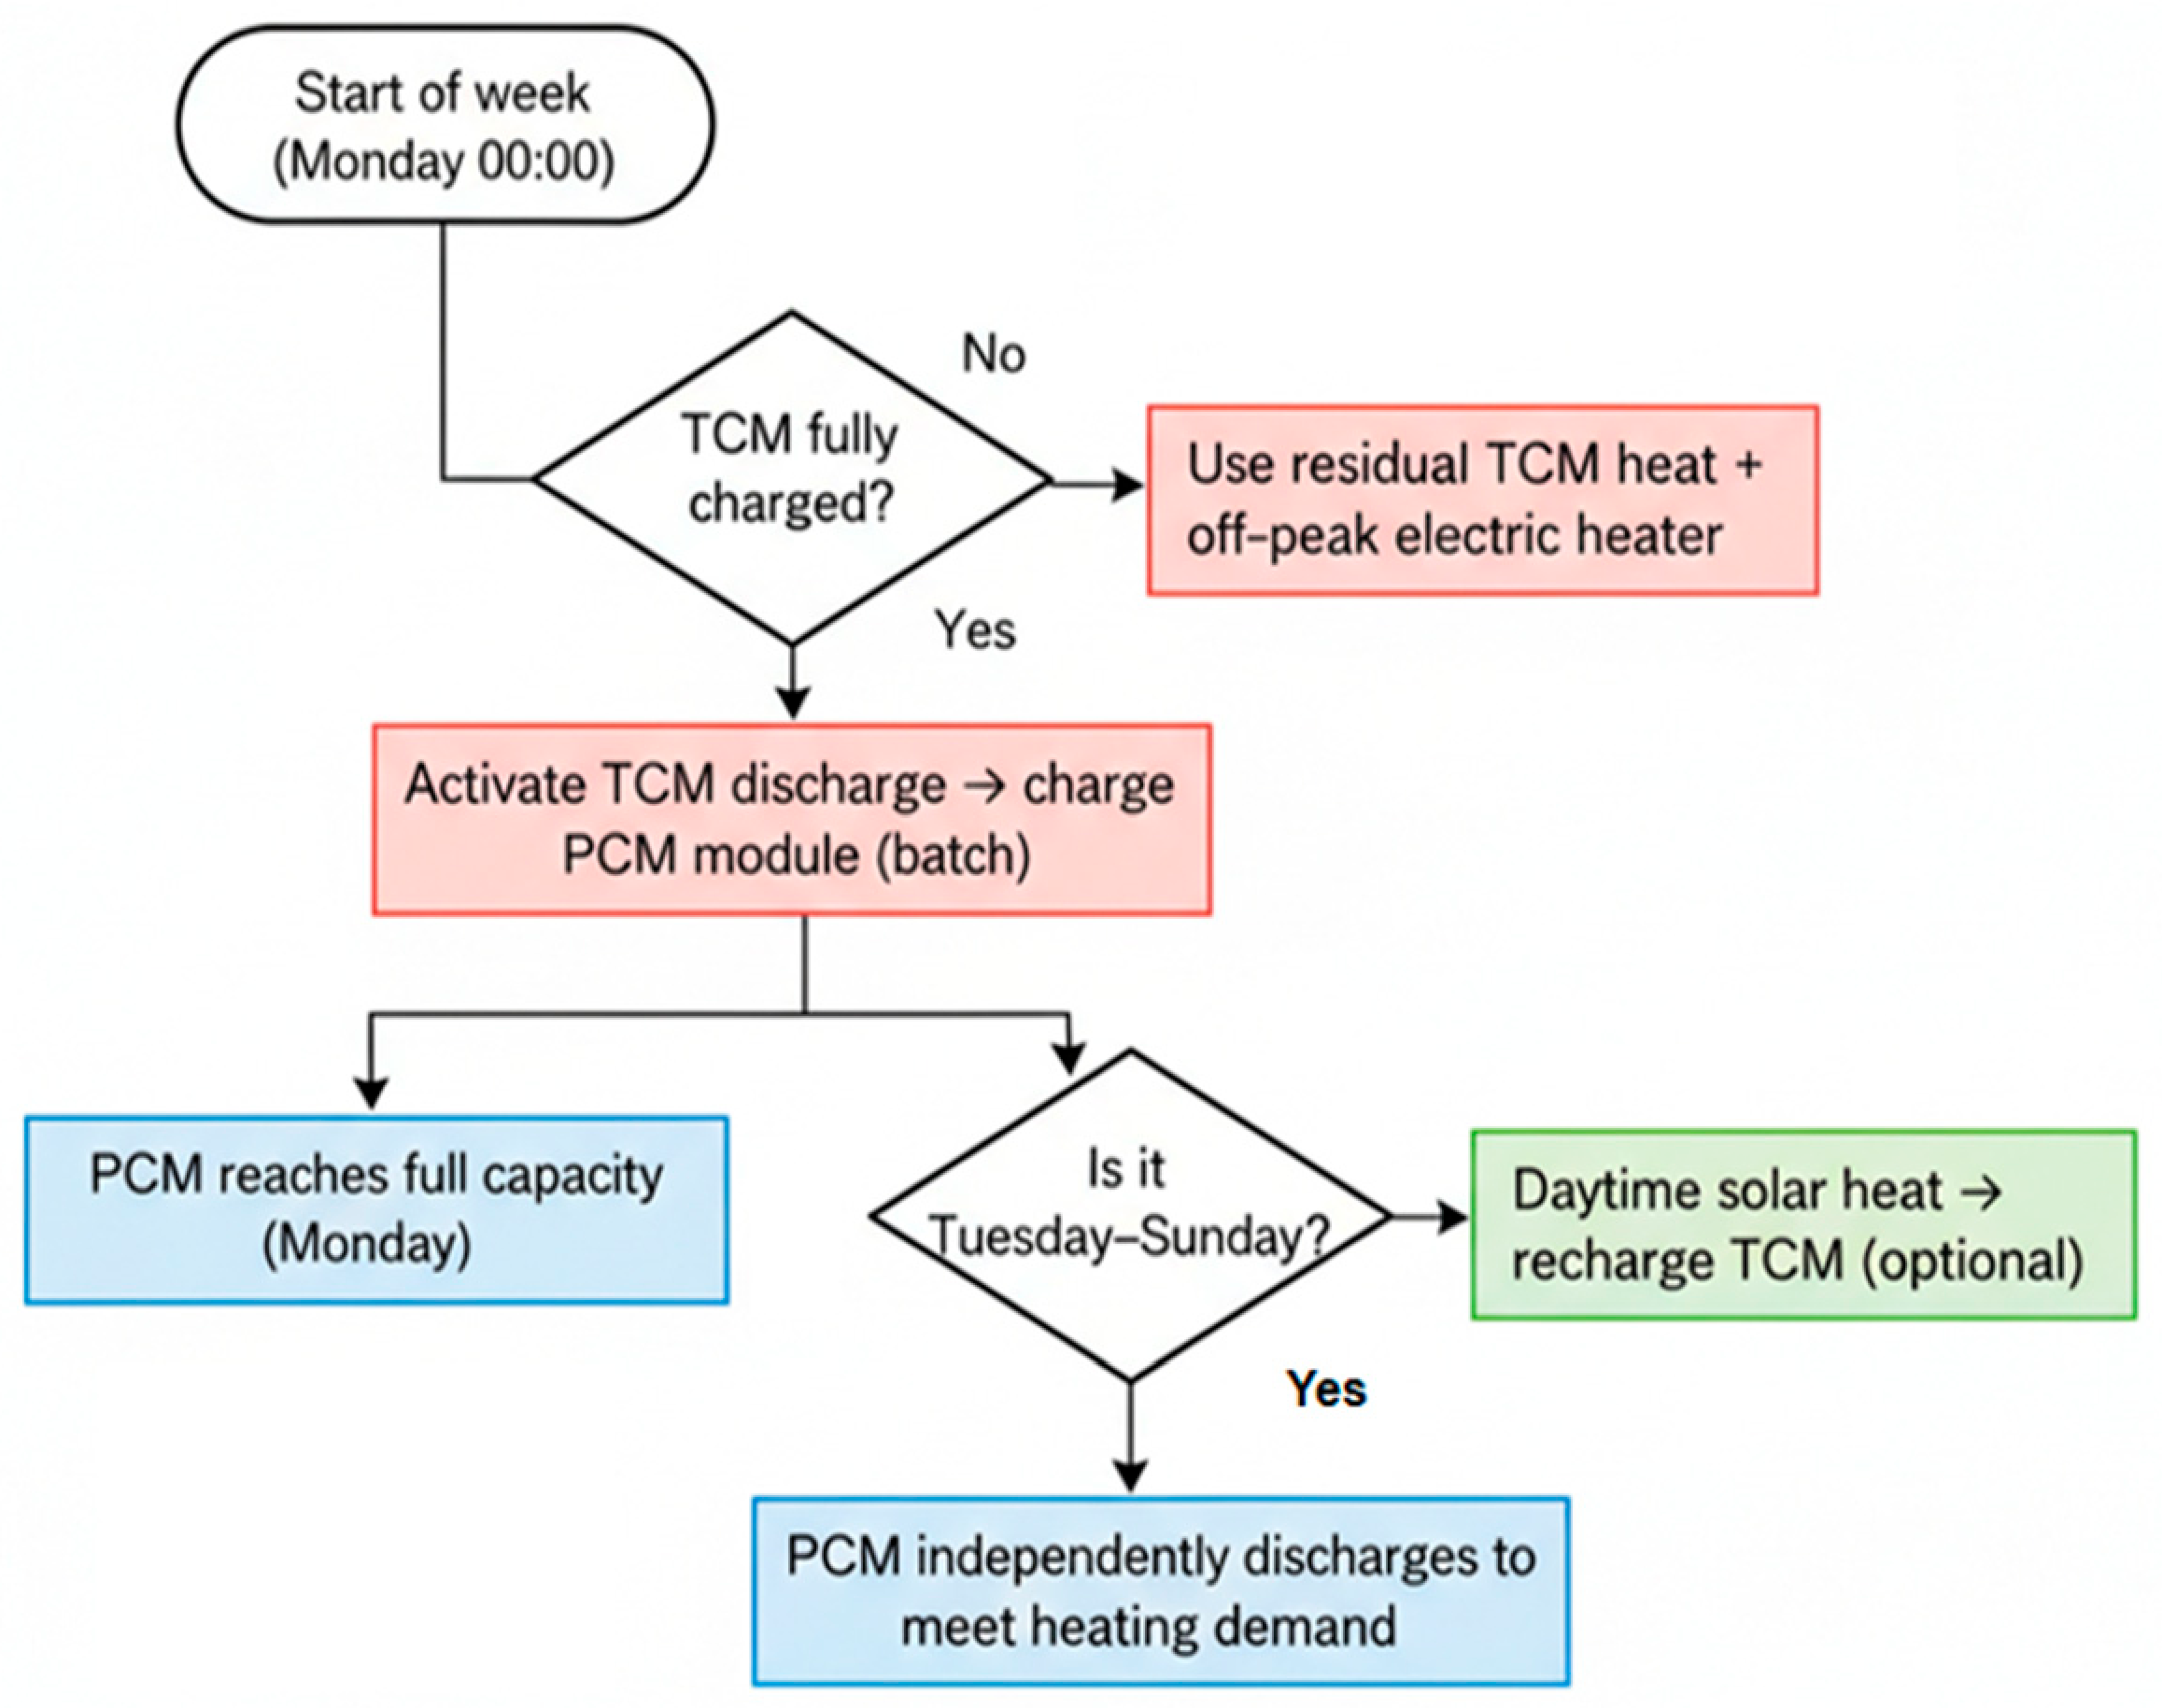
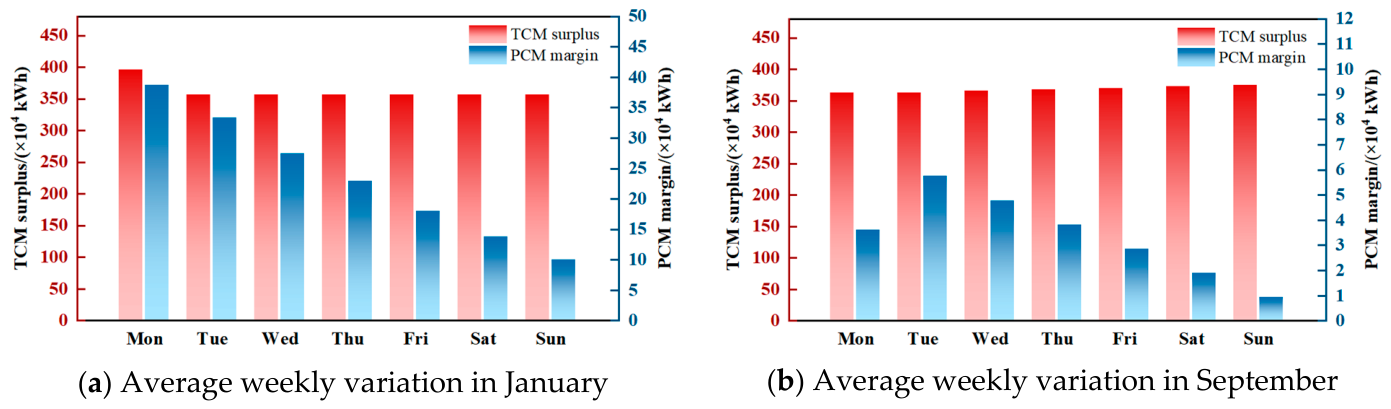
Figure 7a), the PCM module is fully charged on Monday by the TCM discharge. From Tuesday to Sunday, the PCM module discharges gradually to meet the space heating demand. The discharge rate follows the outdoor temperature pattern, with higher heat release on colder days. The TCM module’s state of charge decreases in steps, with a significant drop on Monday and slight recovery from daytime solar charging later in the week. During the week in September (
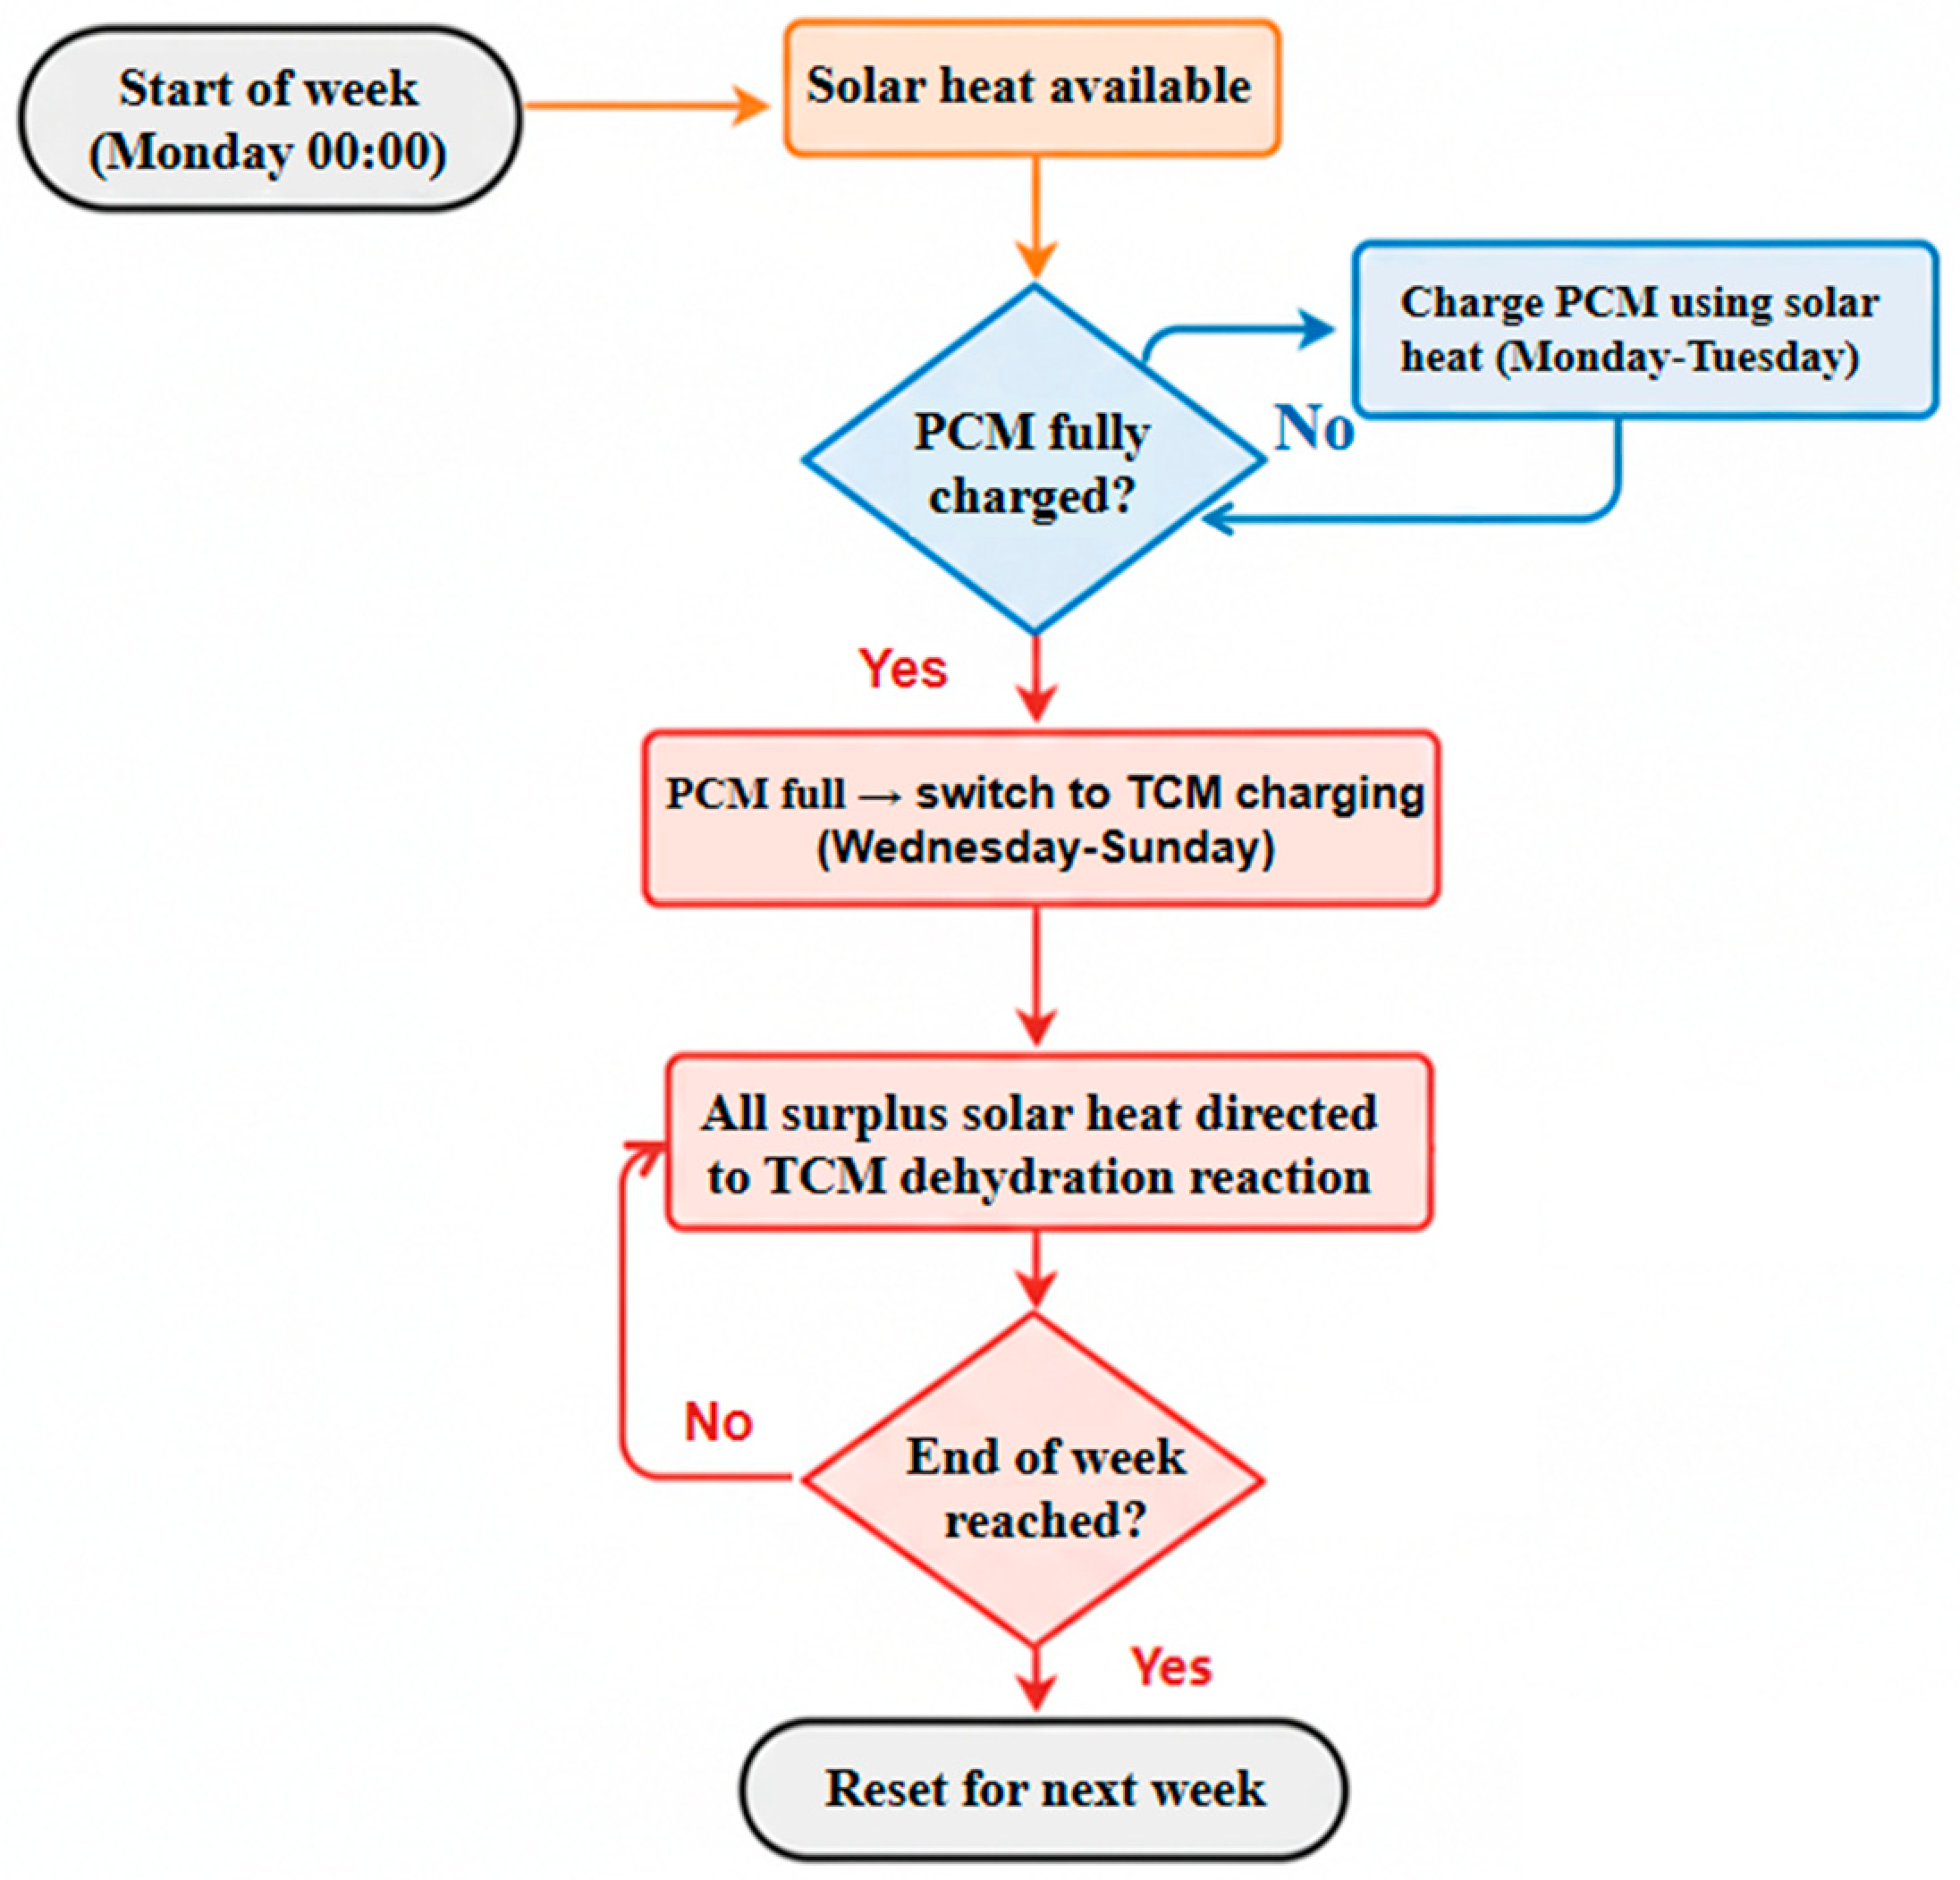
Figure 7b), the PCM module is charged on Monday and Tuesday using solar thermal energy, reaching full capacity by Tuesday evening. From Wednesday to Sunday, the surplus solar heat is directed to the TCM module, which steadily increases its state of charge. By the end of the week, the TCM module accumulates a substantial amount of stored chemical energy.
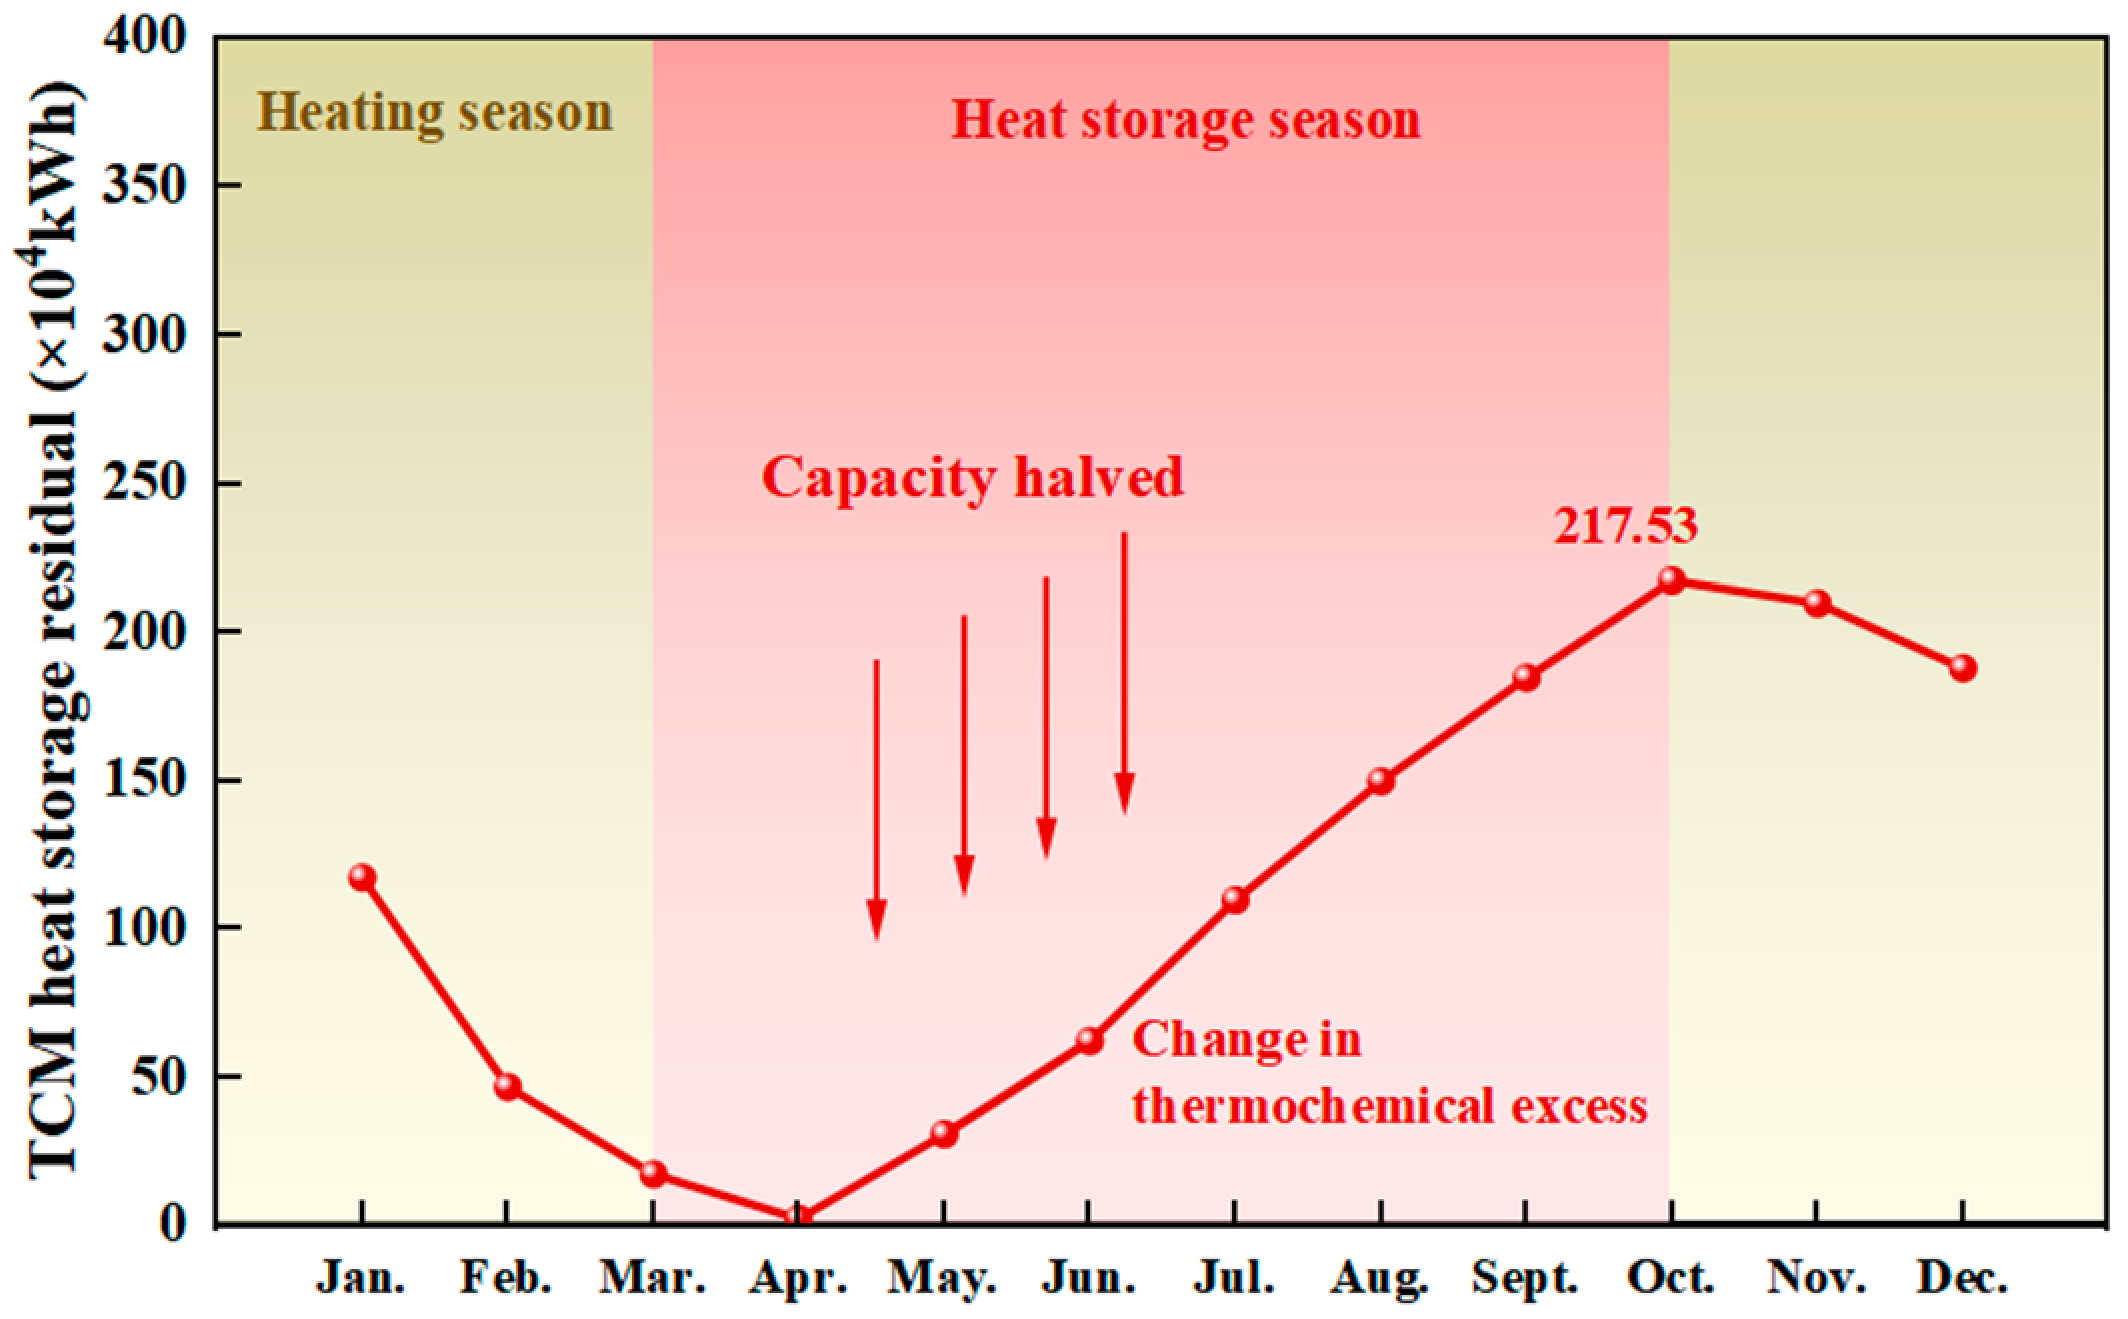
The annual variation in the TCM state of charge is shown in
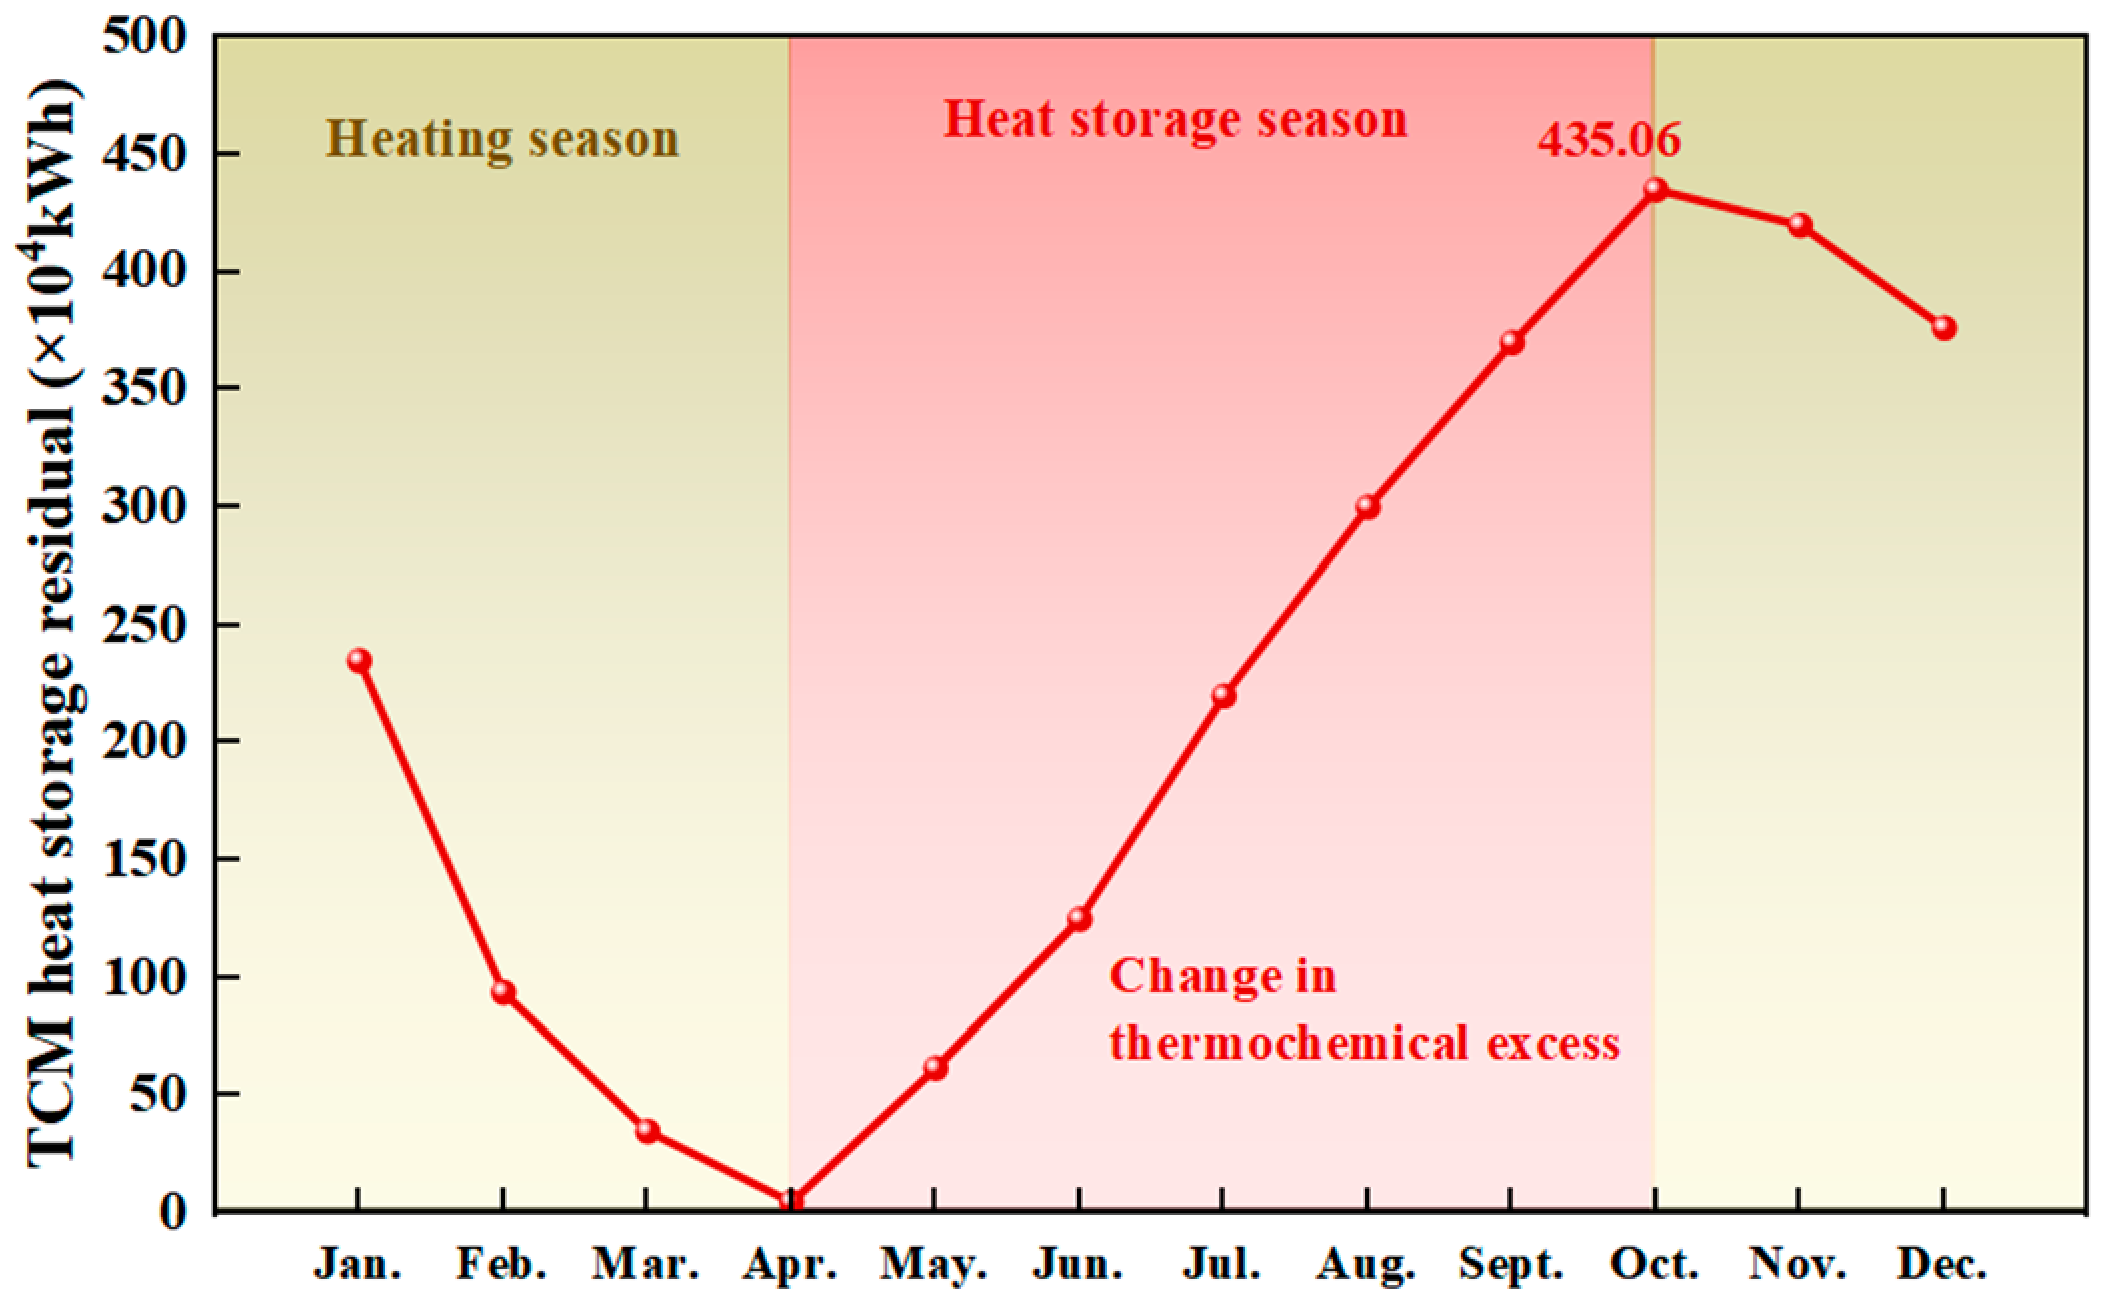
Figure 8. The TCM module begins the non-heating season with a residual charge of approximately 20,000 kWh. It is gradually charged throughout the summer, reaching a peak of nearly full capacity by early October. During the heating season, the TCM module discharges in weekly batches, with the state of charge decreasing stepwise. A small residual charge remains at the end of the heating season, providing a buffer for extreme conditions. The overall energy balance confirms that the system can successfully shift 4.424 × 10
6 kWh of solar energy from the non-heating season to meet the heating season deficit.
4.2.2. Scenario B: Hybrid System
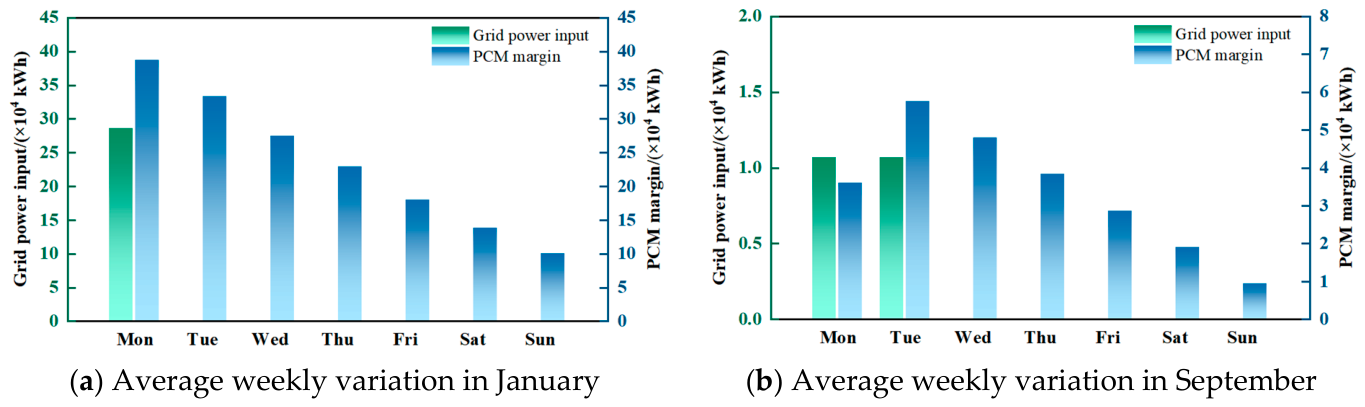
Scenario B retains the same PCM capacity but halves the TCM capacity. An electric heater of 12,000 kW is added, operating during off-peak hours (23:00–7:00) to supplement the heat deficit. The weekly operational pattern during a week in January is shown in
Figure 9a. On Monday, the TCM module discharges as in Scenario A, but because its capacity is halved, it can only provide about half of the energy needed to fully charge the PCM module. The remaining required energy is supplied by the electric heater during the off-peak period on Monday night, charging the PCM module to full capacity. From Tuesday to Sunday, the PCM module discharges to meet the heating load, while daytime solar heat is used to recharge the TCM module. The annual off-peak electricity consumption is 1.849 × 10
6 kWh, corresponding to a 50% reduction in TCM capacity.
During a week in September (
Figure 9b), the operation is identical to Scenario A, as the electric heater is not used. The TCM module is charged using solar heat from Wednesday to Sunday, but due to its reduced capacity, it reaches full charge earlier in the season, and thereafter the system may have to curtail some solar energy (not modelled in this study, but the surplus could be used for other purposes).
Figure 10 presents the annual variation in the TCM state of charge for the hybrid system, where the TCM capacity is reduced by half compared with the full storage system (
Figure 8). During the non-heating season, the module is gradually charged and reaches its peak storage level in October, which is approximately half of the peak value shown in
Figure 8 (217.53 × 10
4 kWh). During the heating season, the TCM module discharges in weekly batches. A small residual charge remains at the end of the heating season, providing a buffer for extreme conditions.
4.2.3. Scenario C: Fully Electric System with PCM Buffering
In Scenario C, the TCM module is eliminated entirely, and a 55,000 kW electric heater is used to charge the PCM module during off-peak hours. The weekly operation during a week in January is shown in
Figure 11a. On Monday, the electric heater operates for 8 h during the off-peak period, supplying 440,000 kWh of electricity (55,000 kW × 8 h) to charge the PCM module. Since the PCM capacity is 457,000 kWh, a single weekly charge is sufficient. From Tuesday to Sunday, the PCM module discharges to meet the heating demand. No solar thermal input is used. The annual off-peak electricity consumption is 3.698 × 10
6 kWh. During a week in September (
Figure 11b), the electric heater operates intermittently to meet domestic hot water demand, with a much smaller energy consumption.
4.3. Economic Analysis
Economic assumptions used in the analysis are summarised in
Table 4. A real discount rate of 3.5% is applied, with storage assets amortised over 30 years and the electric heater over 20 years. The capital expenditure values are based on the following sources. The PCM value of 427 CNY per kilowatt hour comes from a market survey of shape-stabilised fatty acid expanded graphite composites from Chinese suppliers conducted in 2024 and 2025, averaging prices for a scale of 50 to 100 m
3. The TCM value of 105 CNY per kWh is derived from material costs for potassium carbonate and expanded vermiculite, as well as reactor fabrication costs reported in [
21,
35], scaled to a 130 m
3 modular unit. The electricity price follows the 2025 time-of-use structure for Beijing, China, consisting of valley (night) and daytime rates.
The economic analysis is conducted using the Hypatia optimisation framework, which is formulated as a least-cost optimisation problem subject to physical and technological constraints. The objective function minimises total system cost, including fixed annualised costs and variable operating costs. In planning mode, investment costs are incorporated through annualisation or equivalent discounted cost representation. A year is divided into 24 Timeslices (12 months × 2 intra-day blocks: DAY and NIGHT).
Table 5 reports the full 24-row Timeslice definition used in the global input file, including: Timeslice index, Timeslice name, associated month and intra-day block (DAY/NIGHT), hours represented by the Timeslice, and the corresponding annual weight. The formulation is governed by three main constraint groups. First, energy balance constraints enforce carrier-wise consistency between supply and demand in each timeslice. Second, capacity and activity constraints limit technology operation according to installed capacity, availability, and maximum output assumptions. Third, storage constraints regulate charge, discharge, and energy content evolution to ensure physically consistent storage operation over time. Together, these constraints ensure that the optimal solution is both economically efficient and technically feasible. The Levelised Cost of Heat (LCOH) is calculated as the ratio of total annual cost to the total delivered heat (3.698 × 10
6 kWh).
The annualised fixed cost is:
where
are the annualised fixed-cost coefficients,
is the capital expenditure, and
is the balance of system.
The annualised fixed-cost coefficients are derived using the capital recovery factor (CRF) with a 3.5% discount rate:
Table 6 summarises the economic assumptions applied uniformly across the three operational cases (Full Storage, Hybrid, All-Electric). The selected discount rate and asset lifetimes follow widely used conventions in energy system appraisal and techno-economic studies, while storage
CAPEX assumptions are constrained to literature ranges and anchored to transparent material and component price references. The corresponding annualised coefficients used as Hypatia inputs are reported in
Table 7. Variable costs include the cost of electricity purchased during valley and daytime periods, and a CO
2 cost (50 CNY/t CO
2) applied to grid electricity. The simulation results for the three scenarios are summarised in
Table 8.
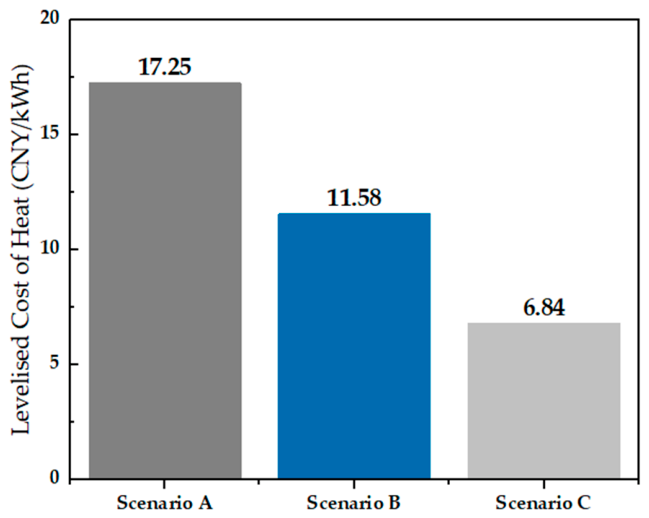
The comparison of levelised heating costs in three scenarios is shown in
Figure 12. The LCOH values show a clear trend: the fully electric system (Scenario C) has the lowest LCOH (6.84 CNY/kWh), but it relies entirely on grid electricity and has no solar thermal contribution. The full storage system (Scenario A) has the highest LCOH (17.25 CNY/kWh), reflecting the high capital cost of the large TCM capacity. The hybrid system (Scenario B) achieves an intermediate LCOH (11.58 CNY/kWh), representing a 33% reduction from Scenario A while still utilising 4.424 × 10
6 kWh of solar energy annually.
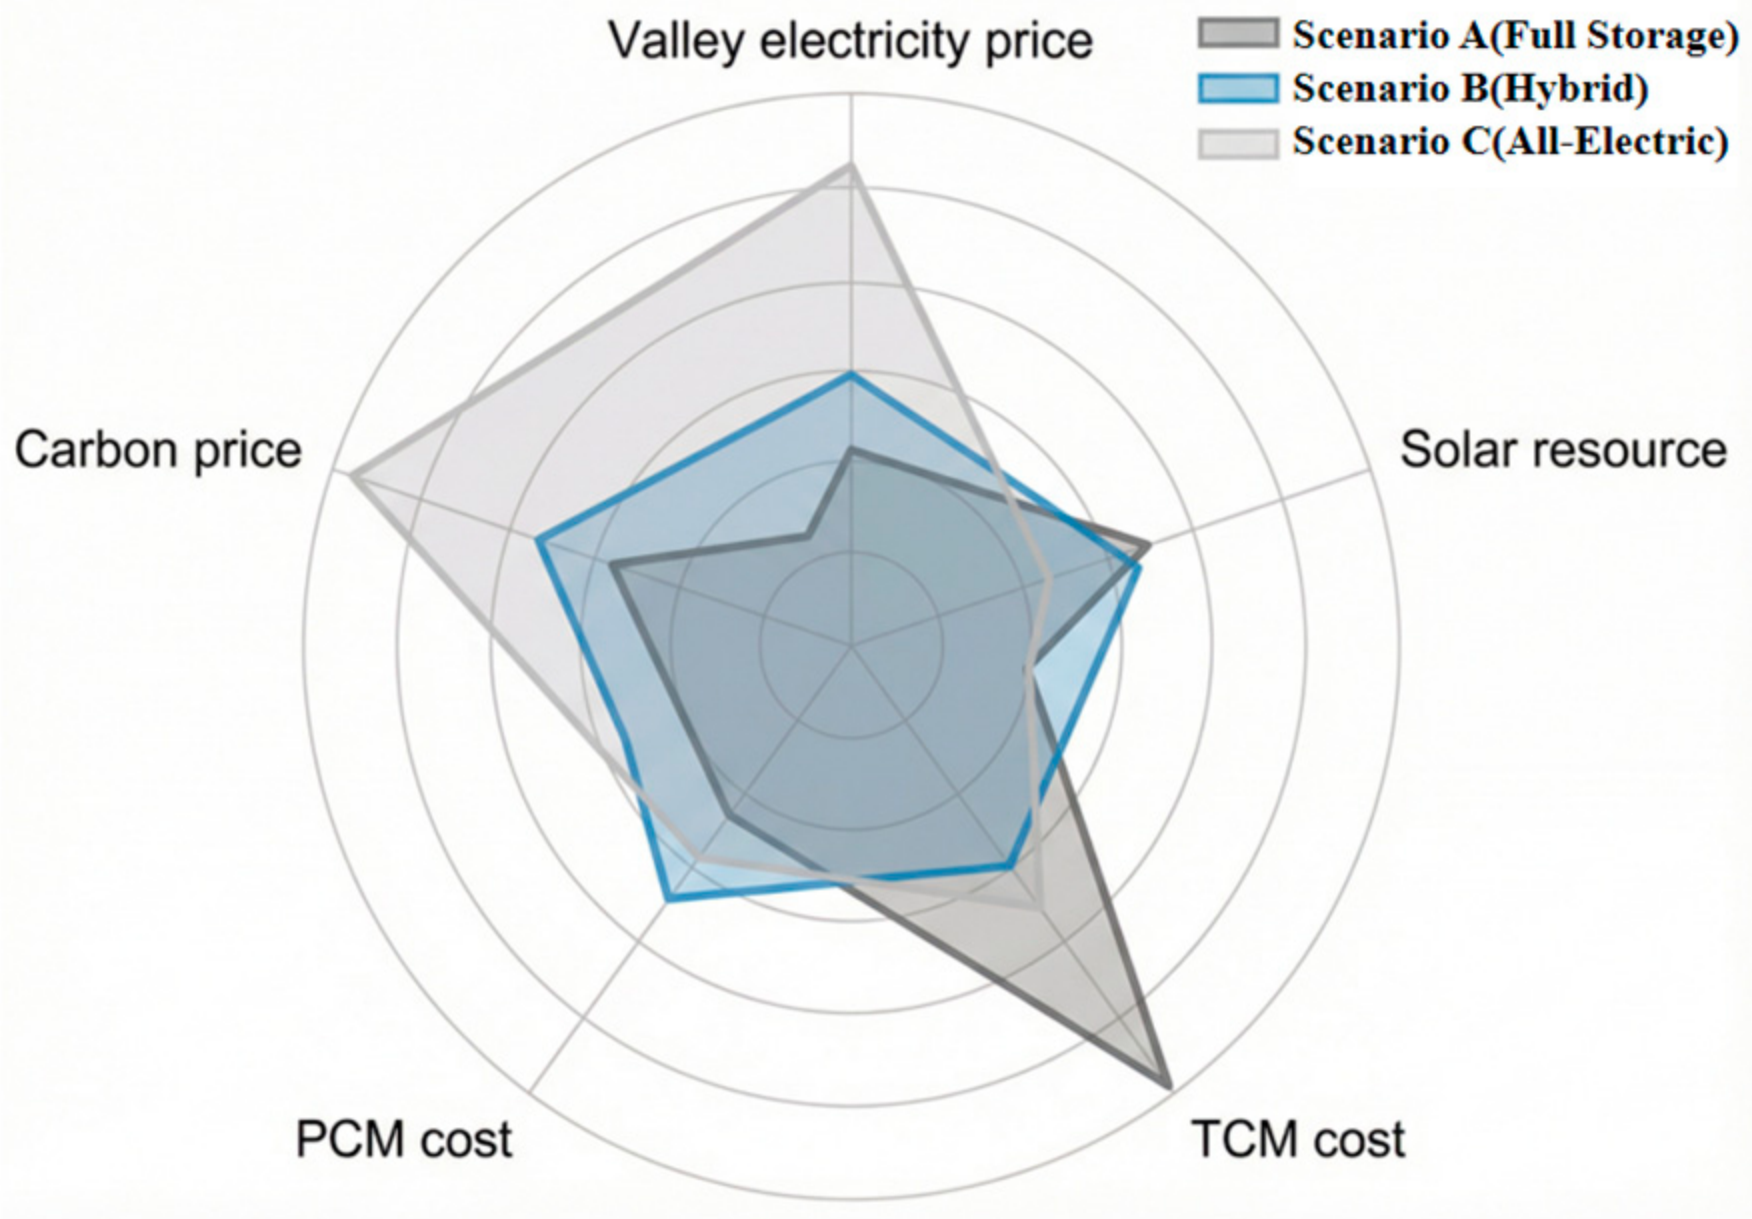
It should be pointed out that the aforementioned economic results are specific to the Beijing case study, including its solar resource and electricity tariff. Therefore, these findings should not be broadly generalised; instead, similar assessments for other regions must be conducted by incorporating local-specific parameters and conditions. To visualise how these factors influence the levelised cost of heat across scenarios, a radar chart is presented in
Figure 13. The chart plots the relative sensitivity of LCOH to five key parameters: valley electricity price, solar resource, TCM cost, PCM cost, and carbon price. For each parameter, the baseline value is taken from the Beijing case study assumptions (
Table 4). The sensitivity metric is defined as the percentage change in LCOH when the parameter is varied by ±20% from its baseline, while all other inputs remain fixed. For each scenario, the resulting percentage changes are plotted on the corresponding axis, and the five points are connected to form a polygon. A larger radial extension along a given axis indicates that the scenario’s LCOH is more sensitive to that parameter.
As can be seen from
Figure 13, the fully electric system (Scenario C) is most sensitive to electricity price and carbon price, reflecting its complete reliance on grid imports. In contrast, the full storage system (Scenario A) is primarily sensitive to TCM cost, as its economics depend almost entirely on the upfront investment in seasonal storage. The hybrid system (Scenario B) exhibits a more balanced sensitivity profile, responding moderately to electricity price, TCM cost, and carbon price. These differences imply that the optimal configuration may vary with local conditions: regions with low-cost valley electricity and high solar availability may favour hybrid or fully electric solutions, while regions with high carbon prices or abundant solar radiation but limited grid access may benefit from storage-dominant designs. This reveals an inherent tension between economic optimality and environmental performance, indicating that system selection should balance cost and carbon considerations rather than pursuing cost minimisation alone.
4.4. Discussion of Practical Implementation Feasibility
Reactor integration and thermal losses are primary engineering considerations. A fixed-bed configuration is feasible at the 130 m3 modular scale, but maintaining uniform vapour distribution across large arrays remains challenging. Basic heat transfer estimates indicate that with good insulation (U ≈ 0.2 W/(m2·K)), a surface area of about 500 m2, and a temperature difference of 55 K, daily heat loss is about 0.5% of stored capacity, consistent with molten-salt tank experience. Allowing the reactor to cool after charging largely eliminates standby losses but adds pre-heating energy costs.
Long-term material degradation is a key uncertainty. The EVPC shows good short-term stability (mass loss < 0.5% after 16 cycles), but 30-year operation (≈900 cycles) lacks long-term data. Repeated hydration–dehydration may cause salt migration or agglomeration, affecting performance. A capacity margin and accelerated ageing tests are recommended.
The control strategy must adapt to weather variability. The weekly fixed-window heuristic is simple and avoids real-time forecasting. The PCM module can buffer 2–3 days of low irradiation; longer deficits require an electric heater or auxiliary source. Simple adaptive logic (e.g., postponing TCM discharge if PCM undercharged) can enhance robustness without changing the basic framework.
Space and land requirements are not negligible in urban areas. Scenario A requires ≈ 650 m2, Scenario B ≈ 410 m2, and Scenario C ≈ 170 m2 (based on 130 m3 modules stacked to 3 m height). Modular design allows partial burial or co-location to alleviate land pressure.
In summary, the proposed system is basically feasible, but thermal losses, material degradation, and weather adaptability require further validation in demonstration projects.
5. Conclusions
This study investigated a modular composite seasonal thermal energy storage system integrating thermochemical storage and phase change storage under a weekly coordinated operating strategy. A techno-economic assessment was conducted based on a residential district case in Beijing. The main conclusions are as follows.
First, the proposed weekly coordination strategy enables a functional separation between long-term seasonal storage and short-term load buffering. The TCM module is primarily responsible for seasonal energy shifting, whereas the PCM module smooths intra-week load fluctuations. By confining TCM charging and discharging to distinct weekly operating windows, the start-stop frequency of the TCM module is reduced by approximately 85% compared with daily cycling, which can simplify system control. The reduction in start-stop cycles is likely to be beneficial for reactor durability, but a quantitative assessment of lifetime improvement would require dedicated experimental studies beyond the scope of this work.
Second, the three system configurations—namely the full storage system (Scenario A), the hybrid storage system with off-peak electricity support (Scenario B), and the fully electric system with PCM buffering (Scenario C)—exhibit clear trade-offs among storage capacity, economic performance, and grid dependence. Scenario A minimises grid reliance but requires the largest storage capacity and highest capital investment. Scenario C achieves the lowest levelised cost of heat under the assumed electricity tariff and cost conditions but depends entirely on grid electricity, therefore leading to higher carbon emissions. Scenario B reduces the TCM capacity by 50% and decreases the levelised cost of heat by 33% compared with Scenario A under the assumed economic and technical parameters of the Beijing case study, while maintaining a substantial solar contribution.
Third, the hybrid configuration provides a practical compromise between storage size, economic feasibility, and low-carbon performance under the case study conditions. The results indicate that appropriately right-sizing seasonal thermal storage and supplementing it with off-peak electricity can reduce storage infrastructure requirements and improve the economic viability of solar-assisted district heating systems in regions with pronounced seasonal mismatches between solar availability and heating demand.
Future work should incorporate high-resolution time-series modelling, real-time dispatch optimisation, and more detailed environmental assessment. In addition, the integration of low-carbon auxiliary heat sources should be further explored to reduce the carbon impact of backup heating and narrow the cost–carbon performance gap.