Article

A Decision-Support Framework for Contracted Demand and Tariff Management in Brazilian Group A Consumers

by
Cleydson Matos Lima
1,*,
Jonathan Muñoz Tabora
1,2,
Cezar Augusto Rocha
1,
Carminda Célia Moura de Moura Carvalho
1,
Ubiratan H. Bezerra
1 and
Maria Emília de Lima Tostes
1
1
Post-Graduate Program in Electrical Engineering, Universidade Federal do Pará (UFPA), Belém 66075-110, PA, Brazil
2
Electrical Engineering Department, National Autonomous University of Honduras (UNAH), Tegucigalpa 04001, Honduras
*
Author to whom correspondence should be addressed.
Energies 2026, 19(11), 2579; https://doi.org/10.3390/en19112579
Submission received: 21 April 2026 / Revised: 22 May 2026 / Accepted: 25 May 2026 / Published: 27 May 2026

Abstract

Large electricity consumers under Brazilian Group A tariffs face a cost–risk trade-off when defining contracted demand, since inadequate sizing leads either to payments for unused capacity or to penalties for exceeding regulatory limits. Despite this relevance, practical decision-support tools that convert tariff rules into reproducible contract optimization remain limited. This paper presents DSManager (version 0.0), a tool based on Python (version 3.14.4) developed to optimize tariff modality and contracted demand for Group A consumer units. The framework incorporates the mathematical formulation of Brazilian tariff structures, including green and blue time-of-use modalities, taxes, and excess-demand penalties, and evaluates two optimization strategies: the Maximum Recorded Demand method and a Grid Search procedure for direct minimization of the billing cost function. The tool was implemented with Pandas (version 3.0.2) and Streamlit (version 1.57.0) and validated using real billing data from two consumer units in the Equatorial Pará concession area. In the retrospective case, the green tariff combined with Grid Search produced projected savings of US$9554.20 relative to the unchanged contract. In the real implementation case, reducing contracted demand from 450 kW to 240 kW yielded an observed average saving of US$1944.31 per month. The results demonstrate the practical value of the proposed tool for tariff management and electricity cost reduction in large consumers.

1. Introduction

1.1. General Considerations

Energy efficiency and demand-side management have become central strategies for improving the economic and operational performance of electricity consumers. In addition to reducing electricity consumption through technological upgrades and operational measures, large consumers may also achieve significant savings through a more efficient management of their electricity supply contract [1].
In regulated electricity markets, tariff design itself acts as an economic signal capable of influencing consumption patterns and contractual decisions, thereby linking tariff management to broader demand-side management practices [2]. The classic demand-side management literature frames DSM as a portfolio of load-shaping, demand-response, and energy-efficiency actions capable of improving both consumer cost performance and power-system operation [3]. In addition, empirical evidence on dynamic electricity pricing shows that tariff signals can induce measurable changes in consumption behavior, reinforcing the role of tariff structures as economic instruments for demand management [4].
In Brazil, this issue is particularly relevant for consumers supplied under Group A, whose billing structure includes not only energy consumption charges but also charges related to contracted active power demand [5]. Under this framework, the final electricity cost depends on the tariff modality adopted and on how closely the contracted demand reflects the actual operating requirements of the installation. In practical terms, the consumer faces a recurrent trade-off: excessive contracted demand leads to avoidable payments for unused capacity, whereas underestimated contracted demand increases the risk of overrun charges and contractual inefficiencies.
This regulatory environment is further shaped by the existence of distinct tariff modalities for Group A consumers, notably the Blue and Green time-of-use structures, each with different billing logics for energy and demand [6]. As a result, the economic performance of a consumer unit is not determined solely by the amount of electricity consumed, but also by the adequacy of the tariff framework and the contractual demand levels adopted over time. Therefore, tariff management should be understood as a technical-economic decision problem, in which measured demand behavior, seasonal variability, and regulatory billing rules must be jointly considered.
At the network level, recent advances in transmission and converter-based technologies, including fault ride-through strategies for hybrid cascaded HVDC systems, also illustrate how power-system modernization increasingly depends on coordinated operation across supply-side infrastructure and demand-side decision-support tools [7].
The problem becomes even more critical in large and complex installations, such as university campuses, hospitals, or multi-building public institutions, where demand patterns are influenced by heterogeneous end uses, variable occupancy, operational schedules, and, increasingly, distributed generation systems. In such contexts, defining the most appropriate tariff modality and contracted demand cannot rely exclusively on empirical judgment or static contractual practices. Instead, it requires systematic analysis capable of translating billing rules and historical demand data into consistent decision support for contract management.

1.2. State of the Art

Recent studies have shown that reducing electricity expenditure in large consumers can be pursued through different but complementary approaches, including demand-side management, tariff-aware planning, forecasting, and optimization [8]. However, the literature remains fragmented, since most works address only one part of the decision problem. Operational DSM studies such as [9] focus on peak clipping and load shifting to reshape the daily load profile and reduce billing costs, while [10] addresses demand response from the perspective of load aggregators using forecasting-based participant selection. End-use efficiency is also relevant to demand-side management, especially in large consumers with significant motor-driven loads. Studies on motor-loading diagnosis under voltage variations [11,12] and voltage harmonic impacts on line-start permanent magnet motors [13,14] reinforce that motor performance and power-quality conditions can affect consumption and demand behavior, complementing tariff and contracted-demand optimization.
Although these studies demonstrate the value of flexibility-oriented strategies, they are not centered on the contractual definition of demand under regulated billing frameworks. For industrial and large consumers, time-of-use electricity pricing has been widely studied as a mechanism to align consumption patterns with system cost conditions [15]. Optimization-based formulations have also been proposed to model the interaction between time-differentiated tariffs, consumption response, and electricity cost minimization [16]. More recent tariff-design studies further show that the economic consequences of tariff structures depend on the interaction between pricing rules, consumer heterogeneity, and local generation adoption [17].
A second group of studies investigates broader campus or system-level optimization [18]. The study in [19] treats the university campus as a multi-energy system and combines linear programming, cogeneration scheduling, photovoltaic sizing, and renewable energy credits to reduce costs and emissions. In the Brazilian context, ref. [20] further advances this line by proposing an MILP framework that jointly evaluates tariff modality, contracted demand, and demand-response actions with local generation. These studies are relevant because they show that tariff performance depends on the interaction between operational and contractual decisions. Nevertheless, their formulations are strongly tied to integrated resource scheduling, making them less directly applicable when the main practical problem is contract revision itself, based on historical billing and measured demand.
More directly related to the present manuscript are studies focused on contracted-demand optimization. In the international literature, authors in [21] show that contracted power can be treated as an optimization variable and that metaheuristic approaches reduce electricity costs under multi-period tariffs and penalty structures. In Brazil, the study in [22] demonstrates that electricity costs can be reduced by jointly optimizing contracted-demand and photovoltaic panel orientation, highlighting the interaction between tariff structure, local climate, load behavior, and distributed generation. Similarly, ref. [23] places the contract itself at the center of the problem by using genetic algorithms to determine optimal annual contracted-demand profiles for a large university consumer under Brazilian tariff rules.
These contributions are highly relevant because they confirm that contracted demand is not merely an administrative parameter, but a key economic decision variable. Even so, they remain predominantly algorithm-centered and do not yet culminate in a broader decision-support environment aimed at reproducible and routine institutional use.
The information layer supporting those decisions has also been strengthened by data-driven studies. Paper in [24] integrates anomaly detection, clustering, and forecasting across multiple public consumer units to identify atypical patterns and suggest more appropriate demand settings, while the paper in [25] applies LSTM neural networks to medium-term demand forecasting for a large Brazilian consumer and validates the results against real utility bills. These studies confirm that data analytics and forecasting are valuable for anticipating contract needs, especially when tariff procedures require advance notice. However, they also show important limitations: portfolio screening does not replace billing-exact optimization, and forecasting accuracy may deteriorate under unforeseen events such as abrupt calendar disruptions or strikes. Therefore, forecasting and pattern recognition improve decision support, but do not by themselves resolve the contractual optimization problem.
Methodologically, authors in [26] broaden the discussion by comparing classical optimization methods and genetic algorithms for contracted-demand reduction in the Brazilian public sector. Its results are important because they indicate that the problem is not restricted to a single optimization family and that algorithmic behavior may vary with the demand profile and the case under analysis.
However, as in [23], the emphasis remains on algorithm comparison rather than on the development of an operationally transparent and reproducible framework for tariff management. More directly related to the present manuscript, contracted-demand and contract-capacity optimization have been addressed through different methodological families. Classical formulations have treated contracted capacity as an explicit decision variable, including cost-optimization procedures for large consumers [1] and linear programming formulations for electricity contract-capacity problems [27], and customer tariff subscription optimization models [28]. Other studies have explored heuristic and metaheuristic approaches to determine contract capacity under time-of-use tariffs and penalty structures, including genetic algorithms and other optimization-based strategies [21,23].
In the Brazilian context, tariff-aware optimization has also been linked to demand-response actions, local generation, photovoltaic-system configuration, and contract revision [20,22]. A particularly relevant contribution is the framework proposed by Rosado et al. [29], which formulates the contracted-demand optimization problem for large customers and evaluates mathematical models using Brazilian utility data, including cases with intermittent generation. Related evidence from industrial photovoltaic applications also confirms that demand-charge reduction and contracted-power optimization are strongly affected by load shape, peak coincidence, and local generation profiles [30]. These contributions confirm that contracted demand is not merely an administrative parameter, but a relevant technical-economic decision variable whose optimal value depends on the interaction between load behavior, tariff modality, and regulatory penalty rules.
Recent studies have further incorporated forecasting, asymmetric cost treatment, stochastic decision-making, and risk-aware formulations into contract-capacity decision-making [31,32]. These approaches are particularly relevant for large consumers because contractual decisions involve a trade-off between expected cost reduction, penalty exposure, demand uncertainty, and regret-based economic outcomes. For example, asymmetric loss functions have been proposed to represent the unequal economic consequences of overestimating and underestimating contract capacity [31], while analytical approaches have considered the effects of forecasting errors on maximum demand and price uncertainty [33]. More recent risk-assessment formulations for industrial consumers also show that contract-capacity decisions must balance cost minimization against the exposure to penalties under uncertain demand behavior [34]. In parallel, data-driven studies based on clustering, anomaly detection, and forecasting have improved the identification of atypical consumption patterns and the anticipation of future demand requirements [14,15]. However, these approaches generally emphasize either algorithmic performance, predictive accuracy, or risk modeling, rather than the construction of a practical tool that reproduces regulated invoice logic and supports routine contract revision by energy managers.
Overall, the literature confirms that contracted-demand management can be addressed through mathematical programming, metaheuristics, forecasting, and risk-aware approaches. Nevertheless, three gaps remain relevant for practical energy management. First, several studies are primarily algorithm-centered and do not provide an operational environment for routine institutional use. Second, forecasting and risk-based models improve anticipation of future demand but do not necessarily reproduce the exact billing logic applied in regulated invoices. Third, few frameworks jointly integrate Brazilian Group A tariff rules, Green/Blue modality comparison, contracted-demand evaluation, overrun penalties, tax treatment, and validation with real billing data. Therefore, the gap addressed in this paper is not the absence of optimization algorithms, but the lack of a transparent, regulation-aware, and manager-oriented framework capable of translating Brazilian Group A billing rules into actionable contract-management recommendations.

1.3. Motivation and Contributions

Defining contracted demand is a non-trivial decision problem for large electricity consumers operating under tariff schemes with explicit demand charges and overrun penalties. This challenge is particularly relevant in Brazil, where Group A consumers are subject to regulated tariff modalities that directly affect the economic outcome of contract decisions. In complex consumers such as universities, demand variability associated with occupancy patterns, academic schedules, and distributed generation further increases the difficulty of selecting adequate contract values.
Motivated by this context, this paper proposes DSManager, a Python-based decision-support framework for contracted-demand and tariff-modality management in Brazilian Group A consumers. Unlike studies focused primarily on algorithmic benchmarking, forecasting accuracy, or isolated contract-capacity optimization, DSManager integrates regulated billing rules, historical invoice data, tariff-modality comparison, tax treatment, and contracted-demand optimization into a reproducible workflow for practical contract revision. The specific contributions of this study are:
  • The formalization of Brazilian Group A billing rules, including Green and Blue time-of-use tariff modalities, active energy charges, active demand charges, overrun penalties, and tax treatment;
  • The implementation of this formulation in a Python-based tool designed for transparent and reproducible use by energy managers;
  • The comparison between the Maximum Recorded Demand criterion and a Grid Search cost-minimization procedure, representing conservative and cost-oriented decision strategies;
  • The validation of the framework using real billing data from two consumer units, combining retrospective out-of-sample assessment and observed post-implementation savings after real contract revision.

2. Regulatory and Mathematical Background

According to ANEEL Normative Resolution No. 1000/2021, the application of electricity tariffs in Brazil must consider the attributes that characterize the consumer unit, including class, subclass, group, and subgroup [5]. The tariff structure applied to distribution utilities is further detailed in ANEEL’s Tariff Regulation Procedures, particularly PRORET Module 7, which establishes the regulatory basis for tariff structures and time-of-use modalities [35]. Consumer units supplied at voltages below 2.3 kV belong to Group B and are billed under a monomial tariff structure, in which charges apply only to electricity consumption. In contrast, consumer units supplied at voltages equal to or greater than 2.3 kV belong to Group A and are billed under a binomial tariff structure, in which charges apply to both electricity consumption and active power demand.
For Group A consumers, the two main tariff modalities are the Green time-of-use tariff and the Blue time-of-use tariff. In addition, consumer units with installed transformer capacity equal to or lower than 112.5 kVA may, under specific regulatory conditions, opt to be billed under Group B and, therefore, under the conventional tariff structure. Since the purpose of the present study is to support tariff and contracted-demand decisions for Group A consumer units, the operational analysis developed in DSManager focuses on the Green and Blue modalities. The conventional modality is presented only for regulatory completeness. Table 1 summarizes the notation adopted for billed variables and applicable tariffs. Section 2.1, Section 2.2 and Section 2.3 present the mathematical formulations associated with the tariff modalities considered in this study.

2.1. Conventional Tariff Modality

Equation (1) describes the cost calculation for the conventional tariff modality ( C O S T C O N V ). Under this structure, billing is based exclusively on total electricity consumption C O N t o t a l , multiplied by the respective tariff for the Use of the Distribution System applied to energy ( T U S D c o n v e n ) and Energy Tariff ( T E c o n v ) , with no separate charge for active power demand and no differentiation by tariff period. Although this modality is not the focus of the computational analysis, its formulation helps distinguish monomial and binomial billing structures within the Brazilian regulatory framework.
C O S T C O N V = C O N t o t a l T U S D c o n v e n + T E c o n v

2.2. Green Time-of-Use Tariff Modality

Equation (2) defines the electricity consumption cost ( C O S T g r e e n C O N ) under the Green tariff modality. This cost is calculated based on the energy consumed during the peak C O N p and off-peak C O N o p periods, which are multiplied by their respective tariff for the Use of the Distribution System applied to energy ( T U S D g r e e n p e n and T U S D g r e e n o p e n ) and Energy Tariffs ( T E g r e e n p and T E g r e e n o p ), as follows:
C O S T g r e e n C O N = C O N p T U S D g r e e n p e n   +   T E g r e e n p +   C O N o p T U S D g r e e n o p e n   +   T E g r e e n o p
The cost of active power demand ( C O S T g r e e n d e m ) is calculated by multiplying the billed demand ( D E M ) by the tariff for the Use of the Distribution System applied to the demand ( T U S D g r e e n d e m ), as represented by Equation (3):
C O S T g r e e n d e m = D E M T U S D g r e e n d e m
When the measured demand is less than the contracted demand, the billed demand remains equal to the contracted value. On the other hand, when the measured demand exceeds the contracted value, the billed demand becomes equal to the measured demand.
Furthermore, an overrun charge ( C O S T g r e e n u l t ) applies whenever the measured demand ( D E M m e d ) exceeds 105% of the contracted demand ( D E M c o n t ). In this case, the excess portion is billed at twice the applicable demand tariff, as shown in Equation (4):
C O S T g r e e n u l t = D E M m e d D E M c o n t 2 T U S D g r e e n d e m
Therefore, the total cost ( C O S T g r e e n t o t a l ) under the Green tariff modality results from the sum of the energy, demand, and overrun components, as expressed in Equation (5).
C O S T g r e e n t o t a l = C O S T g r e e n c o n + C O S T g r e e n d e m + C O S T g r e e n u l t  

2.3. Blue Time-of-Use Tariff Modality

Unlike the Green modality, in which a single contracted demand applies to the entire day, the Blue modality separates both energy and demand billing into peak and off-peak periods.
Equation (6) describes the calculation of the energy consumption cost ( C O S T b l u e c o n ) under the Blue tariff modality. This cost is determined by multiplying the energy consumed during the peak ( C O N p ) and off-peak ( C O N o p ) periods by their respective tariff for the Use of the Distribution System applied to energy ( T U S D b l u e p e n and T U S D b l u e o p e n ) and Energy Tariffs ( T E b l u e p and T E b l u e o p ):
C O S T b l u e c o n = C O N p T U S D b l u e p e n   +   T E b l u e p +   C O N o p T U S D b l u e o p e n   +   T E b l u e o p
In the Blue tariff modality, the consumer must define two contracted-demand values, one for each tariff period, which increases the dimensionality of the contract-definition problem. The active power demand cost ( C O S T b l u e d e m ) is calculated by multiplying the billed demands for the peak ( D E M p ) and off-peak ( D E M o p ) periods by their specific tariff for the Use of the Distribution System applied to the demand ( T U S D b l u e p d e m and T U S D b l u e o p d e m ), as shown in Equation (7):
C O S T b l u e d e m = D E M p T U S D b l u e p d e m + D E M o p T U S D b l u e o p d e m
Furthermore, an overrun charge ( C O S T b l u e u l t ) is applied independently for each period whenever the measured demand ( D E M m e d p or D E M m e d o p ) exceeds 105% of the contracted demand ( D E M c o n t p or D E M c o n t o p ). The excess portion in each period is billed at twice the applicable demand tariff, as expressed in Equation (8):
C O S T b l u e u l t = D E M m e d p D E M c o n t p 2 T U S D b l u e p d e m + D E M m e d o p D E M c o n t o p 2 T U S D b l u e o p d e m
Therefore, the total billed cost under the Blue tariff modality ( C O S T b l u e t o t a l ) results from the sum of the energy consumption, active power demand, and overrun penalty components, as defined in Equation (9):
C O S T b l u e t o t a l = C O S T b l u e c o n + C O S T b l u e d e m + C O S T b l u e u l t

2.4. Rates, Taxes and Final Billed Cost

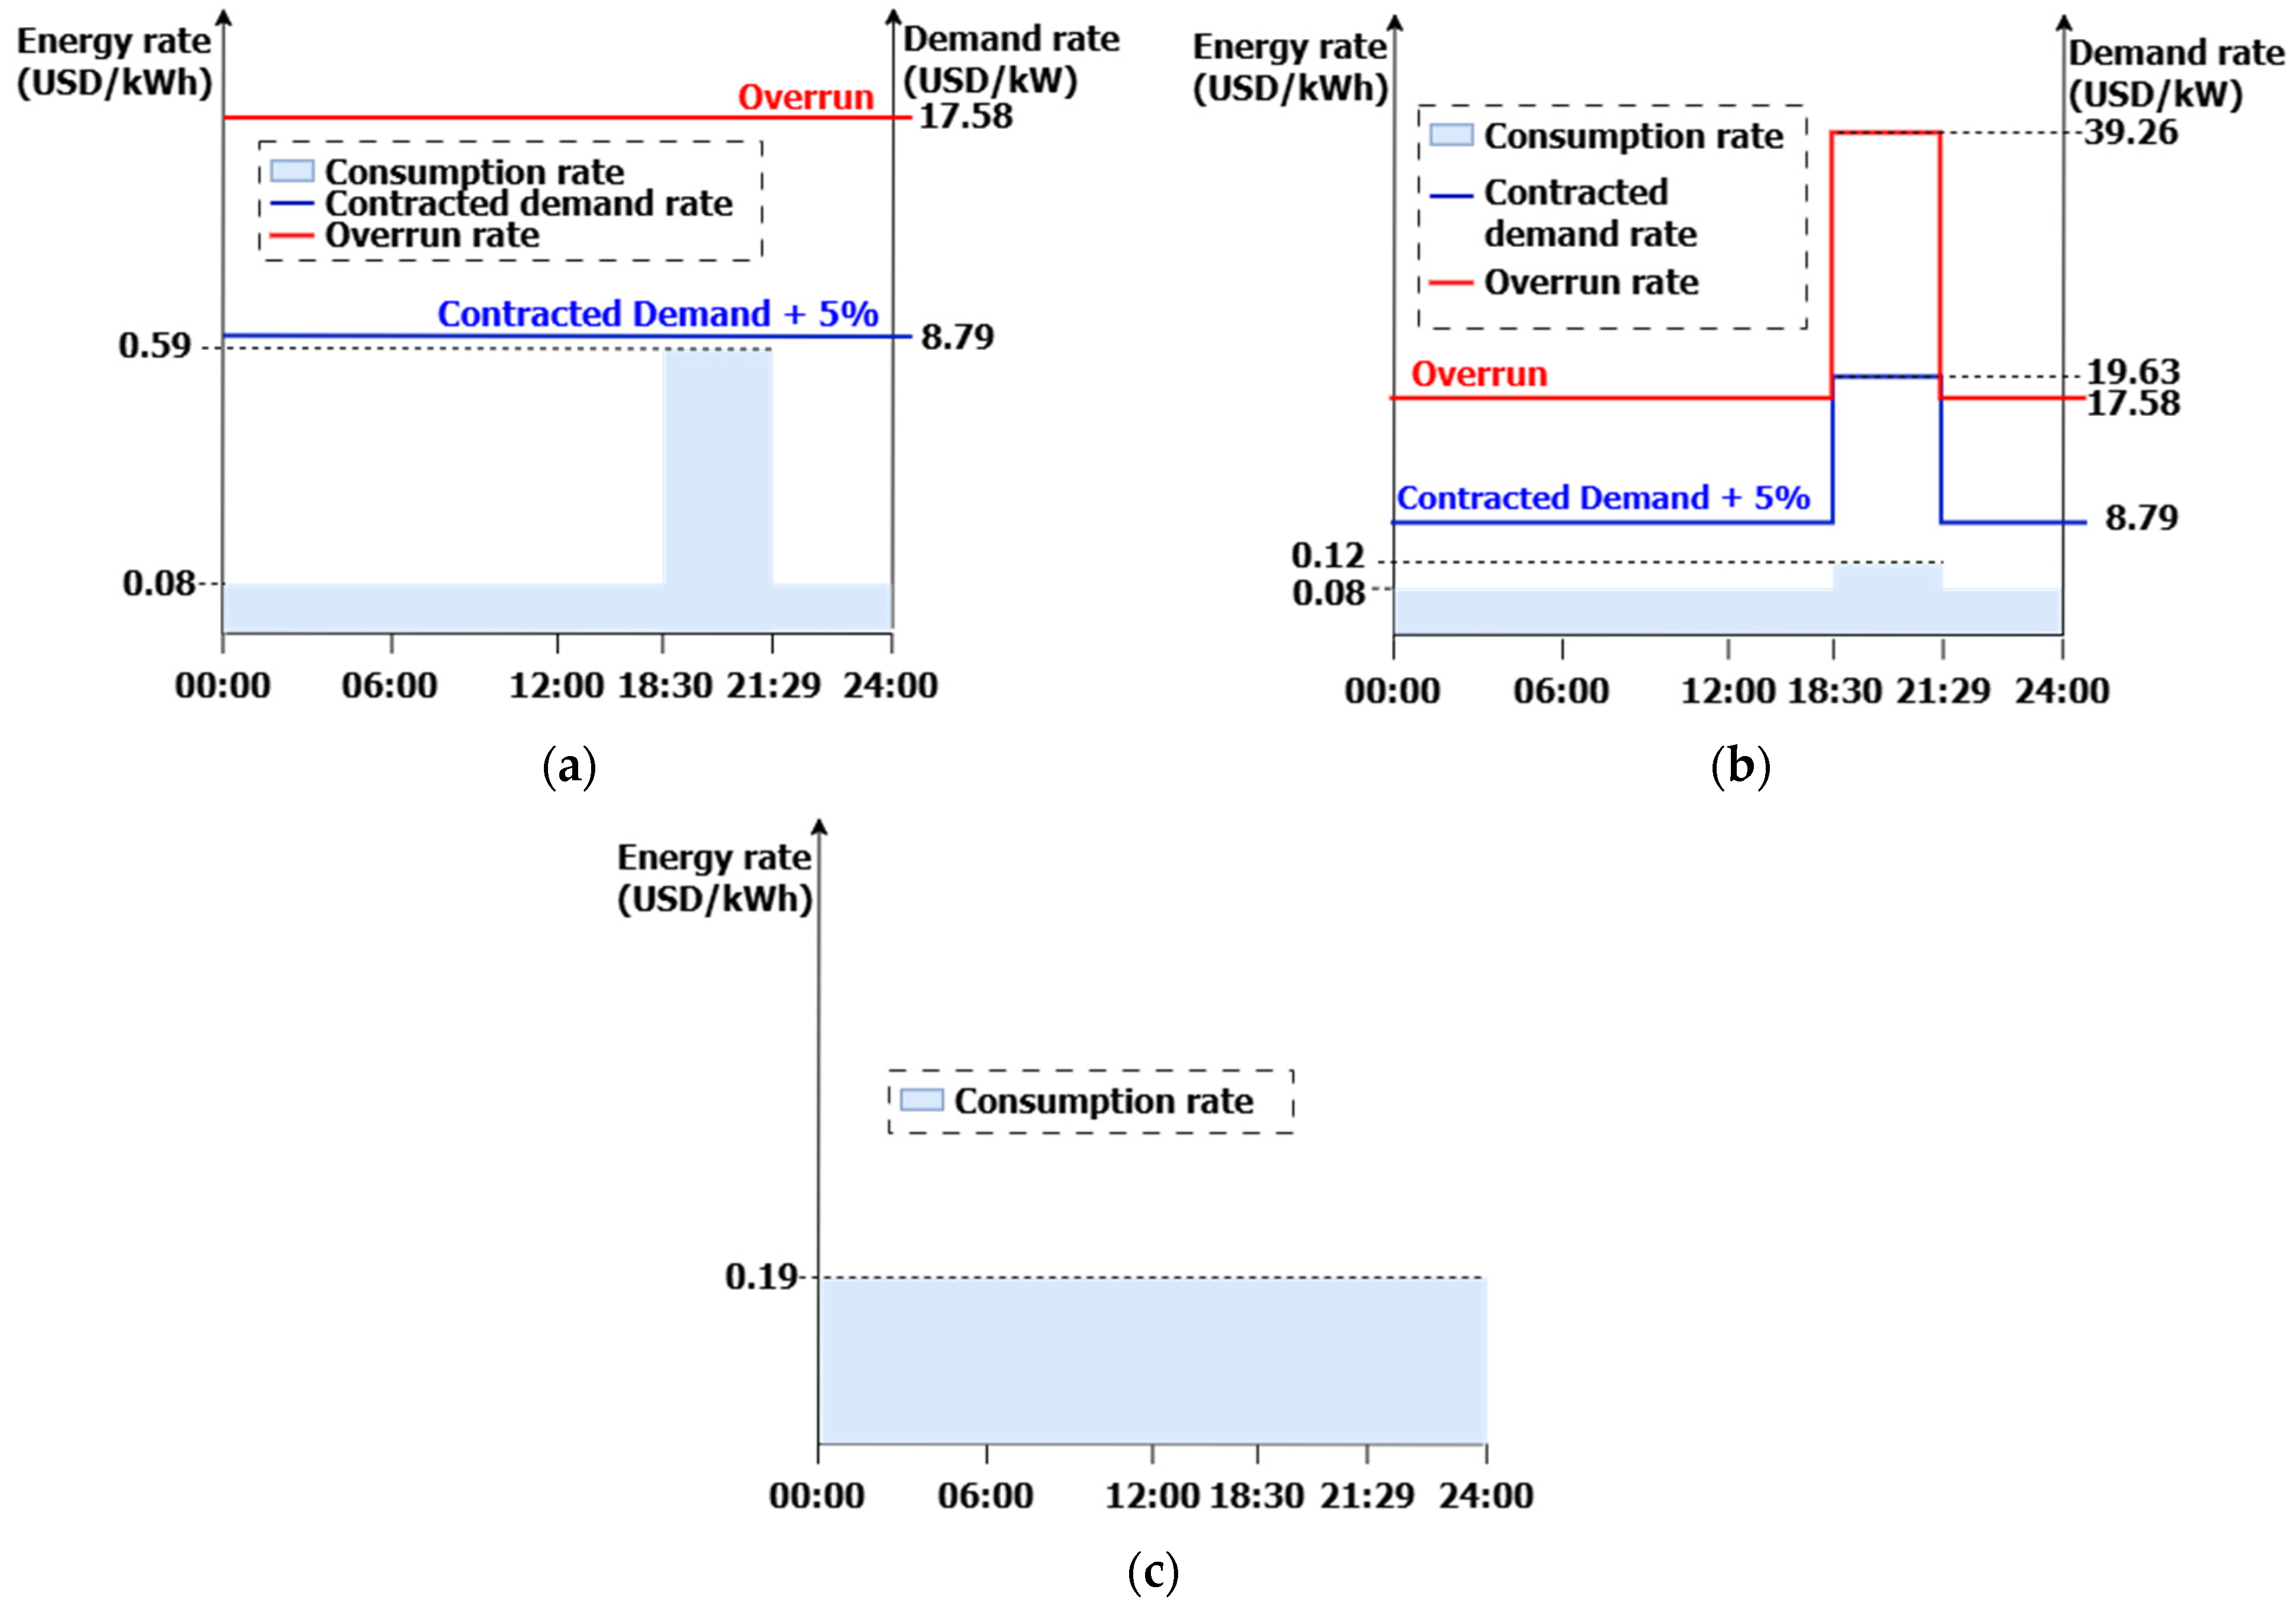
Beyond Equations (1)–(9), it is noted that the applicable rates diverge according to the tariff category and application type. Figure 1 illustrates the variations in consumption and demand prices for each category, detailing the fluctuations by time-of-use block. Reference values follow ANEEL definitions for the utility provider Equatorial Pará, based on the official database of electricity distribution tariffs, which provides the applicable Tariff for the Use of the Distribution System (TUSD), Energy Tariff (TE), and their tariff components for Brazilian distribution utilities [36].
To accurately reflect the Brazilian regulatory mechanisms, the final billed cost ( C O S T f i n a l ) must incorporate the applicable taxes: PIS, COFINS, and ICMS [37]. Since DSManager is designed to operate nationwide, these rates are not hardcoded. ICMS rates vary by state (e.g., 19% in the state of Pará), and PIS/COFINS rates fluctuate monthly based on the utility’s financial balance. Therefore, the tool automatically extracts these historical rates directly from the input billing database.
The taxes are calculated using a gross-up formulation. The ICMS base incorporates the prior effect of PIS and COFINS, as expressed in Equation (10):
C O S T f i n a l = C O S T b a s e 1 t P I S t C O F I N S 1 t I C M S
where C O S T b a s e represents the pre-tax sum of the energy, active power demand, and overrun costs for the selected tariff modality; t P I S , t C O F I N S , and t I C M S are the applicable monthly percentage tax rates extracted from the invoices.
Furthermore, an important regulatory exception is implemented in the model regarding the ICMS incidence on the contracted demand. According to Brazilian tax rules, ICMS applies only to the effectively utilized service. Thus, in scenarios where the contracted demand is higher than the measured demand, the base cost calculation bills the consumer for the full contracted value, but the ICMS is levied exclusively on the measured demand. The unutilized capacity (the difference between the contracted and measured demand) is exempt from ICMS. This specific tax treatment ensures that the optimized cost evaluations exactly mirror real-world billing.
This tax treatment is consistent with Brazilian jurisprudence on contracted electricity demand, according to which ICMS should be associated with the demand effectively used rather than with merely reserved capacity [38].

2.5. Contracted Demand Definition

Under binomial tariff modalities, the definition of contracted demand is a critical decision variable because it directly affects the total electricity bill. If the contracted value is oversized, the consumer pays for unused reserved capacity. If it is undersized, the probability of incurring overrun charges increases. In addition, as indicated in Equations (4) and (8), whenever measured demand exceeds 105% of the contracted value, a penalty is applied. Therefore, inadequate sizing of contracted demand leads to financial inefficiencies and justifies the use of formal decision-support methods.

2.5.1. Maximum Recorded Demand Method

One practical criterion for defining contracted demand is the Maximum Recorded Demand (MRD) method, recommended in the Brazilian Ministry of Economy’s energy management guidelines. The method consists of analyzing the historical demand records of the previous 12 months, identifying the Maximum Recorded Demand for the period, and adjusting the contract accordingly [39].
In the present study, the MRD criterion was implemented by setting the contracted demand such that the historical maximum demand exactly matches the 5% regulatory tolerance limit before overrun penalties apply, as expressed by Equation (11). This approach optimizes the base contract cost while securely accommodating the historical peak within the unpenalized margin.

2.5.2. Grid Search Method

As an alternative to MRD, contracted demand was defined through an exhaustive Grid Search procedure [40]. This approach performs a deterministic search over the discrete contracted-demand domain. Although grid-based search may become computationally inefficient in high-dimensional problems, it is appropriate here because the decision space is low-dimensional, integer-bounded, and restricted to the empirical range of observed demand values [41]. Due to the non-linear and discontinuous nature of Brazilian billing regulations, especially the overrun penalty triggered when measured demand exceeds 105% of the contracted value, direct analytical or LP-based formulations would require additional piecewise linearization or mixed-integer reformulation. Given the low-dimensional and discrete nature of the present problem, Grid Search provides a transparent and exhaustive alternative for evaluating all candidate contracted-demand values within the empirical operating range.
For the Green modality, candidate contracted-demand values were evaluated over a discrete one-dimensional grid bounded by the minimum and maximum measured demand recorded in the previous 12 months, using a step of 1 kW and integer-valued candidates only. For the Blue modality, the search was extended to a two-dimensional grid composed of all integer peak/off-peak candidate pairs within the corresponding empirical demand ranges. For each candidate configuration, DSManager computed the annual billed cost including TUSD and TE components, taxes, unused contracted-demand treatment, and overrun penalties. The optimal contracted demand was defined as the candidate configuration yielding the minimum annual billed cost within the evaluated grid.

3. Tool Development and Computational Implementation

DSManager was developed as a modular decision-support tool for tariff analysis and contracted-demand optimization. The software was implemented in Python (version 3.14.4), selected due to its robust scientific-computing ecosystem, and was structured in three main layers: data input, processing, and visualization. The Pandas (version 3.0.2) library was adopted for vectorized manipulation of billing and tariff data, while Streamlit (version 1.57.0) was used to build the web-based user interface. The computational workflow relies on the Python scientific-computing ecosystem. Pandas provides labeled data structures suitable for tabular and time-indexed billing records [42], while NumPy (version 2.4.4) supports efficient vectorized array operations [43]. Streamlit was adopted to convert the analysis routines into an interactive web-based interface for non-specialist users [44]. This architecture allows the regulatory and mathematical formulations presented in Section 2 to be operationalized in a reproducible and user-oriented environment.

3.1. Computational Implementatio of Contracted Demand

The software uses multidimensional data structures based on Pandas DataFrames. Two input modes were implemented. In the Manual Simulator, the user directly inserts the historical values of demand and energy consumption for peak and off-peak periods through a grid-based interface. This mode is intended for individual and rapid analyses. At least 12 months of measurement data are required so that the analysis captures the seasonal behavior of the consumer unit.
In the Bill Analysis mode, the software processes multiple consumer units. In this case, the tariff history is stored in Parquet format, which was chosen because of its better compression performance and lower latency in large-volume billing queries when compared with conventional formats such as CSV or Excel. Since the extraction of billing data from grouped invoices depends on an external PDF-reading module, this mode is currently adjusted to operate with the Equatorial Pará billing structure.

3.2. Computational Workflow

The DSManager processing engine is fully vectorized. Instead of performing sequential billing calculations case by case, the software simultaneously applies the tariff and tax structures to the annual load profile of each consumer unit. This design reduces computation time and enables rapid comparison among contract alternatives.
For each analysis, DSManager evaluates the Green and Blue tariff modalities and compares their corresponding annual total billed costs. In this way, the “best tariff modality” is determined through comparative annual-cost assessment, rather than through a separate optimization problem.
For the MRD implementation, the software identifies the highest measured demand in the previous 12 months for the tariff period under analysis and applies the 5% safety factor defined in Equation (11). This produces a conservative contracted-demand recommendation intended to reduce overrun risk.
D c o n t = n p . c e i l D m a x , 12 m 1.05
where D c o n t is the contracted demand for the analyzed tariff period; D m a x , 12 m is the highest demand measured in the last 12 months for that period; and n p . c e i l ( ) represents the mathematical ceiling function, which rounds the calculated value up to the nearest integer kW.
For the Grid Search implementation, the optimization domain was restricted to the empirical operating range observed in the previous 12-month billing history, thereby avoiding unrealistic contract proposals outside the historical demand envelope and preserving managerial interpretability. In the Green modality, the optimization problem involves a single decision variable, whereas in the Blue modality, it involves two decision variables, corresponding to peak and off-peak contracted demand.
Candidate values were evaluated exhaustively over the discrete grid defined by the minimum and maximum measured demand in the relevant tariff period, using integer-valued steps of 1 kW. For each candidate configuration, DSManager calculates the final billed cost, including tariff charges, tax effects, unused contracted-demand treatment, and overrun penalties. The optimal contracted demand is then defined as the configuration that yields the minimum annual total billed cost within the evaluated grid. Thus, the software operationalizes the theoretical distinction established in Section 2: MRD provides a conservative heuristic estimate, while Grid Search performs an explicit economic evaluation of all candidate demand values within the defined empirical range.
In terms of computational time, this vectorized architecture ensures high execution efficiency. For a standard 12-month billing analysis, evaluating all candidate combinations of contracted demand, in both the Green and Blue tariff modalities, requires only a few milliseconds per consumer unit. This near-instantaneous execution avoids computational bottlenecks, allowing for dynamic user interaction in the Streamlit web interface.

3.3. Interface and User Interaction

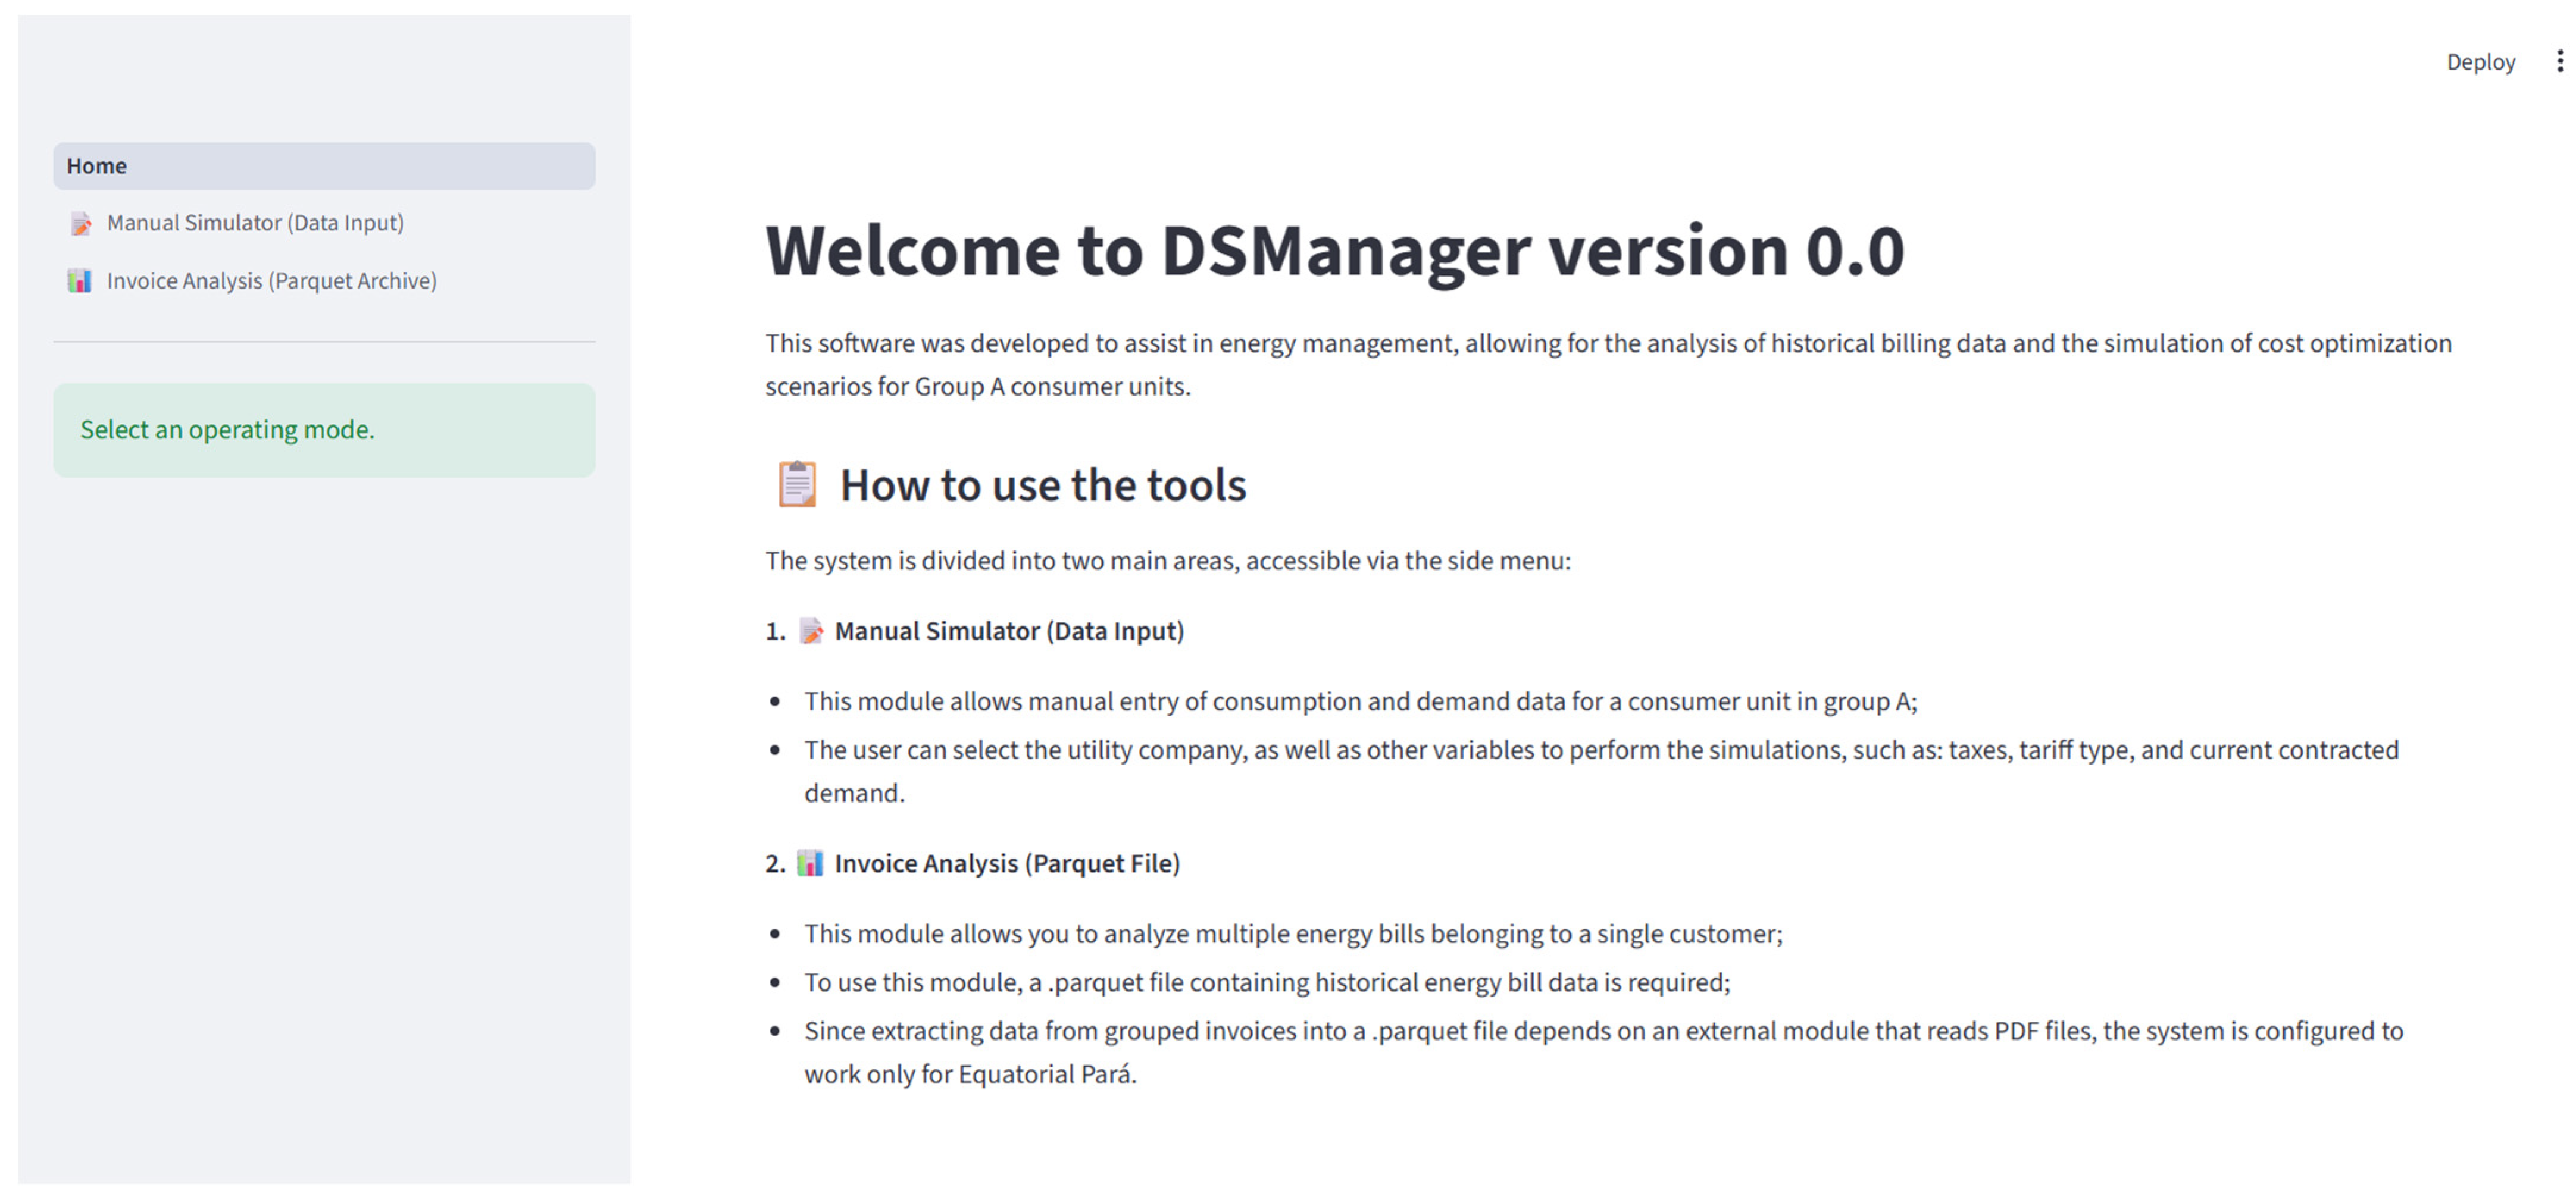
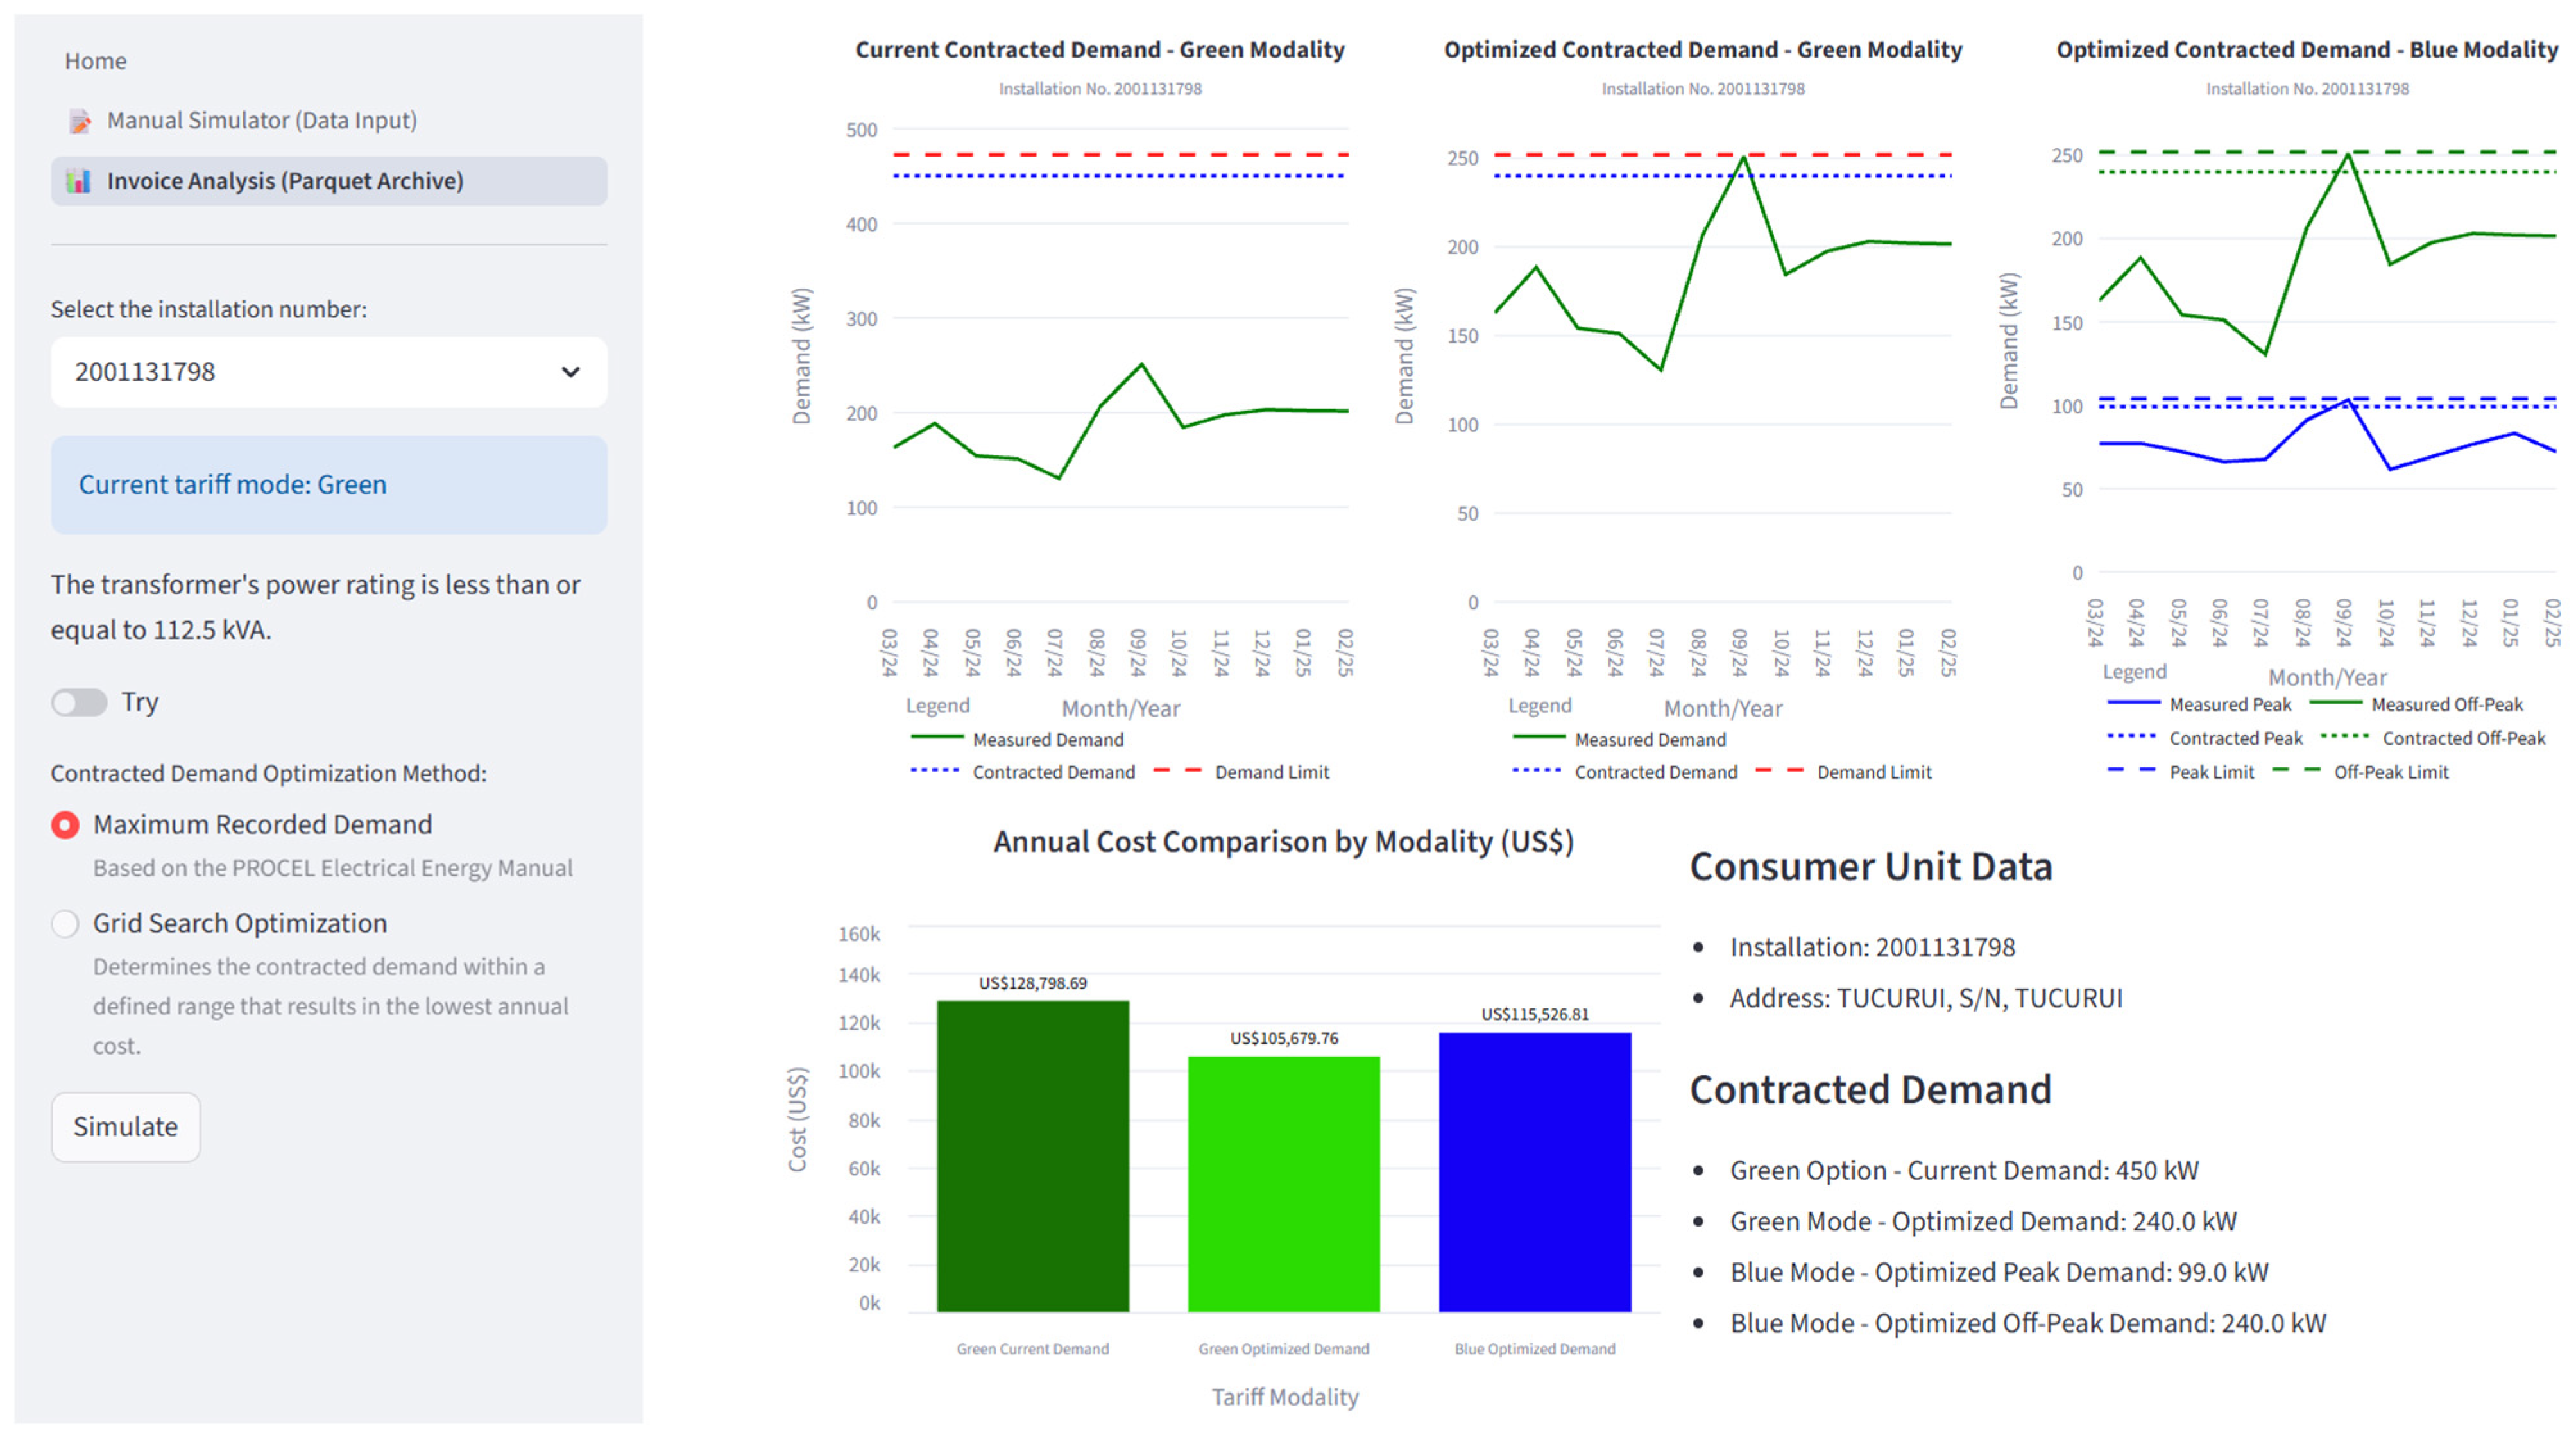
The visualization layer was implemented in Streamlit, allowing direct interaction between the computational engine and the user interface. Through this environment, the user may modify input parameters, switch between input modes, and rerun the analysis immediately. Figure 2 presents the DSManager home screen and the sidebar used to select the operating mode. Figure 3 illustrates the bill-analysis interface and the way optimized results are presented to the user.

3.4. Transition to Validation

Based on the regulatory formulation, the cost models, and the computational workflow described above, DSManager was validated using real billing data from consumer units located in the Equatorial Pará concession area. The validation strategy combined retrospective simulation and real contractual implementation in order to assess both model consistency and practical economic impact.

4. Methodology and Validation

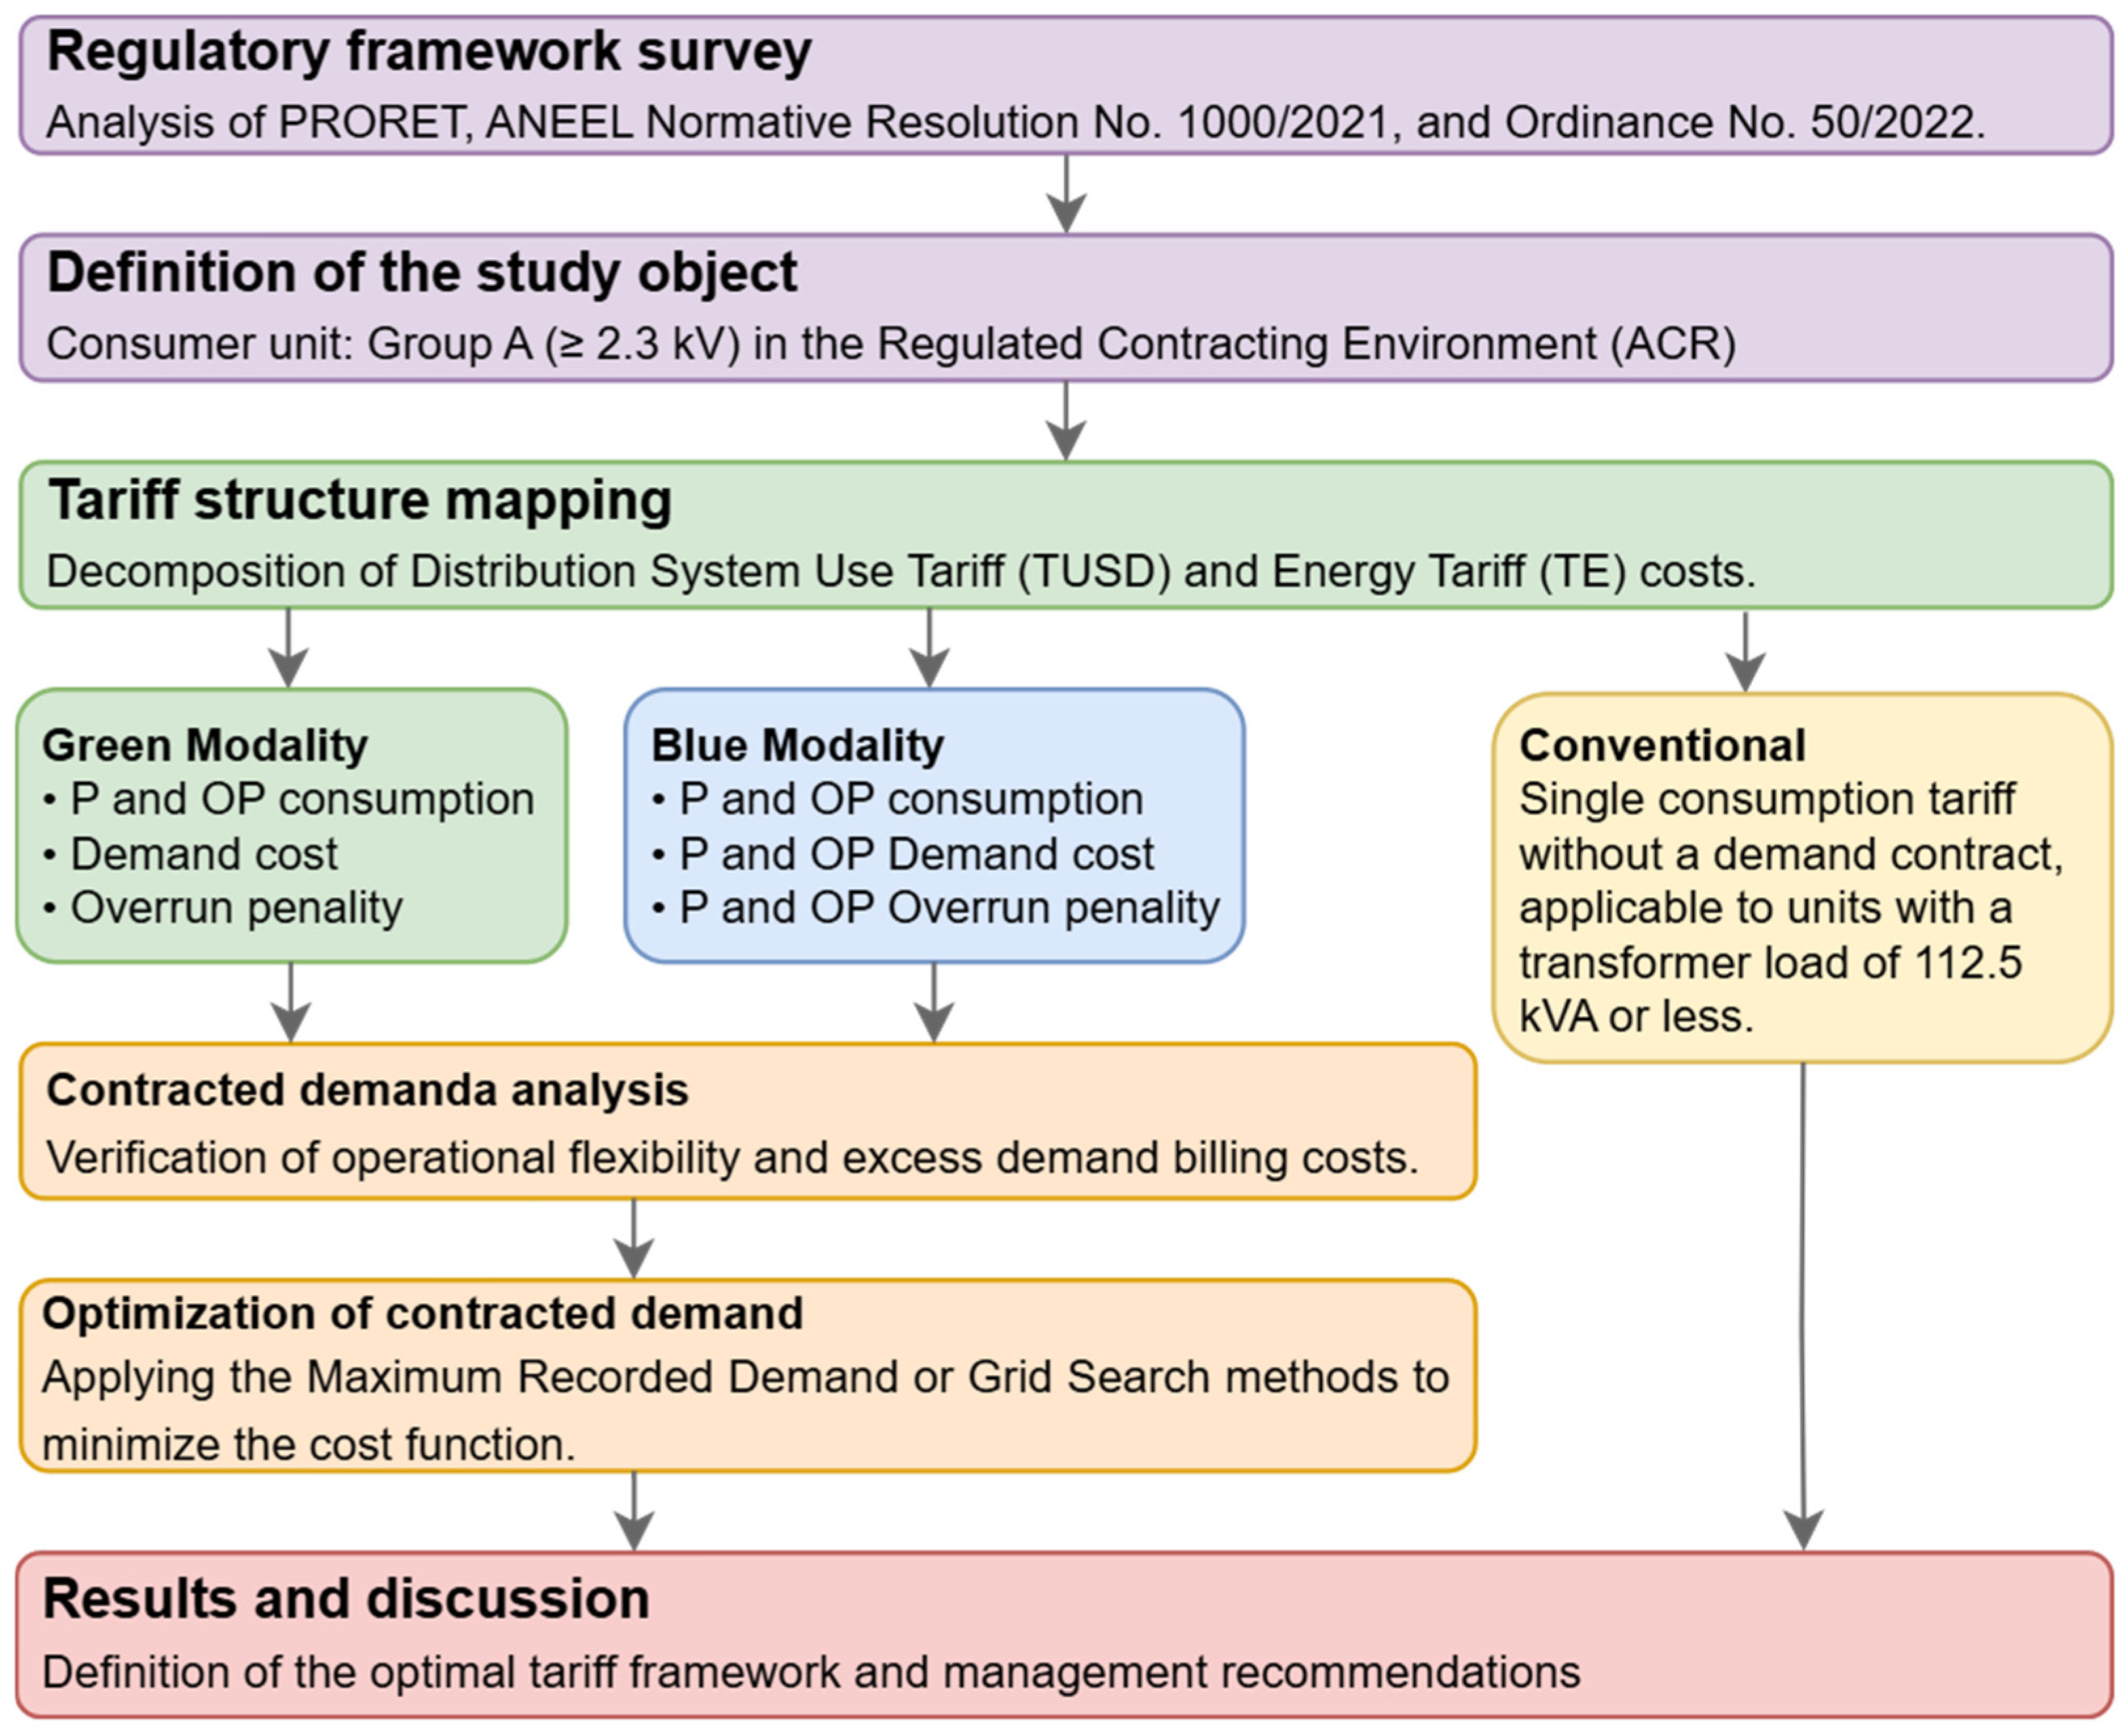
The methodological workflow adopted in this study is summarized in Figure 4. The validation strategy was designed to assess two complementary dimensions of the proposed framework. First, it evaluates whether DSManager provides internally consistent recommendations when the optimized contractual configuration is transferred to a subsequent unseen billing cycle. Second, it verifies whether those recommendations can support real contractual decisions with measurable economic impact under actual operating conditions. To this end, the tool was applied to two Group A consumer units located in the Equatorial Pará concession area. In both cases, DSManager processed historical billing and demand data, evaluated the Green and Blue tariff modalities, and compared two contracted-demand definition strategies: the Maximum Recorded Demand (MRD) criterion and the Grid Search cost-minimization approach. The analysis for each consumer unit followed the same sequence: (i) compilation of the historical billing horizon; (ii) simulation of tariff-modality and contracted-demand alternatives; (iii) identification of the least-cost contractual configuration; and (iv) verification of the recommendation either in a subsequent unseen billing cycle or through actual implementation with the utility.
The results were evaluated in terms of recommended contracted demand, selected tariff modality, billed cost for the analysis horizon, and projected or observed savings relative to the unchanged contract. This validation design makes it possible to assess not only whether the framework identifies economically superior contractual configurations, but also whether the resulting recommendations remain practically relevant when transferred to out-of-sample conditions or real-world contract revision.
Figure 4 summarizes the methodological sequence applied in the study. The framework begins with the collection and organization of billing and demand data for the consumer unit under analysis. These data are then processed by DSManager, which evaluates the applicable tariff modalities and calculates the billed cost associated with alternative contracted-demand configurations. Based on this procedure, the software identifies the contractual arrangement that minimizes the billed cost under the regulatory structure considered. Finally, the resulting recommendation is validated either retrospectively, through application to a subsequent billing cycle, or operationally, through real contractual implementation and ex post comparison of the billing outcome.

4.1. Case-Study Design

Two consumer units were selected because they exhibited clear potential for contractual optimization, either due to apparent demand oversizing or because their billing history allowed consistent ex post evaluation of alternative contractual decisions. To preserve the identification structure adopted in the utility records, the units are referred to by installation number.
  • Installation No. 0010054117 was selected for retrospective validation. In this case, one 12-month billing cycle was used as the analysis horizon to determine the optimal tariff modality and contracted-demand values, and the resulting recommendation was then applied to a subsequent 12-month unseen period. Since no contractual revision was actually implemented for this consumer unit, this case provides a counterfactual validation setting in which the projected savings can be estimated by comparing the unchanged contract with the optimized alternatives.
  • Installation No. 2001131798 was selected for real-world validation. In this case, the recommendation generated by DSManager was effectively implemented with the utility, allowing the pre-intervention and post-intervention billing outcomes to be compared. This case, therefore, provides direct evidence of the practical economic effect of the proposed framework under actual operating conditions.
Taken together, the two-case design strengthens the validation strategy because it combines out-of-sample consistency assessment with observed results after real contractual intervention. In this way, the study evaluates both the analytical robustness and the applied usefulness of the proposed decision-support framework.

4.2. Retrospective Validation: Installation No. 0010054117

For Installation No. 0010054117, the data were divided into two consecutive intervals. The analysis period, from March 2024 to February 2025, was used to determine the optimal contracted-demand values and tariff modality. The validation period, from March 2025 to February 2026, was then used to test the recommendations under unseen billing data. Since no contractual change was actually implemented for this consumer unit, the second interval serves as a counterfactual validation scenario.
Figure 5 presents the measured demand behavior during the analysis period. The figure shows the annual variation in demand that served as the empirical basis for the optimization process, allowing DSManager to evaluate both tariff modalities and both contracted-demand strategies over a complete seasonal cycle. This step is essential because the adequacy of any contracted-demand recommendation depends on the ability of the historical series to represent the consumer unit’s annual operating pattern.
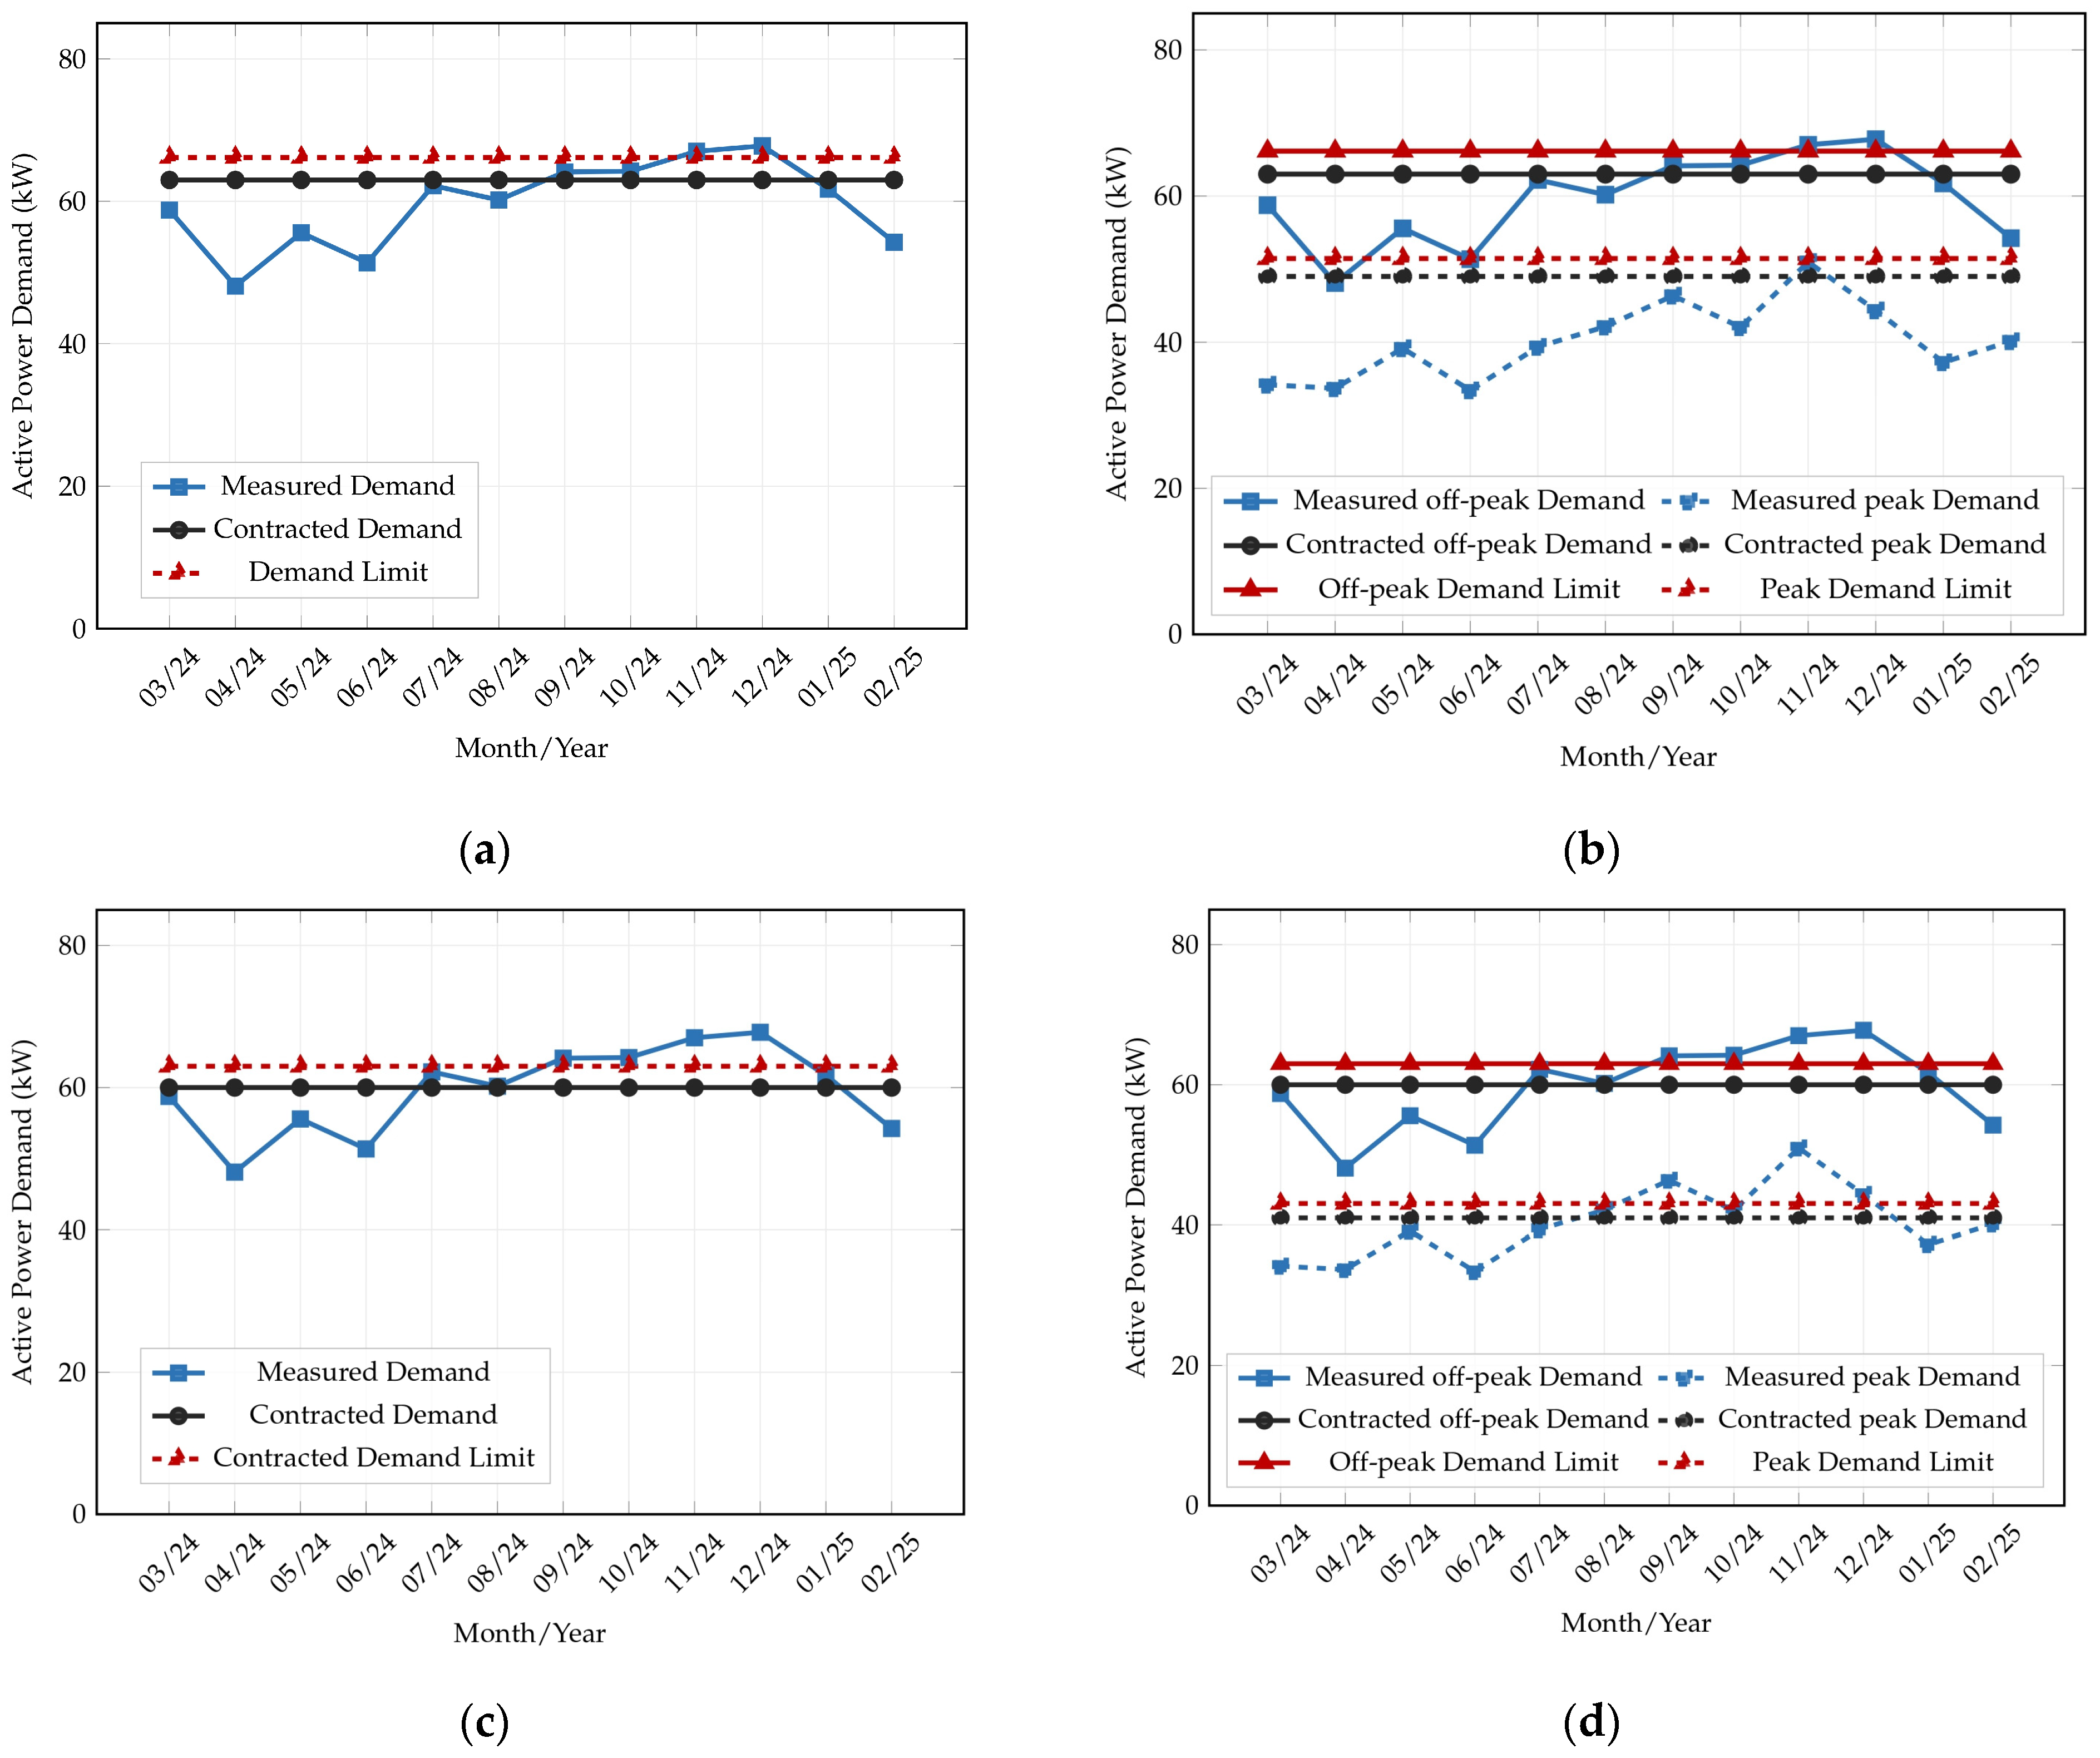
Based on this historical profile, DSManager generated the optimization results shown in Figure 6. Under the MRD criterion, the recommended contracted demand was 65 kW for the Green modality, while for the Blue modality, the recommended values were 49 kW for the peak period and 65 kW for the off-peak period.
Under Grid Search, the optimal values were slightly lower, namely 64 kW for the Green modality and 43 kW for the peak period plus 64 kW for the off-peak period in the Blue modality. These results indicate that, for this installation, the demand profile allowed both methods to converge to similar contractual values, with Grid Search identifying slightly more aggressive reductions, especially in the peak period.
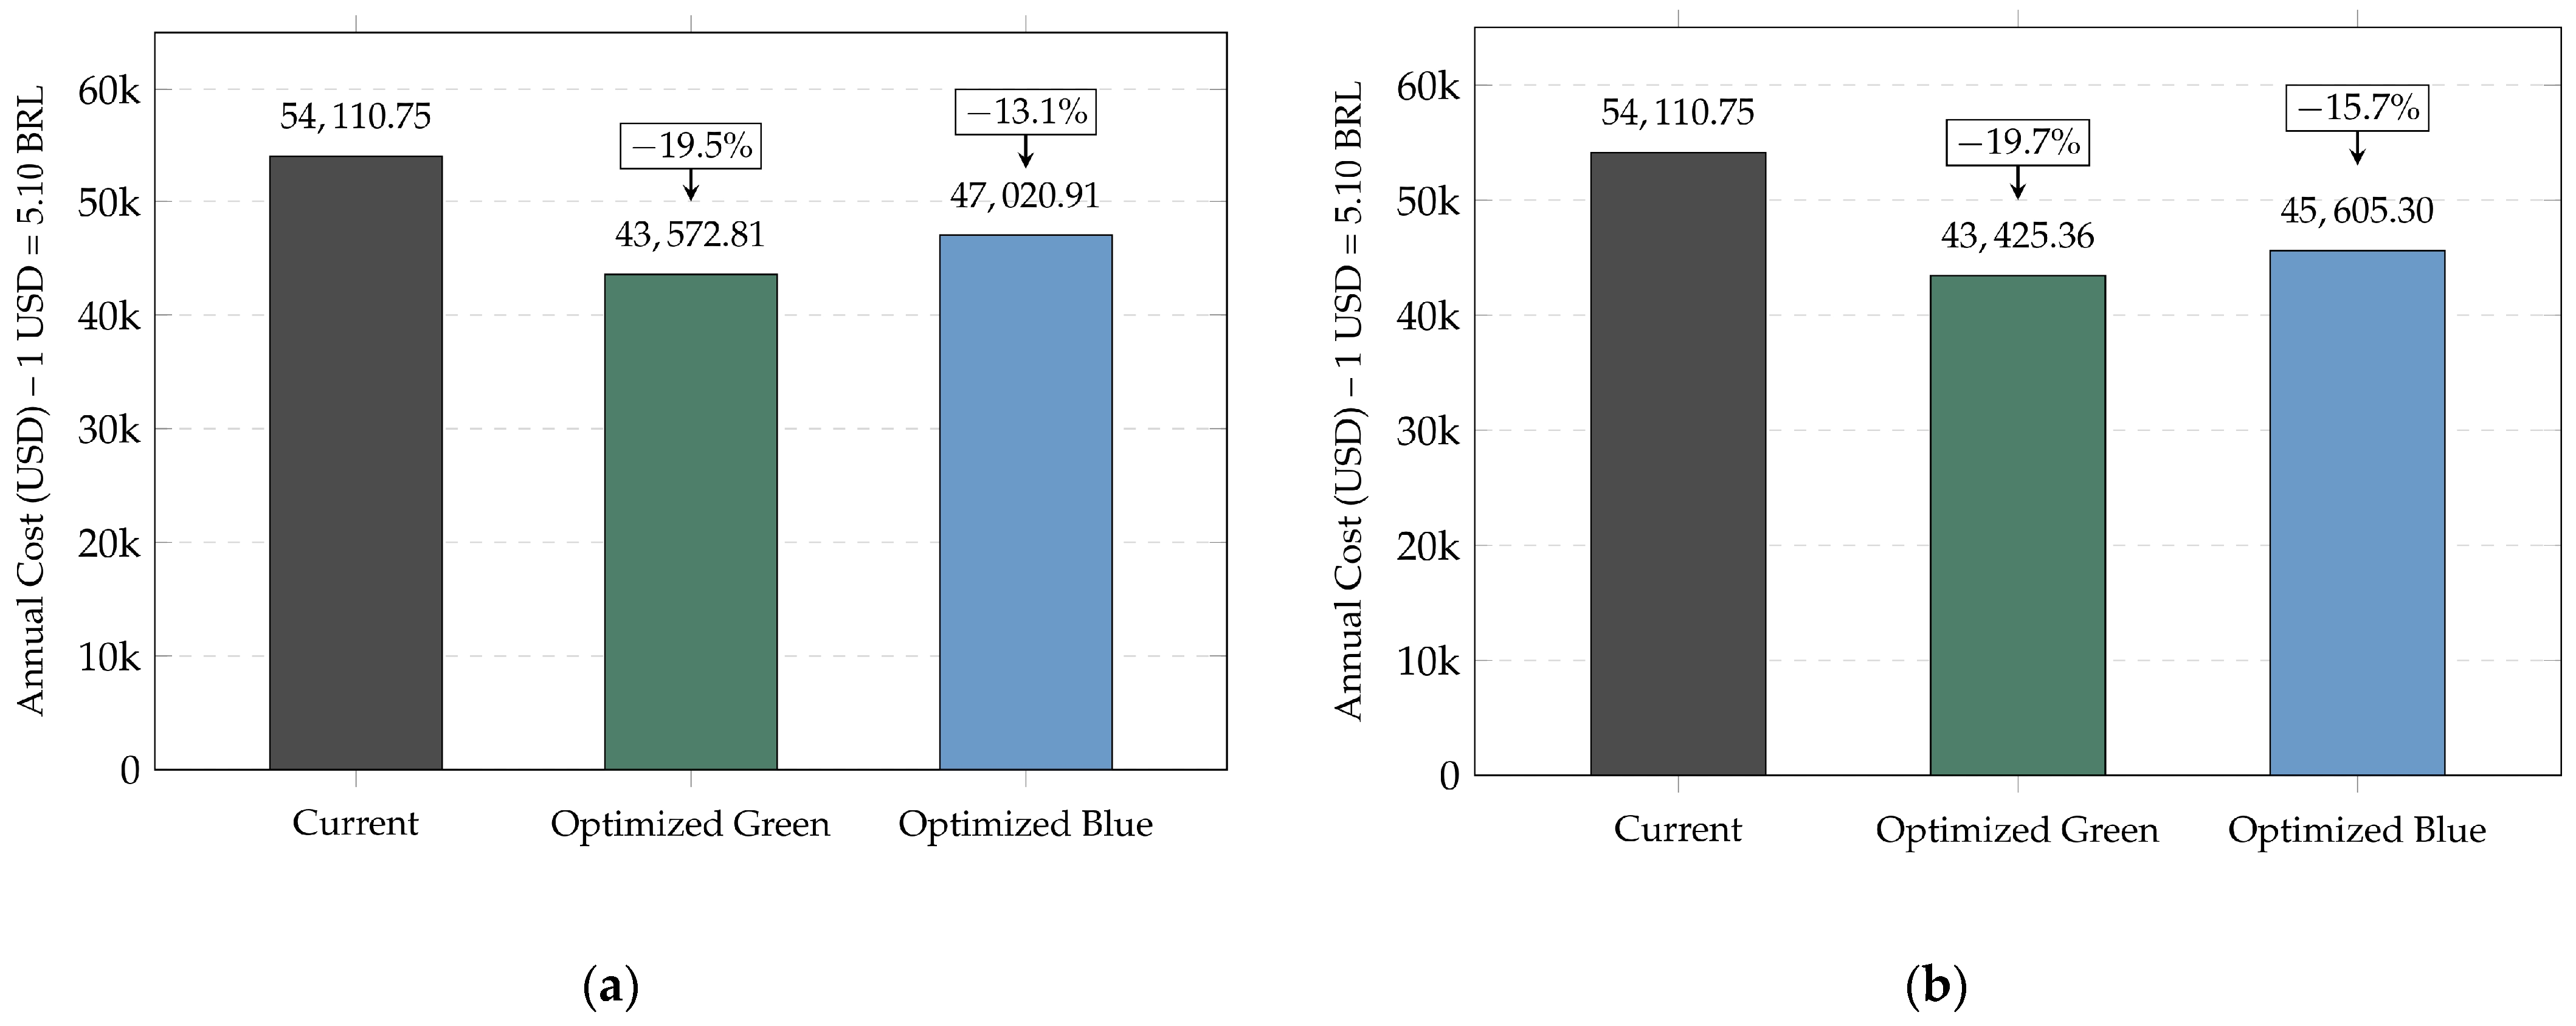
The economic implications of these recommendations are summarized in Figure 7, which compares the annual cost of each tariff modality under the MRD and Grid Search strategies. In both panels, the Green tariff modality produced the lowest annual cost. This result suggests that, for this particular installation, separating demand into peak and off-peak components under the Blue modality did not compensate for the additional cost structure. Moreover, because the annual demand variation was moderate, the difference between the MRD and Grid Search recommendations remained relatively small, which explains the close proximity of the final annual costs under the Green modality.
To verify whether these findings remained valid beyond the analysis interval, the optimized parameters were applied to the validation period, whose demand behavior is shown in Figure 8. In this new billing cycle, the contracted demand was not altered in practice, and the data therefore represent an out-of-sample period used exclusively to test the projected recommendations. The figure confirms that the demand profile remained within a comparable operating range, which supports the use of the second cycle as a consistency check for the tool.
The corresponding cost comparison is presented in Table 2, which contrasts the actual billed cost during the validation period with the estimated costs that would have resulted from the optimized contractual configurations. The table shows that the Green modality with Grid Search would again have produced the lowest cost. If the consumer had adopted the MRD recommendation, the projected saving for the validation period would have been US$9461.68 (BRL values converted to USD at an exchange rate of 5.10 (8 April 2026; Central Bank of Brazil)). If the Grid Search recommendation had been adopted instead, the projected saving would have increased to US$9554.20. Although the absolute annual costs differ between the analysis and validation periods due to changes in consumption and tax components, the relative ranking of the contractual alternatives remained stable. This result indicates that DSManager provides coherent recommendations when transferred from one annual billing cycle to the next.

4.3. Real-World Validation: Installation No. 2001131798

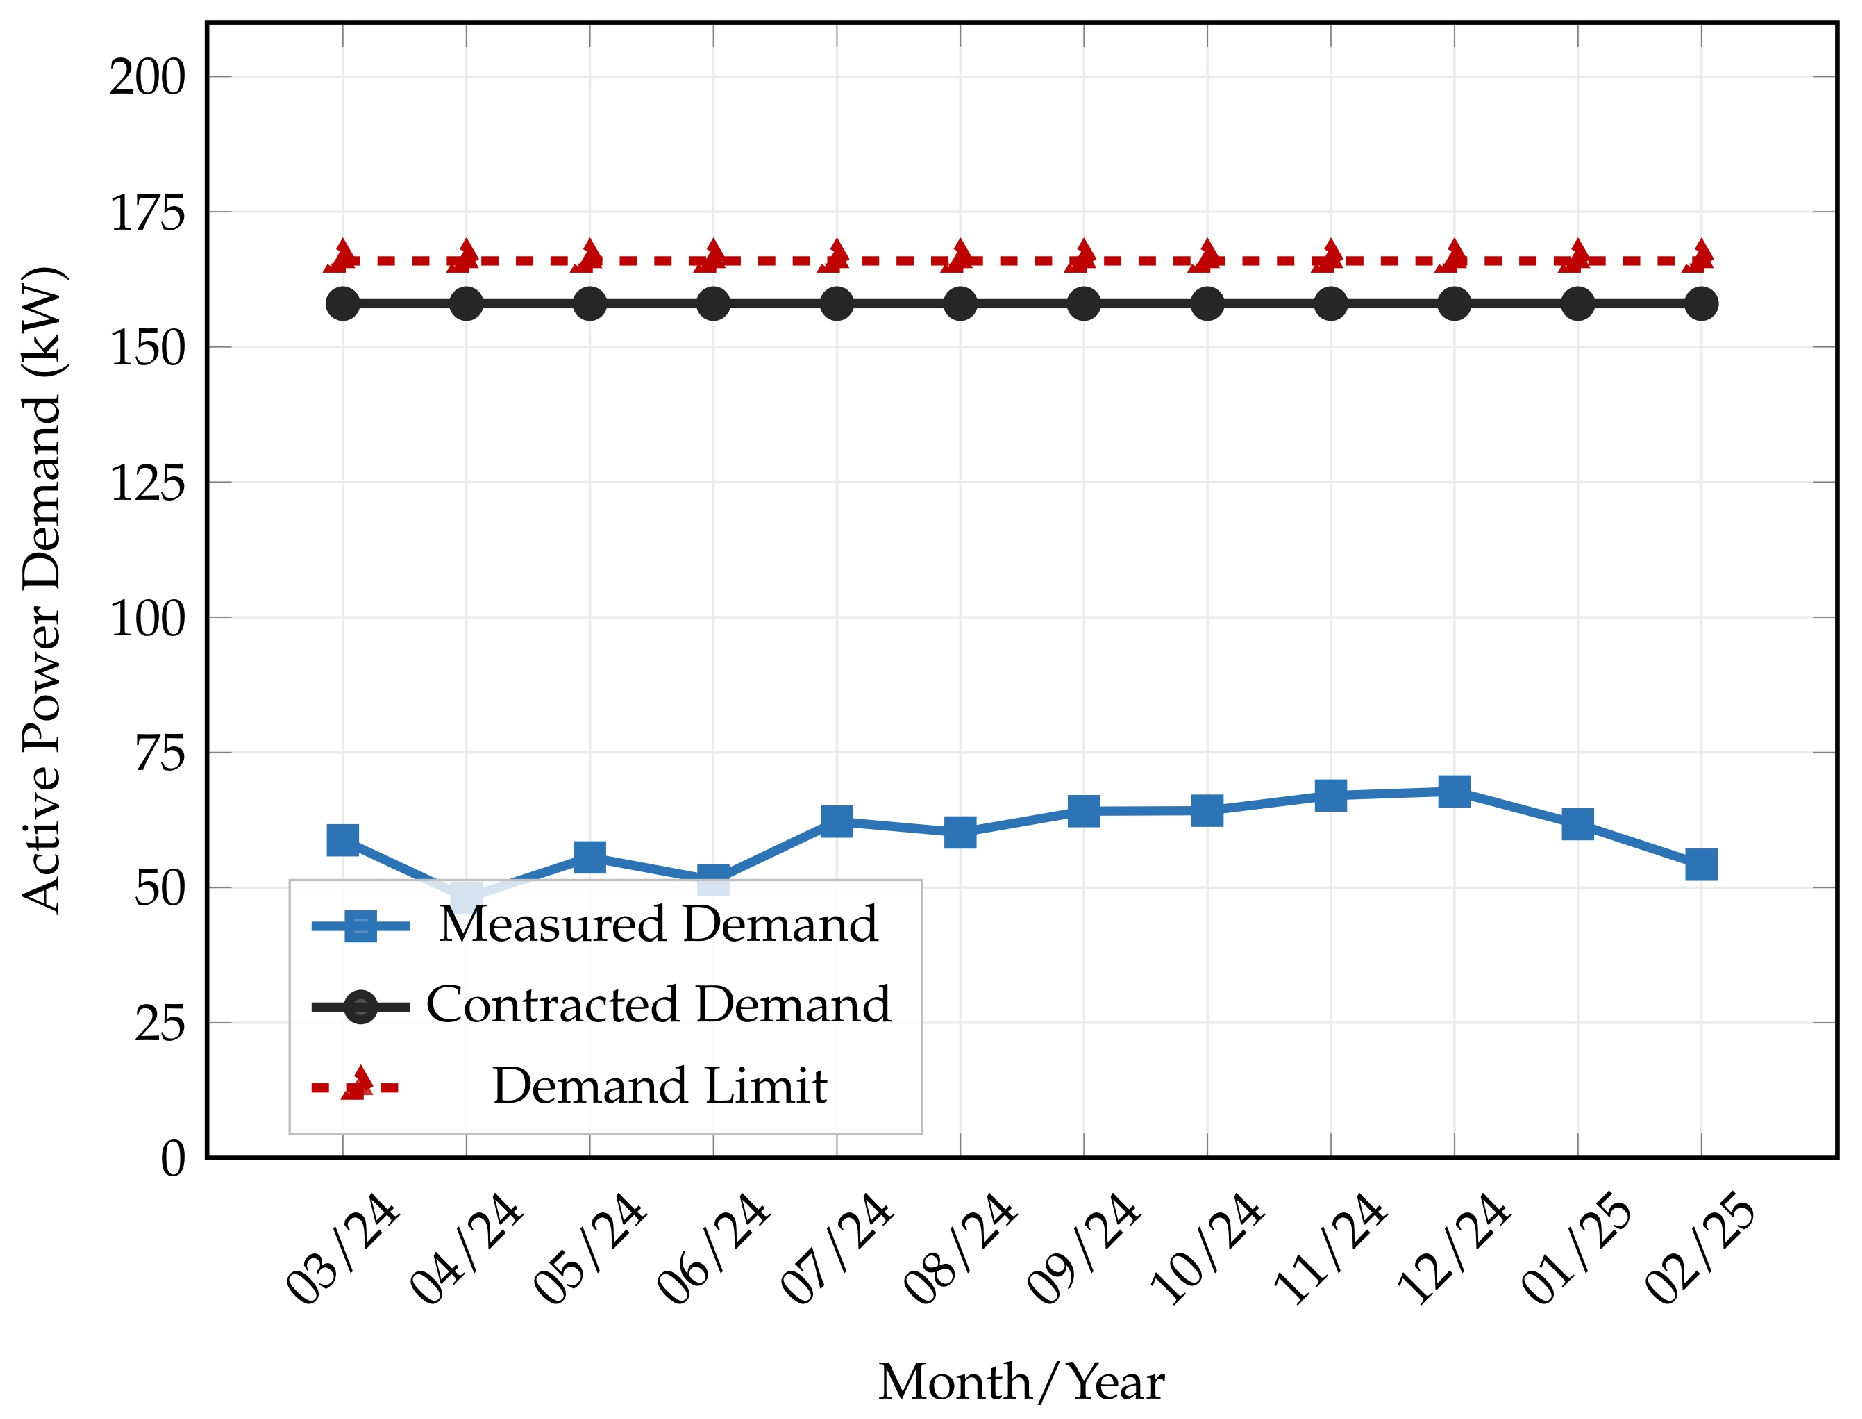
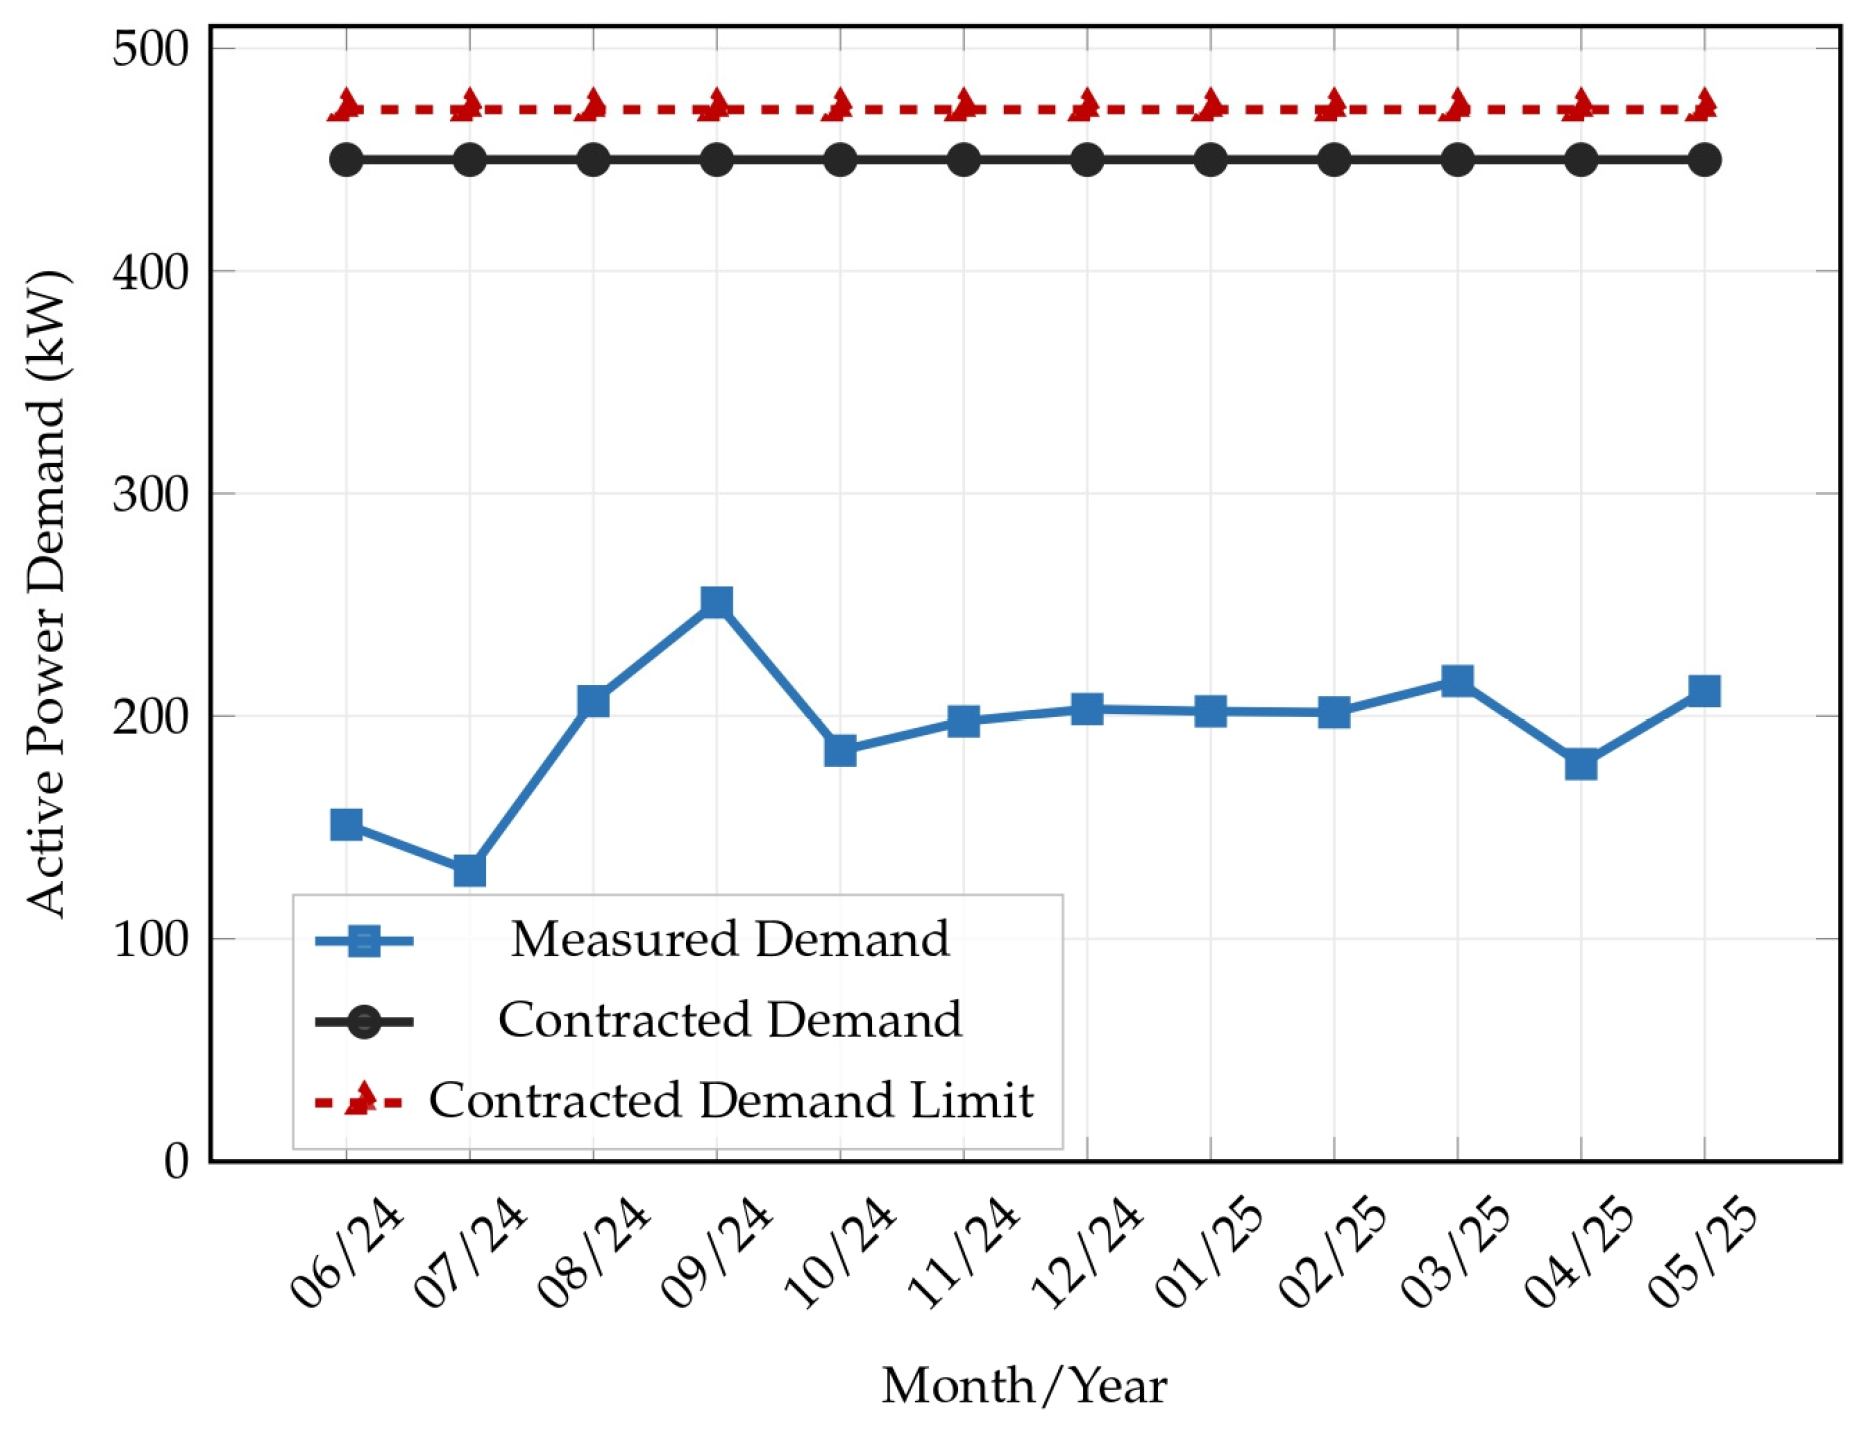
The second validation case was conducted using Installation No. 2001131798, for which DSManager recommendations were effectively implemented. The demand profile of the pre-intervention billing cycle is shown in Figure 9. In this period, the consumer unit operated under the Green tariff modality with a contracted demand of 450 kW. The figure makes clear that this value was substantially oversized in relation to the actual measured demand of the installation, indicating contractual inefficiency and unnecessary expenditure associated with unused reserved capacity.
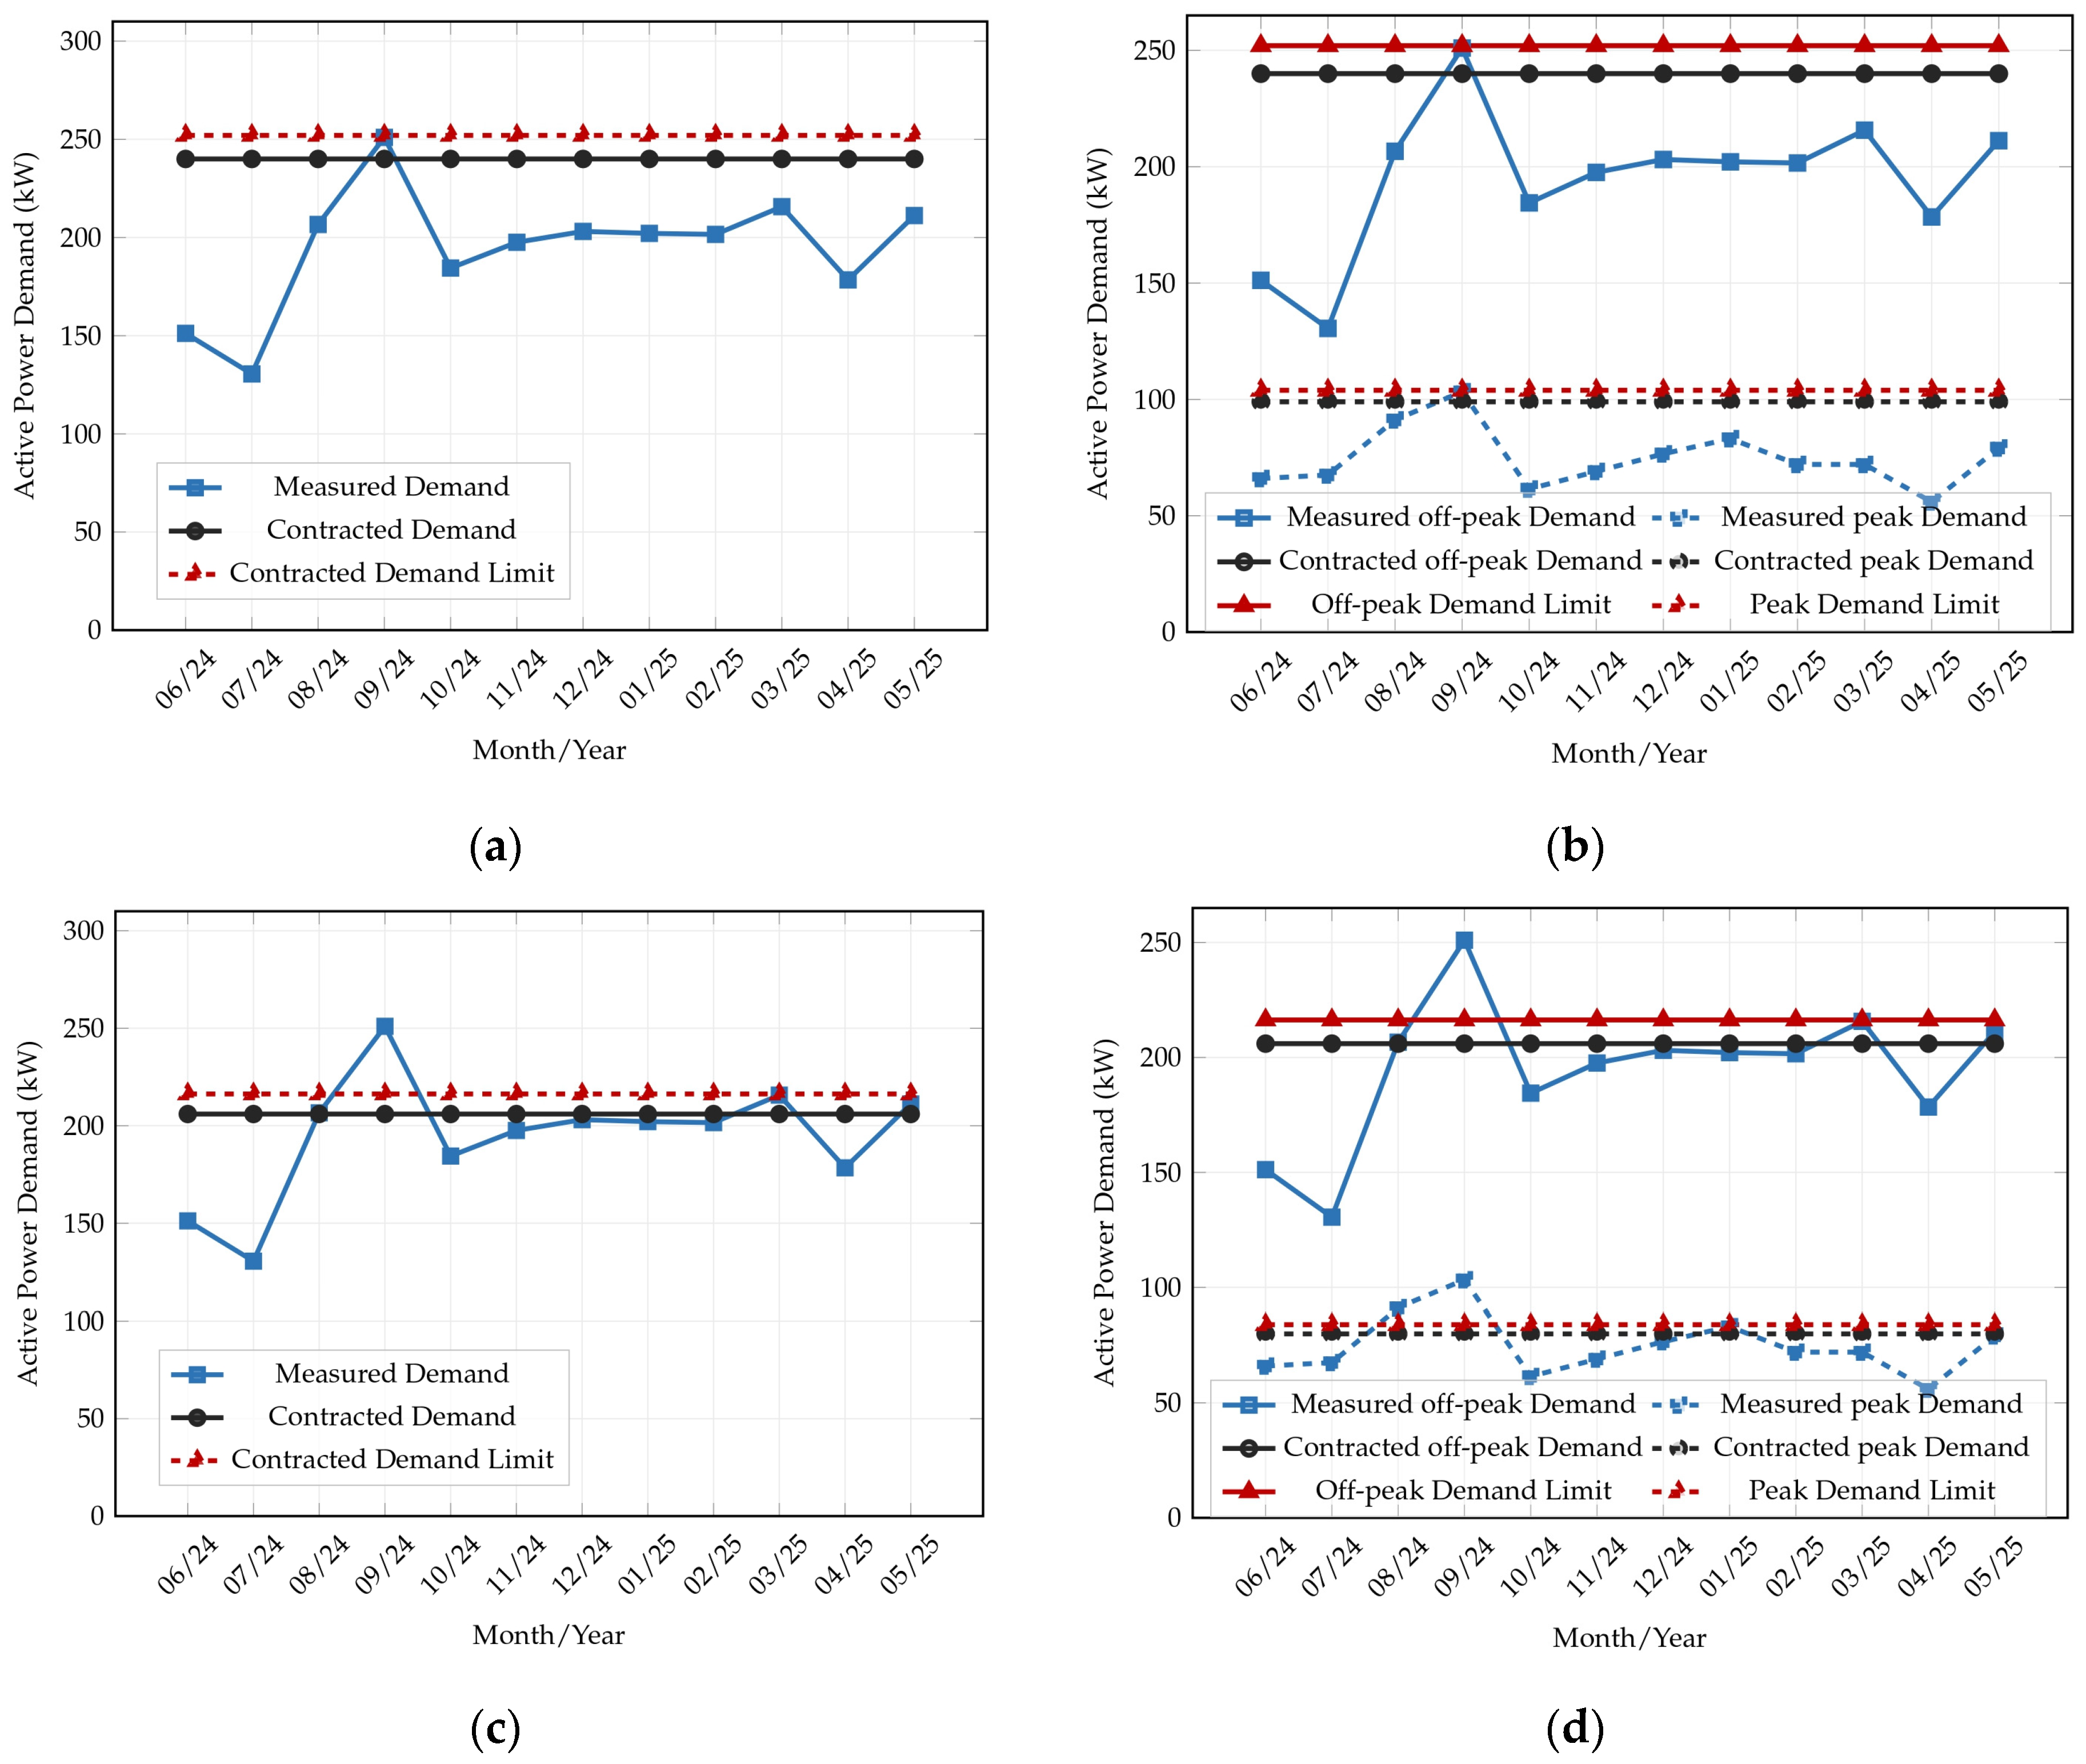
Using the historical profile shown in Figure 9, DSManager produced the optimization results presented in Figure 10. Under the MRD approach, the recommended contracted demand was 240 kW for the Green modality and 99 kW for the peak period, plus 240 kW for the off-peak period under the Blue modality. Under Grid Search, the software identified even lower values, namely 206 kW for the Green modality and 80 kW for the peak period, plus 206 kW for the off-peak period under the Blue modality. These results again indicate that the Green modality was more compatible with the demand behavior of the installation, while Grid Search provided the most economically aggressive recommendation.
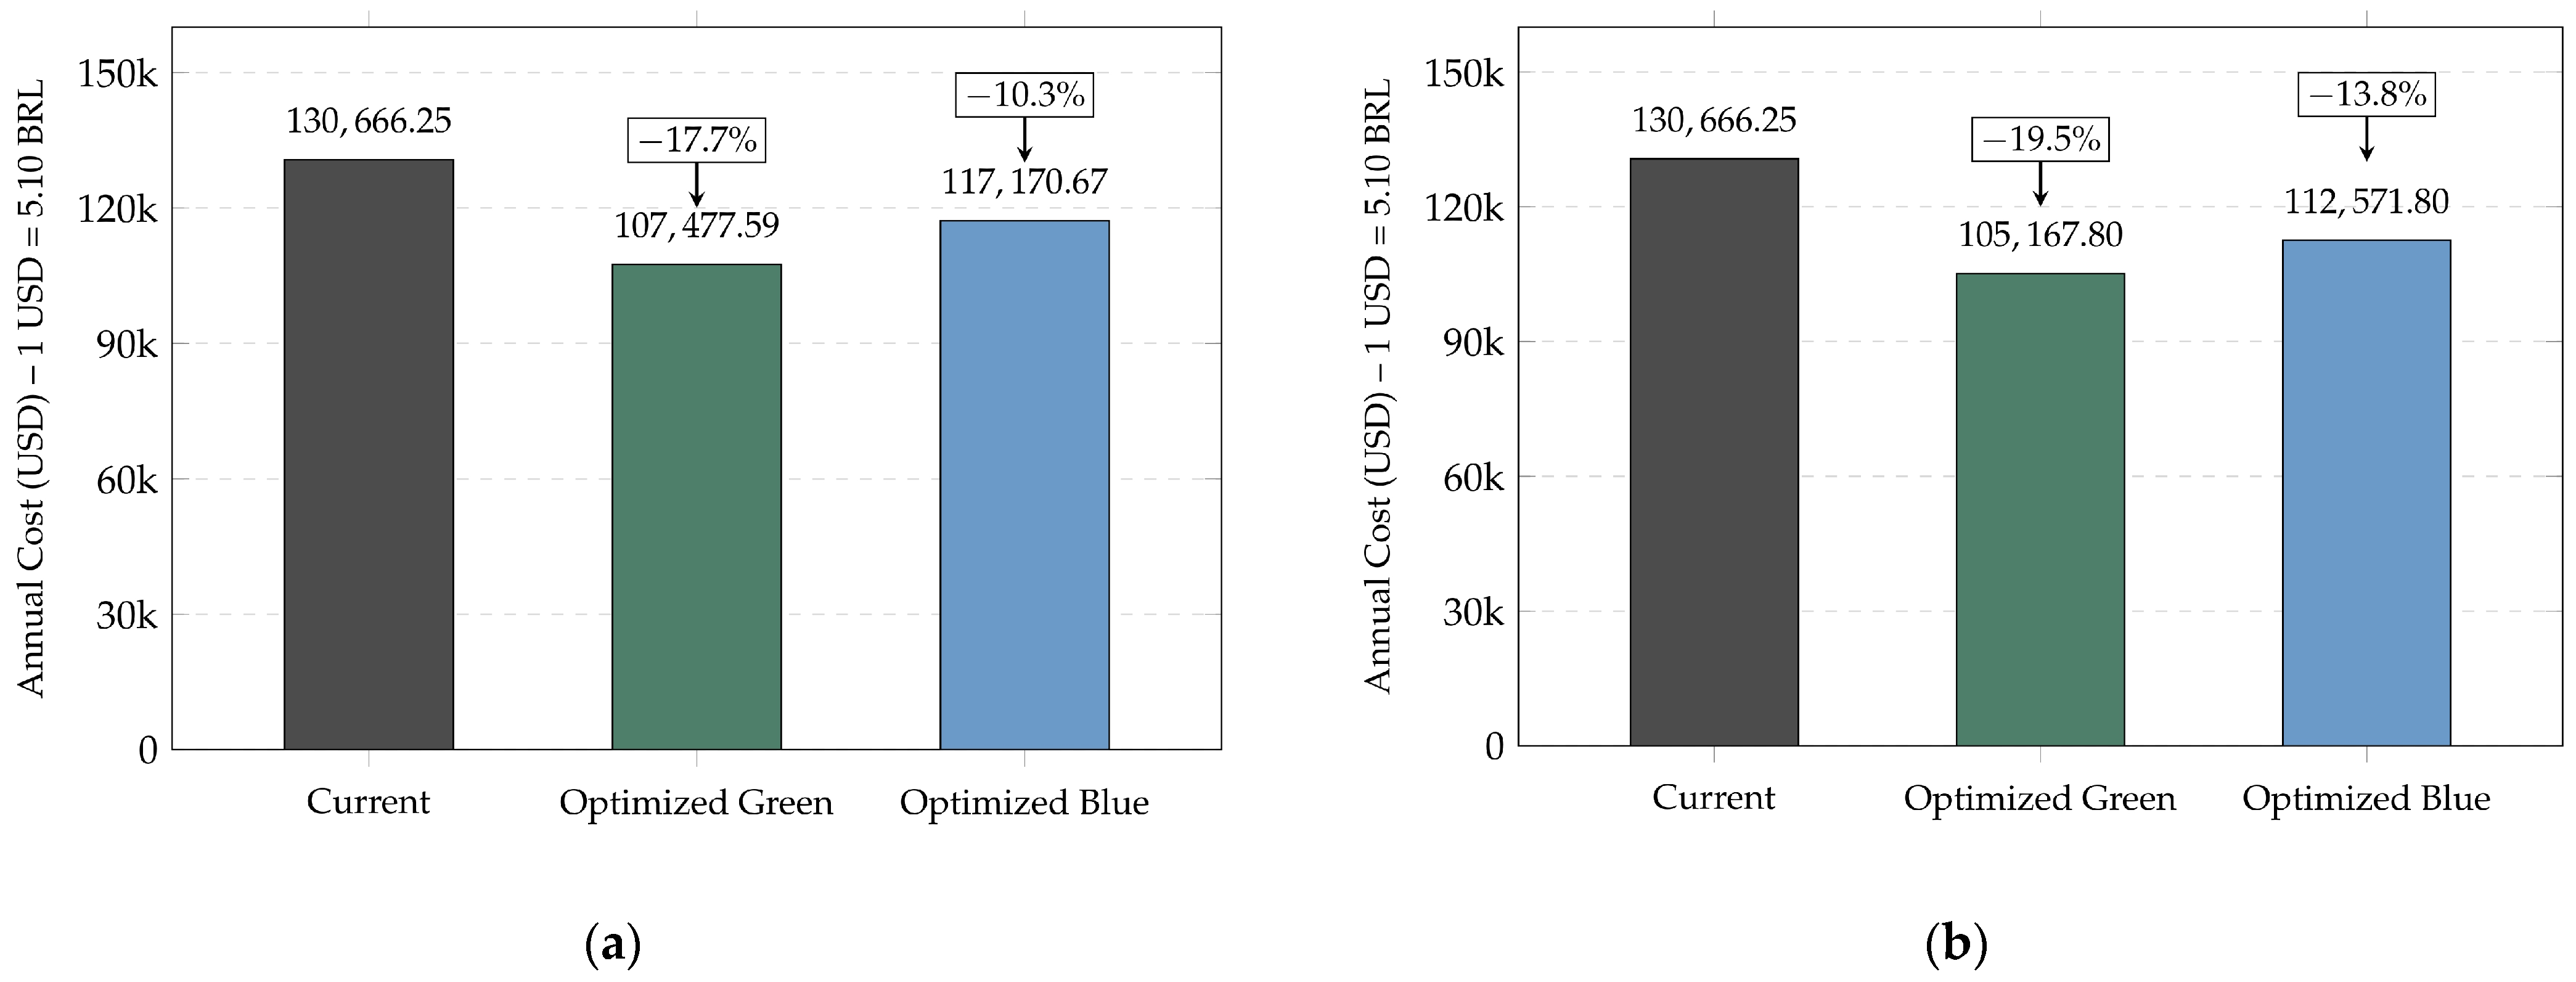
The annual cost comparison among the simulated configurations is shown in Figure 11. In both optimization strategies, the Green modality resulted in the lowest cost for this installation. However, the figure also shows that Grid Search outperformed MRD in purely economic terms, since it minimized the total billed cost without being constrained by the conservative logic of the historical peak. This difference is quantified in Table 3, which summarizes the projected average monthly savings for the Green modality. According to the table, the expected average monthly saving was US$1932.39 under the MRD recommendation and US$2124.87 under Grid Search. These results confirm that the historical maximum-based strategy remains more conservative, while Grid Search tends to exploit the economic trade-off between demand charges and limited overrun exposure more effectively.
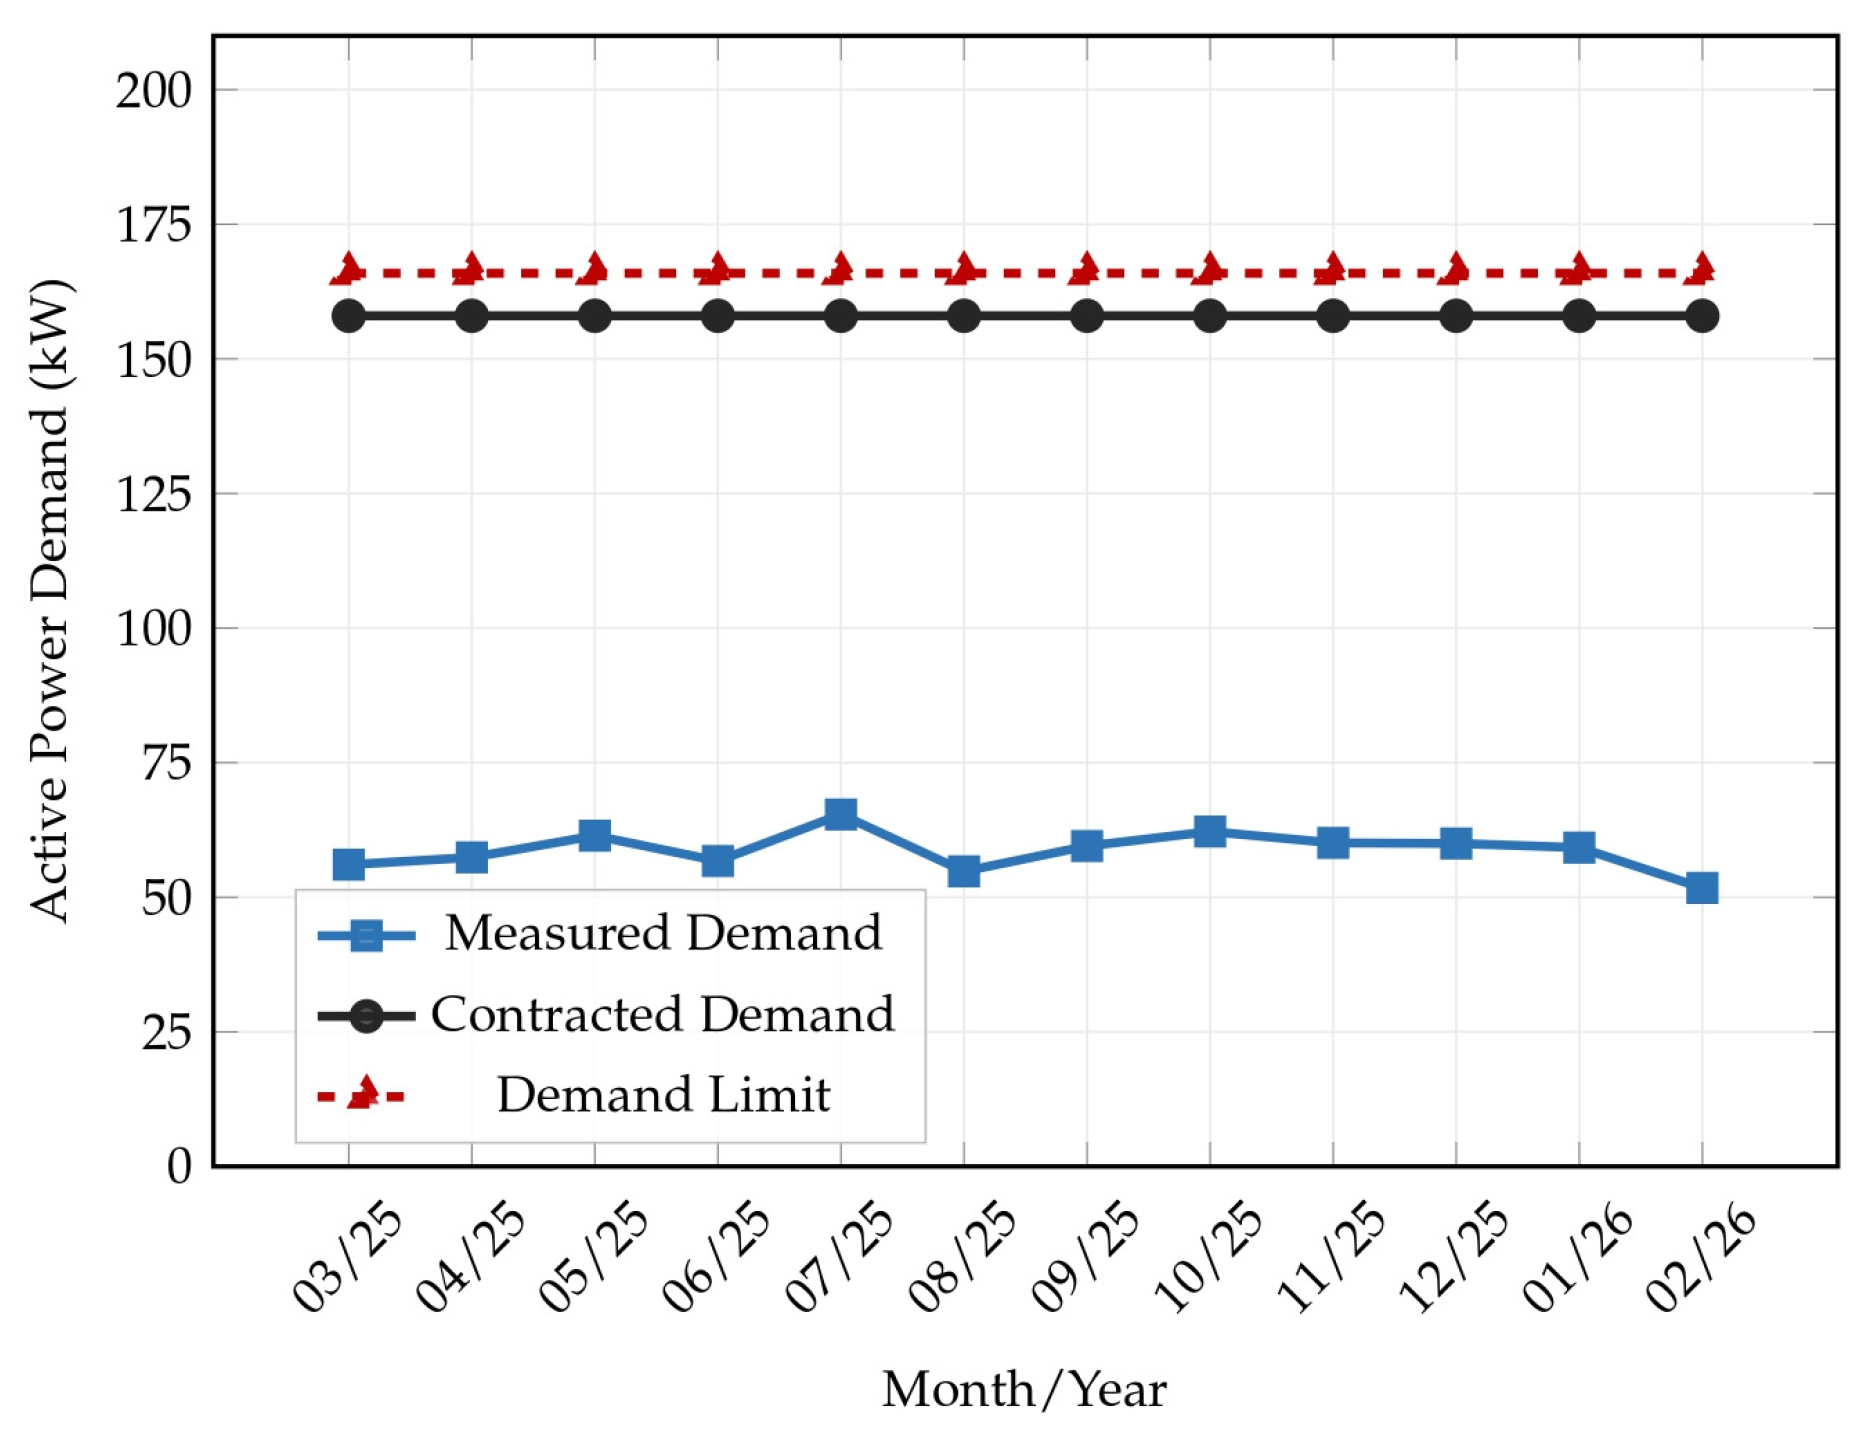
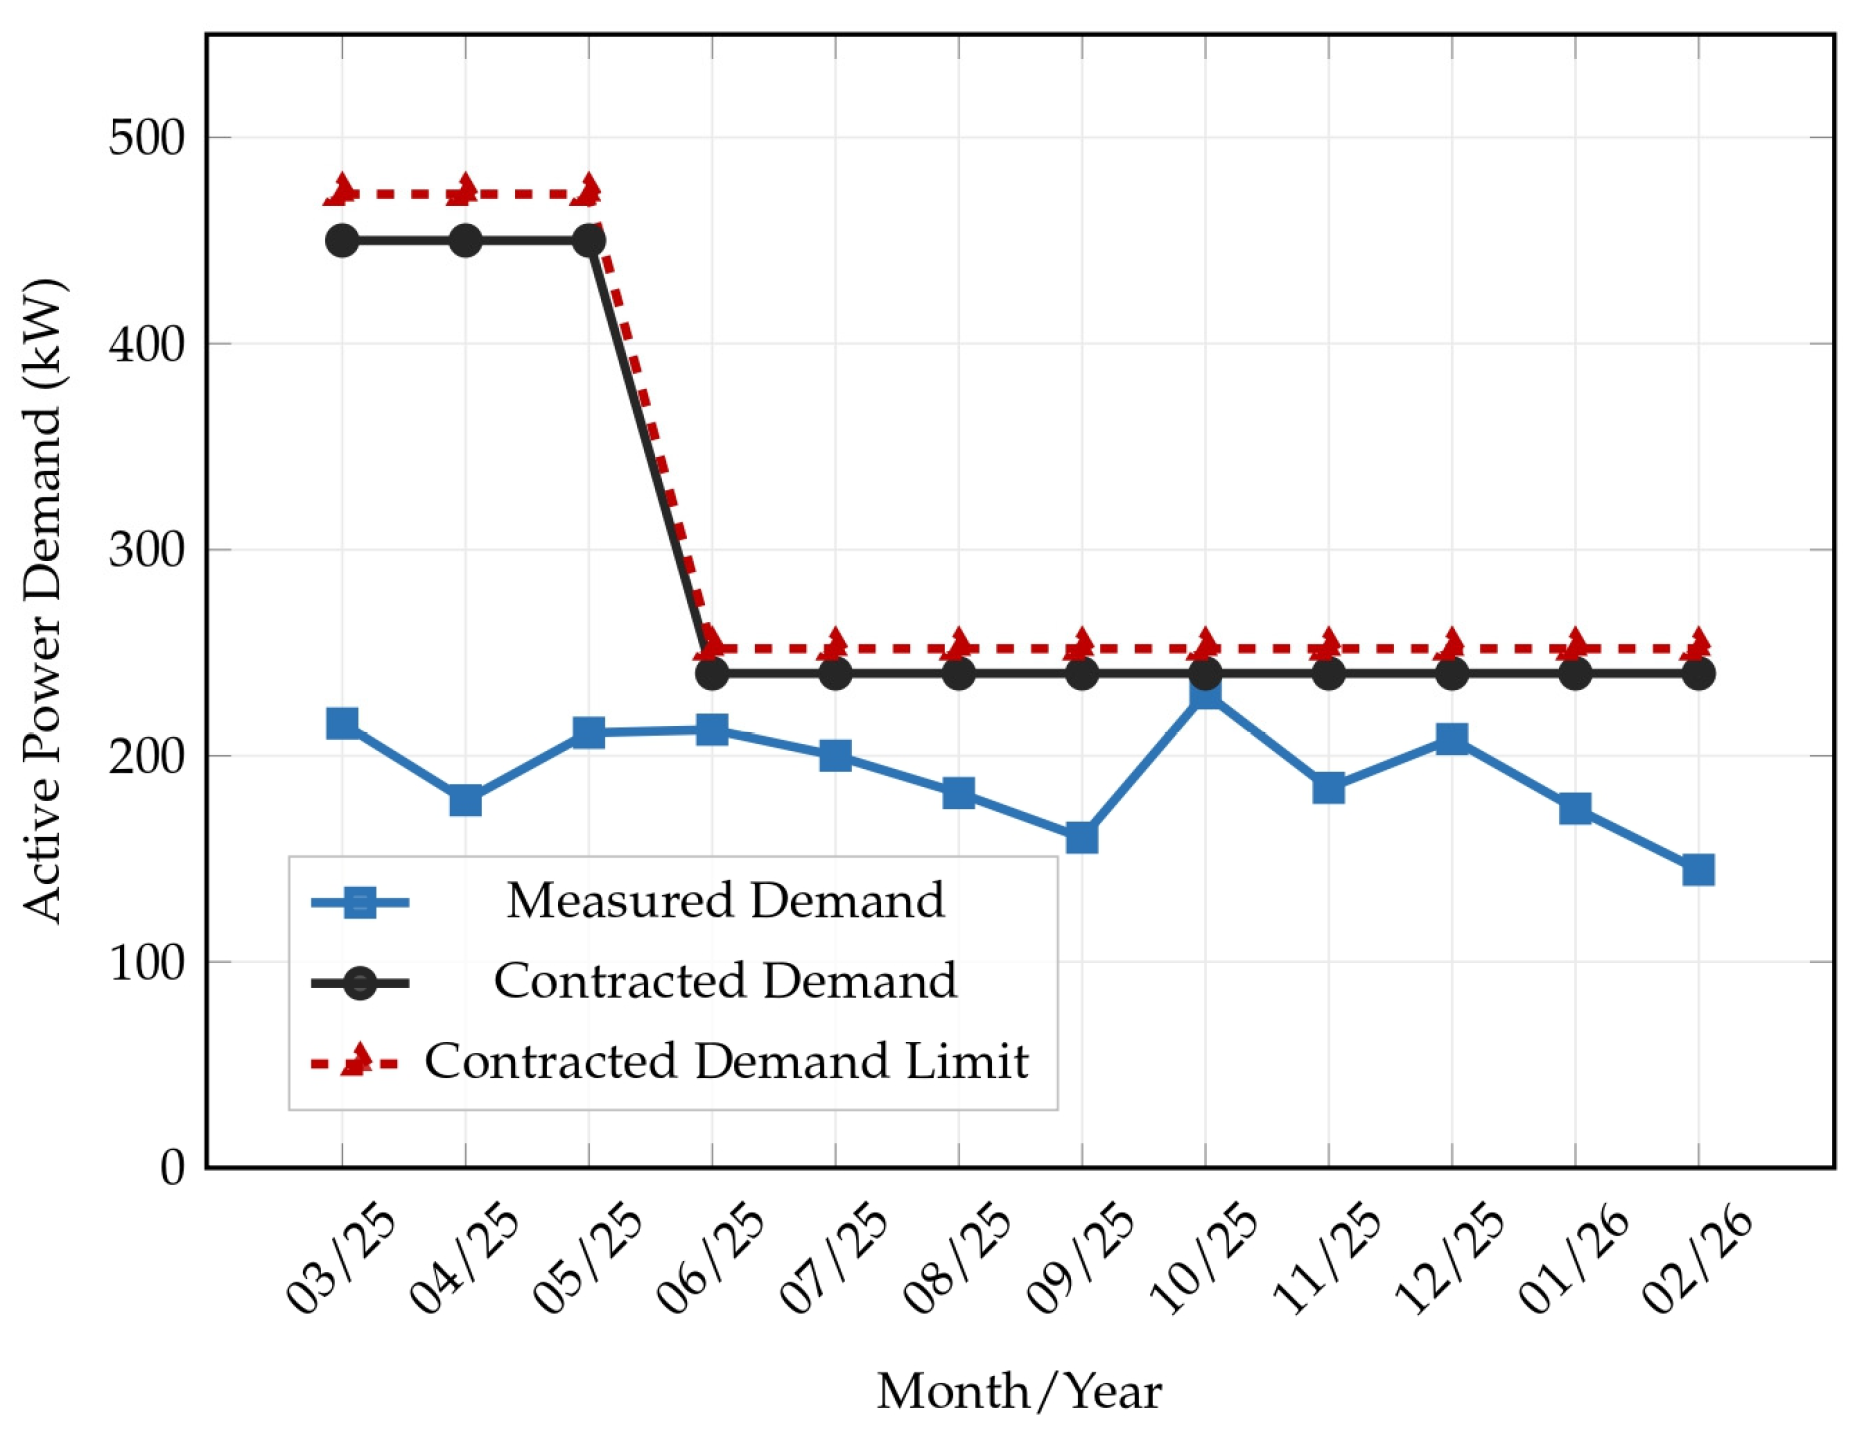
Despite the superior projected performance of Grid Search, the contractual revision implemented with the utility followed the MRD recommendation, reducing the contracted demand from 450 kW to 240 kW. This choice reflected a conservative institutional decision, consistent with the public nature of the consumer unit and with the preference for minimizing overrun risk. The post-intervention demand behavior is presented in Figure 12, which illustrates the billing period after the contracted-demand reduction. The figure shows that the revised contract remained better aligned with the actual demand pattern of the installation, thereby reducing the economic inefficiency associated with the original 450 kW contract. The economic results observed during the intervention period from June 2025 to February 2026 are consolidated in Table 4, which compares the cost considering the original demand configuration with the cost associated with the optimized scenarios. After the implementation of the MRD-based recommendation, the total cost for the observed nine-month post-intervention period decreased from US$93,975.15 to US$76,476.38, corresponding to an effective average monthly saving of US$1944.31. For comparison, if the Grid Search recommendation of 206 kW had been adopted, the projected average monthly saving for the same period would have reached US$2162.23. These results provide direct evidence that DSManager can generate actionable recommendations with substantial economic impact under real operating conditions.

4.4. Discussion of Validation Results

To understand the underlying mechanisms driving these results, two main factors must be systematically analyzed: the cost structure of the tariff modality and the logic of the optimization methods.
First, regarding tariff modalities, the Green tariff outperformed the Blue tariff in the cases analyzed. The main mechanism behind this difference lies in the dual-demand contract structure of the Blue modality, which imposes demand charges specifically during peak hours. For consumers with high loads during peak hours, the Blue tariff tends to be more advantageous. The Green tariff, which applies a single demand rate at all hours, proved to be more economically efficient for the regular administrative and operational profiles observed in these facilities.
Second, regarding optimization strategies, the internal logic of the cost advantage of the Grid Search method over the MRD approach is explained by how each method handles penalty risks. MRD is a risk-averse heuristic: it defines contracted capacity based on the highest absolute historical peak, thus avoiding penalties for excess demand, but binding the consumer to a higher fixed monthly capacity cost throughout the year. In contrast, Grid Search systematically evaluates the mathematical relationship between reference capacity costs and penalties for excess demand. Its main advantage is identifying that deliberately allowing a small penalty for excess demand in atypical months with isolated demand peaks is mathematically cheaper than paying for higher contracted demand over the twelve months. This risk-balancing mechanism is precisely why Grid Search systematically finds a lower overall minimum cost compared to the MRD logic, especially in load scenarios with high variability or seasonal peaks.
The DSManager is a reliable decision-support tool for tariff analysis and contracted-demand revision for Brazilian Group A consumer units. These results indicate that DSManager provides a practical decision-support framework for tariff analysis and contracted-demand revision in Brazilian Group A consumer units. They also show that the two optimization strategies serve different institutional priorities: Grid Search explicitly minimizes the final billed cost, whereas MRD offers a more conservative recommendation for public-sector or risk-averse settings.
Both of the selected consumer units for analysis showed a clear oversizing in their original contracted demand, which naturally facilitated the achievement of substantial savings. For consumers whose contracted demand is already well aligned with actual consumption, DSManager would be expected to identify limited additional savings and to function mainly as an automated verification tool, confirming whether the current contractual configuration is close to the cost-minimizing alternative.
The two validation exercises confirm complementary aspects of the proposed framework. In the retrospective case, the recommendations generated during the analysis period remained economically consistent when transferred to a subsequent unseen billing cycle. In the real-world case, the implementation of the recommended contracted-demand adjustment produced measurable cost savings in practice. Furthermore, it must be recognized that the framework is essentially retrospective. For consumers intending to introduce sudden structural changes to the load profile or integrate new local generation, this reliance on the previous 12 months of historical data becomes a limitation. In these scenarios, past behavior alone cannot predict future needs, requiring the user to manually adjust the input baseline to reflect the new operational reality.

5. Conclusions

This study presented DSManager, a Python-based decision-support tool for tariff analysis and contracted-demand optimization for Brazilian Group A consumer units. The proposed framework combines the regulatory logic of the Brazilian billing structure with a reproducible computational workflow capable of comparing tariff modalities and evaluating alternative contracted-demand definitions. In this way, the study moves beyond isolated theoretical formulations and provides an operationally applicable approach for real contract revision.
The results demonstrated that the tool is capable of identifying economically superior contractual configurations from historical billing data. In both case studies, the Green tariff modality yielded the lowest cost for the observed demand profiles. The comparison between optimization strategies showed that Grid Search consistently produced lower estimated costs than the Maximum Recorded Demand (MRD) criterion, since it directly minimizes the final billed cost and may tolerate limited overrun exposure when this reduces the overall annual expense. By contrast, MRD provided a more conservative recommendation, better aligned with institutional settings in which avoiding overrun risk is prioritized.
The validation stage confirmed both the consistency and the practical relevance of the proposed framework. In the retrospective case, the optimized recommendations remained economically favorable when applied to a subsequent unseen billing cycle, with projected savings of US$9461.67 under MRD and US$9554.20 under Grid Search. In the real-world implementation case, the reduction in contracted demand from 450 kW to 240 kW resulted in an effective average monthly saving of US$1944.31, corresponding to US$17,498.78 over the observed nine-month period. These findings demonstrate that DSManager is not only suitable for simulation but also capable of supporting actionable decisions with measurable economic impact.
Overall, the study shows that contracted-demand management can provide substantial savings even without direct intervention in electricity consumption, provided that billing rules, tariff modality, and demand history are properly represented in the decision process. This makes the proposed framework particularly relevant for large public and institutional consumers operating under regulated tariff environments.
As future work, the framework can be expanded in several key directions: incorporating forecasting models and scenario-based stochastic analyses to support forward-looking contract definition and robustness assessment; expanding case studies to other Brazilian utilities; and integrating with more comprehensive energy management modules, including distributed generation and portfolio analysis across multiple consumer units.

Author Contributions

Conceptualization, C.M.L. and J.M.T.; methodology, C.M.L., J.M.T. and C.A.R.; software, C.M.L. and C.A.R.; validation, C.M.L., J.M.T. and C.C.M.d.M.C.; formal analysis, C.M.L., J.M.T., C.C.M.d.M.C. and M.E.d.L.T.; investigation, C.M.L. and J.M.T.; resources, C.C.M.d.M.C., M.E.d.L.T. and U.H.B.; data curation, C.M.L.; writing—original draft preparation, C.M.L. and J.M.T.; writing—review and editing, C.M.L., J.M.T. and C.A.R.; visualization, C.M.L., J.M.T., C.A.R., C.C.M.d.M.C., U.H.B. and M.E.d.L.T.; supervision, C.C.M.d.M.C., M.E.d.L.T. and U.H.B.; project administration, C.C.M.d.M.C., M.E.d.L.T. and U.H.B.; funding acquisition, C.C.M.d.M.C., M.E.d.L.T. and U.H.B. All authors have read and agreed to the published version of the manuscript.

Funding

This research was funded by the Directorate of Scientific, Humanistic, and Technological Research (DICIHT): PI 1175-DICIHT.

Data Availability Statement

The data presented in this study are available on request from the corresponding authors. Data are confidential due to the requirements of the Federal University of Para administration. Nevertheless, the data are available on request from the corresponding authors.

Acknowledgments

The authors would like to acknowledge the support provided by the Energy Management and Efficiency Project developed by the Amazon Energy Efficiency Center (CEAMAZON) at the Federal University of Pará (UFPA). The project contributed to the development of the present study by supporting the technical environment in which the data analysis, tariff evaluation, and contracted-demand management activities were conducted.

Conflicts of Interest

The authors declare no conflicts of interest.

References

  1. Fernández, M.A.; Zorita, A.L.; García-Escudero, L.A.; Duque, O.; Moríñigo, D.; Riesco, M.; Muñoz, M. Cost Optimization of Electrical Contracted Capacity for Large Customers. Int. J. Electr. Power Energy Syst. 2013, 46, 123–131. [Google Scholar] [CrossRef]
  2. Moreira, G.A.M.; Tabora, J.M.; Soares, T.M.; de Lima Tostes, M.E.; Bezerra, U.H.; de M. Carvalho, C.C.M.; de Matos, E.O. Demand Side Management Strategies for the Introduction of Electric Vehicles: A Case Study. In Proceedings of the 2023 IEEE Colombian Caribbean Conference (C3), Barranquilla, Colombia, 22–25 November 2023; pp. 1–6. [Google Scholar]
  3. Palensky, P.; Dietrich, D. Demand Side Management: Demand Response, Intelligent Energy Systems, and Smart Loads. IEEE Trans. Ind. Inform. 2011, 7, 381–388. [Google Scholar] [CrossRef]
  4. Faruqui, A.; Sergici, S. Household Response to Dynamic Pricing of Electricity: A Survey of 15 Experiments. J. Regul. Econ. 2010, 38, 193–225. [Google Scholar] [CrossRef]
  5. Agência Nacional de Energia Elétrica (ANEEL). Resolução 1000 da ANEEL, Seus Direitos Sobre Energia Elétrica, Agora Num só Lugar! Brasília, Brazil. Available online: https://www.gov.br/aneel/pt-br/assuntos/campanhas/resolucao-1000-da-aneel-seus-direitos-sobre-energia-eletrica-agora-num-so-lugar-2022 (accessed on 3 April 2026).
  6. Agência Nacional de Energia Elétrica (ANEEL). Modalidades Tarifárias, Brasília, Brazil. Available online: https://www.gov.br/aneel/pt-br/assuntos/tarifas/entenda-a-tarifa/modalidades-tarifarias (accessed on 3 April 2026).
  7. Liu, K.; Li, B.; Jiang, Q.; Zhang, Y.; Liu, T. Fault Ride-Through Strategy for Hybrid Cascaded HVdc Systems Based on Controllable LCC. IEEE Trans. Circuits Syst. II Express Briefs 2026, 73, 88–92. [Google Scholar] [CrossRef]
  8. Dos Reis, J.R.; Muñoz Tabora, J.; Carvalho De Lima, M.; Pessoa Monteiro, F.; Cruz De Aquino Monteiro, S.; Holanda Bezerra, U.; Emília De Lima Tostes, M. Medium and Long Term Energy Forecasting Methods: A Literature Review. IEEE Access 2025, 13, 29305–29326. [Google Scholar] [CrossRef]
  9. Dharani, R.; Balasubramonian, M.; Babu, T.S.; Nastasi, B. Load Shifting and Peak Clipping for Reducing Energy Consumption in an Indian University Campus. Energies 2021, 14, 558. [Google Scholar] [CrossRef]
  10. Prakobkaew, P.; Sirisumrannukul, S. Load Aggregation Management Strategies for Demand Response: A Dual Forecasting Approach for Cost Minimization. Front. Energy Res. 2025, 13, 1511207. [Google Scholar] [CrossRef]
  11. Mendes, N.; Tabora, J.M.; de Lima Tostes, M.E.; Matos, E.O.d.; H.Bezerra, U.; Moura, P.; Mendes, J.; Ferreira, F.J.T.E.; Almeida, A.T.d. ANN for Motor Loading Diagnosis under Voltage Variation Conditions. In Proceedings of the 2023 IEEE Kansas Power and Energy Conference (KPEC), Manhattan, KS, USA, 27–28 April 2023; pp. 1–6. [Google Scholar]
  12. Tabora, J.M.; de Lima Tostes, M.E.; de Matos, E.O.; Bezerra, U.H. Voltage Unbalance & Variations Impacts on IE4 Class LSPMM. In Proceedings of the 2021 14th IEEE International Conference on Industry Applications (INDUSCON), São Paulo, Brazil, 15–18 August 2021; pp. 940–946. [Google Scholar]
  13. Tshoombe, B.K.; Muñoz Tabora, J.; da Silva Fonseca, W.; Emília Lima Tostes, M.; de Matos, E.O. Voltage Harmonic Impacts on Line Start Permanent Magnet Motor. In Proceedings of the 2021 14th IEEE International Conference on Industry Applications (INDUSCON), São Paulo, Brazil, 15–18, August 2021; pp. 962–968. [Google Scholar]
  14. Tabora, J.M.; Tshoombe, B.K.; Fonseca, W.d.S.; Tostes, M.E.d.L.; Matos, E.O.d.; Bezerra, U.H.; Silva, M.d.O.e. Virtual Modeling and Experimental Validation of the Line-Start Permanent Magnet Motor in the Presence of Harmonics. Energies 2022, 15, 8603. [Google Scholar] [CrossRef]
  15. Wang, Y.; Li, L. Time-of-Use Electricity Pricing for Industrial Customers: A Survey of U.S. Utilities. Appl. Energy 2015, 149, 89–103. [Google Scholar] [CrossRef]
  16. Hung, Y.-C.; Michailidis, G. Modeling and Optimization of Time-of-Use Electricity Pricing Systems. IEEE Trans. Smart Grid 2019, 10, 4116–4127. [Google Scholar] [CrossRef]
  17. Ansarin, M.; Ghiassi-Farrokhfal, Y.; Ketter, W.; Collins, J. The Economic Consequences of Electricity Tariff Design in a Renewable Energy Era. Appl. Energy 2020, 275, 115317. [Google Scholar] [CrossRef]
  18. Tabora, J.M.; Velasquez, Y.G.; Rivera, D.A.; Quijano, D.A.; Melgar-Dominguez, O.D. A Multiobjective Strategy for Generation Expansion Planning to Enable Increased Penetration of Variable Renewable Energy Sources. IEEE Access 2024, 12, 187665–187675. [Google Scholar] [CrossRef]
  19. Wilk, P.; Cantor, E.; Li, J. Net-Zero Emission for Multi-Energy Campus System. In Proceedings of the 2023 IEEE Power & Energy Society General Meeting (PESGM), Orlando, FL, USA, 16–20 July 2023; pp. 1–5. [Google Scholar]
  20. Marangoni, F.; Magatão, L.; de Arruda, L.V.R. Demand Response Optimization Model to Energy and Power Expenses Analysis and Contract Revision. Energies 2020, 13, 2803. [Google Scholar] [CrossRef]
  21. Alcayde, A.; Baños, R.; Arrabal-Campos, F.M.; Montoya, F.G. Optimization of the Contracted Electric Power by Means of Genetic Algorithms. Energies 2019, 12, 1270. [Google Scholar] [CrossRef]
  22. Martins, A.M.; Guimarães Medeiros, C.A.; Domingos, J.L.; Reis, M.R.; Pacheco, W.C.; de Aquino Gomes, R. Minimization of the Electricity Bill of Brazilian Consumers with PV System through the Optimization of Contracting Demand and the Orientation of Photovoltaic Panels. In Proceedings of the 2019 IEEE International Conference on Environment and Electrical Engineering and 2019 IEEE Industrial and Commercial Power Systems Europe (EEEIC/I&CPS Europe), Genova, Italy, 11–14 June 2019; pp. 1–6. [Google Scholar]
  23. dos Santos Junior, L.C.; Tabora, J.M.; Reis, J.; Andrade, V.; Carvalho, C.; Manito, A.; Tostes, M.; Matos, E.; Bezerra, U. Demand-Side Management Optimization Using Genetic Algorithms: A Case Study. Energies 2024, 17, 1463. [Google Scholar] [CrossRef]
  24. Jhones Passos Nascimento, A.; Berrehil El Kattel, M.; Antônio Fernandes de Macêdo, J.; Antunes, F.L.M. Integrated Time Series Analysis, Clustering, and Forecasting for Energy Efficiency Optimization and Tariff Management. IEEE Access 2025, 13, 59309–59325. [Google Scholar] [CrossRef]
  25. dos Santos, L.C.; Muñoz Tabora, J.; Figueredo Rocha, C.A.; Moura de M. C., C.C.; Soares, T.M.; Emília de Lima Tostes, M. Energy Demand Forecasting for High Energy Consumers: A Case Study in Brazil. In Proceedings of the 2024 IEEE International Symposium on Technology and Society (ISTAS), Puebla, Mexico, 18–20 September 2024; pp. 1–6. [Google Scholar]
  26. de Freitas, R.C.; Gregorio, R.M.; Cruz, M.D. Application of Classical Optimization Methods to Reduce Demand for Contracted Energy in the Brazilian Public Sector. Energy Effic. 2026, 19, 21. [Google Scholar] [CrossRef]
  27. Chen, C.-Y.; Liao, C.-J. A Linear Programming Approach to the Electricity Contract Capacity Problem. Appl. Math. Model. 2011, 35, 4077–4082. [Google Scholar] [CrossRef]
  28. Chassin, D.P.; Sun, Y.; Somani, A. Optimization of Customer Subscription Rates to Electric Utility Tariffs. In Proceedings of the 2015 48th Hawaii International Conference on System Sciences, Kauai, HI, USA, 5–8 January 2015; pp. 2604–2609. [Google Scholar]
  29. Rosado, B.; Torquato, R.; Venkatesh, B.; Gooi, H.B.; Freitas, W.; Rider, M.J. Framework for Optimizing the Demand Contracted by Large Customers. IET Gener. Transm. Distrib. 2020, 14, 635–644. [Google Scholar] [CrossRef]
  30. Ordóñez, Á.; Sánchez, E.; Carlos Solano, J.; Parra-Domínguez, J. Demand Charges Reduction with Photovoltaics in Industry. Heliyon 2024, 10, e23404. [Google Scholar] [CrossRef]
  31. Lin, J.-L.; Zhang, Y.; Zhu, K.; Chen, B.; Zhang, F. Asymmetric Loss Functions for Contract Capacity Optimization. Energies 2020, 13, 3123. [Google Scholar] [CrossRef]
  32. Leonel, L.D.; Balan, M.H.; Camargo, L.A.S.; Ramos, D.S.; Castro, R.; Clemente, F.S. Stochastic Decision-Making Optimization Model for Large Electricity Self-Producers Using Natural Gas in Industrial Processes: An Approach Considering a Regret Cost Function. Energies 2024, 17, 5389. [Google Scholar] [CrossRef]
  33. Ferdavani, A.K.; Hooshmand, R.-A.; Gooi, H.B. Analytical Solution for Demand Contracting with Forecasting-Error Analysis on Maximum Demands and Prices. IET Gener. Transm. Distrib. 2018, 12, 3097–3105. [Google Scholar] [CrossRef]
  34. Tai, S.-H.; Tsai, M.-T.; Huang, W.-H.; Tsai, Y.-H. Contracted Capacity Optimization Problem of Industrial Customers with Risk Assessment. Inventions 2024, 9, 81. [Google Scholar] [CrossRef]
  35. Agência Nacional de Energia Elétrica (ANEEL). Procedimentos de Regulação Tarifária—PRORET, Módulo 7: Estrutura Tarifária das Concessionárias de Distribuição de Energia Elétrica, Submódulo 7.1: Procedimentos Gerais, Brasília, Brazil. Available online: https://Www.Gov.Br/Aneel/Pt-Br/Centrais-de-Conteudos/Procedimentos-Regulatorios/Proret (accessed on 21 May 2026).
  36. Agência Nacional de Energia Elétrica (ANEEL). Base de Dados Das Tarifas Das Distribuidoras de Energia Elétrica, Portal ANEEL de Relatórios Abertos, Brasília, Brazil. Available online: https://portalrelatorios.aneel.gov.br/luznatarifa/basestarifas (accessed on 21 May 2026).
  37. Base Legislação da Presidência da República—Lei Complementar No 87 de 13 de Setembro de 1996. Available online: https://legislacao.presidencia.gov.br/atos/?tipo=LCP&numero=87&ano=1996&ato=6b9oXSq1UMJpWTfd0 (accessed on 3 April 2026).
  38. Superior Tribunal de Justiça. Súmula n. 391: O ICMS Incide Sobre o Valor da Tarifa de Energia Elétrica Correspondente à Demanda de Potência Efetivamente Utilizada. Diário da Justiça Eletrônico, 7 October 2009. Available online: https://www.stj.jus.br/docs_internet/revista/eletronica/stj-revista-sumulas-2013_36_capSumula391.pdf (accessed on 21 May 2026).
  39. Brasil: Ministério da Economia. Cartilha Energia: Como Analisar Gastos com Energia Elétrica, 2nd ed.; Secretaria de Gestão: Brasília, Brazil, 2020. Available online: https://www.gov.br/compras/pt-br/sistemas/arquivos-doc-e-pdf/cartilha_energia.pdf (accessed on 5 March 2026).
  40. Liashchynskyi, P.; Liashchynskyi, P. Grid Search, Random Search, Genetic Algorithm: A Big Comparison for NAS. Available online: https://arxiv.org/abs/1912.06059v1 (accessed on 3 April 2026).
  41. Bergstra, J.; Bengio, Y. Random Search for Hyper-Parameter Optimization. J. Mach. Learn. Res. 2012, 13, 281–305. [Google Scholar]
  42. McKinney, W. Data Structures for Statistical Computing in Python. SciPy 2010, 445, 51–56. [Google Scholar] [CrossRef]
  43. Harris, C.R.; Millman, K.J.; van der Walt, S.J.; Gommers, R.; Virtanen, P.; Cournapeau, D.; Wieser, E.; Taylor, J.; Berg, S.; Smith, N.J.; et al. Array Programming with NumPy. Nature 2020, 585, 357–362. [Google Scholar] [CrossRef]
  44. Streamlit. Basic Concepts of Streamlit, Streamlit Docs. Available online: https://Docs.Streamlit.Io/Get-Started/Fundamentals/Main-Concepts (accessed on 21 May 2026).
Figure 1. Consumption and demand rates applied to tariff modality by Equatorial Pará: (a) Green modality; (b) Blue modality; (c) conventional modality.
Energies 19 02579 g001
Figure 2. Home of DSManager software.
Energies 19 02579 g002
Figure 3. Invoice analysis tab.
Energies 19 02579 g003
Figure 4. Methodology.
Energies 19 02579 g004
Figure 5. Contracted demand for facility No. 0010054117, March 2024 to February 2025.
Energies 19 02579 g005
Figure 6. Optimized demand for facility No. 0010054117, March 2024 to February 2025: (a) Green–MRD; (b) Blue–MRD; (c) Green–Grid Search; (d) Blue–Grid Search.
Energies 19 02579 g006
Figure 7. Annual cost comparison by tariff modality for installation No. 0010054117, March 2024 to February 2025: (a) optimization by MRD; (b) optimization by Grid Search.
Energies 19 02579 g007
Figure 8. Contracted demand for facility No. 0010054117, March 2025 to February 2026.
Energies 19 02579 g008
Figure 9. Contracted demand for facility No. 2001131798, June 2024 to May 2025.
Energies 19 02579 g009
Figure 10. Optimized demand for facility No. 2001131798, June 2024 to May 2025: (a) Green–MRD; (b) Blue–MRD; (c) Green–Grid Search; (d) Blue–Grid Search.
Energies 19 02579 g010
Figure 11. Annual cost comparison by tariff modality for installation No. 2001131798, June 2024 to May 2025: (a) optimization by MRD; (b) optimization by Grid Search.
Energies 19 02579 g011
Figure 12. Contracted demand for facility No. 2001131798, March 2025 to February 2026.
Energies 19 02579 g012
Table 1. Notation of the variables billed and the applicable tariffs.
NotationDescription
C O N Consumption of the UC can be separated by tariff station according to the modality applied.
T E Energy tariff applied to consumption per tariff station in R$/kWh according to the tariff modality.
T U S D Tariff for the Use of the Distribution System applied to energy consumption in R$/kWh and active power demand in R$/kW, according to the station and tariff modality.
D E M Active power demand in kW can be separated by tariff station, according to the modality applied.
Table 2. Annual cost comparison for Installation No. 0010054117 under the current contract and the optimized MRD- and Grid Search-based contractual configurations in the analysis and validation periods.
Optimization Method for Contracted DemandAnnual Cost for Analysis PeriodAnnual Cost for Validation Period
GreenBlueGreenBlue
No AlterationUS$57,259.96-US$54,110.75-
MRDUS$47,022.60US$48,947.26US$44,649.08US$47,224.73
Grid SearchUS$47,020.60US$48,259.89US$44,556.55US$46,251.37
The bold value indicate the lowest projected cost.
Table 3. Projected average monthly savings for installation No. 2001131798.
Contracted Demand Optimization MethodProjected Average Monthly Savings
MRD (240 kW)US$1932.39
Grid Search (206 kW)US$2214.87
Table 4. Economic results observed for Installation No. 2001131798 during the intervention period from June 2025 to February 2026.
Contracted Demand Optimization MethodTotal Cost over the Period (9 Months)Monthly Savings
No Alteration (450 kW)US$93,975.15-
MRD (240 kW)US$76,476.38US$1944.31
Grid Search (206 kW)US$74,515.09US$2162.23
The values in bold indicate the total cost and monthly savings for the implemented optimization method.
Disclaimer/Publisher’s Note: The statements, opinions and data contained in all publications are solely those of the individual author(s) and contributor(s) and not of MDPI and/or the editor(s). MDPI and/or the editor(s) disclaim responsibility for any injury to people or property resulting from any ideas, methods, instructions or products referred to in the content.