


Abstract
This study presents a low-cost, practical approach for determining the average trip current level from a statistically significant sample of polymer positive temperature coefficient (PPTC) fuses. The experimental method uses a controlled constant-current source (CCS) to test PPTC fuses over a range of standard room temperatures without an expensive temperature chamber. This novel approach enables designs to practically investigate the reliability of trip current levels for equivalent specified PPTC fuses from different manufacturers. The experimental setup uses a calibrated CCS circuit to incrementally increase current through a PPTC fuse by 0.01 A. The current flow duration for each applied CCS setting was set to the specified time-to-trip value before device trip determination. The trip condition is identified when the sensed PPTC current drops to 50% of the specified fault trip current. To prevent thermal runaway, an empirically determined zero-current cool-down period separates each current increment. Testing revealed differences in the average trip currents of PPTC fuse samples from different manufacturers: 1.26 A, 1.10 A, and 1.06 A, respectively. The determined 95% confidence interval trip-current ranges also revealed a significant difference between PPTC manufacturer populations. The findings reveal that PPTC determined average trip current within the standard room-temperature range can serve as an effective comparison metric between manufacturers with equivalent device specifications.
1. Introduction
An overcurrent protector (OCP) is a series-connected component that causes currents exceeding a predetermined value to be restricted [1]. Often, OCP is accomplished by using a series-connected single-use fuse that physically melts when an excessive current flows. While effective, conventional fuses require manual replacement after each overcurrent event, resulting in undesirable downtime. Instead, a self-restoring thermally activated OCP will automatically reset after an overcurrent condition has ended, without the need for manual intervention. A solid-state positive temperature coefficient (PTC) thermistor is commonly used as a self-restoring thermally activated OCP device connected in series with electrical equipment. Ceramic or polymer are two common types of materials that can be used to manufacture a PTC thermistor. This paper focuses on polymer-based PTC thermistors because of the reduced resistance at ambient room temperature, simplified manufacturing process, excellent flexibility, including mechanical insensitivity to thermal shock, formability, and a low resistance sensitivity to applied voltage [2,3].
Manufacturers also refer to self-re-healing polymer positive temperature coefficient (PPTC) thermistors, which are used in a broad range of low-voltage consumer electronics as poly-switches or resettable fuses [3,4]. The resistance of a PPTC fuse changes when its conductive network breaks down due to heating. While various theories aim to explain this non-linear change in PPTC fuse resistivity with temperature, they cannot fully explain the experimental observations [2]. However, thermal expansion theory offers a simplified explanation of how a PPTC fuse operates.
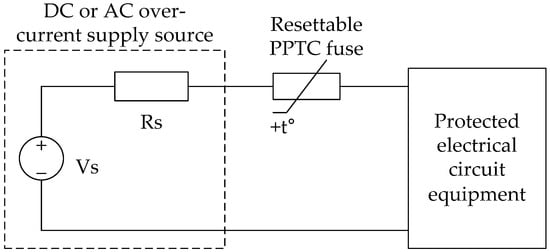
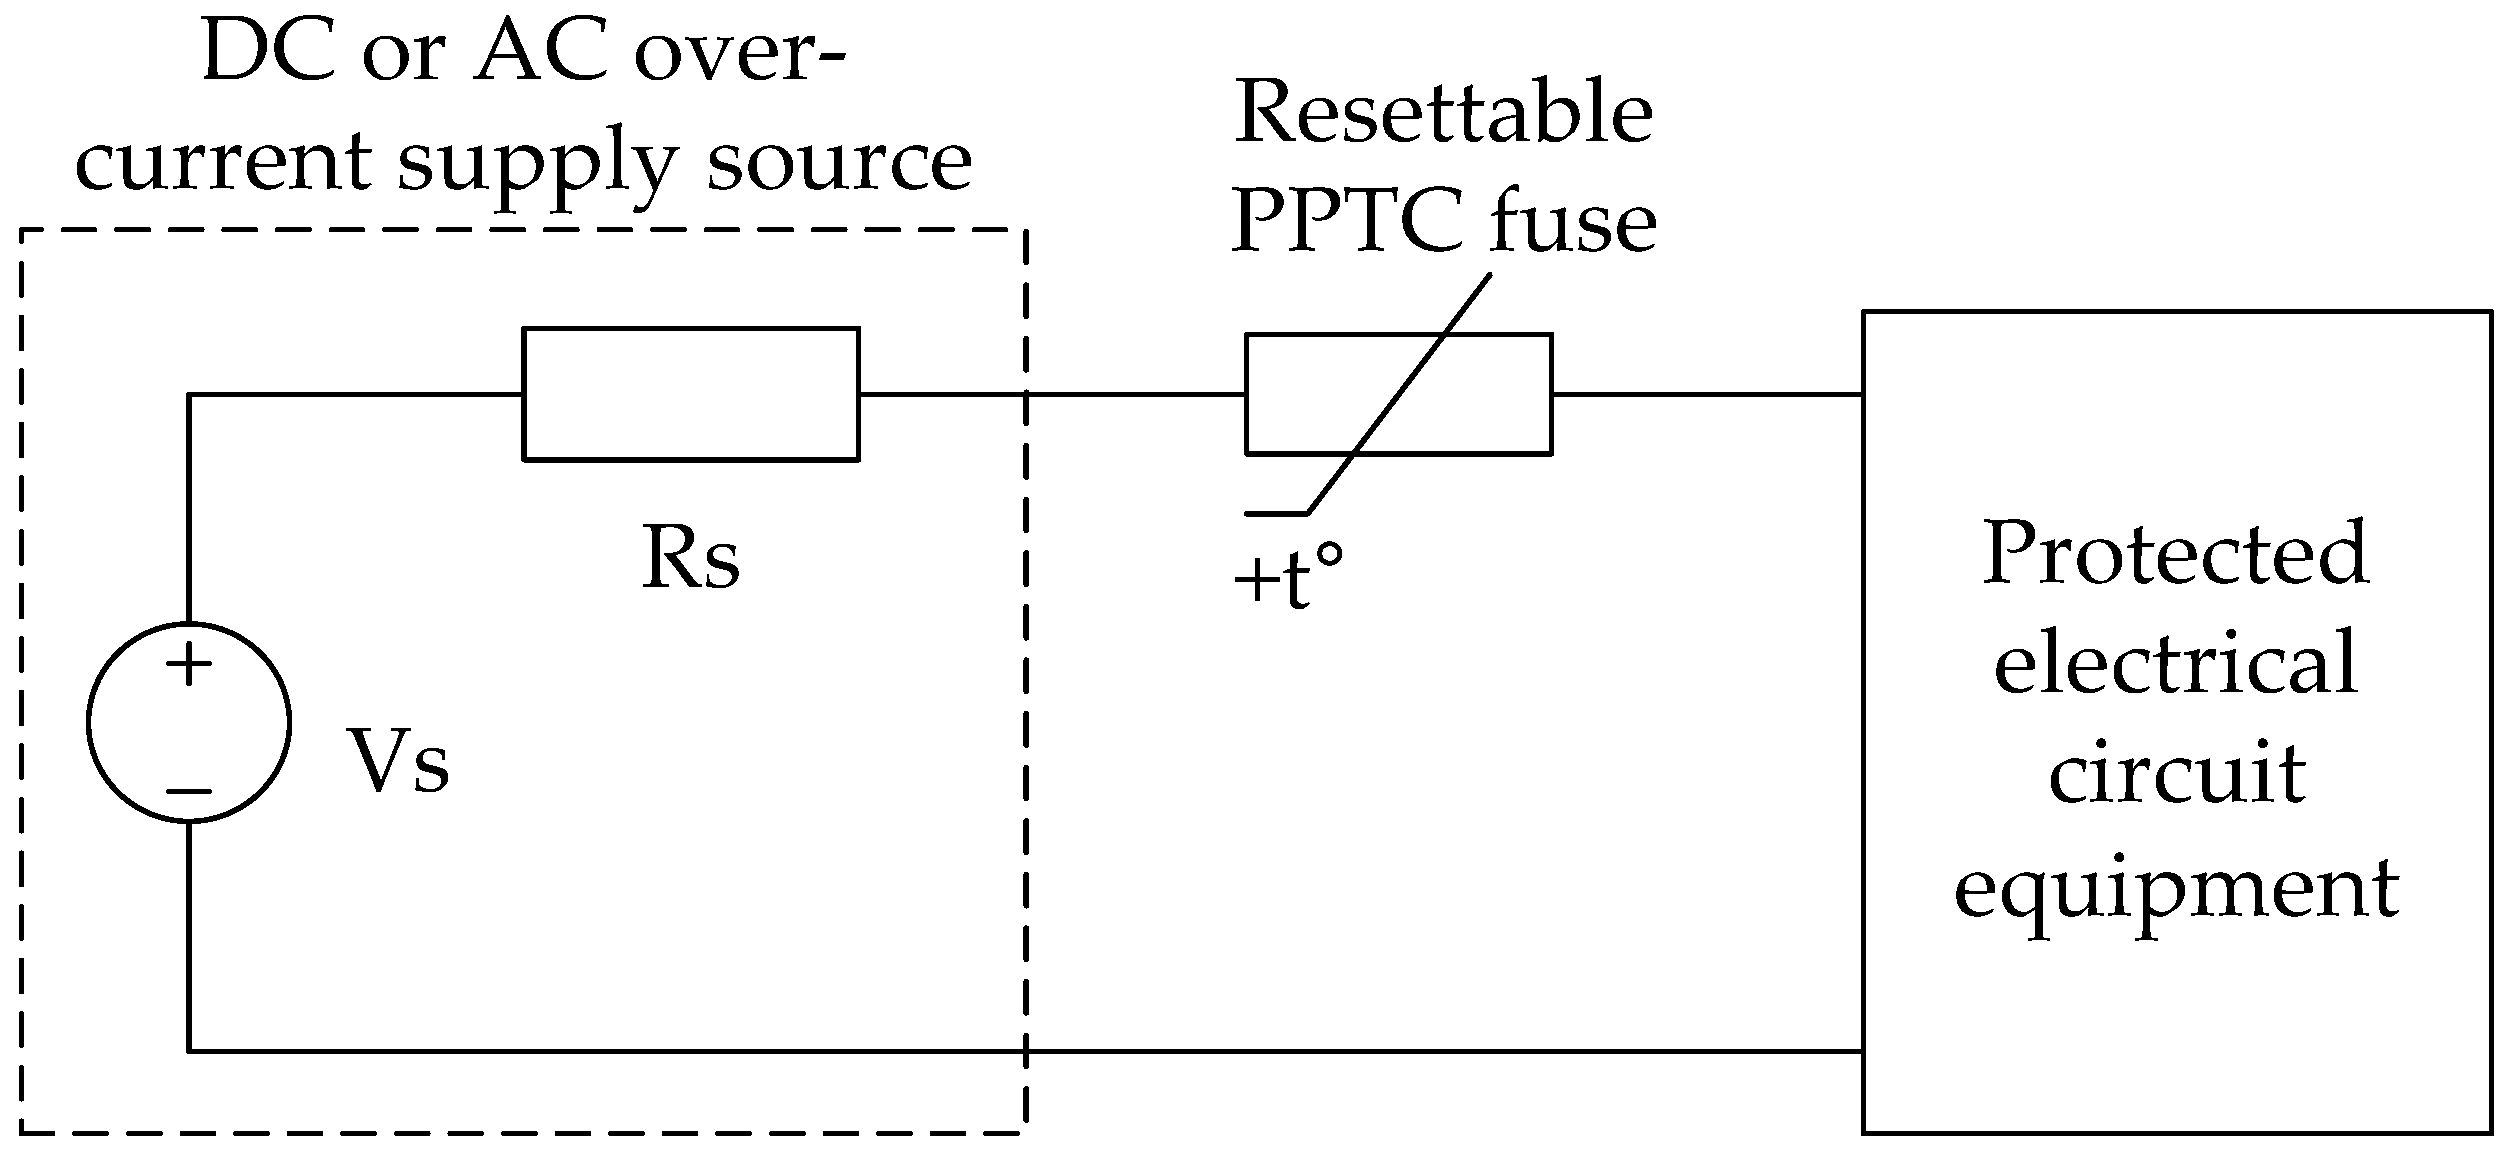
The PPTC fuse is a solid-state device that is composed of a polymer and conductive crystalline matrix fillers of either carbon black, graphite, or metal particles. Furthermore, carbon nanotubes offer significant advantages as reported in [5] over micro-sized carbon materials. Under normal operation, with currents below a specified hold current, these fillers form a low-resistance network. When a fault current flowing through the PPTC fuse exceeds a specified trip threshold, the device self-heats due to the I2R effect. As the temperature of the PPTC fuse body exceeds a critical temperature, the polymer rapidly expands, and the fillers transition from a crystalline to an amorphous state. This expansion disrupts the conductive paths, which causes the low un-tripped resistance to sharply increase to a very high tripped resistance state over a narrow temperature range, thus restricting the overcurrent condition. The PPTC fuse remains in this tripped high-resistance state until the fault is corrected by removing power. As the device cools down, the polymer shrinks, and the fillers recrystallize again, reconnecting the conductive paths automatically and resetting the PPTC fuse to its low, un-tripped resistance state without the need for manual replacement [1,2,4,6,7]. In addition, the associated thermal time lag means that the PPTC fuse will not operate during short-coupled lightning surge currents but will only protect when long-term AC or DC over-currents occur [1,8]. The PPTC fuse device is generally used as a series-connected thermal OCP device to protect electrical equipment, as illustrated in Figure 1, whether supplied by DC or AC.
Figure 1.
Series-connected resettable PPTC fuse for overcurrent protection.
According to IEEE Std C62.39 [8], the PPTC fuse OCP device trips when conducting a specified DC fault trip current for a determined time-to-trip value at a specified ambient temperature. This requires the use of an accurate constant current source and a costly temperature chamber to accurately determine the fault trip current level of a PPTC fuse at a known temperature. This test procedure is only for fault trip current values of 3 A or less. The time required for the PPTC fuse current to reduce to 50% of the initial specified DC fault trip current level determines the time-to-trip value [8].
Design engineers may need to determine the manufacturer’s PPTC fuse trip current level variation range to ensure proper overcurrent protection of electrical equipment at varying room temperatures. This also includes assessing the trip current level variation between different manufacturers with equivalent PPTC fuse device specifications. An affordable experimental method to accomplish this is to use only a controlled constant-current source (CCS) without an expensive temperature chamber. Therefore, this study demonstrates a low-cost, effective experimental approach for determining trip current level variation from a statistically significant sample of PPTC fuses tested at standard atmospheric conditions, with a room temperature range of 15 °C to 35 °C. This novel experimental analysis model will provide design engineers with a practical way to investigate trip current reliability at varying room temperatures without a costly temperature chamber that only determines the accurate trip current level at a specific temperature. This model will also allow design engineers to determine the trip-current reliability differences among manufacturers offering similar PPTC fuse specifications. The model uses a statistical confidence interval for the measured trip current level sample, which can be used as a reliable metric for population comparison analysis across different manufacturers.
The proposed experimental setup uses a CCS circuit to incrementally increase current through the PPTC fuse by 0.01 A. The equivalent time-to-trip specifications of the selected PPTC fuse manufacturers will be used to allow current to flow for each applied CCS setting before determining whether the PPTC fuse has tripped. The PPTC fuse trips if the current sensed through the device falls below 50% of the specified DC fault trip current. After each applied CCS setting for the specified time-to-trip, an experimentally determined internal zero-current cool-down time delay is used to avoid thermal runaway before applying the next incremented PPTC fuse current test.
The focus of the study is to provide a practical approach for adequately comparing average PPTC trip current levels between manufacturers with equivalent electrical specifications when operating over a varied standard room temperature range. It is not a definitive study on the absolute performance of PPTC trip current levels at a particular specified operating temperature. The novel aspect is not only to conduct PPTC fuse trip current level comparisons using the same low-cost experimental setup, without requiring an expensive temperature chamber. The study’s novelty is that the practical approach used to obtain a statistically significant PPTC fuse average trip current level reveals that the standard deviation is relatively low even across a wide range of standard room temperatures. This indicates that the obtained PPTC fuse average trip current level can be considered as a reliable metric for relative comparison between manufacturers with equivalent device specifications. Additionally, designers are interested in comparing PPTC trip current behavior across a varied standard room temperature range where the device is reasonably expected to operate. Therefore, it is essential to have a low-cost practical approach to compare the reliability of average trip current levels between PPTC manufacturers when operating over a varied standard room temperature range.
The problem has been discussed in this introduction, and the relevant publications are provided in the literature study section. A description of the novel experimental setup is provided in the methodology section. The recorded measurement results and analysis are then presented. The conclusion and reference list are provided at the end of this paper.
2. Literature Study
The Positive Temperature Coefficient Resistive (PTCR) Materials have been widely used in electronic/electric thermistor devices for overload protection, and the demand has increased dramatically [2]. There is still a research gap between high-temperature PTCR materials/theories and the application of high-temperature PTCR devices [2]. Our work addresses this gap, focusing on current limiters [2]. Typical PTCR materials consist of ceramic composite and barium titanate (BaTiO3)-based materials [2]. The BaTiO3 material exhibits voltage-current characteristics strikingly similar to those in our work. However, Polymer-based PTCR materials consist of an insulating polymer matrix and conductive filler materials [2].
Fuses have been the focus of a number of studies [8,9,10,11,12,13,14], which is an important aspect in protecting electronic circuits because overcurrent can result in circuit failure. Polymer-based materials have also been the subject of a number of studies [12,13,15,16,17,18,19,20,21,22,23,24,25], whereas their reliability has been studied in [14,26,27,28,29,30,31]. A resettable PPTC fuse is a device that can trip from its normal operating low-resistance state to a high-resistance state in a short time when overheated by ambient heat or the Joule heat generated by high current [14]. It is well known that fuses should break contact when an overcurrent is detected. The application of accelerated life tests, whether at higher temperatures or with higher than normal stress levels, can reduce the life and reliability of a protection device [31]. However, according to the authors’ knowledge, no studies have been performed to demonstrate a cost-effective experimental approach that does not require a temperature chamber for determining trip current reliability from a statistically significant sample of PPTC fuses tested at varying room temperatures.
In the work of [9], a lifetime model was introduced, which is based on elastic and plastic deformation simulations of fuses where Finite Element Method simulations were performed. This can be used to improve reliability. Previous studies suggest that fuse aging can be affected by diffusion of tin overlay, corrosion, moisture, cyclic stress, and contact contamination [9]. There is a direct correlation between the cycles to failure and the simulated strain, fuse bridge temperature, temperature elevation, and activation energy. Fuses were the central point of two studies where improvements on hybrid DC circuit breakers were made [10]. When it comes to fuses, during arc interruption, high arc resistance is desired, and after arc interruption, high insulation resistance is desired [16]. The silica-sand filled inside the fuse case resulted in a shrinking arc conductive diameter by the ablation of the polymer-narrow section. In the work of [32], detection tools were developed to monitor fuses at distribution substations. Detection tools and schemes assist in effective savings, as in the case of [33], where dual-setting directional reclosers were used in distribution networks.
Tensile testing can also be a factor in fuses. In the work of [19], it was assumed that the hardening of semi-crystalline polymers ceases beyond a specific temperature—referred to as the limiting temperature—during the analysis, where fused deposition modelling—which was also the subject of the work conducted in [26]—was used. The results show two important aspects that should be considered as follows [19]:
- Higher elasticity equals lower yield and tensile strength.
- Higher temperature equals more elasticity, which can reduce the device’s capability to handle stress.
Abnormal behavior of resettable fuses can damage a circuit [14]. However, degradation of resettable fuses can be monitored based on precursor parameters. Prognostics and health management of resettable fuses can reduce damage to products if implemented correctly.
Characterization of polymers is important to understand their behavior and implement fuses accordingly. Characterization was also performed in the work of [18], where the application was for the use of superconducting magnets. Additionally, the higher the operating temperature, the lower the Young’s modulus and the higher the coefficient of thermal expansion [18]. Monomers cannot work for this purpose since they are single-molecule implementations.
Factors that affect the PCTR effect of polymer-based matrix include polymer crystallinity, melting point, grain size, and distribution [2]. Multiple types of fillers are a viable method for preparing PTCR nanocomposites at lower costs. An additional factor is the limitations of polymer-based PTCR materials, such as the electrical reproducibility of these composites, irregular structure variations, occurrence of the NTC phenomena, as well as the PCTR phenomena.
The technique used in making PTCR materials is time-consuming since it must be produced in high quantities for industrial and research applications [2]. The use of multilayer structures with varying resistivity can improve self-regulation behavior and enhance performance in PTCRs in specific temperature ranges. The introduction of porosity is included, offering benefits in oxidizing grain boundaries and generating surface acceptor states. High porosity is required for excellent PCTR behavior with smaller grain sizes.
The 3D printing of polymers has also been studied recently [20,22,23,25]. Polymers have a range of applications in the field of 3D printing due to their chemical resistance, good plasticity, and low cost [20]. Common polymer materials used are Polylactic Acid, Acrylonitrile–Butadiene–Styrene, and Nylon due to their ability to melt quickly. In the work of [22], Quasi-Optical components (rectangular horn antennas, 90° off-axis parabolic mirrors, radiation absorbent material, grid polarizers, and dielectric lenses) were 3D printed and analyzed. Results show that the components operate in the 140–220 GHz band. This shows the versatility of polymers. In the work of [25], Fused Deposition Modeling was used to integrate Polymer Thick-Film electronics in 3D printed structures, such as conductive and resistive layers. The last work of note where 3D printed polymers were used was in the work of [23], where an electromagnetic scanning micromirror was developed. In that work, a high-temperature resistant polymer was used, which again shows the versatility of polymers. It can be argued for 3D printers (for instance), that for the same 3D printer with similar materials used from different manufacturers, different results would be obtained. Equally, if different 3D printers from different manufacturers ought to be used where the materials are the same, the results would also differ for PPTC fuse devices. Similar arguments could be made for other applications which are part of the novelty of this work.
Reliability studies on 3D-printed sensors were conducted in [34], where they were implemented in functional wearable assistive devices. Such devices require precision sensors, which can be problematic to obtain. Three-dimensional printing allows the designer to alter the composition of the sensor, thereby improving its reliability. In [27], a physics-of-failure-based reliability optimization approach was used to improve the reliability of consumer healthcare devices. A similar approach was used in [35], where the degradation of photovoltaic Balance of Systems components was studied, and in [36,37], where the reliability of Zener diodes was investigated. In the experimental work, the specimens were subjected to increasing temperatures while the arching of metal was studied as a failure mode. This shows that the experimental approach we adopted is an acceptable method for this type of research. Some researchers prefer single-method approaches, while others prefer multiple-method approaches. That is the case with the work performed in [28], where a Multi-Criteria Analysis of Sensor Reliability (MCASR) was used for Wearable Human Activity Recognition. The two criteria used in that work were the conflict between sensor readings and the imprecision of sensor readings. A novel fused Long Short-Term Memory with MCASR was used to solve the problem. A different multiple-method approach was used in the work of [29], where Markov models were employed in a two-stage optimization. In the work of [30], a three-stage approach was used. The first stage is to use discrete- and continuous-state stochastic processes to model degradation behavior. The second stage is to integrate these two models into a joint state probability distribution by fusing multilevel sensing data. The last stage consists of developing a marginal state probability distribution system to dynamically assess system reliability. Lastly, according to the author’s knowledge, very little work has been conducted using AI to assess reliability. In the work of [31], Bayesian Neural Networks and Differential Evolution algorithms were used to enhance reliability assessment where small samples were used. It was proven with that work that results can be enhanced with the use of machine-learning algorithms. This is left for future work as more experimental studies are being concluded in this field. The results show that by increasing the operating temperature of the samples, reliability decreases.
3. Methodology
The current reliability comparison of three selected commercially available PPTC fuses from different manufacturers with equivalent electrical specifications is analyzed by this study. The identification codes of AX, BY, and CZ are assigned for each sample group of 30 randomly selected manufacturer resettable PPTC fuses. All three selected PPTC fuse manufacturers have an equivalent specified trip current level of 1 A with an associated holding current of 0.5 A.
Each selected manufacturer PPTC fuse group will be tested using the same novel experimental setup to obtain the required measurements for statistical analysis. The Equivalent electrical specifications of the three manufacturer-selected PPTC fuse devices are summarized in Table 1.
Table 1.
Selected manufacturer resettable PPTC fuse electrical specifications.
Note that the average specifications obtained from manufacturer data sheets that are provided in Table 1 will require the use of an expensive temperature chamber set to 23 °C. Our practical experimental setup is a low-cost method that will not require an expensive temperature chamber to yield reliable comparison results, as clarified in Section 4. The maximum voltage () specifies what the PPTC fuse device can withstand without damage. The PPTC fuse manufacturer, CZ, has a higher withstand capability than that of manufacturer AX and BY. However, this will be tested at an equivalent applied voltage level. The maximum current () is the value for the specified operating temperature range, which should not be exceeded through the PPTC fuse to prevent device damage. The power dissipated () specifies what the PPTC fuse typically dissipates when it is in the tripped state at 23 °C in a still air environment. The initial resistance () range specifies the DC un-tripped resistance of the PPTC fuse at 23 °C as received from the factory. Manufacturers may also specify the PPTC fuse resistance one hour after a trip event () and the maximum allowed resistance value () which will not be required for this analysis. The trip current () specifies the lowest current that will cause a trip event within a specified time-to-trip () at 23 °C in still air. Starting from the time a fault is applied, the value is the time required for the PPTC fuse to transition into a high tripped resistance state. The hold current () sometimes known as rated or non-tripping current, specifies the maximum current which will not cause a PPTC fuse trip event at 23 °C in still air [1,8]. The is used when measuring and is commonly either 1 A or five times . The IEEE standard (C62.39-2012) [8] time-to-trip test states that a PPTC fuse has passed into a tripped state when the measured current reduces to 50% of the specified fault. Therefore, for this study, because the specified is at 50% of the specified of 1 A, the PPTC fuse has tripped if the sensed current flowing through the device falls below the level of 0.5 A. All three selected PPTC fuse manufacturers specify the same value of four seconds. Therefore, after applying each incremental test current flow setting through the PPTC fuse for four seconds, the device will have tripped if the measured current flow falls below the of 0.5 A. The novelty of this study is that a low-cost experimental setup will be used to measure all three selected PPTC fuse manufacturer samples to determine the average level at standard atmospheric varying room temperatures. This metric can then be used as an effective reliability comparison between manufacturers that have similar PPTC fuse specifications [1,8].
3.1. Algorithm for Automated Experimental Setup
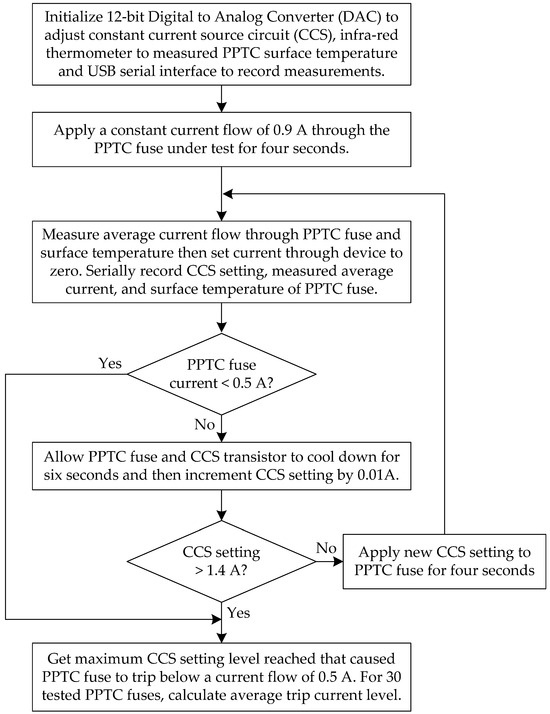
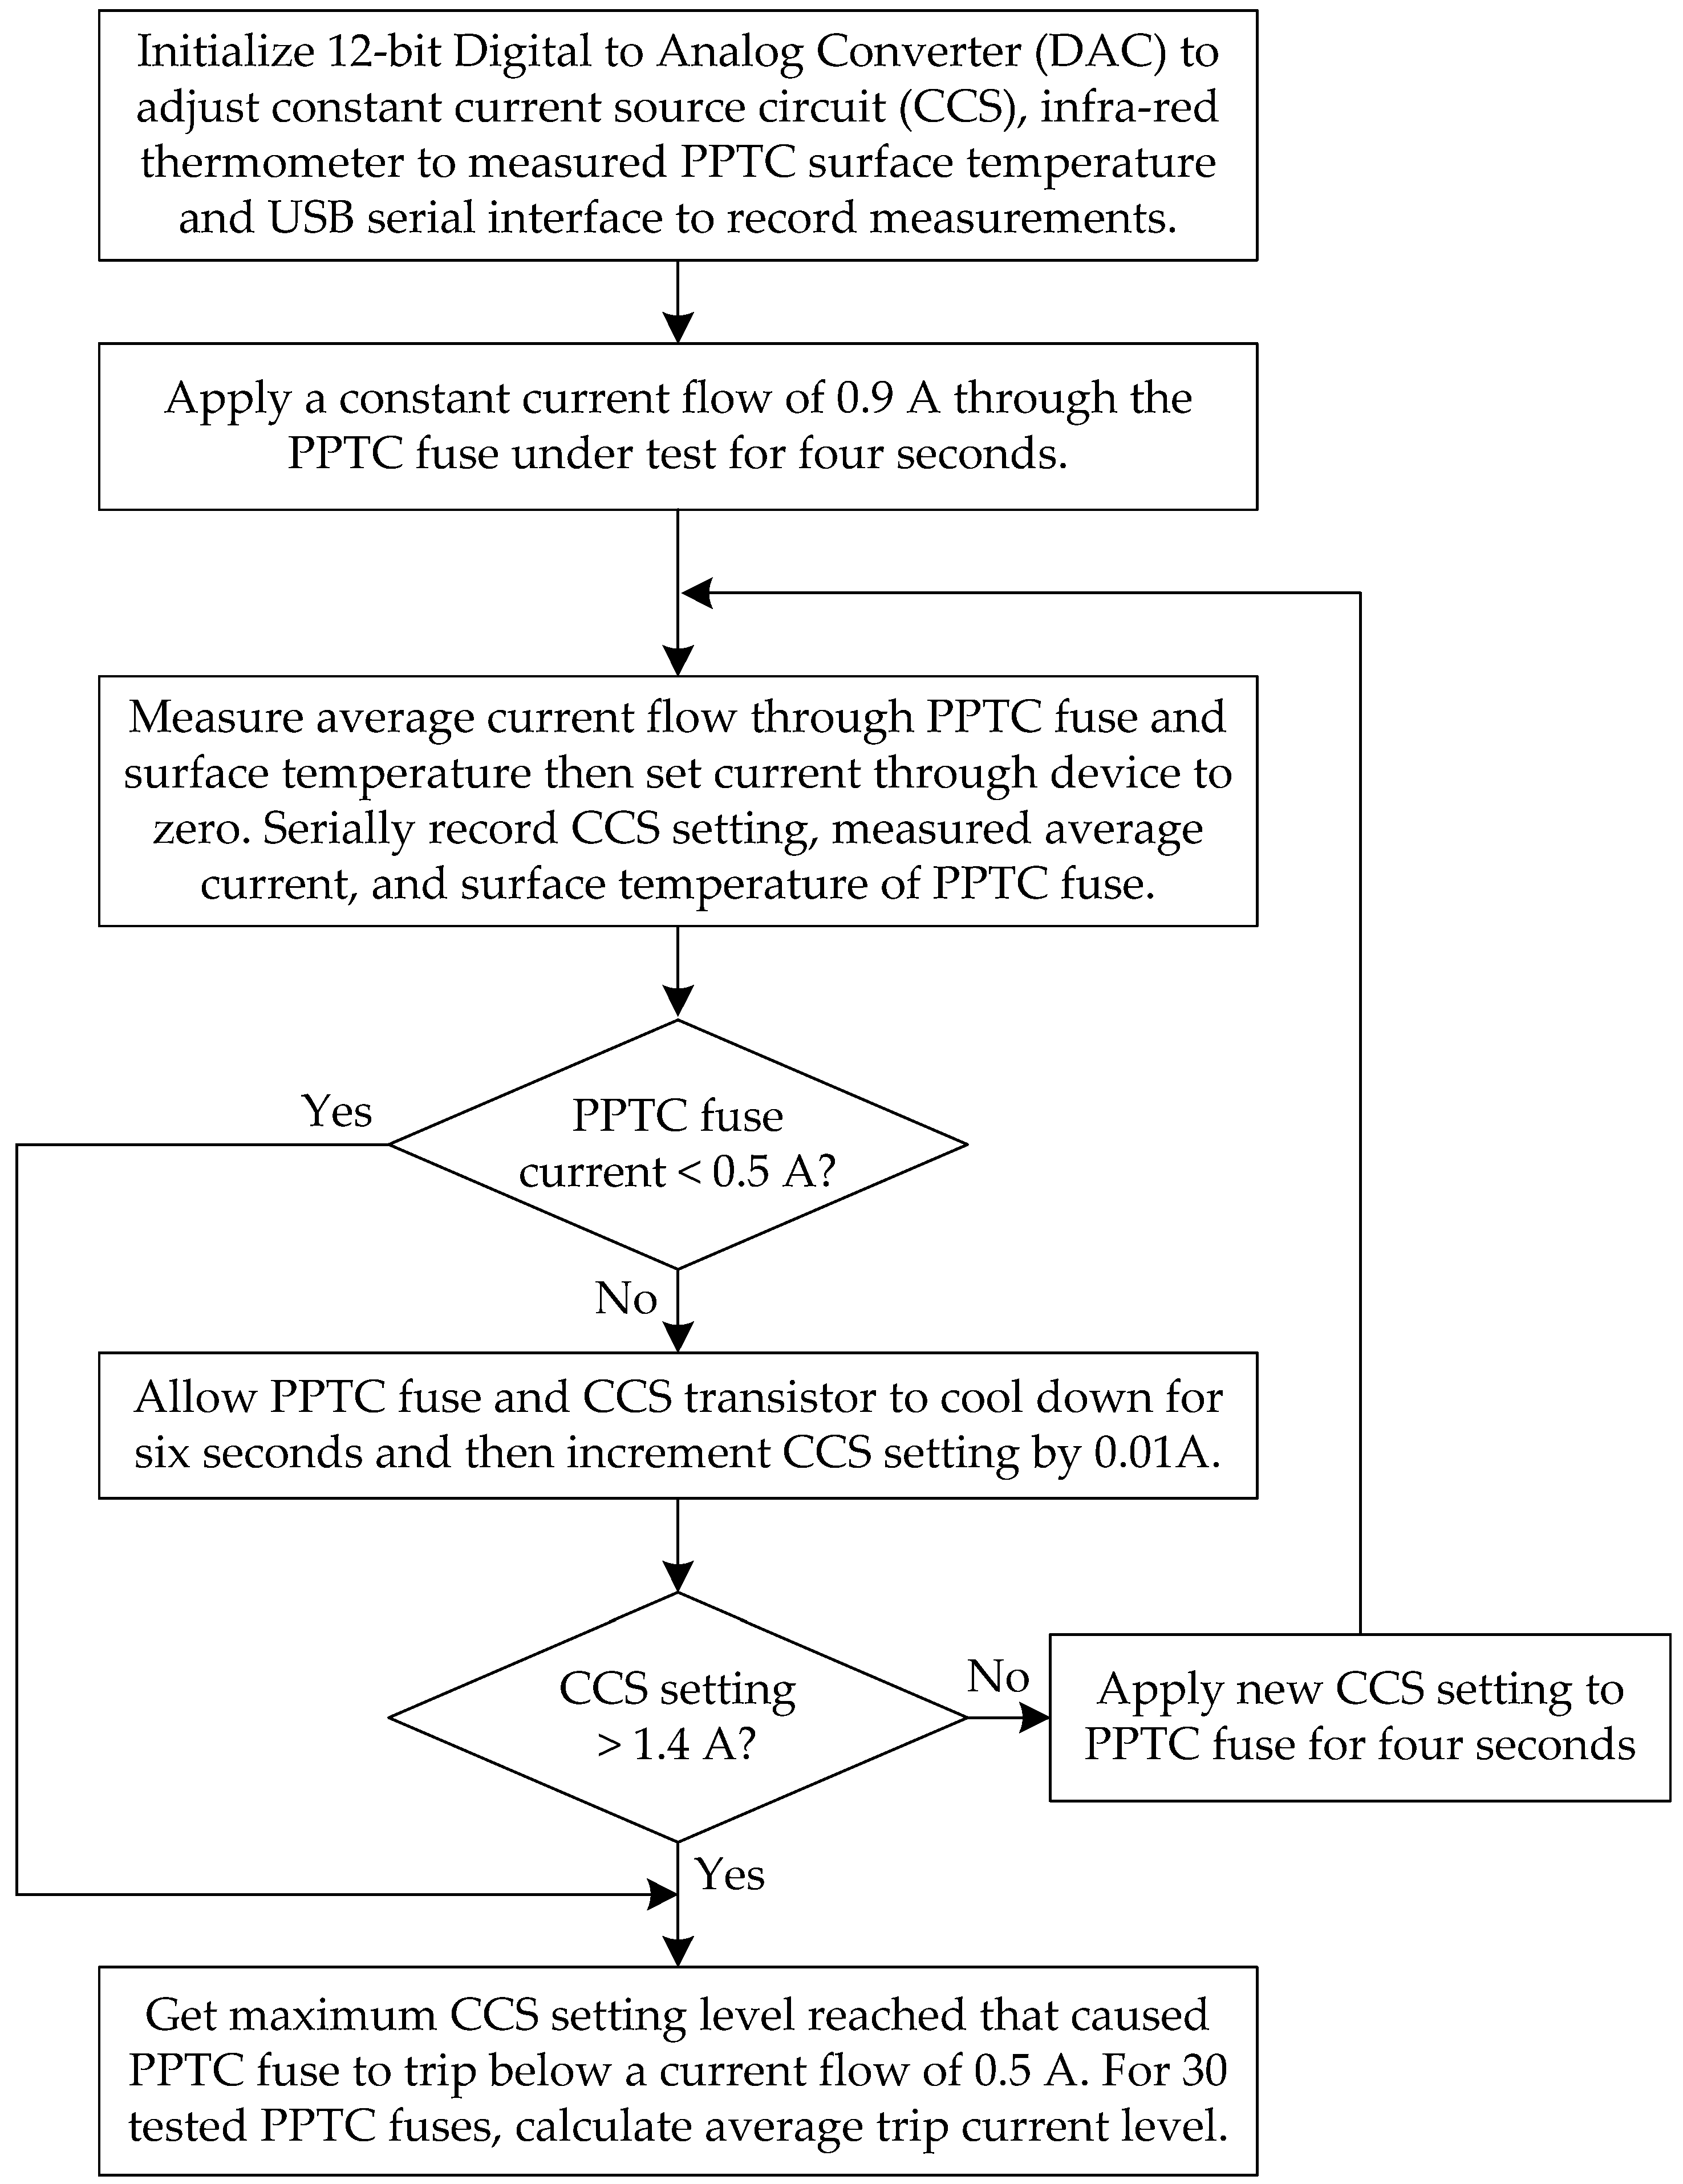
The flowchart algorithm to automate the proposed novel experimental setup that is used to determine the PPTC fuse trip current level is shown in Figure 2.
Figure 2.
Flowchart algorithm to determine a PPTC fuse trip current level.
Applied CCS setting and PPTC fuse current flow measurement consistency is more important than absolute CCS setting and current measurement accuracy. This is because the same experimental setup was used to compare the trip current levels of the three selected manufacturer devices. The algorithm flowchart outlines the sequence of steps used to determine the average trip current level reached that caused the PPTC fuses to trip after a CCS setting application for four seconds. A 12-bit digital-to-analog converter (DAC) is used to control a CCS circuit to accurately set the current through the PPTC fuse under test. All selected PPTC fuses are tested under standard atmospheric conditions, with varying room temperatures. Therefore, an infrared thermometer will be used to determine the initial average temperature after the first CCS setting is applied, and the final average temperature after the PPTC fuse has tripped. These two average temperature measurements for each sample group will be used to determine the temperature rise for each selected PPTC fuse manufacturer sample. The microcontroller that automates the experimental setup will use a USB interface to transmit and record measurements serially.
Initially, a constant current setting of 900 mA will flow through the PPTC fuse under test for the specified time-to-trip of four seconds. Thereafter, the current through the PPTC fuse is measured, along with the device’s surface temperature. The current flowing through the PPTC fuse is then set to zero via the 12-bit DAC interface with the CCS circuit. The applied CCS setting value, the measured average current through the PPTC fuse, and the measured surface temperature are serially recorded in Microsoft Excel using the Microsoft Excel’s Data Streamer software tool available in Microsoft Office 365 package. If the actual measured current flow through the PPTC fuse has fallen below the specified holding current of 0.5 A, the automated test procedure is stopped. If not, the PPTC fuse, including the CCS circuit transistor, is allowed to cool down for an experimentally determined interval of six seconds to prevent thermal runaway and inaccurate CCS settings. Afterwards, the CCS setting is incremented by 0.01 A, and if it is not greater than 1.4 A, it is reapplied to the PPTC fuse under test for the specified time-to-trip of four seconds. Through experimentation, it was determined that all three selected PPTC fuse manufacturer devices will trip before reaching 1.4 A.
After the current through the PPTC fuse under test drops below the holding current of 0.5 A, the final recorded CCS setting will indicate the maximum current level that caused the device to trip. At least 30 random PPTC fuses from each selected manufacturer were experimentally tested, and any outlier trip current measurements were excluded to determine a statistically significant average trip current.
3.2. Constant Current Source and Measurement Circuit
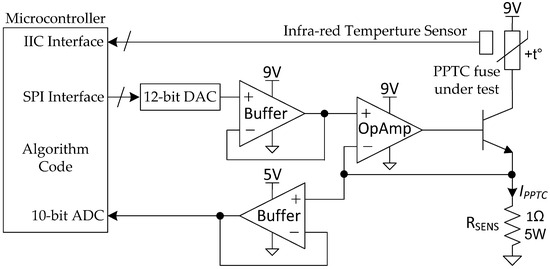
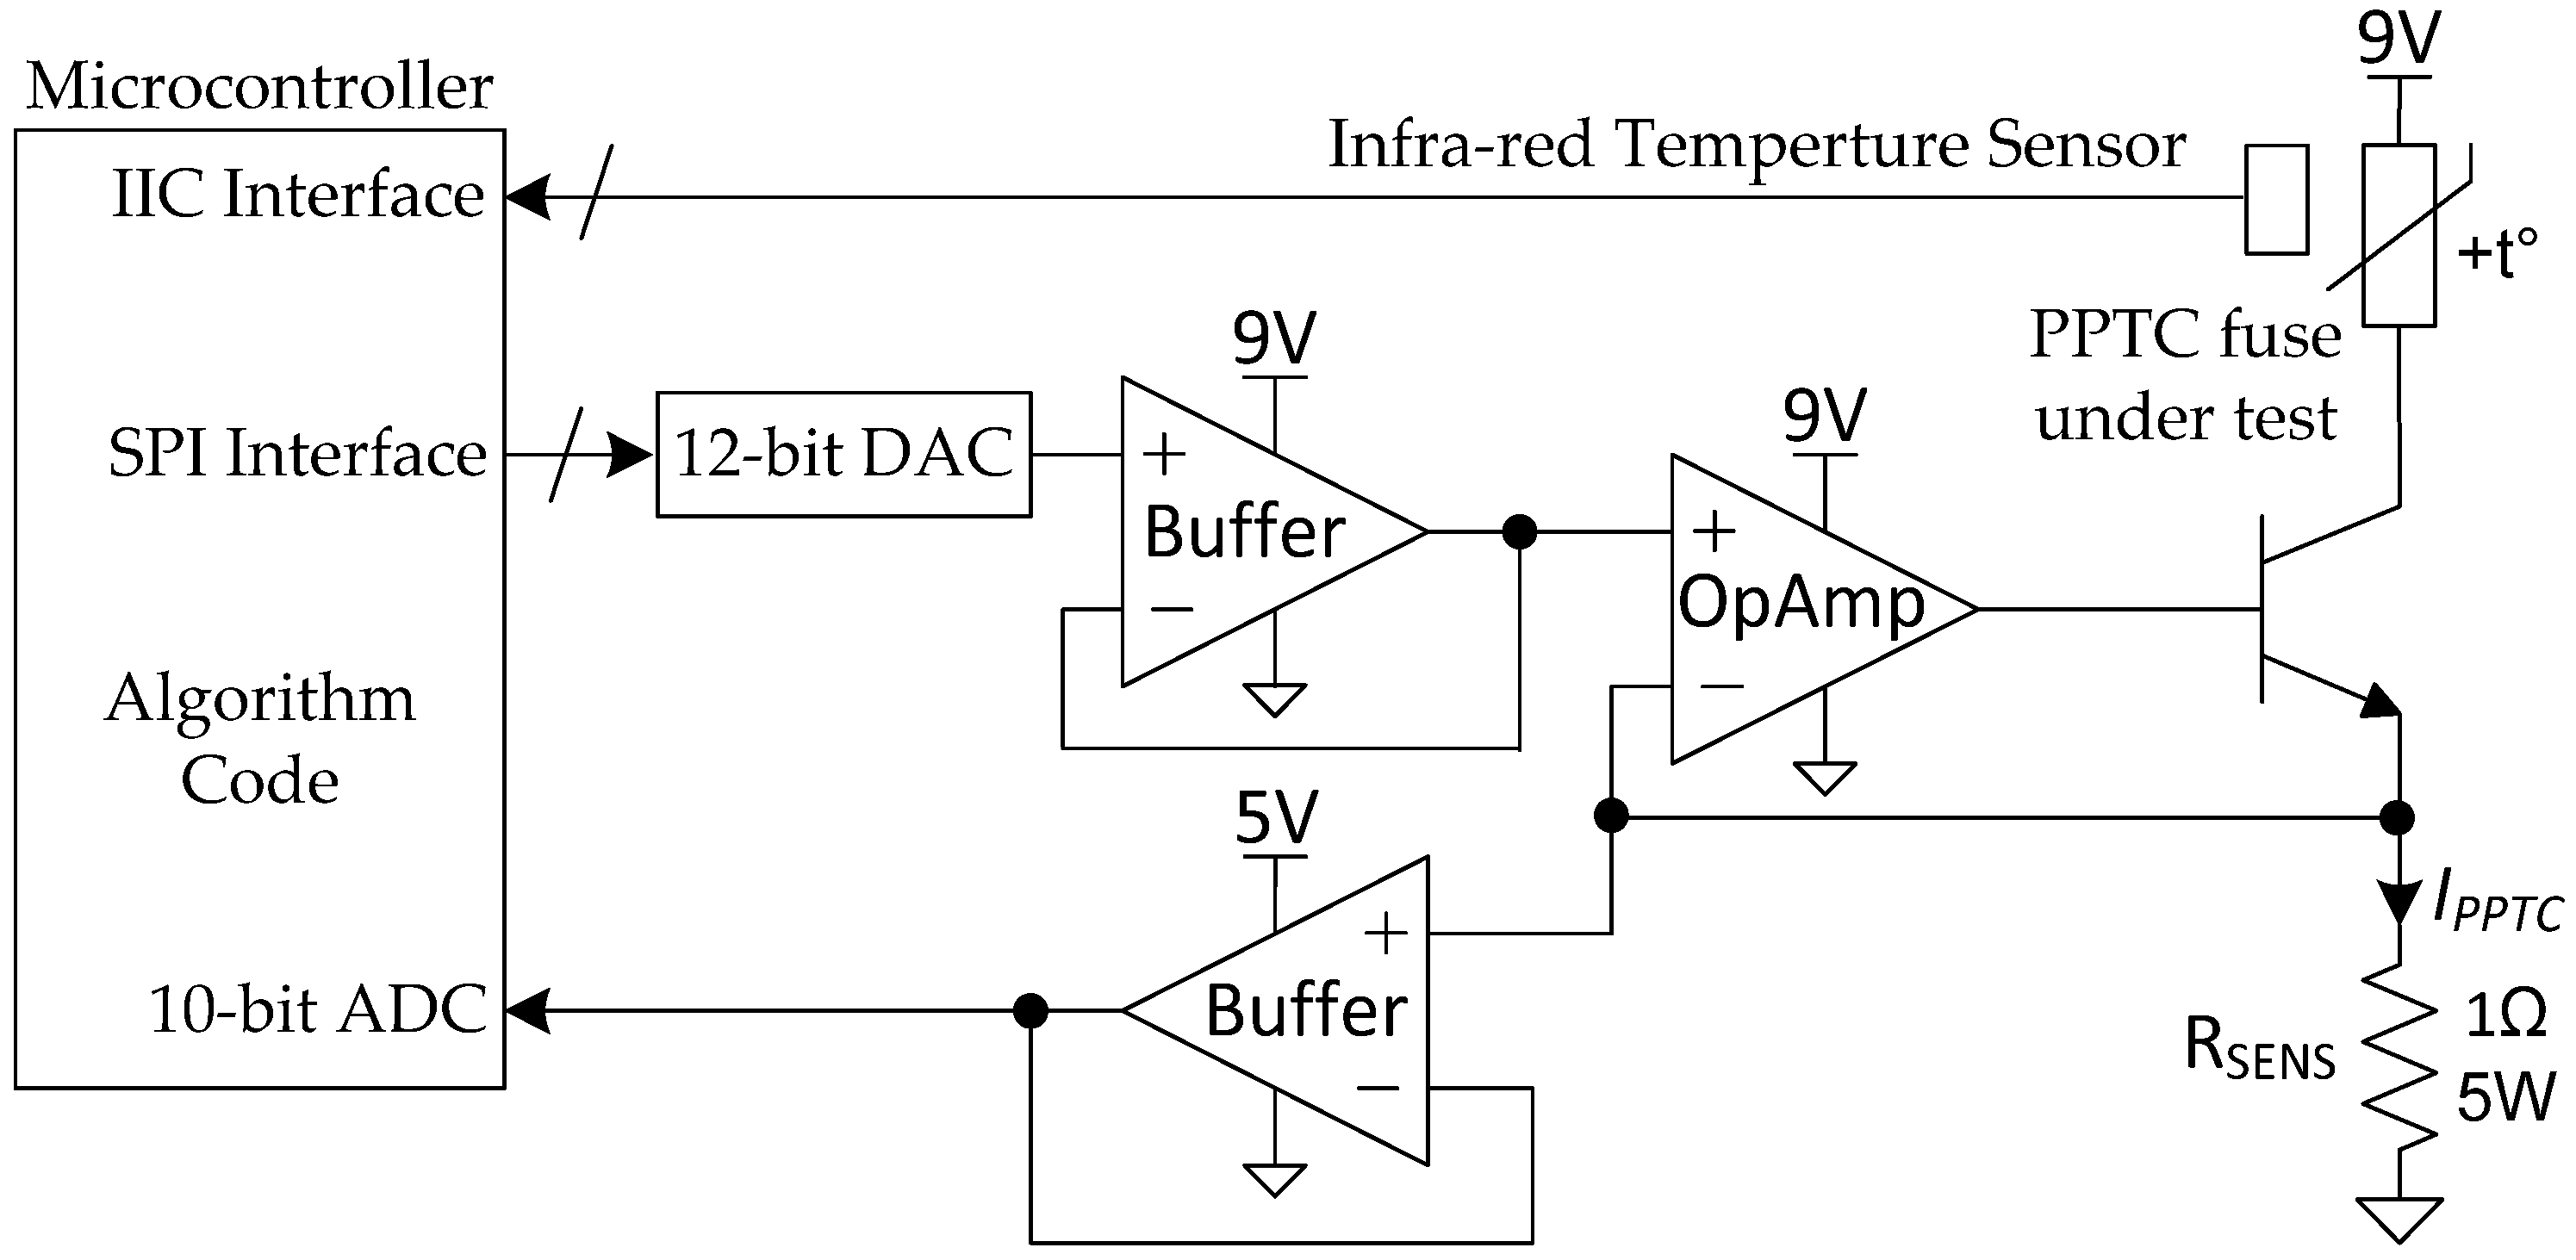
The CCS circuit controlling current through the PPTC fuse under test is illustrated in Figure 3. The actual current flow through the PPTC fuse is also measured to determine when the device has tripped. An infrared temperature sensor (MLX90614 from Melexis Microelectronic Integrated Systems, Ieper (Ypres), Belgium) placed 5 mm away is used to measure the PPTC fuse’s surface temperature after 4 s for each applied CCS setting. The infrared temperature sensor offers a standard accuracy of ±0.5 °C at room temperature with a resolution of 0.01 °C. The microcontroller serial port interface (SPI) is used to control the 12-bit DAC’s output voltage, while an operational amplifier buffer is used to prevent loading the DAC’s output.
Figure 3.
PPTC fuse: constant current source and measurement circuit.
The operational amplifier that receives the buffered DAC set output voltage then drives the power transistor to supply the required current through the sensing resistor (RSENS), ensuring that the developed voltage matches the set DAC output voltage. This is achieved by feeding the voltage developed across RSENS back to the operational amplifier’s inverting input. Therefore, to set a constant current flow of 1 A through the series-connected PPTC fuse under test, the DAC output voltage should be set to 1 V, since a 1 Ω RSENS is used (IPPTC = 1 V/1 Ω = 1 A). Additionally, the developed voltage across RSENS is buffered to avoid loading, then passed to a microcontroller’s 10-bit analogue-to-digital converter (ADC) input. In this way, the actual current through the PPTC fuse can also be measured to determine whether the device under test has tripped after 4 s of applying a CCS setting.
To improve accuracy, both the CCS and the current measurement circuits were calibrated by initially using a six-and-a-half-digit precision current measurement multimeter connected in place of the PPTC fuse. The DAC output voltage was adjusted via SPI until the multimeter displayed the required starting current of 0.9 A. Then this 12-bit DAC setting was recorded, and the current flow was set to zero to allow the CCS power transistor to cool down before adjusting the 12-bit DAC again until the multimeter read 0.95 A. This next 12-bit DAC setting was recorded, and the process was repeated to obtain the actual 12-bit DAC settings to produce 0.9 A to 1.4 A in steps of 0.5 A. The recorded 12-bit DAC settings for the accurately produced output current steps were graphed in Microsoft Excel. An equation for the approximate linear trendline was then determined to ensure that the microcontroller can calculate the required DAC setting to adjust in steps of 0.01 A.
The 10-bit ADC result of current measurements from 0.9 A to 1.4 A in steps of 0.5 A was also recorded and graphed in Microsoft Excel. An equation for the approximate linear trendline was then determined to ensure that the microcontroller can calculate the actual current flow through the PPTC fuse under test. To improve current measurement consistency, ten evenly spaced 100 µs interval measured ADC results were used to calculate the average ADC result before using the linear equation to determine the actual measured current. Additionally, to avoid varying the CCS power transistor gain, an adequate heatsink was used to dissipate heat generated in the junction, and a cool-down time interval was used between each CCS setting. It was empirically determined that a cool-down interval of at least six seconds between each four-second CCS applied setting of 0.9 A to 1.4 A in steps of 0.01 A would ensure accurate and consistent current flow settings through the PPTC fuse under test. This was verified with a current measurement six-and-a-half-digit precision multimeter connected in place of the PPTC fuse when the applied current sequence was automated. This study only investigates the reliability of the PPTC fuse trip current level and not the maximum withstand voltage of the device. Therefore, a separate, precise 9 V linear DC power supply was used to bias the PPTC fuse under test, and this lower selected voltage helped to reduce the CCS power transistor’s internally generated heat.
3.3. Experimental Setup Construction
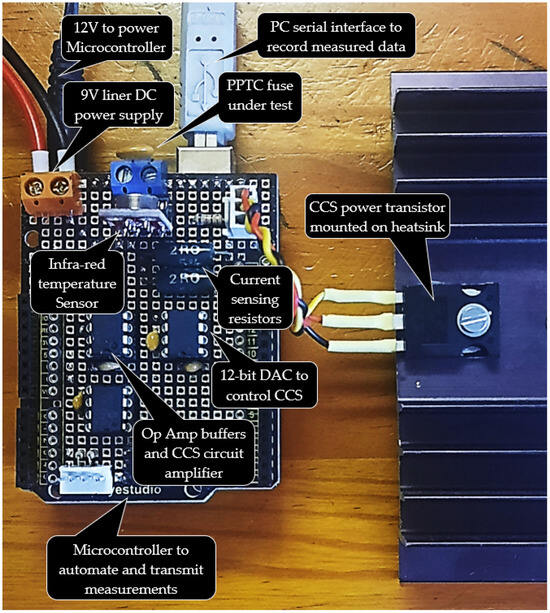
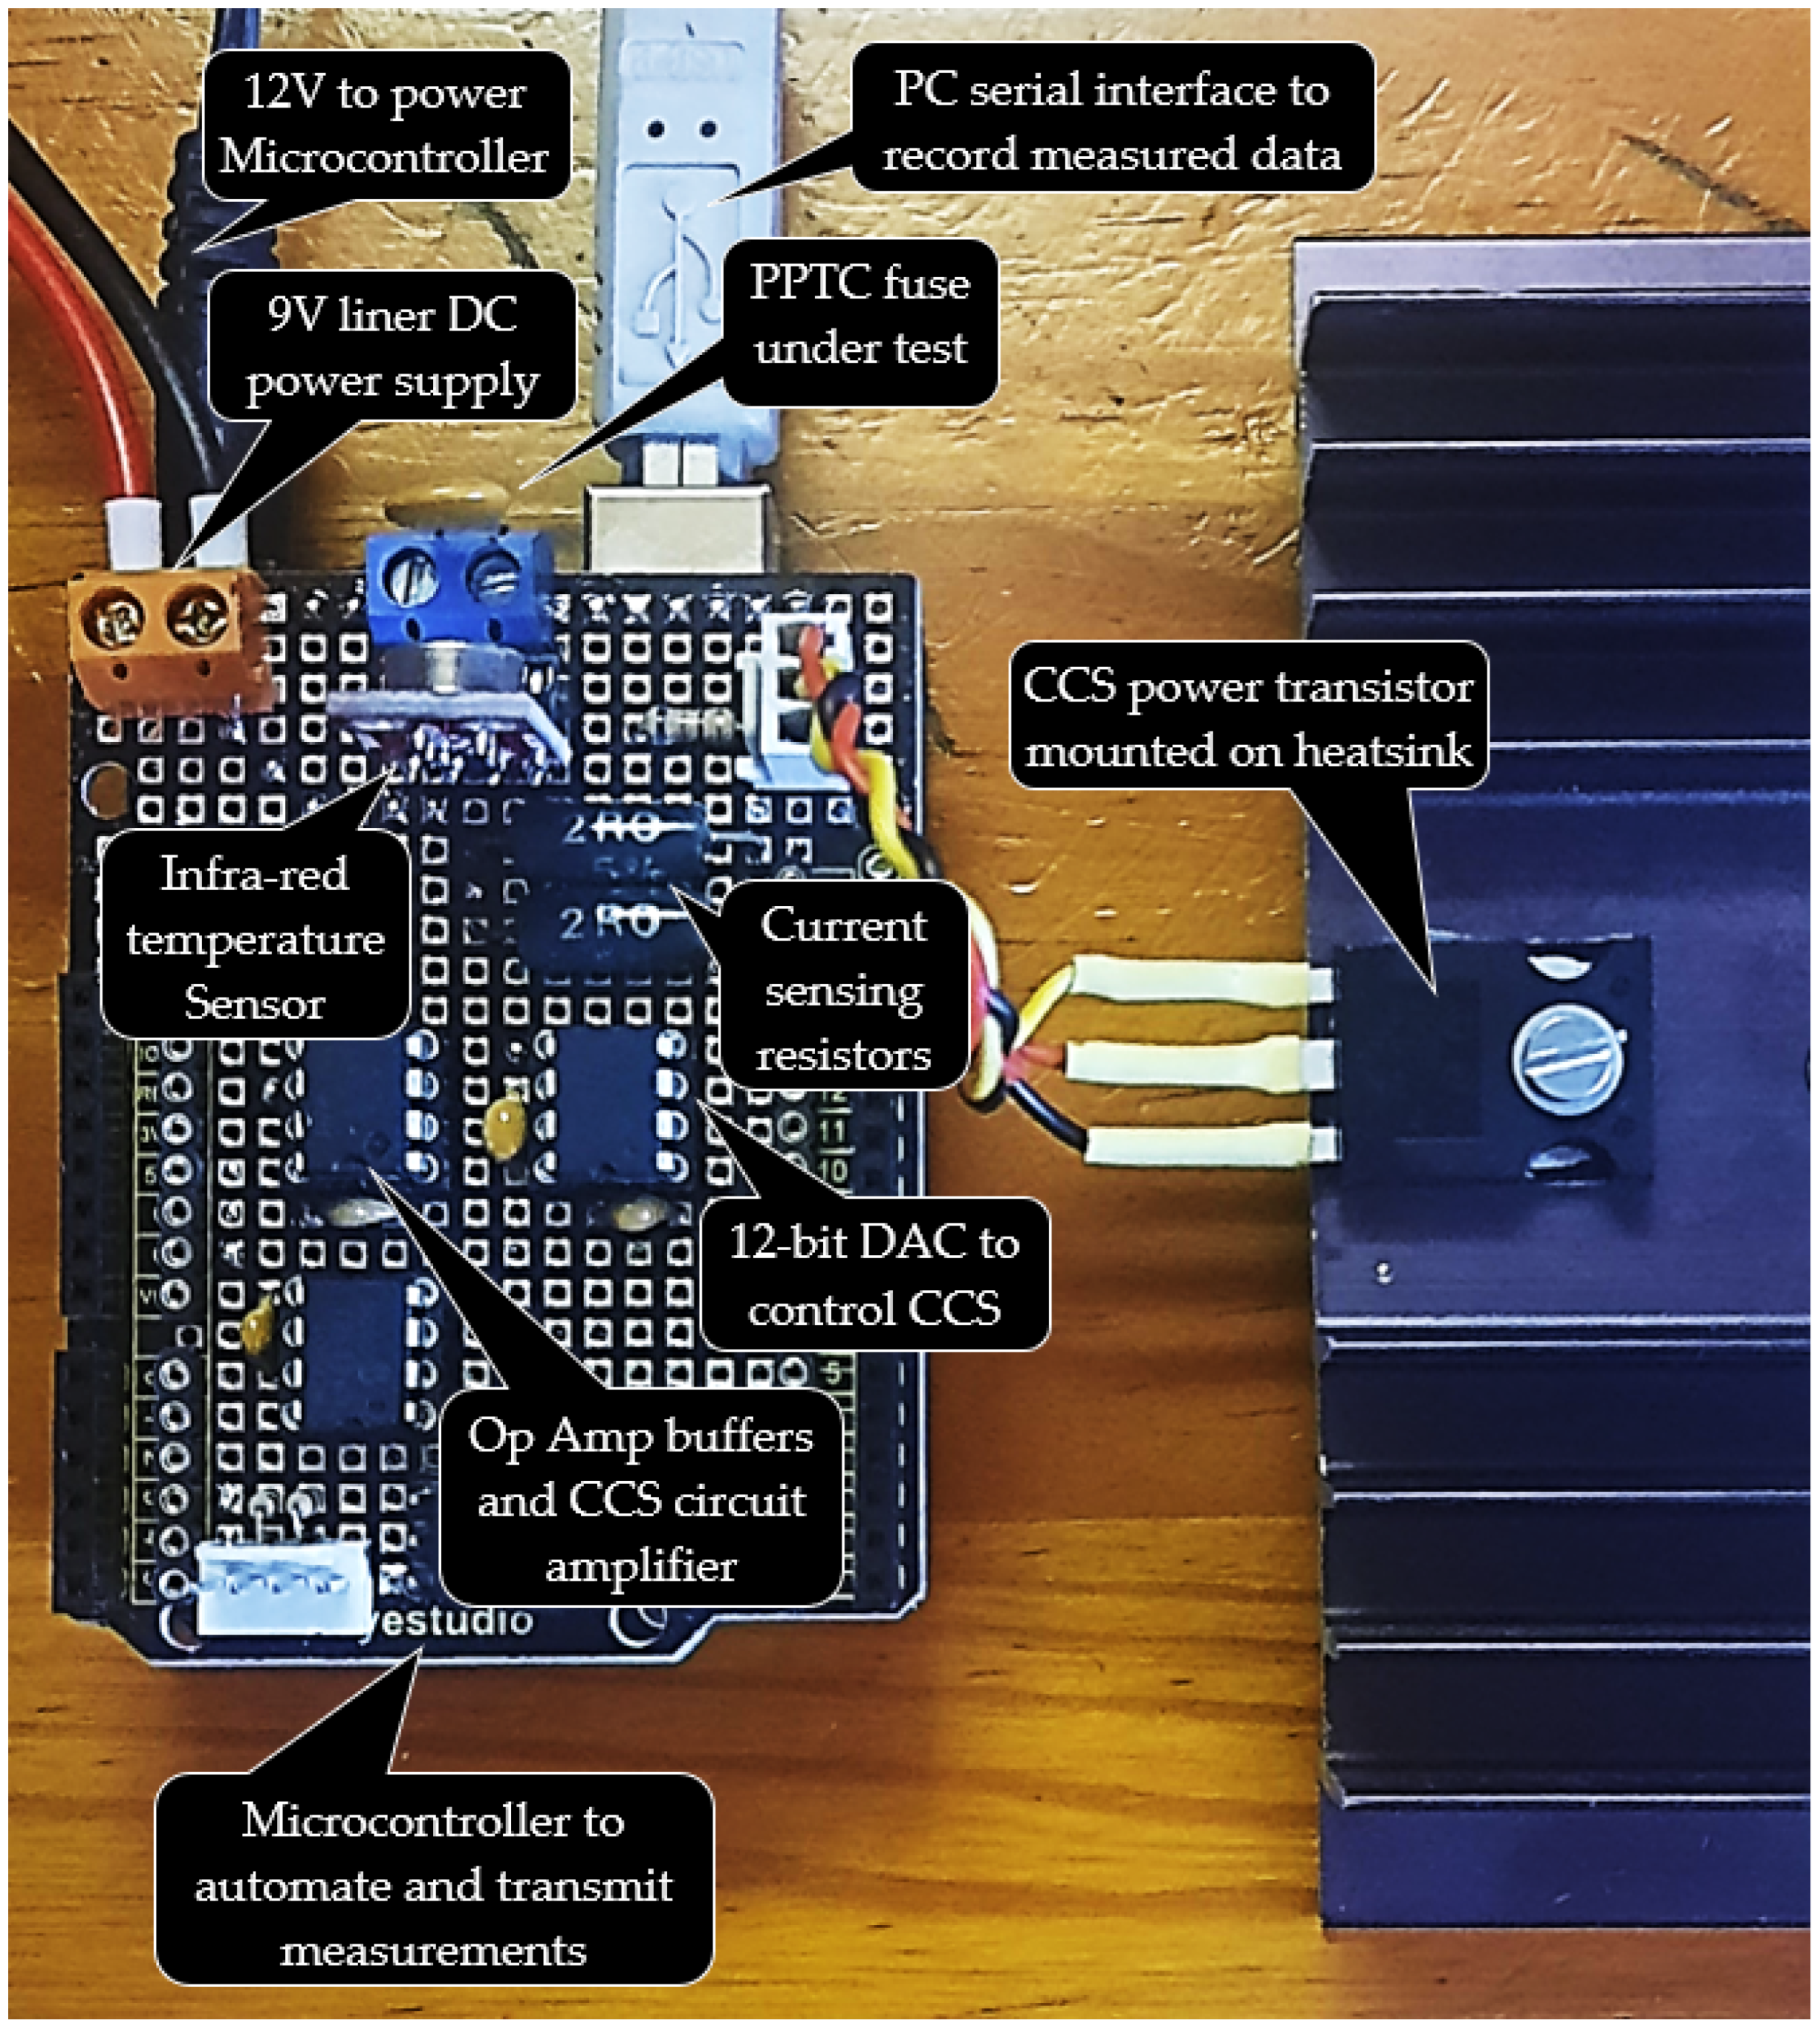
A photograph of the constructed novel experimental PPTC fuse test setup to investigate trip current reliability is shown in Figure 4. The photograph clearly shows a connected PPTC fuse under test, facing an infrared temperature sensor.
Figure 4.
Experimental setup construction for PPTC fuse trip current reliability investigation.
The PPTC fuse CCS circuit makes use of a precise 9 V linear DC power supply for current control from 0.9 A to 1.4 A in steps of 0.01 A. This is achieved by using a 12-bit DAC output voltage to control the CCS circuit as indicated in Figure 4. A separate 12 V power supply was used to power up the microcontroller via an onboard 5 V regulator. The CCS power transistor was mounted to a heatsink as shown in Figure 4, to ensure adequate dissipation of heat, which minimizes transistor gain variation. As indicated in Figure 4, two 2 Ω 3 W resistors were connected in parallel to provide an approximate 1 Ω 6 W current sensing resistor. The buffered current-sensing resistor circuit was calibrated and used to measure the average current flow through the PPTC fuse under test.
The experimental setup was automated by the microcontroller code to apply each CCS setting for 4 s, then measure the PPTC fuse surface temperature and the actual current flow. If the current flow through the PPTC fuse did not fall below the specified holding current of 0.5 A, a cool-down interval of six seconds with zero current flow was applied before the next increased CCS setting was applied again. The CCS setting, the actual measured current, and the PPTC fuse surface temperature after each 4-s fixed-current application were recorded by serially transmitting them to Microsoft Excel via the Data Stream software tool. The recorded data from the PPTC fuse under test would then be analyzed in Microsoft Excel, and the device under test would then be replaced with the next PPTC fuse to test.
4. Results and Discussion
According to IEEE Standard C62.39 [8], all OCP device tests should be carried out under standard atmospheric conditions of 15 °C to 35 °C temperature, 25% to 75% relative humidity, and 86 kPa to 106 kPa air pressure variation [8]. Within the standard atmospheric room temperature range, the surface temperature of the PPTC fuse under test was initially measured after 0.9 A flows for four seconds. This is to show that surface temperatures at the start of the process of all tested devices were within a varied standard room temperature range (15 °C to 35 °C). The mean, standard deviation, maximum, minimum, and range of thirty PPTC fuse surface temperature measurements for each of the selected manufacturer devices are shown in Table 2.
Table 2.
PPTC fuse sample surface temperature analysis after 4 s of initial 0.9 A current flow.
As shown in Table 2, the mean PPTC fuse sample surface temperature is approximately equivalent, and the standard deviation is not more than 2.0 °C. The maximum to minimum PPTC fuse surface temperature measurement range is not more than 7.2 °C. The variation in the initial measured PPTC fuse surface temperature within the standard room temperature range could be attributed to the ambient temperature variations and the initial device resistance variations due to the I2R heating effect of each sample. Since standard deviation is relatively low for all samples, it can be concluded that the ambient temperature variation should not significantly affect the average PPTC fuse current trip level determination. The measured surface temperature of a tripped PPTC fuse after four seconds, when the measured current through the device falls below the holding current of 0.5 A, was also recorded for each sample. The reason the tripped PPTC fuse surface temperature was measured is to show that it is significantly higher than the initial standard room temperature range. This then indicates that internal device I2R heating has a greater effect in causing a PPTC fuse trip condition than ambient standard room temperature variation. Tripped PPTC fuse surface temperature mean, standard deviation, maximum, minimum, and range for thirty devices of each selected PPTC fuse manufacturer are shown in Table 3.
Table 3.
Tripped PPTC fuse surface temperature analysis after 4 s of trip current flow.
As shown in Table 3, the mean PPTC fuse surface temperature is again approximately equivalent, and the standard deviation is not more than 3.3 °C. The maximum to minimum PPTC fuse surface temperature measurement range is not more than 13.6 °C. Therefore, variation in a tripped PPTC fuse surface temperature cannot be attributed only to room temperature variation but primarily to the device resistance variation of each sample. The difference between the average initial and tripped PPTC fuse surface temperature for 30 devices of each selected manufacturer is shown in Table 4.
Table 4.
Tripped PTC fuse surface temperature measured after 4 s.
As shown in Table 4, the difference between the average initial and tripped PPTC fuse surface temperature is between 15.7 °C and 17.6 °C. The average surface temperature change from the initial state of all three manufacturer-selected devices is greater than the room-temperature variation, indicating that I2R heating has a greater effect. The maximum CCS setting, that caused the current flow through each PPTC fuse to drop below its holding current of 0.5 A after a 4-s application was extracted from the recorded data. The following equation was used to determine the average trip current level for thirty PPTC fuses of each selected manufacturer device:
where is the maximum CCS setting applied (in Amperes) that caused the current flow to drop below of 0.5 A after 4 s (excluding any outliers). is the average trip current of a sample of n equal to 30. The following is thoroughly explained in earlier works of [35,36], that the population standard deviation can be estimated by using the following sample standard deviation (in Amperes) equation:
4.1. Measured Sample Data Summary
The five-number summary method, as described in [36,37], was used in this study. Table 5 shows the five-number summary, calculated interquartile range (IQR), outlier limits, , and the associated sample standard deviation () for the determined levels of thirty PPTC fuses from each selected manufacturer.
Table 5.
Determined PTC fuse sample data summary of three different manufacturers.
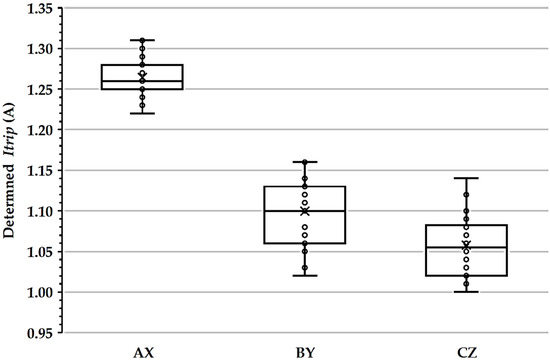
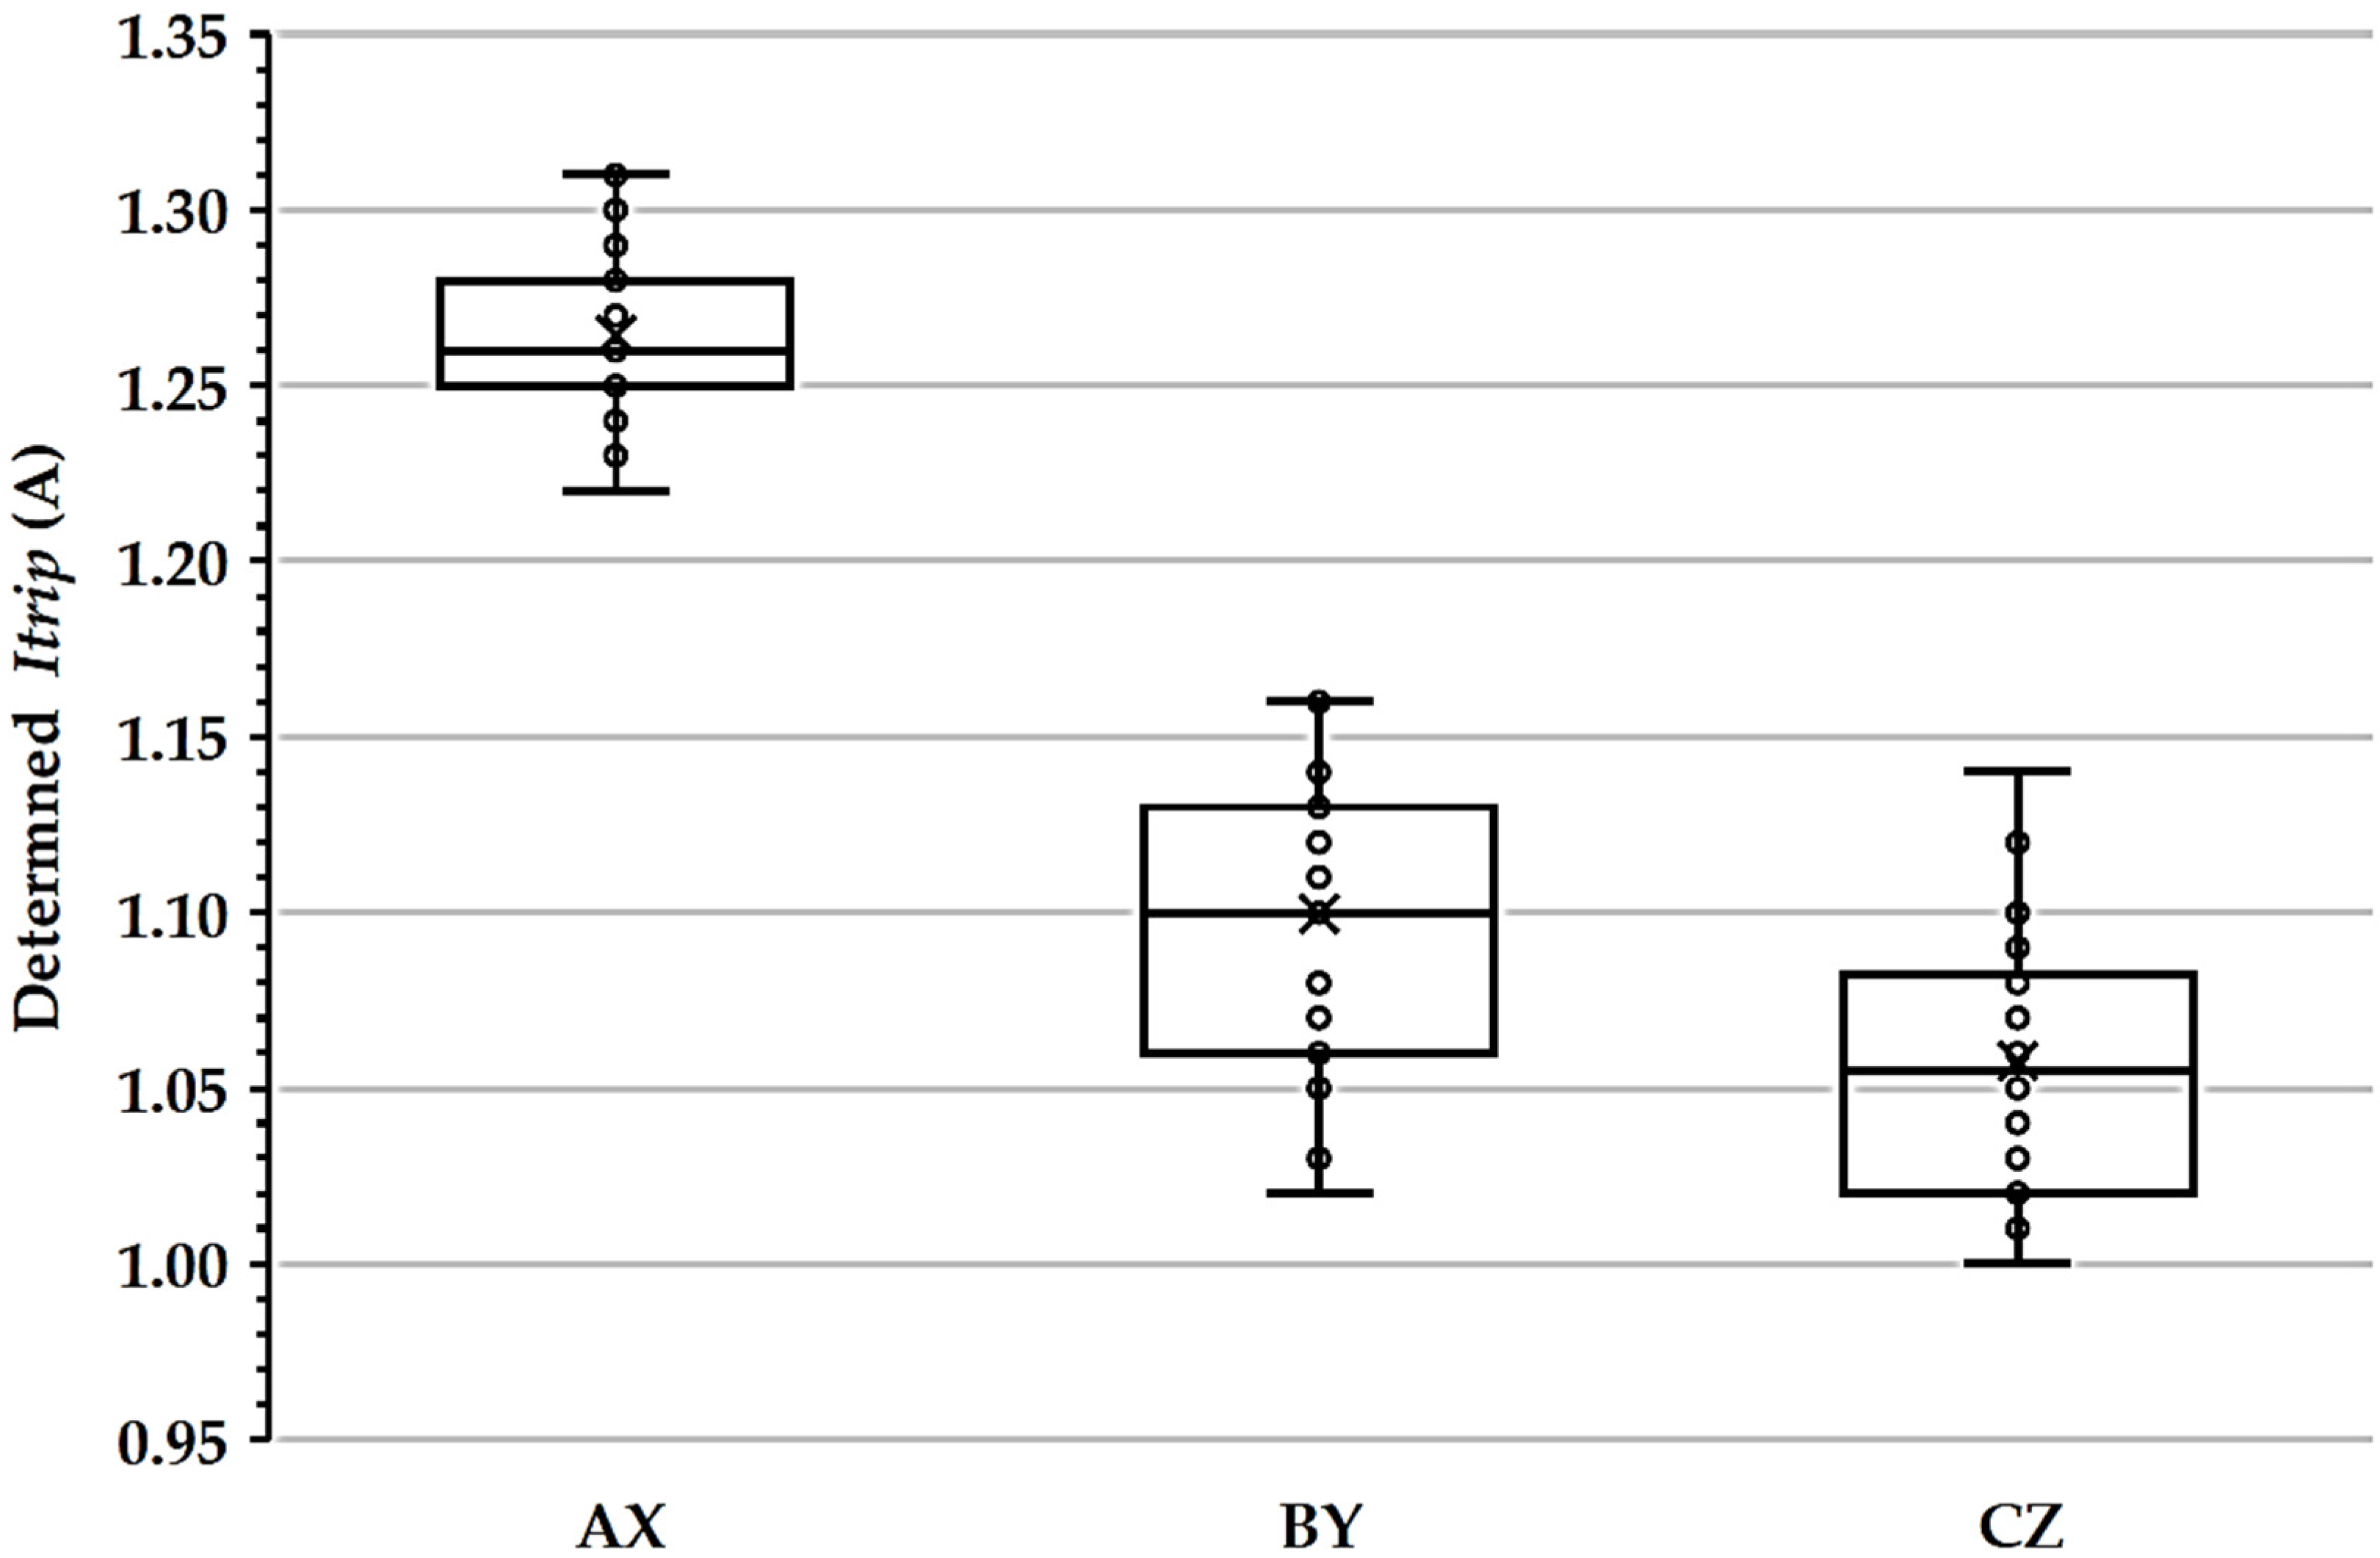
Table 5 clearly shows that the determined minimum and maximum values of all three manufacturer samples do not exceed the calculated outlier limits. Therefore, the calculations shown in Table 5 can be considered reliable estimates of PPTC fuse populations for each selected manufacturer. The determined levels of manufacturers AX, BY, and CZ are 1.26 A, 1.10 A, and 1.06 A, respectively. The associated is 0.02 A, 0.04 A, and 0.04 A, respectively. The low standard deviations indicate that the determined sample data is grouped closer to the calculated . Therefore, the experimental approach used is validated, since is approximately related to the PPTC fuse level of 1 A specified in the datasheet. The calculated level of AX, BY, and CZ is only 26%, 10%, and 6% away from the specified 1 A value. Side-by-side box plot comparison of the determined sample data distribution for manufacturers AX, BY, and CZ is shown in Figure 5.
Figure 5.
Side-by-side box plots of PPTC fuse determined sample data for AX, BY, and CZ.
Circles in each box plot represent all thirty determined sample data values. The ordered sample data middle 50% distribution (or IQR) is represented by the box outline, and the center line represents the median. The determined maximum and minimum values of all three samples do not go beyond the box plot whiskers and therefore do not exceed outlier limits. The calculated marked by “X” for manufacturer AX is not within either BY or CZ ordered sample data distribution range. This possibly reveals a distinct significant variation in the population level and warrants further investigation by analyzing confidence intervals.
4.2. Calculated Confidence Intervals
Analyzing results using 95% confidence interval range would be more fitting for this relative comparison, such that designers can understand how the PPTC device population may differ under a varied standard room temperature range. In [36,37], the sample’s calculated can serve as an estimate of the actual PPTC fuse population average. Confidence intervals for all three selected manufacturer sample sets of PPTC fuses are shown in Table 6.
Table 6.
Calculated confidence interval limits of selected PPTC fuse manufacturers.
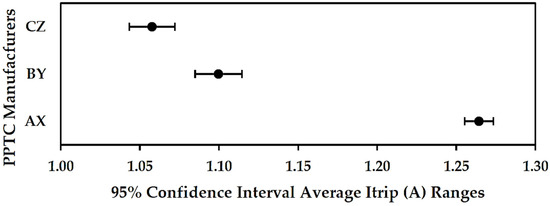
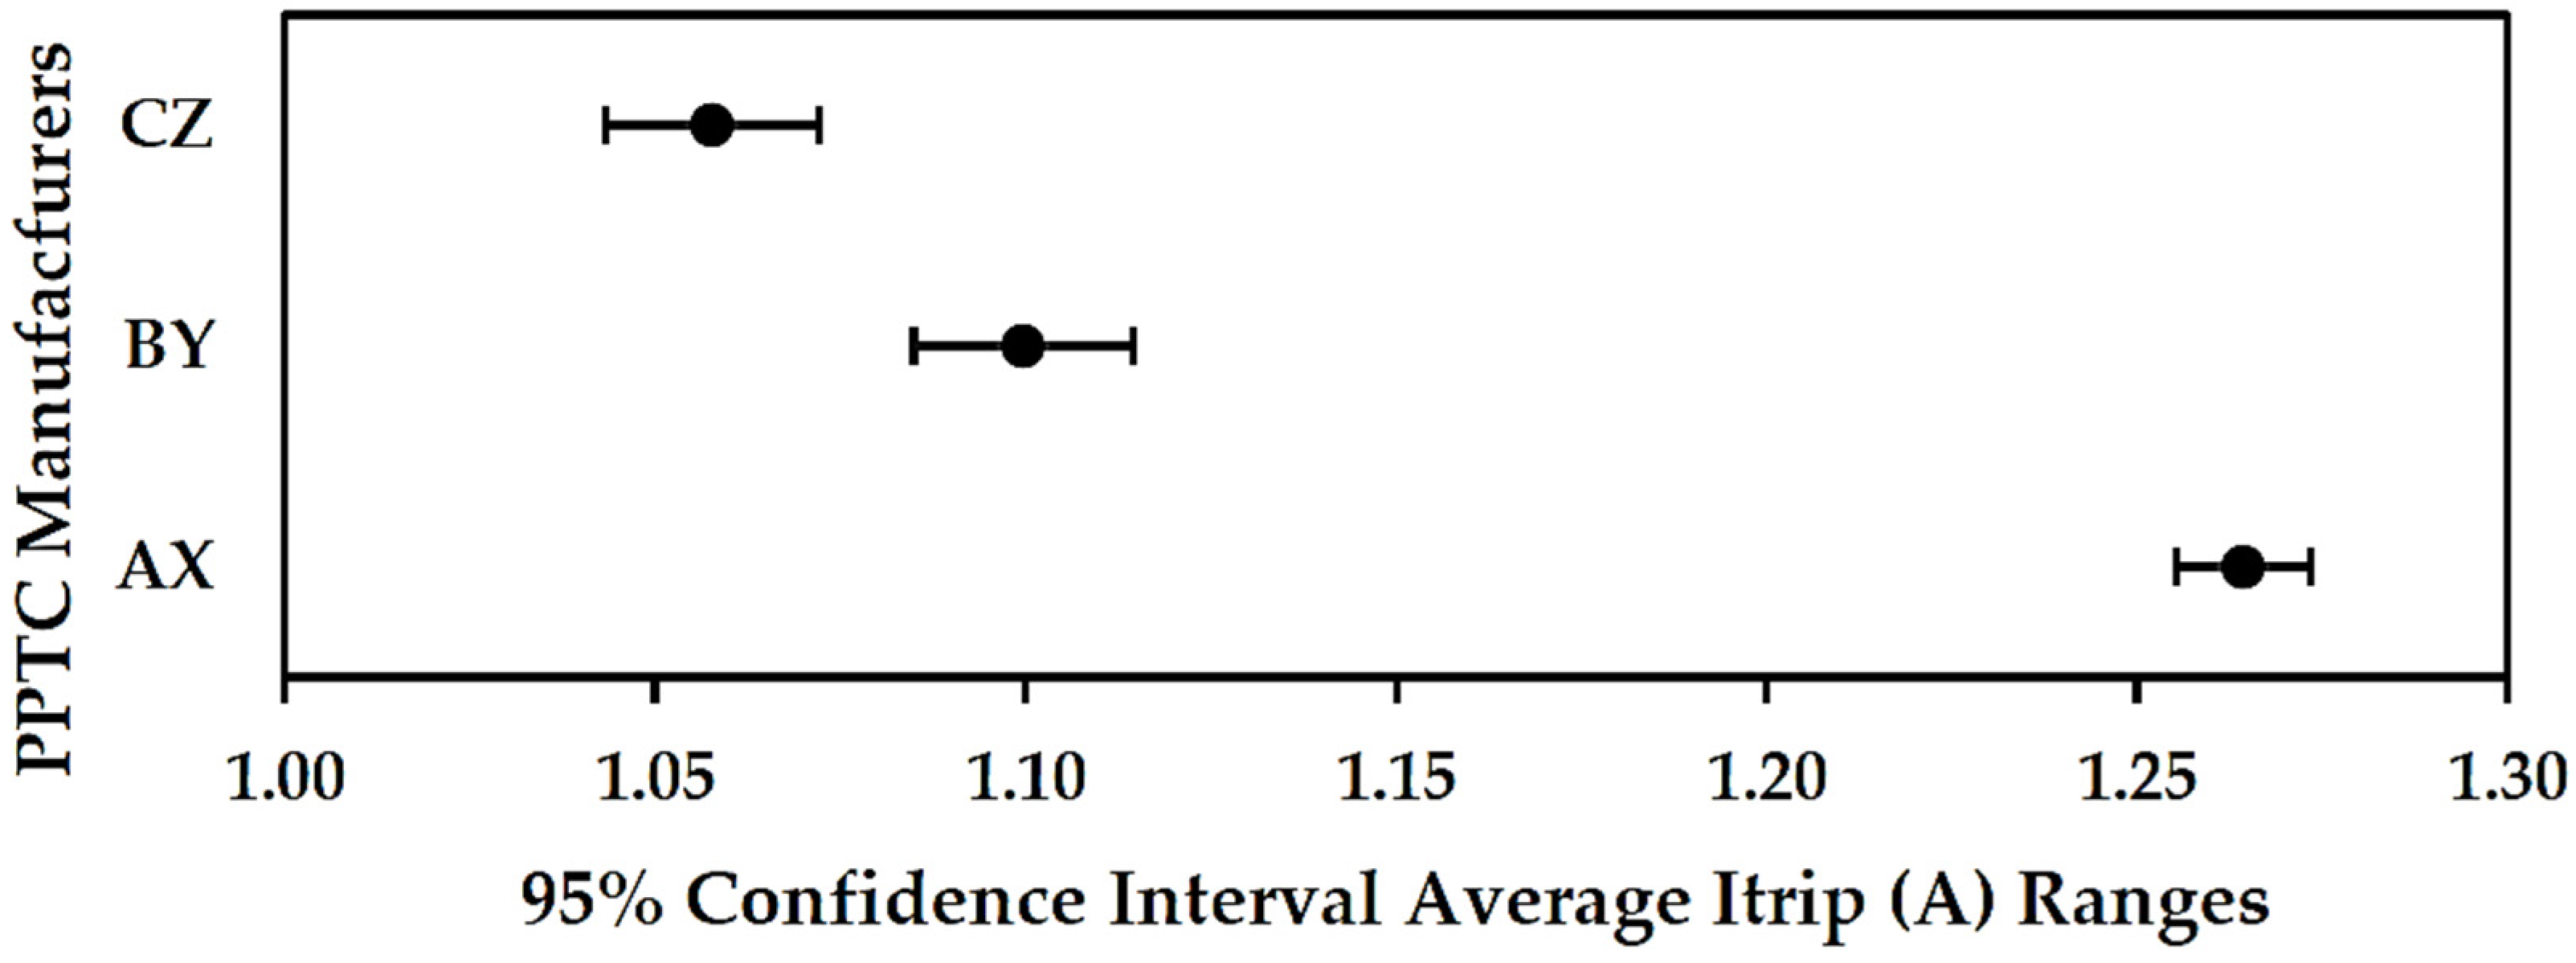
The forest plot shown in Figure 6 visually compares the calculated of the possible population ranges for PPTC fuse manufacturer AX, BY, and CZ. This visually shows the potential differences in population between the three manufacturers. Each represents the range within which each manufacturer’s true population is likely to reside with a 95% level of confidence.
Figure 6.
Forest plot of 95% ranges of for PPTC fuse AX, BY, and CZ manufacturers.
As observed in Figure 6, the 95% ranges of the different manufacturer samples do not overlap. Therefore, there is a statistically significant difference between population of all three PPTC fuse manufacturers.
5. Conclusions
This study developed a practical approach to comparatively investigate the reliability of resettable PPTC fuse trip current levels between different manufacturers with similar electrical specifications. A novel low-cost experimental setup was used to determine the average trip current level of a PPTC fuse sample operating within a varied standard room temperature range that can then be used as a reliability comparison metric. The proposed experimental setup makes use of a CCS circuit that accurately increments current flow through a PPTC fuse in steps of 0.01 A. The four-second time-to-trip specified by selected PPTC fuse manufacturers was used as the current flow duration for each applied CCS setting before detecting if the device tripped. A trip was identified if the detected current sensed through the PPTC fuse fell below the specified hold current of 0.5 A. Additionally, an experimentally determined zero-current cool-down period was implemented between each applied CCS setting to prevent thermal runaway. Three PPTC fuse samples from three different manufacturers with equivalent specifications were tested to determine the average trip current levels. Sample statistical analysis revealed a significant difference in the computed average trip current level for one of the selected manufacturers. The average trip current level findings were 1.26 A, 1.10 A, and 1.06 A, respectively. However, the calculated 95% confidence interval ranges revealed a significant difference between the PPTC fuse manufacturer population’s trip current levels. This could be due to crystalline defects or impurities introduced during the manufacturing process of these devices, which are left for future studies since they are outside the focus of this study. These findings demonstrate that the proposed novel experimental analysis model provides design engineers with a practical way to investigate trip current level reliability and potential differences between manufacturers that offer similar PPTC fuse specifications, without requiring the use of an expensive temperature chamber. Therefore, the determined average trip current level of PPTC fuses operating within a varied standard room temperature range can be considered as an effective comparison metric between manufacturers with similar device electrical specifications. Future research work could employ Data Science in the form of machine-learning models that can use this practical approach to determine the average trip current level of different specified PPTC fuses in a single model.
Author Contributions
Conceptualization, D.v.N. and J.V.; Methodology, D.v.N.; Software, D.v.N.; Validation, D.v.N. and J.V.; Formal analysis, D.v.N.; Investigation, J.V.; Resources, D.v.N. and J.V.; Data curation, D.v.N.; Writing—original draft preparation, D.v.N.; Writing—review and editing, D.v.N. and J.V. All authors have read and agreed to the published version of the manuscript.
Funding
This research received no external funding.
Data Availability Statement
The original contributions presented in the study are included in the article; further inquiries can be directed to the corresponding author.
Conflicts of Interest
The authors declare no conflicts of interest.
Abbreviations
The following abbreviations are used in this manuscript:
| PPTC | Polymer Positive Temperature Coefficient |
| CCS | Constant Current Source |
| OCP | Over Current Protector |
| PTC | Positive Temperature Coefficient |
| PTCR | Positive Temperature Coefficient Resistive |
| DAC | Digital-to-Analog Converter |
| SPI | Serial Port Interface |
| ADC | Analogue to Digital |
| IQR | Interquartile Range |
References
- C62.42.4-2020; IEEE Guide for the Application of Surge-Protective Components in Surge Protective Devices and Equipment Ports–Part 4: Thermally Activated Current Limiters. IEEE: New York, NY, USA, 2020; pp. 1–31. [CrossRef] [Scilit]
- Bakhtiar, S.U.H.; Dong, T.; Xue, B.; Ali, S.; Sattar, H.; Dong, W.; Fu, Q. Positive temperature coefficient materials for intelligent overload protection in the new energy era. Mater. Today 2023, 71, 108–134. [Google Scholar] [CrossRef] [Scilit]
- Doljack, F. PolySwitch PTC Devices-A New Low-Resistance Conductive Polymer-Based PTC Device for Overcurrent Protection. IEEE Trans. Compon. Hybrids Manuf. Technol. 1981, 4, 372–378. [Google Scholar] [CrossRef] [Scilit]
- Mendenhall, M. A new approach to reducing the size and cost of resettable fuses. In Proceedings the WESCON’95, San Francisco, CA, USA, 7–9 November 1995; IEEE: New York, NY, USA, 2002; p. 184. [Google Scholar] [CrossRef] [Scilit]
- Shchegolkov, A.V.; Shchegolkov, A.V.; Parfimovich, I.D.; Komarov, F.F.; Novikov, L.S.; Chernik, V.N. Functional Characteristics of Conductive Polymer Composites with Built-In Carbon Nanotubes and Metallic Particles. J. Compos. Sci. 2025, 9, 429. [Google Scholar] [CrossRef] [Scilit]
- Safonov, E.; Frolov, V.; Zhiligotov, R.; Petrenya, Y. The Specifics of PTC Thermistor Applications for Limiting Surge Currents. Energies 2024, 17, 318. [Google Scholar] [CrossRef] [Scilit]
- Cheng, S.; Tom, K.; Pecht, M. Anomaly Detection of Polymer Resettable Circuit Protection Devices. IEEE Trans. Device Mater. Reliab. 2012, 12, 420–427. [Google Scholar] [CrossRef] [Scilit]
- IEEE Std C62.39-2012; IEEE Standard for Test Methods and Preferred Values for Self-Restoring Current-Limiter Components Used in Telecommunication Surge Protection. IEEE: New York, NY, USA, 2013; pp. 1–39. [CrossRef] [Scilit]
- Sun, Y.; Santos, I.; Dietsch, T. Simulation-Assisted Reliability Study for Fuses Subjected to Thermal-Mechanical Stresses. In Proceedings of the 2023 IEEE 68th Holm Conference on Electrical Contacts (HOLM), Seattle, WA, USA, 4–11 October 2023; IEEE: New York, NY, USA, 2023; pp. 1–5. [Google Scholar]
- Zen, S.; Inada, Y.; Ohnishi, W.; Fukai, Y.; Takayasu, N.; Maeyama, M.; Yamano, Y. Prototype Current-Limiting Hybrid DC Circuit Breaker Incorporating a Fuse and a Semiconductor Device. IEEE Trans. Power Deliv. 2021, 36, 2231–2233. [Google Scholar] [CrossRef] [Scilit]
- Ohnishi, W.; Inada, Y.; Zen, S.; Sasaki, R.; Takada, Y.; Miyaoka, Y.; Tsukamoto, K.; Yamano, Y. Proof-of-Concept of a Fuse-Semiconductor Hybrid Circuit Breaker with a Fast Fuse Exchanger. IEEE Trans. Power Deliv. 2023, 38, 937–946. [Google Scholar] [CrossRef] [Scilit]
- Fu, R.; Montross, K.C. A New Method of Coordinating ZCBs and Fuses for a Reliable Short-Circuit Protection in DC Power Networks. IEEE Access 2023, 10, 63270–63279. [Google Scholar] [CrossRef] [Scilit]
- Mizuno, Y.; Hayashi, N.; Tanaka, H. Spiral Propagation of Polymer Optical Fiber Fuse Accompanied by Spontaneous Burst and Its Real-Time Monitoring Using Brillouin Scattering. IEEE Photonics J. 2014, 6, 6600307. [Google Scholar] [CrossRef] [Scilit]
- Cheng, S.; Tom, K.; Pecht, M. Failure Precursors for Polymer Resettable Fuses. IEEE Trans. Device Mater. Reliab. 2010, 10, 374–380. [Google Scholar] [CrossRef] [Scilit]
- Caixia, L.; Shuren, L.; Fanlong, Z.; Xu, L. Quantitative Reliability Analysis of Detonating Fuse Based on AHP. In Proceedings of the 2023 14th International Conference on Reliability, Maintainability and Safety (ICRMS), Urumuqi, China, 26–29 August 2023; IEEE: New York, NY, USA, 2024; pp. 761–765. [Google Scholar]
- Kodama, N.; Yokomizu, Y.; Takenaka, W. DC Arc Interruption Experiment using Arrangement of Polymer-Narrow Section inside Fuse-Case Filled with Silica-Sand. In Proceedings of the 2022 6th International Conference on Electric Power Equipment—Switching Technology (ICEPE-ST), Seoul, Republic of Korea, 15–18 March 2022; IEEE: New York, NY, USA, 2022; pp. 28–33. [Google Scholar]
- Moulick, M.; Chowdhury, S.; Das, M.; Saha, S.; Nag, S.; Naskar, J.; Modak, A.; Roy, R.B. A Customized Electronic Tongue by Developing an Array of Molecular Imprinted Polymer-Based Voltammetric Electrodes for Tea Quality Evaluation. IEEE Sens. J. 2026, 26, 1562–1568. [Google Scholar] [CrossRef] [Scilit]
- Scheuerlein, C.; Rehmer, B.; Finn, M.; Meyer, C.; Uhlemann, P.; Amez-Droz, M.; Meuter, F.; Konstantopoulou, K.; Lackner, F.; Savary, F.; et al. Thermomechanical Properties of Polymers for Use in Superconducting Magnets. IEEE Trans. Appl. Supercond. 2019, 29, 7701605. [Google Scholar] [CrossRef] [Scilit]
- Paneva, M.; Panev, P.; Tsonev, V. Tensile Testing at Elevated Temperatures of Test Specimens Made of Polymer Materials Obtained by Fused Deposition Modeling. In Proceedings of the 2025 International Conference Automatics and Informatics (ICAI), Varna, Bulgaria, 9–11 October 2025; IEEE: New York, NY, USA, 2026; pp. 207–211. [Google Scholar]
- Wang, J. Research on 3D printing image processing and optimization algorithm of polymer materials. In Proceedings of the 2024 International Conference on Telecommunications and Power Electronics (TELEPE), Frankfurt, Germany, 29–31 May 2024; IEEE: New York, NY, USA, 2024; pp. 796–801. [Google Scholar]
- Balakrishnan, M.; Spittel, R.; Becker, M.; Rothhardt, M.; Schwuchow, A.; Kobelke, J.; Schuster, K.; Bartelt, H. Polymer-Filled Silica Fibers as a Step Towards Electro-Optically Tunable Fiber Devices. J. Light. Technol. 2012, 30, 1931–1936. [Google Scholar] [CrossRef] [Scilit]
- Shin, S.-H.; Shang, X.; Ridler, N.M.; Lucyszyn, S. Polymer-Based 3-D Printed 140–220 GHz Low-Cost Quasi-Optical Components and Integrated Subsystem Assembly. IEEE Access 2021, 9, 28020–28038. [Google Scholar] [CrossRef] [Scilit]
- Lee, Y.; Kim, Y.-K.; Ji, C.-H. High-Temperature-Resistant Polymer-Based 3-D-Printed Electromagnetic Scanning Micromirror. IEEE Sens. Lett. 2024, 8, 5000704. [Google Scholar] [CrossRef] [Scilit]
- Chen, Y.; Yang, P.; Wang, G. High-Sensitive Fiber-Optic Gas Pressure Sensor Consisting of Cascaded Polymer–Air Cavities Based on Vernier Effect. IEEE Sens. J. 2025, 25, 17018–17025. [Google Scholar] [CrossRef] [Scilit]
- Vehec, I.; Lukacs, P.; Lenger, T.; Kardos, S.; Garnek, L. Effect of Manufacturing Technology on Polymer Thick-film Resistors in 3D Printed Structures. In Proceedings of the 2024 47th International Spring Seminar on Electronics Technology (ISSE), Prague, Czech Republic, 15–19 May 2024; IEEE: New York, NY, USA, 2024; pp. 1–5. [Google Scholar]
- Lumsden, G.; Ludbrook, S.S.B.; Weijers, H.; Badcock, R.A. Additively Manufactured Polymer Composites for Superconducting Motor Coil Structures. IEEE Trans. Appl. Supercond. 2023, 33, 3601305. [Google Scholar] [CrossRef] [Scilit]
- Fong, B.; Fong, A.C.M.; Hong, G.Y. Prognostics-Based Reliability Optimization for Consumer Healthcare Devices. IEEE Access 2022, 10, 126885–126891. [Google Scholar] [CrossRef] [Scilit]
- Dong, Y.; Dezert, J.; Zhou, R.; Zhu, C.; Ge, S.S. Multi-Criteria Analysis of Sensor Reliability for Wearable Human Activity Recognition. IEEE Sens. J. 2025, 21, 19144–19156. [Google Scholar] [CrossRef] [Scilit]
- Xiahou, T.; Zeng, Z.; Liu, Z.; Huang, H.-Z. Fusing Conflicting Multisource Imprecise Information for Reliability Assessment of Multistate Systems: A Two-Stage Optimization Approach. IEEE Trans. Reliab. 2023, 72, 90–105. [Google Scholar] [CrossRef] [Scilit]
- Zhang, B.; Liu, Y.; Zheng, Y.-X. Dynamic Reliability Assessment of Hierarchical Multistate Systems with Sensors’ Degradation. IEEE Trans. Reliab. 2025, 74, 3784–3798. [Google Scholar] [CrossRef] [Scilit]
- Cai, B.; Sheng, C.; Gao, C.; Liu, Y.; Shi, M.; Liu, Z.; Feng, Q.; Liu, G. Artificial Intelligence Enhanced Reliability Assessment Methodology with Small Samples. IEEE Trans. Neural Netw. Learn. Syst. 2023, 34, 6578–6590. [Google Scholar] [CrossRef] [Scilit]
- Aulia, M.F.; Berlianti, R.; Widia, R.; Yandri, V.R. Design of Fuse Cut Out (FCO) Detection Tools Break-Up on Internet of Things-Based Distribution Substations to Speed up Response Time of Disorders. In Proceedings of the 2023 International Conference on Electrical Engineering and Informatics (ICEEI), Bandung, Indonesia, 10–11 October 2023; IEEE: New York, NY, USA, 2023; pp. 1–5. [Google Scholar]
- Yousaf, M.; Jililian, A.; Muttaqi, K.M.; Sutanto, D. An Adaptive Overcurrent Protection Scheme for Dual-Setting Directional Recloser and Fuse Coordination in Unbalanced Distribution Networks with Distributed Generation. IEEE Trans. Induwith Appl. 2022, 58, 1831–1842. [Google Scholar] [CrossRef] [Scilit]
- Michalec, P.; Faller, L.-M. 3-D-Printing and Reliability Evaluation of an Easy-to-Fabricate Position Sensing System for Printed Functional Wearable Assistive Devices. IEEE Sens. J. 2024, 24, 4137–4149. [Google Scholar] [CrossRef] [Scilit]
- Miller, D.; Perrin, G.; Terwilliger, K.; Morse, J.; Xiao, C.; To, B.; Uličná, S.; Jiang, C.S.; Schelhas, L.T.; Hacke, P. Development of Fixtures and Methods to Assess the Durability of Balance of Systems Components. IEEE J. Photovolt. 2022, 12, 1341–1348. [Google Scholar] [CrossRef] [Scilit]
- van Niekerk, D.; Venter, J. Experimental Approach for Reliability Analysis of Medium-Power Zener Diodes under DC Switching Surge Degradation. Electronics 2024, 13, 1976. [Google Scholar] [CrossRef] [Scilit]
- van Niekerk, D.; Venter, J. Reliability Analysis of Transient Voltage Suppression Diodes Under Direct Current Switching Surge Stress. Energies 2025, 18, 1725. [Google Scholar] [CrossRef] [Scilit]

Disclaimer/Publisher’s Note: The statements, opinions and data contained in all publications are solely those of the individual author(s) and contributor(s) and not of MDPI and/or the editor(s). MDPI and/or the editor(s) disclaim responsibility for any injury to people or property resulting from any ideas, methods, instructions or products referred to in the content. |
© 2026 by the authors. Licensee MDPI, Basel, Switzerland. This article is an open access article distributed under the terms and conditions of the Creative Commons Attribution (CC BY) license.