1. Introduction
The rapid proliferation of generative artificial intelligence (AI) and Large Language Models (LLMs) is driving a new phase of electricity demand growth in the data center sector. After remaining relatively stable for nearly a decade, data center electricity consumption more than doubled between 2019 and 2022, reaching 460 terawatt-hours (TWh) [
1]. Projections indicate that this growth will continue, with the International Energy Agency (IEA) forecasting global data center demand to exceed 945 TWh by 2030, an amount greater than the current electricity consumption of Japan. In the United States, data centers are projected to consume 9% of all electricity by 2030, up from 4% in 2022 [
2]. This expansion is fueled by large capital investment, accelerated model deployment, and the strategic importance of AI infrastructure [
3].
This growth creates challenges for power systems, particularly where infrastructure upgrades lag behind data center deployment. In a 2025 Deloitte survey, 72% of power company and data center executives identified grid capacity constraints as a primary barrier to infrastructure build-out [
4]. Large AI data centers create concentrated, high-density loads that can stress local transmission and distribution systems. The North American Electric Reliability Corporation (NERC) has also warned that portions of the US grid are exposed to reliability risks, highlighting the tension between rapid data center expansion and the longer planning horizons of power-system infrastructure.
LLM data centers differ from many traditional commercial loads because they serve real-time inference requests. Their electricity demand depends on both usage variables, such as request volume and sequence length, and provider-side architecture and deployment features, such as model size, attention implementation, hardware type, batching policy, and serving configuration. Many of these provider-side quantities are commercially sensitive and are not directly observable to grid operators. As a result, an operator may see historical load and aggregate usage indicators without observing the reduced-form demand parameters that explain how a provider’s LLM service translates usage into electricity demand.
This information asymmetry motivates the central research question of this paper:
How can a grid operator improve LLM-induced power-demand forecasts when provider-side architecture and deployment information is private?
Traditional forecasting methods typically rely on historical demand patterns and observable covariates. Such methods can perform well in stationary environments, but LLM loads may exhibit structural breaks when a provider updates its model, changes its serving infrastructure, adopts a new attention implementation, or migrates to a different hardware platform. Forecasting models that do not have access to provider-side demand-relevant information may therefore miss important changes in the data-generating process.
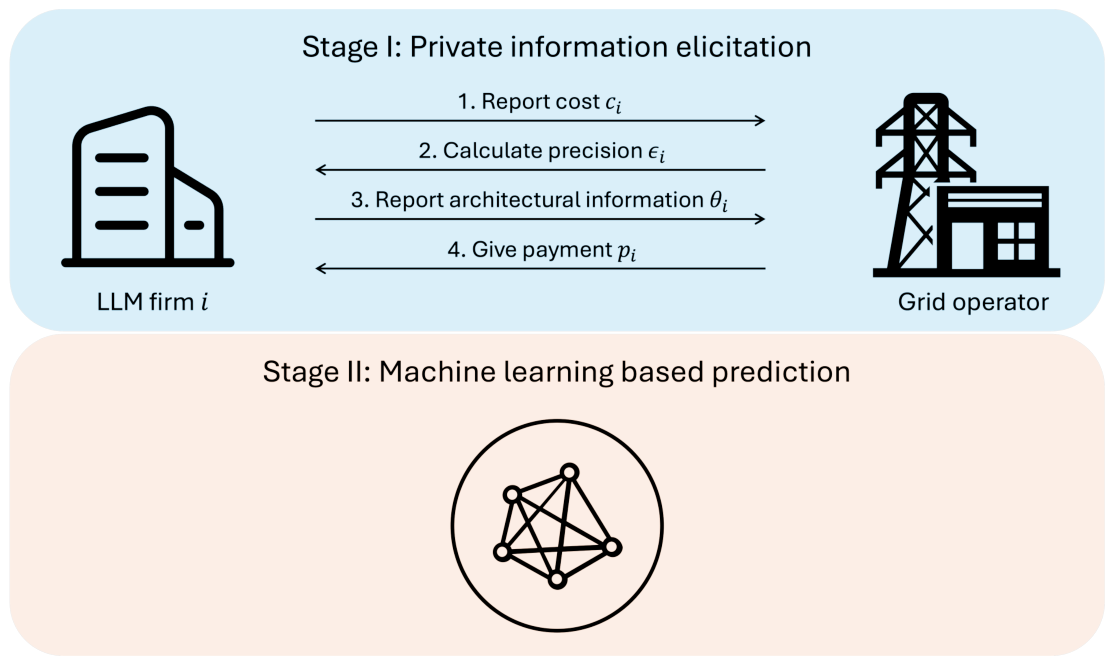
We propose a two-stage, mechanism-assisted forecasting framework. The objective is not to claim that a particular neural architecture dominates all load-forecasting methods. Instead, the central question is whether provider-side architecture- and deployment-informed demand parameters, when elicited and verified through an incentive mechanism, can improve forecasts of LLM-induced electricity demand. In Stage 1, the grid operator uses a stylized mechanism to procure verifiable reduced-form demand parameters from LLM providers at a chosen precision. In Stage 2, the elicited parameters are used as forecasting features together with observable usage and calendar covariates. The framework is therefore best understood as an information-procurement layer that complements, rather than replaces, existing statistical, machine-learning, and power-system operational models.
The proposed framework is illustrated in
Figure 1. It reduces information asymmetry before forecasting begins, thereby providing the forecasting model with otherwise unavailable demand-relevant features. The mechanism does not require providers to disclose their full proprietary architectures. Instead, it targets reduced-form demand descriptors that can be audited against ex-post measurements such as metered electricity consumption, aggregate token throughput, request volume, and prompt/response length statistics.
The contributions of this paper are as follows:
Mechanism-assisted information procurement. We formulate the lack of provider-side architecture and deployment information as an information-asymmetry problem and propose a stylized mechanism for eliciting verifiable reduced-form demand parameters.
Architecture-informed forecasting. We incorporate elicited demand parameters into forecasting models and evaluate whether such information improves LLM-induced demand forecasts relative to architecture-agnostic baselines.
Calibrated proof-of-concept evaluation. We construct representative synthetic scenarios calibrated from public data-center energy reports, open LLM-inference energy benchmarks, and secondary public estimates. The results show that elicited parameters improve forecasting accuracy in the simulated setting, while also highlighting the need for real operational validation.
We emphasize that the term “architecture-informed” does not imply formal causal identification. The proposed framework does not estimate causal effects in the econometric sense, identify a structural causal graph, or provide intervention-based causal identification. Instead, it addresses a different problem: under information asymmetry, the grid operator lacks provider-specific architecture- and deployment-related quantities that are predictive of LLM-induced demand. The mechanism is designed to elicit verifiable reduced-form demand parameters, which are then used as forecasting features.
The remainder of this paper is organized as follows.
Section 2 reviews the relevant literature.
Section 3 presents the system model.
Section 4 describes the mechanism design.
Section 5 details the forecasting stage.
Section 6 presents the numerical results, and
Section 7 concludes.
2. Literature Review
Our framework is positioned at the intersection of two distinct fields: load forecasting and economic mechanism design in power systems. This section reviews the state of the art in each area to highlight the novelty of our proposed two-stage approach.
2.1. Load Forecasting Methods in Power Systems
Accurate load forecasting is foundational to the operational efficiency and reliability of modern power grids. As energy systems become increasingly complex due to the integration of renewable energy and dynamic loads, the field has witnessed a paradigm shift from traditional statistical methods to advanced artificial intelligence (AI) frameworks. A recent state-of-the-art review categorizes these methodologies into statistical, machine learning (ML), deep learning (DL), and hybrid approaches, highlighting the rapid evolution of predictive capabilities [
5].
2.1.1. Deep Learning and Attention-Based Models
While traditional methods such as ARIMA and Support Vector Regression (SVR) [
6] established the early benchmarks for forecasting, they often struggle to capture the high-dimensional non-linearity inherent in modern load profiles. Consequently, deep learning has emerged as the dominant methodology. Recurrent Neural Networks (RNNs), particularly Long Short-Term Memory (LSTM) networks and Gated Recurrent Units (GRUs), have become the standard for short-term load forecasting (STLF) due to their ability to model temporal dependencies. For instance, recent studies have demonstrated that LSTM and GRU architectures significantly outperform traditional ML baselines in capturing daily and seasonal periodicities [
7,
8].
Further advancements have integrated Convolutional Neural Networks (CNNs) with RNNs to extract both spatial and temporal features. Wan et al. [
9] proposed a CNN-LSTM hybrid model that effectively captures local trend features and long-term dependencies, a structure that has been widely adopted for its robustness. More recently, the success of the Transformer architecture in natural language processing has influenced energy forecasting. L’Heureux et al. [
10] introduced a Transformer-based model for electrical load forecasting, utilizing self-attention mechanisms to weigh the importance of different time steps, thereby outperforming RNN-based counterparts in handling long sequences. Similarly, Song et al. [
11] developed a hierarchical multi-task learning framework with spatiotemporal attention, further cementing the status of attention mechanisms as the cutting edge.
2.1.2. Hybrid and Decomposition-Based Frameworks
To address the volatility and stochastic nature of load data, researchers have increasingly turned to hybrid frameworks that combine signal decomposition with DL models. The core premise is that decomposing a non-stationary load signal into simpler sub-modes, using techniques like Variational Mode Decomposition (VMD) or Empirical Mode Decomposition (EMD), makes the components more predictable.
Zhang et al. [
12] demonstrated that hybridizing VMD with learning algorithms significantly reduces forecasting error by isolating high-frequency noise. Similarly, recent work by Chen et al. [
13] proposed an aggregation hybrid modal decomposition framework, which optimizes the reconstruction of sub-signals to enhance accuracy for integrated energy systems. Advanced optimization algorithms, such as the Firefly or Whale Optimization Algorithm, are often employed alongside these decomposition layers to fine-tune hyperparameters, as seen in the work of Hafeez et al. [
14] and others [
15,
16]. These hybrid “decomposition-ensemble” strategies currently represent the peak of statistical accuracy in [
17].
2.1.3. Limitations of Existing Approaches: Information Asymmetry
Despite the strong statistical performance of deep learning and hybrid forecasting models, most existing methods rely on historical correlations and observable covariates [
18]. This creates a limitation for LLM-driven data center loads because important provider-side quantities, including architecture, deployment configuration, attention implementation, hardware type, and serving policy, may be unavailable to grid operators.
This limitation is particularly relevant when the data-generating process changes. An LLM provider may update its model, migrate to new accelerators, alter batching policies, or change its inference stack. Such changes can create structural breaks in electricity demand that are difficult to infer from historical load alone. Explainable AI methods can provide post-hoc feature importance [
19], but they cannot recover private provider-side quantities that were never observed by the forecaster.
Our work addresses this gap by treating the missing provider-side information as an information-procurement problem. Instead of relying solely on architecture-agnostic forecasting, the proposed framework uses an incentive mechanism to elicit verifiable reduced-form demand parameters and then incorporates them into forecasting models. This approach complements the existing forecasting literature by focusing on how privately held demand-relevant information can be made available for forecasting under asymmetric information.
2.2. Mechanism Design and Incentive Compatibility in Power Systems
As power systems transition toward decentralized operation, Mechanism Design (MD) and Game Theory have become essential for eliciting private information from strategic agents, such as prosumers and data centers, who may misreport their parameters to maximize selfish gains. Unlike traditional optimization which assumes full observability, MD focuses on designing rules (incentives) that align individual rationality with social welfare.
2.2.1. Incentive Mechanisms for Demand Response and P2P Trading
The literature on Demand Response (DR) has extensively employed Stackelberg games to model the leader-follower interaction between grid operators and users. Liu et al. [
20] proposed a price-based energy-sharing model, demonstrating that dynamic internal pricing can incentivize prosumers to balance local supply and demand voluntarily. To address the computational complexity of such interactions, Chen et al. [
21] developed a distributed autonomous demand-side management framework, using an aggregative game approach to prove that a unique Nash Equilibrium exists even with selfish consumers.
In the realm of Peer-to-Peer (P2P) trading, ensuring “truthfulness” (incentive compatibility) is a primary challenge. Zhang et al. [
22] introduced a double-auction mechanism for microgrids, validating that their scheme enforces truthful bidding as a dominant strategy while maximizing social welfare. Building on this, Wang et al. [
23] proposed a mechanism specifically for incentivizing the aggregation of distributed energy resources (DERs), using a bargaining framework to fairly allocate the benefits of peak shaving.
Recent work has shifted toward handling large-scale populations and uncertainty using advanced game-theoretic concepts. Li et al. [
24] utilized contract theory to design a menu of incentive contracts that screens users by their private “types” (e.g., willingness to reduce load), effectively solving the information asymmetry problem without iterative negotiations. Furthermore, to manage the complexity of massive electric vehicle (EV) fleets, Lin et al. [
25] applied Mean Field Game (MFG) theory. Their work demonstrated that by modeling the collective behavior of the population rather than individual interactions, a decentralized equilibrium can be achieved that minimizes charging costs for both the parking lot operator and EV owners.
2.2.2. Mechanism Design for Data Centers
Data centers (DCs) represent a unique class of large flexible loads. Unlike residential users, DCs can shift workload spatially (geo-distribution) and temporally. Tran et al. [
26] pioneered a game-theoretic approach, modeling how geo-distributed DCs respond to local utility prices by migrating workloads to regions with cheaper electricity.
More recent studies focus on “colocation” scenarios. Zhou et al. [
27] designed a truthful mechanism for green data centers, incentivizing tenants to reduce server loads during peak periods. Bahrami et al. [
28] further analyzed DCs in deregulated markets, showing that proper incentive design can reduce the data center’s electricity procurement costs by over 15% while aiding grid stability.
2.2.3. Limitations: The Gap Between Economic Valuation and Information Procurement
Existing mechanism-design applications in power systems typically focus on eliciting bids, flexibility, or valuations. They rarely address the problem studied here: a grid operator needs provider-side technical information that is privately held by AI infrastructure operators and is useful for forecasting a new class of electricity demand. This paper contributes to this gap by linking incentive design with architecture-informed load forecasting.
3. System Model
This section introduces the reduced-form demand model used throughout the paper. The model is designed to obtain tractable architecture- and deployment-informed forecasting features under information asymmetry. It is not intended to be a complete systems-level model of modern LLM serving.
3.1. LLM Power Demand Characterization
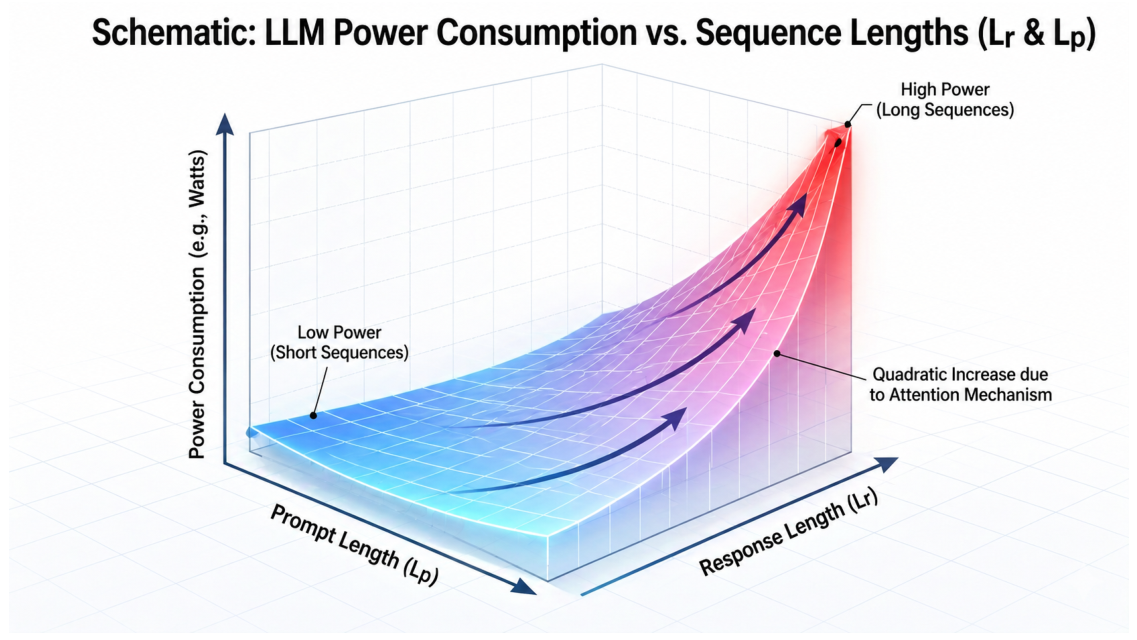
To obtain a tractable representation of LLM-induced demand, we use a stylized reduced-form cost model. The model captures two first-order components of inference demand: a generation-related component that increases with the number of generated tokens, and an attention-related component that increases with the effective context length under a standard dense-attention approximation.
Figure 2 illustrates the resulting non-linear dependence of inference demand on prompt and response lengths.
For provider
i, let
and
denote prompt length and response length, respectively. We approximate the per-request computational cost as
where
is a reduced-form generation-cost coefficient and
is a reduced-form attention-cost coefficient. The quadratic term should be interpreted as a dense-attention benchmark rather than a universal scaling law.
The coefficients
and
summarize architecture- and deployment-dependent inference costs under a given serving configuration. In real LLM deployments, inference energy may be affected by KV-cache reuse, FlashAttention, grouped-query attention, sparse or local attention, Mixture-of-Experts (MoE) routing, batching policies, tensor/model/data parallelism, memory hierarchy, and heterogeneous GPU scheduling. These factors may change not only constants but also the effective scaling of inference cost with sequence length. Therefore, Equation (
1) is best interpreted as a parsimonious approximation used to study information elicitation and forecasting under asymmetric information. More generally, the proposed framework can accommodate alternative reduced-form cost functions
, where
denotes architecture-related features and
denotes deployment-related features.
Let
convert computational cost into energy under provider
i’s deployment configuration, and let
denote the energy consumption of a representative request. Let
denote the request arrival rate of provider
i during time slot
t, measured in requests per unit time. The time-slot-average power demand is modeled as
where the expectation is taken over the prompt and response length distribution in slot
t, and
captures unmodeled fluctuations. Equivalently, if
is the set of requests served during a slot of length
, then
so
denotes average power over the time slot rather than instantaneous power.
Substituting Equation (
1) gives
where
We define the reduced-form demand parameter as
This formulation separates private architecture- and deployment-informed coefficients
from time-varying usage variables such as
,
, and
. Thus,
is not a purely architectural primitive. It is a reduced-form demand descriptor that summarizes how provider
i’s LLM service translates usage into electricity demand under the adopted model.
3.2. Grid Operator’s Problem
The grid operator needs accurate forecasts of aggregate LLM-induced demand,
before downstream operational decisions are made. The operator problem in this paper should be interpreted as a pre-operational information-procurement problem rather than a complete unit-commitment, dispatch, reserve-procurement, or optimal-power-flow model. Improved forecasts can support downstream generation scheduling, reserve planning, and network-security assessment, but those physical constraints are not explicitly optimized in this framework.
The operator does not directly observe . This information asymmetry motivates the mechanism-design stage: the operator offers payments to elicit verifiable reports at a desired reporting precision. The reduced-form imprecision loss introduced below captures the expected value of reducing uncertainty in these reports before downstream grid-operation models are solved.
Table 1 summarizes the main notation.
4. Stage 1: Mechanism Design for Eliciting Reduced-Form Demand Parameters
This section presents the incentive mechanism used to elicit provider-side demand information. The mechanism is designed for reduced-form demand parameters , not for full disclosure of proprietary model architectures. The theoretical results characterize the provider’s reporting precision under an auditable reporting environment.
We model the interaction between the grid operator and the N LLM providers as a Bayesian mechanism-design problem. Each provider has a private cost parameter for providing a report at precision . A higher corresponds to a more accurate report but requires greater internal measurement, monitoring, and audit-compliance effort.
Assumption 1. Each provider i has a private cost of reporting precision . The distribution of has cumulative distribution function F and density f.
The provider’s reporting-effort cost is
. The operator-side expected loss from imprecise reporting is represented by
where
measures the value of accurate information to the operator. This is not a physical cost borne by the provider. Instead, it is a reduced-form representation of the operator’s expected forecasting or reliability loss caused by noisy reports. The transfer
is an incentive-alignment device that makes the provider internalize the operator’s value of improved reporting precision.
4.1. Utility of LLM Providers
Given payment
, provider
i’s utility is
The mechanism must satisfy incentive compatibility (IC) and individual rationality (IR):
4.2. Operator Objective
The following objective is an information-procurement problem, not a full physical grid-operation model. The operator chooses the reporting precision and associated transfers before downstream dispatch or reserve decisions are made:
subject to IC and IR. The parameter
is the operator’s normalized marginal cost of incentive payments. A larger
makes payments more costly and therefore reduces the desired reporting precision.
4.3. Optimal Mechanism Design
The standard envelope argument implies the following payment representation.
Lemma 1. Suppose the precision allocation is weakly decreasing in . Under IC and IR, the payment can be written aswhere the constant is chosen so that the highest-cost type obtains zero rent. Proof. Let
denote the interim utility of type
. Incentive compatibility gives the envelope condition
. Integrating from
to
and imposing
yields
. Substituting this expression into
gives Equation (
12). Monotonicity of
is the standard implementability condition. □
The appearance of the imprecision term in the operator’s objective should not be interpreted as reimbursing the provider for the operator’s loss. The provider is compensated for its reporting effort and information rent; the imprecision term determines the operator’s value of buying precision.
Assumption 2. The virtual cost is increasing in .
This regularity condition is standard in mechanism design and is satisfied by many common distributions, including the uniform distribution and log-concave distributions.
Theorem 1. Under Assumption 2, the Bayesian optimal mechanism-design problem in Equation (11) is equivalent to Proof. Substituting the payment rule in Lemma 1 into Equation (
11) gives an expected objective containing the direct effort cost and the information rent. The expected rent term can be rewritten using integration by parts:
The objective is therefore separable across providers and types, with virtual cost
. Assumption 2 ensures the resulting allocation is monotone and hence implementable. □
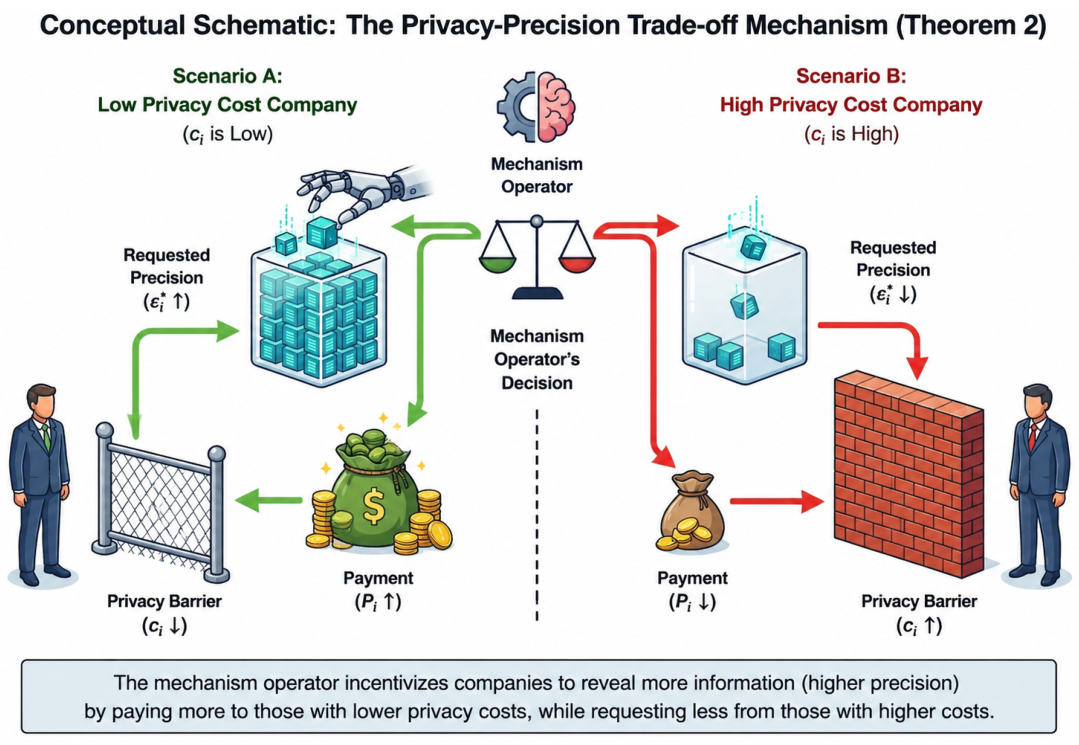
The resulting monotone precision-allocation rule is illustrated in
Figure 3.
Theorem 2. The pointwise optimal reporting precision is Proof. From Equation (
13), the pointwise objective is
The first-order condition is
which yields Equation (
14). The second derivative is
, confirming a minimum. □
The optimal precision is decreasing in the provider’s virtual reporting cost. Thus, the operator demands higher precision from providers that are less costly to incentivize and lower precision from providers with higher reporting costs.
4.4. Auditable Reporting and Verification
The mechanism is interpreted as operating in an auditable reporting environment. It does not require LLM providers to disclose their full proprietary architectures. Instead, providers submit verifiable reduced-form demand parameters that summarize how architecture- and deployment-related factors translate usage into electricity demand under the adopted model.
In practice, reports can be verified using ex-post measurements such as metered electricity consumption, aggregate token throughput, request volume, prompt and response length statistics, GPU utilization logs, and third-party audit records. Let
denote the demand predicted from reported parameters and observable usage covariates. An audit statistic can be defined as
The net payment can then be made contingent on passing an accuracy test:
where
is an audit penalty parameter and
is a tolerance threshold decreasing in the required reporting precision. This verification layer discourages strategic misreporting while allowing providers to protect commercially sensitive architectural details. Without such a verification layer, the mechanism alone cannot guarantee truthful disclosure of proprietary parameters.
4.5. From Reporting Precision to Forecasting Features
The mechanism determines the reporting precision
, while the forecasting stage uses reported parameters
. To connect the two stages, we explicitly model reporting error as precision-dependent noise:
A higher precision
therefore corresponds to lower reporting-noise variance. The architecture-agnostic baseline does not observe
, whereas the proposed forecasting model uses
together with observable usage and calendar covariates. An oracle ablation using the true
provides an upper-bound benchmark for perfectly accurate reporting.
5. Stage 2: Machine Learning Forecasting
Stage 2 evaluates whether the elicited reduced-form demand parameters improve forecasting accuracy. Let
denote observable forecasting covariates, including lagged aggregate demand, calendar variables, request-arrival forecasts, and prompt/response length moments. The architecture-agnostic baseline predicts demand from observable covariates only:
Models with elicited information use the same observable covariates together with the reported parameters:
where
and
denote the stacked reported and true parameter vectors, respectively.
We use ResNet as the main forecasting backbone because the purpose of the experiment is to isolate the predictive value of elicited demand parameters rather than to introduce a new neural forecasting architecture. The residual structure provides a lightweight and stable model that can learn corrections around baseline demand patterns and can combine dynamic usage covariates with static provider-level parameters. To avoid making the empirical conclusion dependent on a single architecture, we also compare with statistical, machine-learning, and simple time-series baselines.
For the ResNet ablation, all variants use the same architecture and training settings. The only difference is whether the model receives no elicited parameters, noisy elicited parameters , oracle parameters , or placebo features. This design isolates the predictive contribution of elicited information from changes in model capacity or training procedure.
6. Numerical Results
This section presents calibrated synthetic experiments. The experiments are designed to evaluate the internal logic of the proposed mechanism-assisted forecasting framework. They should not be interpreted as validation on operational AI-data-center measurements.
Table 2 reports representative deployment scenarios used to calibrate the simulation. The entries are not treated as verified measurements of proprietary LLM deployments. Instead, they provide plausible heterogeneous provider scenarios compiled from public data-center energy reports, open inference-energy benchmarks, and secondary public estimates. For proprietary models whose architecture or serving infrastructure is not publicly disclosed, the corresponding entries are assumptions for scenario analysis. Secondary public aggregations are used only as auxiliary references and are not treated as authoritative measurements.
The calibration uses three layers of evidence. First, aggregate data-center energy reports are used to set the scale of the problem and motivate hourly load forecasting. Second, open LLM-inference energy benchmarks are used to calibrate plausible ranges for per-request energy, GPU power, and throughput sensitivity. Third, public estimates of frontier-model deployments are used only to generate heterogeneity across representative providers. This layered construction allows the simulation to reflect heterogeneous LLM serving conditions while avoiding the unsupported claim that proprietary deployment parameters are directly observed.
6.1. Simulation Data Generation
Because operational AI-data-center load measurements paired with proprietary LLM serving logs are not publicly available, we construct a calibrated scenario dataset. The dataset is designed to test whether elicited provider-side demand descriptors improve forecasts in a controlled environment, not to reproduce the exact load trace of a particular data center. We consider
representative providers over
hourly time slots, corresponding to 90 days of synthetic operation. The request arrival rate
is measured in requests per hour and follows a time-varying intensity with daily and weekly seasonality:
where
is the provider-specific baseline request rate and
is a zero-mean demand shock. The daily and weekly factors create predictable load variation, while
captures unmodeled demand shocks. Prompt and response lengths are sampled from provider-specific log-normal distributions and truncated to avoid extreme outliers. This choice reflects the empirical observation that token lengths are nonnegative, skewed, and heterogeneous across applications, while keeping the simulation analytically transparent.
Given
, demand is generated as in Equation (
4) with additional unmodeled fluctuations. Reporting noise is generated according to Equation (
17), so that higher reporting precision produces lower-variance reported parameters. The resulting aggregate target is
. The forecasting task is therefore constructed from the same primitives as the mechanism-design stage: usage variables determine the time-varying load, while the reduced-form demand parameters determine how provider-specific architecture and deployment conditions translate usage into energy demand.
The benchmark simulation assumes
. This assumption is not intended to represent an empirically estimated distribution of reporting costs. Such costs are not publicly observable because they depend on internal monitoring systems, audit readiness, compliance procedures, and proprietary serving infrastructure.
Section 6.4 therefore reports a sensitivity analysis using alternative private-cost distributions.
Table 3 summarizes the simulation and forecasting settings used in the experiments.
We report raw MSE, raw MAE, and normalized MSE (NMSE), where
All percentage reductions are computed using raw aggregate-demand MSE.
6.2. Impact of the Payment-Cost Weight
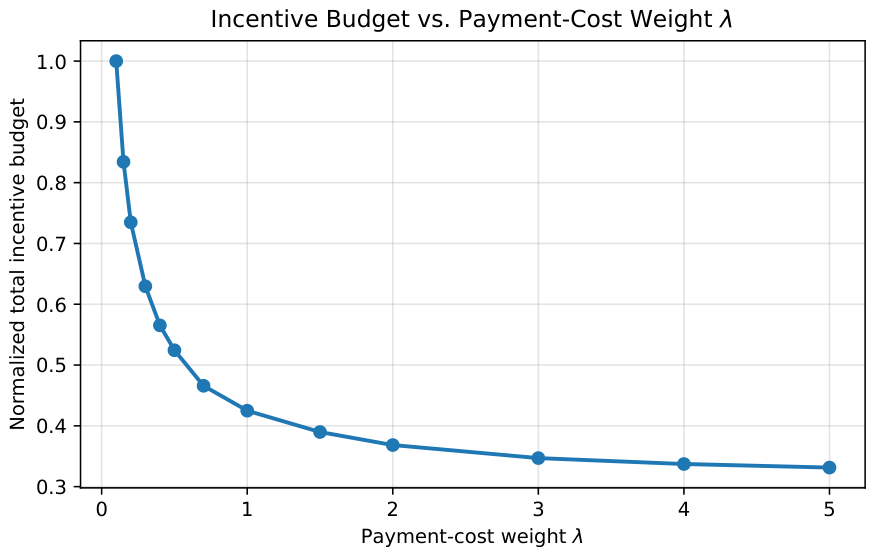
We first evaluate how the payment-cost weight affects the total incentive payments required by the mechanism. Because provider-specific reporting costs and regulatory transfer schedules are not publicly observed, all payment and budget quantities are reported in normalized mechanism units. These figures should be interpreted as comparative statics rather than monetary estimates.
Figure 4 shows that total normalized incentive payments decline as
increases. This pattern follows directly from Equation (
14): when payments become more costly, the operator requests lower reporting precision, reducing the required transfer. The curve is steep when
is small and flattens for larger
, indicating diminishing marginal budget savings.
6.3. Forecasting Performance Comparison
We evaluate 24-hour-ahead aggregate demand forecasts using a broader set of baselines. The experiments include persistence, seasonal naive, Ridge regression, gradient boosting, an architecture-agnostic ResNet, a ResNet with elicited parameters, and an oracle ResNet that observes the true without reporting noise. The gradient-boosting variant is also evaluated with and without elicited parameters.
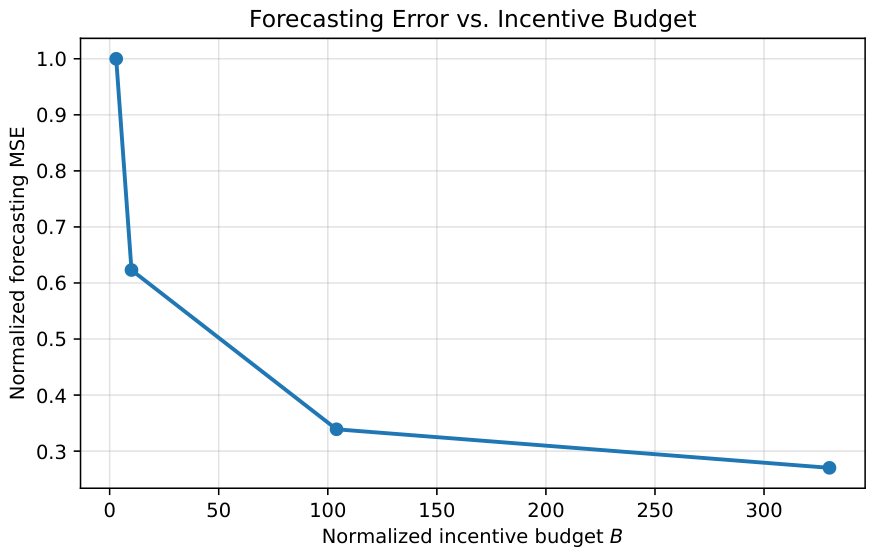
Figure 5 reports the budget sensitivity of forecasting error under the elicitation mechanism.
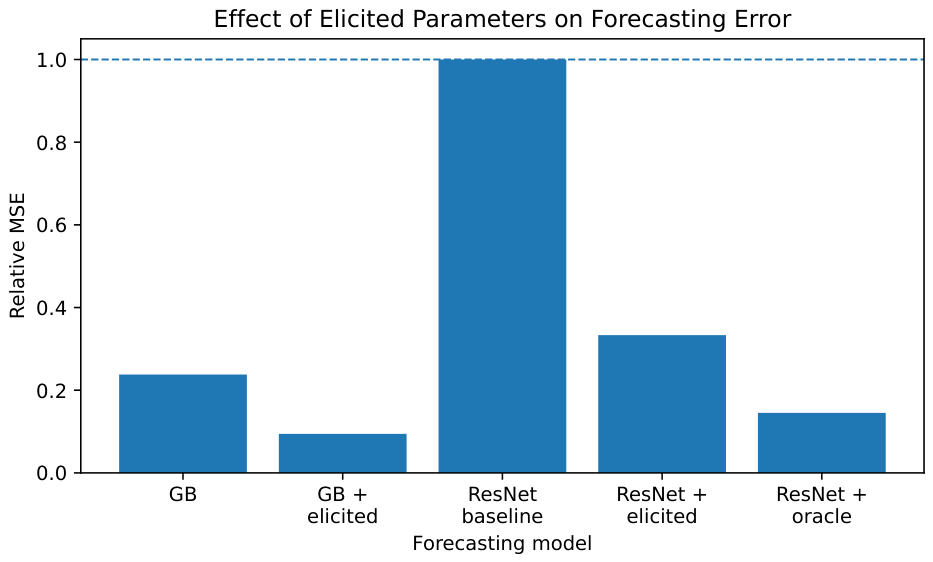
Table 4 and
Figure 6 show that incorporating elicited reduced-form parameters substantially improves the ResNet backbone. The architecture-agnostic ResNet obtains an average MSE of
, while the ResNet with elicited parameters obtains
, corresponding to a 65.1% reduction. The oracle-parameter variant further reduces MSE to
, providing an upper-bound comparison when the true reduced-form parameters are observed without reporting noise. Similar gains appear in the gradient-boosting comparison: adding elicited parameters reduces MSE from
to
. These results suggest that the predictive value comes from procuring otherwise unavailable provider-side demand information, rather than from a specific ResNet architecture alone.
6.4. Sensitivity to the Precision-Cost Distribution
To examine whether the mechanism depends on the uniform-cost benchmark, we conduct a Monte Carlo sensitivity analysis over 5000 replications with
providers. We compare uniform, truncated-normal, exponential, and log-normal private-cost distributions with comparable means. For transparency, this auxiliary analysis uses the complete-information precision benchmark
under
, with
. The same monotonic relationship between cost and precision carries over to the virtual-cost rule in Equation (
14).
Table 5 shows that the qualitative relationship is robust across distributions: lower reporting costs induce higher precision, and higher precision reduces imprecision loss. The uniform distribution therefore serves as a transparent benchmark rather than a necessary assumption for the mechanism.
7. Conclusions
This paper presents a proof-of-concept framework for mechanism-assisted LLM power-demand forecasting under information asymmetry. The central insight is that provider-side architecture- and deployment-informed demand parameters can be valuable forecasting features when they are elicited and verified through an incentive mechanism. In calibrated synthetic scenarios, adding elicited parameters reduces the MSE of the ResNet forecasting backbone by 65.1% relative to an architecture-agnostic ResNet baseline. Similar improvements are observed for gradient boosting, indicating that the value comes from procuring otherwise unavailable demand-relevant information rather than from a specific neural architecture alone.
The framework should be interpreted as an information-procurement and forecasting layer. It does not replace full LLM serving models, unit commitment, economic dispatch, reserve procurement, optimal power flow, or network-security analysis. Instead, it provides a mechanism for improving the information available to such downstream models. The experiments support the internal logic of this approach in controlled calibrated scenarios.
Limitations and Future Work
Several limitations should be emphasized. First, the LLM inference-energy model is a reduced-form approximation and does not fully capture KV-cache reuse, FlashAttention, grouped-query attention, MoE routing, batching, parallelism, memory hierarchy, or heterogeneous GPU scheduling. Richer serving models could allow the reduced-form coefficients to vary with batch size, context-window policy, decoding strategy, and hardware utilization. Second, the empirical evaluation uses calibrated synthetic scenarios rather than operational AI-data-center load measurements paired with proprietary serving logs. The results therefore demonstrate proof-of-concept validity, but not deployment-level external validity. Validation on measured data-center load, token throughput, and serving-configuration logs would be necessary before operational deployment. Third, the operator objective represents an information-procurement layer and does not explicitly model unit commitment, economic dispatch, reserve procurement, voltage stability, or transmission constraints. A natural extension is to embed the elicited demand distribution into downstream unit-commitment, reserve-sizing, or optimal-power-flow models and evaluate whether improved forecasts reduce operating costs or reliability violations. Fourth, truthful reporting requires an auditable or verifiable reporting environment. The audit layer in this paper addresses unilateral misreporting in reduced form, but it does not by itself eliminate risks of collusion, coordinated manipulation, market power, strategic non-participation, or data manipulation. Finally, practical implementation would require regulatory authority, confidentiality protection, and possibly privacy-preserving auditing protocols, such as trusted third-party audits or secure aggregation of commercially sensitive serving statistics.
Future work can extend the framework in several directions. One direction is to validate the forecasting stage using operational AI-data-center measurements when such data become available. A second direction is to replace the linear–quadratic reduced-form inference model with richer serving models that explicitly represent batching, memory hierarchy, and hardware scheduling. A third direction is to integrate the information-procurement layer with downstream power-system formulations, including unit commitment, reserve procurement, optimal power flow, and security constraints. Finally, privacy-preserving auditing methods, such as secure multi-party computation, federated learning, or confidential third-party verification, may allow providers to prove the accuracy of reduced-form reports without revealing commercially sensitive architectural details.
The broader implication is that emerging grid-interactive loads may require both forecasting tools and mechanisms for procuring privately held operational information. LLM data centers provide one motivating example, but similar issues may arise for other high-impact flexible or semi-flexible loads.
Author Contributions
Conceptualization, X.C., K.C., L.J., R.X., K.D. and Z.M.; methodology, K.C. and R.X.; validation, K.C. and R.X.; formal analysis, K.C. and R.X.; investigation, K.C. and R.X.; resources, X.C., K.C., L.J., R.X., K.D. and Z.M.; data curation, R.X.; writing—original draft preparation, K.C. and R.X.; writing—review and editing, X.C., K.C., L.J., R.X., K.D. and Z.M.; visualization, R.X.; supervision, X.C., L.J., K.D. and Z.M.; project administration, X.C., L.J., K.D. and Z.M.; funding acquisition, K.C. and R.X. All authors have read and agreed to the published version of the manuscript.
Funding
This work was supported by Guangdong Power Grid Company under Grant 036000KC23090003 (GDKJXM20231024), the National Natural Science Foundation of China (Project 62271434), and the Shenzhen Key Laboratory of Crowd Intelligence Empowered Low-Carbon Energy Networks (No. ZDSYS20220606100601002).
Institutional Review Board Statement
Not applicable.
Informed Consent Statement
Not applicable.
Data Availability Statement
The data analyzed in this study are publicly available from the sources cited in the manuscript, including the LLMs Energy Consumption Dataset reported in [
29]. The processed data used to support the findings of this study are available from the corresponding author upon reasonable request.
Conflicts of Interest
Authors Xinlei Cai, Lizhou Jiang, Kai Dong and Zijie Meng were employed by the company Power Dispatch Control Center of Guangdong Power Grid Co., Ltd. The remaining authors declare that the research was conducted in the absence of any commercial or financial relationships that could be construed as a potential conflict of interest.
References
- de Roucy-Rochegonde, L.; Buffard, A. AI, Data Centers and Energy Demand: Reassessing and Exploring the Trends. In Proceedings of the IFRI Papers; IFRI: Paris, France, 2025. [Google Scholar]
- IEA. AI Is Set to Drive Surging Electricity Demand from Data Centres While Offering the Potential to Transform How the Energy Sector Works. 2025. Available online: https://www.iea.org/news/ai-is-set-to-drive-surging-electricity-demand-from-data-centres-while-offering-the-potential-to-transform-how-the-energy-sector-works (accessed on 7 August 2025).
- Ramachandran, K.; Stewart, D.; Hardin, K.; Crossan, G.; Bucaille, A. As Generative AI Asks for More Power, Data Centers Seek More Reliable, Cleaner Energy Solutions. 2025. Available online: https://www.deloitte.com/us/en/insights/industry/technology/technology-media-and-telecom-predictions/2025/genai-power-consumption-creates-need-for-more-sustainable-data-centers.html (accessed on 7 August 2025).
- Stansbury, M.; Marchese, K.; Hardin, K.; Amon, C. Can US Infrastructure Keep Up with the AI Economy? 2025. Available online: https://www.deloitte.com/us/en/insights/industry/power-and-utilities/data-center-infrastructure-artificial-intelligence.html (accessed on 7 August 2025).
- Hasan, M.; Mifta, Z.; Papiya, S.J.; Roy, P.; Dey, P.; Salsabil, N.A.; Chowdhury, N.U.R.; Farrok, O. A state-of-the-art comparative review of load forecasting methods: Characteristics, perspectives, and applications. Energy Convers. Manag. X 2025, 26, 100922. [Google Scholar] [CrossRef]
- Cao, G.; Wu, L. Support vector regression with fruit fly optimization algorithm for seasonal electricity consumption forecasting. Energy 2016, 115, 734–745. [Google Scholar] [CrossRef]
- Alhashemi, K.; Altınöz, Ö.T. Electricity load forecasting models based on LSTM and GRU with their bidirectional recurrent neural networks. Niğde Ömer. Halisdemir Üniver. Mühendis. Bilim. Derg. 2025, 14, 1372–1384. [Google Scholar] [CrossRef]
- Ramos, P.V.B.; Villela, S.M.; Silva, W.N.; Dias, B.H. Residential energy consumption forecasting using deep learning models. Appl. Energy 2023, 350, 121705. [Google Scholar] [CrossRef]
- Wan, A.; Chang, Q.; Khalil, A.B.; He, J. Short-term power load forecasting for combined heat and power using CNN-LSTM enhanced by attention mechanism. Energy 2023, 282, 128274. [Google Scholar] [CrossRef]
- L’Heureux, A.; Grolinger, K.; Capretz, M.A. Transformer-based model for electrical load forecasting. Energies 2022, 15, 4993. [Google Scholar] [CrossRef]
- Song, C.; Yang, H.; Cai, J.; Yang, P.; Bao, H.; Xu, K.; Meng, X.B. Multi-energy load forecasting via hierarchical multi-task learning and spatiotemporal attention. Appl. Energy 2024, 373, 123788. [Google Scholar] [CrossRef]
- Zhang, X.; Wang, J.; Zhang, K. Short-term electric load forecasting based on singular spectrum analysis and support vector machine optimized by Cuckoo search algorithm. Electr. Power Syst. Res. 2017, 146, 270–285. [Google Scholar] [CrossRef]
- Chen, H.; Huang, H.; Zheng, Y.; Yang, B. A load forecasting approach for integrated energy systems based on aggregation hybrid modal decomposition and combined model. Appl. Energy 2024, 375, 124166. [Google Scholar] [CrossRef]
- Hafeez, G.; Khan, I.; Jan, S.; Shah, I.A.; Khan, F.A.; Derhab, A. A novel hybrid load forecasting framework with intelligent feature engineering and optimization algorithm in smart grid. Appl. Energy 2021, 299, 117178. [Google Scholar] [CrossRef]
- Ren, X.; Tian, X.; Wang, K.; Yang, S.; Chen, W.; Wang, J. Enhanced load forecasting for distributed multi-energy system: A stacking ensemble learning method with deep reinforcement learning and model fusion. Energy 2025, 319, 135031. [Google Scholar] [CrossRef]
- Zou, Z.; Wang, J.; E, N.; Zhang, C.; Wang, Z.; Jiang, E. Short-term power load forecasting: An integrated approach utilizing variational mode decomposition and TCN–BiGRU. Energies 2023, 16, 6625. [Google Scholar] [CrossRef]
- Gou, T.; Xu, Y.; Sun, H. Carbon-aware day-ahead optimal dispatch for integrated power grid thermal systems with aggregated distributed resources. Appl. Energy 2025, 389, 125715. [Google Scholar] [CrossRef]
- Eren, Y.; Küçükdemiral, İ. A comprehensive review on deep learning approaches for short-term load forecasting. Renew. Sustain. Energy Rev. 2024, 189, 114031. [Google Scholar] [CrossRef]
- Chen, D.; Lin, X.; Qiao, Y. Perspectives for artificial intelligence in sustainable energy systems. Energy 2025, 318, 134711. [Google Scholar] [CrossRef]
- Liu, N.; Yu, X.; Wang, C.; Li, C.; Ma, L.; Lei, J. Energy-sharing model with price-based demand response for microgrids of peer-to-peer prosumers. IEEE Trans. Power Syst. 2017, 32, 3569–3583. [Google Scholar] [CrossRef]
- Chen, H.; Li, Y.; Louie, R.H.; Vucetic, B. Autonomous demand side management based on energy consumption scheduling and instantaneous load billing: An aggregative game approach. IEEE Trans. Smart Grid 2017, 5, 1744–1754. [Google Scholar] [CrossRef]
- Zhang, C.; Wu, J.; Zhou, Y.; Cheng, M.; Long, C. Peer-to-Peer energy trading in a Microgrid. Appl. Energy 2018, 220, 1–12. [Google Scholar] [CrossRef]
- Wang, J.; Zhong, H.; Wu, C.; Du, E.; Xia, Q.; Kang, C. Incentivizing distributed energy resource aggregation in energy and capacity markets: An energy sharing scheme and mechanism design. Appl. Energy 2019, 252, 113471. [Google Scholar] [CrossRef]
- Li, Z.; Chen, L.; Nan, G. Small-scale renewable energy source trading: A contract theory approach. IEEE Trans. Ind. Inform. 2017, 14, 1491–1500. [Google Scholar] [CrossRef]
- Lin, R.; Xu, Z.; Huang, X.; Gao, J.; Chen, H.; Shen, T. Optimal scheduling management of the parking lot and decentralized charging of electric vehicles based on mean field game. Appl. Energy 2022, 328, 120198. [Google Scholar] [CrossRef]
- Tran, N.H.; Tran, D.H.; Ren, S.; Han, Z.; Huh, E.N.; Hong, C.S. How geo-distributed data centers do demand response: A game-theoretic approach. IEEE Trans. Smart Grid 2015, 7, 937–947. [Google Scholar] [CrossRef]
- Zhou, Z.; Liu, F.; Chen, S.; Li, Z. A truthful and efficient incentive mechanism for demand response in green datacenters. IEEE Trans. Parallel Distrib. Syst. 2018, 31, 1–15. [Google Scholar] [CrossRef]
- Bahrami, S.; Wong, V.W.; Huang, J. Data center demand response in deregulated electricity markets. IEEE Trans. Smart Grid 2018, 10, 2820–2832. [Google Scholar] [CrossRef]
- Kumar, N. LLMs Energy Consumption Dataset. 2024. Available online: https://www.kaggle.com/datasets/nitishkumar2k01/llms-energy-consumption-dataset (accessed on 7 November 2025).
| Disclaimer/Publisher’s Note: The statements, opinions and data contained in all publications are solely those of the individual author(s) and contributor(s) and not of MDPI and/or the editor(s). MDPI and/or the editor(s) disclaim responsibility for any injury to people or property resulting from any ideas, methods, instructions or products referred to in the content. |