Article

Synchronization of Low-Frequency Thermoacoustic Oscillation in Can-Annular Combustor via Compressor Combustion Casing


1
China United Gas Turbine Technology Co., Ltd., Beijing 100016, China
2
State Power Investment Corporation Limited, Beijing 100029, China
3
Key Laboratory for Thermal Science and Power Engineering of Ministry of Education, Department of Energy and Power Engineering, Tsinghua University, Beijing 100084, China
*
Author to whom correspondence should be addressed.
Energies 2026, 19(11), 2552; https://doi.org/10.3390/en19112552
Submission received: 12 March 2026 / Revised: 25 April 2026 / Accepted: 30 April 2026 / Published: 26 May 2026

Abstract

Thermoacoustic instability remains an important challenge in gas turbines. In can-annular combustors, cross-talk effects can lead to complex collective dynamics. This paper investigates the in-phase synchronization of low-frequency thermoacoustic oscillations in a can-annular combustor, focusing on the upstream cross-talk mechanism mediated by the compressor combustion casing. Dynamic pressure data from the full-scale engine reveal a transition from independent, low-amplitude pressure dynamics to a state of high-amplitude, in-phase synchronized oscillation in the combustor system. To quantify the upstream cross-talk effect, the multi-port acoustic scattering matrix of the casing is computed by solving the Helmholtz equation based on a mean-flow field obtained from Reynolds-Averaged Navier–Stokes simulations. Analysis of the matrix shows that the casing provides a coupling path between cans, with strength and phase being insensitive to the relative azimuthal position of the cans. Based on this physical insight, a star-network model of coupled Van der Pol oscillators is developed. The model, with parameters identified from experimental data and inferred from the scattering matrix, successfully reproduces the synchronization phenomenon observed in the experiment. A subsequent parametric study based on the validated model shows that in-phase synchronization occurs within periodic windows of the time delay and that the range of these windows expands with increasing coupling strengths. For τ = 0.1 T , 0.85 T and 1.1 T , synchronization is achieved with moderate coupling strengths. For τ = 0.35 T and 0.6 T , the interaction between the two coupling mechanisms suppresses synchronization even at strong coupling strengths. This study shows that the upstream cross-talk effect is an important mechanism for in-phase synchronization and provides a validated, physics-based model for analyzing and predicting the collective thermoacoustic behavior of can-annular combustors.

1. Introduction

Thermoacoustic instability remains an important challenge in gas turbines. Many heavy-duty gas turbines utilize a can-annular combustor architecture, which consists of multiple combustor cans arranged in a circular array. In a can-annular system, the individual combustor cans are not acoustically isolated. They can be coupled through the outlets of the transition duct [1], the crossfire tube [2], upstream compressor combustor casing [3], etc. Pressure oscillations originating in one can could propagate and influence the dynamics in other cans. This can-to-can interaction is known as the cross-talk effect, which is similar to the burner-to-burner interaction in annular combustors, where the multiple burners interact via a plenum and combustor [4,5,6,7]. In can-annular combustors, cross-talk effects introduce collective dynamics that are absent in an isolated can, thereby complicating the overall thermoacoustic behavior. Previous studies focused on the downstream cross-talk effect, which usually leads to a ‘push-pull’ mode or chimera state  [2,8,9,10,11]. However, field operation data from a full-scale F-class heavy-duty gas turbine revealed a state of high-amplitude, low-frequency, in-phase synchronized oscillation in all cans. These observations suggest an upstream cross-talk effect, potentially mediated by the compressor combustion casing. A new model is needed to explain the upstream coupling mechanism.
The downstream cross-talk effect, on which most of the recent literature has focused, originates from the gap area at the turbine inlet. Laboratory experiments, as well as LES and FEM simulations, were conducted to investigate the effect of the size and position of the cross-talk area on the thermoacoustic characteristics [1,12,13]. For example, breathing chimera and anti-phase synchronization phenomena were observed in a four-can system [9]. Recurrence networks and unsupervised machine learning were used to characterize the synchronization patterns. The results demonstrated that the downstream cross-talk effect plays a critical role in defining the collective dynamics of the system. Vorgias et al. [14] established a 12-can electro-acoustic system to study thermoacoustic mode synchronization. The experimental results showed that system symmetry and boundary conditions could affect the synchronization phenomenon. Several theoretical acoustic models were established to consider the effects of grazing flow [10], bias flow [15], and high dimensional acoustic propagation [16,17] on the downstream cross-talk effect. Meanwhile, some studies focused on the global thermoacoustic behavior of can-annular combustors by modeling each can as a Van der Pol (VDP) oscillator to describe its oscillatory characteristics. In these low-order network model approaches, the cross-talk effect between combustors is represented by the difference in pressure perturbations, defined as time-delay and dissipative couplings [8,18,19,20]. Liao et al. [11] developed a ring of four VDP oscillators with dissipative, time-delay, and reactive coupling, demonstrating that such low-order models can capture a range of collective dynamics, including anti-phase synchronization, pairwise oscillations, and spinning azimuthal modes. Zheng et al. [20] discussed the effect of nonlocal can-to-can interaction on the asymmetric thermoacoustic oscillators.
While the downstream cross-talk effect has been extensively studied, the role of the upstream cross-talk effect has received less attention, despite its potential significance. However, in our study, the experimental data show that pressure oscillations at the compressor outlet can be observed at the same frequency as those inside the combustor. This provides strong evidence for the presence of the upstream cross-talk effect. According to the structure of this gas turbine, the compressor combustion casing plays an important role. The possibility of this upstream cross-talk effect has also been pointed out in some gas turbines [21,22]. A few researchers have considered the upstream cross-talk effect. Haeringer et al. [3,23] combined CFD simulation and a state-space method to study the thermoacoustic oscillations in can-annular configurations with an annular upstream structure. Yoon et al. [24] studied the thermoacoustic characteristics of combustors with cross-talk between multiple plenums. In the above studies, the upstream section of the cans has an annular configuration that differs substantially from the compressor combustion casing in practical heavy-duty gas turbines. The cross-talk effect induced by the compressor combustion casing on thermoacoustic instability requires the development of a new model.
This paper investigates the effect of upstream cross-talk via the compressor combustion casing of a can-annular combustor on thermoacoustic synchronization using a combined experimental and physically-based modeling approach. Full-scale engine field-operation data showing global in-phase synchronization in a 14-can-annular combustor are first presented. The upstream cross-talk effect is then quantified using the Helmholtz frequency-domain solver in COMSOL Multiphysics® v5.4. Based on this physical characterization, a star-network model of coupled Van der Pol oscillators is developed to analyze the system’s collective dynamics. The subsequent sections detail the experimental setup and results (Section 2), the numerical acoustic coupling analysis (Section 3), and the development and validation of the low-order network model (Section 4), followed by a concluding discussion.

2. Synchronization Phenomenon in the Full-Scale Engine Experiment

2.1. Experiment Setup

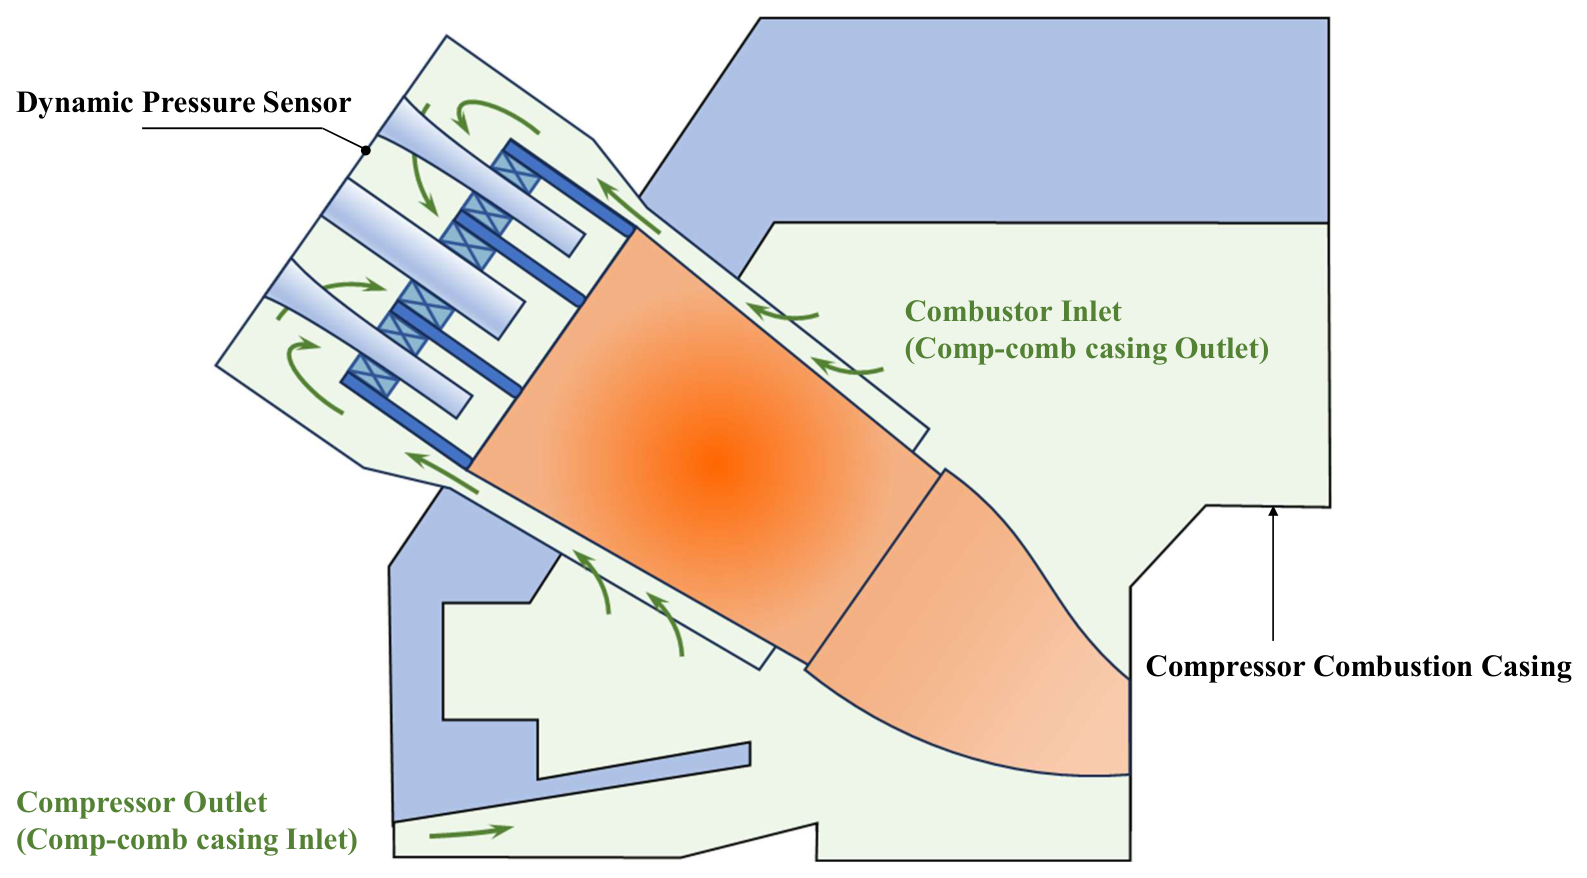
The present study is based on an engine field-operation campaign of a full-scale F-class heavy-duty gas turbine, covering a wide operating range up to full load. Such full-engine, full-temperature and full-pressure data are rarely available in the open literature. The gas turbine features 14 cans installed in a compressor combustion casing. Figure 1 shows the sketch of the compressor combustion casing and cans. Steady-state data are recorded for temperature, pressure, flow, and pollutant emissions. For dynamic data, each can is equipped with a dynamic pressure sensor at the head end (cold side) to capture the pressure oscillation. All dynamic pressure data are recorded at a sample rate of 25.6 kHz during the experiment.

2.2. Synchronization Phenomenon

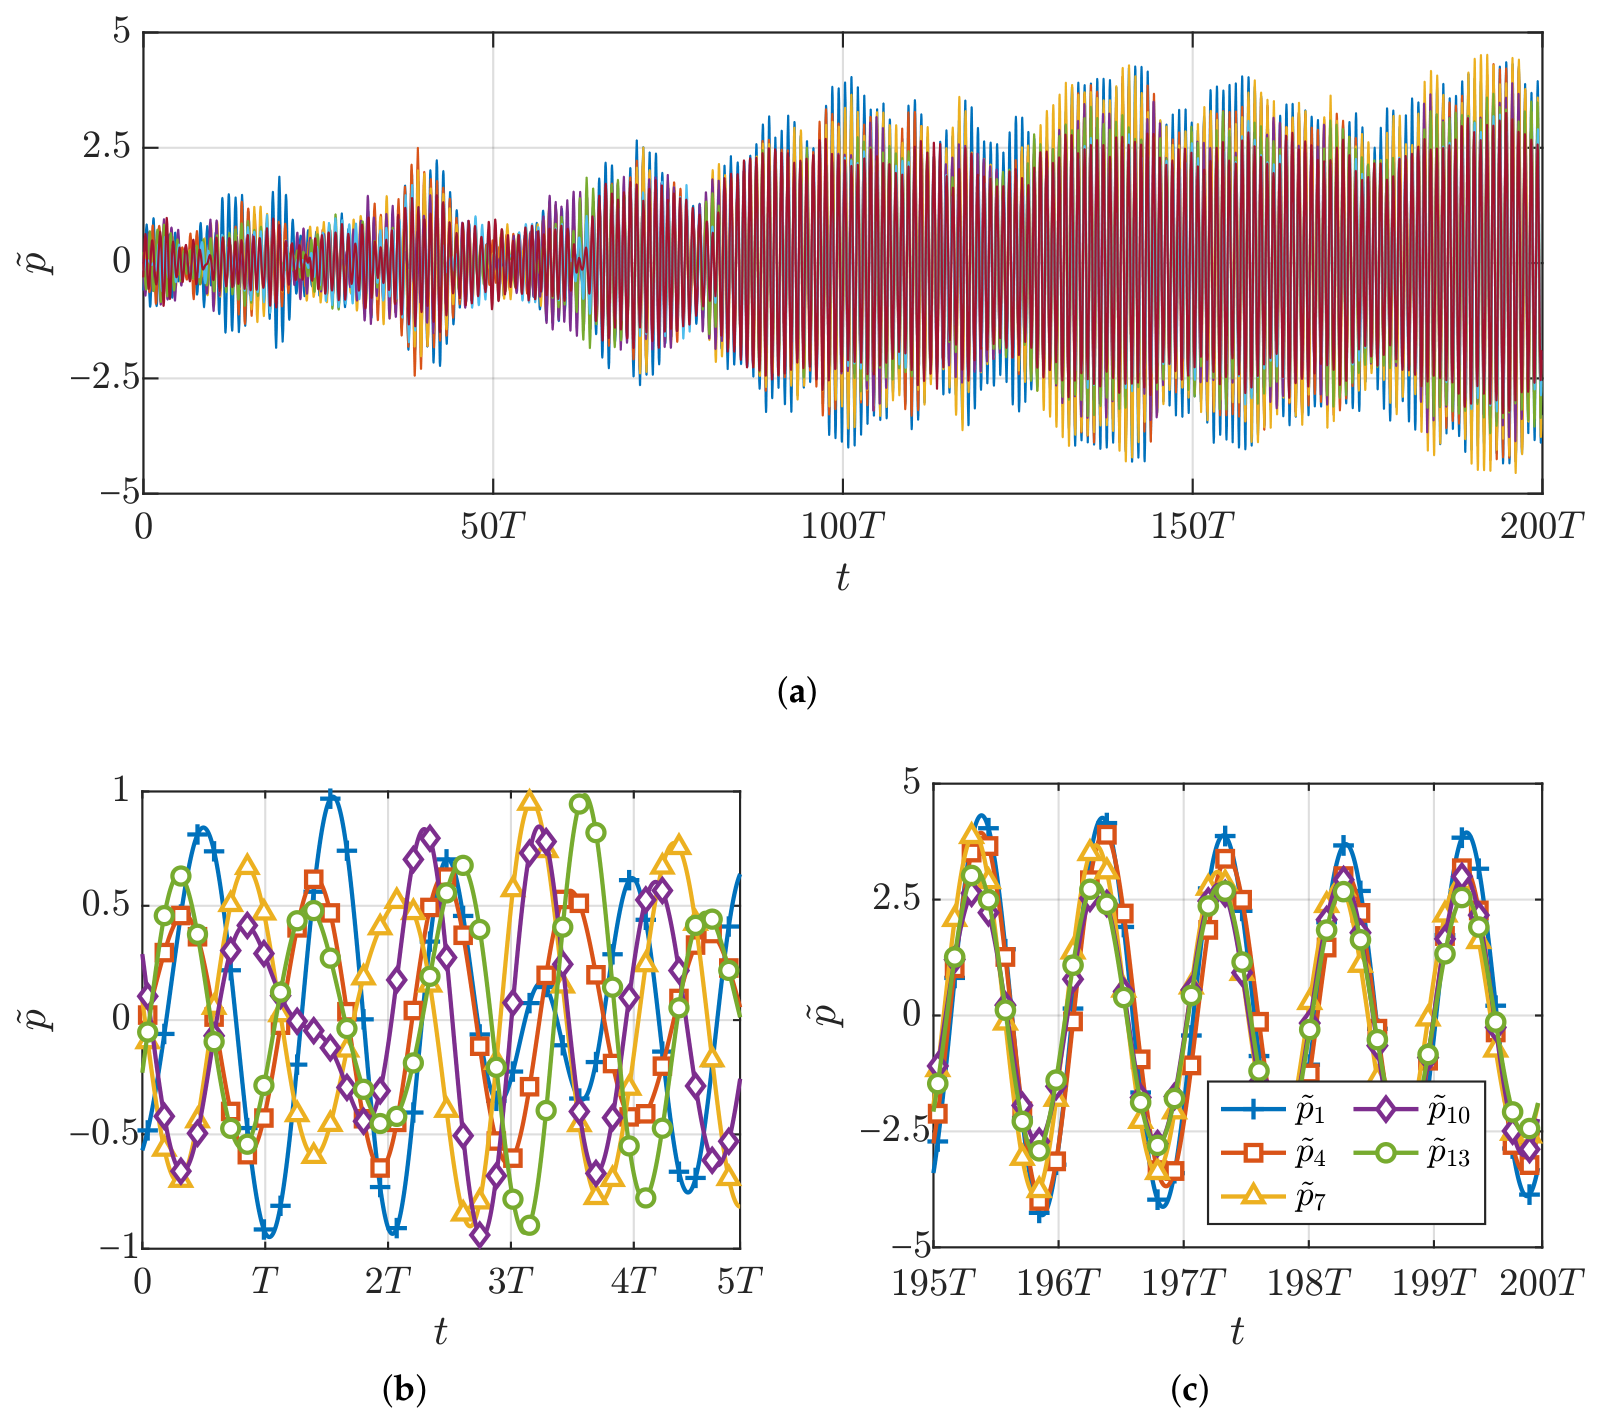
The low-frequency thermoacoustic oscillations under investigation were observed at a specific partial-load operating condition and were detected by all dynamic pressure sensors across the cans. Figure 2 shows the dynamic pressure signals of the thermoacoustic instability. Pressure signals in all 14 cans were acquired during the experiment, while only the pressure signals from cans 1, 4, 7, 10 and 13 are shown in the figure for clarity. Figure 2a shows a transition from weakly correlated, low-amplitude pressure dynamics to high-amplitude, globally in-phase low-frequency limit-cycle oscillation. These pressure signals are normalized using a reference value. Before the onset of the thermoacoustic instability, the pressure dynamics in each can were effectively independent, as shown in Figure 2b. As the system evolved into the limit-cycle state, in-phase synchronized oscillations are observed across all pressure signals, indicating a dominant thermoacoustic mode within the system, as shown in Figure 2c. The observed frequency ω 0 is much lower than that of the first-order longitudinal acoustic mode of a single can. Such low-frequency oscillations have been associated with entropy waves in the literature [25]. The in-phase synchronization across all cans is a new thermoacoustic oscillation phenomenon observed in a practical gas turbine system. In the present work, we focus on the can-to-can phase synchronization mechanism mediated by the upstream casing.
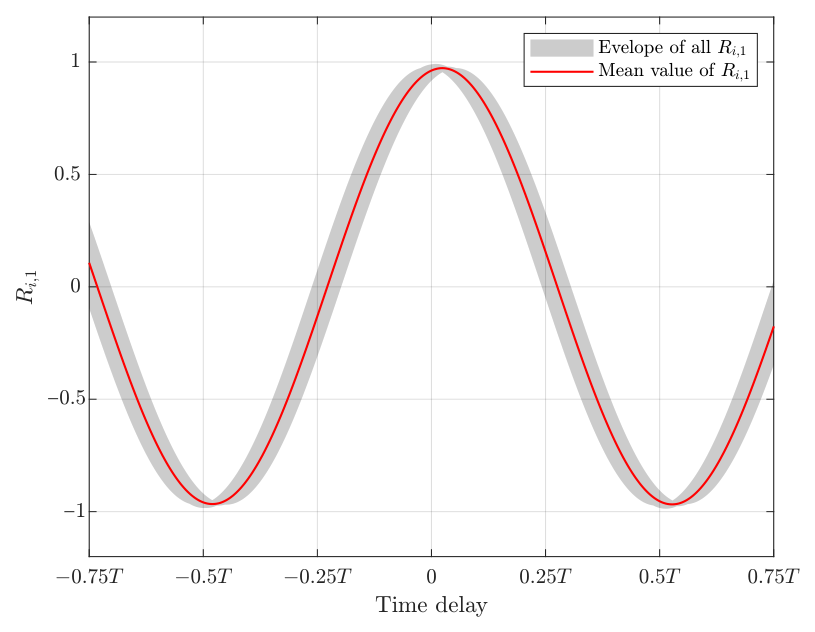
To provide a more direct characterization of the synchronization, a cross-correlation analysis was performed on the pressure signals during the limit-cycle state. Figure 3 shows the envelope and the mean of the normalized cross-correlation functions R i , 1 for all other cans with respect to the reference can (Can 1). The analysis confirms a globally in-phase synchronized state. The correlation peaks are nearly unity (>0.97) and tightly clustered around the time delay τ = 0 . While small time delays exist due to factors such as stochastic noise, they are negligible in comparison to the period of low-frequency oscillation. Therefore, the system can be effectively described as being in a state of near in-phase synchronization.
To analyze the synchronization phenomenon, the instantaneous amplitude and phase of the pressure oscillation are obtained from the filtered dynamic pressure signals using a Hilbert transform. The mean, standard deviation, and coefficient of variation are calculated to quantify the variation in oscillation amplitude among the cans, which are defined as
p ^ ¯ t = i = 1 N p i ^ t N ,
σ p t = i = 1 N p i ^ t p ^ ¯ t 2 N ,
c v p t = σ p t p ^ ¯ t ,
where p i ^ denotes the instantaneous amplitude of pressure oscillation in the i-th can. N is the number of cans, which is 14 in this paper.
The phase relationship between the pressure oscillations in different cans is a key indicator of the synchronization phenomenon. One of the cans is selected as the reference can, and the relative phase difference is then defined as
Δ ϕ i t = ϕ i t ϕ r e f t .
Then, the mean and standard deviation of the phase differences are calculated as follows:
Δ ϕ ¯ t = i = 1 N Δ ϕ i N ,
σ ϕ t = i = 1 N Δ ϕ i t Δ ϕ ¯ t 2 N ,
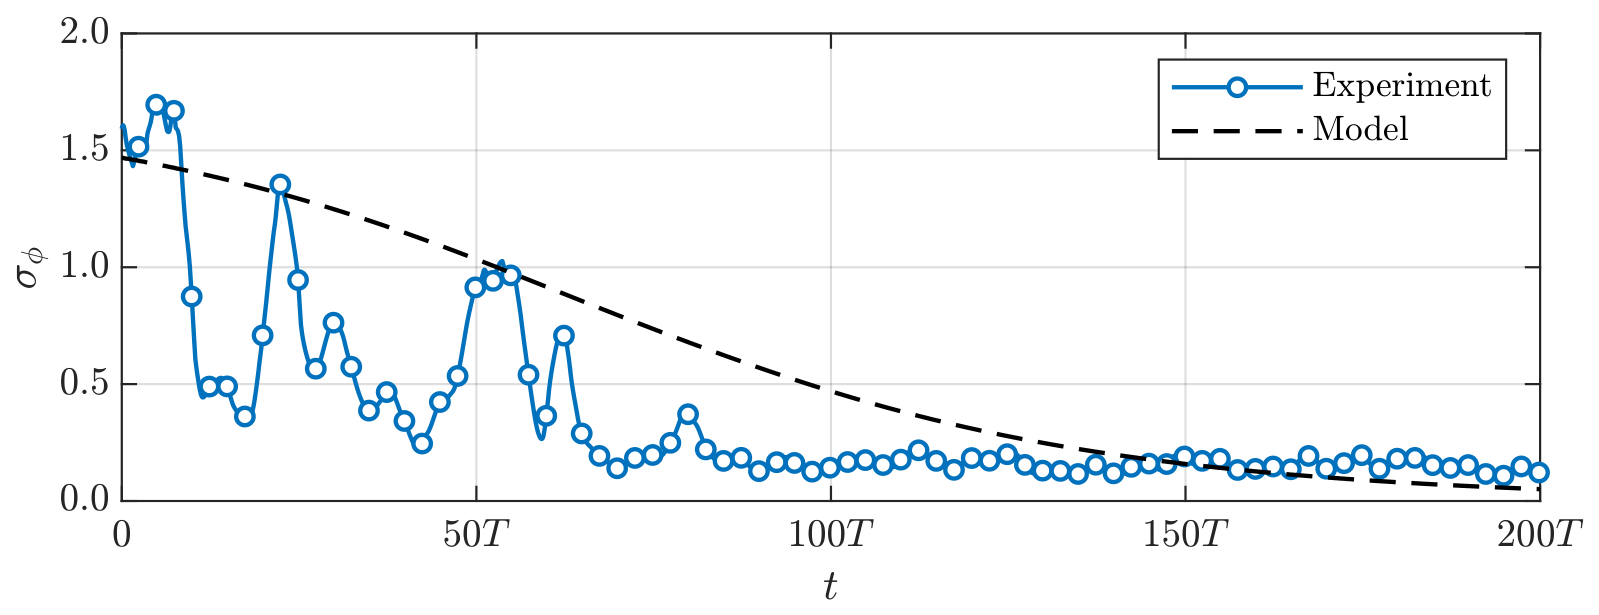
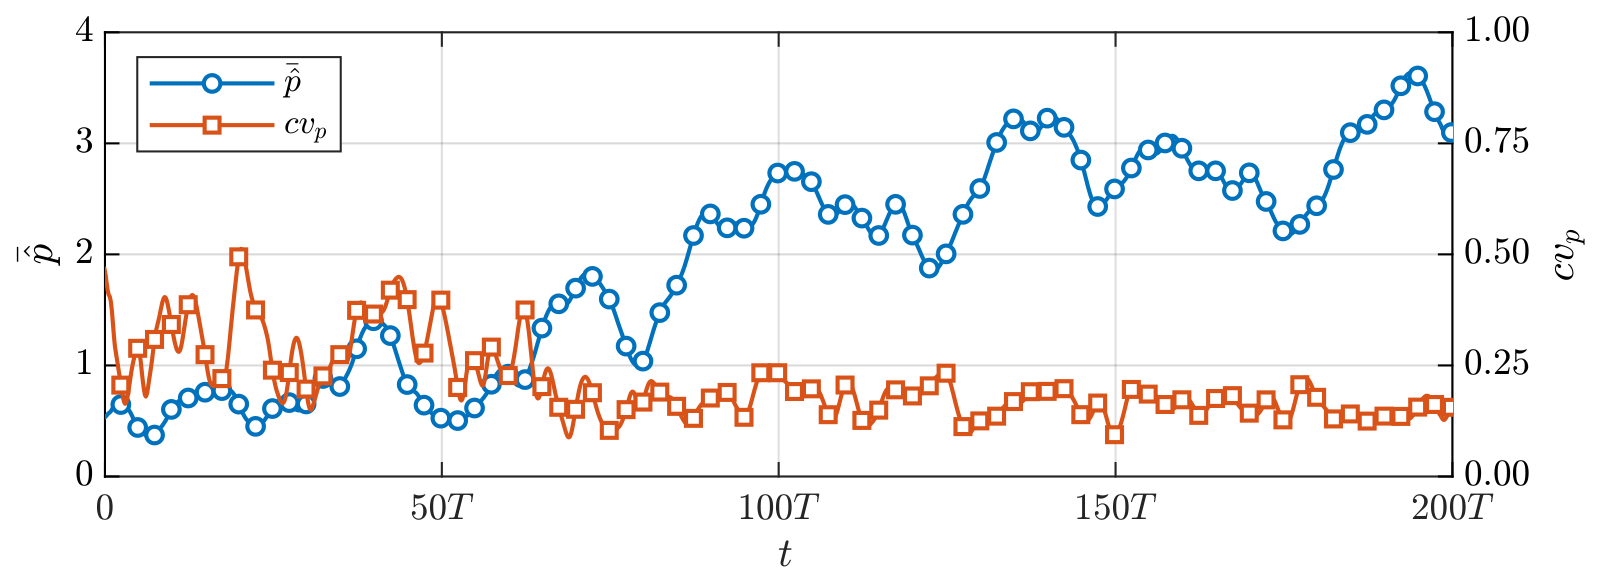
where σ ϕ serves as a quantitative measure of phase synchrony. A value approaching zero indicates perfect in-phase synchronization. Figure 4 shows the evolution of p ^ ¯ t and c v p t . After reaching the limit cycle state, the coefficient of variation levels off at around 0.15. This is supported by Figure 2, which shows that during the limit cycle state, the pressure oscillation amplitudes in different cans are not identical. This observation can be attributed to slight non-uniformity among the individual cans. Inevitable minor variations in manufacturing and assembly lead to small differences in the thermoacoustic properties of each can, which in turn manifest as slight differences in their final limit cycle amplitudes.
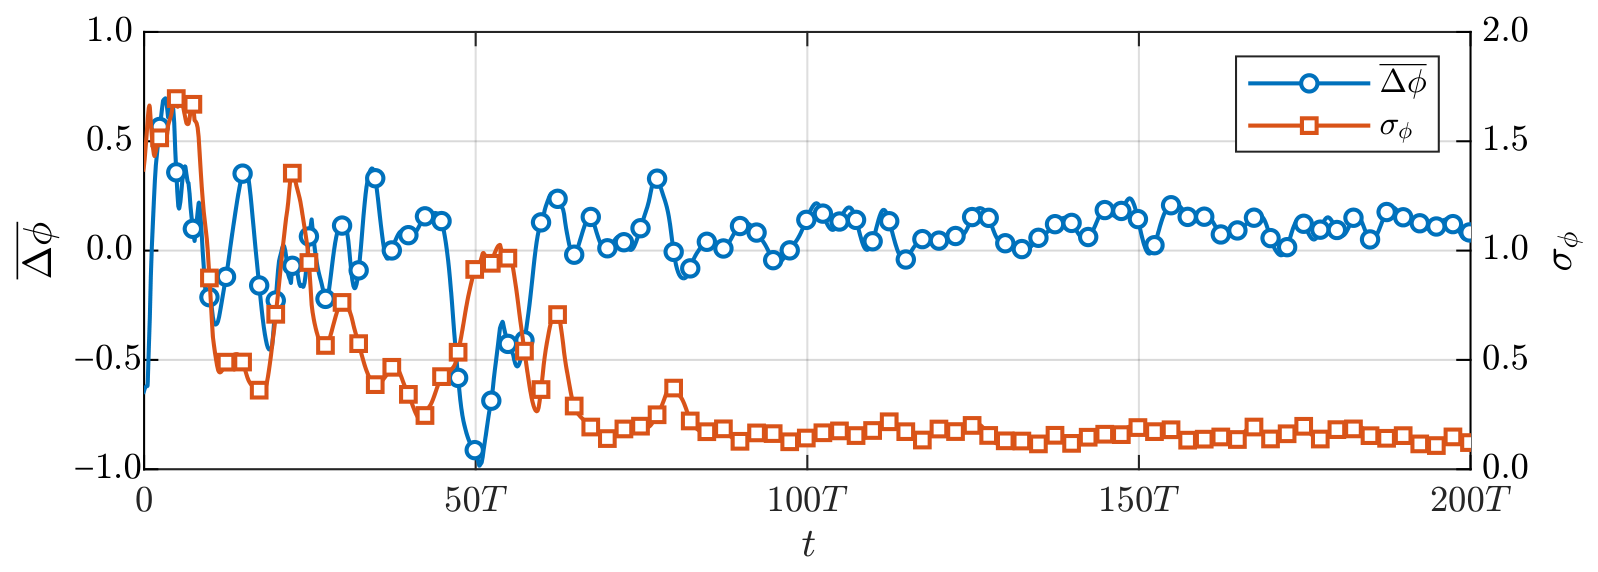
Figure 5 shows the Δ ϕ ¯ t and σ ϕ t gradually decreasing, and they are close to zero when reaching the limit cycle state. This implies that all cans eventually perform in-phase synchronization.
The in-phase synchronization observed in the experiment suggested the presence of a cross-talk effect. This is also supported by the fact that during the onset of the thermoacoustic instability, the dynamic pressure sensor at the compressor outlet detected pressure oscillations at the same frequency as in the cans, which supports the presence of an upstream acoustic pathway. This motivates the scattering-matrix characterization of the compressor combustion casing in Section 3.

2.3. Discussion on the Origin of the Instability

The observed thermoacoustic oscillations could potentially be conflated with aerodynamic noise originating from the compressor. However, pressure oscillations associated with the compressor, such as blade passing frequencies, are determined by its rotational speed and blade count and typically lie in the kilohertz range [26]. The low-frequency oscillation observed in our experiment is inconsistent with a compressor aerodynamic source. To definitively verify the thermoacoustic origin of the instability, we analyzed data from a single-can combustor experiment under similar operating conditions, as well as full-engine test data with different fuel staging parameters at the same load.
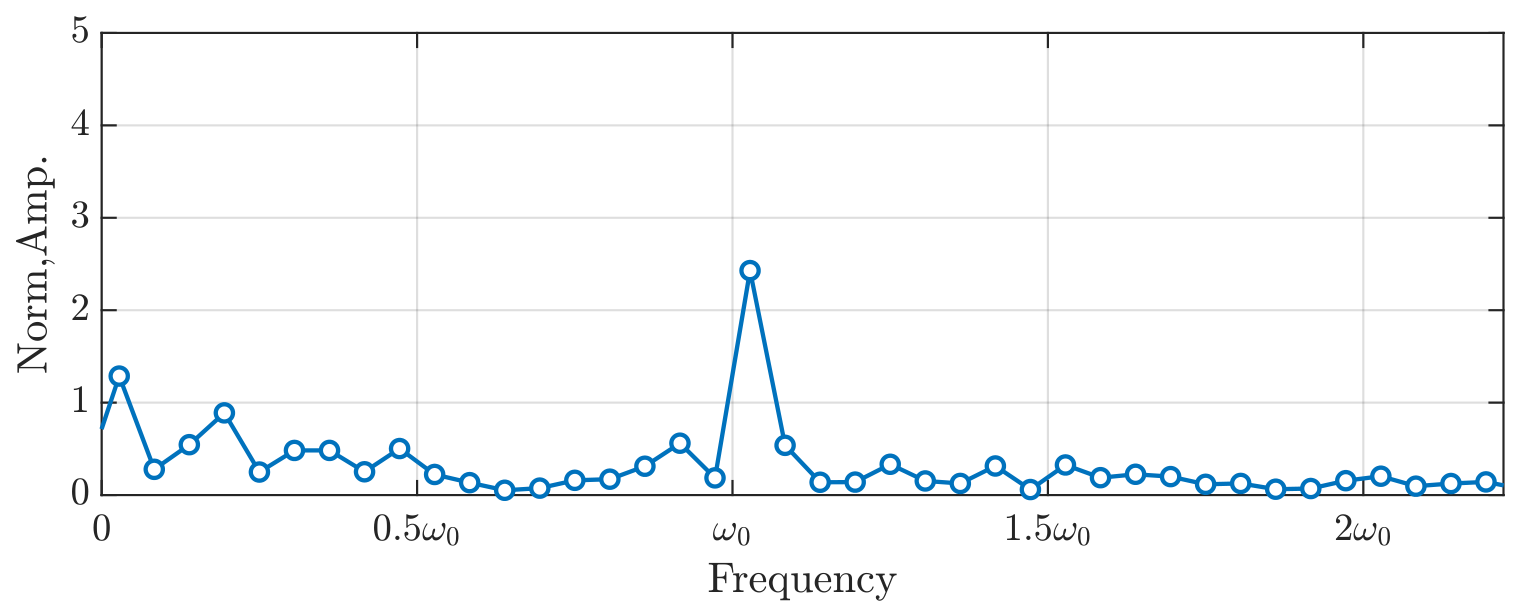
Figure 6 shows the pressure frequency spectrum from a single-can experiment conducted under similar operating conditions. It reveals a dominant peak near the observed frequency ω 0 . The emergence of this mode in the absence of the compressor confirms that the instability originates from a thermoacoustic feedback loop within the can combustor.
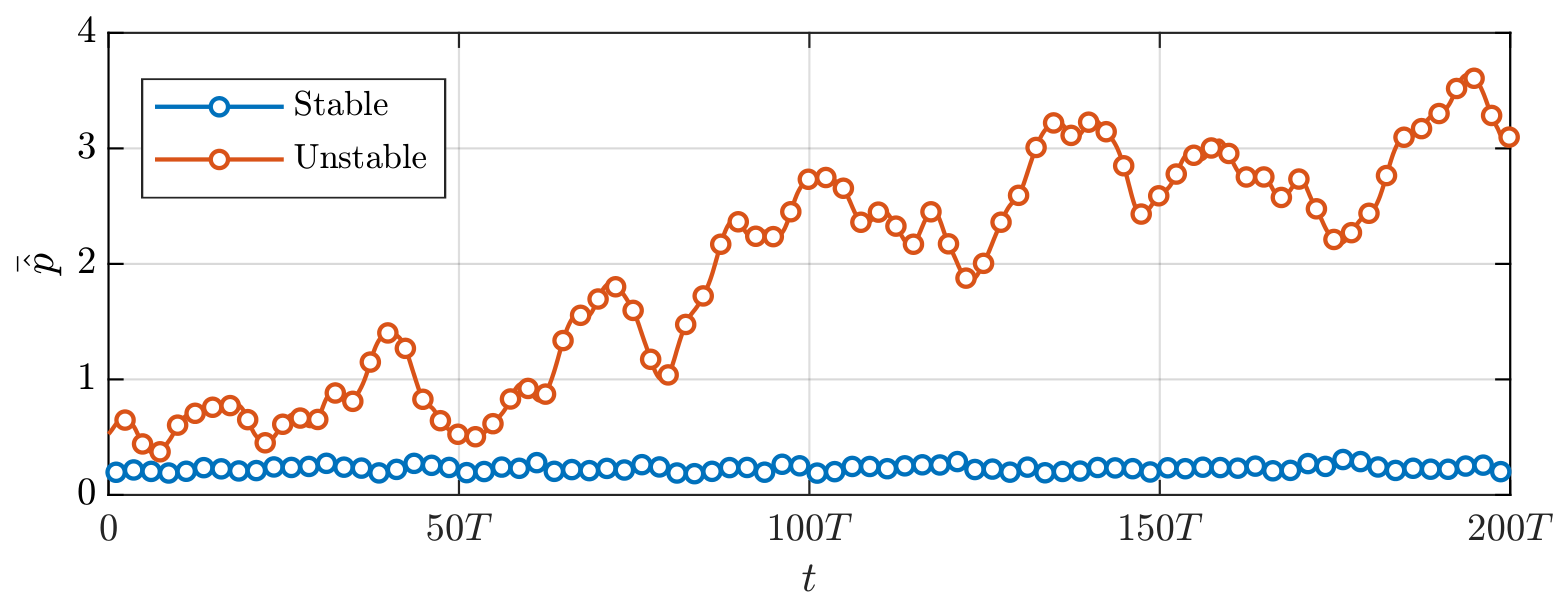
The sensitivity of the oscillation to combustion parameters provides definitive evidence of its thermoacoustic origin. It is standard industrial practice to suppress thermoacoustic instability by adjusting fuel staging [2,22,27]. We applied this method during our full-engine tests. Figure 7 compares the amplitudes of the low-frequency pressure oscillations for two different fuel staging parameter settings at the same load. The results demonstrate that a change in the staging parameter leads to the complete suppression of the low-frequency oscillation. This direct causal link between combustion control parameters and the existence of the instability confirms that it originated from a thermoacoustic feedback mechanism.
Based on the analysis above, we can conclude that the origin of the low-frequency oscillation is a thermoacoustic instability rather than an effect from the compressor. This provides a foundation for the subsequent analysis of the acoustic coupling between multiple cans via the compressor combustion casing and for the development of the corresponding star-network oscillator model.

3. Numerical Results of Upstream Cross-Talk Effect

To quantify the upstream cross-talk effect, the acoustic characteristics of the compressor combustion casing were investigated using a two-step numerical approach. First, the mean-flow field, including pressure, temperature, and velocity, was obtained with Reynolds-Averaged Navier–Stokes (RANS) simulations using the experimental boundary conditions. Second, the Helmholtz equation was solved in the frequency domain based on the mean-flow field to compute the multi-port acoustic scattering matrix of the compressor combustion casing.

3.1. Mean-Flow Field in the Compressor Combustion Casing

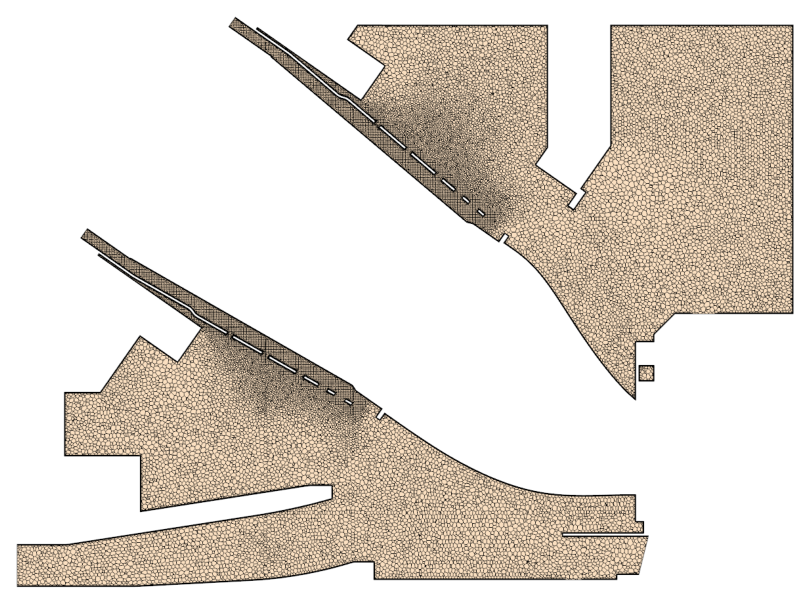
The mean-flow field was calculated using STARCCM+. The computational domain extends from the compressor outlet to the inlets of the cans. In this reverse-flow configuration, air enters the compressor combustion casing, turns, and flows through a guide liner towards the cans, moving counter to the direction of the internal hot gas flow. The simulation was performed using a three-dimensional, steady-state Reynolds-Averaged Navier–Stokes (RANS) approach, assuming an ideal gas. The Realizable k ϵ model was selected for turbulence closure. The governing equations were discretized using a second-order upwind scheme. A mass flow rate boundary condition was applied at the main inlet (compressor outlet). The inlet profiles for velocity and turbulence quantities were obtained from a separate CFD simulation of the upstream compressor. At the 14 outlets corresponding to the combustor inlets, pressure outlet boundary conditions were applied. A polyhedral mesh with local refinement was used for the spatial discretization, as shown in Figure 8. The details of the mesh are summarized in Table 1.
To ensure the accuracy and reliability of the numerical results, a mesh independence study was conducted. Four different mesh schemes were tested, and the normalized pressure, referenced to the experimental value in the casing ( P exp ), was chosen to assess the convergence. The results are summarized in Table 2. This reduction in the relative change demonstrates a convergence trend towards a mesh-independent solution. The third mesh was accurate enough for the present study because the relative change is less than 5%. Therefore, this mesh, which corresponds to the setup detailed in Table 1, is chosen to balance computational efficiency with solution precision.
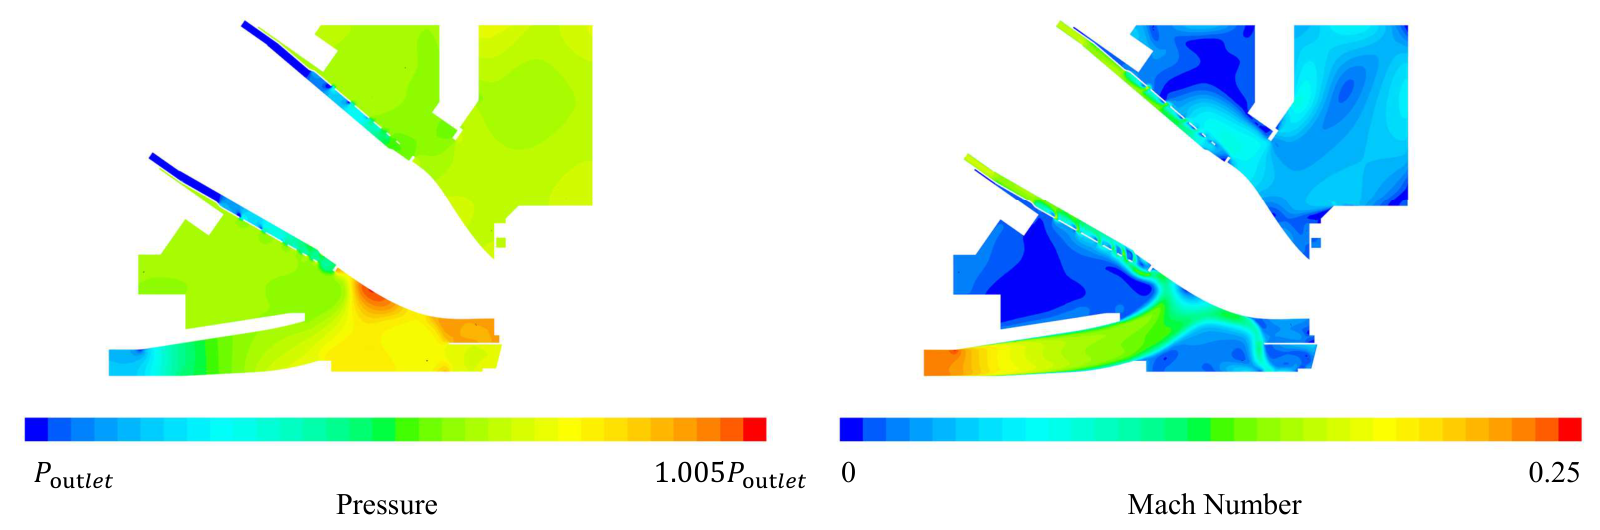
Figure 9 shows the pressure and velocity magnitude in the compressor combustion casing. The airflow decelerates as it enters the compressor combustion casing and slows further upon impinging on the transition duct. Part of the flow bypasses this component to reach the outer wall of the casing. Overall, the static pressure field inside the casing is relatively uniform. The maximum pressure difference is 0.5% of the average pressure, with the peak pressure occurring in the stagnation region formed by the flow impacting the transition duct.

3.2. Acoustic Scattering Matrix of the Compressor Combustion Casing

The compressor combustion casing is a multi-port acoustic element, with each port corresponding to the interface between the casing and one can. Specifically, these 14 ports represent the inlets of the individual combustor cans. The acoustic simulation requires a realistic boundary condition at the casing’s main inlet, which is modeled following the methodology of Silva et al. [28]. A frequency-dependent reflection coefficient R c o m p ω is obtained. This complex frequency-dependent coefficient was then implemented as the impedance boundary condition for the casing inlet in the Helmholtz simulation in COMSOL. Therefore, the acoustic characteristics could be described by an acoustic scattering matrix, S ω C 14 × 14 . The matrix element S j , i represents the relation between the incident wave at port i and the resulting outgoing wave from port j. Given the rotational symmetry of the compressor combustion casing geometry and mean-flow field, the scattering matrix, which is a symmetric circulant matrix, could be constructed from a single reference simulation. A unit-amplitude incident pressure wave was imposed at a reference port, while the outgoing wave amplitudes were recorded at other ports. All ports (representing the combustor inlets) were set up as a non-reflecting boundary condition. This setup ensures that outgoing waves are fully absorbed and do not reflect back, allowing for an accurate calculation of the scattering matrix element. The simulation was conducted near the frequency observed in the experiment, using a mesh with more than 5 × 10 6 grids. The grid resolution was chosen to ensure that there are at least 30 grid points per wavelength for the frequencies considered in this study, which is sufficient for accurately resolving the acoustic waves.
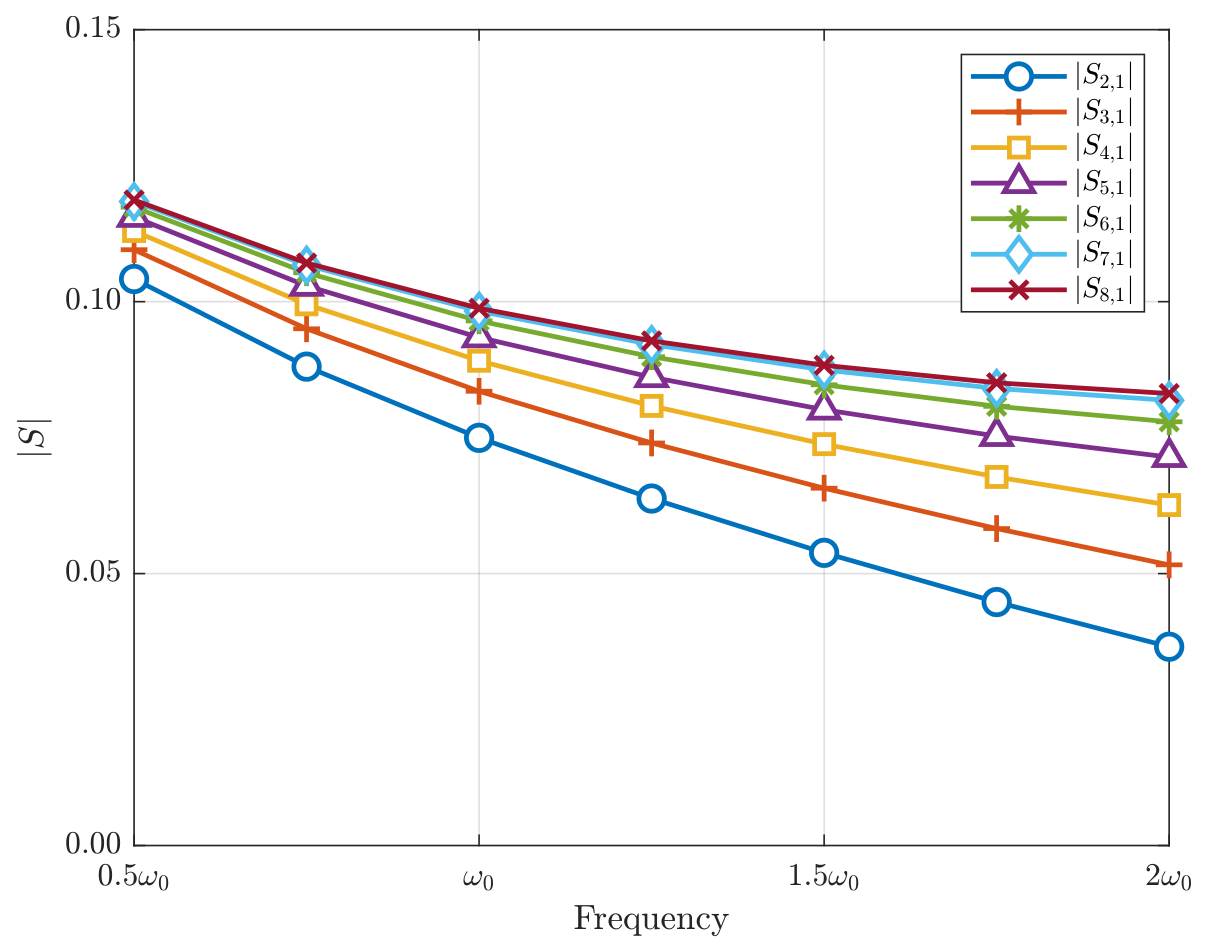
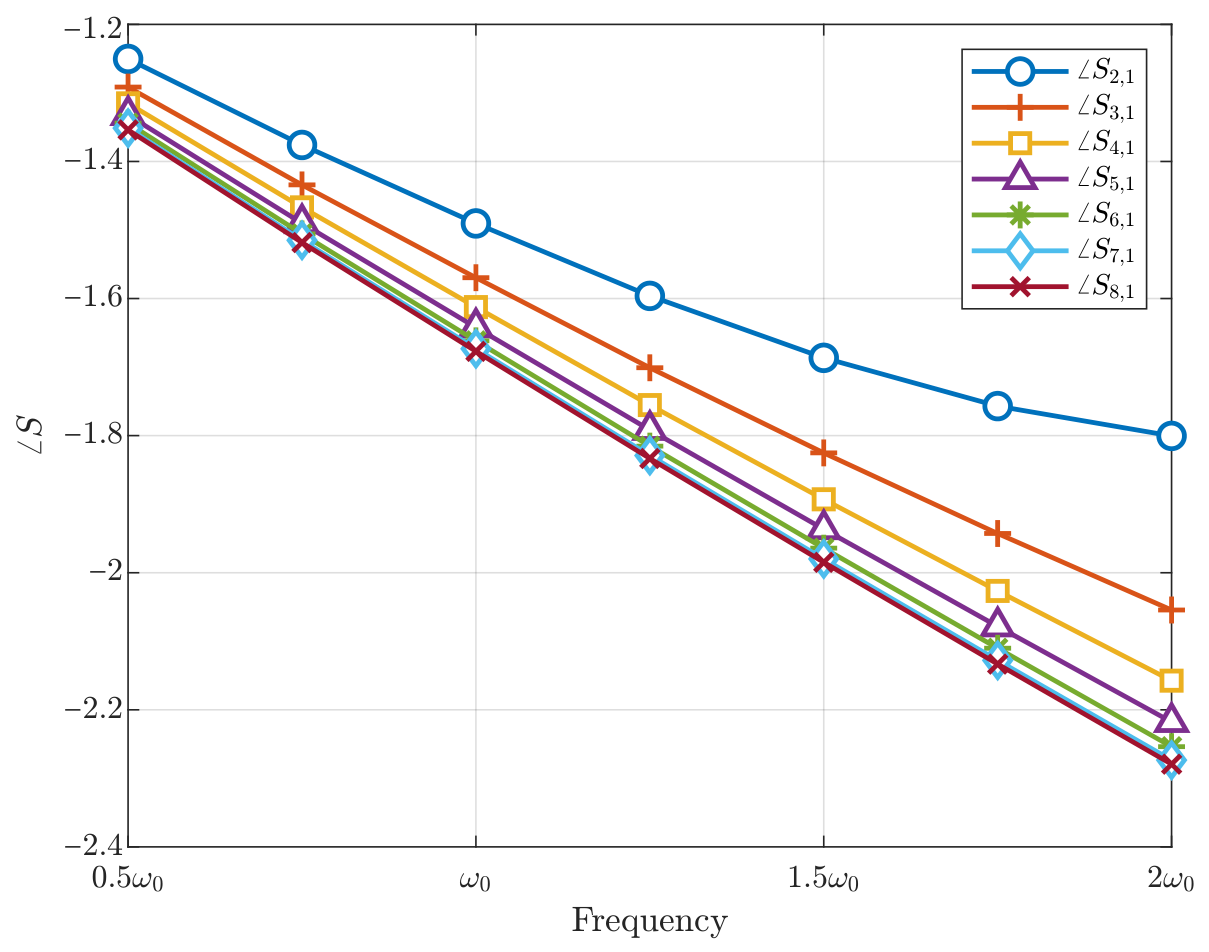
The magnitudes of the scattering matrix elements S 2 , 1 to S 8 , 1 are shown in Figure 10. The magnitudes of all the scattering matrix elements near the frequency ω 0 maintain a similar value of approximately 0.1, and the strength of the effect is insensitive to the relative azimuthal position between any two cans. This result indicates that the thermoacoustic instability frequency is likely determined by the thermoacoustic properties of the individual cans rather than the upstream casing. The role of the casing is to act as a passive, yet effective, acoustic pathway that enables cross-talk. Figure 11 shows the phases of the elements S 2 , 1 to S 8 , 1 . The phases maintain a similar value of approximately −1.7 near frequencies ω 0 , which means they are also insensitive to the relative azimuthal position. The consistent magnitude and phase across different cans suggest that the casing acts as a central hub, mediating a uniform, in-phase interaction among all cans.
Overall, the scattering-matrix results indicate appreciable upstream acoustic cross-talk via the compressor combustion casing near ω 0 , with weak sensitivity to the relative azimuthal position. These coupling characteristics are used in Section 4 to parameterize the star-network oscillator model.

4. Star-Network Thermoacoustic Oscillator Model

4.1. Star-Network Thermoacoustic Oscillator Model Structure

Based on the numerical results of the acoustic characteristics of the compressor combustion casing, we propose a star-network thermoacoustic oscillator model to describe the upstream cross-talk effect on thermoacoustic instability.
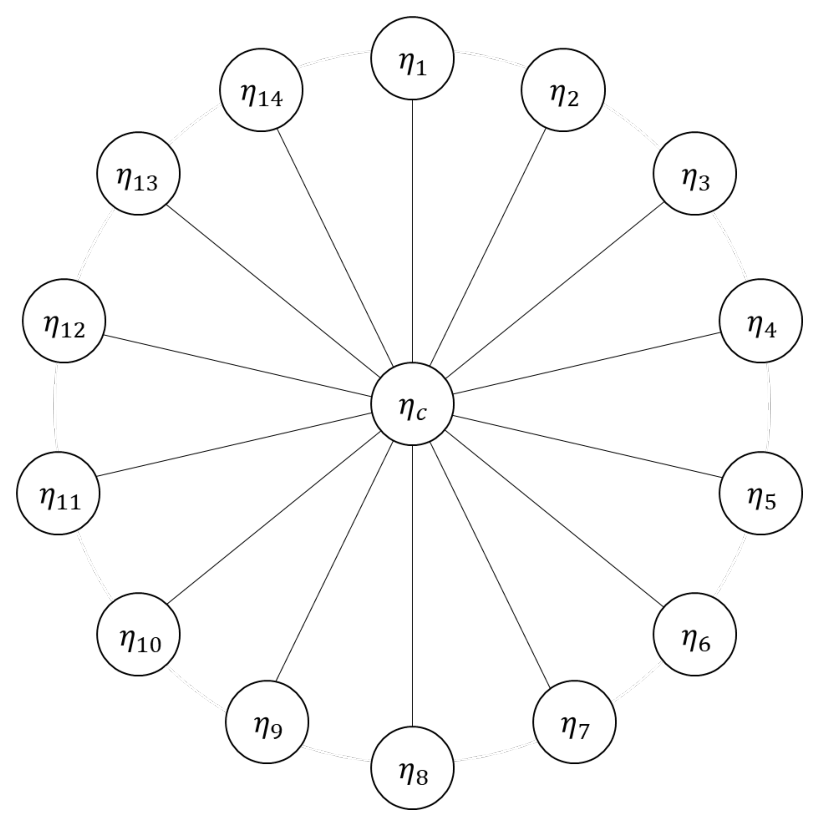
To model the thermoacoustic instability with the upstream cross-talk effect of the can-annular combustor, we employed a system of 15 coupled oscillators that consists of one central oscillator and 14 surrounding oscillators. A sketch of the star-network model is shown in Figure 12. Each surrounding oscillator is represented by a Van der Pol oscillator, which is a standard approach in thermoacoustics to capture limit-cycle characteristics [11,29,30]. Owing to the rotational symmetry of the can-annular combustor geometry, it is reasonably assumed that all 14 surrounding oscillators are identical, possessing the same natural frequency and positive growth rate parameters. The central oscillator represents the compressor combustion casing and is coupled to all 14 surrounding oscillators. It provides an effective low-order hub that captures the casing-mediated, low-frequency acoustic response around ω 0 as characterized by the scattering matrix in Section 3. The hub receives acoustic oscillations from all cans and, in turn, transmits them back. The interactions consist of dissipative and time-delay coupling terms, as in previous research [8,11].
Therefore, the equations of the star-network model are:
d 2 η c d t 2 ν c κ c η c 2 d η c d t + ω c 2 η c = k d i = 1 14 d η i d t d η c d t + k τ i = 1 14 d η i d t ( t τ ) d η c d t ( t τ ) ,
d 2 η i d t 2 ν i κ i η i 2 d η i d t + ω i 2 η i = k d d η c d t d η i d t + k τ d η c d t ( t τ ) d η i d t ( t τ ) ,
where η , ν , κ , and ω are the pressure oscillation, linear growth rate, nonlinear parameter, and natural frequency of the oscillator. The subscripts c and i denote the center and surrounding oscillators. k d denotes the interaction strength between two oscillators without time delay, and k τ denotes the interaction strength with time delay τ . This star-network model was solved in MATLAB® 2018 using the built-in solver dde23 with adaptive time stepping.

4.2. Model Validation

For validation purposes, the results obtained from the network model are compared with those from the experiments. The values of the parameters used for validation are shown in Table 3.
The parameters of the surrounding oscillators, including natural frequency ω i , linear growth rate ν i , and nonlinear saturation coefficient κ i , are identified from the normalized pressure signals in Section 2 using the first method in [30]. The parameters of the central oscillator are selected to represent the passive acoustic behavior of the casing. The linear growth rate ν c is set to a small negative value so that the central oscillator is linearly stable, consistent with the absence of an acoustic source in the casing. A small nonlinear coefficient κ c κ i is included as an amplitude-limiting regularization when the central node is driven by the surrounding oscillators. The role of the central oscillator is not to model detailed casing acoustic characteristics but to provide a representation consistent with the casing-mediated coupling strength and phase implied by S ( ω 0 ) . The coupling strengths k d , k τ , and the time delay τ are derived from the scatter matrix results in Section 3. The scattering matrix element quantifies the interaction between two cans through the compressor combustion casing. It encompasses a two-step process: the propagation from one can to the compressor combustion casing and the subsequent propagation from the compressor combustion casing to another can. To bridge the frequency-domain scattering data with the time-domain network model, we approximate the casing-mediated transfer function between one can and the casing near frequency ω 0 as a pure time delay process with a constant gain. Therefore, the effective one-step coupling gain k and time delay τ from S j , i ( ω 0 ) are defined as
k = S j , i ( ω 0 ) , τ = S j , i ( ω 0 ) 2 ω 0 .
Since | S j , i ( ω 0 ) | and S j , i ( ω 0 ) are nearly independent of the azimuthal position (Section 3), we use uniform coupling parameters obtained by averaging all the S j , i ( ω 0 ) .
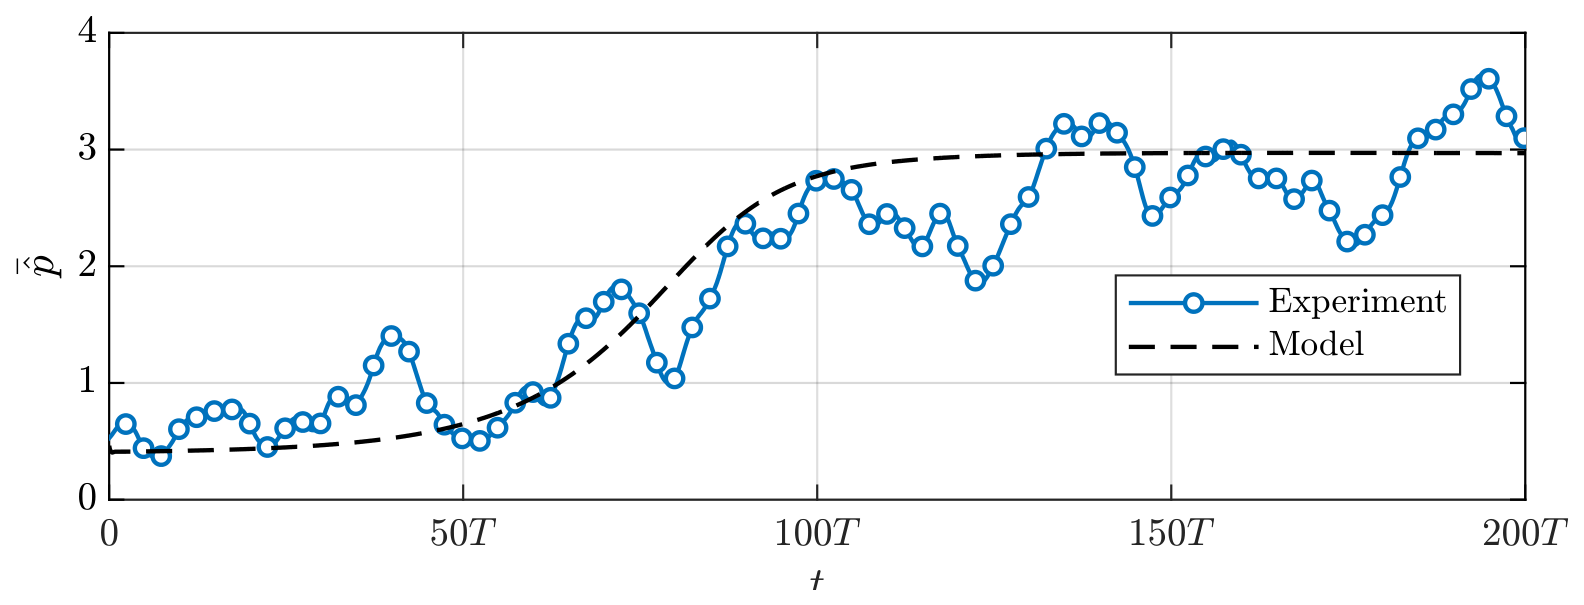
The model is solved starting with its initial conditions set to be consistent with the experimental data at t = 0 . Figure 13 compares the mean amplitude of pressure oscillation in 14 cans between the model and experimental results. The model predictions show good agreement with the experimental results. Although the pressure oscillation amplitude during the limit cycle state is less steady in the experiment due to the presence of inherent noise, the amplitude evolution during the onset of instability is consistent between the two. The slight fluctuations observed in the experimental amplitude during the limit-cycle state, which are absent in the star-network model, can be attributed to turbulence and stochastic noise within the cans. The coefficient of variation of the amplitude is not included in this comparison. This is because the coefficient of variation in the experiment is primarily attributed to slight non-uniformity among the cans. The model presumes that all cans have identical parameters for simplification, because the slight non-uniformity would not affect the synchronization phenomenon. In this case, the coefficient of variation in the model results is smaller than that in the experimental results.
Figure 14 compares the standard deviation of phase differences between model and experimental results. The temporal evolution of the standard deviation reflects the dynamics of the synchronization transient. It can be observed that the trend of the standard deviation from the model and the experiment is consistent. This indicates that the star-network model is capable of capturing the coupling mechanism through the compressor combustion casing. The observed discrepancies are due to stochastic noise and non-uniformity. At low oscillation amplitudes, noise dominates and leads to a large initial fluctuation of the standard deviation. In the final state, the experimental standard deviation does not perfectly reach zero due to the slight non-uniformity between the cans. It is observed that the model converges slightly slower than the experiment. This might be because our model’s coupling strength is slightly underestimated. The model focuses on the upstream cross-talk effect and does not account for complex flow effects or any potential downstream cross-talk effect, which could accelerate synchronization in the real gas turbine. Nevertheless, the model successfully captures the primary features of the synchronization, confirming the dominant role of the upstream coupling mechanism.

4.3. Effect of Coupling Parameters on the Synchronization Phenomenon

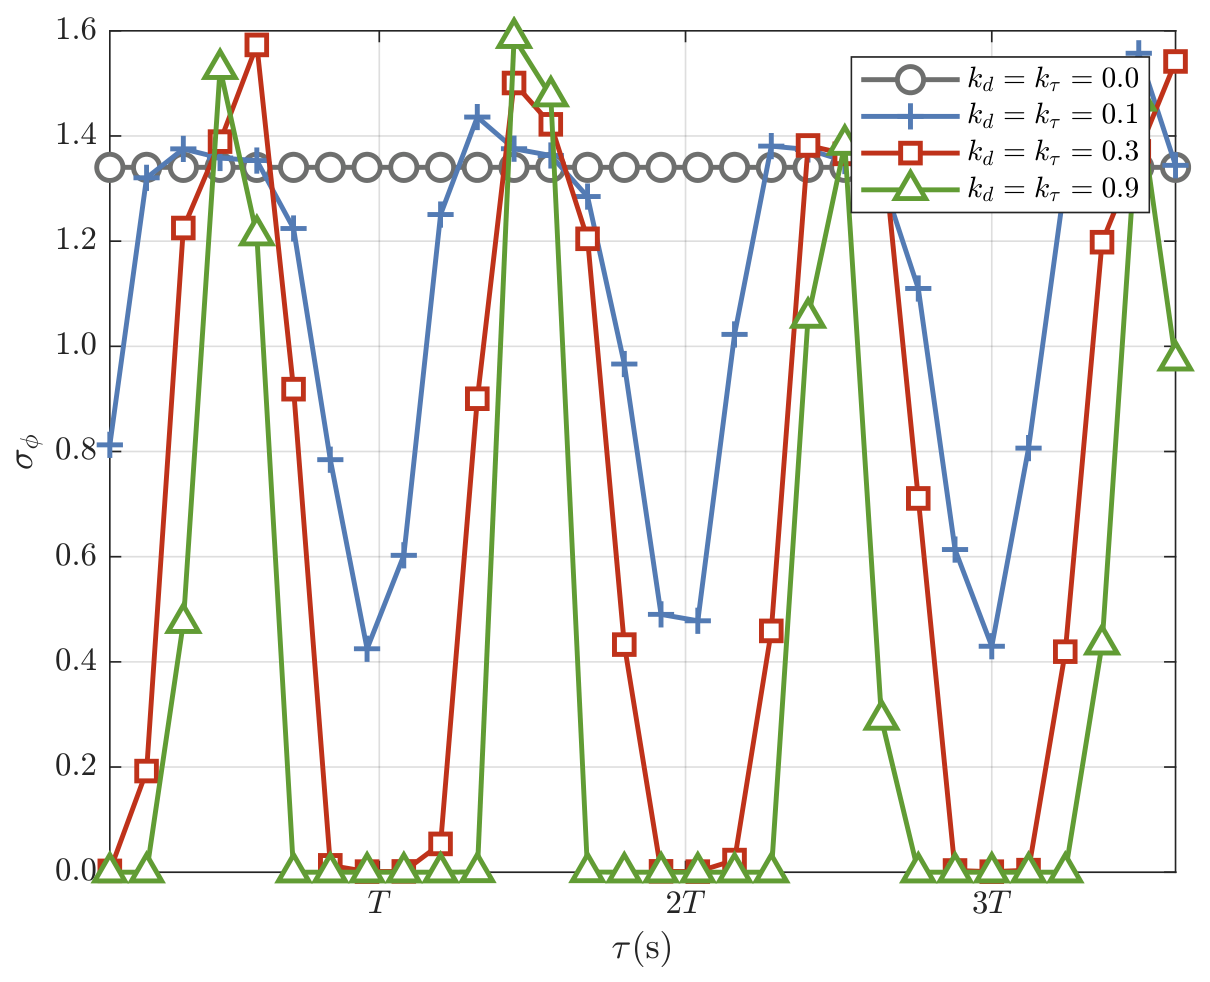
Based on the validated model, the influence of coupling parameters on the synchronization phenomenon is studied by systematically varying the coupling strength and time delay. The standard deviation of the phase differences defined in Equation 6 is used to quantify the degree of synchronization. Figure 15 shows the effect of k d , k τ and τ on the synchronization phenomenon. Following the earlier assumption, the study maintains equal values for the two coupling strengths ( k d = k τ ). The gray line represents the baseline case without the cross-talk effect, for which the standard deviation remains constant. In this uncoupled state, each can oscillates independently, and their phase differences depend on the initial values. When the cross-talk effect is introduced, the standard deviation of the phase differences varies periodically with the time delay. This indicates that the synchronization phenomenon is sensitive to the time delay. In-phase synchronization is only achieved within a specific window of τ . The period of the standard deviation is around that of the pressure oscillation. Furthermore, as the coupling strength increases, the range of time delays over which in-phase synchronization occurs expands. For k d = k τ = 0.1 , the standard deviation oscillates between approximately 0.4 and 1.4, never reaching zero. This indicates that while the upstream cross-talk effect is introduced, the coupling strengths are insufficient to achieve complete in-phase synchronization, leaving residual phase dispersion even at optimal time delay values. For k d = k τ = 0.3 , in-phase synchronization emerges. The standard deviation periodically drops to near-zero values. Meanwhile, the maximum is larger than the baseline, which suggests that the upstream cross-talk can generate larger phase dispersion than independent oscillations when the time delay is unfavorable. For k d = k τ = 0.9 , the range of time delays for in-phase synchronization further expands. Nonetheless, for certain time delay parameters, in-phase synchronization cannot be achieved.
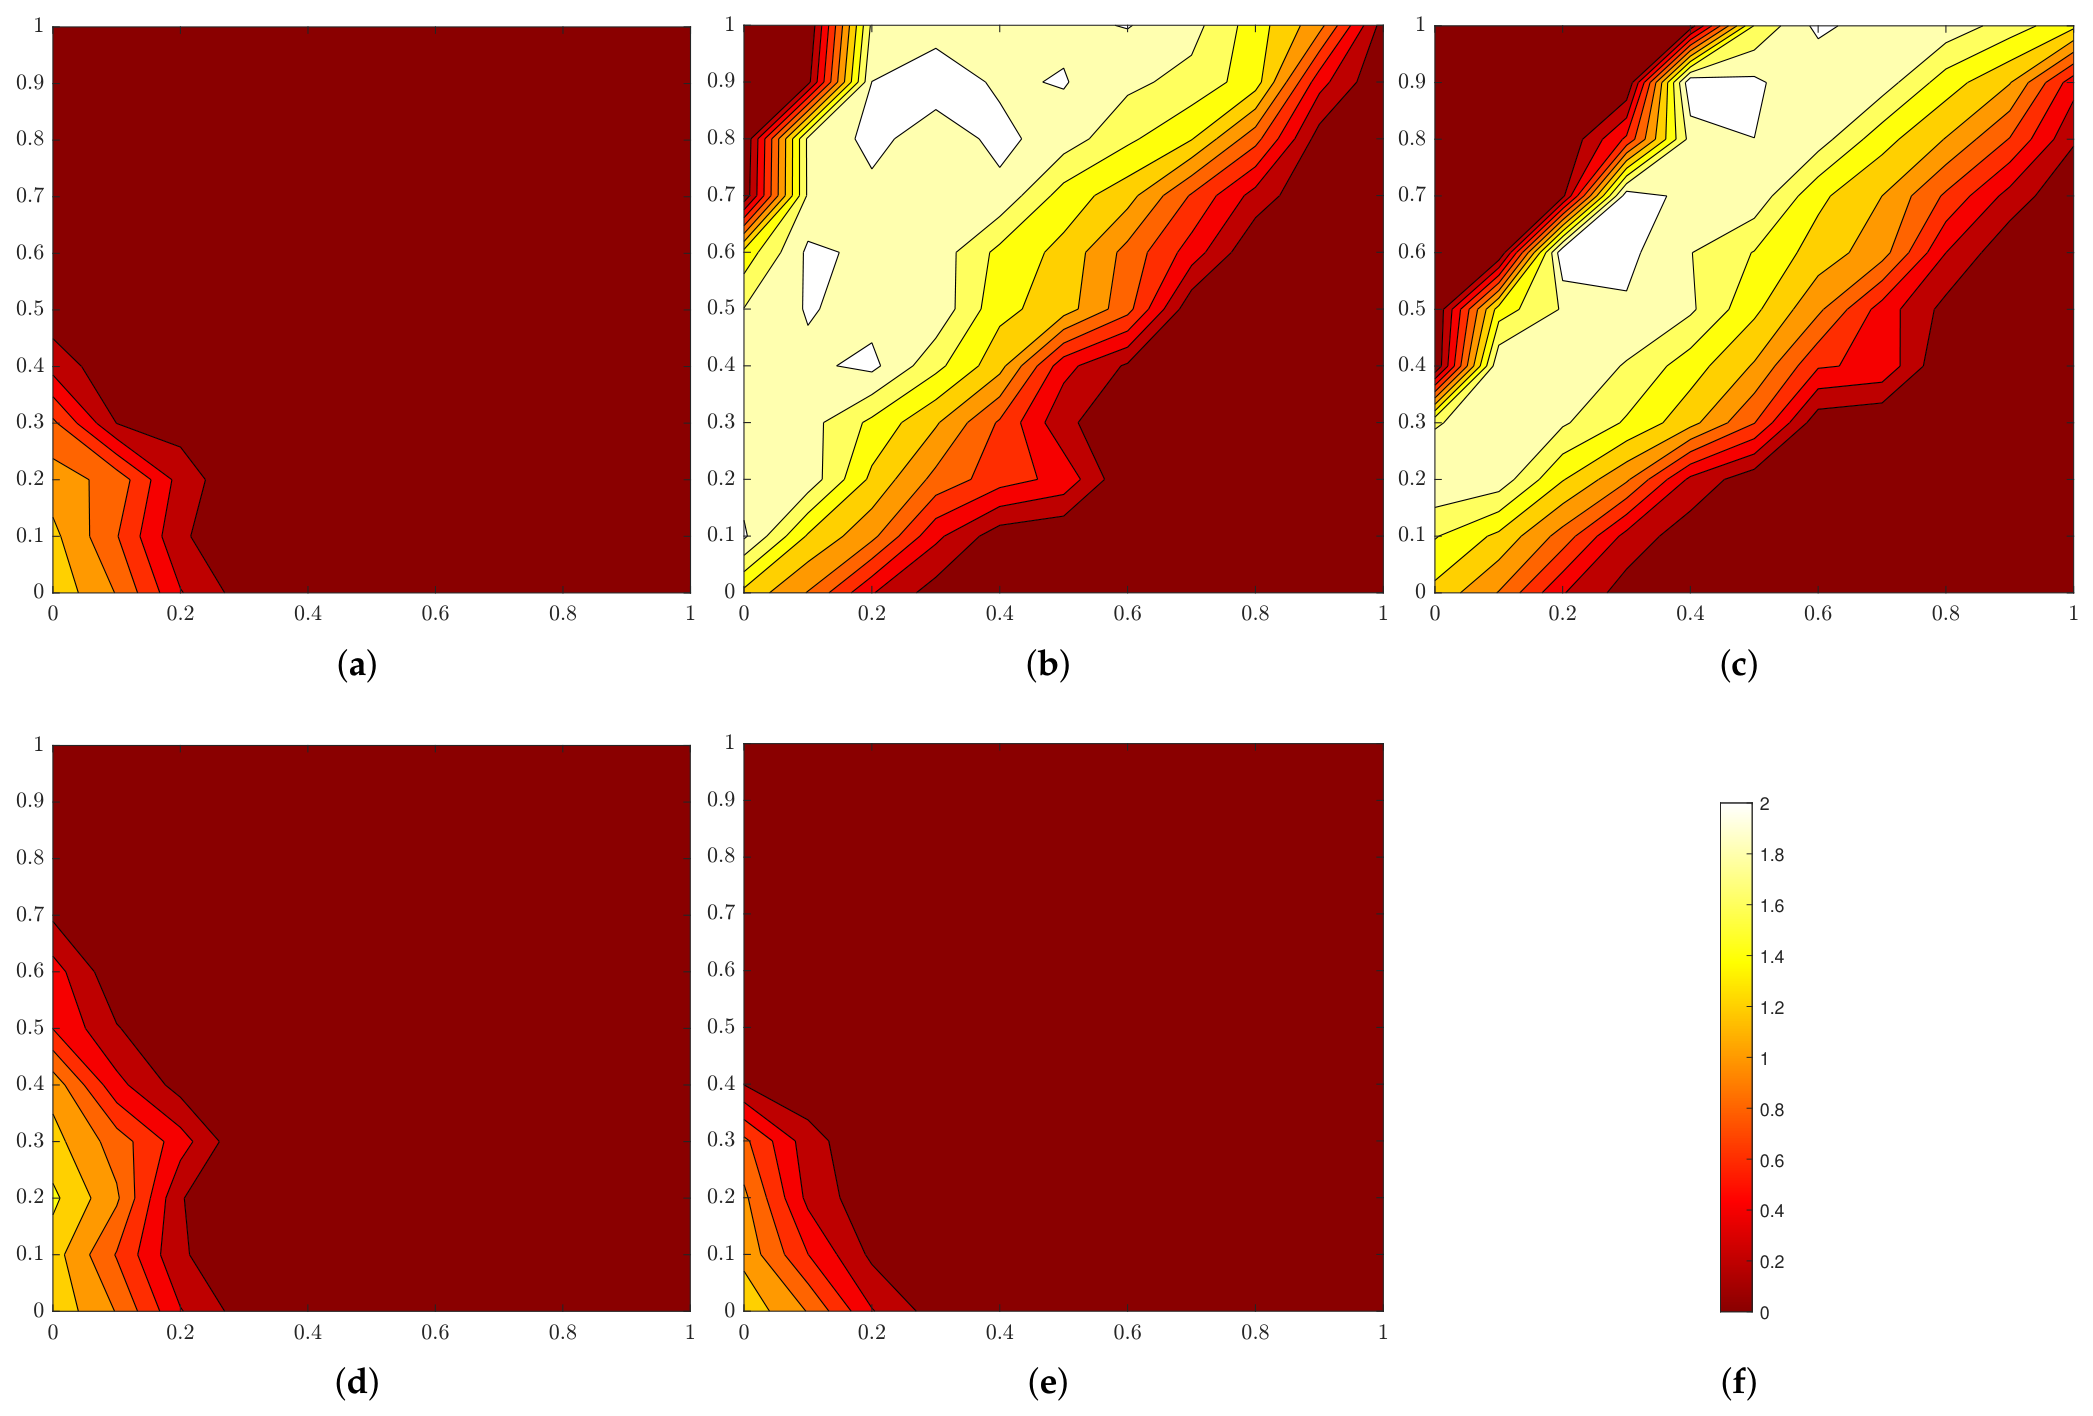
Figure 16 shows how the synchronization landscape evolves with the time delay. It can be seen that increasing either of the coupling strengths generally promotes in-phase synchronization. However, the influence of the coupling strengths is strongly modulated by the time delay, leading to two distinct patterns. In the first pattern, observed at τ = 0.1 T , τ = 0.85 T and τ = 1.1 T , the non-synchronized region is confined to the bottom-left corner where both k d and k τ are smaller than 0.2 . This indicates that for these time delays, two coupling terms work constructively to achieve in-phase synchronization.
The second pattern is observed at τ = 0.35 T and τ = 0.6 T . A prominent diagonal band of asynchronous behavior appears where k d and k τ are comparable in magnitude. This behavior indicates a regime of destructive interference between two coupling strengths. When the two coupling strengths are comparable, their combined effect fails to lock the oscillators. Synchronization is only achieved when one coupling mechanism significantly dominates the other.

5. Conclusions

This study investigated the synchronization of low-frequency thermoacoustic oscillations in a 14-can annular combustor, driven by upstream cross-talk via the compressor combustion casing. A combined experimental, numerical, and modeling approach was employed to clarify the underlying physical mechanisms. Engine test data first provided direct evidence of a global thermoacoustic instability, characterized by a transition from independent pressure dynamics to a state of high-amplitude, in-phase synchronized oscillation across the system. Analyses of instantaneous amplitude and phase confirmed this collective behavior, pointing to a strong upstream cross-talk effect. To quantify the upstream cross-talk effect, the acoustic characteristics of the compressor combustion casing were investigated. RANS simulations provided the mean-flow field, upon which a frequency-domain Helmholtz Equations solver was used to compute the acoustic scattering matrix. The results indicated that the cross-talk strength is insensitive to the relative azimuthal position of the cans. The compressor combustion casing acts as a central acoustic hub, mediating uniform, in-phase interaction among all cans. Based on this physical insight, a star-network thermoacoustic oscillator model was proposed, consisting of 14 surrounding Van der Pol oscillators representing the cans and one central oscillator for the compressor combustion casing. The model’s parameters, including coupling strength ( k d , k τ ) and time delay ( τ ), were derived from the experimental data and the computed scattering matrix. The model successfully reproduced the temporal evolution of the mean pressure oscillation amplitude and the standard deviation of phase differences observed in the experiment. This strong agreement validated that the star-network model is capable of capturing the coupling mechanism through the compressor combustion casing. Using the validated model, the influence of coupling parameters on the synchronization phenomenon was further studied by systematically varying the coupling strengths and time delays. The results showed that when the cross-talk effect is introduced, the standard deviation of phase differences is modulated by the time delay, leading to periodic windows where in-phase synchronization is observed. As the coupling strength increases, the range of time delays over which in-phase synchronization is obtained expands.
In conclusion, this work demonstrates that upstream cross-talk via the compressor combustion casing is a critical mechanism for inducing in-phase thermoacoustic synchronization in can-annular combustors. The validated star-network model provides an effective tool for understanding and predicting these collective dynamics. Future work will aim to incorporate the effects of downstream coupling and investigate the sensitivity of this synchronization phenomenon to different combustor geometries and operating conditions. Furthermore, exploring the competition and interplay between upstream and downstream cross-talk effects could reveal even richer collective dynamics.

Author Contributions

Conceptualization, Y.W., Y.Q., J.W. and X.L.; methodology, Y.W., G.S. (Guojun Sun), Z.L. and G.S. (Guogang Shu); software, Y.W., G.S. (Guojun Sun), Z.L. and Y.Q.; validation, Y.W. and G.S. (Guojun Sun); formal analysis, Y.W. and J.G.; investigation, Y.W., G.S. (Guojun Sun), Z.L. and G.S. (Guogang Shu); resources, X.L.; data curation, Y.W. and J.G.; writing—original draft preparation, Y.W., G.S. (Guojun Sun) and Z.L.; writing—review and editing, Y.W., Y.Q., J.G., J.W., G.S. (Guogang Shu) and X.L.; visualization, Y.W., G.S. (Guojun Sun) and Z.L.; supervision, X.L.; project administration, X.L.; funding acquisition, X.L. All authors have read and agreed to the published version of the manuscript.

Funding

This research received no external funding.

Data Availability Statement

Data will be made available on request.

Acknowledgments

During the preparation of this manuscript, the authors used Google’s Gemini 2.5 Pro model for the purposes of language polishing and readability improvement. The authors have reviewed and edited the output and take full responsibility for the content of this publication.

Conflicts of Interest

The authors declare the following financial interest/personal relationships which may be considered as potential competing interest: All authors are employees of State Power Investment Corporation Limited and China United Gas Turbine Technology Co., Ltd. This research was funded by the company. The authors declare that they have no other known competing financial interest or personal relationships that could have appeared to influence the work reported in this paper.

References

  1. Ghirardo, G.; Di Giovine, C.; Moeck, J.P.; Bothien, M.R. Thermoacoustics of Can-Annular Combustors. J. Eng. Gas Turbines Power 2018, 141, 011007. [Google Scholar] [CrossRef]
  2. Hajiloo, A.; Narra, V.; Krumenacker, E.; Karim, H.; Shunn, L.; Bose, S.; Ham, F. Application of Large Eddy Simulation for HA_Class Combustion System Design to Mitigate Combustion Instabilities (Frequency, and Amplitude). In Proceedings of the ASME Turbo Expo 2021: Turbomachinery Technical Conference and Exposition; ASME: New York, NY, USA, 2021; Volume 3B: Combustion, Fuels, and Emissions. [Google Scholar] [CrossRef]
  3. Haeringer, M.; Polifke, W. Time-Domain Bloch Boundary Conditions for Efficient Simulation of Thermoacoustic Limit Cycles in (Can-)Annular Combustors. J. Eng. Gas Turbines Power 2019, 141, 121005. [Google Scholar] [CrossRef]
  4. Bauerheim, M.; Parmentier, J.F.; Salas, P.; Nicoud, F.; Poinsot, T. An analytical model for azimuthal thermoacoustic modes in an annular chamber fed by an annular plenum. Combust. Flame 2014, 161, 1374–1389. [Google Scholar] [CrossRef]
  5. Yang, D.; Laera, D.; Morgans, A.S. A systematic study of nonlinear coupling of thermoacoustic modes in annular combustors. J. Sound Vib. 2019, 456, 137–161. [Google Scholar] [CrossRef]
  6. Wolf, P.; Staffelbach, G.; Gicquel, L.Y.; Müller, J.D.; Poinsot, T. Acoustic and Large Eddy Simulation studies of azimuthal modes in annular combustion chambers. Combust. Flame 2012, 159, 3398–3413. [Google Scholar] [CrossRef]
  7. Pérez Arroyo, C.; Dombard, J.; Duchaine, F.; Gicquel, L.; Martin, B.; Odier, N.; Staffelbach, G. Towards the Large-Eddy Simulation of a full engine: Integration of a 360 azimuthal degrees fan, compressor and combustion chamber. Part II: Comparison against stand-alone simulations. J. Glob. Power Propuls. Soc. 2021, 1–16. [Google Scholar] [CrossRef]
  8. Guan, Y.; Moon, K.; Kim, K.T.; Li, L.K.B. Low-order modeling of the mutual synchronization between two turbulent thermoacoustic oscillators. Phys. Rev. E 2021, 104, 24216. [Google Scholar] [CrossRef]
  9. Guan, Y.; Moon, K.; Kim, K.T.; Li, L.K. Synchronization and chimeras in a network of four ring-coupled thermoacoustic oscillators. J. Fluid Mech. 2022, 938, A5. [Google Scholar] [CrossRef]
  10. Pedergnana, T.; Noiray, N. Coupling-induced instability in a ring of thermoacoustic oscillators. Proc. R. Soc. A Math. Phys. Eng. Sci. 2022, 478, 20210851. [Google Scholar] [CrossRef]
  11. Liao, Y.; Guan, Y.; Liu, P.; Moon, K.; Kim, K.T. Low-order modeling of collective dynamics of four ring-coupled turbulent thermoacoustic oscillators. Nonlinear Dyn. 2024, 112, 6897–6917. [Google Scholar] [CrossRef]
  12. Moon, K.; Jegal, H.; Gu, J.; Kim, K.T. Combustion-acoustic interactions through cross-talk area between adjacent model gas turbine combustors. Combust. Flame 2019, 202, 405–416. [Google Scholar] [CrossRef]
  13. Farisco, F.; Panek, L.; Kok, J.B. Thermo-acoustic cross-talk between cans in a can-annular combustor. Int. J. Spray Combust. Dyn. 2017, 9, 452–469. [Google Scholar] [CrossRef]
  14. Vorgias, E.A.J.; Orchini, A. Experimental investigation of thermoacoustic mode synchronization in can-annular combustors using an electro-acoustic system. Int. J. Spray Combust. Dyn. 2025, 17, 63–73. [Google Scholar] [CrossRef]
  15. Orchini, A.; Pedergnana, T.; Buschmann, P.E.; Moeck, J.P.; Noiray, N. Reduced-order modelling of thermoacoustic instabilities in can-annular combustors. J. Sound Vib. 2022, 526, 116808. [Google Scholar] [CrossRef]
  16. Humbert, S.C.; Orchini, A. Acoustics of can-annular combustors: Experimental characterisation and modelling of a lab-scale multi-can setup with adjustable geometry. J. Sound Vib. 2023, 564, 117864. [Google Scholar] [CrossRef]
  17. Wang, Y.; Yang, D.; Zhu, M. A network model for can-annular combustors using a multidimensional transfer matrix based on the mode matching method. J. Sound Vib. 2024, 588, 118521. [Google Scholar] [CrossRef]
  18. Biwa, T.; Tozuka, S.; Yazaki, T. Amplitude Death in Coupled Thermoacoustic Oscillators. Phys. Rev. Appl. 2015, 3, 034006. [Google Scholar] [CrossRef]
  19. Thomas, N.; Mondal, S.; Pawar, S.A.; Sujith, R.I. Effect of time-delay and dissipative coupling on amplitude death in coupled thermoacoustic oscillators. Chaos Interdiscip. J. Nonlinear Sci. 2018, 28, 033119. [Google Scholar] [CrossRef]
  20. Zheng, L.; Liao, Y.; Kim, K.T.; Zhou, J.; Guan, Y. Amplitude death in ring-coupled network with asymmetric thermoacoustic oscillators and nonlocal time-delay interactions. Nonlinear Dyn. 2025, 113, 6141–6156. [Google Scholar] [CrossRef]
  21. Hubbard, S.; Dowling, A.P. Acoustic Resonances of an Industrial Gas Turbine Combustion System. J. Eng. Gas Turbines Power 2000, 123, 766–773. [Google Scholar] [CrossRef]
  22. Oh, J.; Kim, M.; Yoon, Y. The tuning methodology of a GE 7FA + e DLN-2.6 gas turbine combustor. Appl. Therm. Eng. 2012, 36, 14–20. [Google Scholar] [CrossRef]
  23. Haeringer, M.; Polifke, W. Hybrid CFD/low-order modeling of thermoacoustic limit cycle oscillations in can-annular configurations. Int. J. Spray Combust. Dyn. 2022, 14, 143–152. [Google Scholar] [CrossRef]
  24. Yoon, M. Thermoacoustics of multi-burner combustors with plenum and chamber cross-talk. J. Sound Vib. 2022, 520, 116623. [Google Scholar] [CrossRef]
  25. Dhanuka, S.K.; Temme, J.E.; Driscoll, J.F. Lean-limit combustion instabilities of a lean premixed prevaporized gas turbine combustor. Proc. Combust. Inst. 2011, 33, 2961–2966. [Google Scholar] [CrossRef]
  26. Tyler, J.M.; Sofrin, T.G. Axial Flow Compressor Noise Studies. In Proceedings of the Pre-1964 SAE Technical Papers; SAE International: Warrendale, PA, USA, 1962. [Google Scholar] [CrossRef]
  27. Venkataraman, K.; Lewis, S.E.; Natarajan, J.; Thomas, S.R.; Citeno, J.V. F-Class DLN Technology Advancements: DLN2.6+. In Proceedings of the ASME 2011 Turbo Expo: Turbine Technical Conference and Exposition; ASME: New York, NY, USA, 2011; Volume 3: Controls, Diagnostics and Instrumentation; Education; Electric Power; Microturbines and Small Turbomachinery; Solar Brayton and Rankine Cycle; pp. 587–594. [Google Scholar] [CrossRef]
  28. Silva, C.F.; Durán, I.; Nicoud, F.; Moreau, S. Boundary Conditions for the Computation of Thermoacoustic Modes in Combustion Chambers. AIAA J. 2014, 52, 1180–1193. [Google Scholar] [CrossRef]
  29. Noiray, N.; Schuermans, B. Deterministic quantities characterizing noise driven Hopf bifurcations in gas turbine combustors. Int. J.-Non-Linear Mech. 2013, 50, 152–163. [Google Scholar] [CrossRef]
  30. Noiray, N. Linear Growth Rate Estimation From Dynamics and Statistics of Acoustic Signal Envelope in Turbulent Combustors. J. Eng. Gas Turbines Power 2016, 139, 041503. [Google Scholar] [CrossRef]
Figure 1. Schematic cross-section of the can-annular combustor system, including cans and compressor combustion casing (comp-comb casing).
Energies 19 02552 g001
Figure 2. Normalized dynamic pressure signals p ˜ in cans 1, 4, 7, 10 and 13, showing the onset and evolution of thermoacoustic instability. T denotes the period of the oscillation. (a) Normalized dynamic pressure signals over the transition from steady state to limit cycle state. (b) Dynamic pressure signals over five oscillation periods before the onset of thermoacoustic instability. (c) Dynamic pressure signals over five oscillation periods in the limit cycle state.
Energies 19 02552 g002
Figure 3. Cross-Correlation analysis of combustor can pressures. The shaded region shows the envelope of all 13 cross-correlations against the Can 1, and the red line is their mean.
Energies 19 02552 g003
Figure 4. Temporal evolution of the mean amplitude ( p ^ ¯ ) and the coefficient of variation ( c v p ) of pressure oscillations in the 14 cans.
Energies 19 02552 g004
Figure 5. Temporal evolution of the mean ( Δ ϕ ¯ ) and standard deviation ( σ ϕ ) of the relative phase differences. Both approach zero as the system reaches a state of in-phase synchronization.
Energies 19 02552 g005
Figure 6. Pressure spectrum from a single-can experiment, showing a characteristic instability mode near ω 0 .
Energies 19 02552 g006
Figure 7. Comparison of the amplitudes of the low-frequency pressure oscillations for two different fuel staging parameter settings at the same load.
Energies 19 02552 g007
Figure 8. Polyhedral mesh used for the RANS simulation of the compressor combustion casing, with local refinement near the combustor inlets.
Energies 19 02552 g008
Figure 9. Mean-flow field in the compressor combustion casing from the RANS simulation, showing static pressure (left) and velocity magnitude (right) distributions on a cross-sectional plane. P outlet is the static pressure of outlets.
Energies 19 02552 g009
Figure 10. Magnitude of the scattering matrix elements ( | S j , 1 | ) as a function of frequency.
Energies 19 02552 g010
Figure 11. Phase of scattering matrix elements ( S j , 1 ) as a function of frequency. The phases are nearly identical at the frequency ω 0 .
Energies 19 02552 g011
Figure 12. Sketch of Van der Pol oscillator star-network model.
Energies 19 02552 g012
Figure 13. Comparison of the mean pressure oscillation amplitude between the star-network model prediction and the experimental data. The model accurately captures the growth and saturation of the instability.
Energies 19 02552 g013
Figure 14. Comparison of the standard deviation of phase differences ( σ ϕ ) between the star-network model and experimental results. The consistent trend validates the model’s ability to capture the synchronization transient.
Energies 19 02552 g014
Figure 15. Effect of coupling strengths ( k d = k τ ) and time delay ( τ ) on the synchronization phenomenon, quantified by the standard deviation of phase differences ( σ ϕ ) at the limit cycle state. In-phase synchronization occurs in periodic windows of time delay, and the synchronization range expands with increasing coupling strengths.
Energies 19 02552 g015
Figure 16. Effect of coupling strengths ( k d , k τ ) and time delay ( τ ) on the synchronization phenomenon. The contour plots show the standard deviation of phase differences ( σ ϕ ) at the limit cycle state. Each subplot corresponds to a different fixed time delay: (a) τ = 0.1 T , (b) τ = 0.35 T , (c) τ = 0.6 T , (d) τ = 0.85 T , (e) τ = 1.1 T . (f) Colorbar.
Energies 19 02552 g016
Table 1. Mesh Setup for RANS simulation.
ParametersValues
Total grid count 10 8
Global basic size8.0 mm
Local refinement Size4.0 mm
Number of boundary layers4
First Layer thichness2.4 mm
Stretching ratio of boudary layers1.5
Table 2. Grid independence study.
Number of CellsNormalized PressureRelative Change
2 × 10 7 0.852 P exp -
6 × 10 7 0.939 P exp +10.2%
1 × 10 8 0.965 P exp +2.7%
1.3 × 10 8 0.982 P exp +1.8%
Table 3. Parameters for validation of the star-network model.
ComponentParameterSymbolValue
Surrounding oscillatorsLinear growth rate ν i 2.07
Nonlinear saturation parameter κ i 1.2
natural frequency ω i ω 0
Central oscillatorLinear growth rate ν c −0.1
Nonlinear saturation parameter κ c 0.1
natural frequency ω c ω 0
Coupling parameterDirect coupling strength k d 0.32
Delayed coupling strength k τ 0.32
Time delay (s) τ 0.012
Disclaimer/Publisher’s Note: The statements, opinions and data contained in all publications are solely those of the individual author(s) and contributor(s) and not of MDPI and/or the editor(s). MDPI and/or the editor(s) disclaim responsibility for any injury to people or property resulting from any ideas, methods, instructions or products referred to in the content.