Article

Cold CO2 Injection into Depleted Gas Reservoirs: Implications for Capacity, Injectivity and Containment


1
Institute of Drilling Engineering and Fluid Mining, TU Bergakademie Freiberg, Agricolastraße 22, 09599 Freiberg, Germany
2
Norwegian Research Centre NORCE AS, Nygårdsgaten 112, 5008 Bergen, Norway
*
Authors to whom correspondence should be addressed.
Energies 2026, 19(11), 2548; https://doi.org/10.3390/en19112548 (registering DOI)
Submission received: 23 April 2026 / Revised: 19 May 2026 / Accepted: 20 May 2026 / Published: 25 May 2026
(This article belongs to the Special Issue Advances in Carbon Capture, Utilization & Storage (CCUS))

Abstract

Depleted hydrocarbon reservoirs (DHRs), particularly depleted gas reservoirs (DGRs), are increasingly regarded as promising candidates for geologic carbon storage (GCS). However, their low abandonment pressure poses significant thermo-hydraulic challenges during the injection of cold, high-pressure CO2. In such non-isothermal conditions, complex processes may occur, including Joule–Thomson (J-T) cooling, hydrate formation, salt precipitation, and thermal fracturing, all of which may affect storage performance. This study presents an integrated assessment of the impact of CO2 injection into DGRs on the three key pillars of GCS: capacity, injectivity, and containment. The analysis integrates laboratory experiments conducted at our institute, simplified analytics and numerical simulations to assess the governing physical mechanisms. The findings indicate that the cold CO2 injection can enhance effective storage capacity during the injection phase. This is attributed to the increase in fluid density and the delay in pressure buildup. However, the post-injection thermal equilibrium may result in pressure rebound. The CO2 injectivity has been demonstrated to be significantly impacted by the near-wellbore thermal effects. While thermo-induced fracturing may enhance injectivity, it poses potential risks to wellbore and caprock integrity. The process of hydrate formation depends on the local temperature and petrophysical conditions, with dynamic factors further reducing the likelihood of pore plugging. Salt precipitation has been found to be less critical under typical DGR conditions with low initial water saturation, although having the potential to become significant in the presence of water influx and/or cyclic injection. The findings provide a technical basis for enhancing the engineering design, accelerating the certification process, and ensuring the safe operation of future GCS projects in DGRs.

1. Introduction

Globally, depleted hydrocarbon reservoirs (DHRs) have been identified as having significant potential for carbon dioxide (CO2) storage, with estimated storage capacity ranging from 675 to 900 Gt. These reservoirs possess unique geological and engineering features that render them particularly well-suited to geologic carbon storage (GCS), including proven containment structures, existing facilities and substantial storage capacity [1,2,3,4].
The suitability of DHRs for CO2 storage is primarily supported by their demonstrated ability to retain hydrocarbons over geological timescales, providing confidence in long-term containment [3,4,5]. In other words, the caprock sealing performance has already been tested by nature, reducing uncertainty about long-term storage security. Secondly, the reuse of existing infrastructure (e.g., wells, pipelines and surface facilities) can significantly reduce development costs [6]. Thirdly, the availability of extensive high-quality data from hydrocarbon production provides detailed knowledge of reservoir characteristics (porosity, permeability, structure) that is typically unavailable for saline aquifers (SAs). Fourthly, DHRs may exhibit a lower risk of injection-induced seismicity, as pore pressure must first be restored to its original level before fracture thresholds are exceeded [7]. Additionally, enhancing oil recovery using miscible and/or immiscible CO2 or enhanced gas recovery techniques through CO2 injection could generate revenues to offset the storage costs [4,8]. Carbon dioxide-enhanced oil recovery (CO2-EOR) operations are a notable example of such applications, primarily in the United States [9]. It is widely accepted that, in the context of CO2 sequestration, the utilization of DHRs is more advantageous than that of SAs, provided that sufficient capacity exists. Despite these advantages, significant technical challenges remain. While some challenges are common to all GCS systems, others are specific to DHRs, particularly DGRs, where reservoir pressures are substantially reduced due to prior production. Under such conditions, the injection of cold, high-pressure CO2 introduces strong thermodynamic contrasts between the injected fluid and the reservoir. This leads to non-isothermal behavior that can significantly affect near-wellbore processes and overall storage performance.
One of the key phenomena associated with cold CO2 injection is the Joule–Thomson (J-T) effect, which may further reduce the temperatures in the near-wellbore zone (NWZ) due to fluid expansion. The resulting thermal perturbations can trigger a range of coupled thermo-hydraulic and geomechanical processes, including hydrate formation, salt precipitation and thermally induced fracturing (thermo-hydraulic fracturing or cryofracturing). These processes directly impact injectivity and may compromise wellbore and caprock integrity, raising concerns regarding long-term containment. Furthermore, thermal effects influence CO2 density and mobility and therefore must be considered in storage capacity assessments.
This study investigates the technical challenges associated with non-isothermal CO2 injection in DHRs, with a particular focus on their implications for the three key pillars of GCS: capacity, injectivity, and containment (CIC). We also consider how these challenges can be analyzed and mitigated. The study primarily focuses on DGRs because the technical challenges are particularly pertinent in DGRs, where the depletion pressure is often much lower than in oil reservoirs. Another distinguishing feature of DGRs is that they offer standalone GCS opportunities, which differ from DORs, in which GCS is primarily driven by economic perspectives and forms part of a continuum of CO2-EOR operations. Another reason for focusing on DGRs is their greater potential for CO2 sequestration, given that the use of DORs for CO2-EOR is controversial due to the CO2 emissions associated with the additional oil produced (e.g., [10,11]).
The paper is structured as follows. The initial part of the study provides an overview of the challenges that could affect the short- and long-term sustainability of storage operations, and the most suitable methods for analyzing them. The subsequent stage of the study involves elaborating on the challenges that could reduce operational continuity, focusing particularly on CIC. A thorough investigation into each possible challenge is undertaken, encompassing a comprehensive evaluation of the associated risks and the exploration of potential mitigations. The methodology is primarily informed by the institute’s (TUBAF) laboratory and numerical analysis capabilities, particularly within the context of international projects such as RETURN and InjectWell [12,13], and is supported by the recent literature on the subject. In instances where numerical emphasis is deemed necessary, simplified yet validated numerical models are employed to quantify the relevance of the issues under discussion.
Overall, this work aims to provide a comprehensive framework for understanding and evaluating the coupled thermo-hydraulic challenges associated with cold CO2 injection into DGRs, supporting improved design, risk assessment, faster certification and safe implementation of future GCS operations.

2. GCS in DGRs: Opportunities and Challenges

Global estimates of CO2 storage capacity vary considerably across studies; however, there is a broad consensus that the storage capacity of SAs significantly exceeds that of DHRs, being approximately 10 times higher [14]. Nevertheless, GCS in DGRs is regarded as more effective and feasible in general. Alkan et al. (2021) revealed that, under comparable initial conditions, a unit pore volume (e.g., one m3) of SA has the capacity to store approximately 30 kg of CO2, whereas in a DGR, this amount can reach 800 kg [2]. Moreover, the probability of success (PoS) of potential deployments in DGRs is considerably higher than in SAs, particularly in view of the information available for DGRs.
Similar to GCS in SAs, CO2 is retained in DHRs via multiple mechanisms that operate at different timescales. Structural and stratigraphic trapping are dominant in DGRs, where CO2 accumulated beneath low-permeability caprock. This mechanism is generally supported by the residual/capillary trapping that occurs as CO2 becomes immobilized as disconnected droplets in pore spaces due to capillary forces. Residual (capillary) trapping may contribute where brine is present, immobilizing CO2 as disconnected ganglia in pore spaces. Dissolution trapping occurs when CO2 dissolves into formation water and oil in oil reservoirs; however, due to lower brine saturation, this mechanism is of lower relevance in DGRs. The process of mineral trapping is a mechanism that develops over long timescales. In this process, dissolved CO2 reacts with reservoir minerals to form stable carbonate minerals. This process has a lower impact on the total storage capacity of DGRs again due to the low initial brine saturation. In DGRs, studies show that the majority of injected CO2 remains mobile, with capillary and dissolution trapping playing minor roles as long as the brine saturation remains negligible (e.g., [5,15]). However, in the case of substantial water influx into the DGR due to declining reservoir pressure, it may be necessary to consider these as mechanisms that could contribute to storage capacity. A key advantage of DHRs for GCS lies in the availability of existing infrastructure in the field, particularly legacy wells. The rationale underpinning this phenomenon pertains to two interrelated factors: the economic aspect and the conceptualization of each well as a repository of information. It is evident that the wells constitute a significant proportion of the overall costs; therefore, the legacy wells represent a valuable opportunity for cost-effective operations. Nevertheless, this also constitutes a significant risk factor, as well as the primary potential leakage pathways for geologically stored CO2 and other fluids. It is crucial to acknowledge that the assessment of associated risks and their subsequent mitigation are well-defined tasks before the launch of the operation, as these are prerequisites for both technical and regulatory requirements. The utilization and potential remediation of the remaining legacy surface components, such as pumps and manifolds, are comparatively less significant and less costly to remediate, should there be a necessity to deploy them. The issue of pipelines merits discussion in a separate section dedicated to the transportation of CO2 streams.
Wells also play a central role in determining injectivity and flow behavior, as they control the delivery of CO2 into the reservoir and its distribution within the NWZ [16,17]. In DGRs, the thermodynamic conditions during injection differ significantly from those in SAs due to a large pressure and temperature contrast between the injected CO2 and the depleted reservoir [16]. These differences give rise to coupled thermo-hydraulic processes that can alter both petrophysical and geomechanical properties in the NWZ.
Consequently, understanding the thermodynamics of CO2 injection is essential for evaluating storage performance in DGRs. The interplay between pressure, temperature and fluid properties governs key processes such as cooling, phase behavior, and fluid–rock interactions, which ultimately control storage capacity, CO2 injectivity, and containment through caprock and wellbore integrity components in DGRs. An analysis of these aspects is conducted in the subsequent sections, commencing with a review of the thermodynamic framework.

3. Thermodynamics of CO2 Injection into DGRs

GCS operations are inherently non-isothermal due to the significant thermodynamic contrast between the injected CO2 stream and in situ reservoir conditions. At the wellhead, the CO2 transmitted from the logistics system is typically colder than reservoir temperatures (TCO2 < 30 °C) and in a dense phase (ρCO2 > 800 kg/m3). As the fluid travels down the wellbore, the temperature may rise due to heat exchange with the surrounding formations, while pressure increases due to hydrostatic effects. Consequently, CO2 reaches the bottomhole at much higher pressure, and potentially at a moderately elevated temperature compared to the wellhead conditions. The thermodynamic evolution of CO2 injection along the wellbore and within the NWZ depends mainly on the following factors:
-
Geothermal gradient;
-
Composition of the CO2 stream, including impurities;
-
Injection rate;
-
Well geometry (diameter, depth, configuration, perforation design);
-
Reservoir pressure and temperature;
-
Thermal and petrophysical properties of the reservoir (especially in the NWZ).
CO2 streams may contain impurities within the limits defined by standards and regulatory guidelines. Any impurities within these limits are not expected to significantly affect the thermodynamic properties of the CO2 stream. The spatial extent of the cooling zone is significantly influenced by the presence of impurities: SO2 promotes expansion, whereas O2, N2, and CH4 induce contraction; H2S exhibits a negligible effect on the spatial distribution of cooling [18]. As pressure losses in the wellbore and the J-T effect increase with flow rate, the injection rate is crucial in determining the resulting thermodynamic changes [19]. The well geometry is also important in determining variations in pressure and temperature during flow from the wellhead to the bottomhole. This encompasses well completion, i.e., the tubing, casing and cement used, as their respective parameters determine heat exchange with the surrounding formations, as well as the geothermal gradient. The effect of reservoir temperature and pressure on CO2 thermodynamics in the wellbore and NWZ also depends strongly on the reservoir’s thermal and petrophysical properties.
The characterization of flow from the wellhead to the bottomhole is a pivotal element in the design and operation of GCS projects. This is a particularly challenging aspect of CO2 injection into DGRs, given the critical importance of accurately estimating bottomhole conditions. As borehole measurements, especially in deeper wells, are not always straightforward, the numerical assessment of CO2 wellbore flow is a focal point of related studies. However, the validation and testing of such numerical tools is still in its early stages, particularly regarding transient modeling and coupling with reservoir models [20,21,22]. A detailed evaluation of modelling approaches is beyond the scope of this study.
The fundamental premise and assumption of this study is that the injected CO2 enters the reservoir at a temperature significantly lower than the reservoir and that this creates challenges for all key aspects of storage operations, namely capacity, injection capability and integrity. To emphasize this issue, it has been assumed that the CO2 temperature at the bottom of the well is approximately 10 °C at a pressure of 12 MPa. It is important to note that these conditions were selected conservatively to emphasize the effect of cold CO2 in the vicinity of the well and within the reservoir; they may reflect real-world conditions, particularly for deep injection wells into DGRs. Recent studies have demonstrated the importance of thermal effects on CO2 plume evolution in SAs using historical data. (e.g., [23]). However, a general observation indicates that field-scale benchmarking data for DGRs remains comparatively scarce, particularly with respect to detailed non-isothermal behavior in the near-wellbore region and coupled thermo-hydromechanical processes. DGRs are typically produced until substantially lower pressures are reached. For instance, the DGRs in the Southern North Sea (Netherlands), designated for use in the CCS projects Athos and Porthos, with reservoir temperatures ranging from 90 to 120 °C, are depleted to pressures ranging from 30 to 50 bar [5]. A paucity of reliable data exists regarding the measured thermodynamics of CO2 in the injection wellbore, encompassing the entire depth and the near-wellbore. Offshore operations can be regarded as the most conservative example of injecting cold CO2, where the CO2 temperature at the wellhead is equivalent to the deep-sea temperature (approximately 4 °C) with wellhead pressures slightly above atmospheric pressure. In our example we assume that CO2 is heated up in the wellbore due to the geothermal gradient, reaching 10 °C at the bottomhole, a temperature which is consistent with the prevailing field and limited wellbore modeling studies [24,25,26,27].
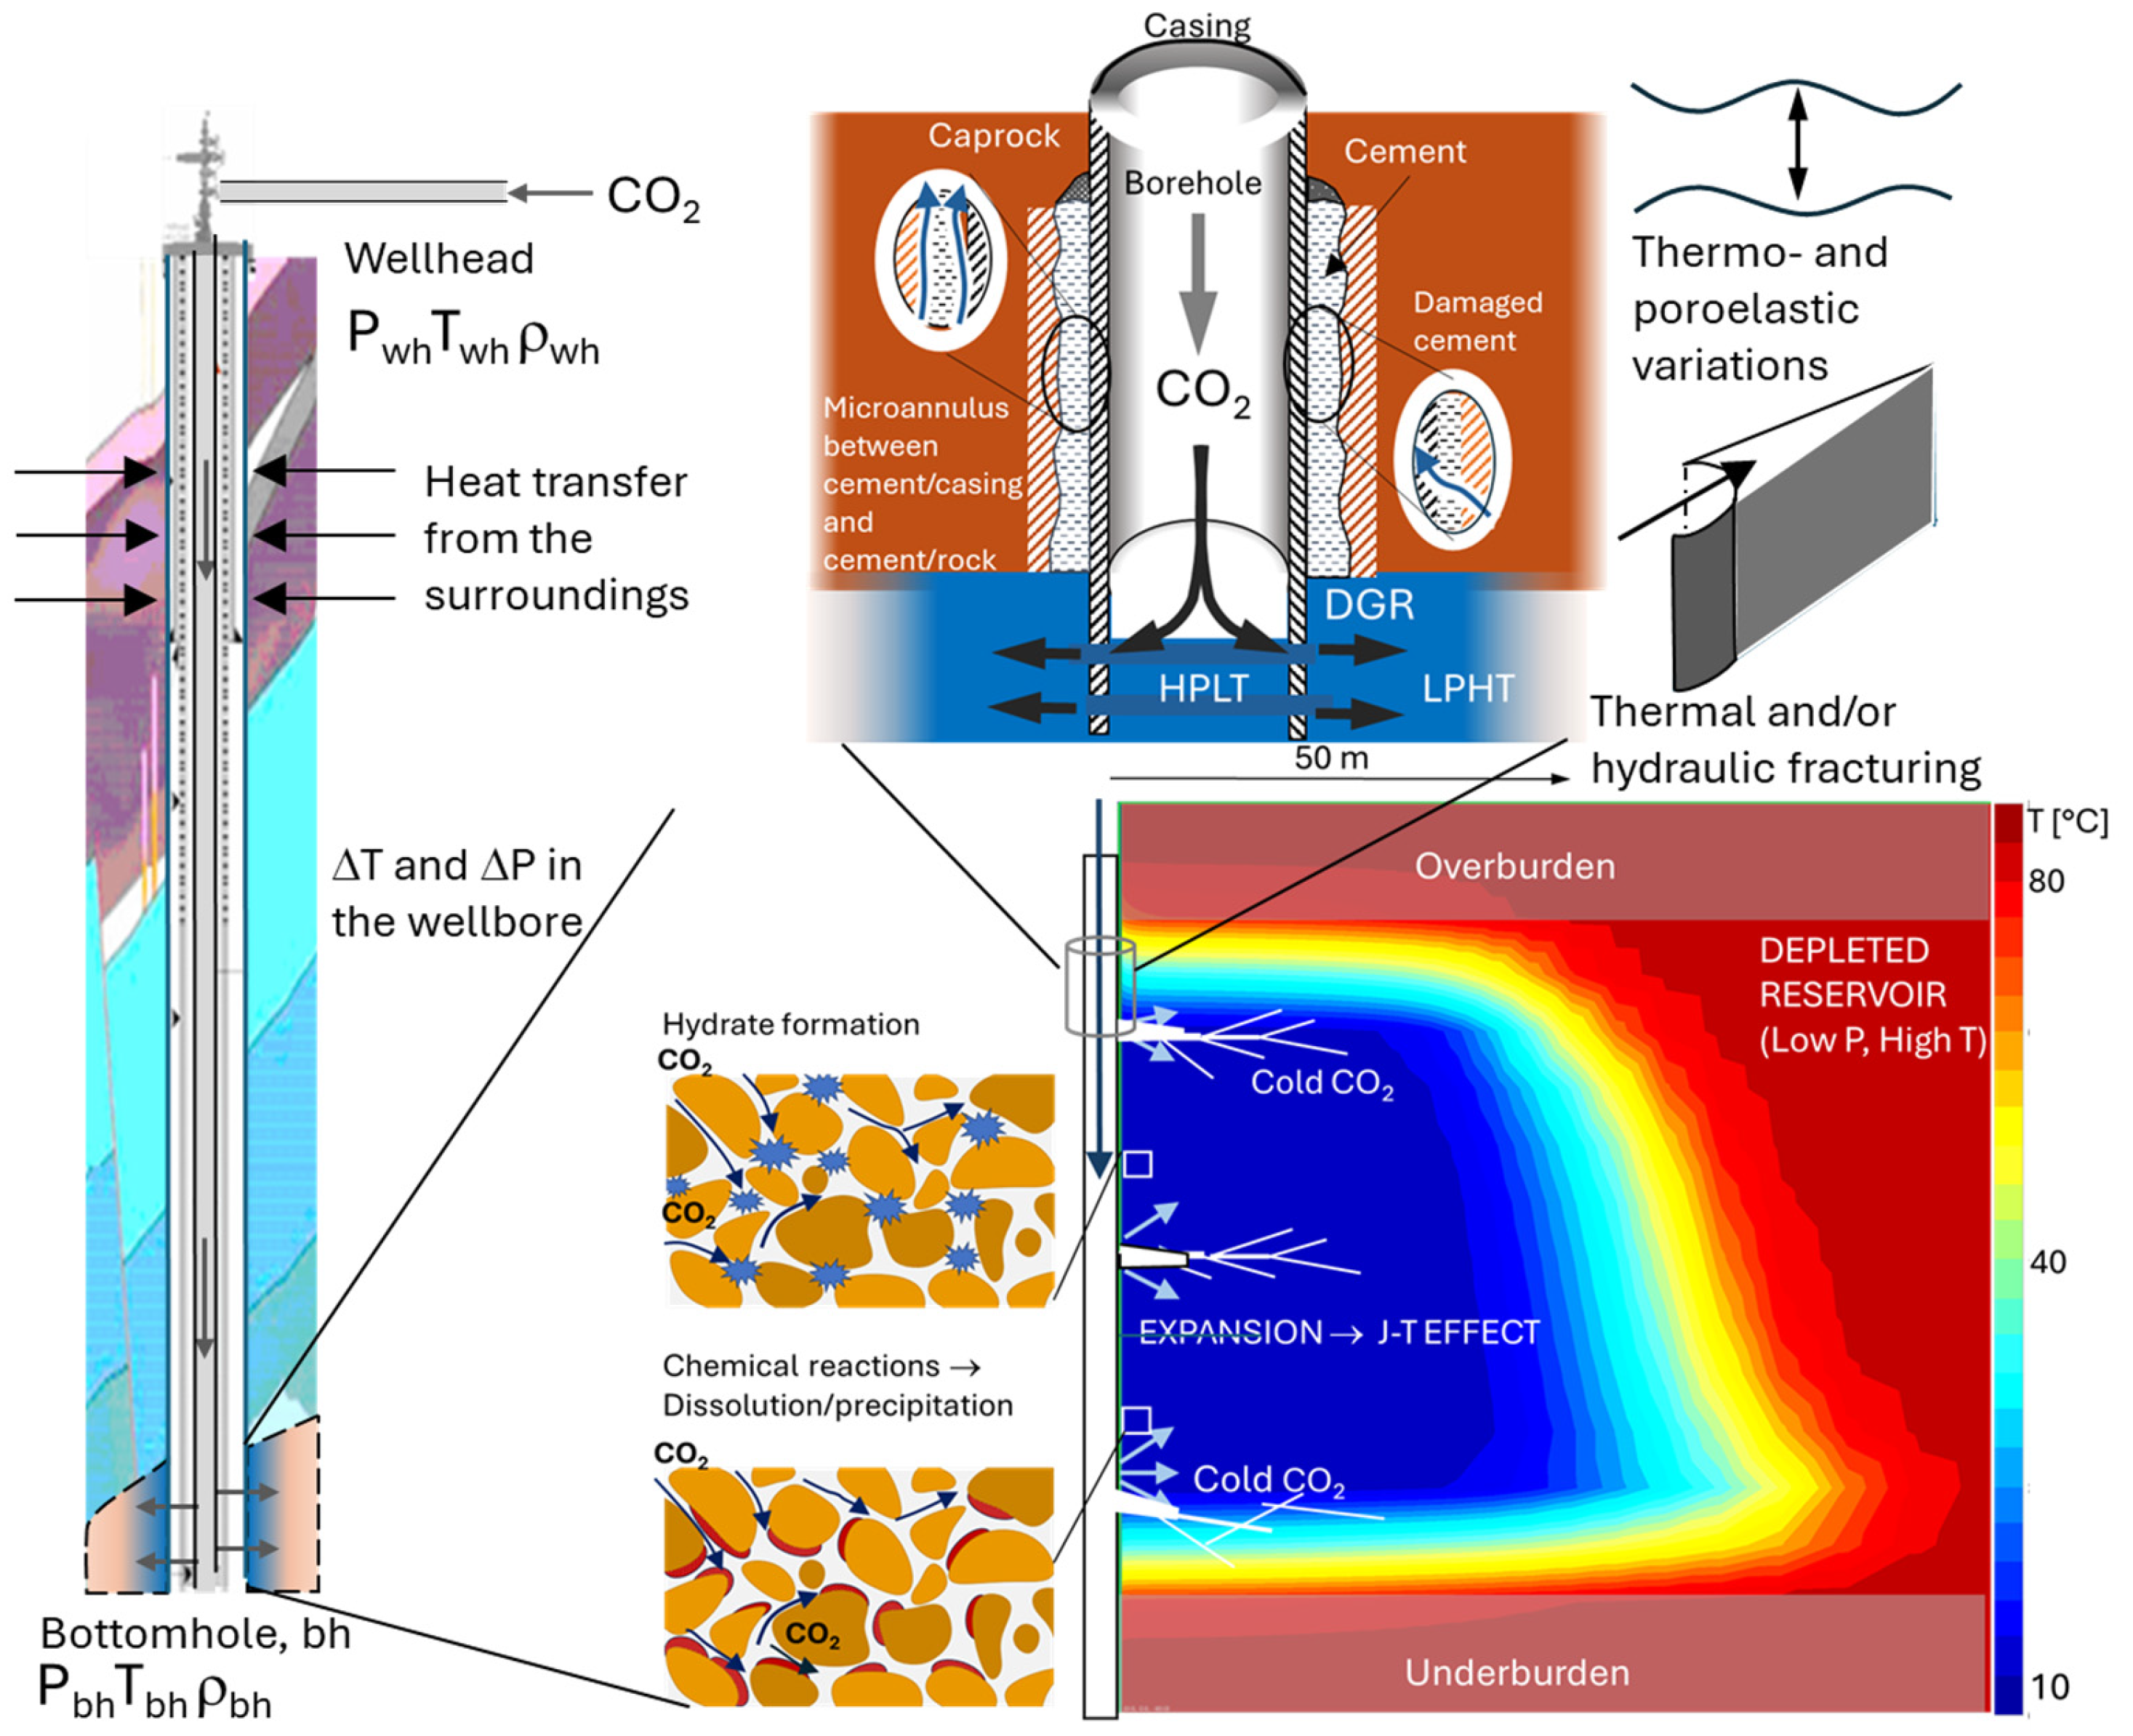
Figure 1 illustrates the simulated temperature profile in a 50 m thick radial GCS model using TOUGH2 simulator [28]. For an injection rate of approximately 32 kg/s (equivalent to 1 Mt/year, within the maximum-industrial range from one well), the cooling front propagates up to 50 m down from the well within 100 days after injection begins. Further details on the numerical model can be found in Appendix A and the subsequent chapters. It should be noted that this model does not explicitly consider J-T cooling due to expansion at the near-wellbore and represents a conservative estimate of cooling effects.
The impact of the J-T process on DGR NWZ has been the focus of extensive research in recent years [19,29,30,31,32,33]. Recent findings have indicated that the expansion of CO2 in the NWZ could potentially generate a substantial cooling in the reservoir. In an adiabatic process, the J-T coefficient (μJT) is directly proportional to the temperature and pressure decline, and a positive μJT indicates temperature reduction during expansion with the magnitude of cooling depending on pressure drop:
μ J T = T P H = T P
However, in practice, the heat capacity and conductivity of the reservoir rock and fluids can decrease the theoretical temperature drop. Moreover, the magnitude of μJT is contingent on the pressure and temperature, as well as the gas type and its thermodynamic state. For CO2, μJT is typically lower in the liquid phase and higher in the gas and supercritical state. Consequently, greater cooling is expected due to the J-T effect when CO2 is injected under supercritical conditions compared to liquid conditions.
The analytical model proposed by Mathias et al. (2010) is used to quantify the J-T cooling effect and estimate the lowest possible temperature (Tmin) during injection [30]. The model accounts for pressure- and temperature-dependent μJT values and assumes negligible water saturation, which is reasonable for DGRs and the dry-out region in the NWZ.
T m i n = α μ q 4 π h k ρ C O 2 l n c C O 2 1 S w ρ C O 2 c C O 2 + S w ρ w c w + ( 1 ) ρ r c r q t π h r w 2 + 1 + T r   i f   T r T i T i   i f   T r > T i
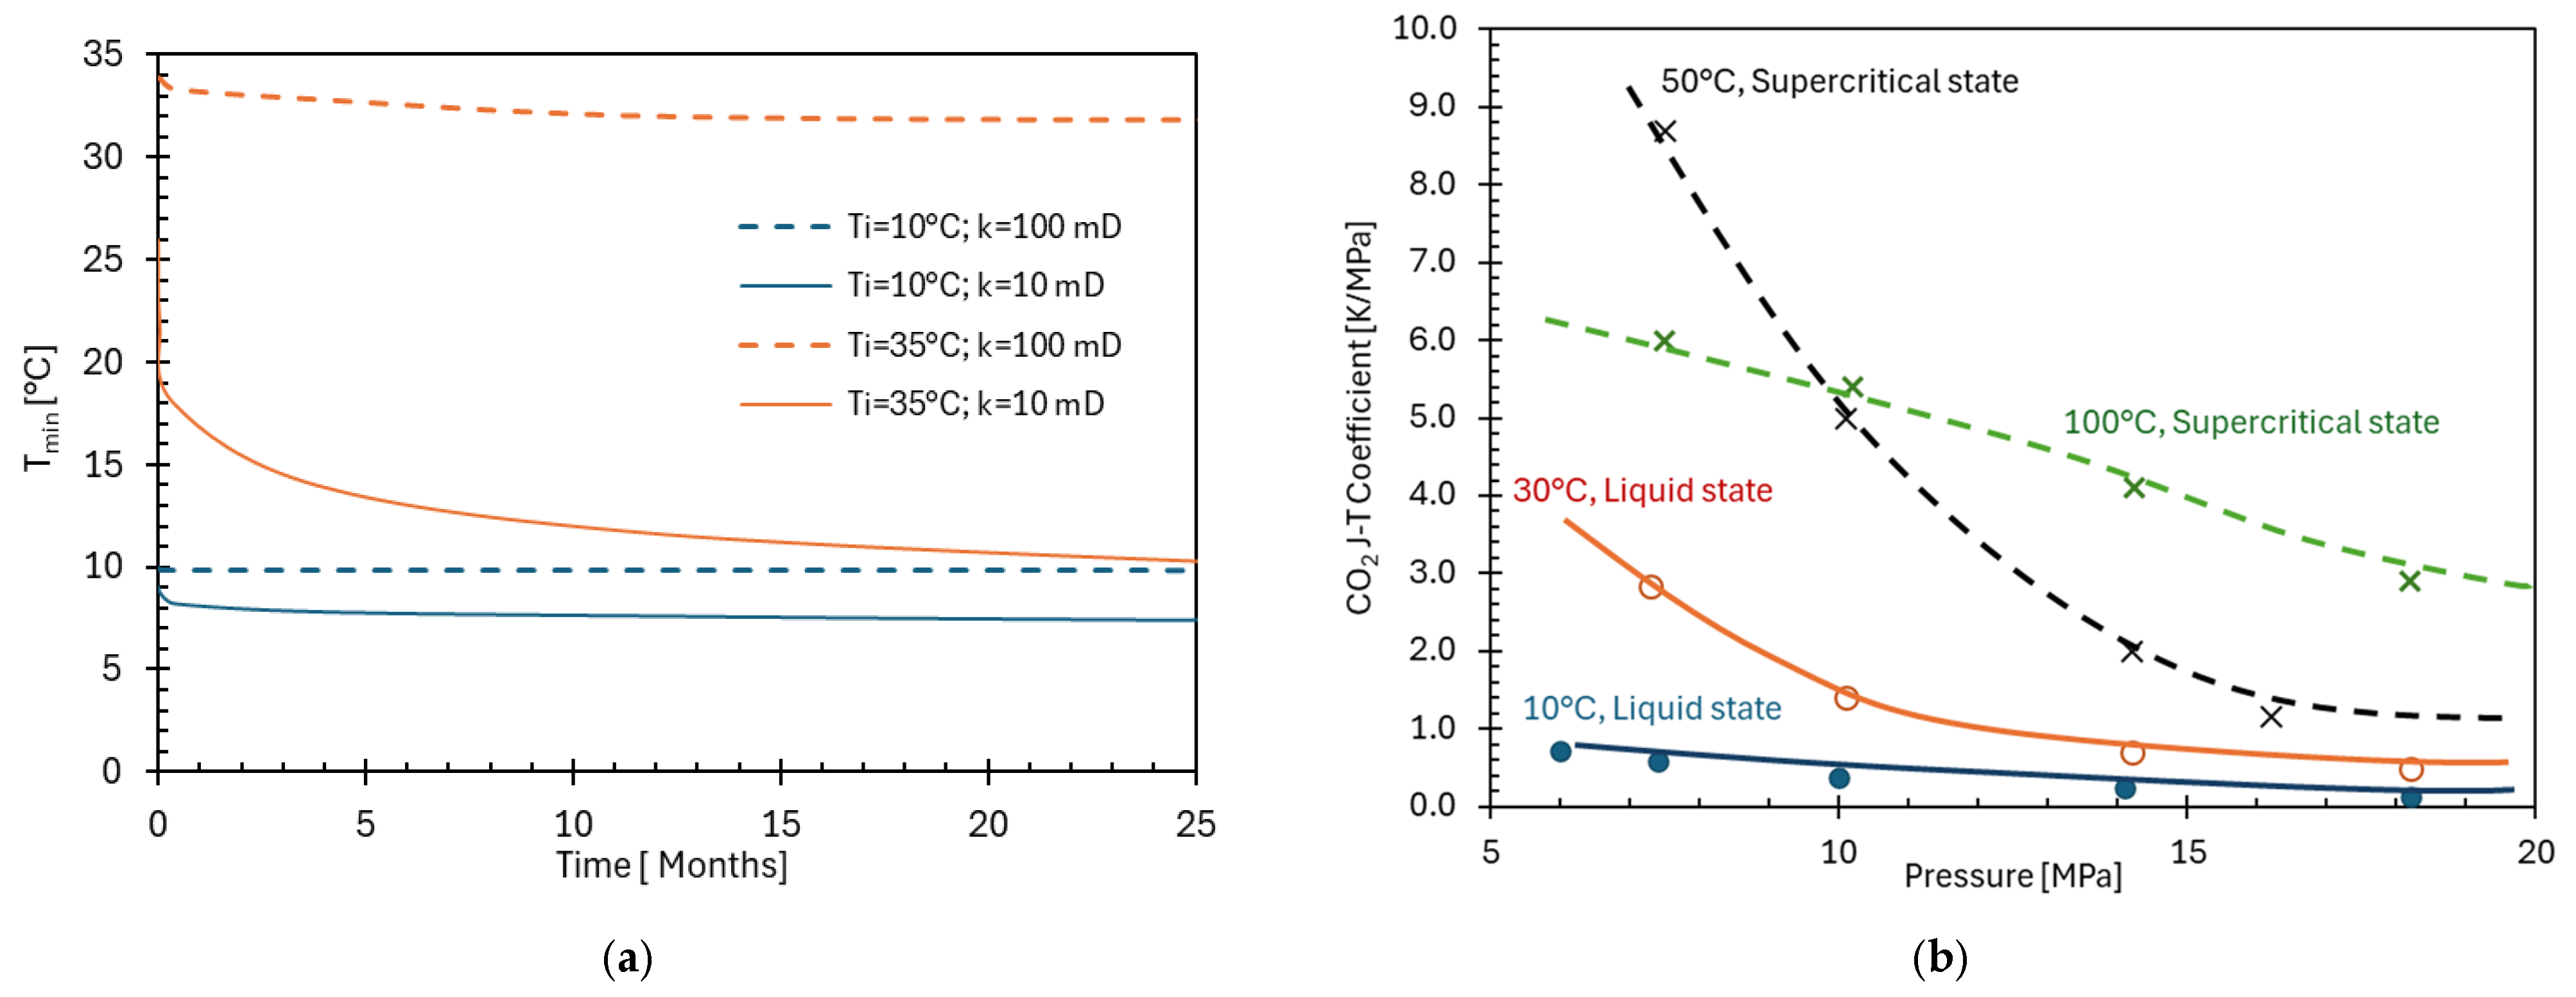
The model’s specifics, along with the relevant data, can be found in Appendix B. Assuming that the water saturation is zero, the relative permeability to CO2 is equal to the absolute permeability. Two scenarios are considered, injection at 10 °C (liquid phase), and 35 °C (supercritical case), for two permeabilities, 100 mD (base case) and 10 mD (tight reservoir). In the first thermodynamic framework, the CO2 is in the liquid phase, and the μJT is considerably lower than in the case where a CO2 temperature of 35 °C is assumed. As shown in Figure 2a, J-T cooling is negligible under liquid-phase conditions, with temperature reductions of less than 3 °C over two years even for the tight reservoir case. In contrast, supercritical CO2 injection (35 °C) leads to significantly larger cooling, with temperature reductions up to 30 °C, particularly in low-permeability systems where pressure drawdown is higher. These findings highlight the strong dependence of J-T cooling on thermodynamic state, permeability and pressure gradients.
Overall, the magnitude of cooling in the NWZ is controlled by the interplay between injection conditions and reservoir properties. Higher injection rates and larger differences between the bottomhole and reservoir pressures enhance cooling. The effect of reservoir thickness is related to the injection velocity and the resulting pressure drawdown in the NWZ. Similarly, lower-permeability systems create greater pressure drawdown and thus a stronger J-T effect. CO2 injection in the liquid phase creates a relatively weaker J-T effect due to significantly lower J-T coefficients, as can be seen in Figure 2b. As the J-T phenomenon and its potential formation in GCS in DGRs has been thoroughly explored in previous studies, this is beyond the scope of the present paper. The J-T effect may affect the vicinity of the wellbore, increasing the impact of the reservoir cooling manifesting as petrophysical or geomechanical processes with direct implications for CIC components. The following potential implications may be drawn from the effects of reservoir cooling on CIC, irrespective of the underlying reason:
-
Capacity: CO2 density decreases at lower temperatures, affecting storage efficiency and pressure evolution.
-
Injectivity: Cooling may shift conditions into the hydrate stability region, or influence salt precipitation behavior. Meanwhile, it can induce thermal fractures, which may potentially increase injectivity.
-
Containment: Thermally induced stresses may promote fracturing, potentially compromising wellbore and caprock integrity.
These coupled thermo-hydraulic–mechanical effects form the basis for the analysis presented in the following sections.

4. Storage Capacity

Injection of cold CO2 into DHRs directly affects the storage capacity through its influence on fluid density and pressure evolution. At lower temperatures, CO2 density increases, allowing a greater mass of CO2 to be stored within a given pore volume. As a result, cold injections lead to a slower pressure buildup during the injection phase, enabling additional CO2 to be injected before reaching the maximum allowable reservoir pressure.
However, this apparent increase in storage capacity is not static. Over time, heat exchange between injected CO2, formation rock, and the overburden and underburden leads to gradual thermal equilibrium. As the temperature of the injected CO2 increases toward reservoir conditions, its density decreases, resulting in volumetric expansion and a corresponding pressure increase. This post-injection pressure rebound may have important implications for long-term reservoir management and containment. Conventional capacity assessments are often performed under isothermal assumptions, particularly at early project stages. While this simplification is convenient, it neglects the dynamic thermal processes that occur during and after injection. The validity of the isothermal assumption is therefore questionable in the context of cold CO2 injection into DGRs, where a strong thermal gradient develops in the NWZ and propagates into the reservoir.
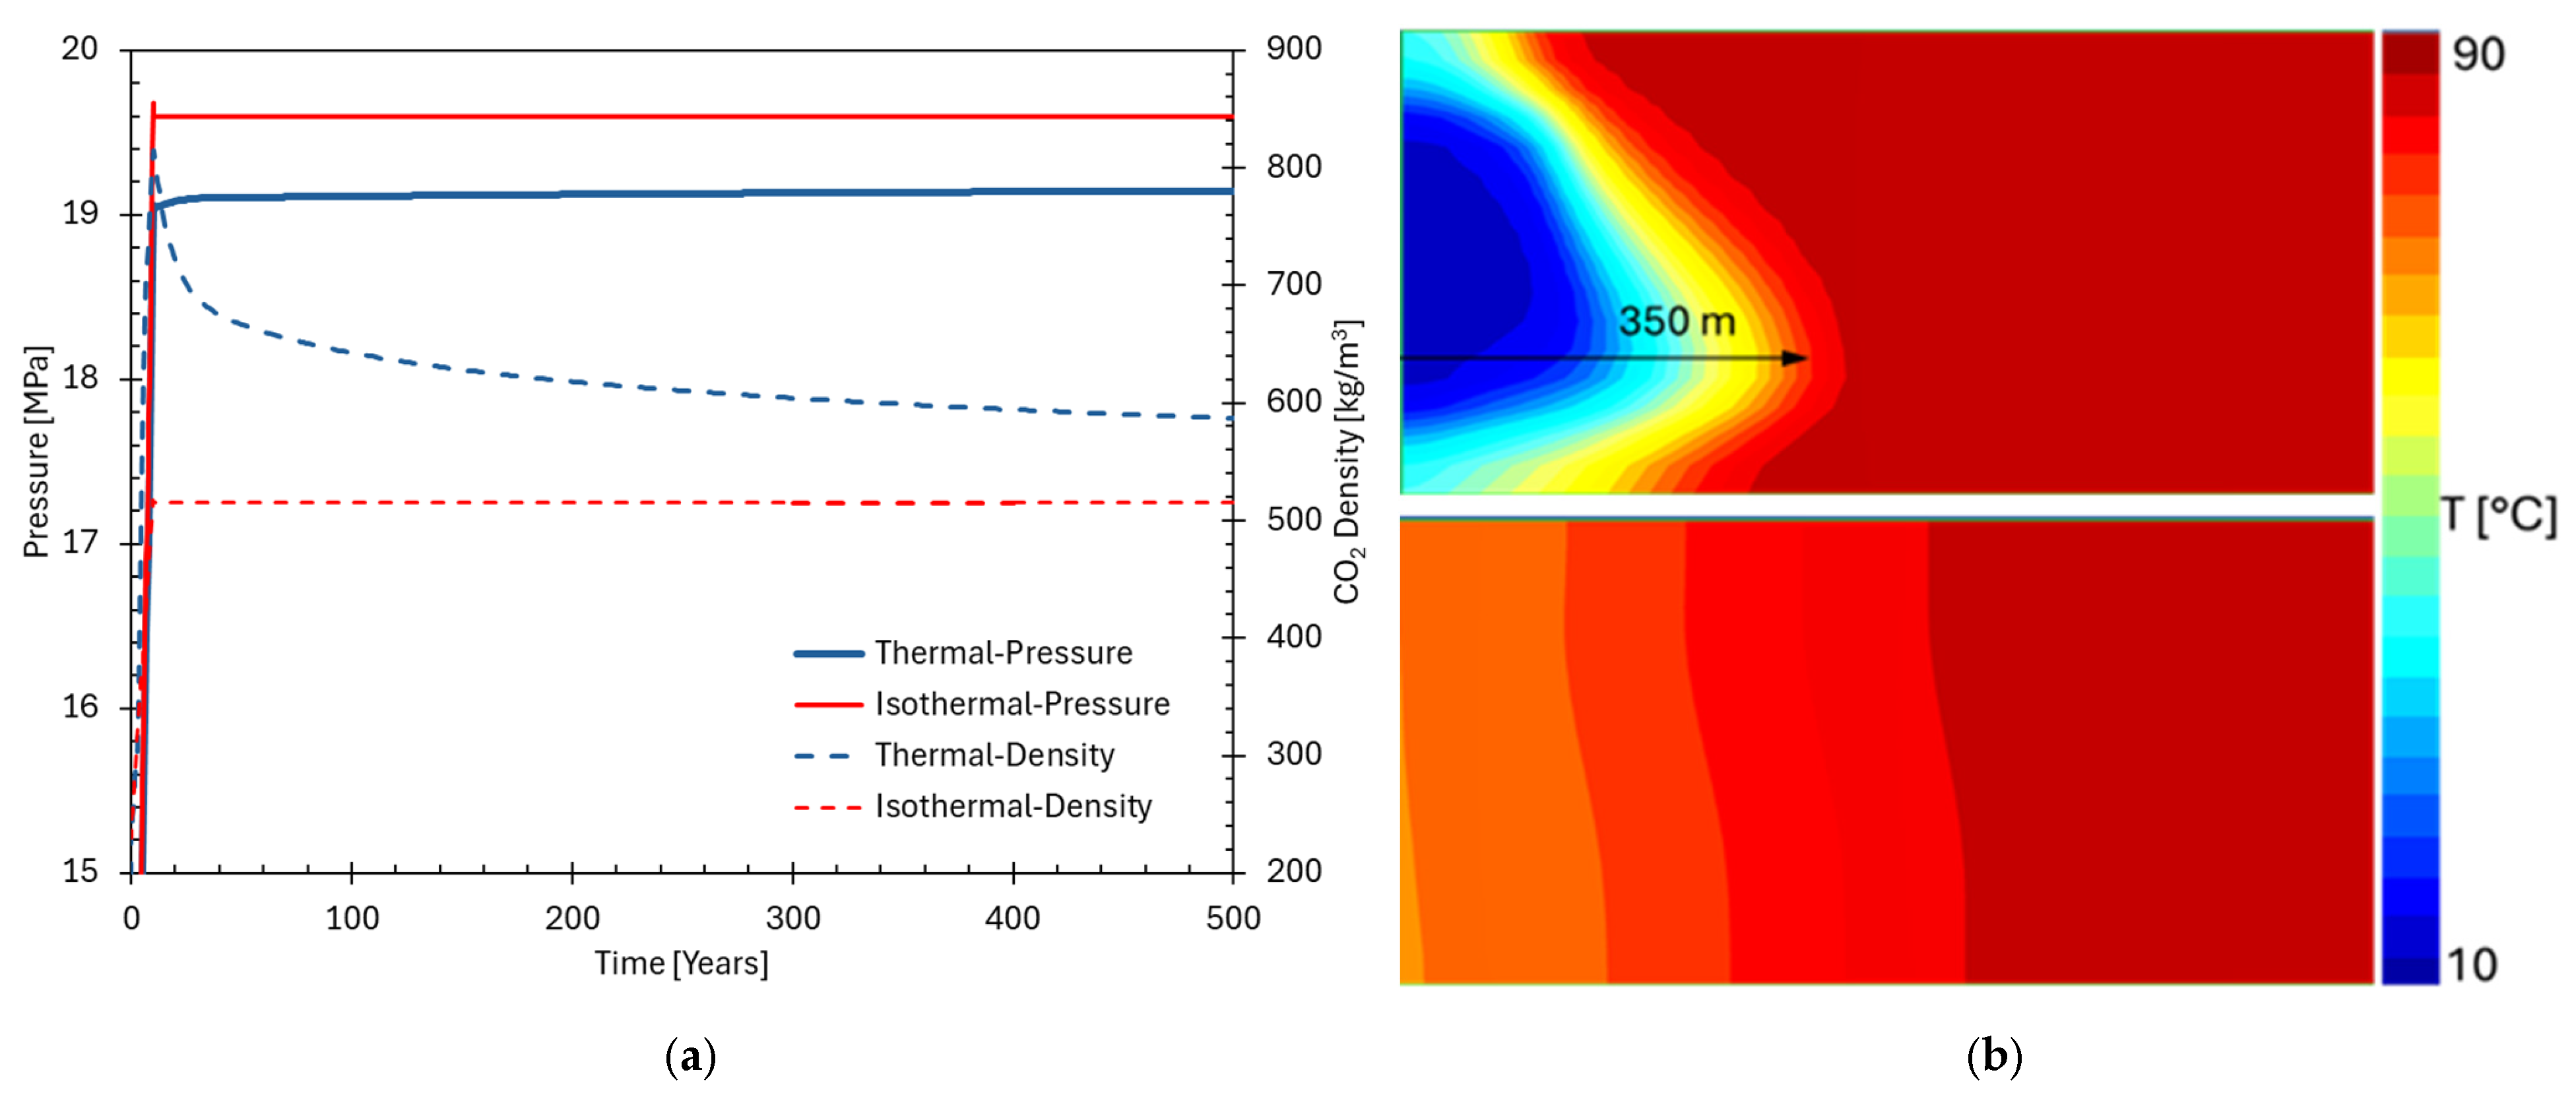
In this study, an attempt was made to simulate the thermodynamic picture during and after cold CO2 injection in a DGR reservoir for GCS. The generic, simplified DGR model with the properties listed in Appendix A is utilized. The generic model simulates a closed boundary reservoir with a radius of 1000 m and a thickness of 50 m. The sealing formations above and below are modeled with a thickness of 15 m and corresponding petrophysics. The complete set of model properties can be found in Table A1. For comparison, the same model was also operated in isothermal mode, i.e., with the injection of CO2 at the reservoir temperature.
Figure 3a compares the temporal evolution of reservoir pressure and CO2 density at a location 200 m from the wellbore in the middle layer and demonstrates substantial differences in injection performance. It should be reiterated that the reservoir simulator is not coupled with a wellbore model. The thermal model displays a reduced rate of bottomhole pressure buildup in comparison with the isothermal case, mainly because CO2 injected at 10 °C occupies a reduced volume at reservoir conditions in contrast to CO2 at the initial reservoir temperature of 90 °C. Following a decade of isothermal injection, the reservoir pressure has been observed to reach 19.6 MPa. In contrast, the pressure in the thermal simulation has been found to remain at 19.0 MPa. As shown in Figure 3a, the pressure continues to increase slightly in the thermal case, owing to the concomitant changes in density. In this instance, the discrepancy in capacity is negligible, with an approximate 5% increase in the mass that is injected for the thermal case. It is evident that this amount is contingent on the characteristics of the injection and reservoir, consequently effecting a shift in the ultimate capacity. As the injection period ends (after 10 years), the reservoir portion cooled to the injection temperature reaches a radius of approximately 350 m from the well (see Figure 3b). As the CO2 travels deeper into the reservoir, it cools a portion of the reservoir rock down to the injection temperature. Concurrently, the CO2 itself is heated up due to the continuous heat exchange between the reservoir rock, in situ fluids, and the injected CO2. This is also the reason the radius of the CO2 front is larger than the thermal (cooled) front. During the dissipation of CO2 in the reservoir, a portion of the overburden and underburden formations is subject to cooling as well. The density profile in the reservoir is analogous to the temperature profile, as its value is strongly dependent on temperature. After the closure of the injection well during the post-injection period (see Figure 3b, bottom), a change in the temperature distribution is observed. This phenomenon can be attributed to the heat transfer process, which occurs concurrently with the expansion of the colder CO2. Conversely, the conduction of heat in the surrounding formations, followed by slow convection, results in the heating of the reservoir. Consequently, the colder portion of the reservoir becomes warmer over time. This process is characterized by its gradual and uninterrupted nature, persisting until a state of equilibrium is achieved.
In conclusion, the pressure and temperature, and therefore the capacity of the storage unit, are not only a static function of the given petrophysics and initial reservoir thermodynamics but also a function of time. Heat transfer via conduction and convection mechanisms counteract the thermal depletion in the cooled zone of the reservoir, promoting gradual thermal re-equilibration. This temperature recovery will cause CO2 to expand, leading to a long-term pressure rebound that requires careful consideration in post-injection monitoring. Furthermore, while cold CO2 has a higher density, which increases the apparent storage capacity, it simultaneously elevates geomechanical risks due to thermal stresses. These risks could potentially necessitate a lower maximum allowable injection pressure, which would inversely affect the storage capacity. Consequently, a comprehensive evaluation of thermal effects is imperative for the precise determination of storage capacity. Notwithstanding the intricacies inherent in post-injection thermal recovery, the effective storage capacity is contingent upon the quantity of CO2 that can be injected prior to the reservoir pressure attaining the safety-driven maximum allowable limit during the period of active injection. It is evident that the primary rationale behind the imposition of this maximum pressure constraint is to prevent geomechanical issues. The reservoir pressure naturally declines post-injection due to spatial redistribution and equilibration; the critical operational bottleneck is the pressure buildup during injection. When thermal effects are considered, the slower pressure buildup delays the attainment of this maximum allowable limit compared to the isothermal case. Therefore, from an operational perspective, it is reasonable to conclude that the effective CO2 storage capacity is indeed increased relative to the isothermal assumption.

5. CO2 Injectivity

Preliminary analyses indicate that the injectivity of CO2 in DGRs is considerably higher than in SAs under thermodynamic and petrophysical parameters normally occurring. In the absence of substantial water influx from the underlying formations, brine displacement is minimal due to depletion. However, when considering the changing thermodynamics due to the potential J-T effect in addition to cold injection, there are several phenomena that may affect injectivity, which must be properly addressed.

5.1. Thermo-Hydraulic Fracturing

In the context of the oil and gas industry, as well as geothermal and GCS applications, the fracturing process is of paramount importance due to its multifaceted nature, which might be both beneficial and detrimental. Numerous studies have investigated the initiation and propagation of fractures, as well as their impact on reservoir performance and associated risks (e.g., [36,37]).
As demonstrated by numerical analyses, fracture initiation is typically associated with tensile failure in the vicinity of fluid injection. This phenomenon occurs when fluid pressure and drag forces exceed both the tensile strength of the rock and the minimum principal stress. Consequently, fracture initiation predominantly occurs at the periphery of the perforation tunnel and is dominated by tensile failure, characterized by the predominance of tensile cracks. However, as injection continues, the combined effect of rock mass degradation and boundary stresses promotes the development of shear-induced fractures. It is important to note that these cracks eventually exceed tensile-induced cracks as a result of shear/compressive failure. This finding suggests that shear fracturing becomes more prevalent as the process continues.
Hydraulic fracturing may occur when the minimum principal stress decreases and/or the pore pressure (Pp) increases sufficiently. This can occur either intentionally or accidentally during fluid injection at high rates. This process can cause the fluid pressure within the rock to exceed the sum of the rock’s tensile strength (T0) and the minimum principal stress (σmin). The criterion also commonly known as the effective stress law can be formulated as follows:
P p σ m i n + T 0       or       σ m i n P p T 0
A tensile fracture propagates perpendicular to the direction of the minimum total stress.
Changes in fluid and/or rock temperature have the potential to induce thermal stresses, which may in turn enhance the initiation and propagation of hydraulic fracturing, both into the reservoir and potentially the caprock. The effects may vary considerably depending on the magnitude of thermal shock and the rock properties. In the context of the injection of cold CO2 into the reservoir, thermal stresses are expressed in general terms as the expansion (or contraction) of the rock. This is formulated using the Young’s modulus (E), Poisson’s ratio (v) and thermal expansion coefficient (αT).
Hydraulic fracturing generally enhances injectivity. However, it may also exert a detrimental effect on the integrity of the system, particularly regarding containment, when fractures expand within the caprock and the well barrier system.
The formation and/or opening of fractures in the NWZ may lead to a decline in bottomhole pressure (BHP), thereby enhancing the reservoir injectivity. In addition to the thermal effect, the magnitude of pressure buildup is significantly influenced by two primary factors: the fluid injection rate and the distance from the wellbore [36,38]. Modeling studies indicate that fracture initiation is controlled by tensile failure due to pressure buildup, while shear-induced fracturing becomes more important as deformation progresses. The current understanding of injection-induced fracture propagation in GCS remains, however, incomplete [39]. The literature contains a significant degree of controversy regarding the question of whether fracturing is beneficial or detrimental to CO2 sequestration (e.g., [40,41]). However, the integrity of the wellbore is of paramount importance for any subsurface operation, especially when considering the injection of cold, high-pressure CO2 into a warmer, depleted reservoir as discussed previously. A considerable number of attempts have been made to assess and predict the so-called thermo-hydraulic-fracturing (cryogenic fracturing; cryofracturing) process during cold water or CO2 injection into a reservoir (e.g., [41,42,43,44]). While a comprehensive treatment of these processes is beyond the scope of this paper, their fundamental behavior and implications for injectivity can be assessed using simplified models.
A recent study provides a comprehensive overview of the fundamental principles of thermo-hydraulic fracturing, supported by an analytical model [40]. The proposed model has been validated against a numerical model, with findings indicating a satisfactory level of agreement, which allows for the preliminary assessment of the initiation and development of fractures during the process of cold CO2 injection. The model delineates the interrelationships between thermo-poro-elastic stress and the criterion for initiation of fracturing. The thermal-stress component employs a simplified analytical solution to model the stresses surrounding the wellbore. This solution incorporates variations resulting from near-wellbore cooling and far-field reservoir temperature conditions.
The total horizontal stress in a given thermo-hydraulic situation is calculated by expanding the pressure term in the following equation and adding the thermal-stress term [40]:
σ h = σ h ,   d e p l + γ u , i n j G p , r e q P i n j + γ u , i n j G p , r r e s P b u E ( 1 v ) α T G T T
where the two pressure terms represent the local pressure increase due to injection, ΔPinj = Pinj − Pres, and the pressure increase from the depleted state to the current state: ΔPbu = Pres − Pdepl. σh,depl is the minimum horizontal total stress in the depleted (start) situation, γu,inj is the stress path under pressure changes during the injection phase and the last term is the thermal stress caused by expansion (or contraction), with Young’s modulus E, Poisson’s ratio v, the thermal-expansion coefficient αT, and temperature difference ΔT. GT and Gp are geometrical factors as proposed by [45,46], which are included to account for the difference between local temperatures and pressures compared to the far-field conditions. These factors and the other components of the equation are described in detail in Appendix B.
To quantify the impact of cooling on fracture initiation, Equation (4) is applied using the parameters provided in Appendix B. The fracture initiation criterion given in Equation (3) is used to evaluate the results graphically.
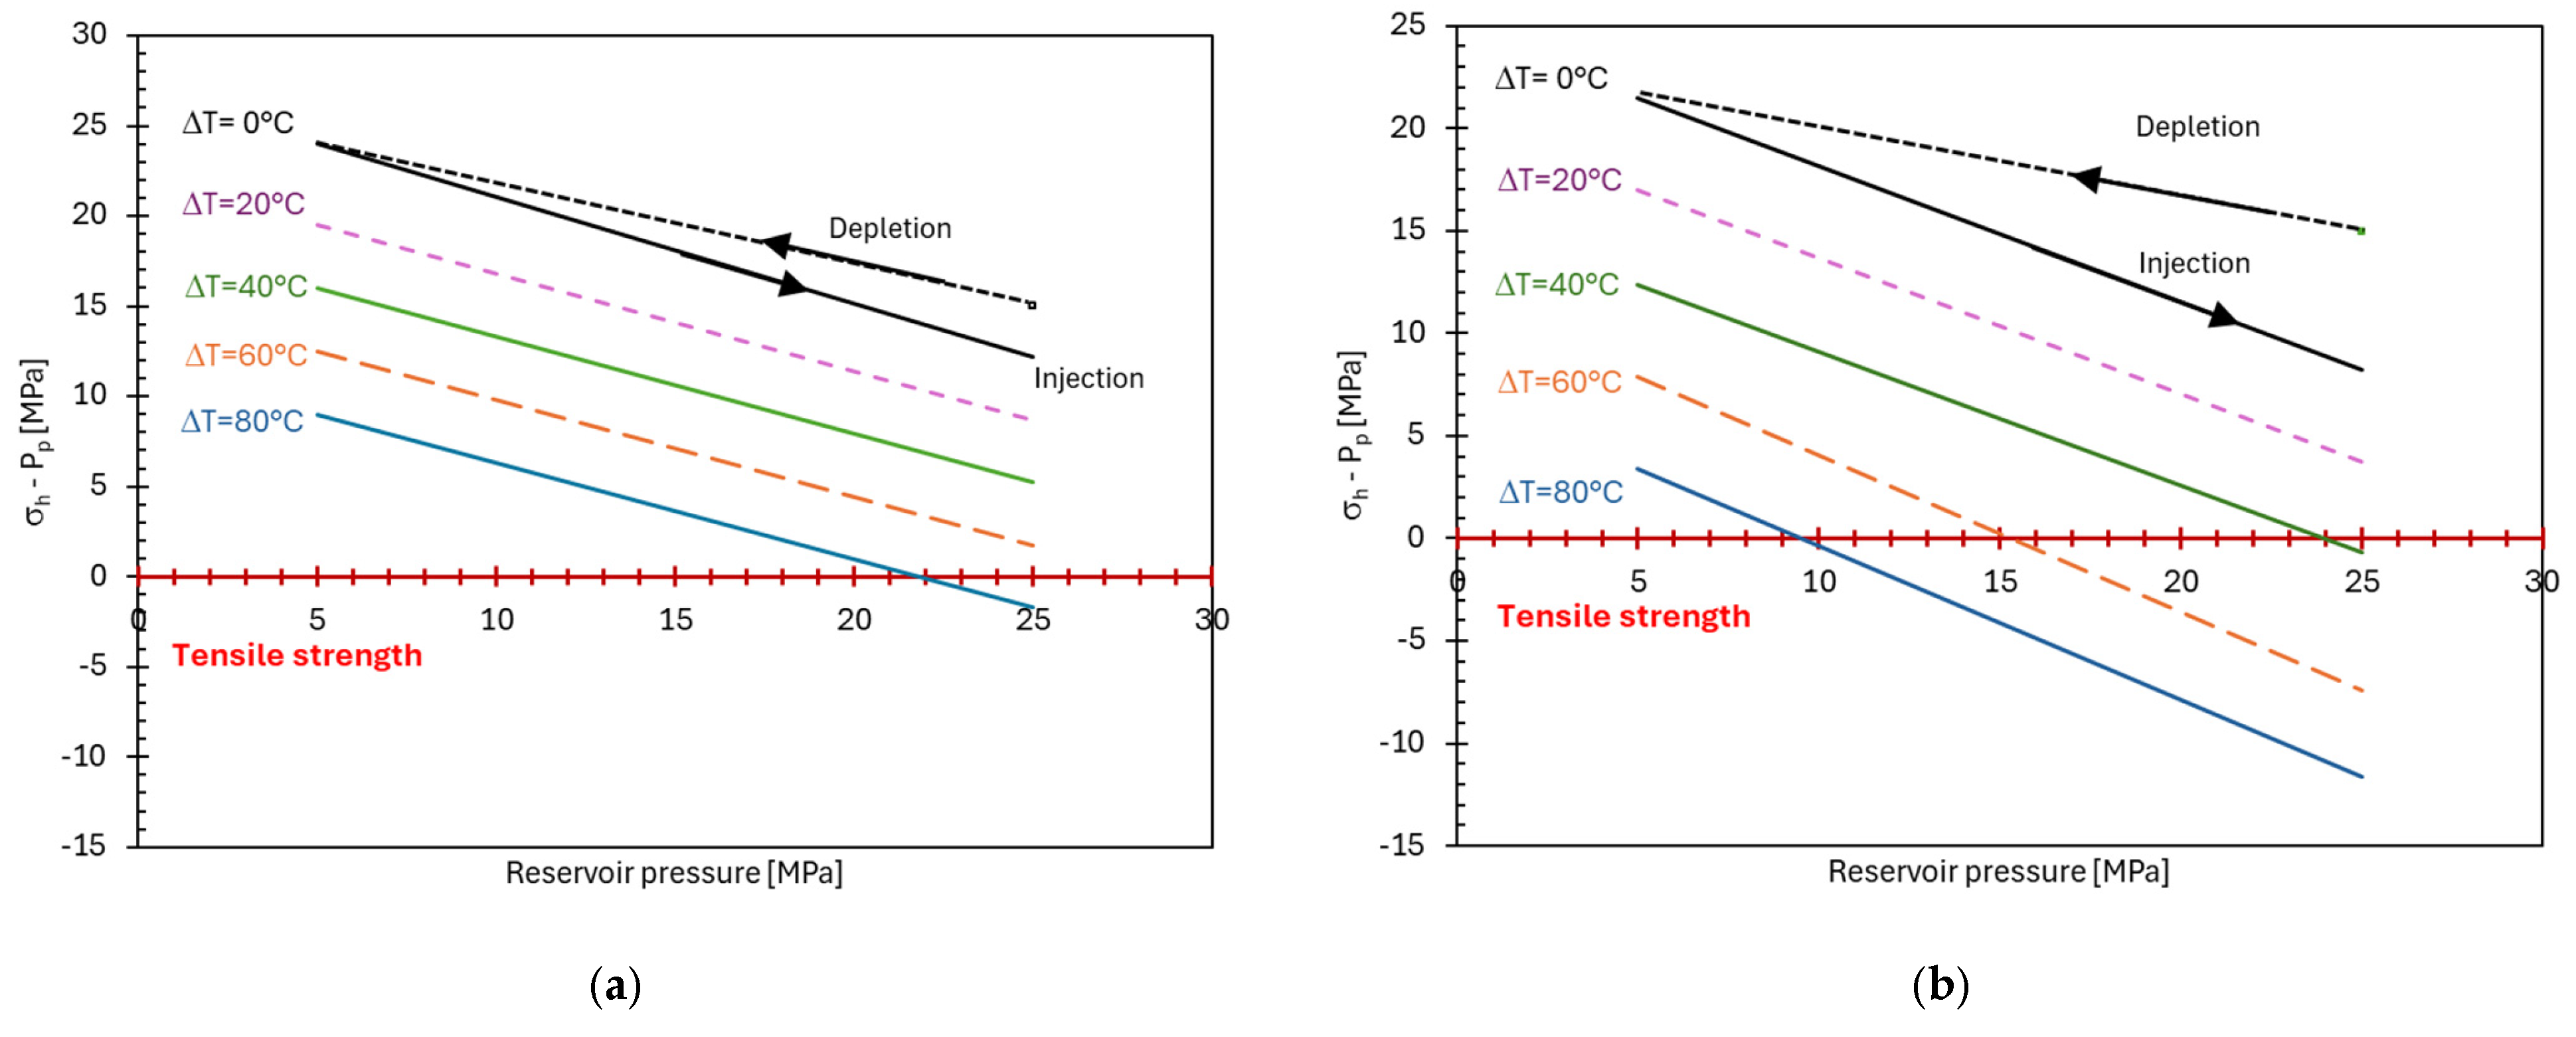
As established by Equation (3), Figure 4a,b are plotted in terms of σh − Pp versus average reservoir pressure to comment on fracture evaluation in terms of the increase in pore pressure during injection. The figures also show the depletion path and the tensile strength (x-axis, red). As long as the minimum stress remains positive (i.e., in compression), there will be no fracture, since rock only fractures under tension (i.e., with an effective stress below −T0 on the x-axis, where σh − Pp = 0). It should be noted that the γh is a function of the Poisson ratio (v) and Biot coefficients (β) for the plastic deformation of the rock and is the most significant unknown variable, exerting a significant influence on the pressure-dependent alteration in total stress:
γ h = ( 1 2 v ) ( 1 v ) β
Figure 4a shows a case with γh = 0.71 (with v = 0.1), and Figure 4b shows a more conservative case with γh = 0.45, where v = 0.3 represents a ductile rock. The Biot coefficient is assumed to be equal to 0.8 for both cases. The injection paths are calculated for various temperature differences due to cooling, as depicted in the figures. The path with ΔT = 0 is that of standalone hydraulic fracturing. In (a), a ΔT of at least 80 °C is required for a fracture to be initiated within the injection lifetime. For less localized cooling, the minimum stress remains positive (i.e., in compression). Another aspect that can be observed in the figures is the moment of fracture initiation. This depends on the amount of cooling: for example, in case (b), at a temperature difference of 80 °C, the reservoir begins to fracture around the well when the reservoir pressure is approximately 9 MPa or higher.
The figures also illustrate the effects of the different terms in Equation (4). The ΔT term and the ΔPinj term both shift the stress lines up and down linearly. The injection constant is known to alter the derivative to P, thereby changing the slope of the stress relative to the reservoir pressure. A modification of Poisson’s ratio would result in an alteration to both the slope and the distance between the stress lines. Young’s modulus and the thermal-expansion coefficient would only modify the spacing between the stress lines in a manner analogous to the ΔT term. In summary, this illustrates how geomechanical input affects the development of effective stress during pressure buildup.
GT and GP are geometrical factors that account for the difference in local temperatures and pressures in comparison to those experienced in the far-field. The term ‘GT’ is the correction factor for the effect of the cold zone on thermal stresses. This is calculated as a function of the cold-front diameter relative to its thickness (d/h). The value of the parameter under consideration ranges from 0.5 (early times) to 0.75 (later times). This is a matter of significant variance in the early stages. In a manner analogous to the distinction between cooled and original zones in the reservoir, there exist pressurized and non-pressurized zones within the reservoir, as compared to uniaxial strain conditions in infinite-reservoir rock. One such form of pressure effect is the average pressure increase or decrease in comparison to a reference situation. The second is the injection pressure added to the average reservoir pressure, which decreases logarithmically away from the well. To account for this phenomenon, the implementation of the same methodological approach employed for temperature, utilizing the formulation of the equivalent radius on which a constant ΔPinj operates, is proposed [45]. The derivation of both GT and GP is provided in [40].
Other studies based on fully thermo-hydromechanical simulations support these findings. In a recent study the simulation results indicate that the cooling process leads to two key outcomes [41]: firstly, an acceleration in the initiation of fracture, and secondly, a reduction in the breakdown pressure. The process of cooling has been demonstrated to facilitate the transverse initiation of hydraulic fractures in circumstances where such initiation would have occurred longitudinally (i.e., within the same plane as the well) in the absence of cooling. It has been observed that cases demonstrating the greatest susceptibility to a complete change in fracture initiation geometry are those in which the well is drilled parallel to the least compressive stress. This is generally observed in the context of horizontal wells drilled parallel to the minimum horizontal stress, although it is also applicable to vertical wells in cases where the vertical stress is lower in magnitude than either of the horizontal principal stresses. The results of this study indicate a significant potential for cooling to impact hydraulic fracture initiation and early growth. It is therefore essential that this potential is taken into consideration during the planning and interpretation of stress testing and reservoir stimulation when cooling operations are necessary.
One important implication of the thermal fracturing is on the integrity of the GCS system, which will be discussed in the Section “Containment”. The other implication is due to the increased injectivity as discussed in the literature (e.g., [38,47]). Luo and Bryant (2014) proposed a semi-analytical quasi-steady-state model to analyze injection-induced fracture growth and its impact on CO2 plume migration [38]. This analysis was conducted under the assumption that regulators would permit injection-induced fractures [38]. A parametric analysis of the model is conducted to investigate the influence of geological properties and operating conditions on fracture growth and CO2 migration. One of their conclusions is the increased injectivity of the fractured system, leading to their question in the title “Is Fracturing Good or Bad for CO2 Sequestration”. Huerta et al. (2020) investigated the issue by incorporating the equivalent fracture permeability model (kf) into an equivalent permeability (ke) term for flow in multiple parallel units as follows (for two layers as an example) [37]:
k f = b 12           and         k e = k 1 A 1 + k f A f + k 2 A 2 A t
where b is the fracture aperture and A is the area of the layers, where At is the sum of the layers 1, 2, and f. The authors performed runs with various stress-induced fracture configurations, both in vertical and horizontal directions. They showed that horizontal wells with a series of hydraulically induced fractures increased reservoir injectivity by about 32% compared to nonfractured horizontal and vertical injection wells. They also indicate that the amount stored is higher in fractured cases due to the greater vertical and horizontal extent of the CO2 plume. Although their study was performed on SAs for GCS, their conclusions are also relevant to DGRs. Induced fracturing certainly involves more risks and uncertainties in DGRs; however, it can be preferred especially in tight reservoirs.

5.2. Chemical Reactions/Salt Precipitation

In a GCS operation, physical and/or chemical interactions start as soon as CO2 comes into contact with the reservoir rock and fluids. In DORs, CO2 dissolves physically in oil, altering its properties such as density and viscosity, which is primarily relevant for EOR rather than for GCS. Another important interaction occurs between CO2 and formation water. CO2 dissolves in water through physical absorption and a small amount of the CO2 reacts with water to form carbonic acid. This subsequently dissociates into hydrogen and bicarbonate ions in a well-established process. In an acidic environment, some minerals such as calcite and dolomite may dissolve, releasing ions such as Ca2+, Mg2+, etc., which can later react with HCO3 and CO32− to form stable carbonate minerals. These geochemical reactions, involving various minerals and fluid compositions (including clays), depend on thermodynamic conditions such as pressure, temperature, and brine compositions. The interaction between CO2 and brine, specifically the dissolution of CO2 in formation brine, is a pivotal parameter for all three pillars of GCS. The presence of CO2 dissolved in brine has been shown to disrupt the geochemical equilibrium within the reservoir, thereby inducing the dissolution and/or precipitation of reservoir minerals. Carbonate mineralization is one of the mechanisms that ensures long-term trapping. However, alterations in mineral composition result in petrophysical changes, leading to increases or decreases in porosity and permeability, which directly impact storage characteristics. The integrity of well components is susceptible to degradation due to dissolution or precipitation processes that occur within the well and its interface with the surrounding formation. However, the relevance of geochemical reactions in GCS in DHRs is generally limited due to the relatively low water saturation of such reservoirs, unless a stronger water influx from the reservoir boundaries takes place over time, effectively transforming parts of the depleted reservoirs into a SA within a given period. In such cases, their effect can be determined through case-specific physical and/or numerical modeling studies. Within this context, the NWZ of DGRs deserves particular attention due to the processes discussed previously.
Halite precipitation near the wellbore has received greater attention than other physicochemical interactions in GCS, due to its relatively fast kinetics and its potential to impair injectivity. A discussion of the occurrence and risk potential of the phenomenon is also worthy of inclusion. The risk of salt precipitation is well established for SAs, whereas it has been less emphasized for DGRs [48,49,50]. To investigate this phenomenon, both physical and numerical experiments were conducted.
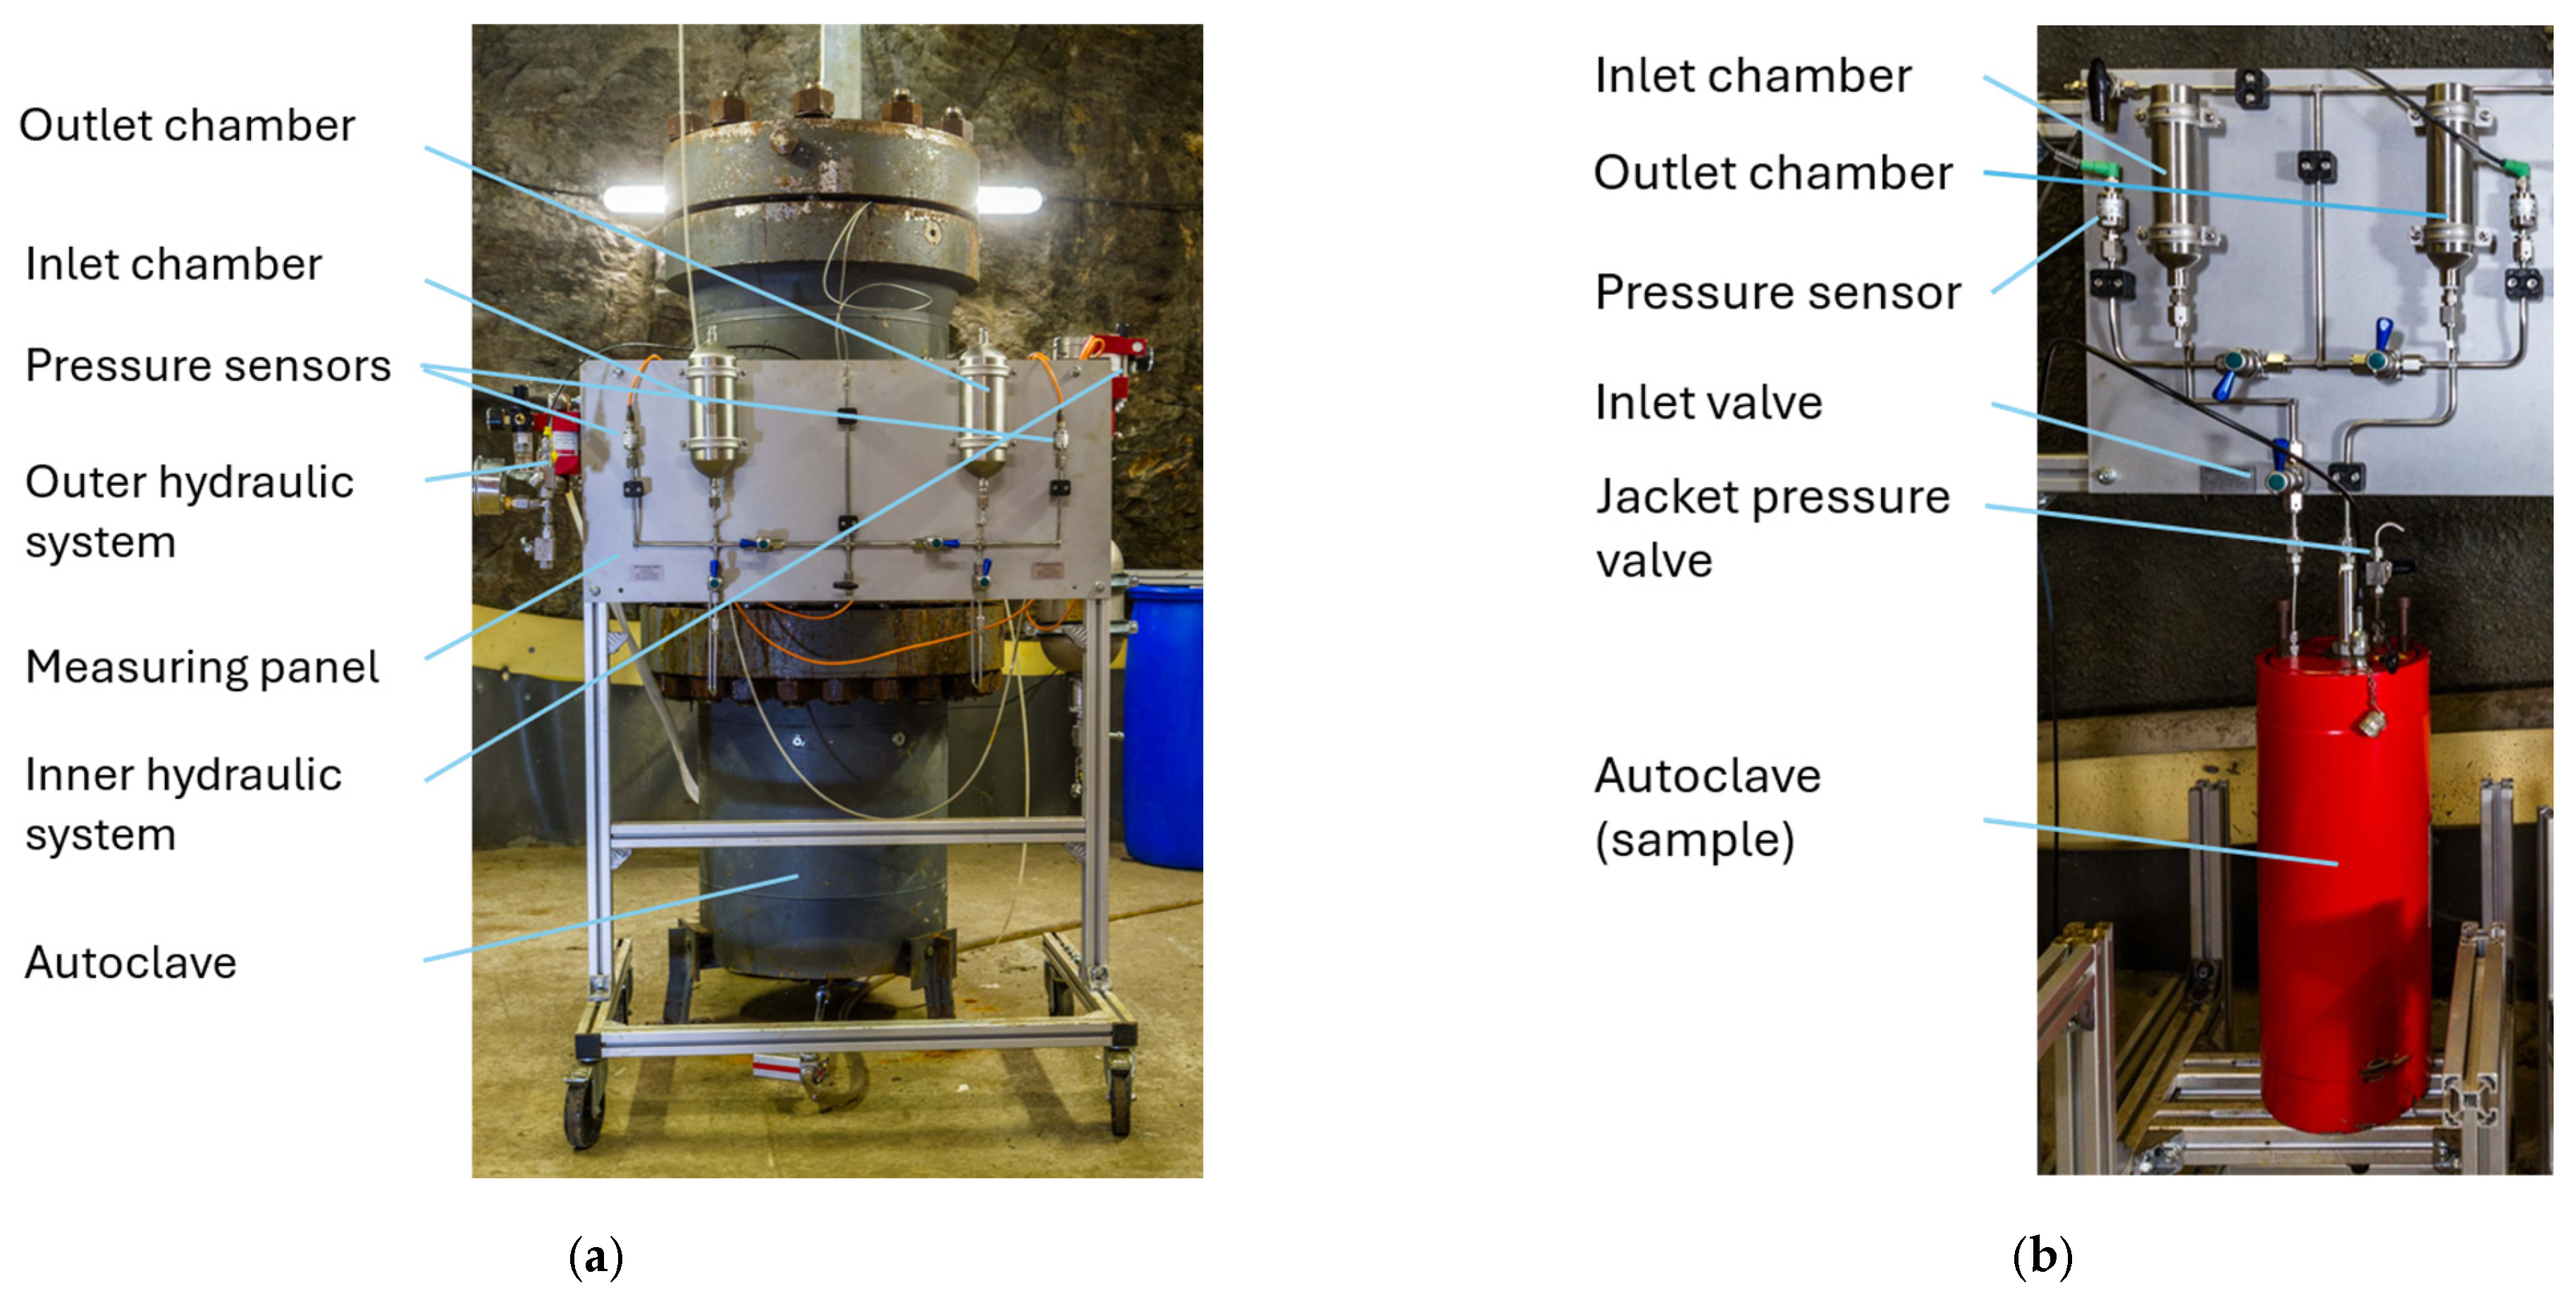
We performed several core-flooding experiments using a specially designed and constructed experimental setup. Complementary numerical simulations were carried out using the TOUGH2 reservoir simulator and its corresponding equation-of-state modules to enhance the understanding of the governing processes [51,52]. The methodology, including geometry, petrophysical parameters, and injection conditions adapted to the experimental cores, is described in Appendix A.
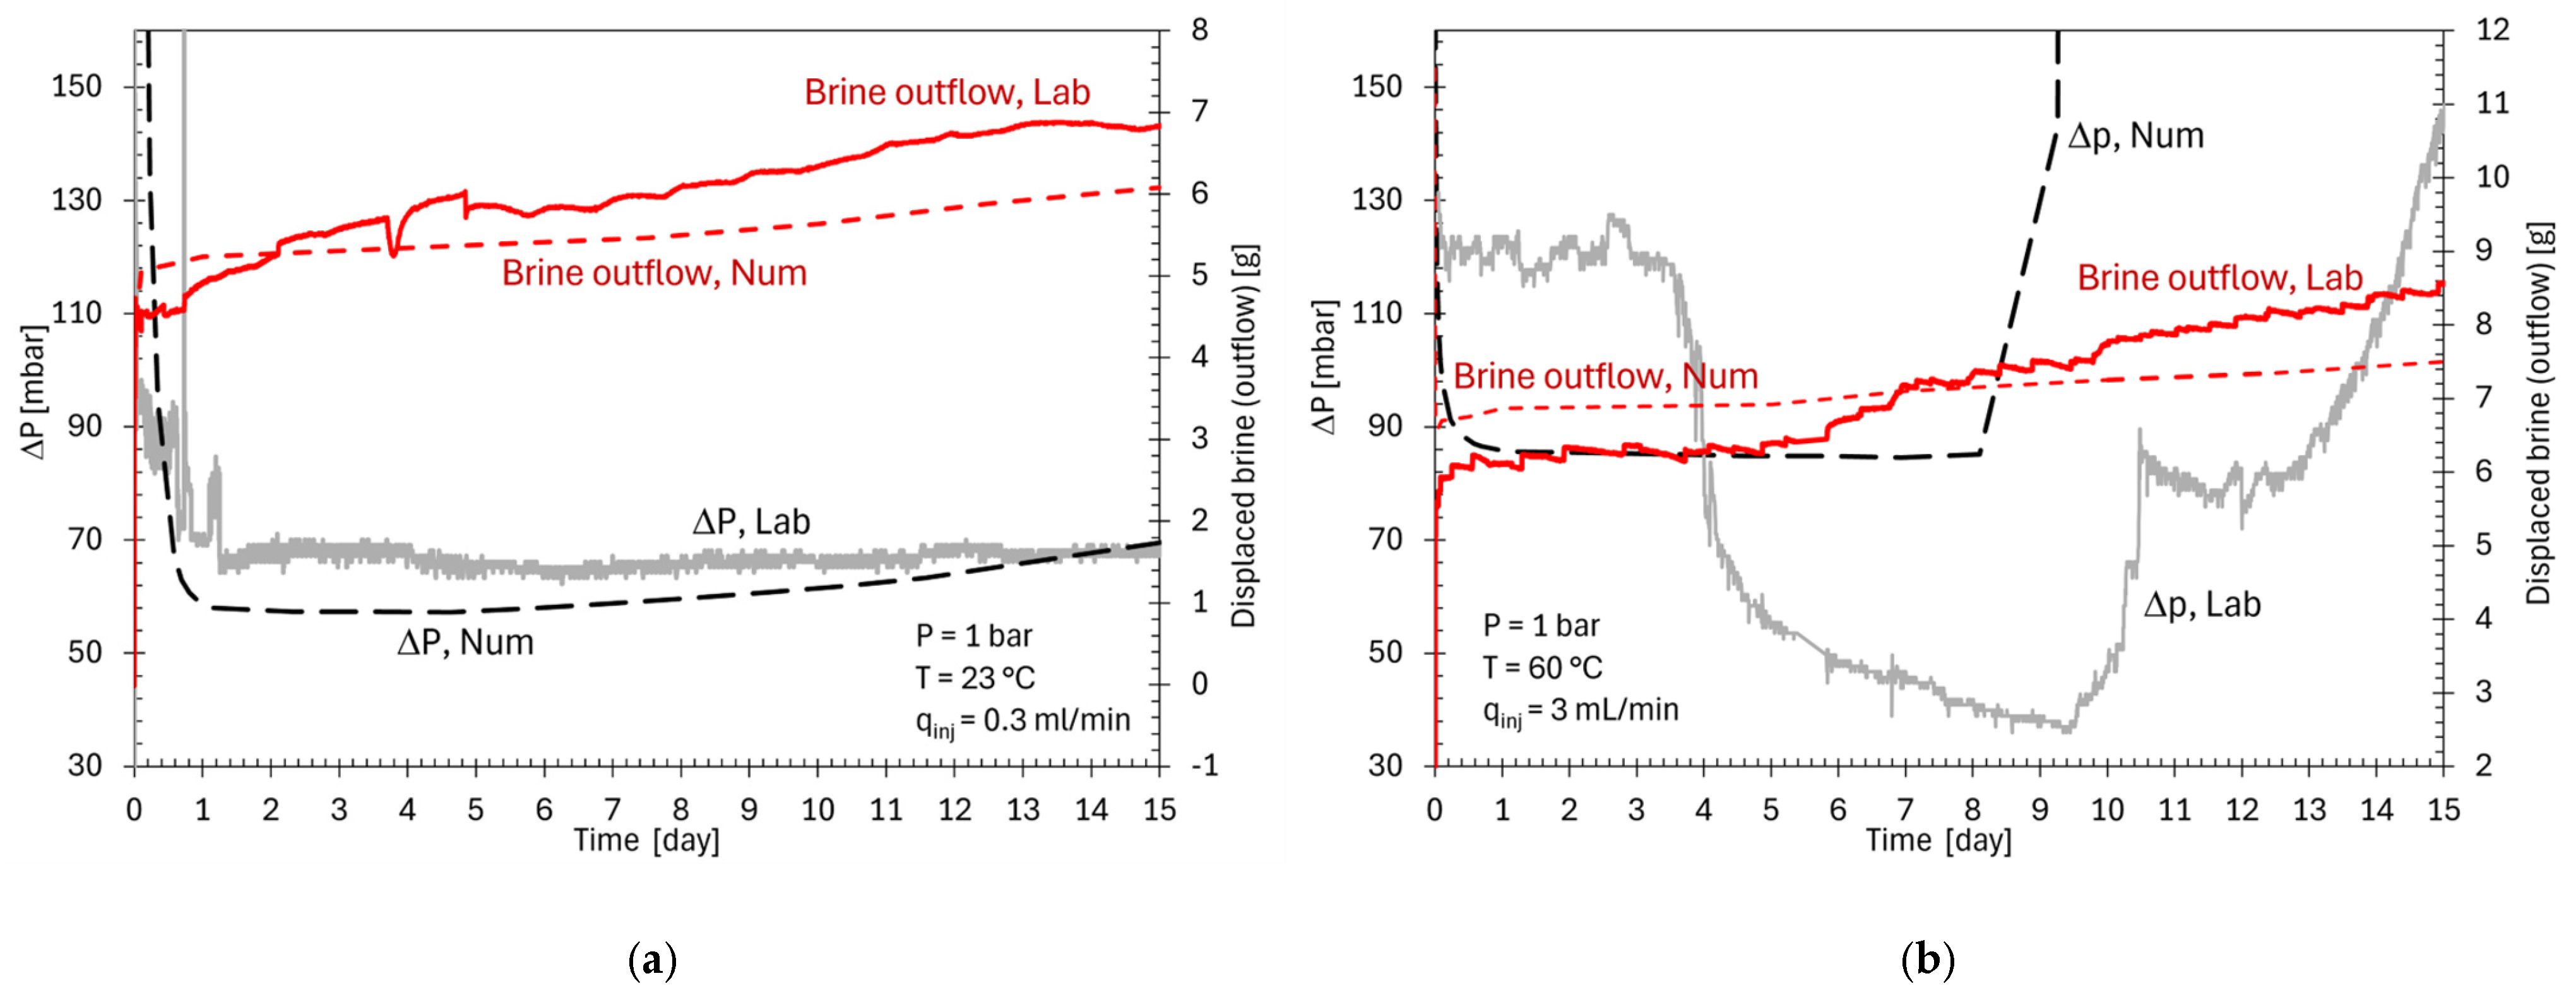
The results of two experiments conducted at atmospheric pressure are presented in Figure 5. In Figure 5a, a core coded TUF-4 with a porosity of 16.5%, fully saturated with a brine of 17.4 wt% TDS, and an absolute permeability of 30 mD was subjected to CO2 injection at a rate of 0.3 mL/min under atmospheric pressure, at a constant temperature of 23 °C. During the experiment, continuous brine displacement by CO2 took place without any significant indication of drying-out (DO) or salting-out (SO) effects in the pressure response. CO2 injection lasted for 25 days (approximately 1180 PV). Numerical simulations reproduced the experimental trends with acceptable agreement, capturing the initial increase in differential pressure and its subsequent stabilization. In Figure 5a the calculated differential pressure and brine outflow are compared with the experimental data. Although there is a slight difference in the values, the sudden increase in pressure is captured by the numerical simulation shortly after the commencement of the experiment. After this point, the differential pressure decreases as the relative permeability to CO2 increases. After approximately one day, the pressure slightly increases, whereas in the experiments the pressure stays approximately constant.
In the second experiment, temperature and injection rate were changed to 60 °C and 3 mL/min while maintaining atmospheric pressure. The results are depicted in Figure 5b together with calculated values as a function of time for this core TUF-5 with a porosity of 16%. In this experiment, CO2 breakthrough was detected after approximately 1 PV, indicated by a decrease in differential pressure, marking the onset of the DO phase. The brine displacement continued for approximately 2000 PV, after which measurable DO effects were observed. The SO phase began after approximately 9 days of injection (about 4600 PV), as indicated by an increase in differential pressure. Differential pressure increased exponentially during the SO phase and permeability decreased until full blockage. Permeability decreased due to increasing salt precipitation, and plugging of pores began after about 13.5 days of injection at about 7100 PV. Residual water saturation after core removal was measured at 38%. In this case, salt precipitation was clearly visible at the inlet of the core after removing the sample from the core holder. Since no precipitation was visible at the outlet side, it can be assumed that the SO effect is occurring/beginning near the inlet, as is also supported by numerical work. In the numerical modeling of the experiment, in addition to the adaptation of the core and injection characteristics, a capillary pressure curve was also assigned for the core. As can be concluded from Figure 5b, after an increase and decrease at the beginning of the experiment, a smooth and slight decrease in the pressure reflects the evaporation period. Unfortunately, in the experiment this period could not be captured properly, probably due to experimental limitations. The reduction in pressure is stronger and comes after a constant pressure period of 4 days. On the 8th day, the pressure increases suddenly with a good match with the experimental path, indicating the loss in permeability, potentially due to the salt precipitation.
It is important to note that the residual brine saturation at breakthrough is higher than typically expected for DGRs. Consequently, the DO and SO profiles observed in the laboratory cannot be directly extrapolated to field-scale DGR conditions. For TUF-5, high brine saturation at the beginning of CO2 injection results in higher injection times to observe the SO leading to permeability impairment. In the TUF-4 experiment, the injection time was probably too short to observe any SO. The numerical modeling of the experiments could mimic the results acceptably well and the next step of the numerical study focused on the missing aspects of the core flooding experiments for CGS in DGRs, namely the use of more realistic parameters such as lower residual water saturation and colder CO2 injection.
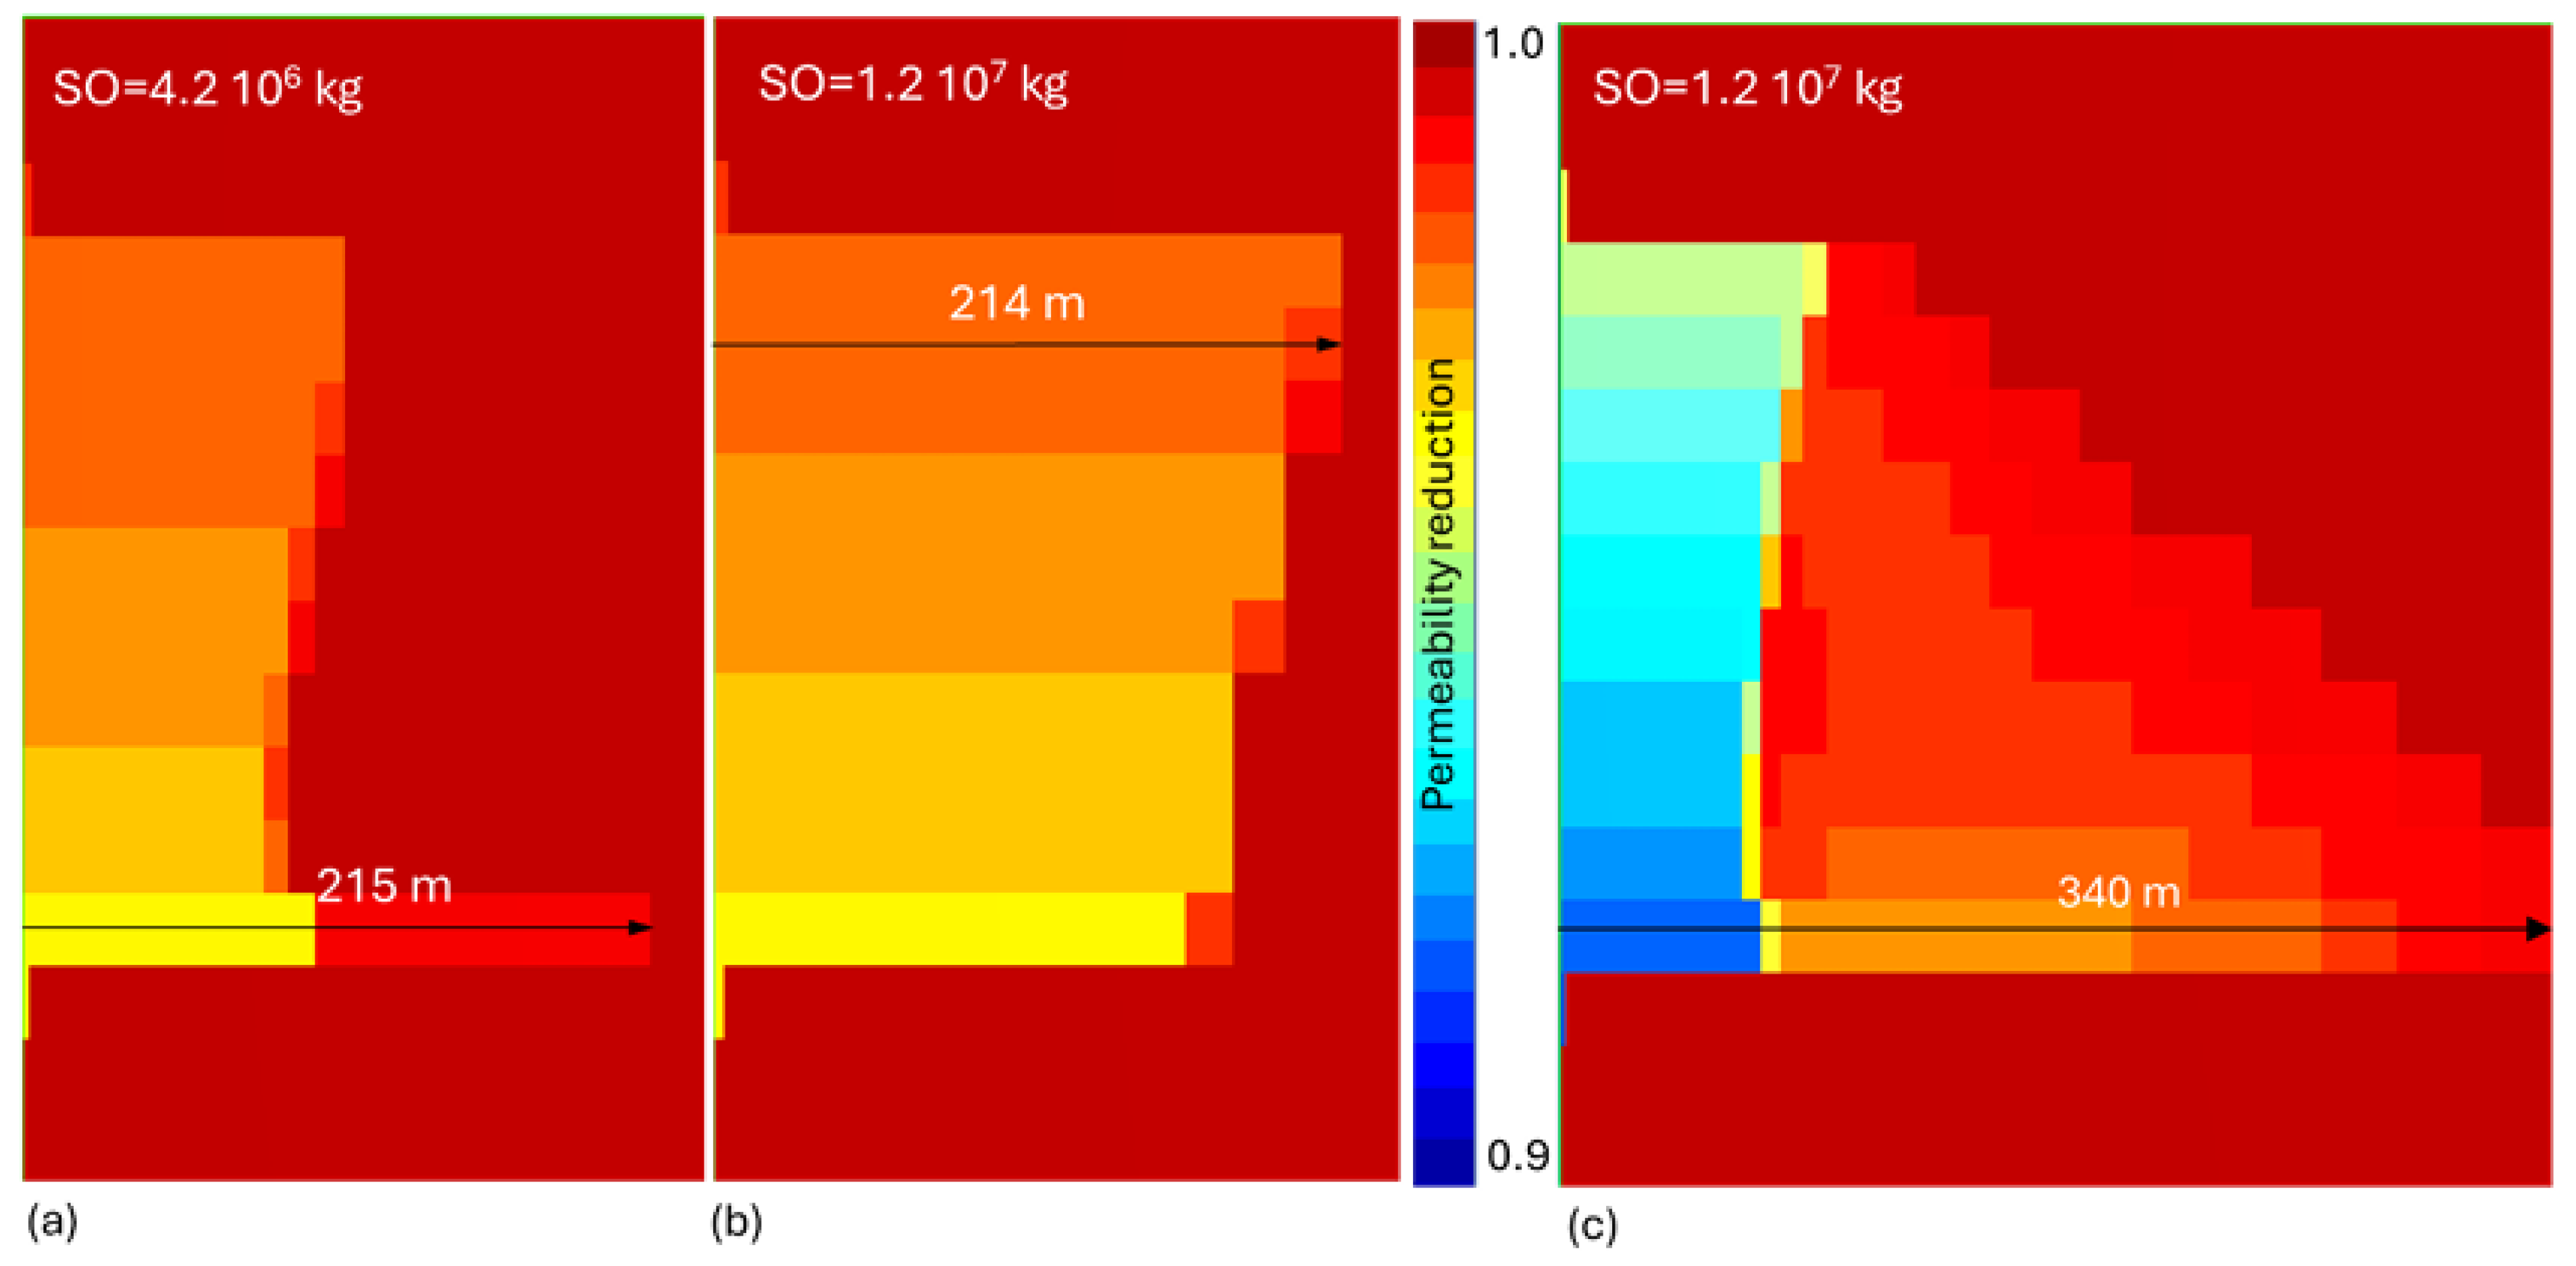
The model described in Appendix A was adopted accordingly. The initial brine saturation is set at 20 % and the salt concentration (NaCl) is assumed to be 20 wt%. For modeling permeability changes as a result of SO, the Verma–Pruess porosity–permeability model was used with parameters given in Table A1. The permeability reduction is expressed as the ratio of actual permeability to absolute permeability. Figure 6 illustrates the permeability reduction profiles in NWZ after ten years of CO2 injection for three different cases. The cold CO2 injection (10 °C) scenario (a) results in a substantially diminished extent and amount of salt precipitation compared to the isothermal case (b), where CO2 is injected at reservoir temperature. This result is consistent with the established scientific understanding that colder CO2 has a lower evaporation capacity compared to warmer CO2. The maximum permeability reduction is approximately 0.96 in both cases; however, the total amount of salt precipitated is different, being significantly higher in the isothermal case.
A third, highly conservative scenario was performed, assuming higher salinity (25 wt% NaCl) and initial brine saturation of 30 %. The parameters of the Verma–Pruess (VP [53]) model were also set to be higher (Γ= 0.7 and ϕ0 = 0.7 instead of Γ = 0.6 and ϕ0 = 0.6) to complete the conservative way of modeling. Even under these extreme conditions, no significant injectivity impairment was observed. The maximum permeability reduction was calculated to be approximately 0.92 with a total SO of 1.2 × 10⁷ kg in the model. Additionally, it was observed that salt accumulation in the confining layers may provide an auxiliary sealing effect, potentially enhancing containment.
It can be deduced from the calculated permeability reduction profiles that salt precipitation is not likely to be a significant issue unless there is a brine influx from the overburden and/or underburden formations. Cold CO2 injection is advantageous in terms of salt precipitation due to the reduced evaporation capacity of CO2. Salt precipitation can be an injectivity issue when using DGR for GCS for the higher brine salinities and favorable geologic (e.g., water influx from the boundaries), petrophysical (e.g., lower porosity and permeability as well as high capillary pressures), thermodynamic (e.g., favorable pressure and temperature) and operational practices (e.g., low injection rates or cyclic injection). Also susceptible are cyclic injection cases where the periodic back and forth movement of the brine can be a reason for increasing salinity and thus precipitation [50]. On the other hand, fines migration was concluded to contribute more to brine permeability damage if a significant amount of brine was found in the pores [32].

5.3. Hydrate Formation

As discussed, the additional J-T effect can significantly cool down the NWZ during CO2 injection. The key question is whether the thermodynamic conditions of the system enter the gas hydrate stability zone (GHSZ). CO2 hydrates in storage formations may include three more components: (i) the salt content of the formation water; (ii) the presence of the hydrocarbon gases, particularly methane (CH4), and potentially heavier hydrocarbon components in DHRs; and (iii) impurities within the injected CO2 stream. Numerous studies have investigated the phase behavior of clathrate hydrates and the thermodynamic conditions leading to hydrate formation [54,55,56,57]. Evaluation of the GHSZ typically involves determining the equilibrium dissociation temperature and pressure of hydrates in an isochoric system (e.g., [58,59,60]). In addition to laboratory studies, numerical models are proposed to predict the hydrate phase behavior under various conditions (e.g., [61,62,63]).
A comprehensive compilation of the experimental data on CO2 hydrate equilibrium conditions in water with various NaCl salinities, along with thermodynamic predictions, is provided by [64]. Their study demonstrates good agreement between predictions and experimental observation, confirming the reliability of the developed model. They report that, for dissolved CO2 systems, a decrease in system pressure and/or an increase in salinity favors hydrate formation by reducing CO2 solubility in the aqueous phase. This behavior contrasts with systems containing a free-gas phase, where higher gas pressures increase gas solubility and promote hydrate formation.
When CO2 is injected into a DGR, it can mix with natural gas (NG, which mainly consists of CH4). The formation conditions of CO2-CH4 mixtures have been investigated in several studies [57,65]. Zatsepina and Pooladi-Darvish (2012) compiled hydrate characteristics of CO2-CH4 mixtures and examined their influence on the storage capacity in DGRs and reservoir properties as well as operating conditions [66]. Horvat et al. (2012) investigated the kinetics of the gas hydrate formation and dissociation in CO2-CH4 systems, particularly in the context of CO2 sequestration in the form of its hydrates in natural methane (CH4) hydrate reservoirs, via CO2/CH4 exchange [67]. Eslamimanesh et al. (2013) provided numerical assessments of clathrate hydrate phase equilibrium data for CO2 + CH4/N2 + water systems [68].
Ballard and Sloan (2002) reviewed the modeling tools used to predict hydrate formation under various thermodynamic conditions [69]. They also introduced the CSMGem program, which uses the van der Waals and Platteeuw hydrate EoS, along with the classical thermodynamic formulations for hydrates in the HYDOFF program for clathrate hydrates in brine solutions with different salt levels [69]. Burgass et al. (2023) presented new experimental data for CO2 hydrates formed in the presence of aqueous solutions of NaCl over a wide range of temperatures, pressures and concentrations [64]. The developed model was subsequently validated using experimental data from a broad spectrum of temperatures, pressures, and NaCl concentrations, resulting in a successful outcome. A comparison was made between experimental results and predictions derived from the Simplified Cubic Plus Association Equation of State (sCPA-EoS) coupled with the van der Waals and Platteeuw solid-solution theory. The quality of the match was found to be excellent except for results pertaining to the highest salinity (25 wt%) solutions.
Studies addressing the effects of hydrocarbon gases and impurities in the CO2 stream on hydrate formation are comparatively limited. Based on experimental investigations of stability conditions of CO2, CH4 and C3H8 hydrates in various electrolyte solutions, it is demonstrated that anions exert a more significant influence than cations on hydrate stability [70]. As demonstrated by Oldenburg (2007), the presence of impurities, including N2, O2, H2, H2S, and CH4, can either promote or hinder the J-T cooling process, contingent upon the injection temperature [29]. This, in turn, affects the process of hydrate formation. Notably, SO2 behaves differently from other impurities due to its chemical reactivity in CO2-rich streams.
Yang et al. (2015) examined the occurrence of hydrate formation in wells during CO2 injection into SAs under conditions deemed representative of operational practice [71]. This investigation was conducted using laboratory-data-derived hydrate curves and commercial thermodynamic simulators to calculate hydrate formation curves for various brine salinities [71]. Their results indicated a low likelihood of hydrate formation in the wellbore due to the negligible water content of the injected CO2 stream. Yang et al. (2016) further studied CO2 hydrate formation and dissociation under the conditions of Toyoura sand, pure water, and saline solutions (1.5 wt%, 3 wt% and natural seawater) [72]. They did not observe significant kinetic inhibition of CO2 hydrate formation in the presence of salts. Sun et al. (2018) reported the solubility of CO2 in water in equilibrium with hydrates and compared it with reference data [73]. They demonstrated that elevated temperatures and reduced pressures impede the development of hydrates, thereby indicating that the presence of hydrates diminishes the dissolution of CO2 in water. Sodium chloride (NaCl) also plays an inhibitor role in the dissolution of CO2 and formation of CO2 hydrate in water, a conclusion made by earlier studies as well.
If the thermodynamic conditions in the NWZ fall within the GHSZ, hydrates may form and reduce the pore volume and therefore impair the injectivity. Although chemical inhibitors can be used to mitigate hydrate formation, the most effective strategy is to avoid the thermodynamic conditions that lead to hydrate formation and stability. While significant research has been conducted on the various thermodynamic conditions that lead to hydrate formation, hydrate formation under dynamic conditions representative of the NWZ during CO2 injection into DGRs and SAs remains insufficiently understood.
Ahmad et al. (2019) developed a coupled numerical simulator to analyze the CO2 hydrate nucleation process under varying P-T equilibrium conditions [74]. The results showed that the intrinsic permeability strongly influences pressure distribution, which in turn affects temperature evolution, hydrate growth rate, CO2 velocity, CO2 density, CO2 and H2O saturation, CO2 permeability, and interface boundary movement speed. Aghajanloo et al. (2024) emphasized the credibility of hydrate-induced injectivity impairment in a recent literature review, although experimental studies in porous media remain limited [75]. Mahmood et al. (2024) investigated CO2 hydrate formation in sandstone cores saturated with pure water at temperatures between 0 °C and 5 °C [76]. Experimental findings indicate that flowing CO2 at a Darcy velocity of 0.033 cm/s initiates hydrate formation within the sandstone core under dynamic pressures exceeding the minimum threshold required for static conditions. At temperatures changing from 0 °C to 5 °C, the observed hydrate-forming pressure changes from 1.87 to 2.5 times the pressure required for CO2 hydrates under static conditions. The minimum pressure required for CO2 to form hydrates is higher in dynamic conditions than in static conditions. Guo et al. (2024) conducted experiments in a sandstone core with a porosity of 24.5% and permeability of 116 mD [77]. The core temperature was controlled between 2 °C and 3 °C and CO2 was injected through the core saturated initially with water (salinity is not given, probably pure water). They also concluded that the pressure required to form hydrates is higher than the minimum pressure required to form hydrates in static conditions. They speculated that the shear rate effect of flowing fluids should slow down the growth of hydrate crystals or break down hydrate films, resulting in delayed formation of bulk CO2 hydrates. In a numerical study using a generic DGR for GCS, Indina et al. (2024) concluded that heat exchange with the underburden and overburden rocks mitigates hydrate formation in the multilayer case, resulting in a higher minimum temperature for hydrate formation [78]. They also reported that more hydrates and J-T cooling are observed at higher water saturations, and permeability reduction by hydrate formation amplified the J-T cooling and increased the amount of hydrates. However, no plugging is observed by either hydrates or ice in the sensitivity simulations. In their study there is no reference for the salinity used; therefore, no representative GHSZ for DHRs is used in their study. In a numerical study supported by laboratory experiments, Castaneda et al. (2025) found that the extent of the injectivity decline depends on the CO2 temperature at the inlet [79]. In the case of inlet temperatures falling within the hydrate stability zone, and given sufficient water presence in the reservoir, hydrates form immediately in the near-wellbore. However, in instances where the inlet temperature lies outside the hydrate stability zone, the formation of hydrates can occur in regions distant from the well. This phenomenon is attributed to the anticipated low temperatures resulting from the J-T effect within the reservoir, particularly in the vicinity of the injection well. They suggest that the interplay between the DO and temperature fronts is a critical factor in determining the ultimate saturation of the hydrate within porous media. In circumstances characterized by higher rates of evaporation, the development of a cold temperature front is observed to occur after the initial stages of hydrate formation, thereby reducing the likelihood of hydrate formation.
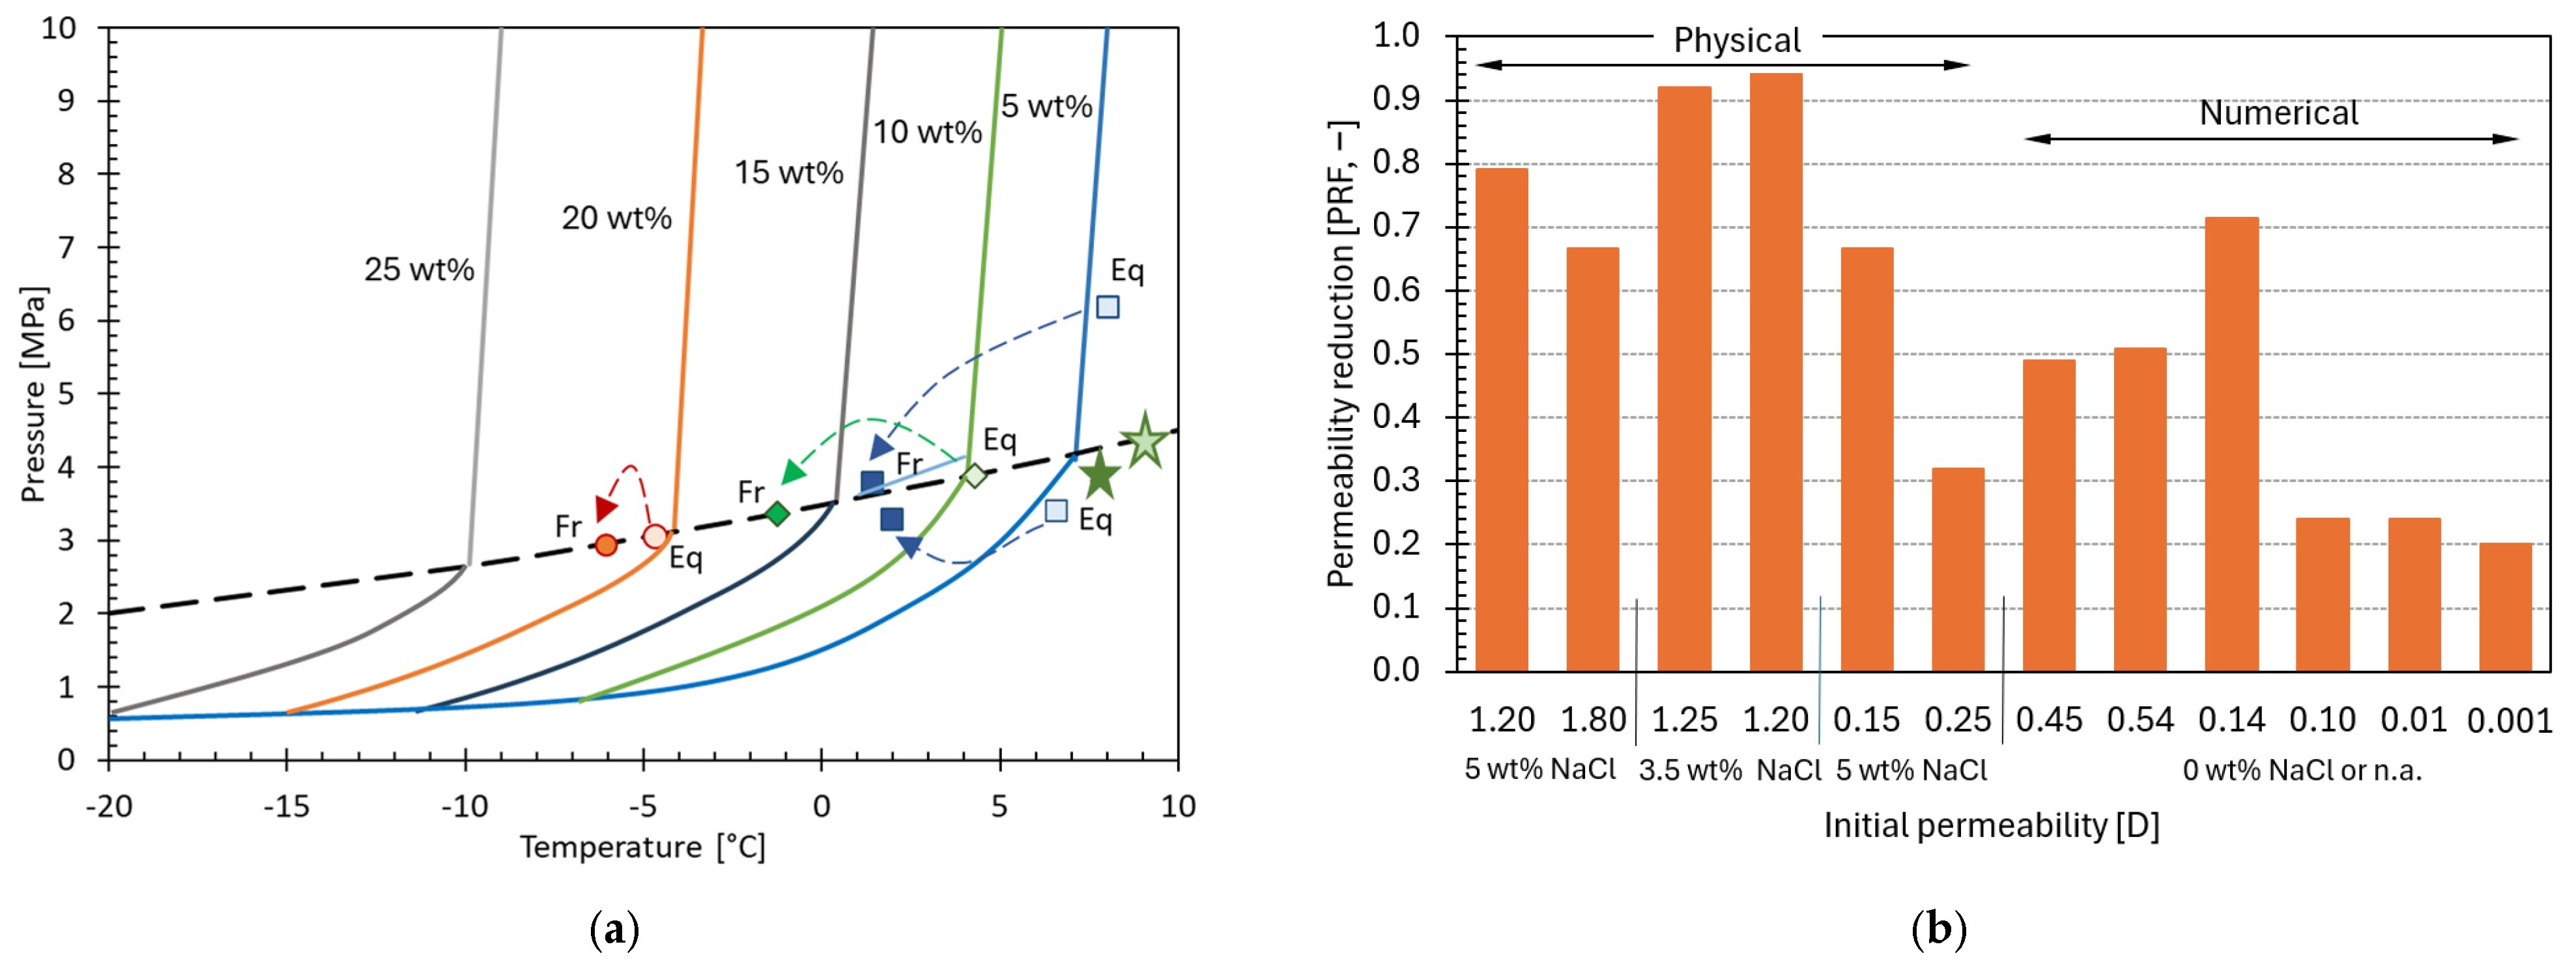
To conclude the discussion on the potential for hydrate formation in GCS operations in DGRs and its implications for injectivity, the two plots in Figure 7 are helpful. Figure 7a depicts the CO2 GHSZs for various NaCl salinities based on experimental data from previous studies. The same figure also shows a couple of data points for a CO2-CH4 mixture to illustrate the effect of CH4 as a component of the system. Figure 7b shows the permeability reduction factors (PRF = actual permeability/absolute permeability) from this study and various others, which are the results of physical and numerical hydrate formation experiments in porous media. As can be seen in Figure 7a, GHSZ shifts toward lower temperatures with increasing brine salinity. It can also be concluded from the same figure that a CO2-CH4 mixture can form hydrates at a higher temperature for a given salinity, a result also supported by recent studies (e.g., [57]). Figure 7b shows the effect of hydrates on the reduction in permeability as a function of initial permeability and thus on impairment of injectivity. As the physical and numerical experiments depicted in the figure were performed under different conditions, a quantitative conclusion is not possible. However, the harmful impact of hydrate formation on injectivity is evident. It can also be concluded from the figure that cores with lower initial permeability experience a greater reduction in permeability. Our experience, supported by the literature, shows that the GHSZ shifts to lower temperatures (to the left) and dissociation to higher temperatures (to the right) in porous media compared to batch experiments. This may be due to heat exchange with the surrounding rock and gas molecules diffusing slowly through the porous medium. It takes longer for hydrate to form in porous media because of kinetic shifting.
Safe application of GCS projects in DGRs is guaranteed with an operation outside the modeled GHSZ if the required parameters, including pressure (P), temperature (T), water salinity, and the concentrations of impurities such as air, nitrogen (N2), and oxygen (O2), are known. Firstly, this necessitates a reliable prediction of the thermodynamic conditions at the bottom of the well and in the NWZ. It should be noted that the impurities, including the CH4 component, do not significantly affect the potential in situ hydrate stability zone of CO2, but rather the brine salinity; the higher the formation salinity, the smaller the GHSZ. Dissolved salt not only decreases the temperature at which hydrates form, but also the amount of hydrate formed from a given volume of water, as a smaller number of water molecules are available for gas hydrate formation at higher salt concentrations. Assuming that the thermodynamic conditions at the NWZ ensure the GHSZ for a given brine salinity, water is needed for CO2 hydrates to form. This may only be feasible at the start of injection, when the CO2 cannot yet evaporate the remaining water. On the other hand, evaporation of water increases the brine salinity, meaning the GHSZ becomes smaller and the thermodynamic conditions for hydrate formation become tighter. A similar argument applies to the presence of NG: CO2 displaces NG, which consists mainly of methane (CH4). This eliminates the negative effect of CH4 on hydrate formation. Our experimental data, as well as measurements from the literature, confirm the reliability of existing numerical models, which can be used to predict the GHSZ of CO2 under given conditions. However, it is worth noting that most of these models calculate GHSZ based on hydrate equilibrium data, whereas our experimental work concludes that hydrates form at a later (cooler) stage. If hydrate formation is anticipated despite operational precautions, selected chemical inhibitors may be employed as a mitigation strategy (e.g., [80]).
Figure 7. (a) Pure CO2 GHSZ at different water salinities derived from various studies (Eq: equilibrium; Fr: formation); hydrate equilibrium and formation of CO2−CH4 mixture (90–10% mol) in 10% NaCl salinity brine shown with stars (derived from [64,81]). (b) Permeability reduction (PRF = actual permeability/absolute permeability) due to hydrate formation, as observed in this study and supported by various other studies (data from [74,75,76,77,78,79]).
Energies 19 02548 g007

6. Containment: Caprock and Well Integrity

DHRs are generally considered favorable from a geomechanical perspective because their related behavior and properties are well understood and characterized during depletion. However, as discussed in previous sections, thermally induced hydraulic fracturing has the potential to create new fractures, or activate existing ones, in various shapes and sizes, in caprocks. There is also a risk to well integrity, especially in legacy wells, where there is greater uncertainty about the quality of the bonding between the well and the formations. These pathways could allow CO2 to leak from the reservoirs, endangering the integrity of the containment system. Consequently, failures involving fault/fracture initiation and/or reactivation in well–cement formation coupling and caprock, as well as induced seismicity and surface uplift, should be considered major geomechanical issues. Routine risk assessments should be conducted prior to GCS operations in DHRs to investigate these issues.

6.1. Caprock Integrity

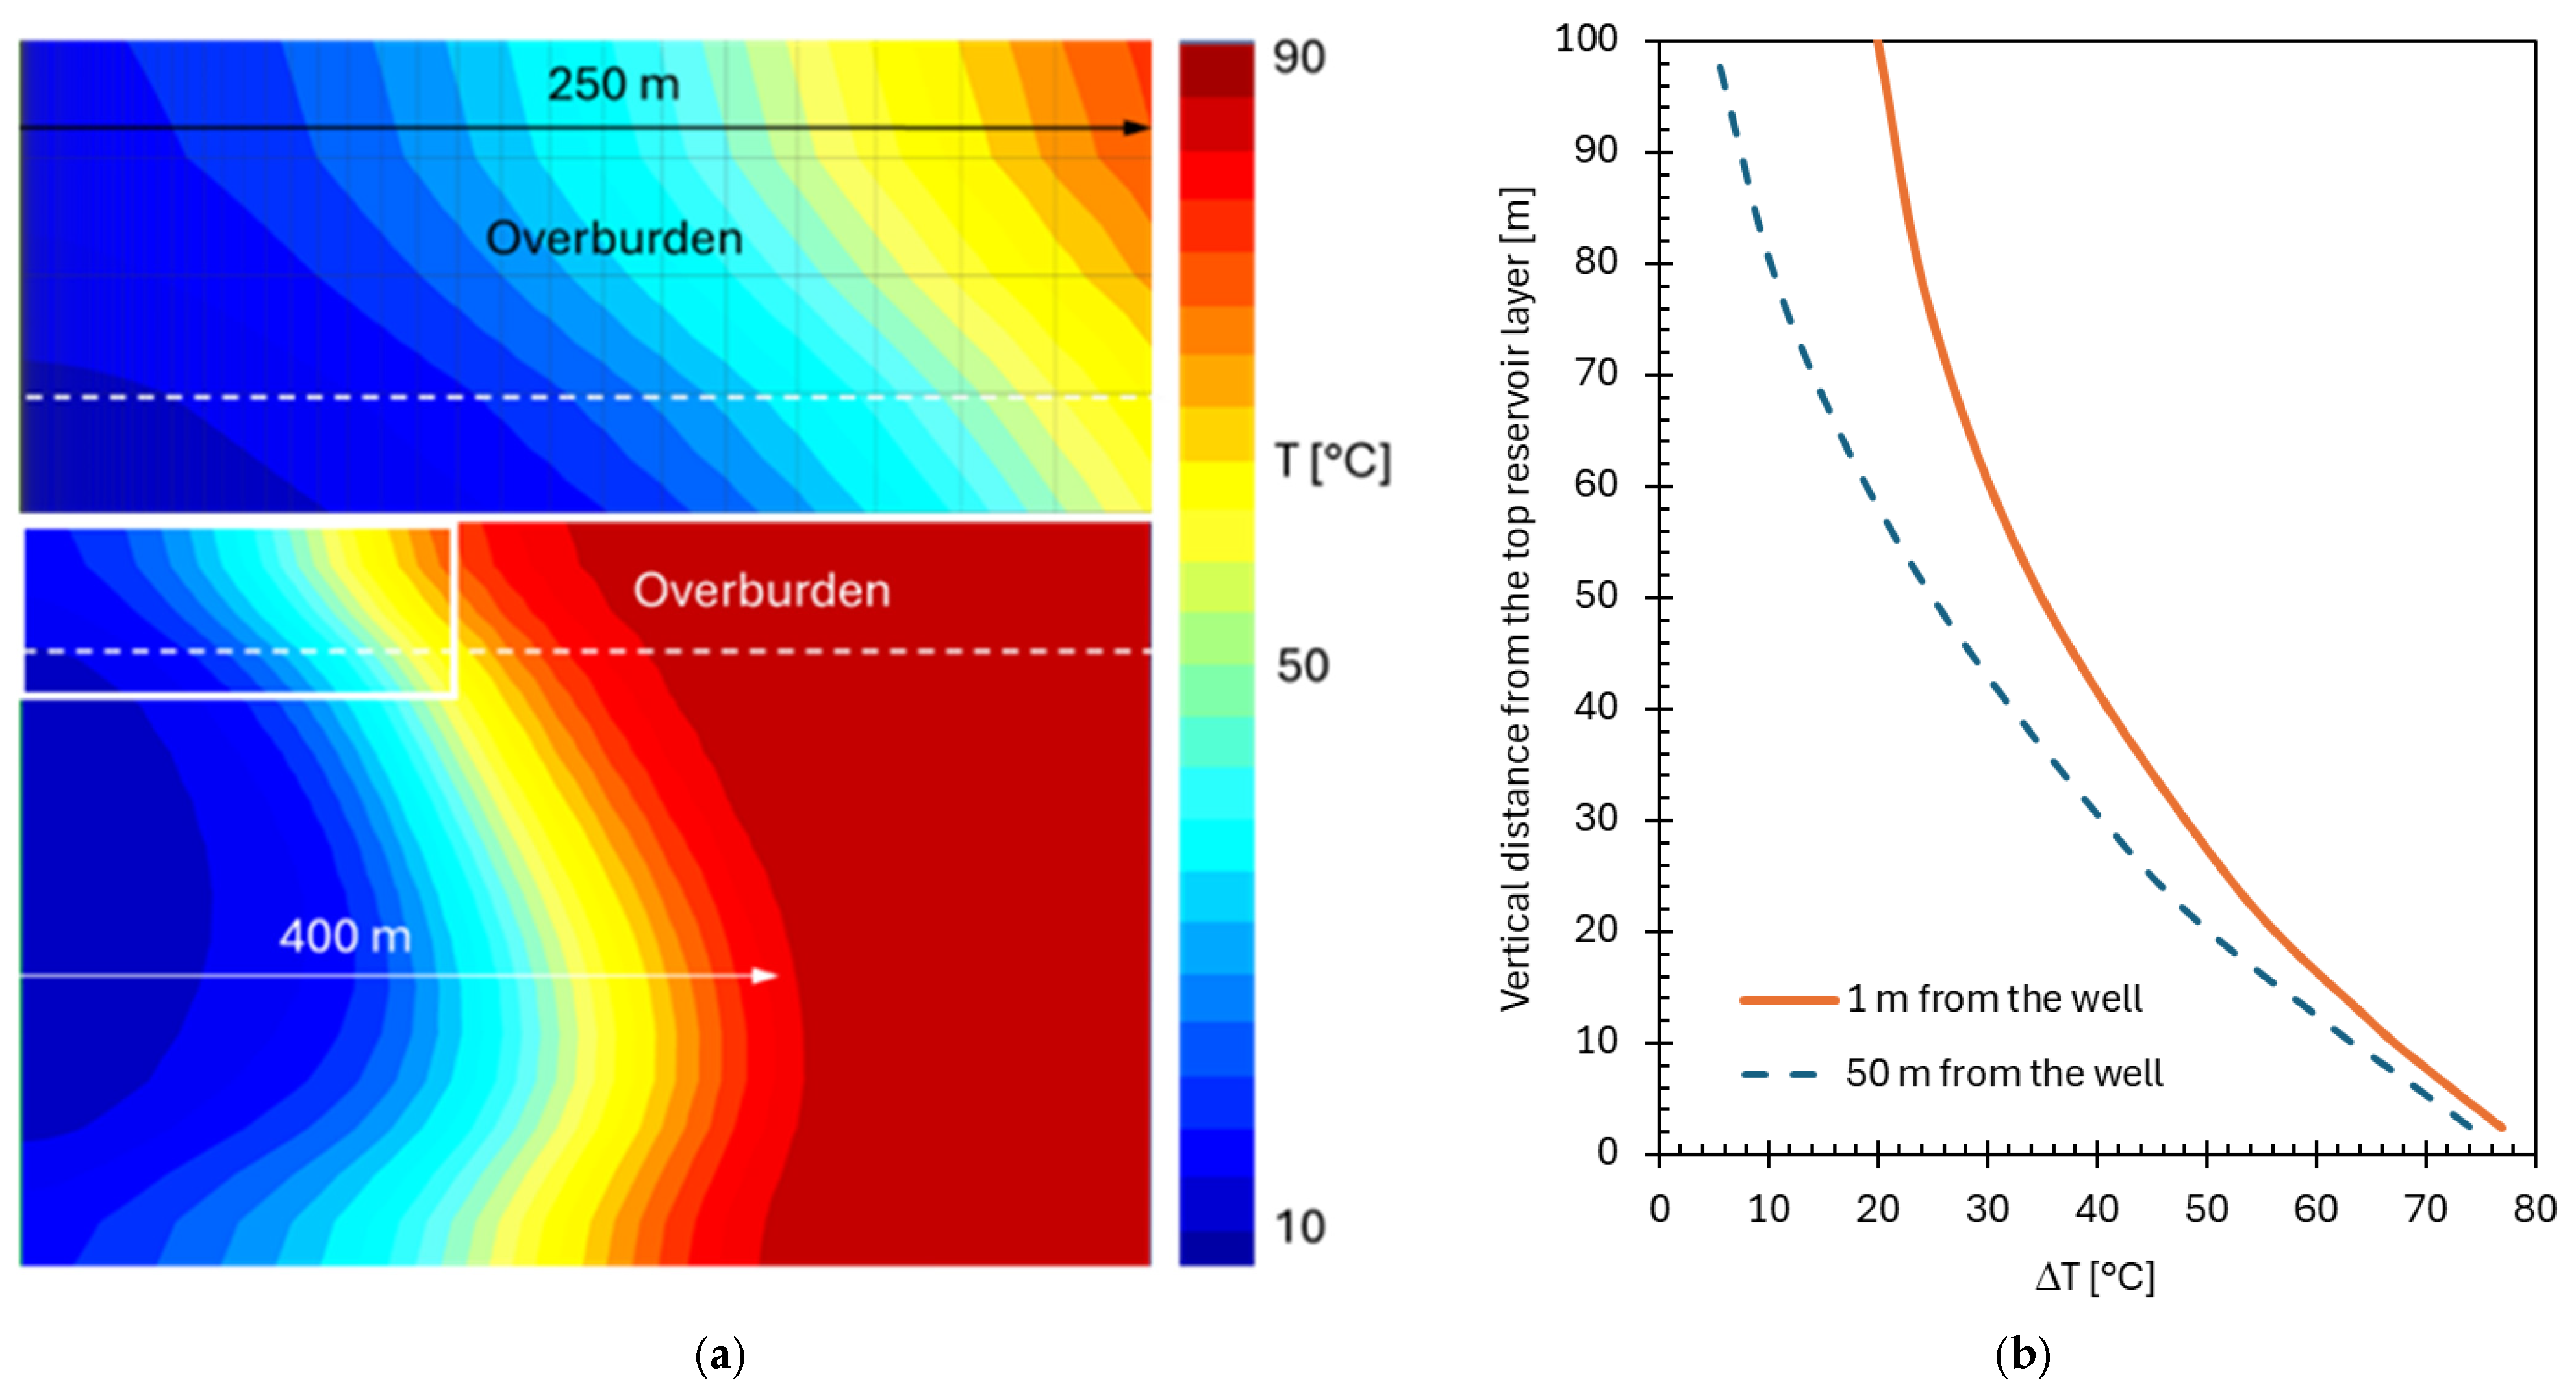
As can be seen in the bottom picture of Figure 8a, the temperature distribution in the reservoir of the model (see Appendix A for its characteristics) shows a cooled region extending around 400 m from the wellbore within the reservoir. After 20 years of injection, temperatures in this region reach a minimum of 10 °C (the injection temperature). Figure 8a shows the extent of cooling in the overburden for the upper part of the model, which is framed and has a length of 250 m. Figure 8b shows the cooling profiles of two block columns positioned 1 m and 50 m from the well, respectively, as a function of the vertical distance from the reservoir top, calculated with an extended model with a thicker caprock (100 m). This analysis shows that after 20 years of injection, the temperature of the block located 50 m from the wellbore reaches its original temperature approximately at a height of 100 m from the reservoir (ΔT = 5 °C). In contrast, at the same depth, the block located closer to the wellbore (1 m) is observed to reach a temperature of around 70 °C at 100 m above the reservoir (ΔT = 20 °C).
The above-described cooling process could affect the integrity of the caprock, albeit potentially to a lesser extent than the reservoir, given its thickness and its petrophysical, geomechanical and thermal properties. Various studies investigated this issue, primarily in cases of SA as GCS. Gor et al. (2013) conducted a study on the impact of varying CO2 injection temperatures on the integrity of caprock formations in SAs, using a thermo-poromechanical simulation approach encompassing multiple phases [82]. They demonstrated that injecting CO2 at a temperature below the ambient value in the formation over several years can result in tensile or shear failure of the caprock due to stresses above the horizontal injection well. They also indicate that injecting CO2 at a temperature close to the ambient temperature of the aquifer substantially mitigates the risk of caprock fracturing and, consequently, potential leakage. Vilarassa and Laloui (2016) demonstrated through numerical modeling that the caprock generally remains stable following the long-term injection of liquid (cold) CO2 [83]. Injecting a constant mass flow rate of CO2 through a vertical well was shown to enhance caprock stability during the initial injection phase, particularly within a normal faulting-stress regime [83]. This enhancement is attributed to stress redistribution induced by thermal changes, which partially offsets that caused by fluid overpressure. Even when its stability declines, the caprock never becomes less stable than it was prior to injection. They indicated that highly rigid caprocks might be a cause for concern when approaching failure conditions due to contraction of the rock. However, their findings demonstrate that caprock stiffness exerts minimal influence on stability. Thompson et al. (2021) conducted a case study for the Northern Lights CCS project to assess the thermomechanical impact of CO2 injection on the caprock [84]. While the undrained effects do indeed induce a more complicated response in stress changes in the caprock, they demonstrated that they do not necessarily lead to unfavorable tensile conditions. It is possible that they may lead to increases in effective stress, which would contribute to confidence in the integrity of the caprock/seal system.
Cordero et al. (2024) demonstrate, using coupled hydraulic, mechanical and thermal numerical models, that in the isothermal scenario, reservoir expansion occurs due to increments in pore pressure resulting from fluid injection [85]. In the non-isothermal scenario, i.e., reservoir cooling, compaction rather than expansion occurs throughout the cooled region of the reservoir despite the injection. In this case, thermal behavior dominates the coupling mechanisms within the thermally disturbed region. Outside this region, the reservoir undergoes subtle expansion due to the low-pressure buildup from injection. The instantaneous drop in temperature induces a significant increase in deviatoric stresses within the reservoir and on the caprock, reaching critical levels and potentially causing plastic deformations. This compromises the containment integrity of the reservoir. In a recent study, Chatterjee et al. (2025) addressed the direct impact of thermally induced stresses on the integrity of the caprock in DGRs for CCS projects [86]. Assuming that the caprock experiences the same level of cooling effect as the reservoir, the fracture pressures of the reservoir and caprock (considering the effects of thermal stress) were estimated at the well location at the start and end of the injection stage. The analysis concluded that, when considering the effects of thermal stress, the storage layer pressures did not exceed the fracture pressure values of the caprock. The 5% uncertainty associated with the 1D geomechanical modeling (which was carried over to the γhmin modeling) was also considered. It was concluded that the caprock’s integrity is still maintained.
As the above discussion and literature excerpt show, thermal stress does not pose a significant threat to the integrity of the caprock unless it is initially disturbed by faults and fractures that are ready to be activated. Another noteworthy point is that, in DGRs, the CO2 plume migrates through the bottom of the reservoir because it is denser than natural gas. This means that its contact with the overburden is reduced, which limits the impact of cooling on it. Provided that geomechanical parameters remain within defined limits, any issues with the caprock are likely to be minor. Nevertheless, thermal stresses should be considered in the standard reassessment of the DGR caprock prior to GCS, preferably using coupled modeling supported/calibrated by laboratory data. The situation may change near the wellbore. This phenomenon may be particularly evident in legacy wells used for cold CO2 injection, where well integrity can be compromised.

6.2. Well Integrity

Maintaining the integrity of wells is critical to the success of all GCS operations. Numerous studies have investigated this issue, focusing especially on whether the legacy wells of the DHRs can be used for GCS. Iyera et al. (2022) investigated the operator experiences and site characteristics related to well integrity, monitoring methods, and risk assessment of legacy wells [87]. The relevant literature was also reviewed and summarized to provide context for the survey responses and to identify areas where field experience of well integrity aligns or does not align with the current state of research. The primary concern among the topics covered in the survey was material degradation in CO2 wells, as CO2 reacts with most well materials and components. Nguyen et al. (2023) provided a fundamental overview of the degradation of well cement and the integrity of wellbores in geological CO2 storage [88]. The review primarily focused on changes in the mechanical, thermal and chemical properties of cement, as well as corrosion onset and progression, based on experimental and simulation studies during geological CO2 storage. However, the debonding at the casing/cement or cement/formation interface has not been thoroughly addressed in the literature. Srimannarayana et al. (2023) mention that cement sheath stability throughout well workover, production, and intervention is crucial for successful field operations [89]. Bazaid et al. (2024) stated that microannuli may form in the casing/cement and/or cement/formation interfaces for several reasons [90]. Among these reasons are variations in temperature or pressure during or after the cementing process, poor mud removal from the casing wall, differences in hydrostatic pressure during cementing and logging operations, the volumetric behavior of cement against formations during the setting process, and overlapping pipe sections [90]. These microannuli may be filled with either liquid (i.e., a wet microannulus) or gas (i.e., a dry microannulus). If the effects of microannuli on cement logs go unnoticed, this can lead to incorrect assessments of the condition of the cement, which in turn can result in unsuccessful and expensive intervention efforts.
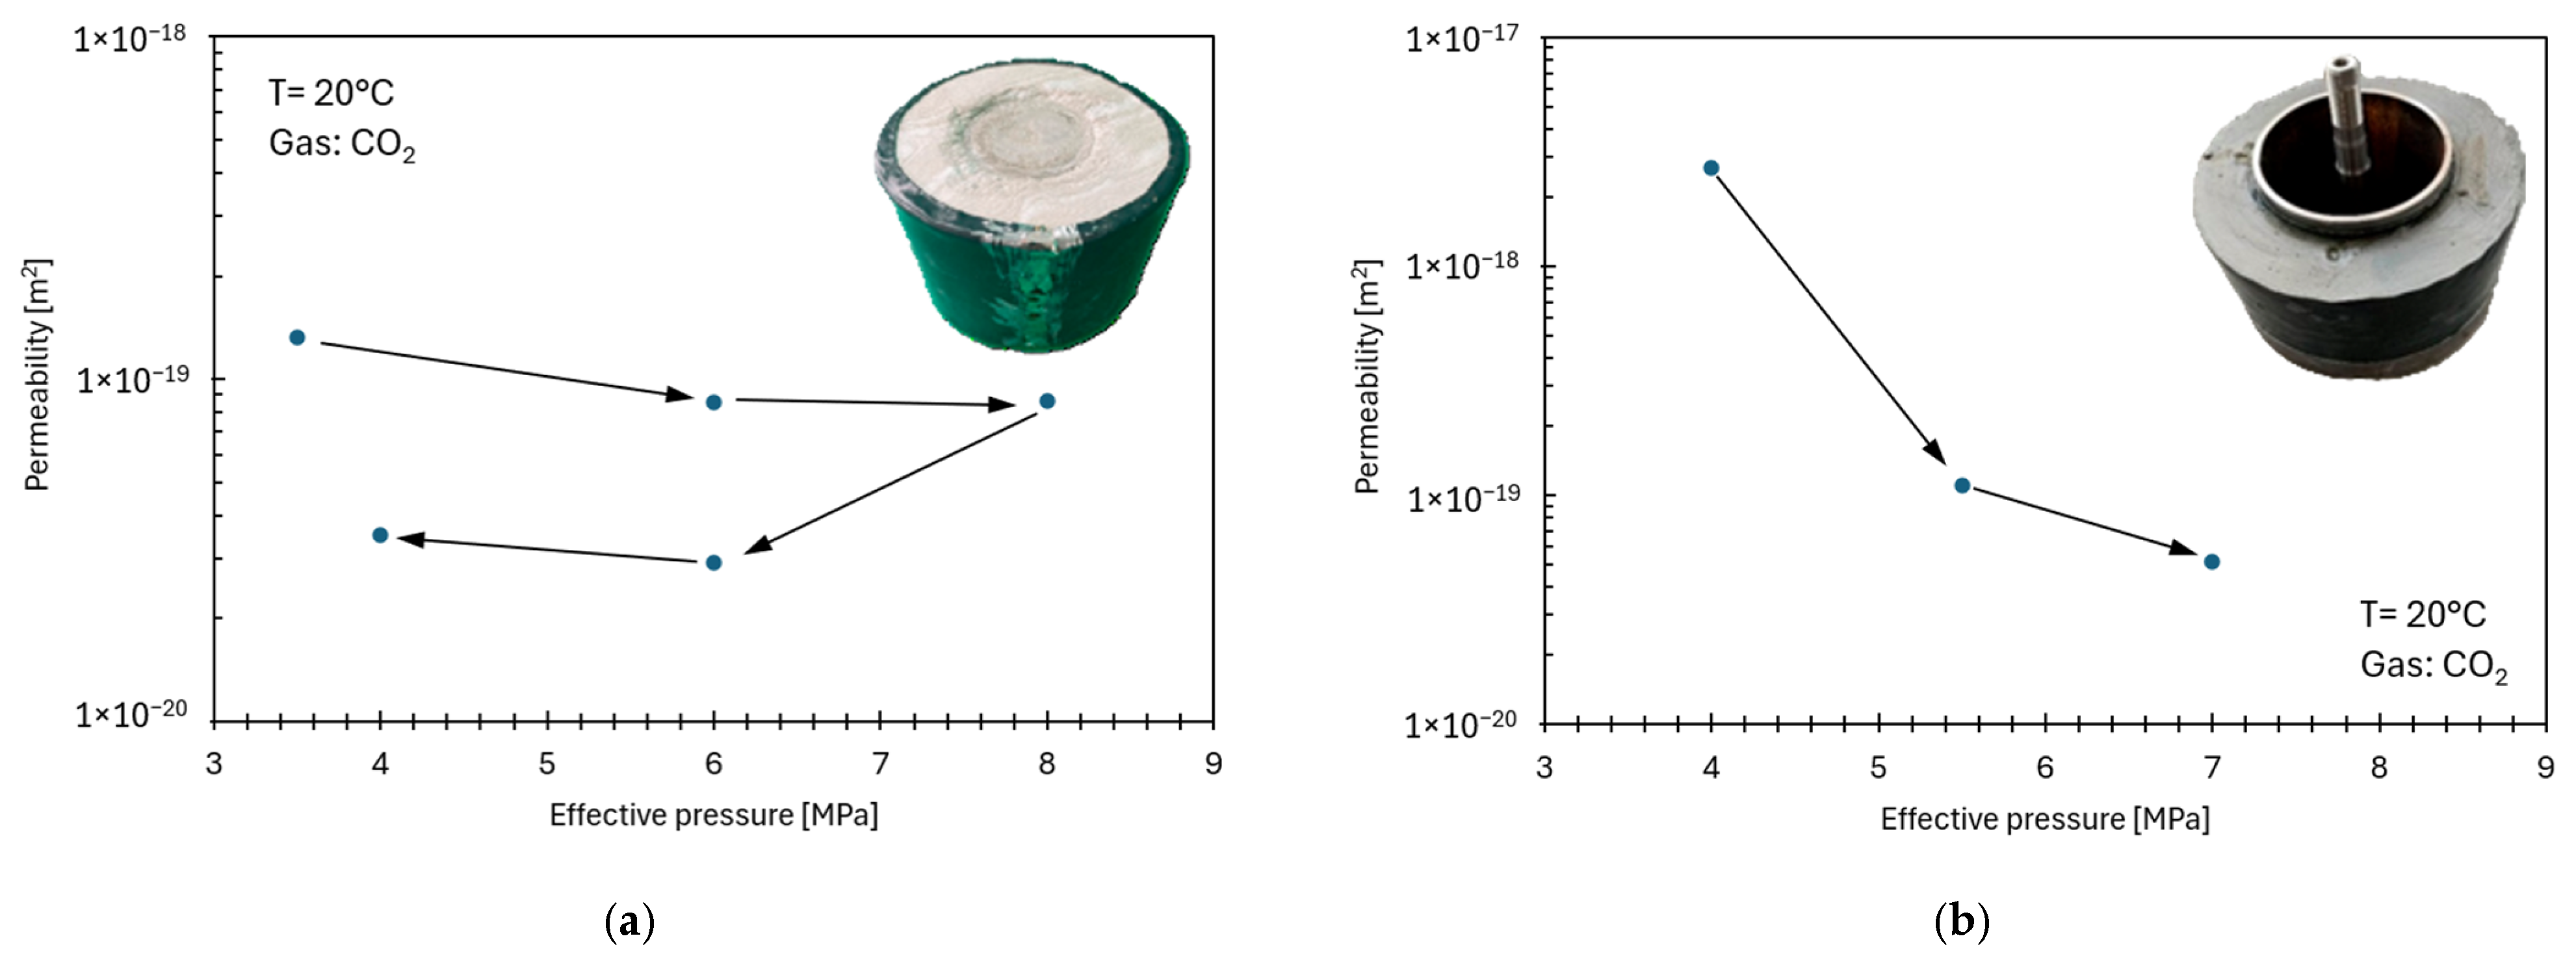
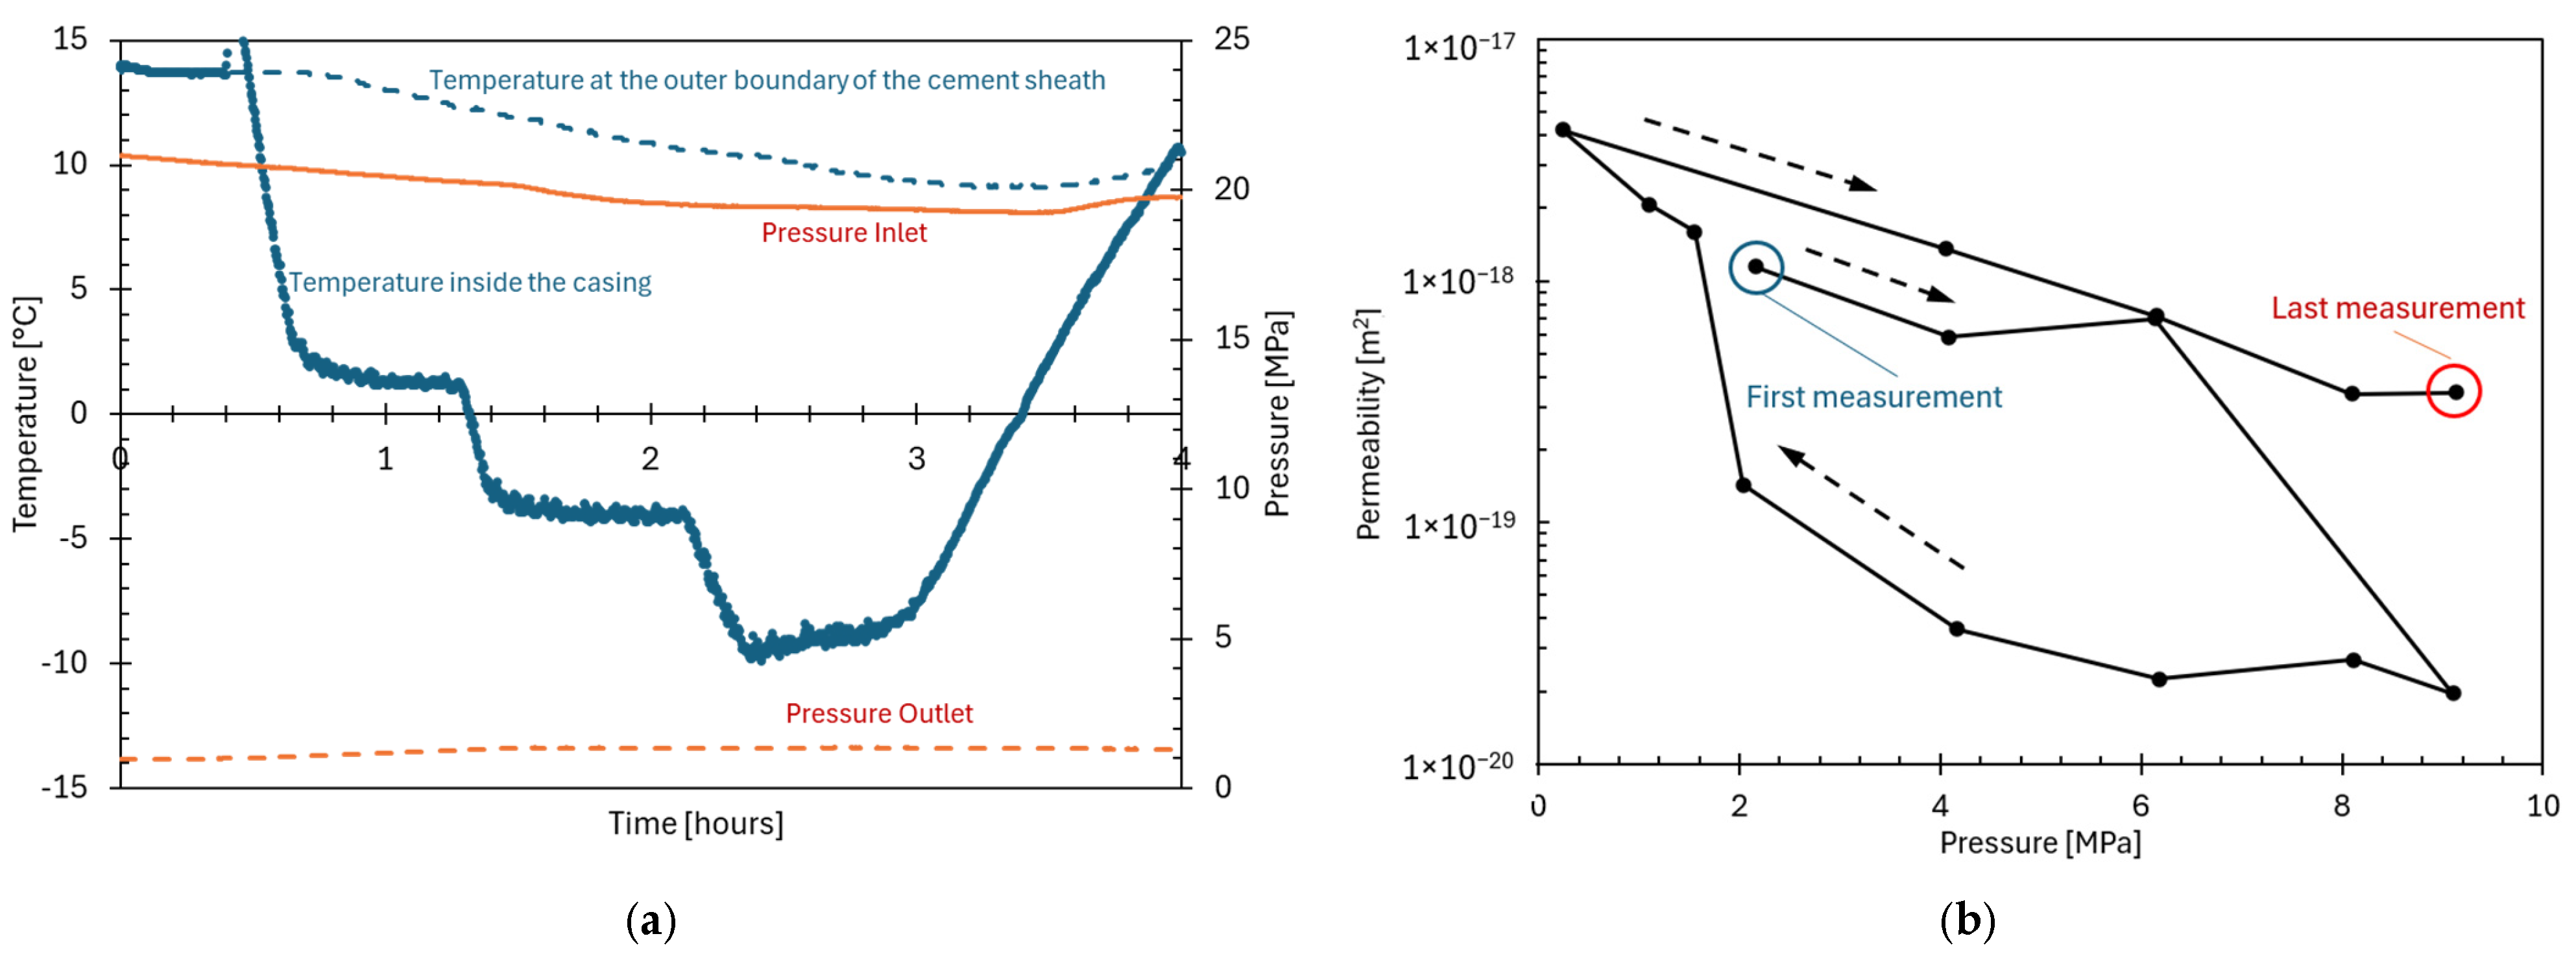
The well barriers, consisting of the rock formation, casing, cement, and the interfaces between these components, are particularly susceptible to strong pressure and temperature cycling, as well as to low temperatures [91,92]. Therefore, it is crucial to understand the relationship between operational choices made during CO2 injection into depleted reservoirs and the risk of well integrity breaches. The temperature difference between the cold CO2 and the warm reservoir, together with the varying thermal properties of the wellbore casing, cement, and lithology, will put stress on the environment near the wellbore. This may result in the formation of new pathways or the extension of existing defects, creating leakage pathways from the storage reservoir to the overburden. Furthermore, during periods of injection interruption, whether due to shutdowns or the necessity for cyclic injection, heat transferred from the host rock may subsequently raise the wellbore temperature. Temperature fluctuations have been shown to induce additional stress in wellbore components, thereby reducing the critical pressure required to initiate fractures.
In the cases of discontinuous injection of CO2—as is often the case during the initiation phase of GCS field projects, due to factors such as inconsistent availability, scheduled maintenance, unanticipated responses and unscheduled events in the vicinity of the wellbore (e.g., salt precipitation or hydrate formation)—there is an increased risk of interrupted and resumed (cyclic) operations. Most studies and projects today focus on the challenges of maintaining wellbore integrity and the effects on the NWZ when CO2 is injected continuously. Much less investigated and understood are the challenges associated with CO2 injection in a cyclic (intermittent, fluctuating or pulsed) mode. This can also lead to problems such as casing failure, cement sheath degradation and leaks. Therefore, it is crucial to understand how cyclic pressure and temperature affect well integrity to ensure reliable well systems. Figure 1 shows the different ways that liquid can seep out of an injection well. These pathways extend from the storage formation to the wellhead, passing through the annuli as well as through damaged cement, which is caused by the initiation, propagation and deformation (opening and closure) of fractures resulting from thermal and pressure cycling similar to the challenges of continuous injection.
As previously discussed, the formation of thermo-hydraulic fractures depends on the extent of the reservoir’s cooling. The formation and/or opening of fractures may influence the NWZ, resulting in a decline in bottomhole pressure (BHP) and enhancing the reservoir’s injectivity. In recent years, the entire wellbore section has been investigated under reservoir conditions [92,93,94,95,96,97,98]. Recent studies have focused on the impact of pressure cycling on the integrity of cement in the internal casing [94,95]. Shadravan et al. (2015) subjected a down-scaled casing–cement model to high-pressure, high-temperature (HPHT) conditions, and found that the cement failed after a certain number of cycles, depending on the applied pressure [96]. However, it is difficult to replicate these conditions in CO2 injection wells, particularly in depleted reservoirs. The effect of freeze–thaw cycling on wellbore integrity has only been reported in a few studies. Todorovic et al. (2016) conducted pioneering research in this area [97]. They performed thermal cycling on a dry casing–cement–sandstone composite within a temperature range of 19 to 58 °C. The results obtained through CT scanning revealed no significant changes to the cement. The results were consistent when a wet composite was subjected to −40 °C during the cooling process. Simulations indicated relatively low thermal stresses at the casing–cement interface, ranging from 0.5 to 1.0 MPa.
Roy et al. (2016) used a combination of physical experimentation and simulation-based methodologies to analyze the thermomechanical behavior of well barrier materials when subjected to thermal cycling [98]. The objective was to determine the occurrence of fracturing or debonding, the location of these defects, and their prevalence or extent as a function of applied thermal cycles and time. The experiments were performed using downscaled wellbore samples consisting of a steel pipe cemented inside a hollow sandstone cylinder. X-ray CT was used to visualize the effects of thermal cycling and determine the extent of fracture. The experimental results showed no detectable change in the existing pore volume of the sample within a temperature range of −50 °C to 80 °C. However, the results of the numerical simulations suggest that large thermal stresses may develop inside the materials during the heating/cooling stages, which could lead to radial fractures or debonding. The data gathered from these experiments and simulations can be used to determine the optimal temperature range for minimal impact on well integrity. Hosking and Zhou (2024) developed simulation scenarios to determine the initiation and development of damage to the well interface for intact wells and wells with an initial defect in the form of a 45° de-bonded azimuth [44]. Each well, both intact and defective, was subjected to a 30-day simulation involving the injection of CO2 at various temperatures. In the circumstances under consideration, tensile radial stress was observed to develop at both the casing/cement and cement/formation interfaces. Hoop stress in the cement sheath exhibited a persistent compressive strain after a 30-day period, albeit with a diminished magnitude at the lower injection temperature. This finding suggests that as the injection temperature is reduced, there is an increased probability of tensile stress and radial cracking. Damage was observed in two of the four scenarios evaluated: the intact and defective wells at an injection temperature of 10 °C. This damage was limited to the casing/cement interface and did not extend to the cement/formation interface. The inclusion of the pre-existing defect resulted in earlier damage initiation at 2.75 days compared to 4 days and produced a microannulus with a peak aperture over twice as large at 0.077 mm compared to 0.037 mm. The significance of these findings lies in their underscoring the necessity of accounting for initial defects and damage evolution when investigating the integrity of CO2 injection wells. Sun et al. (2024) performed a numerical study to investigate the role of CO2 injection temperature and pressure based on a 3D coupled thermal–hydromechanical model of the formation/cement/casing system [99]. The study makes use of the publicly available Northern Lights project dataset. Cyclic thermal loading was simulated and the results showed that no debonding occurred at the cement/casing or cement/formation interface during the cooling and heating phases. This indicates that high in situ effective horizontal stresses mitigate the negative impact of thermal stresses on wellbore integrity.
In the context of GCS operations, the reactivity of CO2 in the presence of water and cement represents a significant concern. A limited number of studies on typical wellbore cement (such as Class G and H cement) have reported instances of cement degradation due to interaction with CO2 (e.g., [100,101,102,103]). The scope of the studies has been expanded to encompass composites or wellbore sections (two components, e.g., casing/cement or cement/rock) under various conditions of CO2 operation (e.g., [104,105]). In recent years, the investigation of the whole wellbore section has been performed under reservoir conditions (e.g., [91,92]). However, just a few studies have reported on real-time permeability measurements for composites (casing/cement or cement/rock) on a large– scale while exposed to CO2 [106,107]. Our conclusion that wellbore cement with fractures is likely to heal during exposure to CO2-saturated water under static flow conditions is supported by existing experimental evidence. However, fractures along the cement/caprock interface may remain vulnerable to CO2 leakage [108,109].
In recently finalized international projects (e.g., RETURN and InjectWell), we performed several experiments testing casing–cement composite samples in the large-scale well integrity rig shown in Figure 9a, in which thermal- and pressure-cyclic loadings were applied. The results of these tests were compared with those of small-scale tests performed using the equipment shown in Figure 9b. The aim was to study the integrity of the samples under different thermal and pressure cyclic loads and their sealing capabilities against CO2 flow. Effective permeability in different composite systems (cement/caprock and cement/casing) was measured in real time using the unsteady-state method. For reference purposes, the integrity of cement and caprock samples was studied as standalone materials and compared with the composite samples. Details of the equipment, preparation of the composites and experimental procedures can be found in [106,107].
For cement samples, permeability was first measured in the small-scale setup with hydrogen for reference. The reference permeabilities were in the order of 10−19 m2, which is lower than the typical range of values reported for well cement, 10−17–10−18 m2. This was followed by permeability measurements with CO2. The pressure profiles indicated that there was no flow through the cement. Calcium carbonate (CaCO3) precipitation was observed on the inlet side of the samples. Pore size distribution was measured using a mercury porosimeter. The combined results and observations indicate even a potential reduction in permeability in the cement sample. Given that the initial quality of the cement samples was good, this outcome is expected because of the reaction with carbonated brine and the formation of CaCO3. Cement/caprock samples displayed no flow during the permeability measurements, indicating good quality of both materials and good bonding between them. This behavior represents a self-healing nature of cement when CO2 flows through it.
We also used permeability measurements to assess the effects of cyclic pressure and temperature conditions. The first set of experiments was performed with a small-scale setup using cement (HMR+)/anhydrite and cement (Class G)/coiled tubing (ct) composite cores. HMR+ cement refers to high-magnesium-resistant cement, usually used to cement salt formations, and differs from Class G in the chemical composition and grain size (finer than Class G). The second set of experiments was conducted in a large-scale setup to test casing–cement (Class G) under pressure- and thermal-cyclic conditions. Anhydrite and shale samples with permeabilities lower than 1 × 10⁻¹⁸ m2 were used to mimic the caprock. Cement/anhydrite composite was investigated with permeability measurements under cyclic pressure variations. Figure 10a shows the permeability behavior as a function of effective pressure. As expected, effective pressure and permeability values are inversely proportional. Note that the effective pressure is the difference between the confining pressure applied on the sample and half of the injection gas pressure on the inlet of the sample (applied on the cross-sectional area of the cement sheath). The reduction in permeability observed during the cyclic stages (effective pressure at 6 and 4 MPa) is attributable to extended exposure to CO2 under confining pressure. These findings are further supported by the observation that the values of permeability correspond to the results of the measurement for pure HMR+ and anhydrite, thereby confirming the tightness of the composite. Figure 10b depicts the results of one of the experiments showing that the permeability (measured with pure CO2) of the cement/ct bond depends on the effective pressure at a constant temperature of 20 °C. It is well known that CO2 is reactive with Class G cement in the presence of water; therefore, pure cement samples were either extremely tight to CO2 or impermeable. As for the cement/casing composites, they were showing permeability within an acceptable range for wellbore cement within the time frame of the experiments. According to the API recommendations, the permeability of conventional wellbore cement should not exceed 2 × 10⁻¹⁶ m2 to ensure sufficient sealing capacity and maintain wellbore integrity. As for HMR+ cement, it showed better performance than Class G cement in pure-cement samples, cement/caprock composites, and casing/cement composites. The reactivity of HMR+ with CO2 was very low compared to Class G cement, even when tested in an autoclave and being in continuous contact with carbonated brine for 6 months [103].
To understand how changes in temperature affect the strength of the well, two experiments were carried out on the composite casing/cement (Class G) system. The first experiment began with an initial temperature of 0 °C and an effective pressure of 5 MPa; the test pressure (gas injection pressure) was then held constant at around 1 MPa. A slight decrease in pressure was observed, most likely due to the chemical interaction between CO2 and cement. The second measurement started at −21 °C, with the test and confining pressures held constant at around 1 and 6 MPa, respectively. The temperature variation results showed no significant effect on integrity. The outlet valve also showed no fluid discharge, indicating that the cement/casing bond remained intact.
A series of experiments were conducted using cement Class G in the large setup as well. Pressure and temperature (P/T) cycling were investigated separately. By increasing the effective pressure to 9 MPa, a minimum permeability of 2 × 10⁻²⁰ m2 was reached. By decreasing the effective pressure to 1.7 MPa, the permeability increased slowly to a level of 1 × 10⁻¹⁸ m2. Probably this is due to the opening of microcracks with decreasing confining pressure. Further reduction in confining pressure results in an increase in permeability. Conversely, an increase in confining pressure subsequently leads to a decrease in permeability, owing to the higher effective pressure.
At an effective pressure of around 8.0 MPa, the permeability was measured at different time steps to see if it dropped to a value close to that of the initial measurement. However, it remained at around 4 × 10⁻¹⁹ m2. Increasing the effective pressure further to 9.0 MPa made no difference, and the permeability value remained constant. This is probably because the cracks did not fully close. Overall, the permeability value remained within the expected range for Class G cement throughout the experiment, indicating a strong bond between the casing and cement.
In Figure 11a the outcomes of a series of experiments involving cyclic temperatures at a constant effective pressure of 4.75 MPa (confining pressure: 5.5 MPa) are presented. The blue line denotes the temperature measured within the casing, whilst the blue dashed line signifies the external temperature of the cement sheath. Consequently, the temperature difference between the casing and the outer boundary is represented by the gap between the blue line and the red line at the corresponding time point. This experiment examined the tightness of the casing/cement (Class G) sample at a minimum temperature of −9 °C. Note that a reference measurement was conducted with CO2 at ambient temperature for comparison. After maintaining a constant temperature of −9 °C for 45 min, the warming phase was initiated. A slight pressure drop at the inlet chamber and a corresponding increase at the outlet chamber during the first 1.5 h are attributed to fluid communication between the inlet and outlet chambers, indicating CO2 flow. After this initial period, both inlet and outlet pressures stabilize and remain constant toward the end of the experiment. The slight increase in inlet pressure observed after thawing is due to gas expansion as the system returns to room temperature (14 °C). The comparison with the reference measurement confirms that flow occurs through and/or close to the interface between the casing and cement. However, the composite exhibits a minimum permeability of 8.3 × 10⁻¹⁹ m2, which falls within the typical range observed for Class G cement. The experiment was repeated at ambient temperature to investigate the possibility of thermal cracking. The confirmation measurement exhibited an identical pressure profile to the reference measurement, thereby indicating that subzero temperatures had no effect on the integrity of the composite sample. In summary, the freeze–thaw cycle did not induce microcracks in the cement structure during the present experiment.
Several casing/cement (Class G) composites were tested under different pressure-cycling patterns to evaluate their long-term performance under GCS-relevant conditions. One commonly applied pattern involved gradually increasing and then decreasing the pressure to simulate cyclic CO2 injection over a period exceeding 30 days. This test indicated that the composites became tighter, as reflected by reduced permeability, when the effective pressure was lowered. A similar pattern, applied to other samples over a longer timescale of up to six months (Figure 11b), produced a different outcome. In this case, repeated pressure cycling resulted in a progressive increase in permeability that did not return to its original value [106]. This irreversible behavior suggests the gradual formation of microcracks in the cement matrix, most likely during pressure reduction phases when the confining stress on the composite was diminished. Despite this degradation, the measured permeability remained relatively low and within acceptable limits, being comparable to the API-recommended range for wellbore cement and below 1 × 10⁻¹⁷ m2. This observation highlights that while microstructural damage may accumulate, overall sealing capacity can be maintained over practical timescales. Nonetheless, the findings emphasize the importance of testing CO2 injection strategies on casing/cement composites under conditions representative of the planned cyclicity of GCS projects, as the injection schedule itself may significantly influence long-term well integrity.
It is important to note that micro-CT scanning was not employed in our experiments to directly observe and measure cement–CO2 interactions. However, based on prior studies and our own experience, Class G cement is known to react with CO2 in a time-dependent manner, with the extent of reaction strongly influenced by the free water content in the cement. This chemical alteration, in conjunction with mechanical-stress cycling, has the potential to exert a pivotal influence on the development of permeability. It is therefore recommended that this aspect be given due consideration in forthcoming experimental and modeling studies.
Based on the experiments conducted, the following insights on the wellbore integrity under P/T cyclic conditions can be summarized in three categories:
The impact of transient P/T cycling on well integrity and the near-wellbore:
-
API Class G cement, caprock (shale and anhydrite), and the composite cement/caprock are tight to CO2 flow.
-
Temperature reduction to subzero due to J-T effect does not affect cement integrity or the integrity of the casing/cement interface (i.e., no cement sheath damage identified).
The impact, especially on re-purposed well casing/cement interface and associated well integrity:
-
Wellbore integrity depends on the bond between the cement/casing and the cement/caprock and cement quality.
-
It can be inferred that the elastic parameter contrast between the rock and the cement influences the microannulus formation and behavior.
-
A small increase in casing pressure decreased microannulus gas flow rate, with the main flow paths seeming to be at the casing/cement interface.
The impact on flow assurance and phase behavior in the well and near-wellbore area:
-
Thermally induced fracturing and embrittlement occur; however, freezing experiments showed no significant changes in the permeability due to brine freezing.

7. Discussion

The primary challenge in applying DGRs for GCS pertains to the thermodynamic gap or collapse that occurs during the injection of HPLT CO2 into a reservoir characterized by LPHT. While this is not a critical issue during the injection into SAs, it becomes a significant concern when injecting into depleted reservoirs, particularly into DGRs. In contrast to the generally higher depletion pressure observed in DORs, DGRs may exhibit a depletion pressure as low as 3 MPa. For CO2 to be injected in a dense state, the temperature must remain below the critical temperature of 31.1 °C. Therefore, the bottomhole injection pressure must be greater than or equal to hydrostatic pressure.
The prevailing hypothesis concerning this phenomenon is that the influx of high-pressure CO2 into a depleted reservoir may initiate an additional cooling process in the vicinity of the wellbore due to J-T expansion. Under such conditions, the thermodynamic state may enter the GHSZ, with the potential for hydrates to form. In addition, the temperature contrast between the reservoir and colder CO2 may also pose further challenges related to the geomechanical behavior and the CIC parameters.
It is mostly argued that J-T cooling plays a substantial role in the cooling of the DGR during CO2 injection. In order to reassess the issue for the maximum possible effect, it is possible to use conservative values of parameters. As outlined previously, the most influential parameters are the injection rate, permeability and the thermodynamic state, specifically the temperatures and pressures of the CO2 at the bottomhole and within the reservoir. To establish a more conservative case, a low permeability of 5 mD is considered, while the remaining parameters are kept within conservative limits. The injection rate is set at 1 Mt/year, representative of industrial-scale operations for a reservoir thickness of 50 m. The J-T coefficient is derived from measurements corresponding to the relevant thermodynamic conditions [35]. Under these assumptions, a minimum temperature of approximately 6 °C is calculated around the well after two years of injection. This corresponds to an additional temperature reduction of about 4 °C compared to the anticipated temperature distribution around the well. In this instance, the J-T coefficient is approximately 0.35 K/MPa as CO2 enters the reservoir in the liquid phase.
If the permeability is further reduced to 2 mD, the temperature in the vicinity of the well may decrease to approximately 0 °C. For supercritical CO2 injection, higher J-T coefficients result in greater cooling. For example, injection at 35 °C yields minimum temperatures of approximately 27 °C and 16 °C for 5 mD and 2 mD, respectively. These results are consistent with previous studies. Overall, the J-T effect becomes significant only under a combination of marginal thermodynamic and petrophysical conditions, including injection rates, large pressure differences, and very low permeability. High J-T cooling only occurs when relatively high-temperature CO2 (>31.1 °C for the supercritical phase) is injected, resulting in combined cooling that always remains outside the GHSZ. Considering the contribution of J-T cooling, the potential challenges associated with CO2 injection in DGRs are summarized in Table 1. The J-T effect itself is not listed as a separate challenge, as it acts as a contributing mechanism influencing the processes discussed in previous sections. The table also presents possible mitigation strategies. The following discussion points can be highlighted:
Provided that the minimum stress remains positive (i.e., in compression), fracturing will not occur, since rock only fractures under tension. It is important to note that the γh is a function of the Poisson ratio (v) and the Biot coefficients (β) for the plastic deformation of the rock. The rock’s Poisson ratio and Biot coefficients are the most significant unknown variables, exerting a significant influence on the pressure-dependent alteration in total stress. However, these parameters can be more easily predicted in DGRs. The initiation risk of thermo-hydraulic fractures appears to be contingent on substantial temperature reductions. Consequently, even in conservative geomechanical scenarios, the cold CO2 injection should result in temperature drops higher than 80 °C below the initial reservoir temperature, to achieve an effective pressure that falls below the tensile strength threshold. In such drastic cases, the potential for fracturing is only possible at higher reservoir pressures, where the impact of J-T expansion on further cooling is already reduced. In the event of thermo-hydraulic fracture formation, it is expected that the impact on injectivity will be favorable, as a fracture network has the capacity to facilitate the dissipation of CO2, thereby leading to the formation of a more uniform plume over time. Furthermore, higher fracture conductivities than those assured by the original reservoir permeability are likely to result in an increase in injectivity.
The formation of CO2 hydrates and their subsequent negative impact on permeability, and therefore on injectivity, are contingent upon a rare combination of thermodynamic and petrophysical conditions. As discussed previously, entry into the GHSZ in the NWZ requires low CO2 temperatures at the bottomhole (typically below 10 °C) combined with a strong J–T effect. Referring to Figure 7 and the discussion in the relevant section, additional prerequisites for hydrate formation include a tight reservoir formation with permeabilities around 1 mD, the presence of low-salinity formation water, and a certain amount of NG (>10 wt%). The likelihood of meeting all these conditions is extremely low; however, this should be verified using available reservoir data of DGR in question and operational scenarios. Clearly, assessing the thermodynamic conditions at the bottomhole and within the NWZ is crucial for accurately estimating the PoS of the operations. The most effective approach to mitigating hydrate formation is preventing the GHSZ for the specific formation brine salinity. If hydrate formation appears inevitable under the prevailing conditions, which seems extremely unlikely, effective thermodynamic inhibitors must be utilized as discussed, e.g., in [80].
The hypothesis that salt (NaCl) precipitation would reduce injectivity by blocking the pores in the NWZ of DGRs appears to be of limited relevance under typical conditions. This is mainly due to the low brine saturation in DGRs, especially in the NWZ, resulting from the evaporation of the remaining water. While evaporation of the water (DO) leads to salt precipitation, it simultaneously increases the permeability to CO2 and thus increases the injectivity. As the evaporation capacity of CO2 decreases with decreasing temperature, the injection of cold CO2 further reduces the likelihood of significant salt precipitation. Furthermore, the presence of low-null brine saturation imposes limitations on the supply of capillary-driven brine.
Stronger salt precipitation may occur in the NWZ of the confining formations (under and/or overburden), where water saturation and capillary pressures are higher. This may even be beneficial for well integrity and containment. However, under less favorable conditions—such as warmer CO2 injection, elevated salinity levels, higher brine presence or influx, and/or low porosity and permeability—it is recommended to conduct a preliminary numerical assessment using a thermal–hydraulic coupled code considering the salt precipitation. Currently, there are no well-established mitigation methods that can mitigate the salt precipitation in NWZ in GCS applications. Therefore, confirming brine characteristics prior to injection, using field data is important to minimize SO risk. In contrast, a potential brine supply through water influx from the gas–water interface can greatly increase salt precipitation. Accordingly, perforation design of newly drilled wells is of the utmost importance. The interaction of other chemical components with reservoir fluids is expected to be negligible in terms of capacity and injectivity because of the low brine saturation; however, the long-term impact on containment (wellbore–caprock) needs to be assessed within routine FEED (Front End Engineering and Design) activities.
The injection of cold CO2 and additional J-T cooling could clearly affect the integrity of the caprock, although potentially to a lesser extent than the reservoir, given its thickness and its petrophysical, geomechanical and thermal properties. This is supported by theoretical and case studies in the literature (e.g., [83,85]). The primary risk to DGR containment is wellbore leakage, particularly when using legacy wells. The well barriers consisting of rock, casing, cement and the interfaces between these components are particularly susceptible to strong pressure and temperature cycling, as well as to low temperatures. Therefore, it is crucial to understand the connection between the choices made during CO2 injection into depleted reservoirs and the risk of well integrity breaches.
The experimental findings on various well barriers, in conjunction with other comparable literature data, demonstrate that API Class G cement, caprock (shale and anhydrite), and the composite cement/caprock exhibit a high degree of tightness to CO2 flow. It has been demonstrated that a reduction in temperature to subzero levels, because of the J-T effect in conjunction with P and T cycles, does not compromise the integrity of cement, nor that of the casing/cement or caprock/cement interfaces. Nevertheless, to ensure a comprehensive interpretation of the results, it is imperative to consider the following factors when applying them to real-life case scenarios. Firstly, it is crucial to note that the composite material used in our experiments, as well as in analogous studies, is carefully prepared under controlled laboratory conditions. It is crucial that the well barriers underground, encompassing both legacy and recently completed wells, be subjected to timely and adequate evaluation. Special care should be taken to ensure that the well components are positioned correctly and that the well’s integrity is maintained. To this end, it is essential to undertake wellbore logging runs in a timely manner, prior to the initial injection. This will enable the execution of any necessary remedial work. Secondly, the long-term effects of thermal–hydraulic–mechanical and geochemical interactions should be reconsidered, considering the critical role played by pressure and exposure time to CO2 in determining cement permeability. It is imperative to emphasize that geochemical interactions with cement and in the cement/caprock interface are particularly lengthy processes, necessitating continuous monitoring of well integrity. The application of coupled thermal–hydraulic–mechanical–chemical (THMC) modeling has been demonstrated to be particularly beneficial in supporting these initiatives, particularly when accompanied by well-studied reservoir geochemistry and thermodynamic databases [110].
It is important to note that reliable prediction of thermodynamics in the borehole and at the bottomhole is a fundamental prerequisite for assessing and mitigating the potential implications of high-pressure cold CO2 injection into DGRs, as discussed above. As the borehole measurements are limited in terms of technical difficulties and economics, numerical wellbore simulators are being developed to predict the thermodynamic conditions in the borehole as a function of depth and time coupled with reservoir dynamics. Nevertheless, there is still a need for rigorous validation efforts to be made for most of the newly developed codes. It is also imperative to emphasize the utilization of scoped simulators with limited, yet more reliable, outputs. Quantifying leakage rates through microannuli at the cement/casing/caprock interfaces is a notable example of such efforts. These tools adopt a relatively conservative approach in their estimation process. However, it is crucial to conduct a greater number of experiments and field applications to improve the accuracy of their predictions and to refine the underlying assumptions.
It should be noted that this study primarily uses simplified and generic models to isolate and explain the dominant THMC mechanisms associated with cold CO2 injection into DGRs. Therefore, certain site-specific scaling aspects such as strong geological heterogeneity, permeability anisotropy, complex fault architectures, and detailed legacy well conditions are not represented explicitly in the simulations. Heterogeneity and anisotropy can significantly impact the migration of the CO2 plume, the propagation of pressure, and the behavior of salt precipitation. Heterogeneity may promote the downward movement of the CO2 plume in DGRs and this certainly facilitates a faster pressure equilibrium and lower probability of integrity risks on the overburden formations. It is widely acknowledged that heterogeneity can exert a significant influence on the processes of salt precipitation and hydrate formation within a reservoir {17,50]. This influence is attributed to the interplay between the distinct capillary pressure and water saturation profiles within the reservoir. Nonetheless, it is obvious that this element is not pertinent to DGRs following substantial depletion. Geological discontinuities, such as faults in the caprock, have the potential to exert a significant influence on the containment. Although it is indicated that the stress heterogeneity between the storage formation and the caprock makes fracture propagation into the caprock less likely, a thorough evaluation of the prevailing geological environment, encompassing the architecture of faults, is imperative for the successful execution of the planned operations [27]. The existence of historical data pertaining to DGRs constitutes a distinct advantage for conducting such assessments.

8. Conclusions

This study investigates the technical challenges associated with cold (non-isothermal) CO2 injection into DGRs, with a focus on their implications for storage capacity, injectivity and containment (CIC). The analysis combines laboratory observations, analytical modeling, and numerical simulations to evaluate the governing thermo-hydraulic–geomechanical processes in the NWZ and caprock. The following conclusions can be useful for the engineering of GCS in DGRs:
-
Cold CO2 injectivity in DGRs creates strong thermodynamic contrasts that control all three pillars of GCS. Lower injection temperature increases CO2 density and delays pressure buildup during injection, allowing more CO2 to be injected; however, post-injection thermal equilibrium leads to CO2 expansion and pressure rebound, which must be considered in long-term reservoir management.
-
Cooling in the NWZ significantly influences the CIC components and may dominate over conventional isothermal assumptions. Whereas isothermal assumptions are valid in capacity assessments leading to a conservative approach, some risks in injectivity and containment should be carefully assessed with realistic assumptions.
-
The risks and probability of occurrence of thermo-hydraulic fracturing, hydrate formation and salt precipitation in GCS in DGRs are rare, depending on the combination of marginal conditions. In contrast, thermo-hydraulic fracturing and evaporation might be beneficial in terms of injectivity.
-
The probability of well-integrity issues is more likely to occur with a significant impact on containment. Physical and numerical research shows promising non-leakage characteristics of well components, although under assumed ideal conditions. Prior to undertaking any operations, it is imperative to conduct comprehensive laboratory tests and perform well measurements, particularly in the context of legacy wells, given the potential for non-isothermal and cyclic P/T conditions. Cooling-induced stresses have the potential to compromise wellbore integrity and caprock stability, necessitating meticulous design and monitoring. Ensuring the integrity of the wellbore is contingent upon the quality of the cement job. Inadequate cement placement and substandard quality from the outset may result in early-stage complications, including leakage or degradation.
-
To assess and potentially mitigate the challenges, it is essential to make a reliable estimate of the wellbore and NWZ thermodynamics. Numerical models that have undergone validation and calibration with laboratory data and field measurements can be used for the purpose of timely and accurate assessments. Furthermore, the THMC-coupled reservoir modeling approach is of significant value for the GCS in DGRs, as history-matched reservoir models are predominantly applied in such operations.

Author Contributions

Conceptualization, H.A., T.H.N. and M.A.; methodology, H.A., T.H.N. and A.T.; software, H.A., A.T. and N.Z.; validation, H.A., T.H.N., N.Z. and D.B.; investigation, T.H.N., A.T., N.-A.K. and D.B.; resources, M.A.; data curation, H.A., T.H.N., A.T. and N.Z.; writing—original draft preparation, H.A. and T.H.N.; writing—review and editing, H.A., T.H.N. and N.Z.; visualization, H.A. and T.H.N.; supervision, T.H.N., N.-A.K., N.Z. and M.A.; project administration, M.A. and C.F.; funding acquisition, M.A. and C.F. All authors have read and agreed to the published version of the manuscript.

Funding

This research received no external funding.

Data Availability Statement

The original contributions presented in this study are included in the article.

Acknowledgments

We would like to thank the staff of the projects RETURN and InjectWell for their significant contributions to this study. The authors have reviewed and edited the content of this publication and assume full responsibility for it.

Conflicts of Interest

The authors declare no conflicts of interest.

Abbreviations

The following abbreviations are used in this manuscript:
BHPBottomhole pressure
CCSCarbon capture and storage
CICCapacity, injectivity, containment (GCS)
ctCoiled tubing
CTComputer tomography
DGRDepleted gas reservoir
DHRDepleted hydrocarbon reservoirs
DODrying out
DORDepleted oil reservoir
EOREnhanced oil recovery
FEEDFront-end engineering and design
GCSGeologic carbon storage
GHSZGas hydrate stability zone
HMR+High-magnesium-resistant (cement)
HPLTHigh-pressure low-temperature
J-TJoule–Thomson
kPermeability
LPHTLow-pressure high-temperature
NGNatural gas
NWZNear-wellbore zone
PPressure
PoSProbability of success
PRFPermeability reduction factor
SA Saline aquifer
SOSalting out
TTemperature
T0Tensile strength
TDSTotal dissolved solids
THMCThermal–hydraulic–mechanical–chemical
TUBAFTechnical University Bergakademie Freiberg
vGVan Genuchten relative permeability model
wtweight
Symbols, subscripts
AArea
bFracture width
bhBottomhole
DDiameter
deplDepleted
EYoung’s modulus
fFracture
hReservoir thickness
iInitial
injInjected, injection
minMinimum
ppore
PPressure (GP)
resReservoir
TTemperature (GT)
vPoisson’s ratio
whWellhead
ΔDelta, difference
αTThermal expansion coefficient
βBiot coefficient
μJTJoule–Thomson coefficient
ρDensity
σStress

Appendix A. Reservoir Model Used in the Study

A generic numerical model created using a radial geometry with reservoir characteristics given in Table A1 is used in the study. The TOUGH2-ECO2N reservoir simulator is applied. The ECO2N equation of state (EoS) module of TOUGH2 is the most frequently used numerical tool for investigating the DO and SO (e.g., [111]) due to its tabulated database (CO2–brine mutual solubilities) and relatively straightforward numerical processing (due to equilibrium chemistry). The generic model simulates a closed boundary reservoir with a radius of 1000 m and a thickness of 50 m. The sealing formations above and below are modeled with a thickness of 15 m and corresponding petrophysics. In the radial model with a vertical well at the center, fine discretization is consistently applied as in previous publications (e.g., [112,113]), using a size factor ( f   i n   l = l 0 i = 0 n 1 f i , l0 being the width of the first block well) of 1.1. This configuration results in the establishment of a more refined grid at the center, with a radius of 1 cm proximate to the well and a gradual increase in grid size in more distant areas. The outermost block, which represents the boundary, has a width of 200 m and a high-volume modifier to reduce boundary effects on reservoir hydrodynamics. The vertical well is open along its entire 50 m length and is simulated with blocks at the center of the model, designated as the source. Equal rates are given based on the injection rate. The depletion pressure has been assigned a value of 70, which is slightly higher than the conventional depletion pressures of DGRs. This adjustment has been made to prevent phase transition in the reservoir.
The underburden and overburden formations are modeled with layers (three for each) with corresponding petrophysics.
In addition to basic runs, this model was also modified to simulate core-flooding experiments and heat dissipation across the overburden formation.
Table A1. Principal data applied in the numerical reservoir model.
PropertyAbbreviationValueUnit
Radiusr1000m
Thicknessh80 (50 m reservoir)m
DepthD2500m
Thickness of each layerz5m
Porosity, reservoirϕ0.2-
Permeability, reservoirk100mD
Porosity, sealϕ,0.05-
Permeability, sealk0.1mD
Permeability anisotropykvert/khor,0.2-
TemperatureTres90 + 0.03 (°C/m)·Δz (m)°C
Pressure (depletion)Pres7+ 0.011 (MPa/m) ·Δz (m)MPa
Injection rateqinj32; ca. 1.0kg/s, Mt/year
Injection temperatureTinj,ca. 10°C
Brine salinity (NaCl)SNaCl0.2wt. ratio
Initial water saturationSw20%
Brine-CO2 rel. permeabilitykrUsing vG model-
Verma–Pruess parametersΓ; ϕ00.6; 0.6-
Grid number (radial model)-100 × 16-

Appendix B. Calculation of J-T Cooling Based on the Analytical Model by [30]

The analytical solution facilitates rapid evaluation of spatiotemporal temperature fields resulting from constant-rate CO2 injection, thereby enabling the assessment of the J-T effect. The validity of the solution is evidenced by a comparative analysis with fully coupled and transient non-isothermal simulation results from the reservoir simulator TOUGH2. The analytical model is straightforward to apply and is developed by using steady-state flow and constant thermophysical properties.
The model suggests using the following equation to calculate the lowest possible temperature (Tmin) that could be reached when CO2 is injected and cooled with the J-T effect. The development of the model is given and discussed in [30].
T m i n = α μ q 4 π h k ρ C O 2 l n c C O 2 1 S w ρ C O 2 c C O 2 + S w ρ w c w + ( 1 ) ρ r c r q t π h r w 2 + 1 + T r   if   T r T i T i   if   T r > T i
The parameters used in this study for the assessment of J-T cooling for the cases presented in the paper are provided in Table A2. In the calculations, it is further assumed that the water saturation is equal to 0, thus rendering the relative permeability to CO2 equal to the absolute permeability. This is an acceptable assumption for DGRs, given the evaporation of water in the NWZ. Furthermore, the J-T coefficients are given as functions of the P and T instead of assuming them to be constant, as was the case in the original paper. We assumed that Pp ≈ Pres + 0.5Pinj.
Table A2. Parameters used in this study in calculating J-T cooling according to the model proposed by [30].
ParameterAbbreviationValueUnit
Wellbore radius rw0.05m
J-T coefficientαDepending on P, TK/Pa
Viscosity, CO2µDepending on P, TPa-s
Absolute permeabilityk1 × 10−13; 1 × 10⁻¹⁴m2
Density, CO2ρCO2900kg/m3
Density, waterρw1100kg/m3
Density, rockρr2600kg/m3
Porosityϕ0.25fraction
Thicknessh50m
Injection rateq32kg/s
Heat capacity, CO2cCO2Depending on P, TJ/kg·K
Heat capacity, watercw4050J/kg·K
Heat capacity, rockcr1000J/kg·K
Reservoir pressure (depletion)Pr5 × 106Pa
Reservoir temperature Tr283°C
Injection pressurePi12 × 106Pa
Injection temperatureTi10, variable°C
TimetVariables
Saturation, waterSw0fraction

Appendix C. Calculation of Fracture Initiation Due to Thermo-Hydraulic Variations [40]

An analytical model describing the relations between thermo-poro-elastic stress and the criterion for initiation of (thermal) fracturing is developed. The thermal stress component of the model relies on a simplified analytical solution that considers the stresses surrounding the wellbore, accounting for variations due to near-wellbore cooling and far-field virgin temperature conditions. For injection in a gas reservoir building up pressures from a (very) depleted starting situation, the local total stress is expressed with the following expression:
σ h = σ h ,   d e p l + γ h , i n j G p , r e q P i n j + γ h , i n j G p , r r e s P b u E ( 1 v ) α T G T T
where σh,depl is the minimum horizontal total stress in the depleted (start) situation, ΔPbu is the pressure buildup from the depleted start situation to current average reservoir pressure, Δpinj = Pinj − Pres (the pressure difference over the well), and γh,inj is the stress path under pressure changes during the injection phase, namely injection constant, and is defined as the function of the Poisson ratio (v) and Biot coefficient (β):
γ h , i n j = ( 1 2 v ) ( 1 v ) β
The last term of the Equation (A1) is the thermal stress caused by expansion (or contraction), with Young’s modulus E, Poisson’s ratio v and the linear expansion coefficient aT. GT and Gp are geometrical factors as proposed by Perkins and Gonzalez (1984, 1985), which are included to account for the difference between local temperatures and pressures compared to the far-field conditions [45,46].
The data applied in this study for Equation (A1) are mainly taken from [40] and are given in Table A3.
Table A3. List of the data applied for using Equation (A1).
PropertyAbbreviationValueUnit
Tensile strength of the rockT0-MPa
Injection pressure Pi12MPa
Depletion pressure (variable)Pdep7MPa
Reservoir pressure Pr20MPa
Minimum horizontal total stressσh-MPa
Min, horizontal total stress in the depleted situationσh, depl2.7 × 107MPa
Stress path under pressure changes during injectionγu, inj-MPa
Geometrical factorsGT, Gp 0.8; 0.8-
Pressure difference over the wellΔPnj-MPa
Buildup from the depleted to average reservoir pres.ΔPbu-MPa
Young modulusE27GPa
Poisson’s ratiov0.2-
Biot coefficientβ0,8-
Thermal expansion coefficientαT9 × 10−91/°C
Temperature difference (input)ΔT-°C

References

  1. Hannis, S.; Lu, J.; Chadwick, A.; Hovorka, S.; Kirk, K.; Romanak, K.; Pearce, J. CO2 Storage in Depleted or Depleting Oil and Gas Fields: What can We Learn from Existing Projects? Energy Procedia 2017, 114, 5680–5690. [Google Scholar] [CrossRef]
  2. Alkan, H.; Rivero, F.F.; Burachok, O.; Kowollik, P. Engineering design of CO2 storage in saline aquifers and in depleted hydrocarbon reservoirs: Similarities and differences. First Break 2021, 39, 69–80. [Google Scholar] [CrossRef]
  3. Wei, B.; Wang, B.; Li, X.; Aishan, M.; Ju, Y. CO2 storage in depleted oil and gas reservoirs: A review. Adv. Geo Energy Res. 2023, 9, 76–93. [Google Scholar] [CrossRef]
  4. Neele, F.; Hurter, S.; Wildenborg, T.; van Unen, M. Managing the transition of depleted oil and gas fields to CO2 storage; IEA Greenhouse Gas R&D Programme: Cheltenham, UK, 2024. [Google Scholar] [CrossRef]
  5. Alkan, H.; Burachok, O.; Kowollik, P. Chapter 8—Geologic carbon storage: Key components. In Oil and Gas Chemistry Management Series, Surface Process, Transportation, and Storage; Wang, Q., Ed.; Gulf Professional Publishing: Waltham, MA, USA, 2023; pp. 325–422. [Google Scholar] [CrossRef]
  6. Bump, A.; Bakhshian, S.; hovorka susan Rhodes, J.; Neades, S. Criteria for depleted reservoirs to be developed for CO2 storage. SSRN Electron. J. 2022. [Google Scholar] [CrossRef]
  7. Samuels, F.M.D. Injecting CO2 into depleted oil fields may not cause quakes. Temblor 2021, 7. [Google Scholar] [CrossRef]
  8. Heidarabad, R.G.; Shin, K. Carbon capture and storage in depleted oil and gas reservoirs: The viewpoint of wellbore injectivity. Energies 2024, 17, 1201. [Google Scholar] [CrossRef]
  9. GCCSI, Global CCS Institute. The Global Status of CCS: 2024; Technical Report; GCCSI: Melbourne, Australia, 2024. [Google Scholar]
  10. Cooney, G.; Littlefield, J.; Marriott, J.; Skone, T.J. Evaluating the Climate Benefits of CO2-Enhanced Oil Recovery Using Life Cycle Analysis. Environ. Sci. Technol. 2015, 49, 7491–7500. [Google Scholar] [CrossRef]
  11. Farajzadeh, R.; Eftekhari, A.A.; Dafnomilis, G.; Lake, L.W.; Bruining, J. On the sustainability of CO2 storage through CO2—Enhanced oil recovery. Appl. Energy 2020, 261, 114467. [Google Scholar] [CrossRef]
  12. Amro, M.; Nassan, T.; Tamáskovics, A.; Baganz, D.; Alkan, H.; Opedal, N.; Todorovic, J.; Cilona, A.; Cerasi, P. RETURN: Re-use of depleted oil and gas fields for CO2 sequestration (return-act.eu). In Proceedings of the ÖGEW/DGMK-Herbstveranstaltung, Vienna, Austria, 14–15 November 20024. [Google Scholar] [CrossRef]
  13. Burachok, O.; Solbakken, J.; Amro, M.; Nassan, T.; Aarra, M.G.; Zamani, N.; Fogden, A.; Kowollik, P.; Alkan, H. InjectWell: Experimental and numerical assessments of CO2 injectivity and flow assurance during geological storage. In Proceedings of the 85th EAGE Annual Conference & Exhibition, Oslo, Norway, 10–13 June 2024. [Google Scholar] [CrossRef]
  14. Mac Dowell, N.; Fennell, P.S.; Shah, N.; Maitland, G.C. The role of CO2 capture and utilization in mitigating climate change. Nat. Clim. Change 2017, 7, 243–249. [Google Scholar] [CrossRef]
  15. Sun, Y.; Lin, R.; Pan, Y.; Sun, L.; Tang, Y. Experimental Analysis and Numerical Simulation of the Stability of Geological Storage of CO2: A Case Study of Transforming a Depleted Gas Reservoir into a Carbon Sink Carrier. ACS Omega 2021, 6, 34832–34841. [Google Scholar] [CrossRef]
  16. Zamani, N.; Oldenburg, C.M.; Solbakken, J.; Aarra, M.G.; Kowollik, P.; Alkan, H.; Amro, M.M.; Nassan, T.H.; Estrada, J.K.P.; Burachok, O. CO2 flow modeling in a coupled wellbore and aquifer system: Details of pressure, temperature, and dry-out. Int. J. Greenh. Gas Control. 2024, 132, 104067. [Google Scholar] [CrossRef]
  17. Zamani, N.; Marban, D.L.; Sandve, T.H.; Gasda, S.E. Unraveling salt precipitation mechanisms in geological CO2 storage: Insights into dominant driving forces. InterPore J. 2026, 3, IPJ150526-2. [Google Scholar] [CrossRef]
  18. Ziabakhsh-Ganji, Z.; Kooi, H. Sensitivity of Joule–Thomson cooling to impure CO2 injection in depleted gas reservoirs. Appl. Energy 2014, 113, 434–451. [Google Scholar] [CrossRef]
  19. Zamani, N.; Shokri, A.R.; Chalaturnyk, R.J.; Gasda, S.; Berenblyum, R. Significance of the Joule-Thomson cooling effect for geological CO2 storage in depleted gas reservoirs. SSRN Electron. J. 2025, 20–24. [Google Scholar] [CrossRef]
  20. Pan, L.; Oldenburg, C.M. T2Well—An integrated wellbore–reservoir simulator. Comput. Geosci. 2014, 65, 46–55. [Google Scholar] [CrossRef]
  21. Dou, L.; Zhang, M.; Bi, G.; Li, T. Transient flow in wellbores and phase transition of CO2 during formation supercritical CO2 invasion. Energy Sci. Eng. 2018, 7, 323–337. [Google Scholar] [CrossRef]
  22. Tavagh Mohammadi, B.; Jahanbani Ghahfarokhi, A.; Grimstad, A.-A. A review of modeling approaches for CO2 injection into depleted gas reservoirs: Coupling transient wellbore and reservoir dynamics. Int. J. Greenh. Gas Control 2025, 145, 104406. [Google Scholar] [CrossRef]
  23. Nazarian, B.; Furre, A.K. Simulation Study of Sleipner Plume on Entire Utsira Using A Multi-Physics Modelling Approach. In Proceedings of the 16th Greenhouse Gas Control Technologies Conference (GHGT-16), Lyon, France, 23–24 October 2022. [Google Scholar] [CrossRef]
  24. Arts, R.; Vandeweijer, V.; Hofstee, C.; Pluymaekers, M.; Loeve, D.; Kopp, A.; Plug, W. The feasibility of CO2 storage in the depleted P18-4 gas field offshore the Netherlands (the ROAD project). Int. J. Greenh. Gas Control 2012, 11, S10–S20. [Google Scholar] [CrossRef]
  25. Loeve, D.; Hofstee, C.; Maas, J.G. Thermal effects in a depleted gas field by cold CO2 injection in the presence of methane. Energy Procedia 2014, 63, 3632–3647. [Google Scholar] [CrossRef]
  26. Vilarrasa, V.; Olivella, S.; Carrera, J.; Rutqvist, J. Long term impacts of cold CO2 injection on the caprock integrity. Int. J. Greenh. Gas Control 2014, 24, 1–13. [Google Scholar] [CrossRef]
  27. Vilarrasa, V.; Rutqvist, J. Thermal effects on geologic carbon storage. Earth Sci. Rev. 2017, 165, 245–256. [Google Scholar] [CrossRef]
  28. Talman, S. Adapting TOUGH2 for general equations of state with application to geological storage of CO2*1. Comput. Geosci. 2004, 30, 543–552. [Google Scholar] [CrossRef]
  29. Oldenburg, C.M. Joule-Thomson cooling due to CO2 injection into natural gas reservoirs. Energy Convers. Manag. 2007, 48, 1808–1815. [Google Scholar] [CrossRef]
  30. Mathias, S.A.; Gluyas, J.G.; Oldenburg, C.M.; Tsang, C.F. Analytical solution for Joule–Thomson cooling during CO2 geo-sequestration in depleted oil and gas reservoirs. Int. J. Greenh. Gas Control 2010, 4, 806–810. [Google Scholar] [CrossRef]
  31. Gao, M.; Wang, L.; Chen, X.; Wie, X.; Liang, J.; Li, L. Joule–Thomson effect on a CCS-relevant (CO2 + N2) system. ACS Omega 2021, 6, 9857–9867. [Google Scholar] [CrossRef]
  32. Amir, M.M.; Yusof, M.; Shafian, S.B.; Zulkifli, N.; Affandi, R.A.; Bedrikovetsky, P.; Manap, A.A.; Kechut, N.; Othman, A.A.; Razak, A.A.; et al. Joule Thomson Cooling Effects on Rock Dry-Out, Salt Precipitation and Fines Migration During CO2 Storage in Depleted Oil and Gas Reservoir: Laboratory Investigation. In Proceedings of the SPE-225911-MS, SPE Asia Pacific CCUS Conference, Kuala Lumpur, Malaysia, 26–27 August 2025. [Google Scholar] [CrossRef]
  33. Chesnokov, C.; Prempeh, K.O.K.; Farajzadeh, R.; Bedrikovetsky, P. Joule-Thomsoncoolingduring CO2 injectionunderunsteady-state delayed heat exchange. Water Resour. Res. 2025, 61, e2024WR038466. [Google Scholar] [CrossRef]
  34. Wang, J.; Wang, Z.; Sun, B. Improved equation of CO2 Joule–Thomson coefficient. J. CO2 Util. 2017, 19, 296–307. [Google Scholar] [CrossRef]
  35. NIST. Reference Fluid thermodynamic and transport properties, database REFPROP. 2026. Available online: https://www.nist.gov/programs-projects/reference-fluid-thermodynamic-and-transport-properties-database-refprop (accessed on 20 April 2026).
  36. Eshiet, K.I.; Sheng, Y. Carbon dioxide injection and associated hydraulic fracturing of reservoir formations. Environ. Earth Sci. 2013, 72, 1011–1024. [Google Scholar] [CrossRef]
  37. Huerta, N.J.; Cantrell, K.J.; White, S.K.; Brown, C.F. Hydraulic fracturing to enhance injectivity and storage capacity of CO2 storage reservoirs: Benefits and risks. Int. J. Greenh. Gas Control 2020, 100, 103105. [Google Scholar] [CrossRef]
  38. Luo, Z.; Bryant, S. Impacts of Injection Induced Fractures Propagation in CO2 Geological Sequestration—Is Fracturing Good or Bad for CO2 Sequestration. Energy Procedia 2014, 63, 5394–5407. [Google Scholar] [CrossRef]
  39. Baig, A.R.; Fentaw, J.; Hajiyev, E.; Watson, M.; Emadi, H.; Eissa, B.; Shahin, A. Comprehensive Insights into Carbon Capture and Storage: Geomechanical and Geochemical Aspects, Modeling, Risk Assessment, Monitoring, and Cost Analysis in Geological Storage. Sustainability 2025, 17, 8619. [Google Scholar] [CrossRef]
  40. Thijs, H.; Kok, J. An Analytical method for estimation of thermal fracturing initiation during CO2 injection in depleted gas reservoirs. In Proceedings of the SPE Europ EC—Europe Energy Conference featured at the 84th EAGE Annual Conference & Exhibition, Vienna, Austria, 5–8 June 2023. [Google Scholar] [CrossRef]
  41. Lu, G.; Kelley, M.; Raziperchikolaee, S.; Bunger, A. Modeling the Impact of Thermal Stresses Induced by Wellbore Cooldown on the Breakdown Pressure and Geometry of a Hydraulic Fracture. Rock Mech. Rock Eng. 2024, 57, 5935–5952. [Google Scholar] [CrossRef]
  42. Ghassemi, A.; Tarasovs, S.; Cheng, A.D. A 3-d study of the effects of thermomechanical loads on fracture slip in enhanced geother mal reservoirs. Int. J. Rock Mech. Min. Sci. 2007, 44, 1132–1148. [Google Scholar] [CrossRef]
  43. Cha, M.; Alqahtani, N.B.; Yao, B.; Yin, X.; Kneafsey, T.J.; Wang, L.; Wu, Y.-S.; Miskimins, J.L. Cryogenic fracturing of wellbores under true triaxial-confining stresses: Experimental investigation. SPE J. 2018, 23, 1271–1289. [Google Scholar] [CrossRef]
  44. Hosking, L.J.; Zhou, X. Damage modeling of CO2 injection well interfaces under coupled thermal, hydraulic and mechanical behavior. Deep. Undergr. Sci. Eng. 2025, 4, 762–776. [Google Scholar] [CrossRef]
  45. Perkins, T.K.; Gonzalez, J.A. Changes in Earth Stresses Around a Wellbore Caused by Radially Symmetrical Pressure and Temperature Gradients. Soc. Pet. Eng. J. 1984, 24, 129–140. [Google Scholar] [CrossRef]
  46. Perkins, T.K.; Gonzalez, J.A. The Effect of Thermoelastic Stresses on Injection Well Fracturing. Soc. Pet. Eng. J. 1985, 25, 78–88. [Google Scholar] [CrossRef]
  47. Ghaderi, S.; Keith, D.; Leonenko, Y. Feasibility of Injecting Large Volume of CO2 into Aquifers. Energy Procedia 2009, 1, 3113–3120. [Google Scholar] [CrossRef]
  48. Cui, G.; Hu, Z.; Fulong, N.; Jiang, S.; Wang, R. A review of salt precipitation during CO2 injection into saline Aquifers and its potential impact on carbon sequestration projects in China. Fuel 2023, 334, 126615. [Google Scholar] [CrossRef]
  49. Sun, X.; Liu, K.; An, S.; Hellevang, H.; Cao, Y.; Alcalde, J.; Travé, A.; Yuan, G.; Deng, C.; Gomez-Rivas, E. A review of experimental investigations on salt precipitation during CO2 geological storage. Geoenergy Sci. Eng. 2025, 244, 213451. [Google Scholar] [CrossRef]
  50. Alkan, H.; Zamani, N.; Burachok, O.; Baganz, D.; Amro, M. Decision making on salt precipitation risk in geologic carbon storage: Driving factors and uncertainties. Geoenergy Sci. Eng. 2026, 260, 214411. [Google Scholar] [CrossRef]
  51. Pruess, K. TOUGH2: A General-Purpose Numerical Simulator for Multiphase Fluid and Heat Flow; Technical Report; OSTI (U.S. Department of Energy Office of Scientific and Technical Information): Oak Ridge, TN, USA, 1991. [CrossRef]
  52. Pan, L.; Spycher, N.; Doughty, C.; Pruess, K. ECO2N V2.0: A TOUGH2 fluid property module for modeling CO2-H2O-NACL systems to elevated temperatures of up to 300 °C. Greenh. Gases Sci. Technol. 2016, 7, 313–327. [Google Scholar] [CrossRef]
  53. Verma, A.K.; Pruess, K. Thermohydrological conditions and silica redistribution near high-level nuclear wastes emplaced in saturated geological formations. J. Geophys. Res. 1988, 93, 1159–1173. [Google Scholar] [CrossRef]
  54. Ullerich, J.W.; Selim, M.S.; Sloan, E.D. Theory and measurement of hydrate dissociation. AIChE J. 1987, 33, 747–752. [Google Scholar] [CrossRef]
  55. Sloan, E. Fundamental principles and applications of natural gas hydrates. Nature 2003, 426, 353–359. [Google Scholar] [CrossRef]
  56. Farhang, F.; Nguyen, A.V.; Hampton, M.A. Influence of sodium halides on the kinetics of CO2 hydrate formation. Energy Fuels 2014, 28, 1220–1229. [Google Scholar] [CrossRef]
  57. Ma, H.; Liu, J.; Zhang, Y.; Li, J.; Kan, J.; Li, N. Prediction of phase equilibrium conditions and thermodynamic stability of CO2-CH4 gas hydrate. Appl. Sci. 2024, 14, 2320. [Google Scholar] [CrossRef]
  58. Cha, S.B.; Ouar, H.; Wildeman Sloan, E.D. A Third-Surface Effect on hydrate formation. J. Phys. Chem. 1988, 92, 6492–6494. [Google Scholar] [CrossRef]
  59. Mandal, A.; Sukumar, L. Effect of the promoter on gas hydrate formation and dissociation. Energy Fuels 2008, 22, 2527–2532. [Google Scholar] [CrossRef]
  60. Schulz, A.; Strauß, H. Ethylene glycol as gas hydrate stabilisation substance. In Proceedings of the ASME 2015 34th International Conference on Ocean, Offshore and Arctic Engineering, St. John’s, NL, Canada, 31 May–5 June 2015. [Google Scholar] [CrossRef]
  61. Sloan, E.D. Gas hydrates: Review of physical/chemical properties. Energy Fuels 1998, 12, 191–196. [Google Scholar] [CrossRef]
  62. Aregbe, A.G. A generalized correlation for predicting ethane, propane, and isobutane hydrates equilibrium data in pure water and aqueous salt solutions. Glob. Chall. 2019, 3, 1800069. [Google Scholar] [CrossRef]
  63. Sadeq, D.; Al-Fatlawi, O.; Iglauer, S.; Lebedev, M.; Smith, C.; Barifcani, A. Hydrate Equilibrium Model for Gas Mixtures Containing Methane Nitrogen Carbon Dioxide. In Proceedings of the Offshore Technology Conference, Houston, Texas, USA, 4–7 May 2020. [Google Scholar] [CrossRef]
  64. Burgass, R.; Chapoy, A.; Askvik, K.M.; Neeraas, B.O.; Li, X. CO2 Hydrate formation in NaCl systems and undersaturated aqueous solutions. Sci. Technol. Energy Transit. 2023, 78, 8. [Google Scholar] [CrossRef]
  65. Uchida, T.; Ikeda, I.Y.; Takeya, S.; Kamata, Y.; Ohmura, R.; Nagao, J.; Zatsepina, O.Y.; Buffett, B.A. Kinetics and stability of CH4-CO2 mixed gas hydrates during formation and long-term storage. Chemphyschem 2005, 6, 646–654. [Google Scholar] [CrossRef] [PubMed]
  66. Zatsepina, O.; Pooladi-Darvish, M. Storage of CO2 as hydrate in depleted gas reservoirs. SPE Reserv. Eval. Eng. 2012, 15, 98–108. [Google Scholar] [CrossRef]
  67. Horvat, K.; Kerkar, P.; Jones, K.; Mahajan, D. Kinetics of the formation and dissociation of gas hydrates from CO2-CH4 mixtures. Energies 2012, 5, 2248–2262. [Google Scholar] [CrossRef]
  68. Eslamimanesh, A.; Babaee, S.; Gharagheizi, F.; Javanmardi, J.; Mohammadi, A.H.; Richon, D. Assessment of clathrate hydrate phase equilibrium data for CO2+CH4/N2+water system. Fluid Phase Equil. 2013, 349, 71–82. [Google Scholar] [CrossRef]
  69. Ballard, A.L.; Sloan, E.D. The next generation of hydrate prediction: An overview. J. Supramol. Chem. 2002, 2, 385–392. [Google Scholar] [CrossRef]
  70. Lu, H.; Matsumoto, R.; Tsuji, Y.; Oda, H. Anion plays a more important role than cation in affecting gas hydrate stability in electrolyte solution?—A recognition from experimental results. Fluid Phase Equil. 2001, 178, 225–232. [Google Scholar] [CrossRef]
  71. Yang, S.O.; Hamilton, S.; Nixon, R.; De Silva, R. Prevention of hydrate formation in wells injecting CO2 into the saline aquifer. SPE Prod. Oper. 2015, 30, 52–58. [Google Scholar] [CrossRef]
  72. Yang, S.H.B.; Babu, P.; Chua, S.F.S.; Linga, P. Carbon dioxide hydrate kinetics in porous media with and without salts. Appl. Energy 2016, 162, 1131–1140. [Google Scholar] [CrossRef]
  73. Sun, Q.; Tian, H.; Guo, X.; Liu, A.; Yang, L. Solubility of CO2 in water and NaCl solution in equilibrium with hydrate. Part II: Model calculation. Can. J. Chem. Eng. 2018, 96, 620–624. [Google Scholar] [CrossRef]
  74. Ahmad, S.; Li, Y.; Li, X.; Xia, W.; Chen, Z.; Ullah, N. Numerical analysis of CO2 hydrate growth in a depleted natural gas hydrate formation with free water. Greenh. Gases Sci. Technol. 2019, 9, 1181–1201. [Google Scholar] [CrossRef]
  75. Aghajanloo, M.; Yan, L.; Berg, S.; Voskov, D.; Farajzadeh, R. Impact of CO2 hydrates on injectivity during CO2 storage in depleted gas fields: A literature review. Gas Sci. Eng. 2024, 123, 205250. [Google Scholar] [CrossRef]
  76. Mahmood, M.N.; Islam, M.T.; Guo, B. Carbon Dioxide Hydrate Formation in Porous Media Under Dynamic Conditions for CO2 Storage in Low-Temperature Water Zones. Appl. Sci. 2024, 14, 10860. [Google Scholar] [CrossRef]
  77. Guo, B.; Islam, M.; Mahmood, M. Carbon dioxide hydrate formation in porous media under dynamic conditions. Energy Sci. Eng. 2024, 12, 5266–5271. [Google Scholar] [CrossRef]
  78. Indina, V.; Fernandes, B.R.B.; Delshad, M.; Farajzadeh, R.; Sepehrnoori, K. On the Significance of Hydrate Formation/Dissociation during CO2 Injection in Depleted Gas Reservoirs. SPE J. 2024, 29, 7194–7213. [Google Scholar] [CrossRef]
  79. Castaneda, J.R.; Kahrobaei, S.; Aghajanloo, M.; Voskov, D.; Farajzadeh, R. Numerical and experimental investigation of impact of CO2 hydrates on rock permeability. Fuel 2025, 381, 133708. [Google Scholar] [CrossRef]
  80. Tamáskovics, A.; Kummer, N.; Amro, M. Thermodynamic gas hydrate inhibition for CO2 injection in depleted gas reservoirs. Gas Sci. Eng. 2026, 149, 205868. [Google Scholar] [CrossRef]
  81. Tamáskovics, A.; Kummer, N.; Amro, M.; Alkan, H. Experimental investigation on the stability of gas hydrates under near-wellbore conditions during CO2 injection for geologic carbon storage. Gas Sci. Eng. 2023, 118, 205101. [Google Scholar] [CrossRef]
  82. Gor, G.Y.; Prévost, J.H. Effect of CO2 Injection Temperature on Caprock Stability. Energy Procedia 2013, 37, 3727–3732. [Google Scholar] [CrossRef]
  83. Vilarrasa, V.; Laloui, L. Impacts of thermally induced stresses on fracture stability during geological storage of CO2. Energy Procedia 2016, 86, 411–419. [Google Scholar] [CrossRef]
  84. Thompson, N.; Andrews, J.S.; Bjørnarå, T.I. Assessing Potential Thermo-Mechanical Impacts on Caprock Due to CO2 Injection—A Case Study from Northern Lights CCS. Energies 2021, 14, 5054. [Google Scholar] [CrossRef]
  85. Cordero, J.R.; Sanchez, C.M.; Roehl, D. Impact of cold fluid injection on caprock integrity. In Proceedings of the Ibero-Latin American Congress on Computational Methods in Engineering (CILAMCE), Maceió, Brazil, 11–14 November 2024. [Google Scholar] [CrossRef]
  86. Chatterjee, A.; Younessi, A.; Hamdan, M. Impacts of Thermally Induced Stresses on Caprock Integrity in Depleted Hydrocarbon Reservoirs for CCS Projects. In Proceedings of the EAGE 4th Carbon Capture and Storage Conference Asia Pacific, Kuala Lumpur, Malaysia, 30 June–2 July 2025; pp. 1–4. [Google Scholar] [CrossRef]
  87. Iyera, J.; Lackeyb, G.; Edvardsen, L. A Review of Well Integrity Based on Field Experience at Carbon Utilization and Storage Sites. Int. J. Greenh. Gas Control. 2022, 113, 103533. [Google Scholar] [CrossRef]
  88. Nguyen, V.; Olayiwola, O.; Guo, B.; Liu, N. Well Cement Degradation and Wellbore Integrity in Geological CO2 Storages: A Literature Review. SSRN Electron. J. 2023. [Google Scholar] [CrossRef]
  89. Srimannarayana, V.; Subbarao, C.C.; Raghuram, A.; Srinivas, S.; Pavan, B.M.; Ramana, Y.G.V. Study of Micro Annulus Analysis of Cement Bond Evaluation by using Logging Tools. Indian J. Pet. Eng. 2023, 3, 1–7. [Google Scholar] [CrossRef]
  90. Bazaid, A.; Jawed, R.; Alatigue, M.; Kumar, A. Analysis of Varying Microannulus Size on Cement Evaluation. In Proceedings of the SPE Symposium—Well Integrity Management, Al-Khobar, Saudi Arabia, 21–22 May 2024. [Google Scholar] [CrossRef]
  91. De Andrade, J.; Sangesland, S.; Skorpa, R.; Todorovic, J.; Vrålstad, T. Experimental laboratory setup for visualization and quantification of Cement-Sheath integrity. SPE Drill. Complet. 2016, 31, 317–326. [Google Scholar] [CrossRef]
  92. Vrålstad, T.; Skorpa, R.; Werner, B. Experimental studies on cement sheath integrity during pressure cycling. In Proceedings of the SPE/IADC International Drilling Conference and Exhibition, The Hague, The Netherlands, 5–7 March 2019. SPE-194171-MS. [Google Scholar]
  93. Wu, X.; Hou, Z.; Li, Z.; Xie, Y.; Liu, J.; Song, W.; Li, J.; Sun, W. Experimental Analysis of Cyclic Loading Effect on Seal Integrity of Cement Sheath. In DGMK-Tagungsbericht 2023-1; DGMK e.V.: Hamburg, Germany, 2023. [Google Scholar]
  94. Skorpa, R.; Øia, T.; Taghipour, A.; Vrålstad, T. Laboratory setup for determination of cement sheath integrity during pressure cycling. In Proceedings of the ASME 2018 37th International Conference on Ocean, Offshore and Arctic Engineering OMAE2018, Madrid, Spain, 17–22 June 2018. [Google Scholar]
  95. Kuanhai, D.; Yue, Y.; Yi, H.; Zhonghui, L.; Yuanhua, L. Experimental study on the integrity of casing-cement sheath in shale gas wells under pressure and temperature cycle loading. J. Pet. Sci. Eng. 2020, 195, 107548. [Google Scholar] [CrossRef]
  96. Shadravan, A.; Schubert, J.; Amani, M.; Teodoriu, C. Using fatigue-failure envelope for cement-sheath-integrity evaluation. SPE Drill. Complet. 2015, 30, 68–75. [Google Scholar] [CrossRef]
  97. Todorovic, J.; Gawel, K.; Lavrov, A.; Torsæter, M. Integrity of downscaled well models subject to cooling. In Proceedings of the SPE Bergen One Day Seminar, Grieghallen, Bergen, Norway, 20 April 2016. SPE-180052-MS. [Google Scholar]
  98. Roy, P.; Walsh, S.D.C.; Morris, J.; Todorovic, J.; Gawel, K.; Iyer, J.; Hao, Y.; Torsater, M. Studying the Impact of Thermal Cycling on Wellbore Integrity during CO2 Injection. In Proceedings of the 50th U.S. Rock Mechanics/Geomechanics Symposium 2016, Houston, TX, USA, 26–29 June 2016. ARMA-2016-668. [Google Scholar] [CrossRef]
  99. Sun, Z.; Fager, A.; Crouse, B. Modeling of Thermal-Mechanical Impact on Wellbore Integrity Due to CO2 injection. In Proceedings of the 58th US Rock Mechanics/Geomechanics Symposium, Golden, CO, USA. ARMA 24-498.
  100. Matteo, E.N.; Huet, B.; Jové-Colón, C.F.; Scherer, G.W. Experimental and modeling study of calcium carbonate precipitation and its effects on the degradation of oil well cement during carbonated brine exposure. Cem. Concr. Res. 2018, 113, 1–12. [Google Scholar] [CrossRef]
  101. Todorovic, J.; Opedal, N.V.d.T.; Werner, B.; Clausen, J.A.; Kvassnes, A.J.S. Effect of long-term aging in carbonated brine on mechanical properties of a novel cement system with an expandable agent. In Proceedings of the SPE Norway Subsurface Conference, Bergen, Norway, 2–3 November 2020. SPE-200753-MS. [Google Scholar]
  102. Dalton, L.E.; Crandall, D.; Pour-Ghaz, M. Supercritical, liquid, and gas CO2 reactive transport and carbonate formation in Portland cement mortar. Int. J. Greenh. Gas Control. 2022, 116, 103632. [Google Scholar] [CrossRef]
  103. Nassan, T.H.; Kummer, N.--A.; Fogden, A.; Solbakken, J.; Aarra, M.G.; Zamani, N.; Burachok, O.; Amro, M. Experimental evaluations of cementing systems exposed to carbonated water in relation to geological carbon storage (GCS) operations. In Proceedings of the SPE Europe Energy Conference and Exhibition, Vienna, Austria, 10–12 June 2025. SPE-225602-MS. [Google Scholar] [CrossRef]
  104. Azin, R.; Mehrabi, N.; Osfouri, S.; Asgari, M. Experimental study of CO2-saline aquifer-carbonate rock interaction during CO2 sequestration. Procedia Earth Planet. Sci. 2015, 15, 413–420. [Google Scholar] [CrossRef]
  105. Jahanbakhsh, A.; Liu, Q.; Mosleh, M.H.; Agrawal, H.; Farooqui, N.M.; Buckman, J.; Recasens, M.; Maroto-Valer, M.; Korre, A.; Durucan, S. An Investigation into CO2-brine-cement-reservoir rock interactions for wellbore integrity in CO2 geological storage. Energies 2021, 14, 5033. [Google Scholar] [CrossRef]
  106. Nassan, T.H.; Kirch, M.; Freese, C.; Alkan, H.; Baganz, D.; Amro, M. Experimental investigation of wellbore integrity during geological carbon sequestration: Thermal- and pressure-cycling experiments. Gas Sci. Eng. 2024, 124, 205253. [Google Scholar] [CrossRef]
  107. Nassan, T.H.; Freese, C.; Baganz, D.; Alkan, H.; Burachok, O.; Solbakken, J.; Zamani, N.; Aarra, M.G.; Amro, M. Integrity experiments for geological carbon storage (GCS) in depleted hydrocarbon reservoirs: Wellbore components under cyclic CO2 injection conditions. Energies 2024, 17, 3014. [Google Scholar] [CrossRef]
  108. Panduro, E.A.C.; Cordonnier, B.; Gawe, K.; Børve, I.; Iyer, J.; Carroll, S.; Michels, L.; Rogowska, M.; McBeck, J.A.; Sørensen, H.O.; et al. Real time 3D observations of Portland cement carbonation at CO2 storage conditions. Environ. Sci. Technol. 2020, 54, 8323–8332. [Google Scholar] [CrossRef]
  109. Achang, M.; Radonjic, M. Adding olivine micro particles to Portland cement based wellbore cement slurry as a sacrificial material: A quest for the solution in mitigating corrosion of wellbore cement. Cem. Concr. Compos. 2021, 121, 104078. [Google Scholar] [CrossRef]
  110. Chang, J.; Lin, K.; Wei, N.; Liu, S.; Jing, M.; Yang, C.; Liu, T. THMC Modeling for CO2 Geological Storage: Advances, Challenges, and Prospects. ACS Omega 2026, 11, 15642–15678. [Google Scholar] [CrossRef]
  111. Pruess, K.; Müller, N. Formation dry-out from CO2 injection into saline aquifers: 1. Effects of solids precipitation and their mitigation. Water Resour. Res. 2009, 45, W03402. [Google Scholar] [CrossRef]
  112. Alkan, H.; Cinar, Y.; Ulker, E.B. Impact of Capillary Pressure, Salinity and In situ Conditions on CO2 Injection into Saline Aquifers. Transp. Porous Media 2010, 84, 799–819. [Google Scholar] [CrossRef]
  113. Pruess, K. ECO2M: A TOUGH2 Fluid Property Module for Mixtures of Water, NaCl, and CO2, Including Super- and Sub-Critical Conditions, and Phase Change Between Liquid and Gaseous CO2; Technical Report; OSTI (U.S. Department of Energy Office of Scientific and Technical Information): Oak Ridge, TN, USA, 2011. [CrossRef]
Figure 1. The schematic of the wellbore and near-wellbore of CO2 injection: Thermodynamics and related challenges.
Energies 19 02548 g001
Figure 2. (a) Minimum temperatures calculated with Equation (2) for the model used in this study; (b) CO2 J-T coefficients based on experimental data from [34,35].
Energies 19 02548 g002
Figure 3. (a) Comparison of the reservoir pressure and CO2 density as functions of time calculated for the model used in the study; (b) calculated temperature profiles after 10 years of injection (top) and at the end of simulation time, 500 years (bottom). Note the larger scale in the z direction.
Energies 19 02548 g003
Figure 4. Thermo−hydraulic fracture initiation criteria calculated based on the model proposed by [40] for injection constant (γh) values of 0.71 (a) and 0.46 (b); the data and assumptions taken for the calculations are provided in Appendix B.
Energies 19 02548 g004
Figure 5. Comparison of observed and calculated differential pressure and brine production at theoutlet for core TUF−4 (a) and TUF−5 (b), shown as an example from salt precipitation experiments.
Energies 19 02548 g005
Figure 6. Permeability reduction profiles in DGR model (defined by the ratio of actual to absolute permeability) after 10 years of CO2 injection for three different cases; (a) the injection temperature is 10 °C; (b) CO2 is injected at reservoir temperature (80 °C); (c) the dissolved salt (NaCl) concentration increased to 25 wt%., cold injection and a more conservative porosity–permeability relationship. Note the larger scale in the z direction.
Energies 19 02548 g006
Figure 8. (a) Temperature profiles in the model reservoir (lower) and caprock (upper); note the larger scale in the z direction. (b) Temperature profile in the caprock for the blocks at 1 m and 50 m horizontal distance from the wellbore after 20 years of injection.
Energies 19 02548 g008
Figure 9. Equipment used in TUBAF for well integrity measurements: (a) Large-scale two-chamber experimental setup; (b) small-scale unsteady-state two-chamber facility.
Energies 19 02548 g009
Figure 10. (a) Permeability of the composite sample cement (Class G)/anhydrite, as shown in the picture on the right top corner, (b) and of cement (Class G)/ct, as shown in the picture on the right top corner, at different effective pressures.
Energies 19 02548 g010
Figure 11. (a) Example of thermal loads applied to a cement–casing composite sample in the large-scale setup. The temperature was decreased in steps from ambient temperature (14 °C) to 2 °C, −4 °C, and finally to −9 °C, and then increased back to the ambient temperature. (b) Effect of pressure cycling on permeability of the casing–cement composite (Class G).
Energies 19 02548 g011
Table 1. Phenomena and challenges of CO2 storage in DGR with impacts and mitigation methods.
ChallengeImpact, Severity, ProbabilityMitigation
Thermo-hydraulic fracturingImprovement in injectivity as well as in plume development (capacity) in the reservoir; potential risk on well and caprock integrity. Severity depends on geomechanical parameters and on the magnitude of cooling. Low probability.Assess and control the thermodynamics of the well, the near-wellbore and the caprock. Reliable prediction of the thermodynamics of the wellbore and NWZ is necessary, as it is for its coupling with the reservoir.
Hydrate formationPlug the pores, decreasing the injectivity, potential synergy with salt precipitation, medium to low severity. Low to null probability.Avoid GHSZ with NWZ thermodynamics and check especially if the DGR permeability is lower than 10 mD. Use effective inhibitors if there is any risk.
Chemical reactionsPrecipitation and/or dissolution of minerals, change in ϕ/k with longer-term challenges. Non-to-low impact on capacity and injectivity. Low severity on containment. Low probability in the long term. Assess thermodynamic and chemical equilibrium in relation to kinetics. A preliminary assessment using chemically coupled numerical simulators with reliable databases generally yields satisfactory results.
DO, water evaporationEvaporation of the remaining water saturation (if any) around the well increases the permeability to CO2, increasing the injectivity. High probability.No need for mitigation, this is just a positive aspect.
SO, salt precipitationCan plug the pores, decreasing the injectivity, low severity due to low brine saturation. It can be an issue if there is water influx from the surrounding formations. Low probability.Brine salinity and saturation are the main factors; local brine supply is limited if there is no influx from the surrounding formations. The challenge can be assessed if there is no water influx from the surroundings. If yes, the perforations could be accordingly planned (new well).
Cyclic integrityIt has been demonstrated that a reduction in the mechanical strength of the casing/cement bond can occur, which can, in turn, lead to the development of microannuli. This, in turn, has the potential to jeopardize the well’s integrity. High severity. Medium to low probability.Pre-investigation of stability and integrity under cyclic conditions; laboratory assessments of geomechanical parameters and validation of integrity.
Disclaimer/Publisher’s Note: The statements, opinions and data contained in all publications are solely those of the individual author(s) and contributor(s) and not of MDPI and/or the editor(s). MDPI and/or the editor(s) disclaim responsibility for any injury to people or property resulting from any ideas, methods, instructions or products referred to in the content.