Review

Baseline, Benefits, Barriers, and Beyond: A Review of ISO 50001 Energy Management System Implementation in the AI-Driven Data Center Industry


by
Lito Jr. Pagulayan
1,2,* and
Aldrin D. Calderon
1,2
1
School of Graduate Studies, Mapua University, Manila 1002, Philippines
2
School of Mechanical, Manufacturing, and Energy Engineering, Mapua University, 658 Muralla St., Intramuros, Manila 1002, Philippines
*
Author to whom correspondence should be addressed.
Energies 2026, 19(11), 2550; https://doi.org/10.3390/en19112550
Submission received: 14 March 2026 / Revised: 5 May 2026 / Accepted: 8 May 2026 / Published: 25 May 2026

Abstract

The rapid expansion of Artificial Intelligence (AI) is transforming data centers into energy-intensive industrial systems, with global power consumption projected to exceed 1000 TWh by 2026. Cooling has emerged as the primary controllable non-IT energy driver, accounting for up to 40% of total facility consumption. This review evaluates the implementation of ISO 50001:2018 Energy Management Systems (EnMS) as a strategic response to the “energy–intelligence paradox”—the tension between accelerating digital capability and physical power constraints. Utilizing a “Baseline, Benefits, Barriers, and Beyond” analytical framework, the study finds that global ISO 50001 adoption in the data center sector remains below 15% despite significant cost and compliance advantages. Through PEST analysis, the research identifies critical implementation barriers, including AI workload volatility and the high capital costs associated with liquid-cooling retrofits. The findings demonstrate that effective energy management in the AI era must shift from a narrow focus on compute efficiency to a broader governance of cooling systems. Ultimately, this study positions ISO 50001 as an emerging “license-to-operate” framework essential for navigating 2026 regulatory mandates and ensuring the long-term scalability of global digital infrastructure.

1. Introduction

The data center industry is undergoing a structural transformation driven by the rapid deployment of artificial intelligence (AI) across economic sectors. Unlike traditional enterprise or cloud computing, AI workloads—particularly those associated with model training and large-scale inference—are dominated by graphics processing units (GPUs) and specialized accelerators that introduce unprecedented electrical and thermal intensity [1,2]. Rack power densities exceeding 40–100 kW are increasingly common, accompanied by rapid power transients and complex thermal behavior that challenge conventional infrastructure assumptions [3].
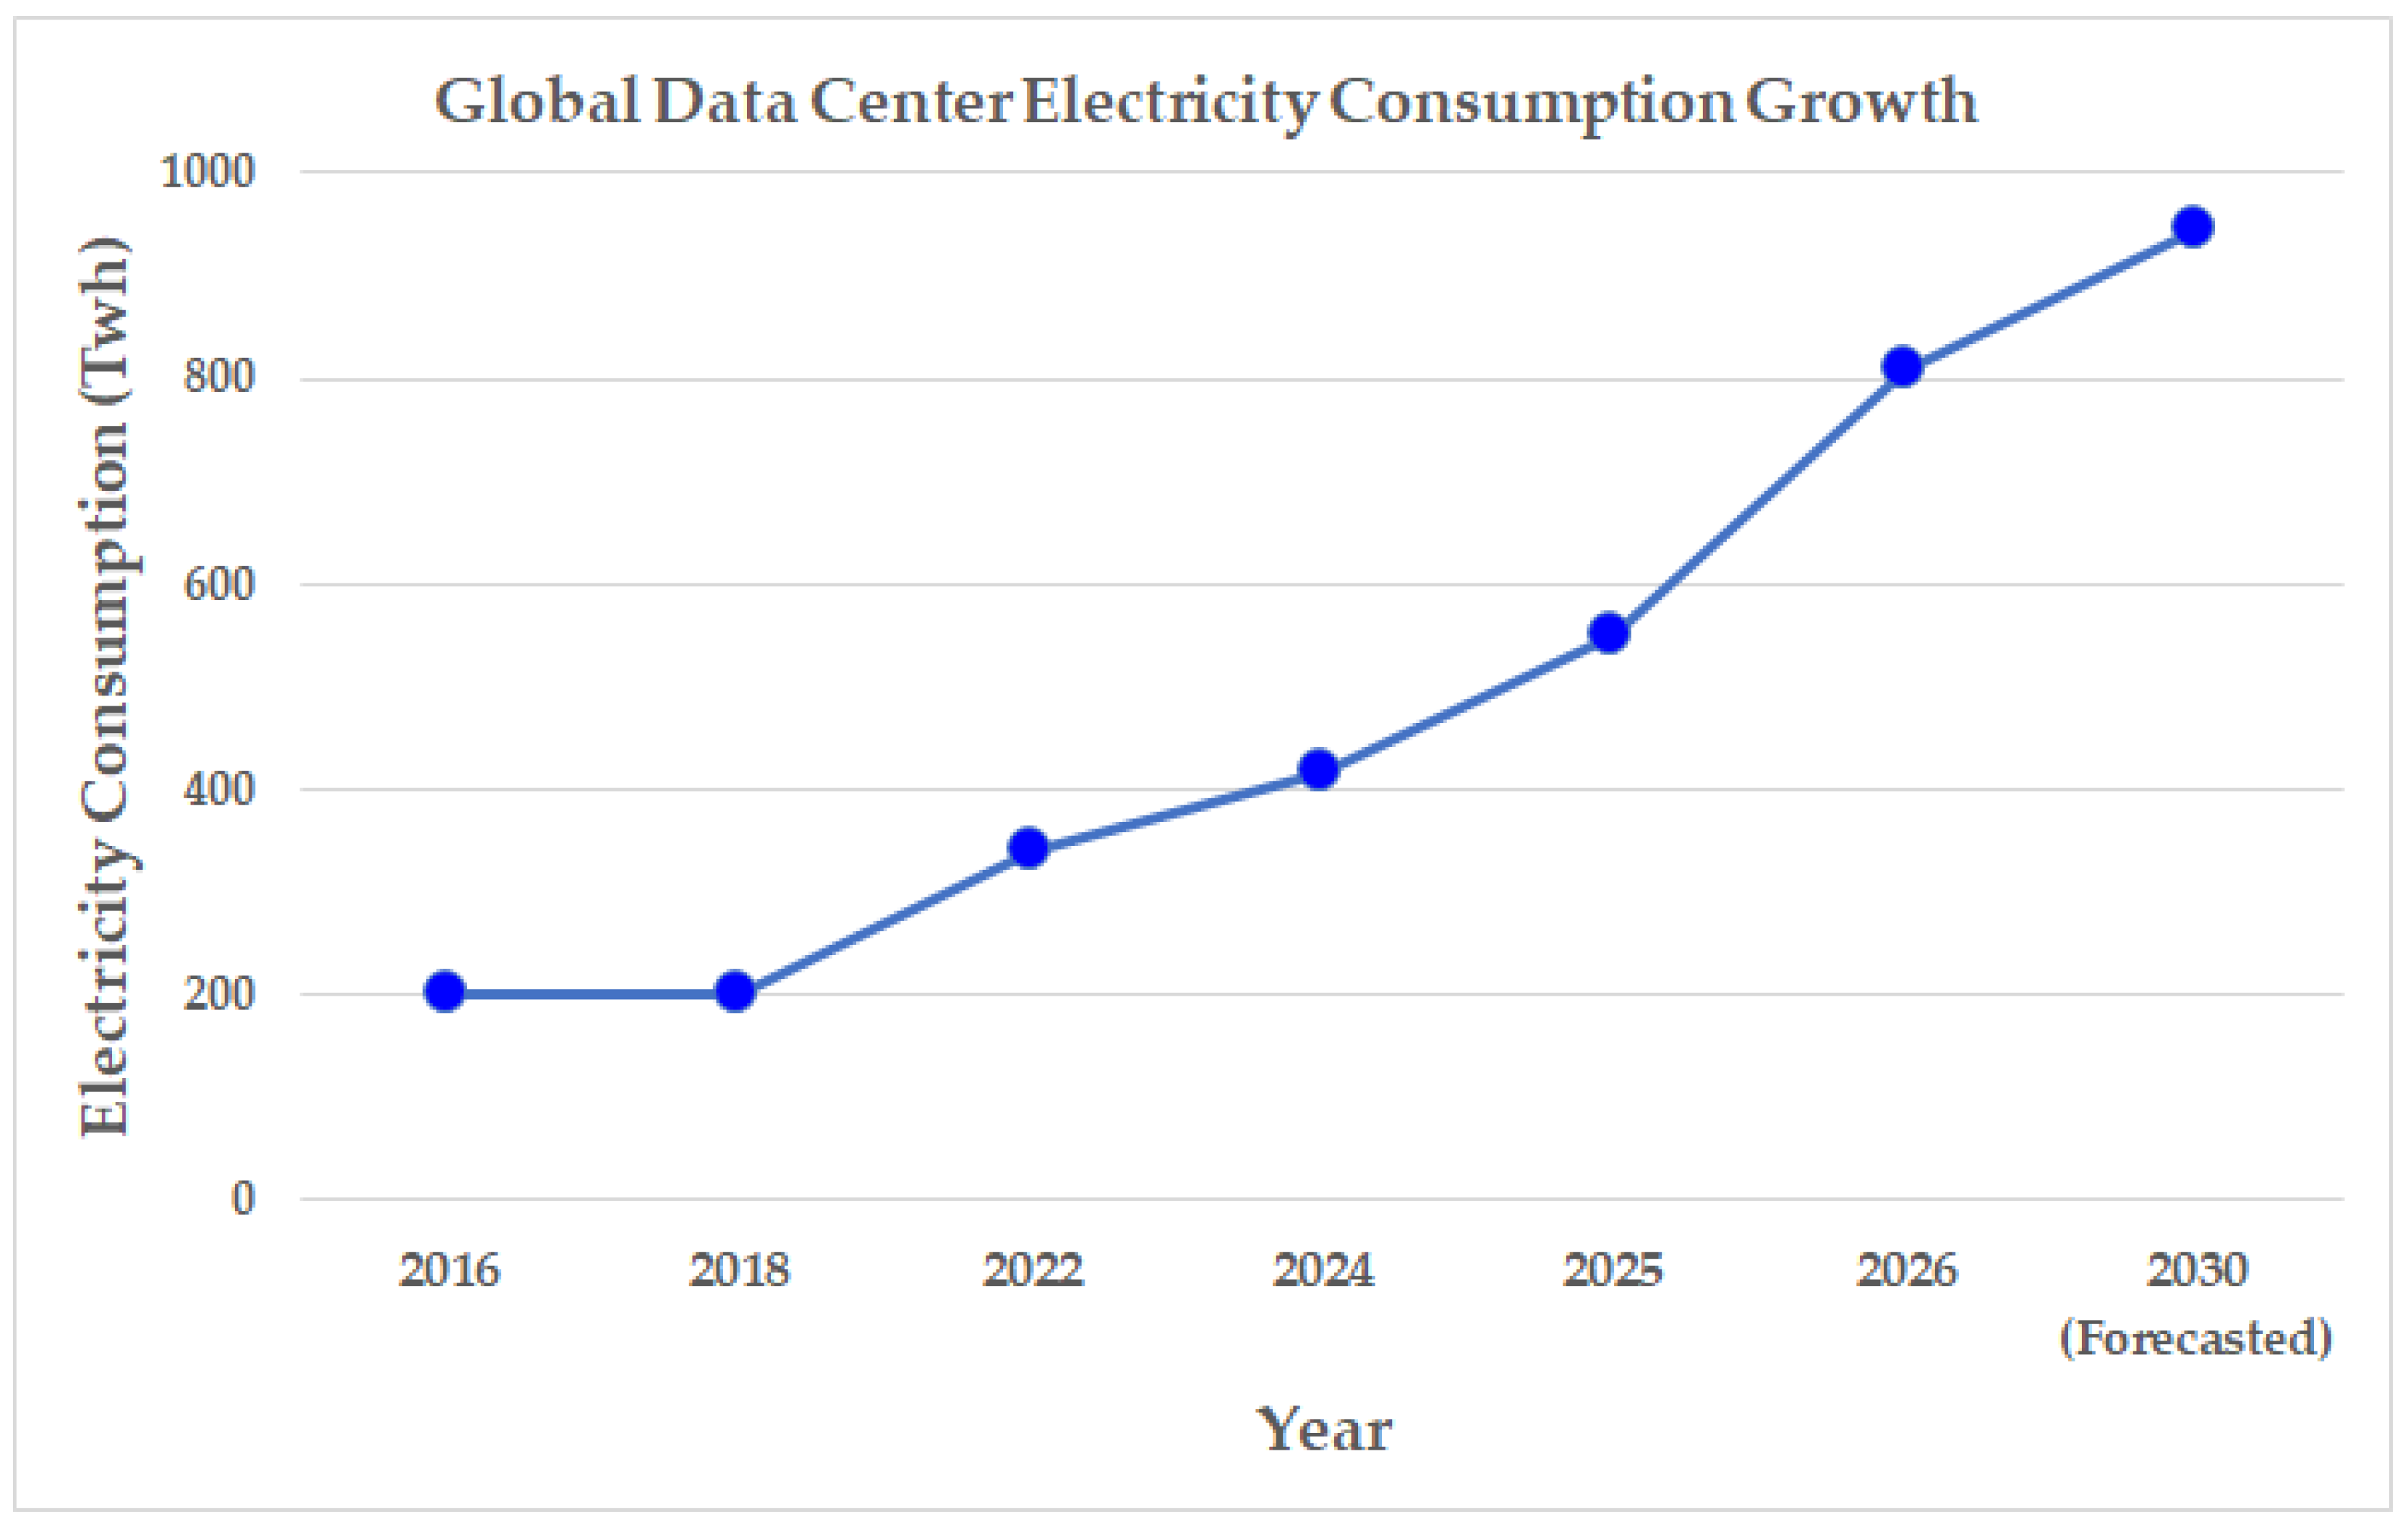
International energy outlooks estimate that global data center electricity consumption growth, as illustrated in Figure 1, will reach nearly 1000 TWh per year by 2030, positioning the sector among the world’s largest electricity consumers [4,5,6]. At this scale, data centers no longer function as passive digital infrastructure but as energy-intensive industrial systems that materially influence grid planning, energy security, and emissions trajectories [7,8]. While compute efficiency and renewable electricity procurement dominate public discourse, cooling systems have emerged as the dominant controllable energy lever, often representing the largest share of non-IT electricity consumption, particularly in warm and humid climates [9,10,11].
AI intensifies the cooling challenge by compressing thermal margins and accelerating the transition from air-based cooling to liquid-based solutions [3,10]. These changes directly affect total energy consumption, peak electrical demand, water use, and refrigerant management, elevating cooling from a facility-level concern to a policy-relevant issue [11,12].
ISO 50001:2018 Energy Management Systems provide a governance-based framework capable of integrating cooling, computing, and electrical performance within a continuous improvement cycle [13]. ISO 50001:2018 is a management system standard designed to enable organizations to establish systems and processes necessary for continuous improvement in energy performance [14].
Unlike prescriptive efficiency standards or one-time energy audits, ISO 50001 emphasizes organizational governance through the Plan–Do–Check–Act (PDCA) cycle, supported by Energy Baselines (EnB) and Energy Performance Indicators (EnPIs) [15,16,17]. These characteristics align closely with the operational realities of data centers, which operate continuously and depend on tightly coupled interactions between IT load, cooling, and electrical systems.
Regulatory responses reflect this shift. The EU Energy Efficiency Directive and Germany’s Energy Efficiency Act impose mandatory energy management and performance requirements on large data centers [18,19]. In Asia-Pacific, jurisdictions such as Singapore and China increasingly link expansion approvals to demonstrated energy and cooling performance [20,21].
The applicability of ISO 50001 becomes particularly pronounced in AI-driven data centers. AI workloads introduce fast transient energy behavior that renders static baselining ineffective. ISO 50001 explicitly allows normalization of energy performance against relevant variables such as workload intensity, utilization, and climatic conditions [20,22]. This flexibility enables the development of AI-appropriate EnPIs, including energy per GPU-hour, energy per training run, and cooling energy per megawatt of IT load.
Beyond technical control, ISO 50001 functions as a governance and communication framework. Certification provides auditable evidence of responsible energy stewardship, facilitating regulatory compliance, grid access negotiations, sustainability-linked financing, and social license to operate [23,24].
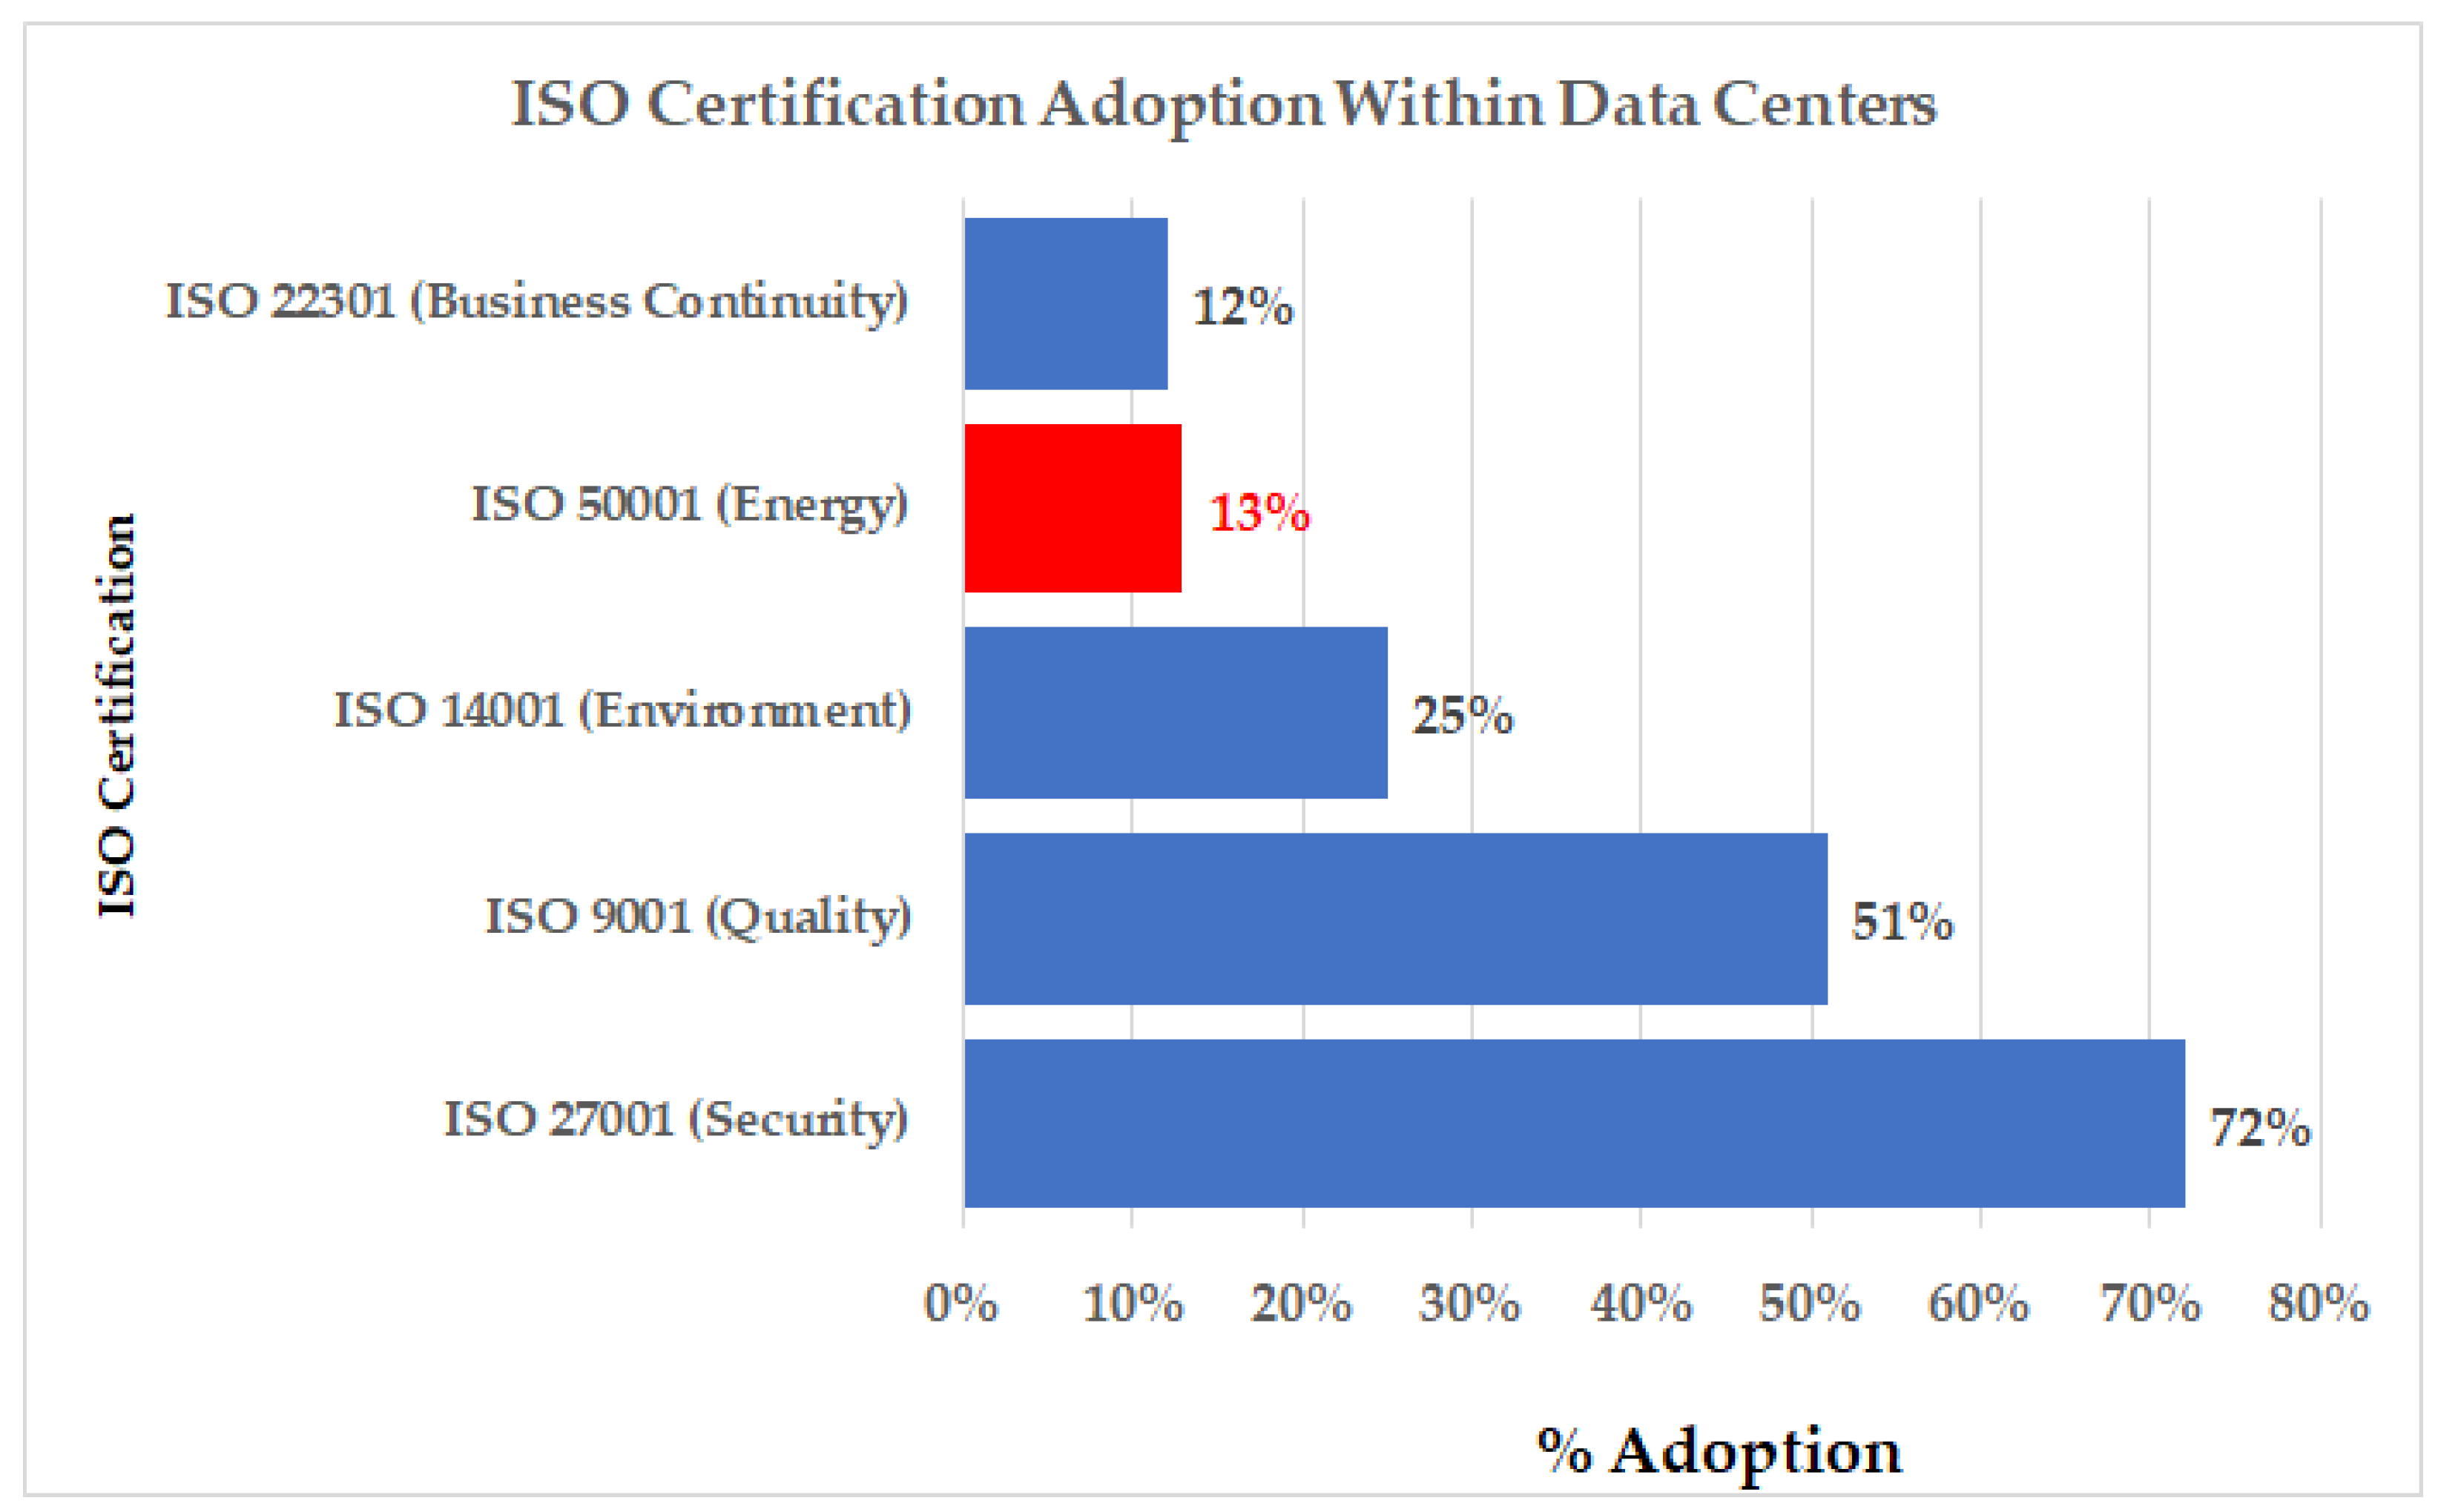
Despite escalating energy consumption, tightening regulations, and demonstrated financial benefits, fewer than 15% of data center operators globally have implemented ISO 50001-certified Energy Management Systems (refer to Figure 2) [25]. This adoption gap is particularly concerning given that 2026 represents a global compliance inflection point, with enforceable mandates in Europe and performance-gated growth regimes emerging across Asia-Pacific [26].
As per Figure 2, in the context of data centers, these adoption rates reflect a “hierarchy of priorities,” where security (ISO 27001) [27] and reliability (ISO 9001) [28] are the non-negotiable foundations, while environmental and energy management are the rapidly growing “next frontier.”
The significance of this study lies in addressing the energy–intelligence paradox: while AI innovation accelerates, its deployment is increasingly constrained by physical energy systems rather than digital capability [4,7].
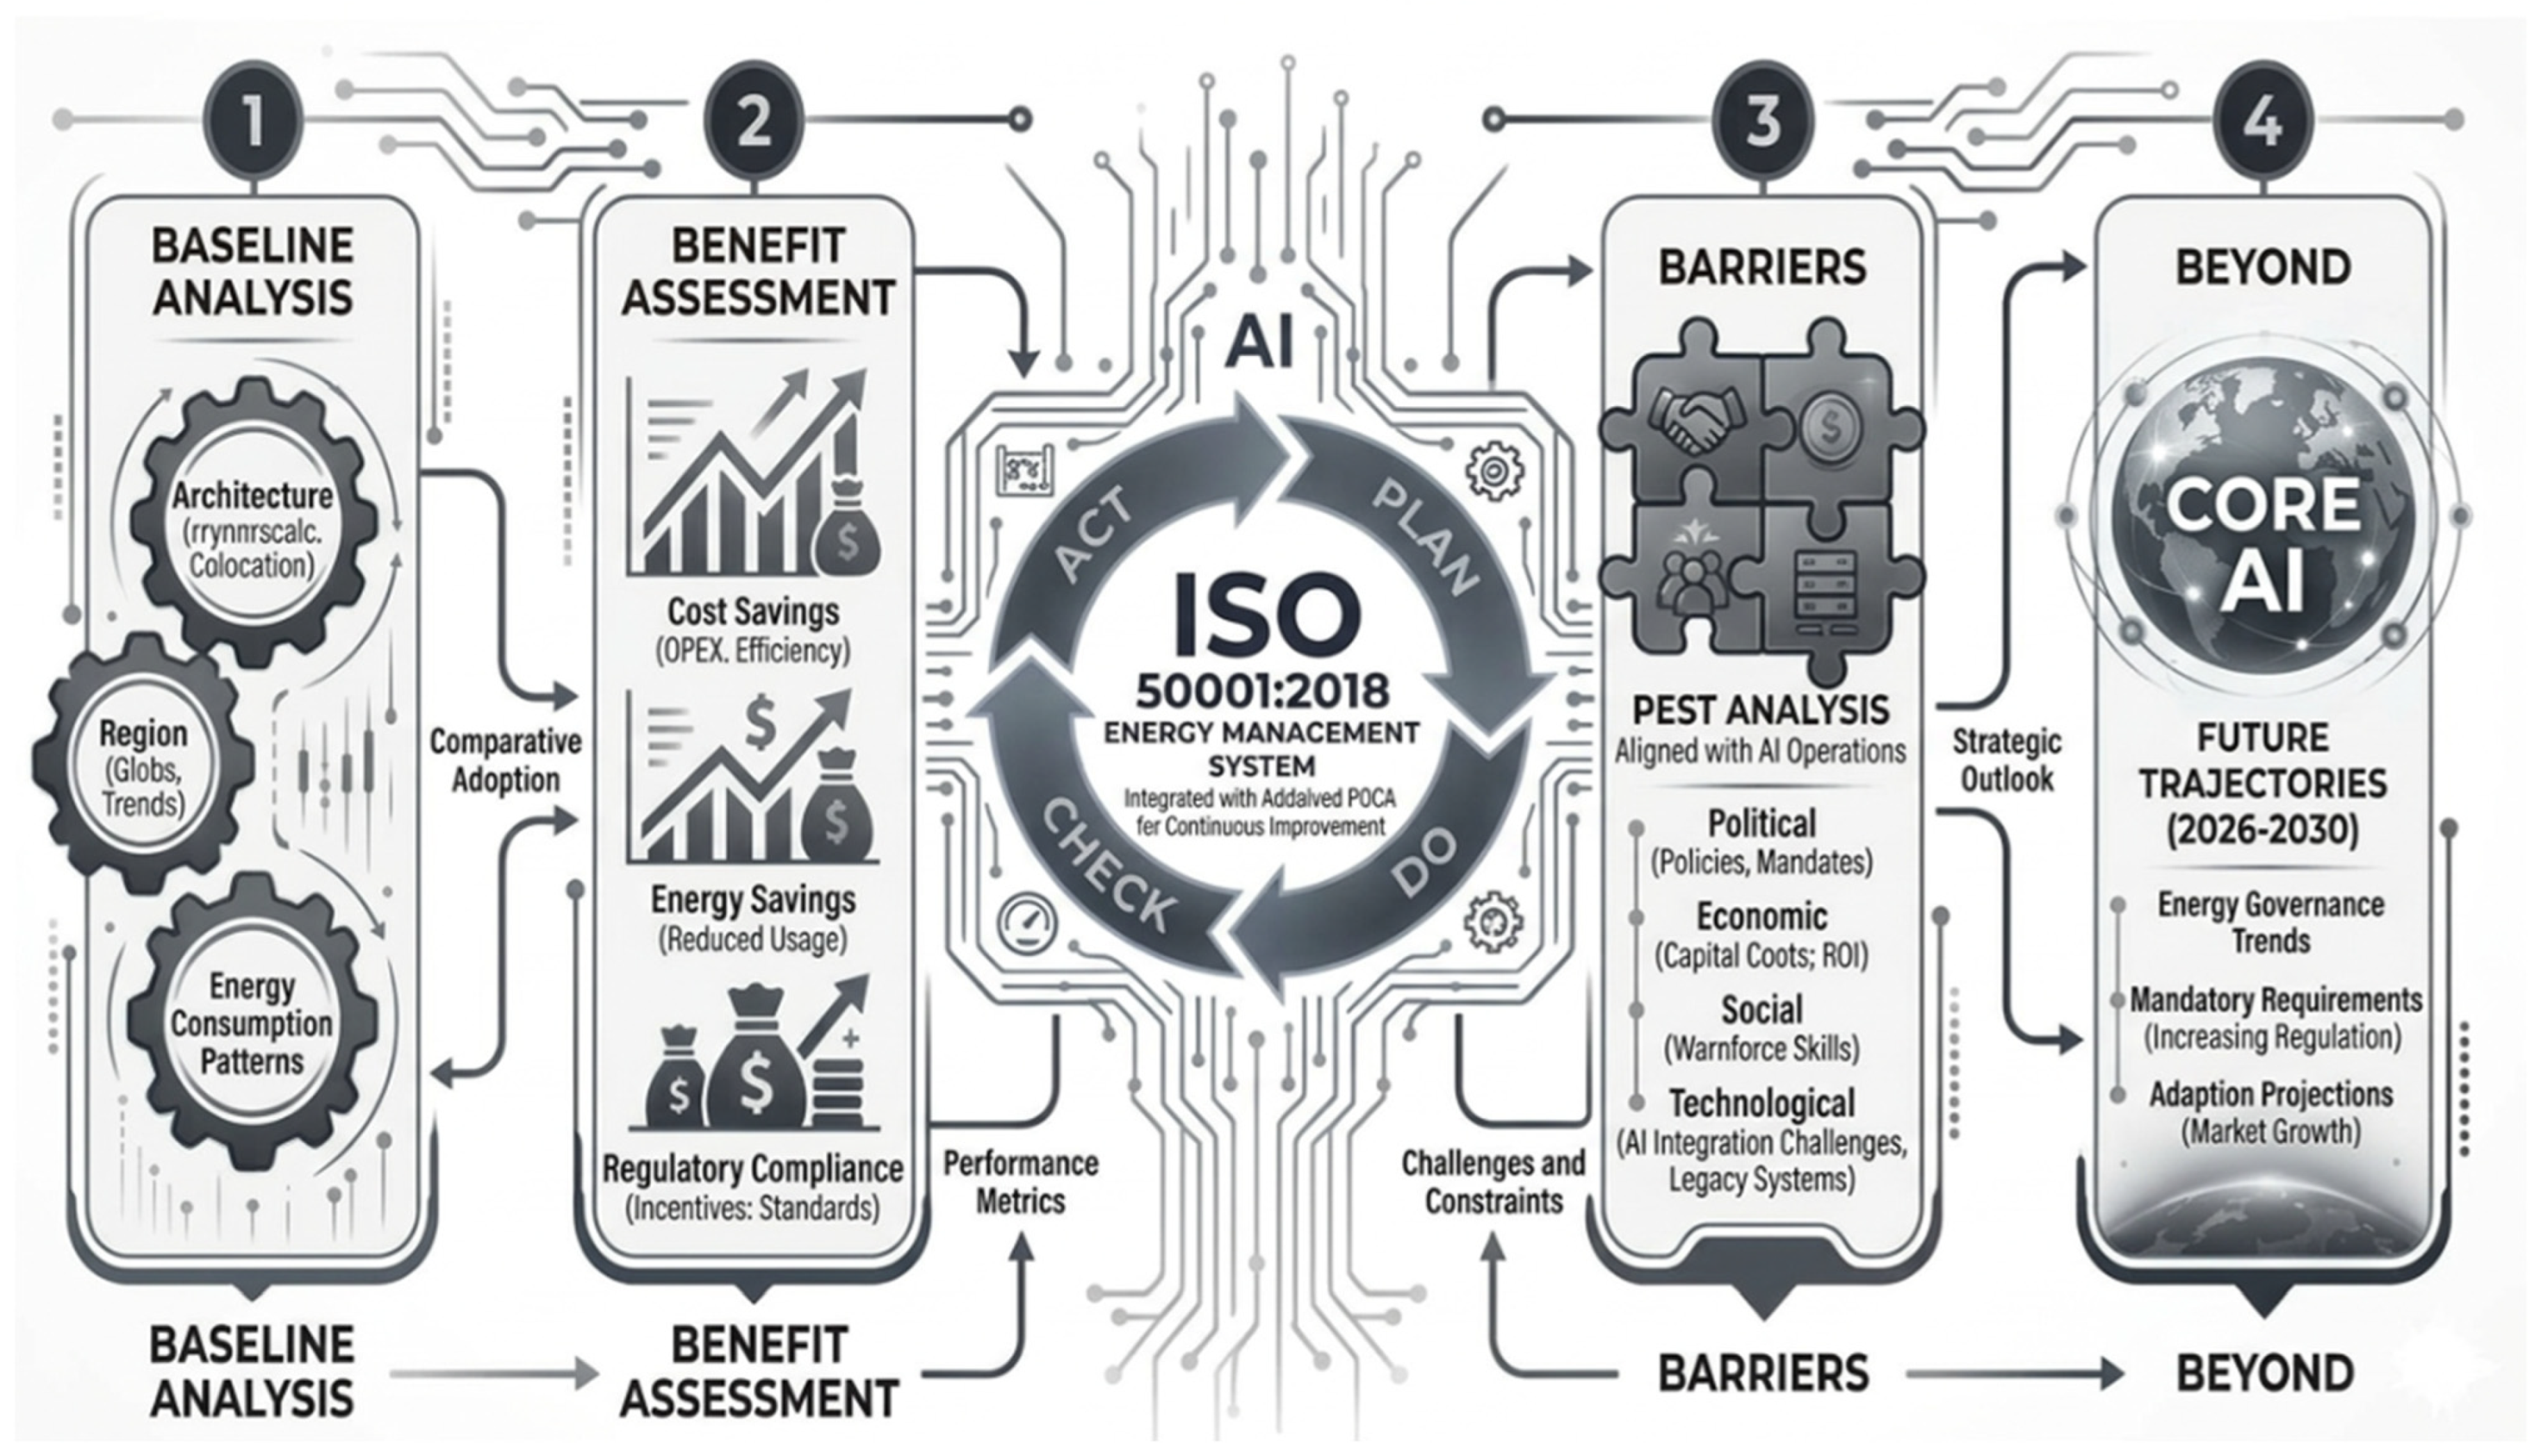
To systematically address these research aims, this review adopts a conceptual framework based on a thematic “4-B” architecture, illustrated in Figure 3. This framework serves as the logical foundation for the paper’s progression: Section 3 presents the Results through four interconnected lenses—the current Baseline of ISO 50001 adoption, the operational Benefits of implementation, the critical Barriers, and the trajectory Beyond toward 2030 energy governance targets.
As illustrated in Figure 3, the conceptual framework for this review is organized into a sequential four-stage analysis.
Stage 1: Baseline Analysis establishes the current landscape by examining adoption patterns across varied data center architectures (e.g., Hyperscale vs. Traditional) and regional Data Center energy consumption trends.
Stage 2: Benefit Assessment synthesizes the primary drivers for ISO 50001 certification, categorizing them into economic efficiency (OPEX), quantifiable energy savings, and alignment with evolving regulatory standards.
Stage 3: Barriers utilizes a PEST (Political, Economic, Social, and Technological) framework to categorize implementation constraints. This section specifically addresses how AI-driven operations introduce unique challenges, such as high capital costs for specialized hardware and the technical complexity of integrating EnMS with legacy systems.
Stage 4: Beyond provides a strategic outlook toward 2030, projecting mandatory energy governance requirements and the evolution of autonomous management systems.
The academic contribution of this review is twofold. First, it addresses the “energy–intelligence paradox,” the critical tension whereby rapid advances in artificial intelligence accelerate digital capability while the physical deployment of AI infrastructure is increasingly constrained by the cooling capacity and electrical limits of data center facilities [1,2]. Second, unlike the existing literature that focuses primarily on IT hardware efficiency metrics such as FLOPS per watt, this study introduces a four-dimensional analytical framework encompassing Baseline, Benefits, Barriers, and Beyond. This framework identifies cooling governance as a primary determinant of sustainability in high-density computing environments and establishes a theoretical basis for AI-aware Energy Performance Indicators (EnPIs) that normalize volatile AI workloads against liquid-cooling and environmental operating variables [5,7].

2. Materials and Methods

This review adopts a structured, comparative methodology combining qualitative and quantitative synthesis of secondary data from authoritative international sources. To evaluate the implementation of ISO 50001:2018 across the data center industry, data were synthesized from five primary thematic streams:
  • Energy Consumption and Outlooks: Global electricity demand statistics and regional consumption trends were sourced from the International Energy Agency (IEA), BloombergNEF, and the U.S. Department of Energy (DOE) [1,2,5,11].
  • Certification and Adoption Statistics: Global and regional ISO 50001 adoption rates were derived from the ISO Survey of Management System Certifications and corporate disclosure databases from ISS-Corporate [17,29,30].
  • Market and Infrastructure Data: Physical data center counts and facility-scale classifications (Hyperscale vs. Traditional) were sourced from Cargoson Industry Reports and JLL Global Data Center Outlooks [26,31].
  • Regulatory and Policy Frameworks: Mandatory compliance requirements and performance-gated growth policies were analyzed using the EU Energy Efficiency Directive (EED), Germany’s Energy Efficiency Act (EnEfG), and the Singapore Green Data Centre Roadmap [14,15,18,19,20,32,33,34].
  • Technical Standards and Performance Benchmarking: Performance is evaluated using ISO/IEC 30134 metrics (PUE, WUE, ERF), ASHRAE Thermal Guidelines, and financial modeling data from the Clean Energy Ministerial and Schneider Electric to calculate annual energy cost savings [4,7,35,36,37,38,39,40,41,42].
Cooling-related Energy Performance Indicators (EnPIs) are normalized against AI workload intensity (e.g., GPU-hours) and climatic variables, consistent with ISO 50006 guidance on energy performance normalization [15,20,43,44].

Study Limitations

This review utilizes secondary data, industry reports, and regulatory documents, which are frequently aggregated at regional or sectoral levels. Due to the limited observation counts within certain datasets, the analysis relies on descriptive synthesis and scenario-informed evidence rather than formal inferential statistical testing. Consequently, the trends identified across the Baseline, Benefits, and Barriers sections characterize the current landscape and future Beyond trajectories but do not establish statistically significant causal relationships. This descriptive approach is intended to provide a foundational framework for energy governance in the AI-driven data center industry.

3. Results

This section presents a narrative synthesis of findings explicitly structured around the comparative scope defined in Section 2, integrating data center architecture (Traditional vs. AI-driven), regional governance regimes (Europe, Asia-Pacific, United States), and energy consumption characteristics (magnitude, volatility, and normalization). Rather than treating results as isolated outcomes, the discussion explains how differences in ISO 50001 adoption, performance, and challenges emerge from the interaction of these three dimensions.

3.1. Baseline Analysis: Comparative Adoption Patterns Across Architecture, Energy Consumption and Region

From an architectural perspective, traditional and AI-driven data centers exhibit fundamentally different baseline conditions for ISO 50001 implementation. Traditional data centers typically operate at rack power densities of 7–10 kW/rack with relatively stable cooling demand, enabling straightforward energy baseline definition but often lacking granular sub-metering [45,46]. In contrast, AI-driven data centers operate at significantly higher absolute energy consumption levels, with rack densities of 30 kW/rack to over 100 kW/rack at very high density [44]. Key distinctions between AI and conventional data centers are summarized in Table 1. Moreover, AI-driven data centers exhibit high absolute cooling loads, rapid energy transients, and tighter thermal constraints [29,47]. While instrumentation is more advanced, defining stable and auditable baselines is complicated by the interaction between AI workload scheduling and cooling system response [48].
Data centers facilities were typically well instrumented, yet their energy baselines are more difficult to normalize due to fast transient AI workloads. This architectural divergence explains why ISO 50001 adoption among AI-driven facilities is often selective and concentrated in sites facing immediate regulatory or grid-related pressure.
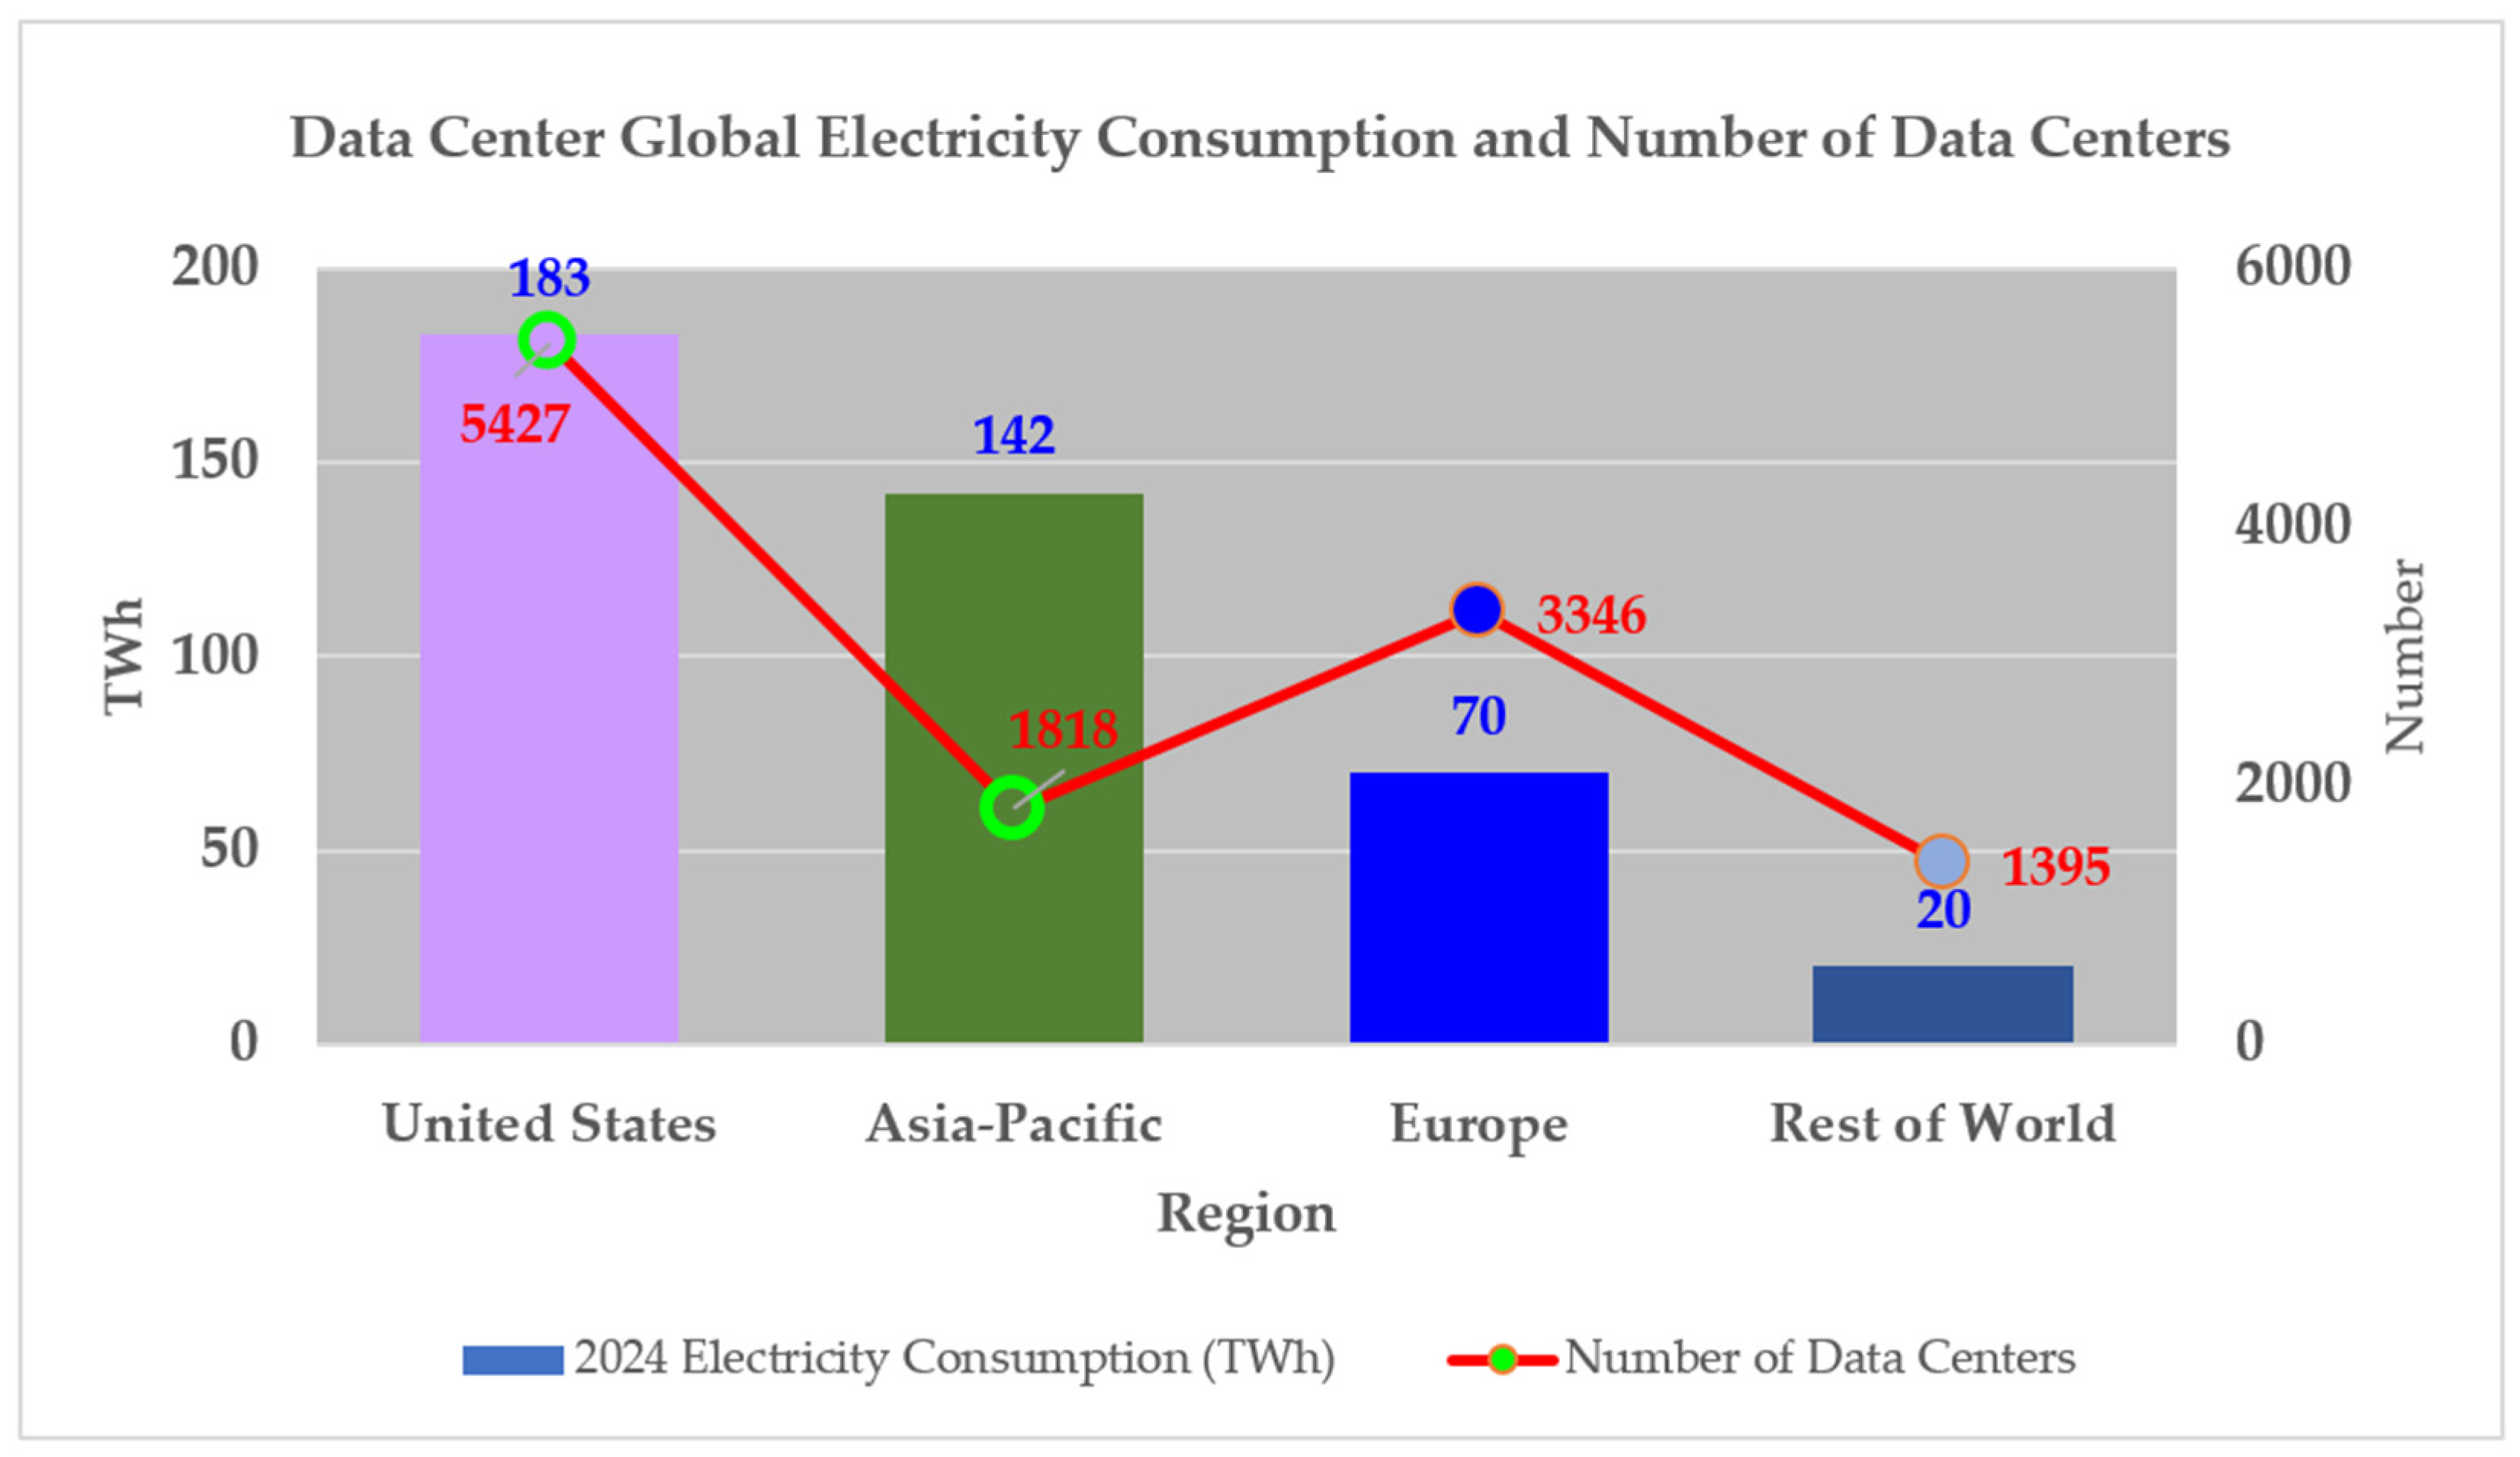
In terms of energy consumption, AI data centers are emerging as one of the fastest-growing electricity consumers in the energy sector. Global data centers consumed around 415 TWh of electricity in 2024, accounting for about 1.5% of total global electricity consumption, according to the International Energy Agency [5]. The United States was the largest contributor, accounting for 45% of electricity demand, followed by Asia-Pacific at 34% and Europe at 15%. Moreover, based on the number of data centers by country as of November 2025, the United States hosts approximately 5247 data centers, making it the world’s largest data center market by a significant margin. Europe hosts 3346, and Asia-Pacific hosts 1818 facilities [31]. Figure 4 presents the relationship between regional electricity consumption and the number of data centers.
Based on Figure 4, the high electricity consumption of the United States—approximately 183 TWh—is largely driven by its large number of operational data centers. In contrast, Asia-Pacific hosts fewer facilities but exhibits comparatively higher energy demand due to hyperscale and AI-optimized infrastructure.
While Europe hosts more data centers than Asia-Pacific, its total electricity consumption remains lower due to several structural factors.
  • Data Center Scale and Density
Asia-Pacific: The region hosts a high concentration of hyperscale data centers and major data-center hubs such as those in China and Singapore. These facilities often exceed 100 MW of power demand, significantly increasing electricity consumption.
Europe: Many European data centers consist of smaller enterprises or colocation facilities with lower individual power loads.
2.
Efficiency and Infrastructure
European data centers often operate under stricter environmental and efficiency regulations, such as the EU Code of Conduct for Data Centres, resulting in improved operational efficiency and lower energy footprints per facility [6].
3.
Rapid Digitalization in Asia
Asia-Pacific remains the fastest-growing region for AI and cloud computing infrastructure. Many new facilities are purpose-built for high-performance computing and AI training workloads, which significantly increase electricity demand [50].
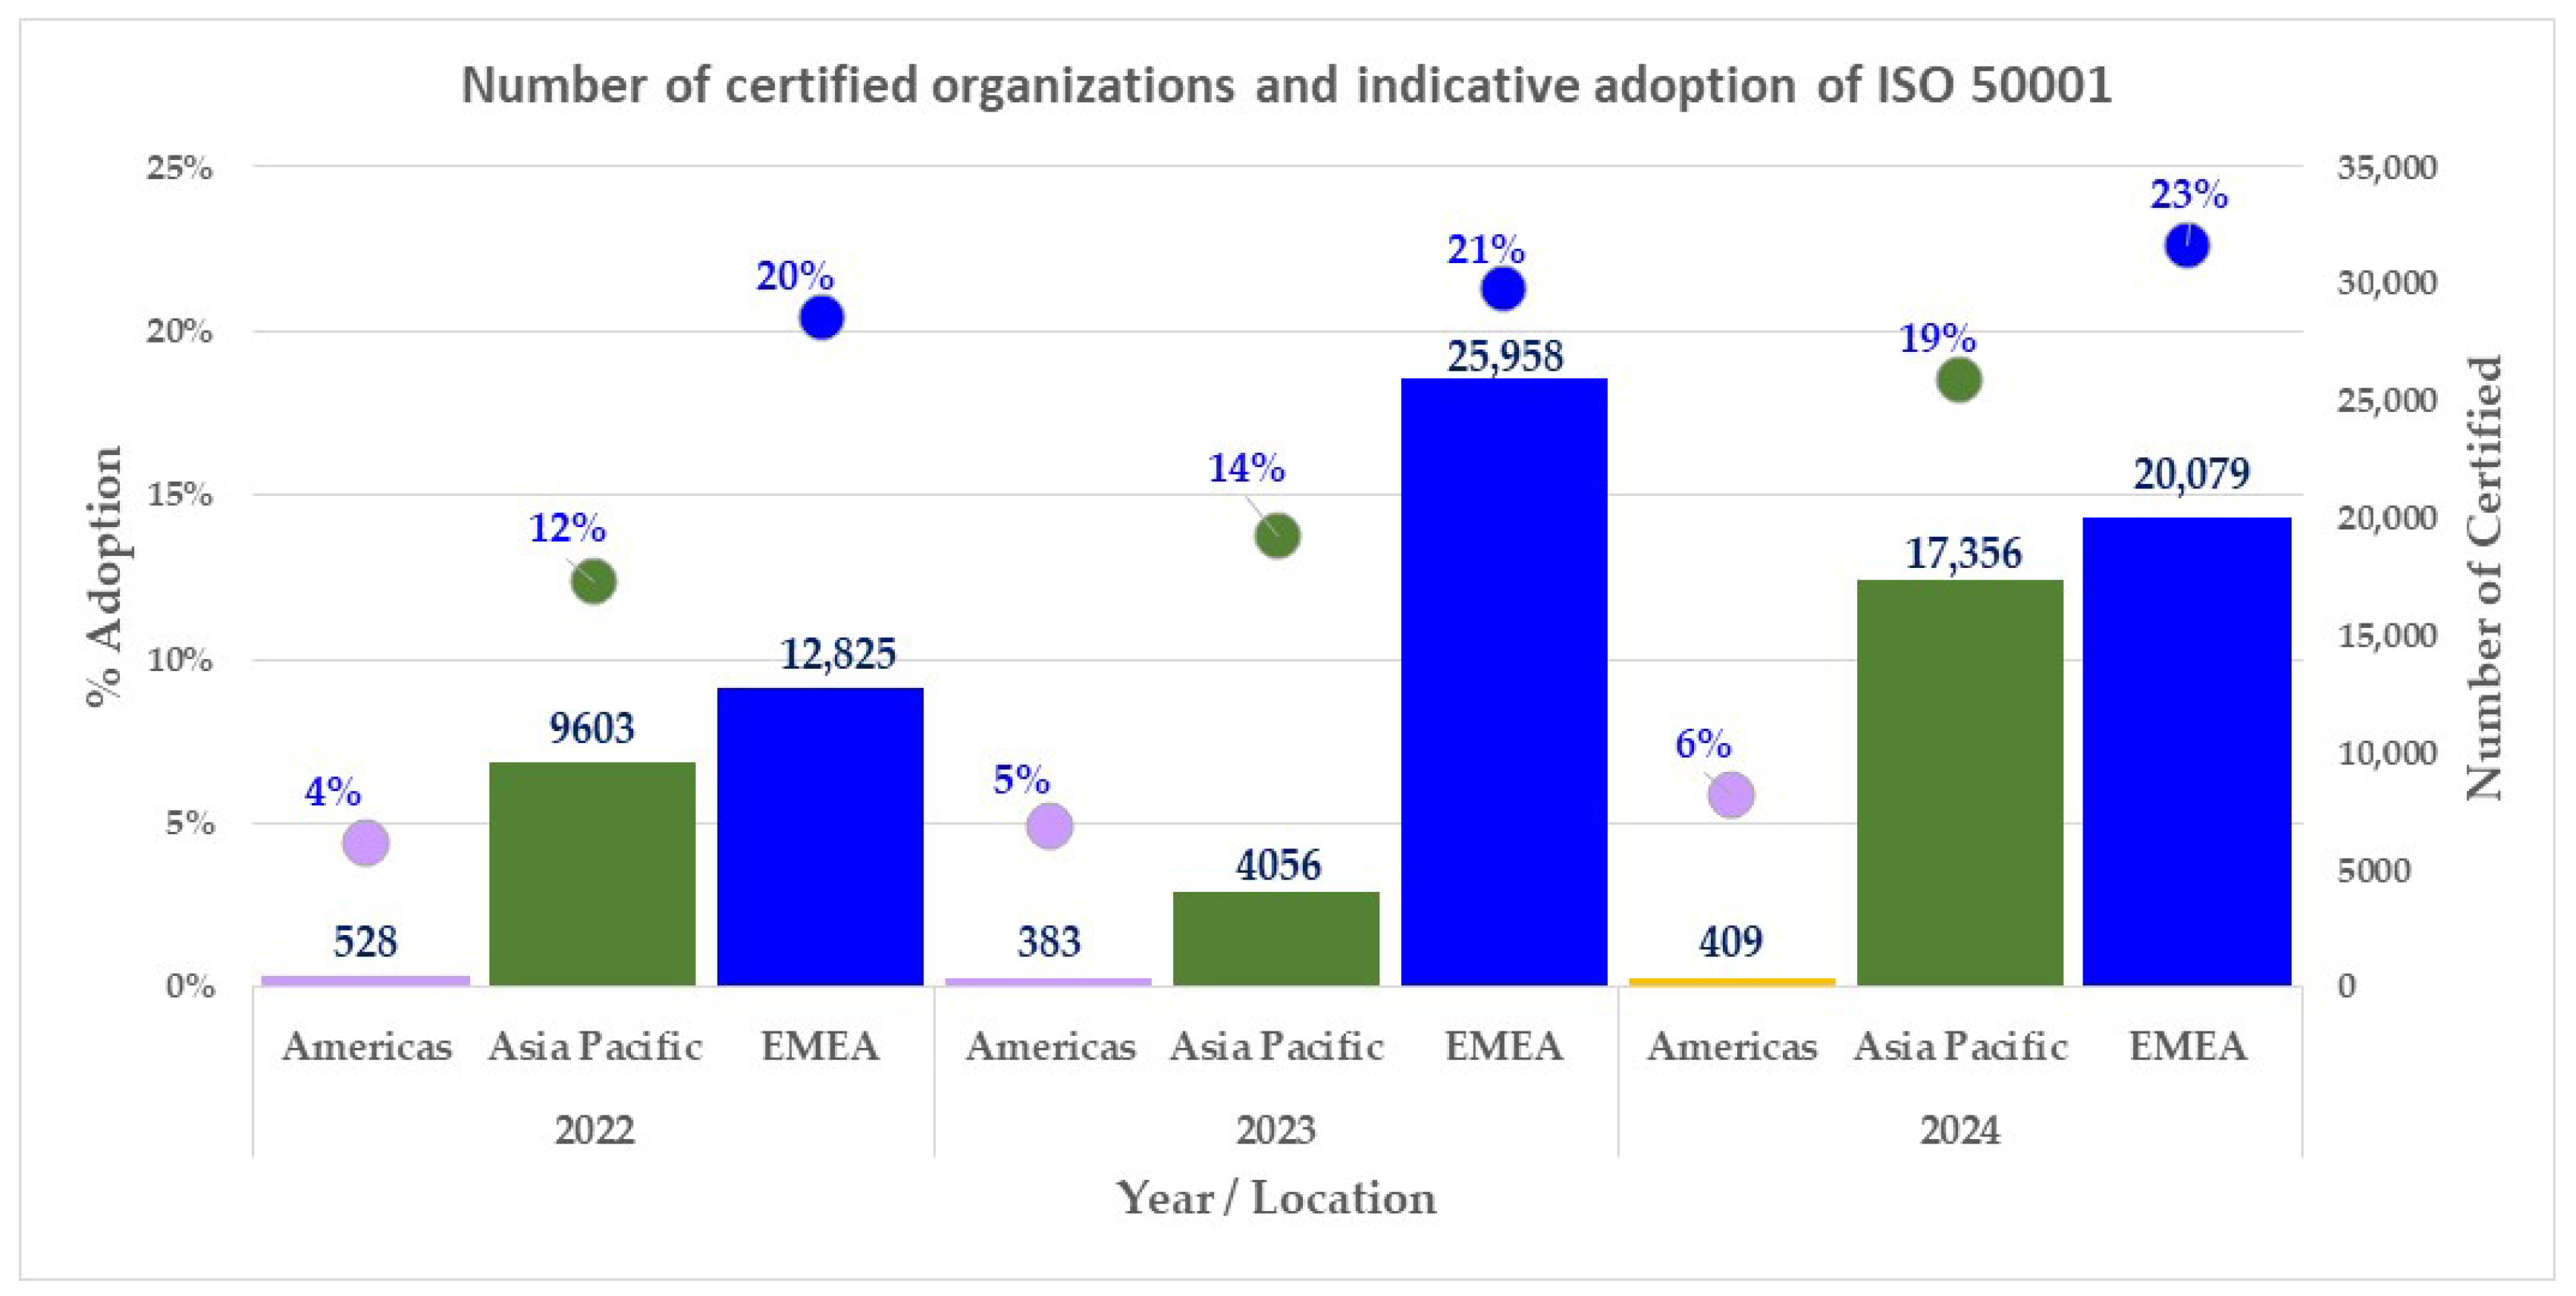
For ISO 50001 comparative adoption by region, adoption remains uneven globally. Figure 5 illustrates regional adoption trends.
As shown in Figure 5, Europe leads with certification rates exceeding 20%, reaching approximately 23% in 2024. This leadership reflects strong regulatory frameworks and long-standing energy-efficiency policies.
Asia-Pacific demonstrates the fastest growth, with indicative adoption increasing from approximately 12% (over 9000 certified organizations) in 2022 to around 19% (over 17,000 certified organizations) in 2024, largely driven by strong uptake in China.
In contrast, adoption across the Americas remains modest, rising from 4% to 6% during the same period.
Within the data-center sector, baseline adoption patterns reflect governance structures rather than infrastructure scale alone. In Europe, enforceable mandates under the EU Energy Efficiency Directive and Germany’s Energy Efficiency Act compel ISO 50001 adoption once consumption thresholds are exceeded [14,15]. Certification density is therefore highest among large energy-intensive facilities.
Asia-Pacific exhibits a different adoption dynamic. In power-constrained markets such as Singapore and China, ISO 50001 adoption is often linked to access to additional energy capacity, rather than universal regulatory compliance [16,17].
North America presents a third baseline condition. Despite hosting some of the world’s most energy-intensive AI data centers, the absence of unified federal mandates results in inconsistent ISO 50001 certification [7]. Many operators implement advanced internal energy management practices but lack external verification, limiting regulatory transparency.
Across all regions, cooling performance increasingly determines whether energy baselines remain credible and defensible under ISO 50001 [19].

3.2. Benefit Assessment: Cost, Energy Savings, and Regulatory Compliance

Implementing ISO 50001 in data centers provides a structured framework to transition energy from an unavoidable overhead into a controllable strategic advantage. Based on industry standards and documented case studies, the following benefit assessment covers three core pillars:
From a cost-savings perspective, adopting ISO 50001 demonstrates that 71% of organizations characterize reduced cost as a major benefit [51]. Enhancing energy monitoring processes according to ISO 50001 using computational intelligence techniques represents a key component of the PDCA cycle because it allows more accurate analysis of operational performance. Large energy companies that adopt advanced monitoring systems can optimize maintenance schedules, reduce over-consumption, and ultimately reduce costs by eliminating avoidable energy waste [52]. Globally, organizations certified under ISO 50001 have achieved average energy reductions of 10–30% within the first five years of implementation [53,54,55].
The benefits of ISO 50001 implementation in data centers become substantially more pronounced when evaluated through the combined lenses of energy cost (USD), absolute energy savings, and regulatory compliance—particularly for AI-driven facilities with large and volatile electricity demand. Unlike conventional data centers, where efficiency gains often translate into incremental operational improvements, AI-driven data centers experience non-linear financial and strategic benefits due to their large-scale energy consumption and exposure to regulatory thresholds.
From an architectural perspective, conventional data centers typically operate at lower electricity consumption levels, often in the range of tens of gigawatt-hours per year. In such facilities, ISO 50001-driven efficiency improvements—commonly reported at 5–10%—translate into measurable cost savings primarily through reduced cooling energy and improved equipment scheduling [45,46]. While these savings can justify EnMS implementation under high electricity prices or regulatory pressure, they may be insufficient to drive voluntary adoption in lightly regulated environments.
In contrast, AI-driven data centers operate at dramatically higher energy scales, frequently exceeding hundreds of gigawatt-hours annually, and in hyperscale AI campuses may approach one terawatt-hour per year [5,6]. At this scale, even conservative ISO 50001 efficiency improvements of 10–20%—values commonly reported across energy-intensive sectors—translate into electricity savings measured in tens to hundreds of millions of dollars annually, depending on regional electricity prices [41,53,56,57].
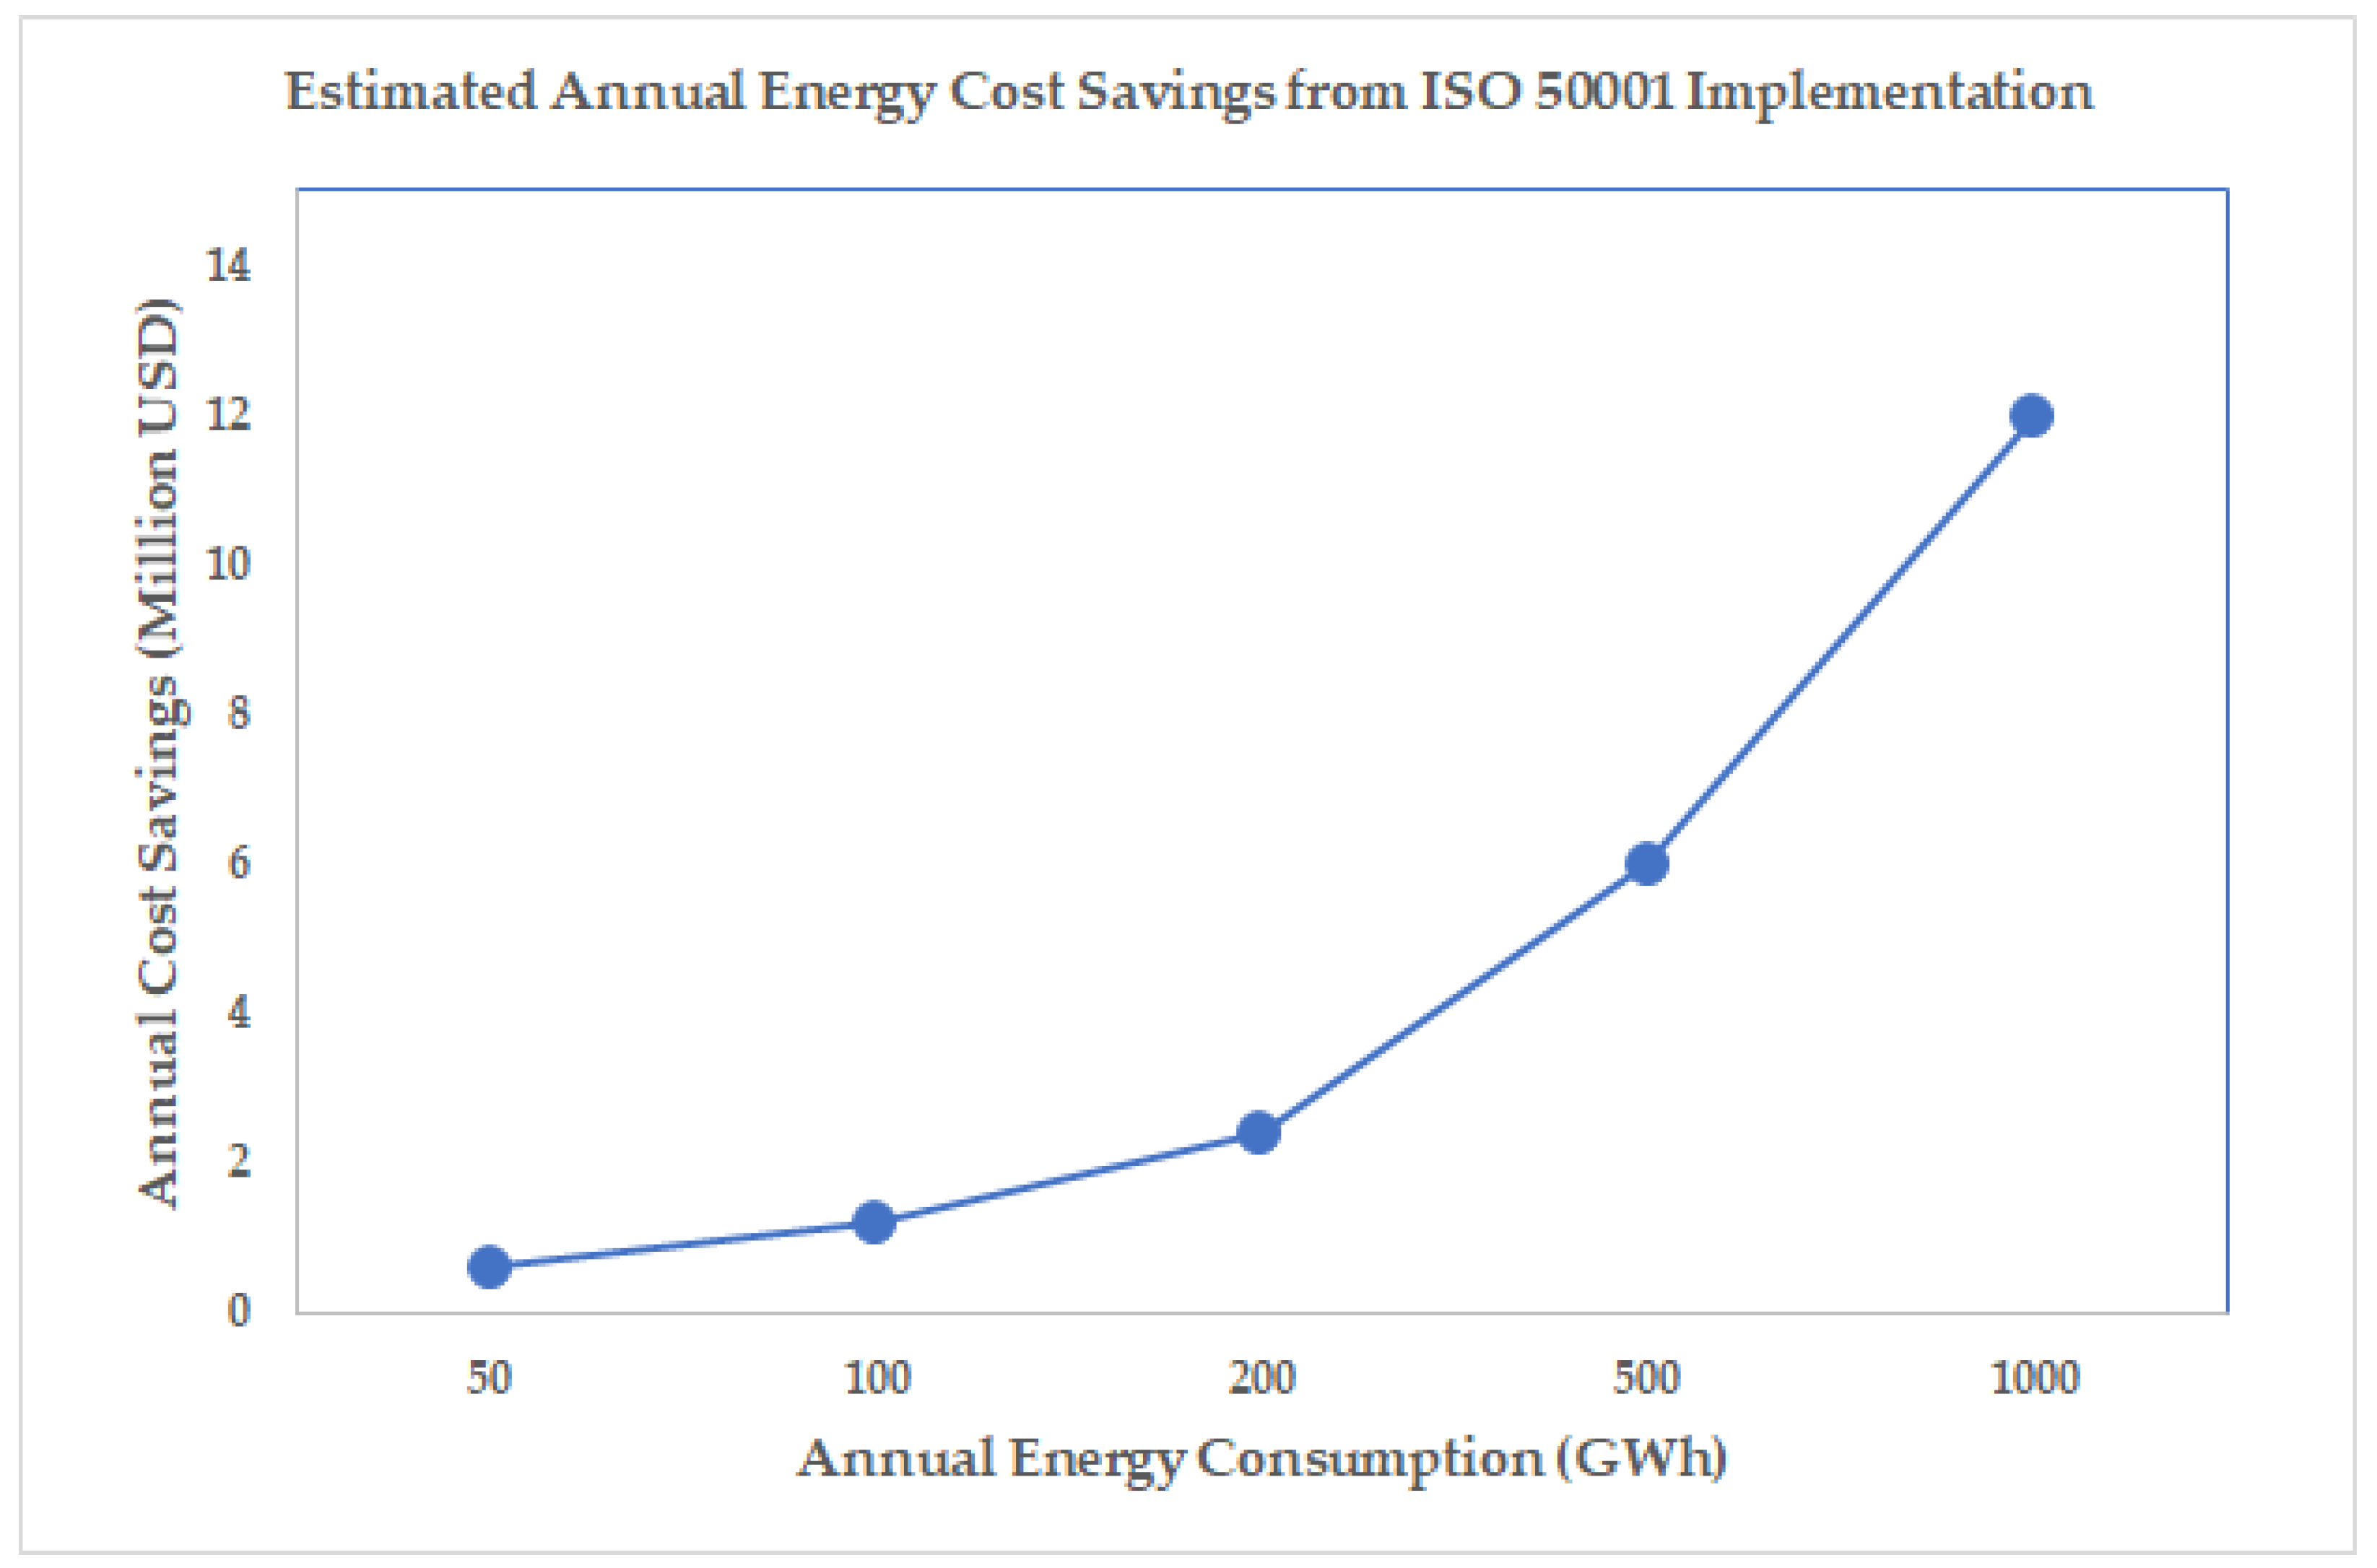
For example, a 500 GWh/year AI-driven facility operating at an electricity price of USD 0.10/kWh can achieve annual savings of approximately USD 50 million from a 12% efficiency improvement.
Figure 6 provides the estimated Annual Energy Cost Savings (USD) from ISO 50001 implementation based on different Data Center facility scales with baseline consumption as follows:
  • Small AI/Edge (50 GWh);
  • Enterprise AI (100 GWh);
  • Colocation AI (200 GWh);
  • Hyperscale Hub (500 GWh);
  • AI Campus (1000 GWH).
Estimated Annual savings are computed as follows:
Annual Savings (USD) = Annual Consumption (GWh) × 106 × Cost (USD/kWh) × Efficiency Gain
Estimated Annual Energy Cost Savings (USD) are calculated as the differential between baseline consumption and post-certification.
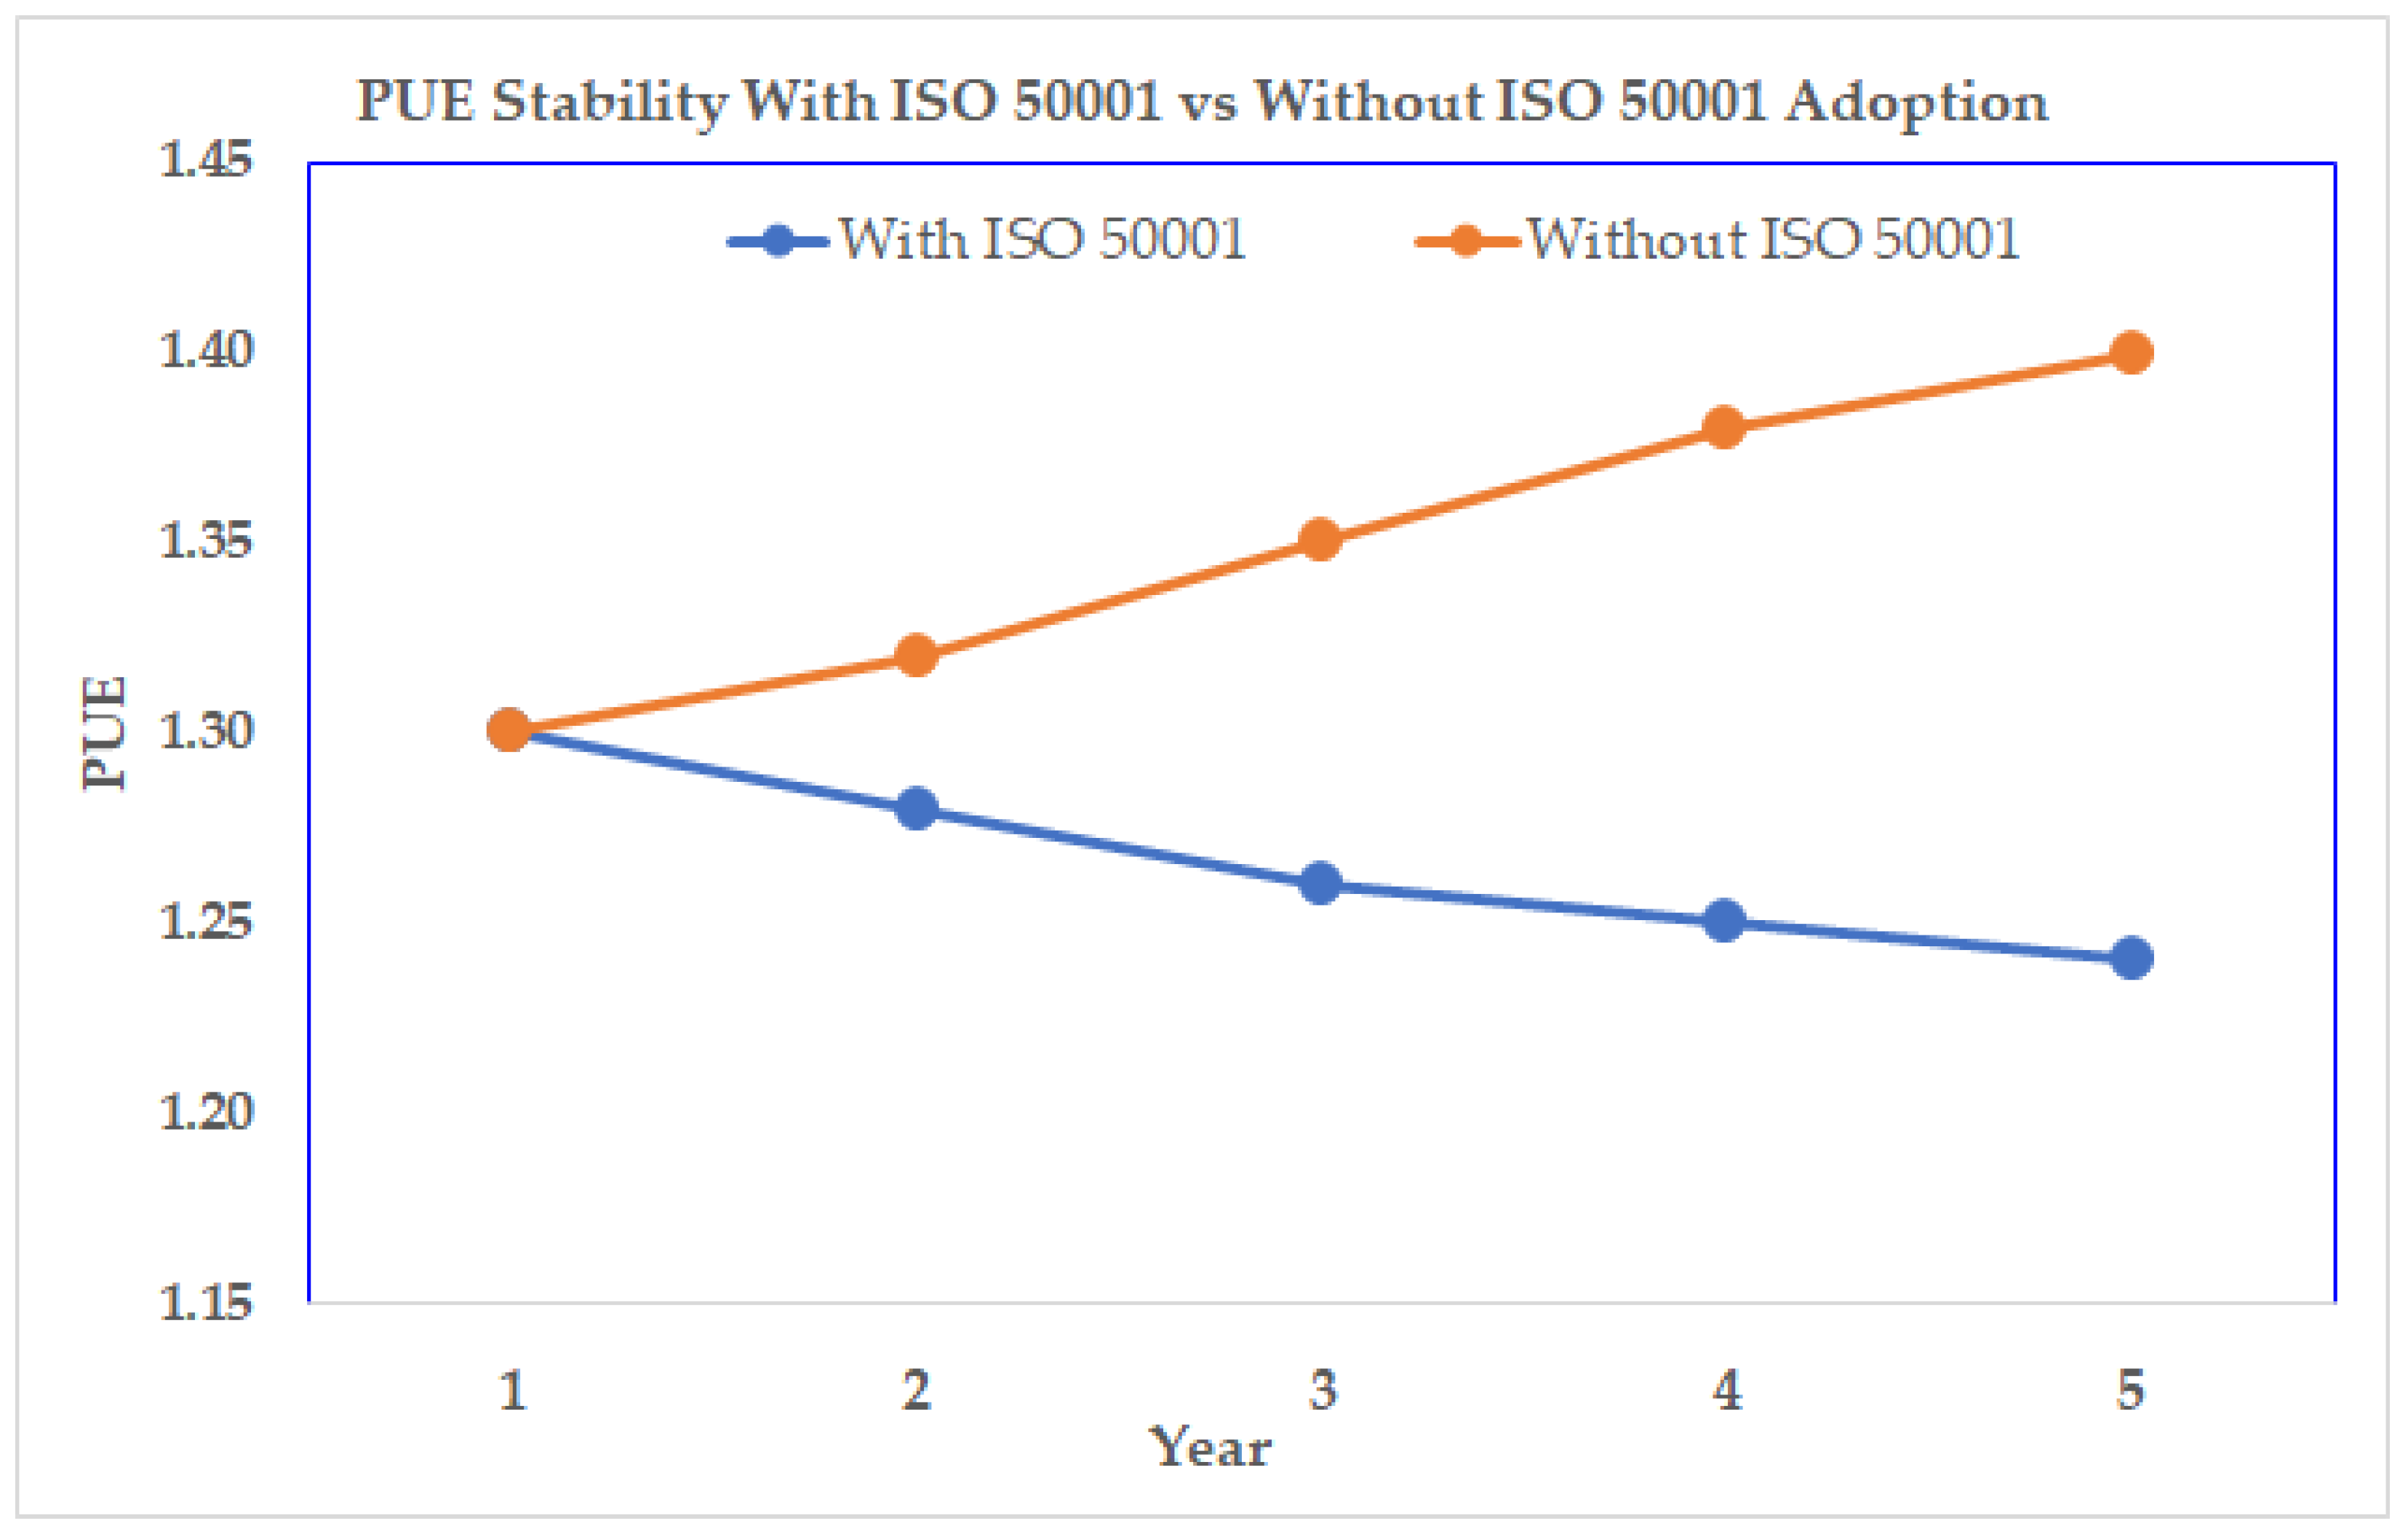
Beyond direct cost savings, ISO 50001 delivers substantial absolute energy savings, which become increasingly critical under grid-constrained conditions. Certified AI-driven facilities consistently demonstrate lower and more stable Power Usage Effectiveness (PUE) values, reflecting sustained reductions in non-IT energy consumption [29,45].
PUE is a ratio that compares the total energy entering the facility to the energy that actually reaches the IT equipment:
PUE = Total   Facility   Energy   Consumption IT   Equipment   Energy   Usage
  • Total Facility Energy: Includes everything used to run the site, such as cooling systems, lighting, power delivery components (UPS, switchgear), and backup generators.
  • IT Equipment Energy: The power consumed specifically by servers, storage devices, and networking equipment.
A theoretical perfect PUE is 1.0, indicating all energy is used directly by IT equipment. In practice, the global industry average PUE in 2024 is approximately 1.56 [7].
To illustrate the impact of ISO 50001 adoption, PUE is evaluated using the ISO/IEC 30134-2 data center performance metric [36]. Certified facilities typically maintain a ±0.02 PUE variance, mitigating efficiency drift through continuous PDCA monitoring.
Figure 7 illustrates the difference between certified and non-certified facilities.
These improvements reduce peak demand, mitigate grid congestion, and improve the feasibility of connecting additional AI capacity without proportional increases in infrastructure investment.
Regionally, the financial benefits of ISO 50001 are strongly linked to regulatory frameworks. In Europe, certified EnMS implementation can substitute for mandatory periodic energy audits under the EU Energy Efficiency Directive, reducing compliance costs and administrative burden [14,15]. In Germany, ISO 50001 certification effectively becomes a prerequisite for operating large data centers under the Energy Efficiency Act, making adoption both economically beneficial and legally necessary.
In Asia-Pacific—particularly in Singapore and China—the benefits of ISO 50001 are closely tied to access to electricity capacity rather than cost savings alone [16,17]. Certification therefore becomes a strategic instrument for securing additional power allocations in constrained energy markets.
In North America, where regulatory mandates vary widely, ISO 50001 benefits are most visible in utility negotiations and capital markets. Utilities increasingly require large AI data centers to demonstrate structured energy management before approving new grid connections [58]. Additionally, ISO 50001 certification supports access to sustainability-linked financing instruments, where interest rates depend on verified energy performance improvements [41].
The benefits of ISO 50001 scale with cooling intensity. In AI-driven facilities consuming hundreds of gigawatt-hours annually, 10–20% cooling efficiency improvements can yield tens of millions of dollars in annual savings [41,53,56,57].
The PDCA cycle within ISO 50001 also prevents efficiency drift, where cooling performance gradually deteriorates due to configuration changes, equipment aging, or operational overrides [19,23]. Furthermore, the framework enables integration of water usage and heat reuse metrics, aligning energy governance with evolving sustainability requirements [35,36,37,38,39,40].
Taken together, these findings indicate that ISO 50001 delivers a triple-benefit structure for AI-driven data centers:
  • Substantial recurring energy cost savings;
  • Meaningful absolute energy reductions that alleviate grid constraints;
  • Regulatory and market advantages that influence AI infrastructure expansion.
These benefits scale with electricity consumption, making ISO 50001 progressively more valuable as AI workloads intensify.

3.3. Barriers: Comparative PEST Analysis Aligned with AI-Driven Operations

Barriers to ISO 50001 implementation differ markedly across the comparative scope and intensify as energy consumption increases.
Politically, fragmented regulatory environments create uncertainty in regions without clear consumption-based mandates, particularly where cooling performance expectations evolve faster than formal standards [59,60]. In contrast, stringent European regulations reduce uncertainty but compress implementation timelines, placing strain on organizational capacity.
Economically, the capital intensity of AI infrastructure amplifies perceived trade-offs between investment in compute capacity and energy management systems. This barrier is particularly evident in cooling retrofits, which are capital-intensive—especially in brownfield AI facilities [61,62].
Social barriers manifest as a shortage of professionals capable of integrating AI operations with energy governance. This skills gap is most acute in AI-driven environments where workload orchestration and energy performance are tightly coupled but often managed by separate organizational units [63].
Technologically, conventional facilities struggle with limited data visibility, while AI-driven sites face opacity introduced by proprietary AI-based control algorithms. Both conditions complicate the definition of auditable Energy Performance Indicators (EnPIs) under ISO 50001. Proprietary control algorithms and liquid cooling architectures introduce additional challenges for transparency and verification.
In Asia-Pacific contexts such as the Philippines, the hot-humid climate makes cooling a dominant energy driver for data centers, reducing free-cooling opportunities and increasing reliance on mechanical systems [64]. Analyses of renewable energy policy frameworks further highlight coordination challenges among regulatory agencies and market instruments, underscoring the need for structured governance frameworks for energy-intensive sectors [65]. The Philippine National Cooling Action Plan therefore positions cooling as a combined energy-efficiency and climate-mitigation priority, addressing both indirect emissions from electricity use and direct emissions from refrigerants [64]. ISO 50001 aligns with this policy landscape by enabling continuous monitoring, target setting, and verification of cooling-related energy performance within a recognized management system [14,53,57,66].
The concise PEST analysis presented in Table 2 is synthesized from international regulatory frameworks, industry surveys, and infrastructure governance studies addressing AI-driven data center energy and cooling challenges [44,59,60,61,62,63,64,65,66,67,68].

3.4. Beyond: Comparative Trajectories of Energy Governance (2026–2030), Mandatory Requirements and Adoption Projections

Across all regions and data center architectures examined in this review, the evidence indicates a clear convergence toward stricter, consumption-aware energy governance as AI-driven electricity demand continues to scale. Unlike earlier phases of digital infrastructure growth—where efficiency improvements alone were sufficient to offset rising demand—the AI era introduces absolute energy consumption levels that materially affect grid stability, permitting processes, and national decarbonization pathways. Within the comparative framework established in Section 2, the future relevance of ISO 50001 is shaped by three interacting forces:
(i)
Mandatory or quasi-mandatory regulatory thresholds;
(ii)
Grid connection and permitting constraints linked to absolute energy consumption;
(iii)
The evolution of performance metrics beyond Power Usage Effectiveness (PUE).

3.4.1. Mandatory and Regulatory Requirements Driving ISO 50001 Adoption

Europe (Mandated Compliance). Europe represents the most explicit transition of ISO 50001 from voluntary best practice to compliance instrument. Under the revised EU Energy Efficiency Directive (Directive (EU) 2023/1791), large energy-consuming organizations must adopt either periodic energy audits or an energy management system [18,32,33,40].
From 11 October 2026, organizations exceeding defined energy consumption thresholds must demonstrate structured energy management, with stricter obligations for higher-consumption entities from 11 October 2027, often interpreted as requiring validated or certified energy management systems depending on national implementation [18,32,33].
For AI-driven data centers, this distinction is critical. Periodic audits are increasingly insufficient to capture fast transient load behavior and utilization volatility associated with AI training workloads. ISO 50001 therefore provides a practical compliance pathway by embedding continuous monitoring, normalization, and management review into operational processes.
Germany’s Energy Efficiency Act (EnEfG) further reinforces this trajectory through data-center-specific obligations. Operators must establish an energy or environmental management system with continuous measurement requirements and—above 1 MW non-redundant connection capacity—must validate or certify the system beginning 1 January 2026 [32].
The German Energy Efficiency Act (EnEfG) introduces tightening performance targets, including PUE ≤ 1.2 for new data centers entering operation after 1 July 2026, alongside minimum Energy Reuse Factor (ERF) obligations [18]. These measures effectively mandate a management-system-based approach capable of demonstrating sustained improvement, making ISO 50001 the most practical compliance framework for large AI-driven facilities.
Asia-Pacific (Performance-gated growth). In contrast to Europe’s mandate-driven model, Asia-Pacific governance regimes typically function through performance-gated growth rather than universal legal requirements.
Singapore’s Green Data Centre Roadmap (2024) explicitly identifies data centers as resource-intensive national infrastructure and conditions expansion approvals on sustainability and energy performance commitments [20].
Similarly, China’s national policy instruments emphasize accelerated low-carbon development, including PUE targets below 1.5 and stricter efficiency oversight for hyperscale facilities [21].
Within these regulatory environments, ISO 50001 increasingly serves as a verification and assurance mechanism rather than a formal legal requirement. Certification provides regulators with confidence that new capacity will be actively managed rather than passively consuming electricity. Consequently, ISO 50001 adoption in Asia-Pacific tends to correlate strongly with AI capacity expansion and hyperscale infrastructure development.
North America—United States (Utility- and market-driven governance), remains less defined by centralized federal mandates; however, grid congestion, interconnection delays, and scrutiny of large electrical loads have created de facto governance requirements mediated through utilities and infrastructure planning authorities.
In major AI infrastructure hubs, operators must increasingly demonstrate demand management strategies, load flexibility, and long-term energy planning to secure grid connection approvals [34].
Within this context, ISO 50001 functions as a governance signal rather than a statutory obligation. Certification supports negotiations with utilities, reduces permitting risks, and strengthens access to sustainability-linked financing instruments.
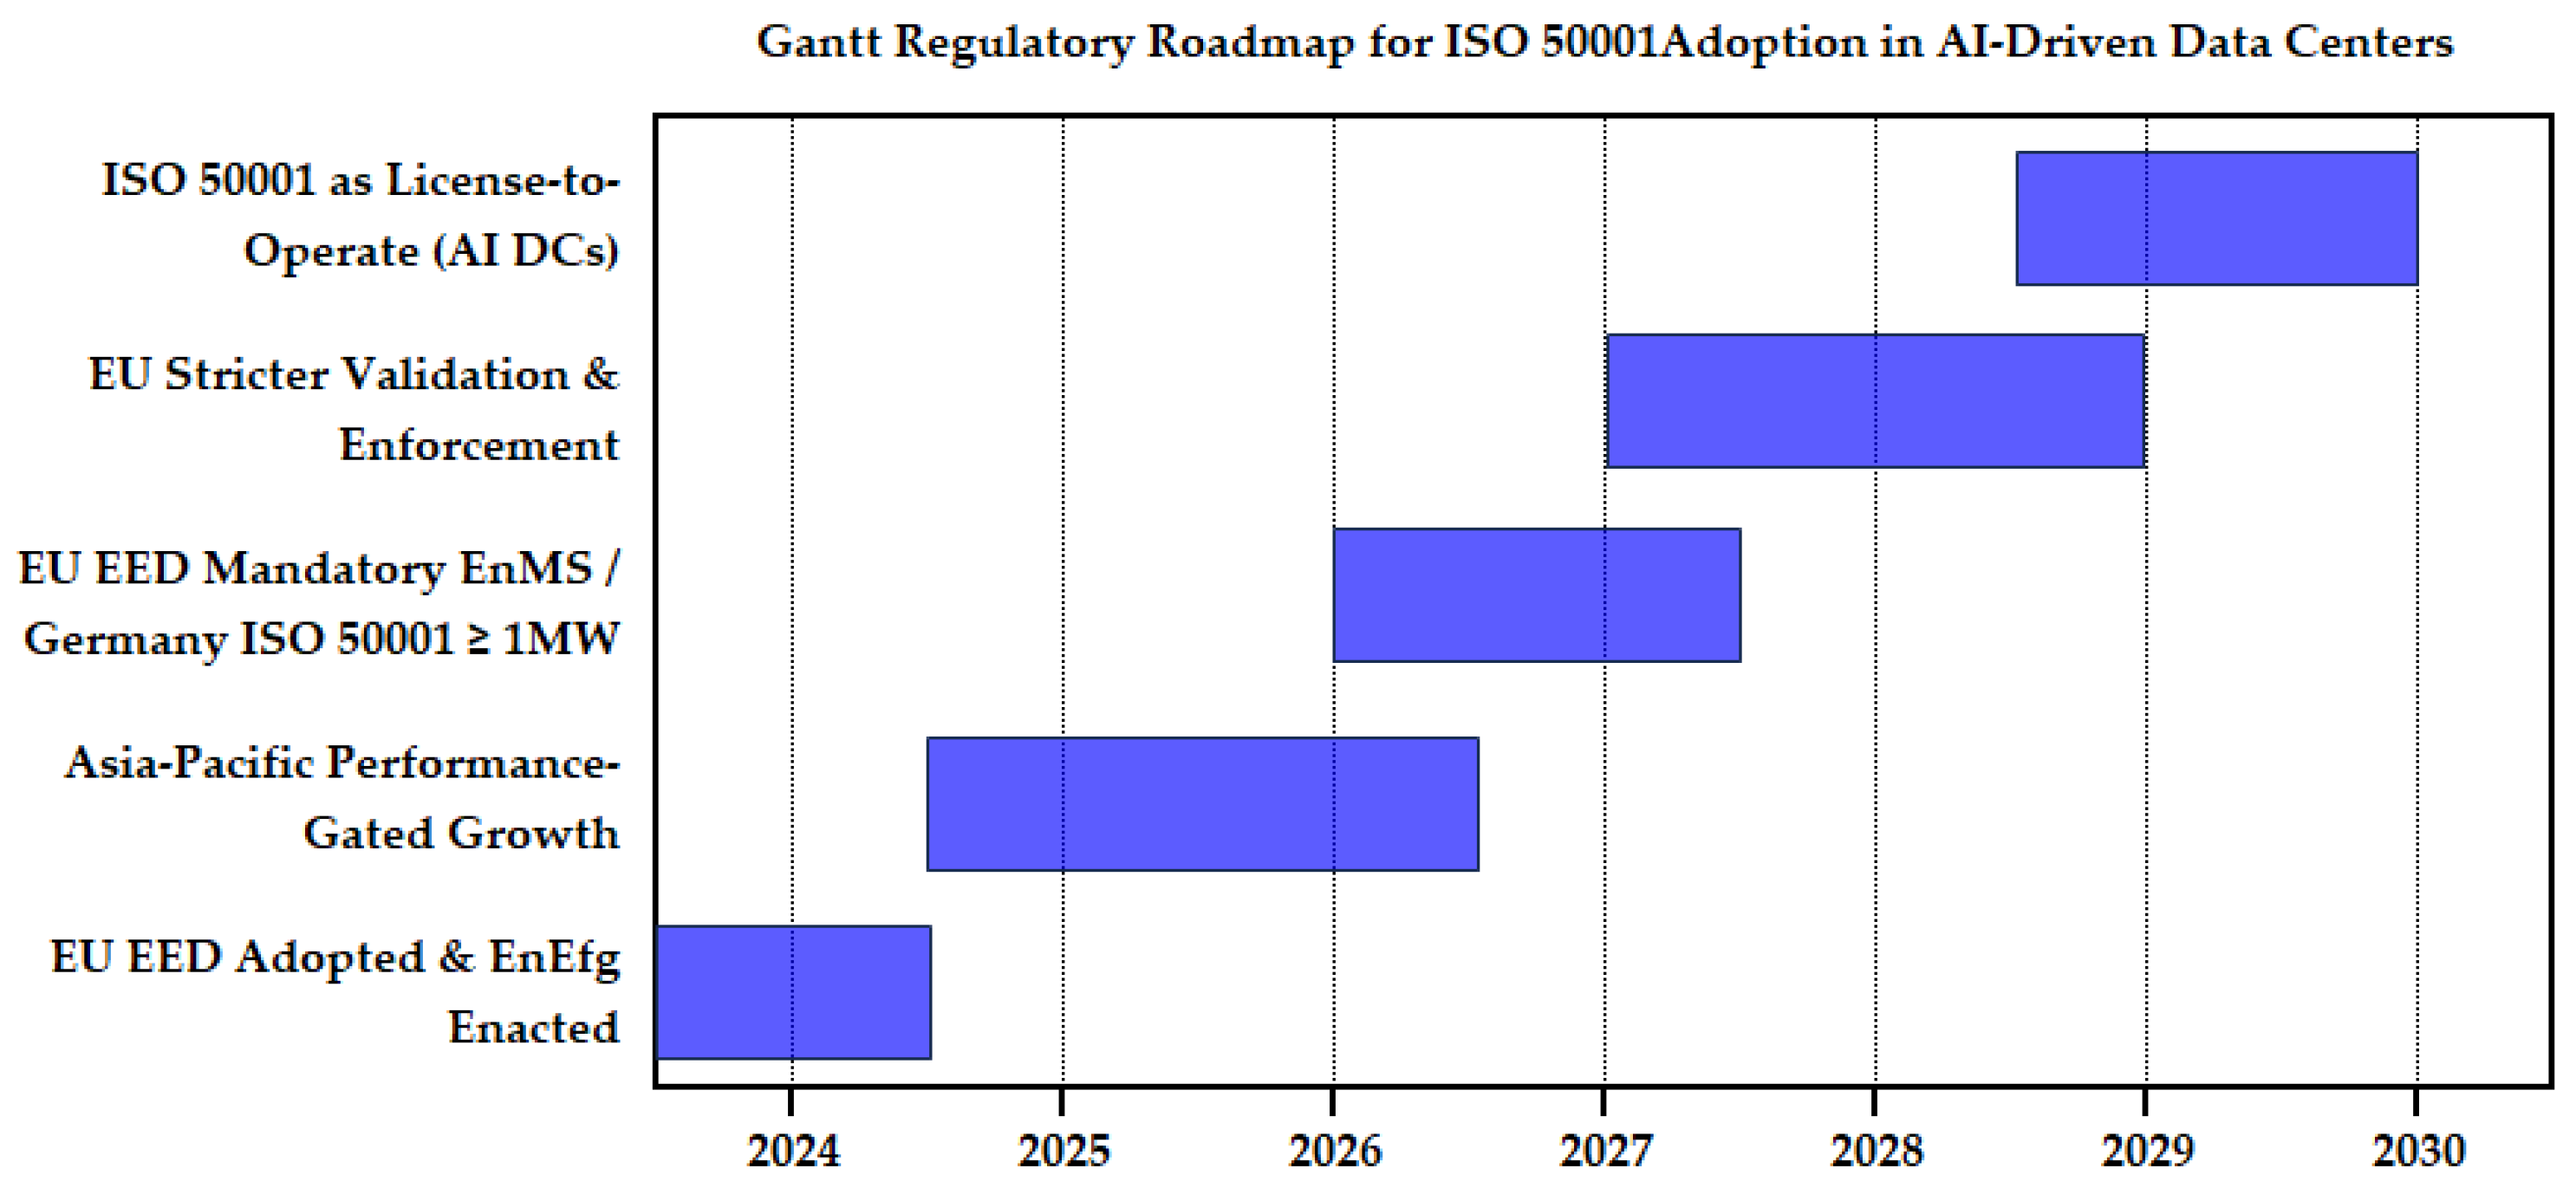
The provided Gantt chart, Figure 8, outlines a regulatory roadmap for the adoption of ISO 50001 (Energy Management Systems) specifically within AI-driven data centers from 2024 to 2030. This roadmap is synthesized from three primary legislative and strategic sources:
  • the EU Energy Efficiency Directive (EED) 2023/1791, mandatory reporting for DCs > 500 kW; mandatory EnMS (e.g., ISO 50001) for large consumers by 2027 [40].
  • Germany’s Energy Efficiency Act (EnEfG), mandatory ISO 50001 for DCs > 1 MW by 2026; PUE limits of 1.5 (2027) and 1.3 (2030) [32].
  • Singapore Green Data Centre Roadmap, Performance-gated capacity growth; introducing liquid cooling and IT efficiency standards by 2025 [20].

3.4.2. Estimated Adoption Trajectories by Region (Scenario-Based Projections)

Since ISO 50001 adoption in the data center sector is not consistently reported by region within a single dataset, adoption trajectories are presented as scenario-based projections grounded in:
(i)
Regulatory mandate strength and timing;
(ii)
Projected growth of AI-driven capacity;
(iii)
Feasibility of certification at scale.
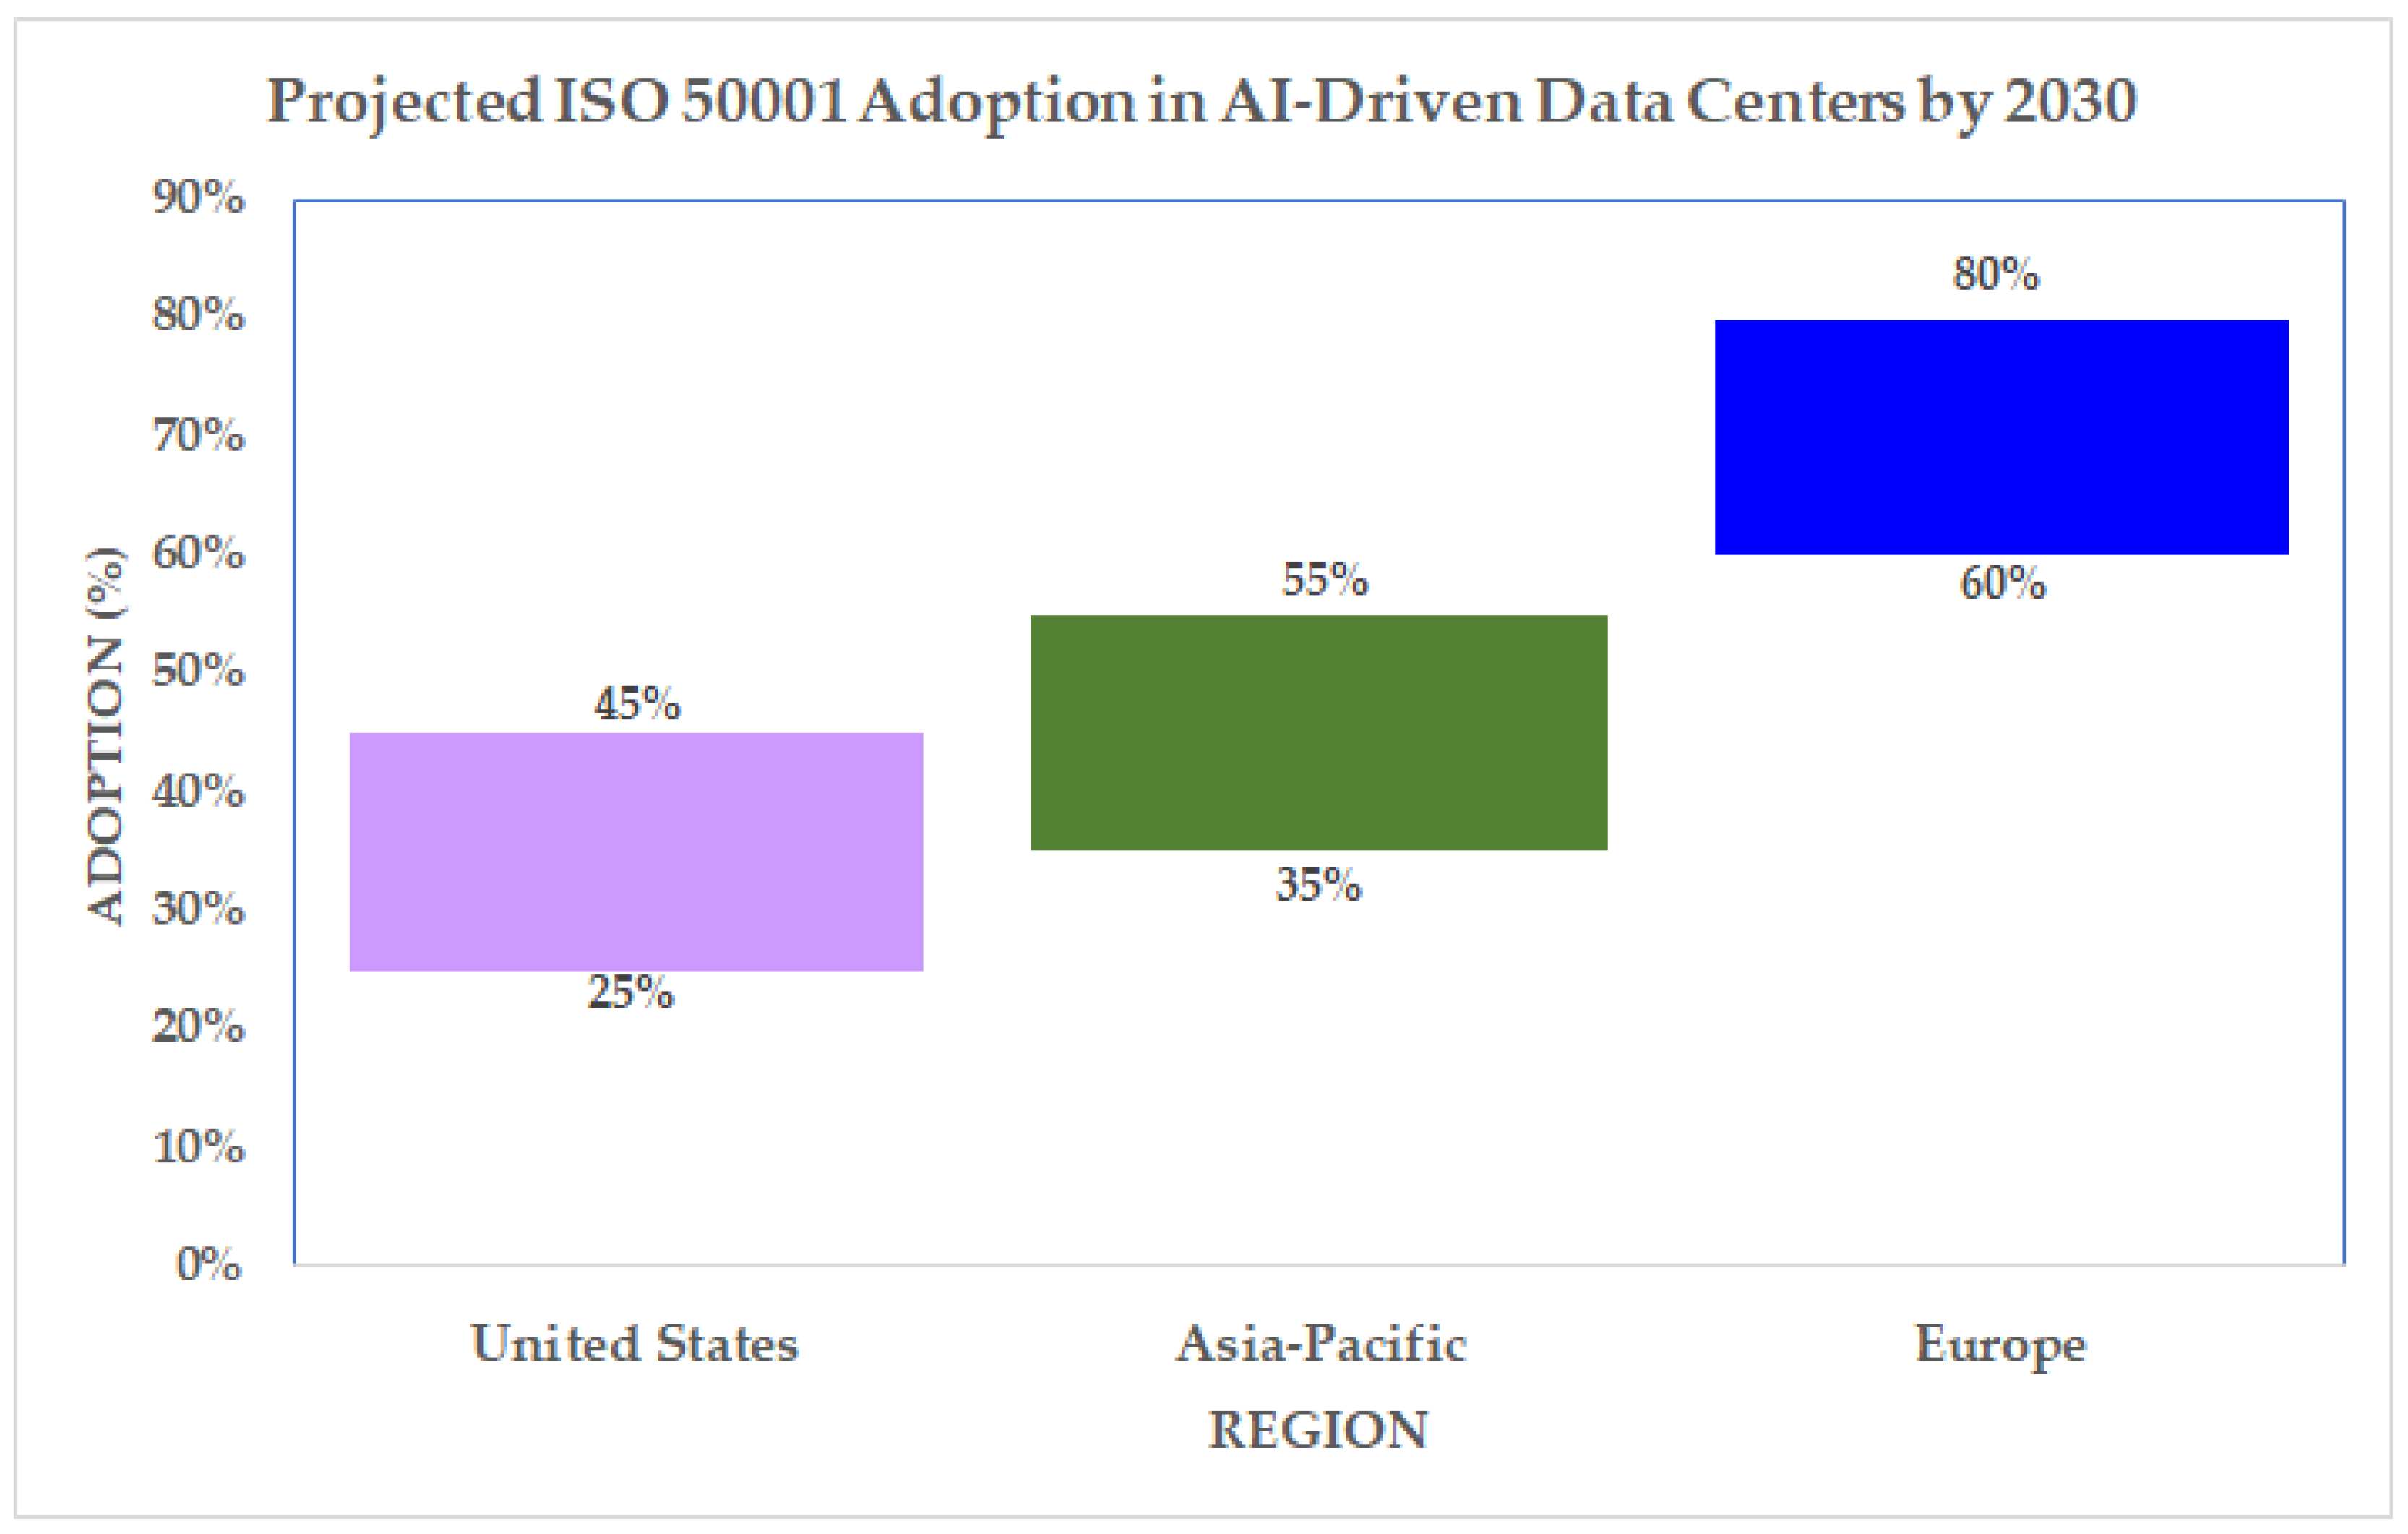
The projections follow a policy-driven acceleration scenario. Figure 9 and Table 3 present estimated adoption ranges for Europe, Asia-Pacific, and North America.
  • Europe (60–80%): High adoption is driven by the 2026/2027 mandatory compliance thresholds for entities exceeding 7.5 TJ (approx. 2 GWh) of annual consumption.
  • Asia-Pacific (35–55%): Adoption is weighted toward “performance-gated” hubs like Singapore and China, where new power allocations are contingent on certification.
  • North America–United States (25–45%): Adoption is concentrated in grid-constrained regions (e.g., Northern Virginia) where utilities require EnMS for new 100 MW+ connections.
These projections assume continued AI-driven capacity growth consistent with major market outlooks forecasting substantial expansion in global data center capacity between 2026 and 2030 [1,58].
i.
Metric Evolution and ISO 50001 as an Integrating Framework
As AI-driven data centers scale, the limitations of PUE-only evaluation become increasingly evident. Policy and industry attention are expanding toward externalities such as waste heat reuse and water consumption, particularly in liquid-cooled AI infrastructure.
Standardized metrics such as Energy Reuse Factor (ERF) and Water Usage Effectiveness (WUE) are defined under the ISO/IEC 30134 data center performance metric series [35,36,37,38,39,40].
ISO 50001 provides a governance framework capable of integrating these metrics into a single management system, enabling continuous measurement, normalization, and improvement.
ii.
ISO 50001 Evolution and Alignment with AI-Driven Data Centers
As of 2026, ISO 50001:2018 has been supplemented by ISO 50001:2018/Amd 1:2024, which introduces climate-change considerations into management system requirements [14].
Although no AI-specific revision of ISO 50001 has yet been announced, the amendment strengthens the relevance of the standard for energy-intensive digital infrastructure by elevating climate and energy risk governance.
For AI-driven data centers, future alignment will likely occur through implementation practice rather than formal revision, particularly through:
  • AI-aware energy baselines;
  • High-frequency energy performance indicators;
  • Integration with AI workload orchestration.
From 2026 onward, energy governance frameworks are expected to prioritize absolute electricity consumption and cooling-related externalities, not only efficiency ratios [32,34].
Europe is transitioning toward mandatory energy management systems, Asia-Pacific toward performance-gated energy allocation, and North America toward utility-driven governance.
Cooling-related metrics such as WUE and ERF are increasingly integrated alongside PUE, with ISO 50001 serving as the central governance framework [35,36,37,38,39,40].

4. Discussion

The findings of this review advance the discourse on energy management by demonstrating that ISO 50001 is transitioning from a voluntary efficiency standard to a strategic governance architecture for the AI era. A key contribution of this synthesis is the mapping of disparate regional trajectories. While Europe utilizes mandate-driven compliance to accelerate adoption, the Asia-Pacific region increasingly relies on performance-gated growth, where certification effectively functions as a license-to-operate in power-constrained infrastructure environments [3,8]. By bridging these regional insights, this study provides a roadmap for integrating ISO 50001’s PDCA cycle directly into AI workload orchestration, offering a systemic solution to prevent the “efficiency drift” commonly observed in unmanaged high-density facilities [6,9].
This review comprehensively evaluated the implementation of ISO 50001:2018 Energy Management Systems (EnMS) within the rapidly expanding AI-driven data center industry. Using a comparative analytical framework that integrates data center architecture (conventional versus AI-driven), regional governance regimes, and energy consumption characteristics, the analysis demonstrates that AI-driven facilities represent a fundamental shift in both the scale and dynamics of energy demand.
AI-driven data centers are characterized by extreme power density, volatile and fast-transient load profiles, and rapidly increasing electricity consumption that may reach hundreds of gigawatt-hours annually for hyperscale facilities [1,2]. These characteristics amplify the importance of structured energy management and expose the limitations of traditional static audits or ad hoc efficiency measures. The findings of this review show that ISO 50001 provides measurable benefits in energy savings, cost reduction, regulatory compliance, and operational resilience; however, adoption remains uneven and highly dependent on regional governance frameworks.
AI-driven infrastructure fundamentally reshapes the relationship between computing workloads and cooling demand. Cooling systems emerge as the largest controllable component of facility energy consumption, influencing operational costs, grid impacts, and regulatory outcomes. ISO 50001 provides a structured governance framework to manage this complexity, yet adoption remains limited globally [6,49,58,69].
Standards organizations should develop supplementary guidance addressing AI-driven load behavior, including dynamic baselining and cooling-specific Energy Performance Indicators (EnPIs) [16]. Future research should empirically evaluate the integration of ISO 50001 with multi-metric sustainability frameworks incorporating Energy Reuse Factor (ERF) [38] and Water Usage Effectiveness (WUE) [39], particularly in liquid-cooled AI infrastructure [14,70].

5. Conclusions

The findings of this review demonstrate that ISO 50001:2018 is no longer merely an optional efficiency standard but is becoming an indispensable governance framework for the AI-driven data center industry. This study’s primary academic contribution lies in identifying the “energy–intelligence paradox,” wherein rapid advances in artificial intelligence accelerate digital capability while the physical deployment of AI infrastructure is increasingly constrained by the linear limits of power grids and cooling thermal margins. While the trends presented in this review are descriptive and scenario-informed due to the aggregated nature of available secondary data, they provide a clear roadmap for the evolution of the sector.
The core significance of ISO 50001:2018 lies in its transition from a technical tool to a governance architecture. By institutionalizing the Plan–Do–Check–Act (PDCA) cycle, the standard forces a shift from fragmented, facility-level monitoring to a corporate-level mandate for energy accountability. This framework provides a standardized language for energy transparency, ensuring that volatile AI workloads are governed as a strategic risk asset rather than an unmanaged operational overhead. In power-constrained markets, this governance becomes a “license-to-operate,” providing the auditable evidence required by regulators and utilities to approve new AI capacity.
ISO 50001:2018 should therefore be understood as both a technical and governance instrument: it provides measurable benefits through energy savings, cooling optimization, and regulatory readiness while also imposing implementation costs related to certification, staff capability, monitoring infrastructure, and continuous audit requirements.
Within hyperscale AI campuses, the potential for a 10–20% efficiency gain offers a powerful financial hedge against volatile energy prices and provides a verified baseline for regulatory compliance. However, these gains require significant CAPEX for granular sub-metering and liquid-cooling retrofits, alongside the OPEX needed to bridge the gap between IT workload orchestration and facility energy management. While the entry cost is high, the cost of remaining unmanaged—characterized by “efficiency drift” and regulatory exclusion—is increasingly prohibitive in the 2026 regulatory landscape.
Looking ahead, the period 2026–2030 will be a decisive window for global energy governance. For ISO 50001 to remain effective in managing AI-era complexity, its implementation must evolve through three key operational mechanisms:
  • AI-Aware Baselines: Transitioning from static indicators to high-resolution Energy Performance Indicators (EnPIs) capable of capturing GPU workload volatility.
  • Integrated Sustainability Metrics: Incorporating Water Usage Effectiveness (WUE) and Energy Reuse Factor (ERF) to address the externalities of liquid-cooled AI clusters.
  • Grid-Interactive Governance: Leveraging certified EnMS data to support demand-response coordination with utilities and mitigate regional grid congestion.
Finally, this review recommends the establishment of national and regional registries to monitor ISO 50001 adoption rates and performance outcomes. Such transparency will validate the theoretical benefits identified in this study and ensure that the rapid expansion of AI infrastructure does not outpace the capacity of global energy systems, transforming a digital revolution into a systemic energy challenge.

Author Contributions

Conceptualization, L.J.P. and A.D.C.; methodology, L.J.P.; validation, L.J.P. and A.D.C.; formal analysis, L.J.P.; investigation, L.J.P.; resources, L.J.P.; data curation, L.J.P.; writing—original draft preparation, L.J.P.; writing—review and editing, L.J.P.; visualization, L.J.P.; supervision, A.D.C.; project administration, A.D.C. All authors have read and agreed to the published version of the manuscript.

Funding

This research received no external funding.

Data Availability Statement

No new data were created or analyzed in this study. Data sharing is not applicable to this article.

Conflicts of Interest

The authors declare no conflicts of interest.

Abbreviations

The following abbreviations are used in this manuscript:
AIArtificial Intelligence
ASHRAEAmerican Society of Heating, Refrigerating and Air-Conditioning Engineers
BMWKGerman Federal Ministry for Economic Affairs and Climate Action
CAPEXCapital Expenditure
CENELECEuropean Committee for Electrotechnical Standardization
DCIMData Center Infrastructure Management
EEDEnergy Efficiency Directive (European Union)
EnBEnergy Baseline
EnEfGEnergy Efficiency Act (Germany)
EnMSEnergy Management System
EnPIEnergy Performance Indicator
ERFEnergy Reuse Factor
ETSIEuropean Telecommunications Standards Institute
GPUGraphics Processing Unit
HVACHeating, Ventilation, and Air Conditioning
IEAInternational Energy Agency
IECInternational Electrotechnical Commission
IMDAInfocomm Media Development Authority (Singapore)
ISOInternational Organization for Standardization
ITUInternational Telecommunication Union
JRCJoint Research Centre (European Commission)
KPIKey Performance Indicator
LBNLLawrence Berkeley National Laboratory
MWMegawatt
NDRCNational Development and Reform Commission (China)
NRELNational Renewable Energy Laboratory
OPEXOperating Expenditure
PDCAPlan–Do–Check–Act
PESTPolitical–Economic–Social–Technological
PUEPower Usage Effectiveness
REFRenewable Energy Factor
TCTechnical Committee
WUEWater Usage Effectiveness

References

  1. IEA. Electricity 2024: Analysis and Forecast to 2026; International Energy Agency: Paris, France, 2024; Available online: https://www.iea.org/reports/electricity-2024 (accessed on 3 May 2026).
  2. IEA. Energy and AI; International Energy Agency: Paris, France, 2024; Available online: https://www.iea.org/reports/energy-and-ai (accessed on 1 May 2026).
  3. Masanet, E.; Shehabi, A.; Lei, N.; Smith, S.; Koomey, J. Recalibrating Global Data Center Energy-Use Estimates. Science 2020, 367, 984–986. [Google Scholar] [CrossRef]
  4. IEA. Data Centres and Data Transmission Networks Sector Tracking; International Energy Agency: Paris, France, 2023; Available online: https://www.iea.org/energy-system/buildings/data-centres-and-data-transmission-networks (accessed on 1 May 2026).
  5. Oró, E.; Depoorter, V.; Garcia, A.; Salom, J. Energy Efficiency and Renewable Energy Integration in Data Centers. Renew. Sustain. Energy Rev. 2015, 42, 429–445. [Google Scholar] [CrossRef]
  6. Uptime Institute. Global Data Center Survey 2024; Uptime Institute: New York, NY, USA, 2024; Available online: https://datacenter.uptimeinstitute.com/rs/711-RIA-145/images/2024.GlobalDataCenterSurvey.Report.pdf?version=0 (accessed on 1 May 2026).
  7. ASHRAE. Thermal Guidelines for Data Processing Environments, 5th ed.; ASHRAE: Atlanta, GA, USA, 2021; Available online: https://www.ashrae.org/file%20library/technical%20resources/bookstore/supplemental%20files/therm-gdlns-5th-r-e-refcard.pdf (accessed on 1 May 2026).
  8. Takci, M.; Qadrdan, M.; Summers, J.; Gustafsson, J. Data centres as a source of flexibility for power systems. Energy Rep. 2025, 13, 3661–3671. [Google Scholar] [CrossRef]
  9. Reddy, V.D.; Setz, B.; Rao, G.S.V.R.K.; Gangadharan, G.R.; Aiello, M. Metrics for Sustainable Data Centers. IEEE Trans. Sustain. Comput. 2017, 2, 290–303. [Google Scholar] [CrossRef]
  10. Schneider Electric. AI-Driven Data Centers: Revolutionizing Decarbonization Strategies; Schneider Electric White Paper: Rueil-Malmaison, France, 2024; Available online: https://www.se.com/ww/en/download/document/SPD_WP106_EN/ (accessed on 1 May 2026).
  11. BloombergNEF. AI Data Centers Fuel Quicker Growth in Power; Bloomberg Technology L.P.: New York, NY, USA, 2025; Available online: https://www.bloomberg.com/professional/insights/commodities/ai-data-centers-fuel-quicker-growth-in-power-demand/ (accessed on 1 May 2026).
  12. World Bank Group. Green Data Centers: Towards a Sustainable Digital Transformation. 2023. Available online: https://www.worldbank.org/en/topic/digital/publication/green-data-centers-towards-a-sustainable-digital-transformation (accessed on 1 May 2026).
  13. European Commission; ETSI. Assessment of the Energy Performance and Sustainability of Data Centres in EU; Publications Office of the European Union: Luxembourg, 2025. [Google Scholar] [CrossRef]
  14. ISO 50001:2018; Energy Management Systems—Requirements with Guidance for Use. ISO: Geneva, Switzerland, 2018. Available online: https://www.iso.org/standard/69426.html (accessed on 1 May 2026).
  15. ISO 50006:2023; Energy Management Systems—Evaluating Energy Performance Using Energy Performance Indicators and Energy Baselines. ISO: Geneva, Switzerland, 2014. Available online: https://www.iso.org/standard/79367.html (accessed on 1 May 2026).
  16. ISO 50004:2020; Guidance for Implementing ISO 50001. ISO: Geneva, Switzerland, 2020. Available online: https://www.iso.org/obp/ui/#iso:std:iso:50004:ed-2:v1:en (accessed on 1 May 2026).
  17. ISO. ISO Survey of Management System Certifications 2024; ISO: Geneva, Switzerland, 2024; Available online: https://www.iafcertsearch.org (accessed on 1 May 2026).
  18. European Commission. Directive (EU) 2023/1791 on Energy Efficiency (Recast); Official Journal of the European Union: Luxembourg, 2023; Available online: https://eur-lex.europa.eu/eli/dir/2023/1791/oj/eng (accessed on 1 May 2026).
  19. BMWK. Energy Efficiency Act (EnEfG); Federal Ministry for Economic Affairs and Climate Action: Berlin, Germany, 2023. Available online: https://www.bundeswirtschaftsministerium.de/Redaktion/EN/Pressemitteilungen/2023/09/20230921-bundestag-adopts-energy-efficiency-act-a-clear-legal-framework-for-energy-efficiency.html (accessed on 1 May 2026).
  20. IMDA. Green Data Centre Roadmap; Infocomm Media Development Authority: Singapore, 2024. Available online: https://www.imda.gov.sg/how-we-can-help/green-dc-roadmap (accessed on 1 May 2026).
  21. NDRC. Action Plan on Green Development of Data Centers; National Development and Reform Commission: Beijing, China, 2024. Available online: https://english.www.gov.cn/news/202407/24/content_WS66a0b167c6d0868f4e8e96ba.html (accessed on 1 May 2026).
  22. Dayarathna, M.; Wen, Y.; Fan, R. Data Center Energy Consumption Modeling: A Survey. IEEE Commun. Surv. Tutor. 2016, 18, 732–794. [Google Scholar] [CrossRef]
  23. IQ-EQ. Driving Sustainable Data Centres White Paper. 2025. Available online: https://iqeq.com/wp-content/uploads/2025/07/Driving-Sustainable-Data-Centres_150725.pdf (accessed on 1 May 2026).
  24. Dentons. How Germany’s Energy Efficiency Act Will Impact Data Center Operators; Dentons Legal Analysis: New York, NY, USA, 2023; Available online: https://www.dentons.com/en/insights/articles/2023/september/25/energy-efficiency-act-relevance-for-data-centers (accessed on 1 May 2026).
  25. Blackmore, J. ISO Certification Trends Among the Top 100 UK Data Centers; Industry Research Report. 2024. Available online: https://blackmoresuk.com/176-top-iso-standard-trends-in-data-centres/ (accessed on 1 May 2026).
  26. JLL. Global Data Center Outlook 2026; Jones Lang LaSalle IP, Inc.: Chicago, IL, USA, 2026; Available online: https://www.jll.com/en-uk/insights/market-outlook/data-center-outlook (accessed on 1 May 2026).
  27. ISO/IEC 27001:2022; Information Security, Cybersecurity and Privacy Protection—Information Security Management Systems—Requirements. ISO: Geneva, Switzerland, 2022. Available online: https://www.iso.org/standard/27001 (accessed on 7 May 2026).
  28. ISO/IEC 9001:2015; Quality Management Systems—Requirements. ISO: Geneva, Switzerland, 2015. Available online: https://www.iso.org/standard/62085.html (accessed on 7 May 2026).
  29. Reyes, L.E.P.; Calderon, A.D. Compliance, Coordination, and Conflict: Examining Renewable Energy Policy Mechanisms in the Philippine Energy Plan. Energies 2025, 18, 4683. [Google Scholar] [CrossRef]
  30. ISS-Corporate. Energy Management Systems: Global Trends and Best Practices; ISS ESG Research: Rockville, MD, USA, 2025; Available online: https://www.iss-corporate.com/resources/blog/energy-management-systems-global-trends-and-best-practices/?__hstc=157098724.4d90a9e35a94c9214c99ad10075d493a.1777876510100.1777876510100.1777876510100.1&__hssc=157098724.1.1777876510100&__hsfp=b86c8fa6f59dd1807f3794fbe2221f86 (accessed on 1 May 2026).
  31. Leighter, R. Number of Data Centers by Country (November 2025). Available online: https://www.cargoson.com/en/blog/number-of-data-centers-by-country (accessed on 1 May 2026).
  32. German Federal Government. Energy Efficiency Act—EnEfG (Gesetz zur Steigerung der Energieeffizienz). Federal Law Gazette (BGBl.) I 2023, 309. Available online: https://www.gesetze-im-internet.de/enefg/ (accessed on 1 May 2026).
  33. Federal Ministry for Economic Affairs and Climate Action. Act to Increase Energy Efficiency and to Amend the Energy Services Act. Bundesgesetzblatt Teil I 2023, 309. Available online: https://www.recht.bund.de/bgbl/1/2023/309/VO.html (accessed on 1 May 2026).
  34. U.S. Department of Energy. Electricity Demand Growth Resource Hub—Understanding Electricity Demand Growth and Available Solutions; U.S. Department of Energy: Washington, DC, USA, 2025. Available online: https://www.energy.gov/policy/electricity-demand-growth-resource-hub (accessed on 1 May 2026).
  35. ISO/IEC 30134-1; Data Centre Key Performance Indicators. ISO: Geneva, Switzerland, 2016. Available online: https://www.iso.org/standard/63450.html (accessed on 1 May 2026).
  36. ISO/IEC 30134-2:2026; Power Usage Effectiveness (PUE). ISO: Geneva, Switzerland, 2026. Available online: https://www.iso.org/standard/30134-2 (accessed on 1 May 2026).
  37. ISO/IEC 30134-3:2016; Renewable Energy Factor (REF). ISO: Geneva, Switzerland, 2016. Available online: https://www.iso.org/standard/66127.html (accessed on 1 May 2026).
  38. ISO/IEC 30134-4:2017; IT Equipment Energy Efficiency for Servers (ITEEsv). ISO: Geneva, Switzerland, 2017. Available online: https://www.iso.org/standard/66191.html (accessed on 1 May 2026).
  39. ISO/IEC 30134-9:2022; Water Usage Effectiveness (WUE). ISO: Geneva, Switzerland, 2022. Available online: https://www.iso.org/standard/77692.html (accessed on 1 May 2026).
  40. European Commission. 2023 Best Practice Guidelines for the EU Code of Conduct on Data Centre Energy Efficiency; European Commission: Brussels, Belgium, 2023; Available online: https://e3p.jrc.ec.europa.eu/sites/default/files/2023-09/jrc132576_jrc132576_jrc_2023_best_practice_guidelines_v14.1.0final_gt1.pdf (accessed on 1 May 2026).
  41. Kez, D.; Foley, A.; Wong, F.; Dolfi, A.; Srinivasan, G. AI-driven cooling technologies for high-performance data centres: State-of-the-art review and future directions. Sustain. Energy Technol. Assess. 2025, 82, 9. [Google Scholar] [CrossRef]
  42. Andrae, A.; Edler, T. On Global Electricity Usage of Communication Technology: Trends to 2030. Challenges 2015, 6, 117–157. [Google Scholar] [CrossRef]
  43. Fuchs, H.; Aghajanzadeh, A.; Therkelsen, P. Identification of drivers, benefits, and challenges of ISO 50001 through case study content analysis. Energy Policy 2020, 142, 111443. [Google Scholar] [CrossRef]
  44. Calderon, A. Development of the National Cooling Action Plan of the Philippines. IOP Conf. Ser. Earth Environ. Sci. 2024, 1395, 12042. [Google Scholar] [CrossRef]
  45. Grimaccia, F.; Niccolai, A.; Mussetta, M.; D’Alessandro, G. ISO 50001 Data Driven Methods for Energy Efficiency Analysis of Thermal Power Plants. Appl. Sci. 2023, 13, 1368. [Google Scholar] [CrossRef]
  46. Pushpo, F.; Hasan, M.; Uddin, M. Strategic Energy Management: Exploring the Benefits of ISO 50001 Implementation Through Case Study; IEOM Society International: Troy, MI, USA, 2023. [Google Scholar] [CrossRef]
  47. Patterson, M. The Effect of Data Center Temperature on Energy Efficiency. In Proceedings of the 2008 11th Intersociety Conference on Thermal and Thermomechanical Phenomena in Electronic Systems; IEEE: Piscataway, NJ, USA, 2008. [Google Scholar] [CrossRef]
  48. Brotherton, H. Datacenter Efficiency Measures. Energy Eng. 2015. [Google Scholar] [CrossRef]
  49. Chen, X.; Wang, X.; Colacelli, A.; Lee, M.; Xie, L. Electricity Demand and Grid Impacts of AI Data Centers: Challenges and Prospects. arXiv 2025. [Google Scholar] [CrossRef]
  50. Francois, Y.; Kra, M.; Butt, S.; Baah, N.; Memon, I.; Baffour, B.; Mante, F.; Malo, T. Energy Efficiency and Scheduling Techniques using Cloud Computing Methods Within Data Centers. J. Theor. Appl. Inf. Technol. 2019, 97, 3730–3751. Available online: https://www.researchgate.net/publication/338357732_ENERGY_EFFICIENCY_AND_SCHEDULING_TECHNIQUES_USING_CLOUD_COMPUTING_METHODS_WITHIN_DATA_CENTERS (accessed on 7 May 2026).
  51. Prasetya, B.; Wahono, D.; Dewantoro, A.; Anggundari, W.; Yopi. The role of Energy Management System based on ISO 50001 for Energy-Cost Saving and Reduction of CO2-Emission: A review of implementation, benefits, and challenges. IOP Conf. Ser. Earth Environ. Sci. 2021, 926, 12077. [Google Scholar] [CrossRef]
  52. Ioshchikhes, B.; Frank, M.; Weigold, M. A Systematic Review of Expert Systems for Improving Energy Efficiency in the Manufacturing Industry. Energies 2024, 17, 4780. [Google Scholar] [CrossRef]
  53. Envigilance. ISO 50001 Data Center Compliance: Cut Energy Costs 20%. 2025. Available online: https://envigilance.com/energy-monitoring/iso-50001-certification/iso-50001-data-center/ (accessed on 1 May 2026).
  54. Wang, E.; Pan, T. Does ISO 50001 adoption reduce manufacturing energy intensity? Micro-evidence from China. Econ. Anal. Policy 2025, 86, 653–672. [Google Scholar] [CrossRef]
  55. Alotaibi, S.; Alogaili, H.; Alawwad, K.; Aljarallah, S. The Environmental and Business Benefits of Implementing the ISO 50001 Energy Management System in Government Buildings: A Case Study of the Saudi Standards, Metrology and Quality Organization (SASO). Sustainability 2025, 17, 5131. [Google Scholar] [CrossRef]
  56. Li, X.; Zhao, Z.; Jiang, X.; Chen, Y. A Review on AI-Driven Optimization of Data Center Energy Efficiency and Thermal Management. Int. J. Appl. Sci. 2025, 8, 108. [Google Scholar] [CrossRef]
  57. Clean Energy Ministerial. Google- Capturing Energy Savings by Designing Efficient Data Centers. 2022. Available online: https://www.cleanenergyministerial.org/resource/google-global-energy-management-implementation-case-study/ (accessed on 1 May 2026).
  58. Wang, Q.; Sheng, Y.; Zhang, C.; Zhu, Z.; Xu, H.; Wen, J.; Wang, R.; Yang, J.; Bu, S. Power for AI Data Centers: Energy Demand, Grid Impacts, Chalennges and Perspectives. Energies 2026, 19, 722. [Google Scholar] [CrossRef]
  59. Koomey, J.; Berard, S.; Sanchez, M.; Wong, H. Implications of Historical Trends in the Electrical Efficiency of Computing. IEEE Ann. Hist. Comput. 2011, 33, 46–54. [Google Scholar] [CrossRef]
  60. Shehabi, A.; Smith, S.; Sartor, D. United States Data Center Energy Usage Report. Energy 2016, 117, 373–384. Available online: https://eta-publications.lbl.gov/ (accessed on 1 May 2026).
  61. Dorsey, H.; Overton, J.; Wayne, L.; Eladawi, S. Trade-Offs Between AI Performance and Energy Consumption. 2025. Available online: https://www.researchgate.net/publication/398737527_Trade-offs_Between_AI_Performance_and_Energy_Consumption (accessed on 7 May 2026).
  62. Zhou, D.; Du, L.; Xu, R.; Song, J.; Checn, N.; Zheng, S.; Fan, Y. Accelerating liquid cooling adoption in data centers: Necessity, challenges and solutions. Technol. Rev. Carbon Neutrality 2025, 1, 9550014. [Google Scholar] [CrossRef]
  63. Park, C. Addressing Challenges for the Effective Adoption of Artificial Intelligence in the Energy Sector. Sustainability 2025, 17, 5764. [Google Scholar] [CrossRef]
  64. Le, D.; Zhou, J.; Wang, R.; Tan, R.; Duan, F. Impacts of Increasing Temperature and Relative Humidity in Air-Cooled Tropical Data Centers. IEEE Trans. Sustain. Comput. 2024, 9, 790–802. [Google Scholar] [CrossRef]
  65. Soylemez, D.; Soylemez, A. Governance Frameworks for Renewable Energy Development: Energy Transition and Public Governance. Rev. Gestão Soc. E Ambient. 2024, 18, e09423. [Google Scholar] [CrossRef]
  66. Rawson, A.; Pfleuger, J.; Cader, T. Green Grid Data Center Power Efficiency Metrics: PUE and DCiE. ASHRAE J. 2008, 50, 14–18. Available online: https://www.academia.edu/23433359/Green_Grid_Data_Center_Power_Efficiency_Metrics_Pue_and_Dcie (accessed on 1 May 2026).
  67. Shehabi, A.; Smith, S.; Masanet, E.; Koomey, J. Data center growth in the United States: Decoupling the demand for services from electricity. Environ. Res. Lett. 2018, 13, 124030. [Google Scholar] [CrossRef]
  68. Congressional Research Service. Data Centers and Their Energy Consumption: Frequently Asked Questions, Report No. R48646. 2025. Available online: https://www.congress.gov/crs-product/R48646 (accessed on 1 May 2026).
  69. Chauhan, S. The Growing Energy Demand of Data Centers: Impacts of AI and Cloud Computing. Int. J. Multidiscip. Res. 2024, 6. [Google Scholar] [CrossRef]
  70. ISO 50001:2018/Amd 1:2024; Climate Action Amendments. ISO: Geneva, Switzerland, 2024. Available online: https://www.iso.org/standard/88430.html (accessed on 1 May 2026).
Figure 1. Global Data Center Electricity Consumption Growth. Source: Author’s analysis and visualization based on reported data from [1].
Energies 19 02550 g001
Figure 2. ISO Certification Adoption Within Data Centers. Source: Author’s analysis and visualization based on reported data from [25].
Energies 19 02550 g002
Figure 3. Conceptual Framework of the Review. Source: Author synthesis based on ISO 50001 framework PDCA cycle and four pillars review [14]. The schematic conceptual framework illustrates the four-pillar review methodology: (1) Baseline Analysis of current adoption patterns; (2) Assessment of operational and regulatory benefits; (3) PEST-aligned barriers specific to AI workloads; and (4) Future energy governance trajectories (2026–2030).
Energies 19 02550 g003
Figure 4. Data Centers Global Electricity Consumption and Number of Data Centers. Source: Author’s analysis and visualization based on reported data from [1] and global data center counts [31].
Energies 19 02550 g004
Figure 5. Number of certified organizations and indicative adoption of ISO 50001. Source: Author’s analysis and visualization based on reported data from the International Accreditation Forum (IAF) and adoption trends from ISS ESG [17,30]. Note: The 2023 results are affected by the absence of data from China’s accreditation body, as reported in the ISO Survey [17]. The 2024 results reflect incomplete reporting from Germany’s DAkkS-accredited certification bodies via IAF CertSearch [17]. These limitations may influence regional comparability and lead to underestimation in the reported values.
Energies 19 02550 g005
Figure 6. Estimated Annual Energy Cost Savings from ISO 50001 Implementation. Source: Author’s analysis and visualization based on reported data from [41] and [42].
Energies 19 02550 g006
Figure 7. PUE Stability With ISO 50001 vs. Without ISO 50001 Adoption. Source: Author’s analysis and visualization based on reported data from [7,45].
Energies 19 02550 g007
Figure 8. Gantt Regulatory Roadmap for ISO 50001 Adoption in AI-Driven Data Centers. Source: Author’s analysis and visualization based on reported data from [20,32,40].
Energies 19 02550 g008
Figure 9. Projected ISO 50001 Adoption in AI-Driven Data Centers by 2030. Source: Author’s analysis and visualization based on reported data from [26].
Energies 19 02550 g009
Table 1. Comparison between traditional data centers and AI data centers. Source: Reproduced from [49] under CC BY-NC-ND 4.0.
FeatureTraditional Data CenterAI Data Center
Primary FunctionsGeneral-purpose IT services (e.g., web/app hosting, databases, enterprise software hosting, cloud storage, email, virtualization, backup recovery)AI/ML model training, fine-tuning, and inference (e.g., large language models, AI computer vision, generative AI)
Workload PatternStable, predictable workloadsDynamic, bursty, data-intensive, hard-to-predict workloads
Compute
Hardware
CPU-centric, some GPUsGPU/TPU-dense clusters
Rack Power
Density
7–10 kW/rack, moderate densityVery high-throughput SSD/NVMe storage with parallel file systems
Networking Standard Ethernet, designed for general-purpose traffic patternsUltra-high-bandwidth, low-latency interconnects (InfiniBand, NVLink) for distributed AI workloads
CoolingPrimarily air coolingLiquid cooling (direct-to-chip, immersion) or hybrid cooling
Facility DesignOptimized for mixed workloads, standard floor loadingOptimized for high-density AI workloads, reinforced structures for heavy racks and cooling equipment
Table 2. PEST Analysis of Barriers to ISO 50001 in AI-Driven Data Centers.
CategoryEuropeAsia-PacificNorth America
PoliticalMandatory compliance: tight timelines under EU Energy Efficiency Directive and Germany’s EnEfG create administrative strain [59,60]Performance-gated growth: expansion conditional on energy efficiency commitments [61,62]Fragmented governance: lack of federal mandates leads to voluntary adoption [68]
EconomicHigh CAPEX: strict targets necessitate expensive liquid-cooling retrofits [61,62]Capital prioritization toward GPUs rather than management systems [44]Lower energy prices in some regions reduce immediate ROI of EnMS
SocialStrong public pressure for climate targets increases demand for AI-energy specialistsOrganizational silos between IT and facility management teams [63]Cultural preference for proprietary optimization approaches
TechnologicalFast-transient AI workloads complicate auditable baselines [48]Proprietary liquid-cooling systems limit data transparency [61]AI-driven automation complicates verification of PDCA monitoring
Table 3. ISO 50001 Adoption Projections of Data Centers by 2030. Source: Author projections based on IEA [1] and JLL [26] market growth scenarios.
Region2030 AdoptionPrimary Drivers
Europe60–80%Mandatory 2027 EED Deadline for facilities > 85 TJ/year; EnEfG compliance in Germany.
Asia-Pacific35–55%Performance-gated growth in Singapore (PUE ≤ 1.3) and China’s Green DC Action Plan.
North America25–45%Voluntary ESG reporting and utility-driven “grid-interactivity” requirements in constrained hubs.
Disclaimer/Publisher’s Note: The statements, opinions and data contained in all publications are solely those of the individual author(s) and contributor(s) and not of MDPI and/or the editor(s). MDPI and/or the editor(s) disclaim responsibility for any injury to people or property resulting from any ideas, methods, instructions or products referred to in the content.