1. Introduction
Against the backdrop of the accelerated development of new power systems, the integration of high proportions of renewable energy and the continuous growth of load demand have led to a significant increase in cross-regional power exchange and system regulation requirements. Meanwhile, the structural configuration and stability characteristics of power systems are becoming increasingly complex, making it urgent to enhance grid operational flexibility to ensure system security and stability [
1,
2,
3,
4]. Pathways for improving power system flexibility mainly include flexible regulation on the power source side [
5,
6,
7,
8], demand response on the load and energy storage sides [
9,
10,
11], and grid structure optimization [
12]. Existing studies have mainly focused on source-side regulation, demand response, and energy storage flexibility, whereas grid-side flexibility, especially flexibility enhancement through network renovation, has received relatively insufficient attention. In load-center regional power grids, limited transmission capacity, excessive short-circuit current, and insufficient flexibility resources may restrict the secure and flexible operation of the system [
13]. Therefore, this paper considers two renovation schemes for existing transmission corridors. The first scheme is to convert existing AC transmission lines into voltage-source-converter-based high-voltage direct current (VSC-HVDC) transmission lines, forming VSC-HVDC transmission corridors. The second scheme is to convert existing conventional line-commutated converter-based HVDC (LCC-HVDC) projects into VSC-HVDC projects. Owing to its advantages in bidirectional power flow control, asynchronous interconnection, and fast and flexible support, VSC-HVDC provides a promising solution for cross-regional flexible regulation and conventional grid renovation [
14].
However, existing studies on the effectiveness evaluation of grid structure renovation remain fragmented. The evaluation dimensions are relatively broad, the methodological systems are diverse, and systematic evaluation frameworks for grid renovation scenarios are still insufficient. Evaluation indicator systems have been developed for steady-state and transient operating conditions of embedded HVDC systems; however, these studies mainly focus on the impact of newly constructed VSC-HVDC lines on the power grid and are not fully applicable to renovation scenarios involving existing transmission corridors [
15]. Comprehensive evaluation indicator systems considering multiple aspects have also been proposed, but the use of the Analytic Hierarchy Process (AHP) may lead to subjective weight allocation, and sensitivity testing is often lacking [
16]. The fuzzy analytic hierarchy process has been introduced into smart grid evaluation in energy internet systems, but grid operational performance has not been sufficiently considered [
17]. In terms of weighting methods, single subjective weighting is easily affected by expert experience and judgment [
18,
19], whereas single objective weighting tends to rely excessively on data dispersion and may ignore the evaluation purpose [
20], resulting in biased evaluation results. In addition, the recent work by S. Zhang et al. achieves accurate simulation of cascading failure processes during the dynamic operation of power grids by constructing a multi-timescale synchronization mechanism and a multi-data-exchange model and provides an in-depth discussion of the impact of interactions between information flow and energy flow on system security [
21]. Such a detailed analysis of the dynamic operation of power grids offers an important theoretical background for the transient and steady-state modeling and analysis in this paper, as well as for understanding the stability of the complex system after grid structure renovation.
Therefore, this paper proposes a comprehensive evaluation method based on combined weighting using the FAHP and EWM, aiming to systematically evaluate the effectiveness of grid structure renovation by combining expert experience with data characteristics. First, an evaluation system is constructed consisting of eight indicators under four criteria layers: economy, resilience, safety, and reliability. The FAHP is then used to determine the subjective weight of each indicator, while the EWM is used to determine the objective weight, and the comprehensive weight is obtained through a game theory-based combined weighting method. Finally, the weighted comprehensive evaluation and the Technique for Order of Preference by Similarity to Ideal Solution (TOPSIS) are applied to evaluate the effectiveness of eight renovation scenarios in a provincial power grid, and a sensitivity analysis of weights is conducted. The proposed method can provide a basis for evaluating the effectiveness of grid structure renovation and selecting optimal schemes.
2. Construction of the Evaluation Indicator System
To evaluate the comprehensive performance of the grid before and after renovation, as well as the corresponding effectiveness of the renovation, this paper constructs a multi-level, multi-dimensional evaluation indicator system with the effectiveness of grid structure renovation as the goal layer, economy, resilience, safety, and reliability as the criteria layer, and the specific indicators corresponding to each criterion as the indicator layer. Among them, reliability measures the system’s ability to maintain steady-state power supply and withstand faults, while resilience measures whether the system can quickly return to normal after a fault is cleared. The two complement each other from the transient and steady-state dimensions, jointly characterizing the operational performance of the power grid after renovation. The selected indicators are all centered around the core technical advantages of VSC-HVDC renovation (such as bidirectional power flow control and fast support) and the core benefits of grid structure renovation, comprehensively covering the dimensions of technical performance and operational benefits. They can well reflect the actual effectiveness of grid structure renovation and align with the research objectives of renovation effectiveness evaluation and site selection decision in this paper.
2.1. Economy
2.1.1. Power Supply Benefit
After the renovation of existing lines, the power supply capacity of the grid may change, resulting in changes in the indirect economic benefits. The indicator Bsupply can be approximately defined as the power supply benefit indicator, with the expressions before and after renovation as follows:
where
is the total number of renovated lines.
is the average electricity selling price during the planning period.
is the total transmission capacity of the AC line before renovation.
is the total transmission capacity of the VSC-HVDC transmission line after renovation.
2.1.2. Network Loss
Network loss reflects the economic performance of system operation. Smaller losses indicate higher transmission efficiency and better cost-effectiveness. For DC lines, losses of converter equipment should also be considered. The power losses between nodes
i and
j for AC lines and DC lines are given as follows:
where
and
are the voltages at node
i for AC and DC lines, respectively.
and
are the active and reactive power flowing between nodes
i and
j for AC lines.
is the active power flowing between nodes
i and
j for DC lines.
and
are the resistances between nodes
i and
j for AC and DC lines, respectively.
The total power loss of AC/DC hybrid transmission is as follows:
where
and
are the numbers of AC and DC lines, respectively, and
is the loss of the
pth VSC.
2.2. Resilience
Referring to the Guide on Security and Stability of Power Systems, the time window for the transient recovery time indicator is defined as follows: beginning at the moment when the fault is fully isolated, the system is considered to have returned to steady-state operation when the voltages at key buses remain stably within the range of 0.95–1.05 p.u., the active power transferred by the line is no less than 90% of its steady-state value, and no limit violations occur for five consecutive power-frequency cycles (0.1 s in a 50 Hz power grid). The time interval between this recovery completion moment and the fault isolation moment is taken as the recovery time window.
2.2.1. Transient Active Power Recovery Time
After a disturbance, the system should retain a certain degree of frequency stability, which fundamentally relies on its ability to restore power balance through active power regulation. To characterize the system’s active power regulation and recovery capability following a disturbance, the transient active power recovery time is selected as an evaluation indicator. A shorter recovery time indicates a faster active power response, a stronger post-disturbance recovery capability, and, thus, a higher level of system resilience. The indicator is calculated as follows:
where
Tpn is the time at which the active power returns to within the tolerance range after the disturbance.
Tf is the time at which the disturbance is cleared.
2.2.2. Transient Voltage Recovery Time
After a disturbance, the bus voltage should possess strong recovery capability. To characterize the system’s voltage regulation and recovery capability following the disturbance, the transient voltage recovery time is selected as an evaluation indicator. A shorter recovery time indicates a faster voltage regulation response, a stronger recovery capability, and thus a higher level of system resilience. It is defined as follows:
where
Tvn is the time at which the bus voltage returns to within the tolerance range after the disturbance.
2.3. Safety
2.3.1. Short-Circuit Current
Short-circuit current (SCC) refers to the current that may arise at a fault point under specified fault conditions when a short-circuit fault occurs at a certain location in the power system. It is an important indicator for evaluating the system short-circuit level and safety margin. In traditional AC power grids dominated by synchronous power sources, the short-circuit current level generally reflects the system strength to a certain extent. However, an excessively high short-circuit current increases the requirements for equipment interrupting capability and thermal stability and may even pose a risk of exceeding operational limits. With the continuous expansion of power grids and the increasing integration of power sources, the short-circuit current level in some traditional large-scale AC grids has continued to rise. Therefore, grid structure renovation should be able to suppress the short-circuit current to a certain extent.
2.3.2. Voltage Sag Magnitude
Voltage sag in a power system refers to a sudden drop in the RMS value of power frequency voltage at a point in the system, falling between 0.1 p.u. and 0.9 p.u. and then returning to normal within 10 ms to 1 min. Voltage sag has become a major disturbance that threatens the safe operation of electrical equipment. Evaluating the change before and after renovation can show the effectiveness of the renovation. A smaller voltage sag magnitude means stronger anti-interference ability and higher system safety. Let Vsag represent the voltage sag magnitude, expressed as follows:
where
V0 represents the steady-state voltage before the disturbance.
V1 represents the minimum voltage after the disturbance.
2.4. Reliability
2.4.1. Total Transfer Capacity
Transmission capacity is defined as the maximum active power transmission capability that a transmission corridor can continuously carry while ensuring the safe and reliable operation of the system. It can be characterized by total transfer capability (TTC). TTC is the maximum amount of power that a transmission network can accommodate under predefined normal operating conditions and post-contingency system conditions, and it is a core indicator for evaluating the ultimate transmission capability of a transmission network. The calculation of TTC typically includes the following steps: Firstly, gradually increase the active power injection at generator nodes in the source area and the load demand in the sink area. Secondly, perform power flow calculations and security verification under normal operation modes and typical contingency scenarios. Finally, when the system reaches a certain limit (such as voltage violation, line overload, or stability loss), the amount of power transmitted at that point is considered the TTC for that scenario.
2.4.2. Critical Clearing Time
Critical clearing time (CCT) refers to the maximum allowable time for fault clearance after a fault occurs, during which the system can maintain transient stability. It is an important indicator reflecting the transient stability level of the system. If the actual fault clearance time is less than or equal to the CCT, the system can maintain synchronous operation without loss of synchronism after the fault is cleared, indicating that the system remains transiently stable. Conversely, the system will lose transient stability. Therefore, a larger CCT indicates a stronger capability of the system to withstand large disturbances and a higher transient stability margin. Given that among common fault types, three-phase short circuits typically cause the most severe disturbances and correspond to the smallest CCT, this paper selects the CCT under three-phase short circuit conditions as the evaluation indicator.
3. Comprehensive Evaluation Based on Combined Weighting
3.1. Determination of Indicator Weight
3.1.1. Determination of Subjective Weight by FAHP
In evaluating the effectiveness of grid structure renovation, the FAHP [
22] is employed to determine the subjective weights of indicators, which can avoid the one-sidedness and limitations associated with direct weighting. This method builds upon the analytic hierarchy process by constructing a hierarchical structure of “goal-criterion-indicator” to clarify the evaluation logic. At the same time, it introduces fuzzy set theory, replacing the precise matrix used in traditional AHP with a fuzzy judgment matrix. Through fuzzy operations, qualitative evaluations are transformed into quantitative results, achieving an integration of qualitative analysis and quantitative calculation, thereby making the determination of subjective weight more scientific. The calculation steps for subjective weight are as follows:
Geometric interpretation of the triangular fuzzy number: a general triangular fuzzy number
M is expressed as (
l,
m,
u), where
l and
u are the lower and upper bounds, respectively, and
m is the median value at which the membership degree of
M equals 1. When
x =
m,
x fully belongs to
M. Its membership function is shown in Equation (9).
- (1)
Construct the fuzzy judgment matrix for the criteria layer.
Importance scores for the indicators are assigned on a scale of 1 to 9, along with confidence levels for the scores evaluated on a scale of 1, 2, and 3. The importance score serves as the median value m of the triangular fuzzy number M, where a higher score indicates greater relative importance of the indicator. The meaning of the median value of the triangular fuzzy number is shown in
Table 1. The meaning of the confidence level is shown in
Table 2, which determines the lower bound l and upper bound u of M. The triangular fuzzy judgment matrix A is obtained through subjective scoring evaluation.
where
aij represents the triangular fuzzy number and
n represents the number of evaluation objects.
- (2)
Check the consistency of the median matrix T.
To prevent unreasonable value allocation among indicators, the consistency of the judgment matrix must be checked. The maximum eigenvalue of the median matrix T is calculated and substituted into Equation (11) to compute the consistency index (CI). Meanwhile, the corresponding random consistency index (RI) values, obtained from numerous random trials, are listed in
Table 3 and substituted into Equation (12) to calculate the consistency ratio (CR). If the CR is less than 0.1, the consistency check is considered passed.
- (3)
Construct the fuzzy evaluation factor matrix:
where (
uij −
lij)/2
mij is the coefficient of variation.
- (4)
Calculate the adjusted judgment matrix Q.
- (5)
The adjusted judgment matrix Q is converted column-wise into a judgment matrix with diagonal elements equal to 1.
- (6)
Calculate the subjective weight.
The
nth root of all elements in each row is calculated using Equation (15), where
n is the total number of criteria, and then normalized using Equation (16) to obtain the subjective weight of the criteria layer. For the indicators under each criterion, the relative importance among the indicators is weighted to obtain the relative weight
wI of the indicators within each criterion layer. This is then multiplied by the weight
Wi of the corresponding criterion to obtain the subjective weight
Wj of each indicator.
3.1.2. Determination of Objective Weight by EWM
In the process of determining indicator weights using the EWM, the weight coefficient of each indicator is determined based on the amount of information provided by that indicator. The more information an indicator provides, meaning the smaller its information entropy, the greater its degree of variation, and, thus, the more significant its role, so its weight should be larger. Conversely, if the indicator provides less information, its weight should be smaller. The steps for calculating the objective weight of each indicator using the EWM are as follows:
- (1)
Construct the comprehensive evaluation feature matrix.
Assume there are
n evaluation scenarios and
m evaluation indicators. The
m evaluation indicators form an original indicator data matrix for the
n evaluation scenarios, as shown in Equation (18).
- (2)
Standardize the feature matrix.
In multi-indicator evaluation problems, each indicator has its own dimension and type, representing different physical meanings, which makes direct comparison difficult. Therefore, before conducting a comprehensive evaluation, all indicators must be properly transformed and standardized so that a dimensionless evaluation can be performed. Indicator types can be classified into positive indicators, negative indicators, and interval indicators. Positive indicators indicate that larger values are better, negative indicators indicate that smaller values are better, and interval indicators indicate that values falling within a certain interval are optimal. The range transformation method is adopted, where positive indicators are standardized according to Equation (19), negative indicators are standardized according to Equation (20), and interval indicators are standardized according to Equation (21).
where
max(
xij) and
min(
xij) represent the maximum and minimum values of the elements in the
jth column of the feature matrix and
a and
b are the lower and upper bounds of the optimal interval. Through the above transformations, all types of indicators are transformed into positive indicators, with the optimal value being 1 and the worst value being 0.
- (3)
Calculate the entropy value and entropy weight.
Calculate the entropy value
ej of the
jth indicator, as shown in Equation (22).
where
pij is the proportion of the indicator value
yij of the
ith scenario under the
jth indicator.
Calculate the entropy weight
vj of the
jth indicator, as shown in Equation (24), and the objective weight vector of the indicators is given by Equation (25).
3.1.3. Determination of Combined Weight
The method of assigning weights by subjectively scoring the importance of indicators based solely on experience and practical needs overlooks the need for quantitative support from objective data. To overcome the limitations of a single weighting approach, a combined weighting method based on game theory [
24] is adopted, which balances subjective and objective weights to obtain the combined weight, thereby improving the scientific rigor and reliability of the evaluation results.
After obtaining the subjective and objective weights, the optimal combined weight coefficients μ* are solved using Equation (26) and then substituted into Equation (27) to calculate the combined weight ω of the indicators, thereby achieving coordination between the subjective and objective weights.
3.2. Weighted Comprehensive Evaluation
Weighted comprehensive evaluation is a decision-making method that integrates multiple evaluation indicators into a comparable composite score. Its core concept is to quantify importance through weights and combine the standardized data with the weights for calculation. As shown in Equation (27),
B represents the comprehensive evaluation value.
3.3. Comparative Verification Using the TOPSIS Method
The TOPSIS method is one of the most classical objective ranking methods in multi-indicator comprehensive evaluation. Its core idea is to calculate the relative proximity by quantifying the Euclidean distances between each evaluation object and the positive ideal solution and the negative ideal solution and then ranking them accordingly. After constructing the initial evaluation matrix and standardizing the matrix in the same manner as in the EWM, the subsequent evaluation procedure is as follows:
- (1)
Construct the weighted standardized matrix.
In practical evaluation, the importance of each indicator differs, so it is necessary to introduce indicator weights. The combined weighting method based on FAHP-EWM is adopted, and the weighted standardized matrix is denoted as Equation (28).
- (2)
Determine the positive ideal solution and the negative ideal solution.
The ideal solution is the extreme value of each indicator after weighting, rather than the extreme value of the original data. The optimal value and the worst value of each indicator are extracted from the weighted standardized matrix to form the positive ideal solution
A+ and the negative ideal solution
A−.
- (3)
Calculate the Euclidean distance from each evaluation object to the positive ideal solution and the negative ideal solution.
Euclidean distance is the core measure for quantifying the gap in TOPSIS, where the distance from the
ith object to the positive ideal solution is denoted as
and the distance to the negative ideal solution is denoted as
.
- (4)
Calculate the relative closeness and rank.
The relative closeness is used as the final evaluation indicator, where a larger value indicates better comprehensive performance of the evaluation object, as expressed below:
4. Case Study
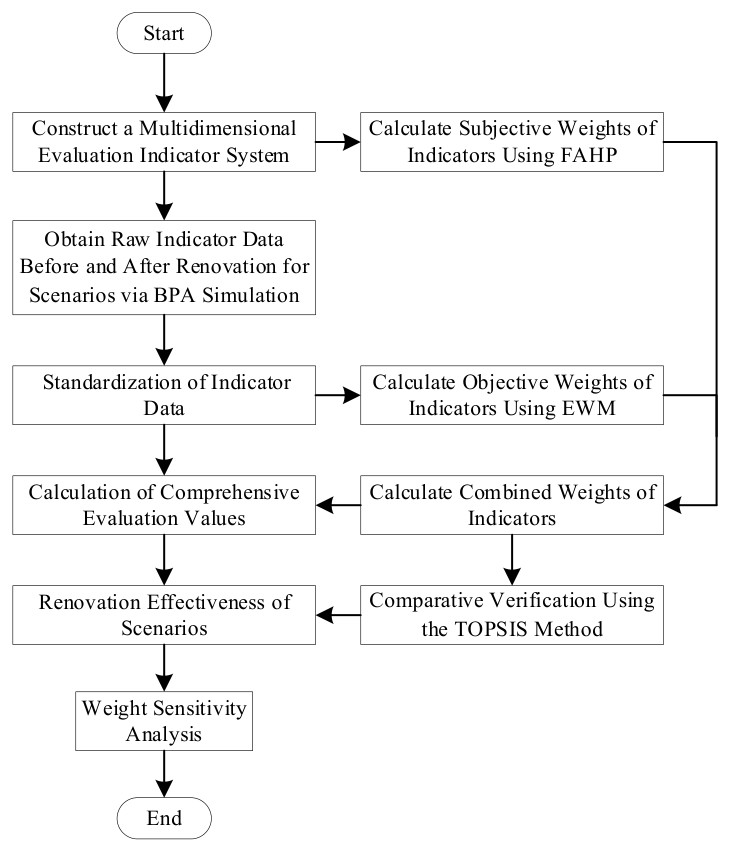
A provincial power grid is selected as a case study, and a comprehensive evaluation is conducted following the framework constructed in
Figure 1.
4.1. Indicator Data
A provincial power grid is selected as a case study, which includes seven scenarios involving AC to VSC-HVDC and one scenario involving LCC-HVDC to VSC-HVDC. The eight scenarios selected are all based on prior field investigations. These scenarios are located in key node corridors of the target grid and were chosen after comprehensively considering both the operational issues of each scenario and the renovation conditions they can accommodate. Therefore, they have good representativeness.
First, simulation models corresponding to each scenario are built in PSD-BPA. Next, considering both single-phase and three-phase short-circuit faults, the fault occurrence time is set to 2.0 s, the fault clearing time to 2.1 s, and the simulation duration to 20.0 s. Finally, simulation data for each scenario before and after renovation are obtained through transient and steady-state calculations and line verification, and the standardized results are presented in
Table 4 and
Table 5, where
Sn represents the
nth scenario.
Scenario 8 in the table corresponds to the conversion of LCC-HVDC into VSC-HVDC. Scenario 3 and Scenario 4 correspond to two forms of renovation in the same area, so the standardized values of all indicators for these two scenarios before renovation are identical. Under this evaluation framework, the raw indicator data obtained from the simulation are standardized to facilitate dimensionless evaluation combined with indicator weights.
4.2. Indicator Weight
Based on the FAHP, and after considering the aforementioned evaluation context and the opinions of experts in the relevant fields, the triangular fuzzy decision matrix shown in
Table 6 was obtained by assigning importance scores to the rule layers and evaluating the confidence levels of those scores. The CR value is 0.01148, which is less than 0.1, indicating that the consistency check is satisfied. The two types of fuzzy judgment matrices used for the indicator layer are shown in
Table 7.
After obtaining the criteria layer weights, subjective weights were further determined based on the relative importance of each indicator, as presented in
Table 8. Based on EWM, the objective weight allocation of the indicators is obtained, as presented in
Table 9. In the subjective weighting results obtained by FAHP, TTC has the highest weight, followed by SCC and CCT, which indicates that expert judgments place greater emphasis on the impact of grid structure renovation on transmission capacity, short-circuit current level, and transient stability margin. In the objective weighting results, SCC and CCT have relatively high weights, suggesting that these two indicators exhibit greater variation across different scenarios and contain richer information.
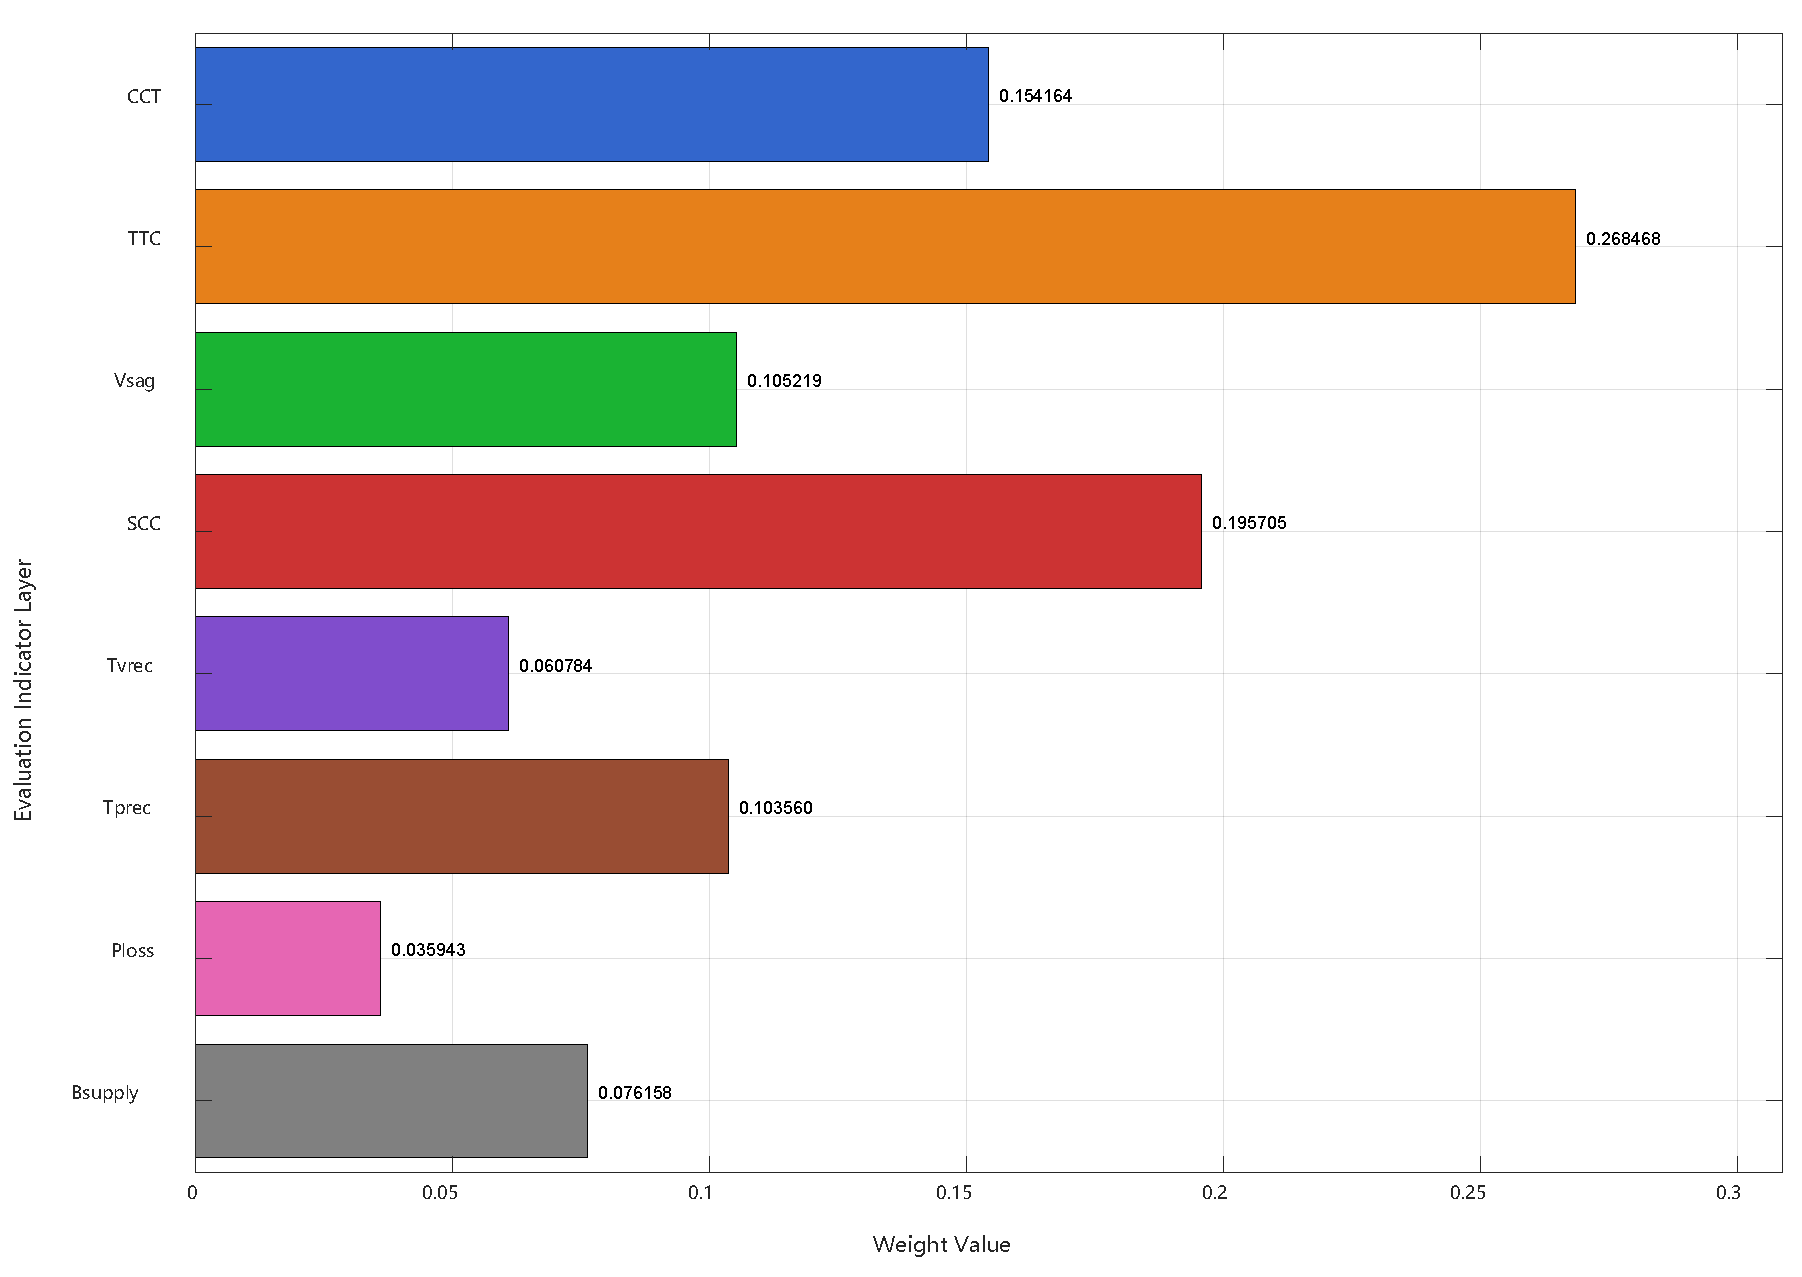
To comprehensively consider the influence of subjective and objective weights, the combined weight allocation is obtained through the combined weighting method, as shown in
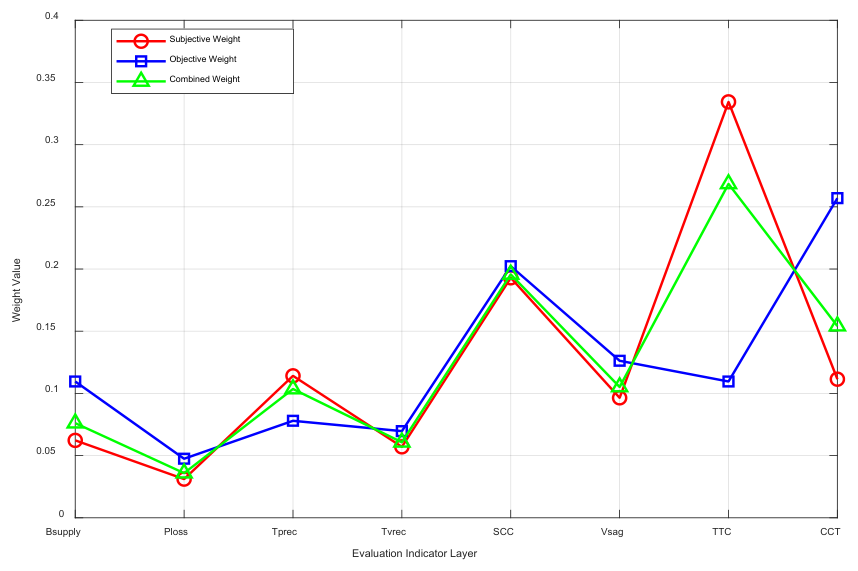
Figure 2. A comparative analysis is conducted on the subjective weights, objective weights, and combined weights, as shown in
Figure 3.
It can be seen that the combined weighting approach not only preserves the overall trend of the subjective judgment results but also accounts for the variation characteristics reflected in the objective data, making the evaluation more balanced and effectively capturing the contribution of each indicator to the effectiveness of grid structure renovation.
4.3. Evaluation of Renovation Effectiveness
4.3.1. Calculation of Pre-Renovation and Post-Renovation Comprehensive Evaluation Values
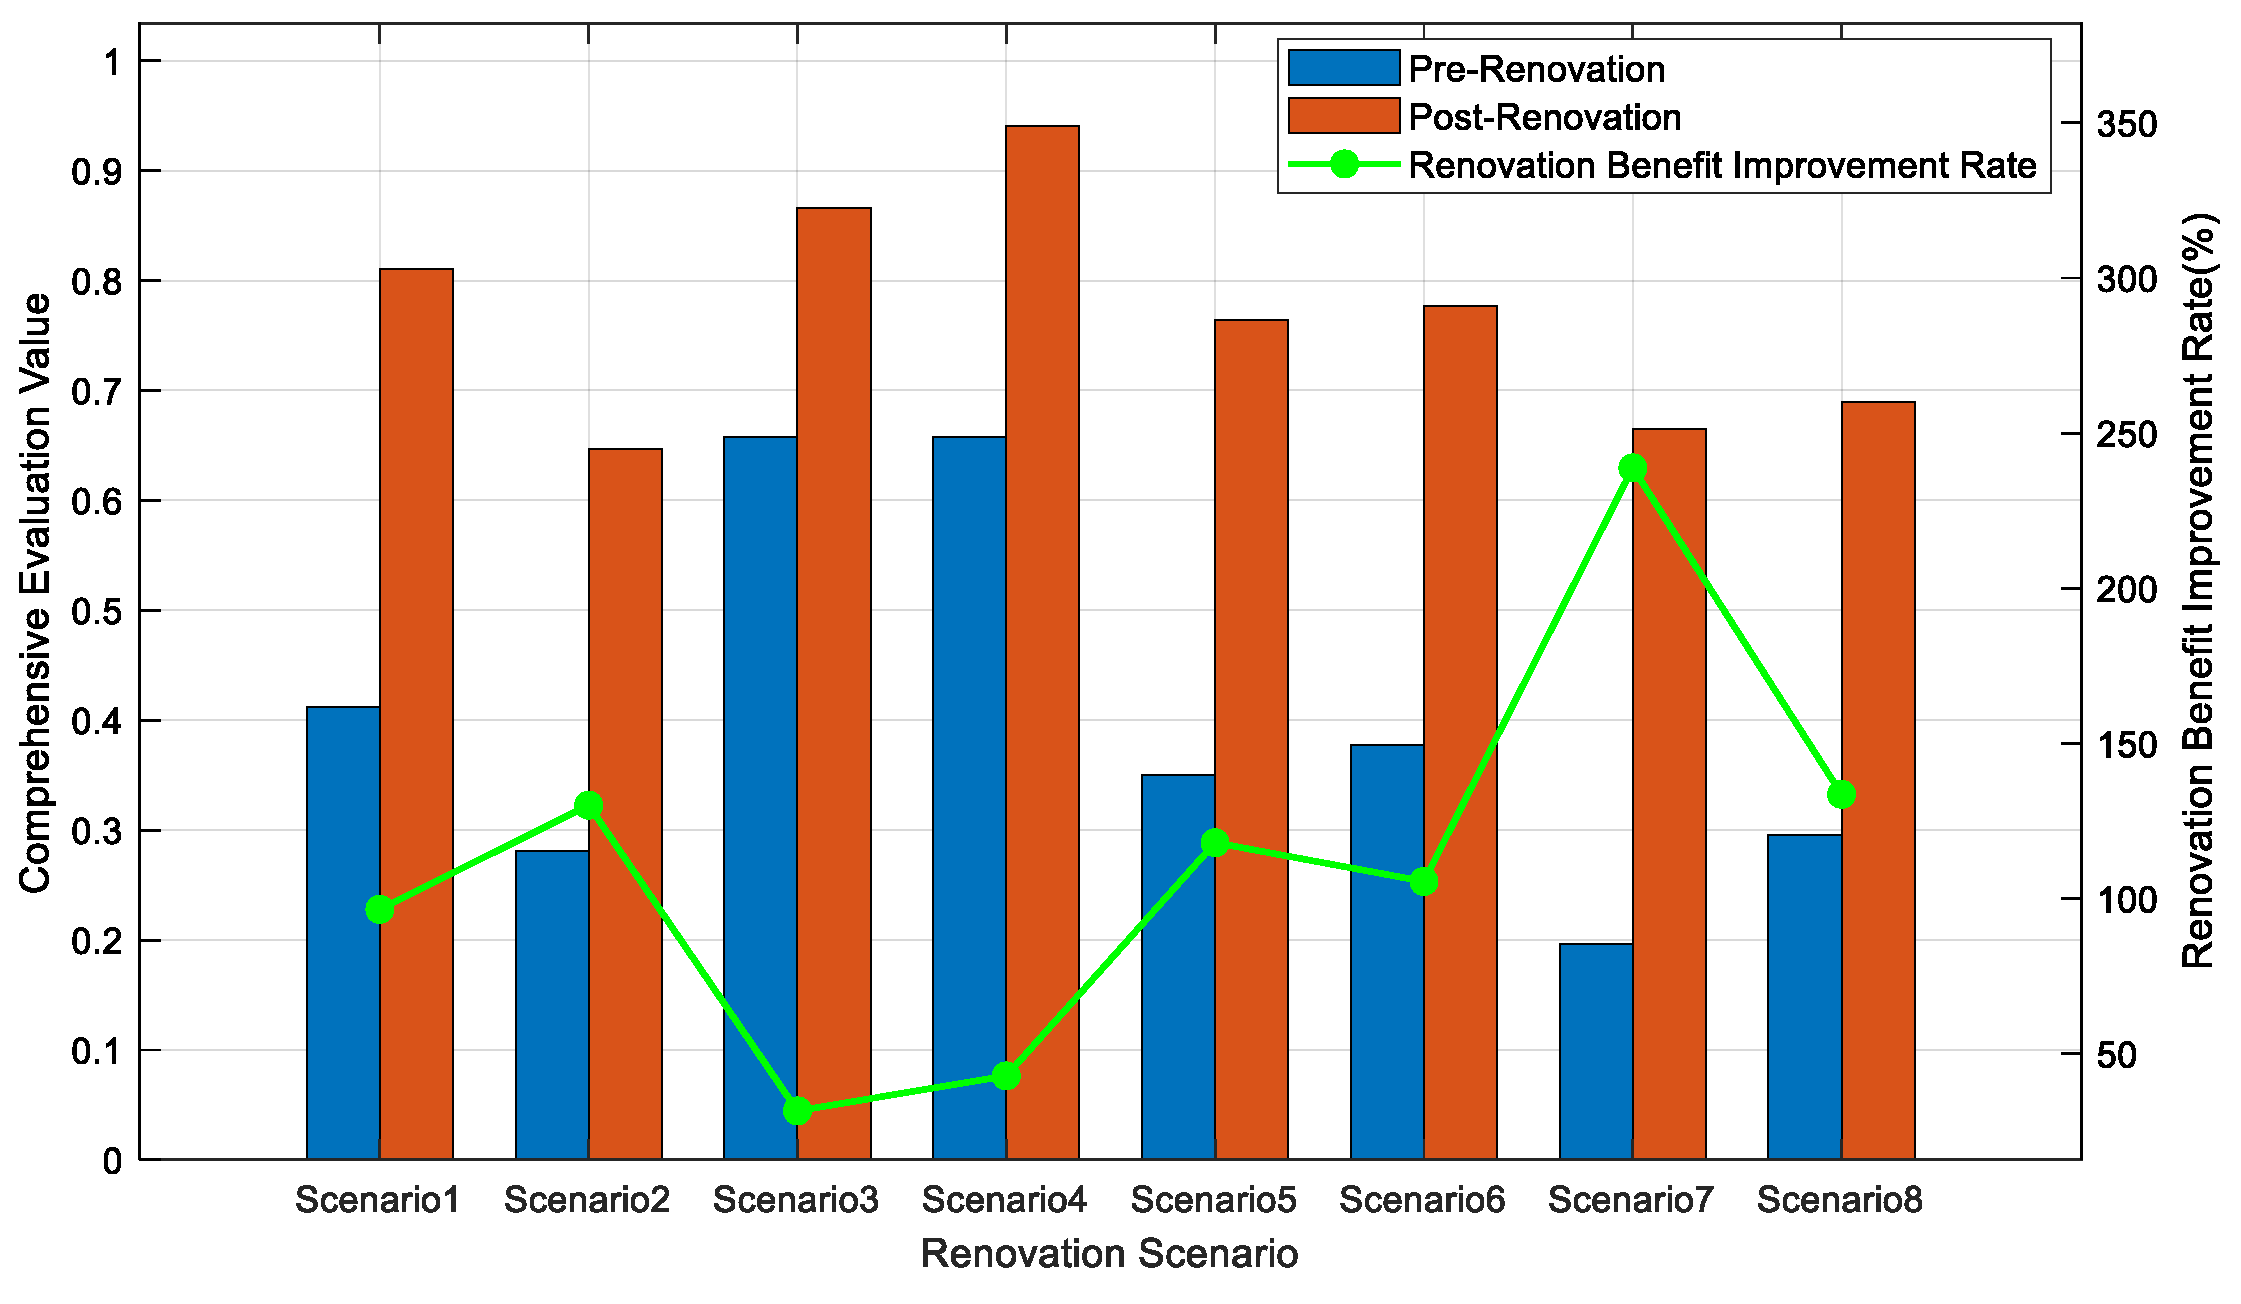
The comprehensive evaluation values calculated for each scenario before and after renovation are shown in
Figure 4.
It can be seen that the comprehensive evaluation values of all post-renovation scenarios have increased, indicating that the grid structure renovation has a positive effect. Among them, Scenario 7 exhibits the highest improvement rate in the effectiveness of the renovation. Scenarios 3 and 4 have the same pre-renovation operating conditions and already exhibit relatively good operational performance compared with the other scenarios; therefore, their improvement rates are limited. The evaluation results have certain engineering reference value. For example, power planning departments can comprehensively consider the post-renovation evaluation value and the improvement rate of renovation benefits for each scenario to determine the priority direction for future renovation.
4.3.2. Comparative Verification
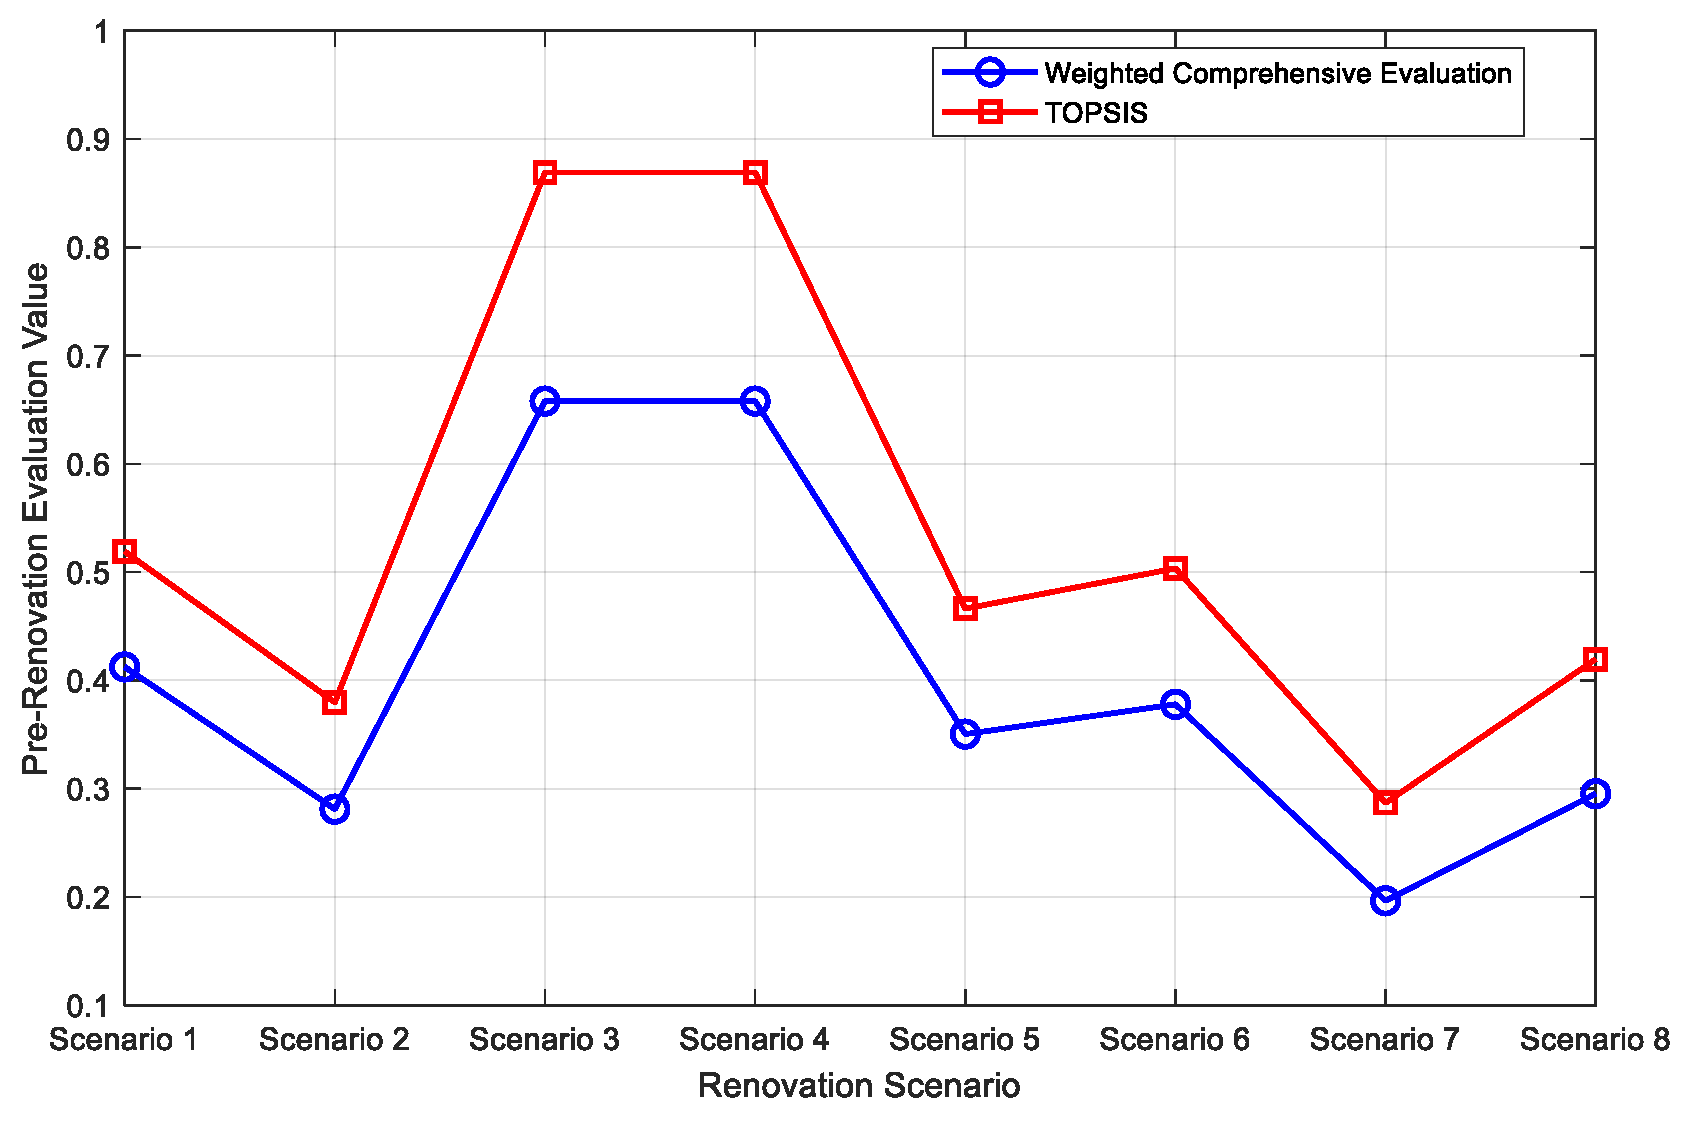
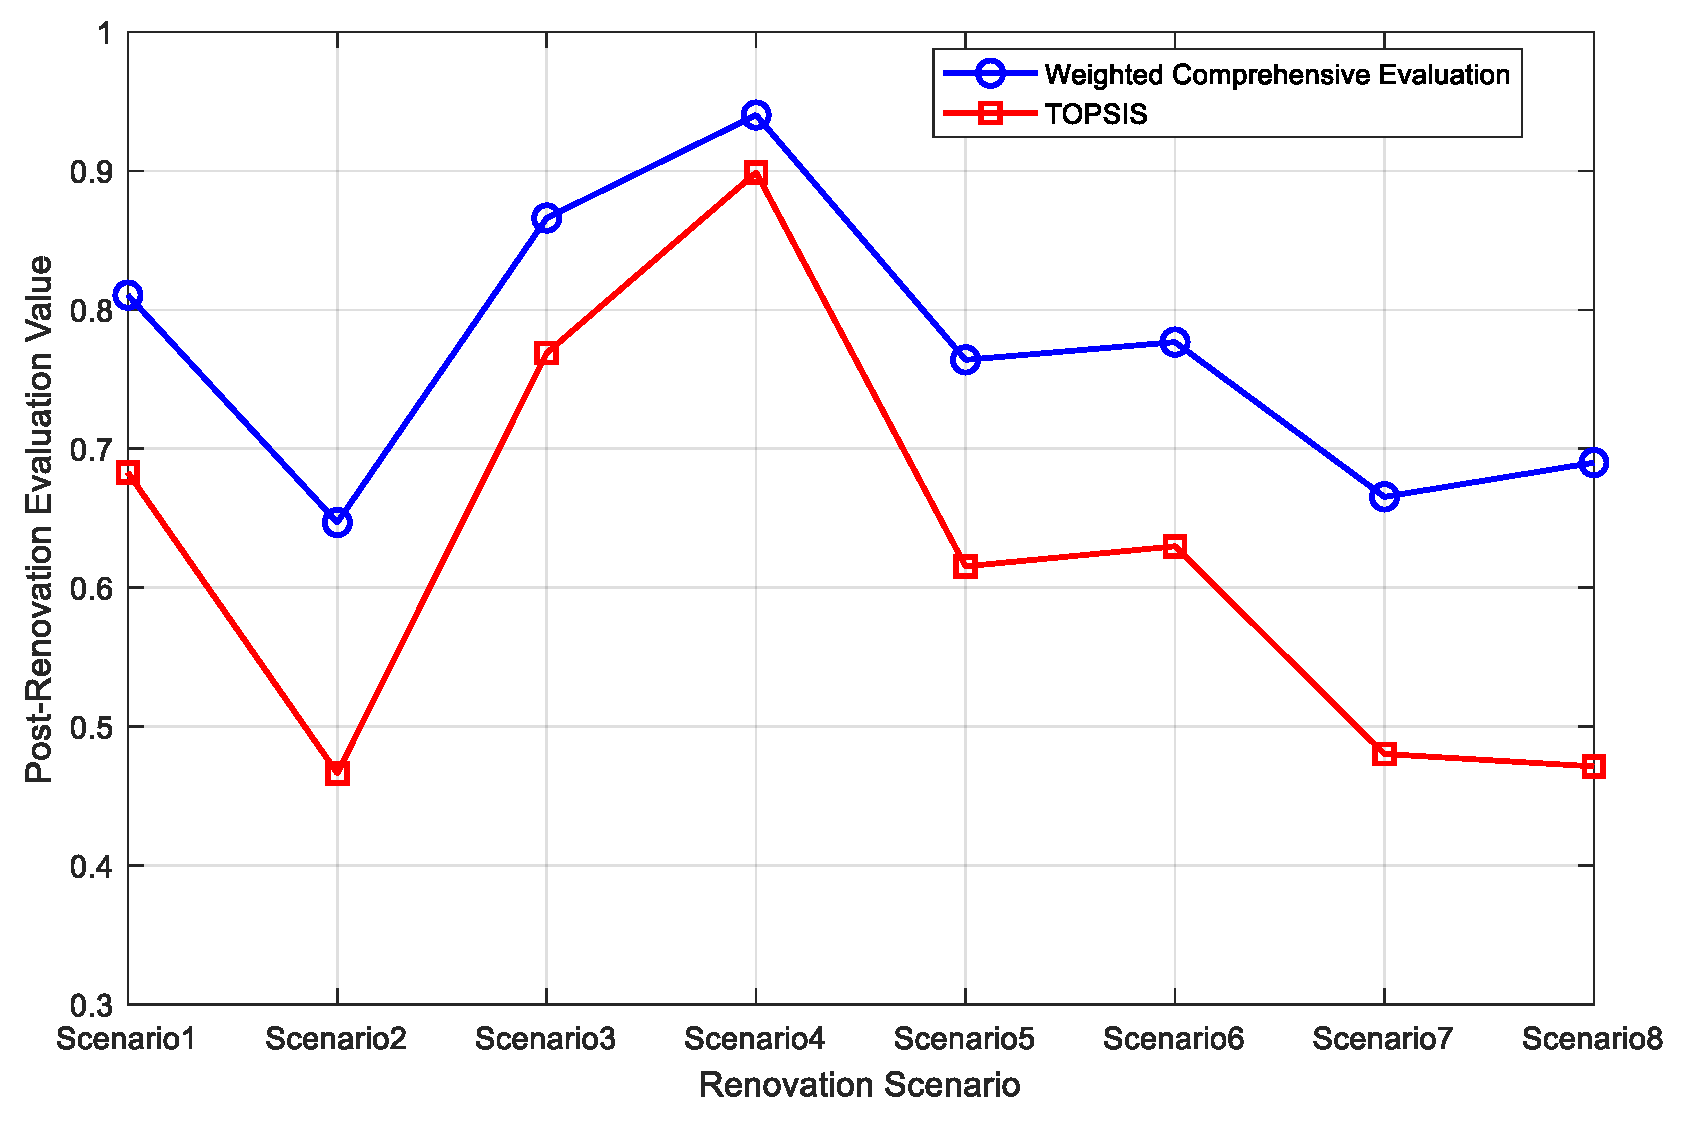
To validate the effectiveness of the weighted comprehensive evaluation method, the TOPSIS method is used to calculate and rank the evaluation values for each scenario before and after renovation. The results of the two evaluation methods before and after renovation are compared in
Figure 5 and
Figure 6. It can be seen that the proposed method shows strong consistency with the TOPSIS method both before and after renovation, confirming the validity of the evaluation.
4.4. Weight Sensitivity Analysis
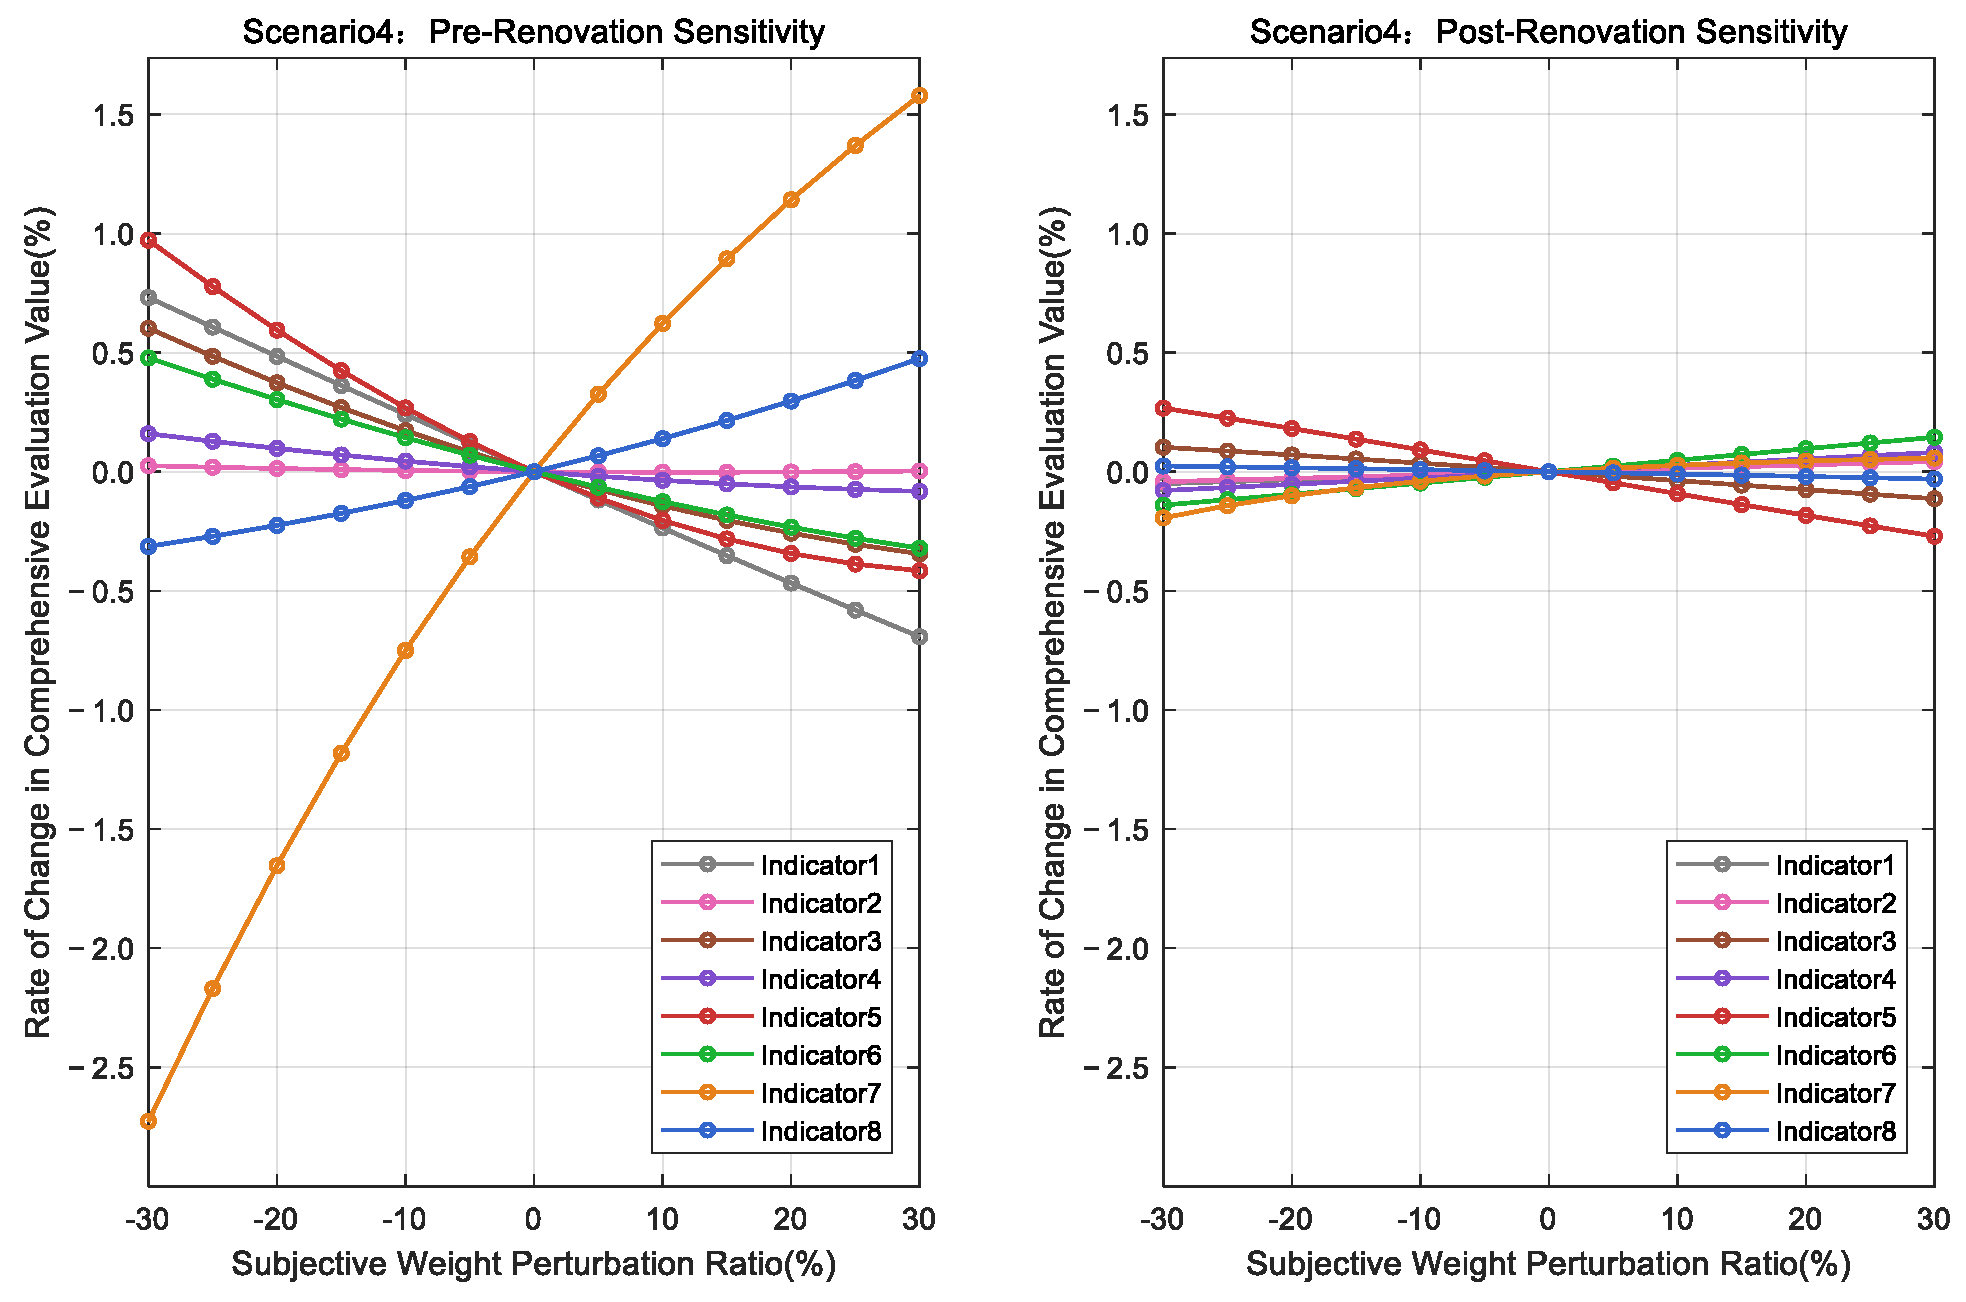
Objective weights come directly from the data, while subjective weights rely on expert opinions. Since experts may disagree, their assigned weights can vary. To investigate how changes in subjective weights impact evaluation results, a sensitivity analysis is introduced. Each indicator’s subjective weight is perturbed within a range of ±30%, while keeping the weights normalized. After perturbation, the rate of change in the comprehensive evaluation value is calculated, making it visible to illustrate how changes in subjective weights affect the evaluation results.
Now, a sensitivity analysis of subjective weight for single indicators is conducted for each scenario. The analysis results for Scenario 4 before and after renovation are shown in
Figure 7. The maximum rate of change in comprehensive evaluation value for each scenario before and after renovation is shown in
Table 10. For Scenario 4, the maximum rate of change in comprehensive evaluation value before renovation is −2.727%, which narrows significantly to −0.271% after renovation. For all other scenarios, the absolute value of the maximum rate of change before and after renovation does not exceed 7.5%, and the rate of change for most scenarios after renovation is significantly lower than that before renovation. This indicates that fluctuations in subjective weight allocation have a limited impact on the comprehensive evaluation results, and the proposed evaluation method has good robustness, with the stability of the evaluation results further improved after renovation.
5. Conclusions
In this paper, a comprehensive evaluation framework based on the FAHP and EWM is developed to quantitatively assess the effectiveness of power grid structure renovation. Several typical renovation scenarios of a practical power grid are selected as simulation case studies for empirical analysis, thereby demonstrating the effectiveness and applicability of the proposed method. The main conclusions are as follows.
First, this paper selects eight indicators from four criteria to comprehensively characterize the overall performance of grid structure renovation. The game theory-based combined weighting method is employed to determine the combined weight of each evaluation indicator, taking into account both subjective judgment and objective data characteristics, thereby enhancing the scientific validity and reliability of the evaluation results. Second, the case study results strongly demonstrate the effectiveness of VSC-HVDC technology in enhancing grid performance. The comprehensive evaluation scores for all eight renovation scenarios show varying degrees of improvement compared with their pre-renovation values. Meanwhile, the differences in evaluation values before and after renovation, along with the improvement rates in renovation benefits, can be comprehensively considered to determine priority directions for renovation. Finally, the proposed evaluation method shows strong consistency in comparative verification with the TOPSIS method, and the weight sensitivity analysis indicates that it has good robustness against fluctuations in subjective weights. Thus, the method provides a quantitative decision-making basis for power planning departments in areas such as multi-scenario comparison, prioritization of renovation projects, and assessment of investment effectiveness.
Future work will further refine the evaluation indicator system and supplement the multi-dimensional evaluation validation method. It will also extend the proposed approach to assess the effectiveness of grid structure renovation across multiple regions and time scales, thereby further enhancing its applicability and engineering guidance value.
Author Contributions
Conceptualization, B.J.; Methodology, B.J. and H.Z.; Software, B.J. and H.Z.; Formal analysis, Z.L.; Investigation, S.L. and H.D.; Writing—original draft, B.J.; Writing—review and editing, C.J. and J.L. (Jindi Luo); Visualization, J.L. (Jiaying Lian); Supervision, B.J.; Funding acquisition, B.J. All authors have read and agreed to the published version of the manuscript.
Funding
The authors declare that this study received funding from the Science and Technology Projects of China Southern Power Grid (No. 030000KC24040059). The funder had the following involvement with the study: interpretation of data and the decision to submit it for publication.
Data Availability Statement
The original contributions presented in this study are included in the article. Further inquiries can be directed to the corresponding author.
Conflicts of Interest
Author Bingjie Jin was employed by the company Power Grid Planning and Research Center, Guangdong Power Grid Co. ltd., Guangzhou, China. The remaining authors declare that the research was conducted in the absence of any commercial or financial relationships that could be construed as a potential conflict of interest.
References
- Mirzapour, O.; Rui, X.; Sahraei-Ardakani, M. Grid-Enhancing Technologies: Progress, Challenges, and Future Research Directions. Electr. Power Syst. Res. 2024, 230, 110304. [Google Scholar] [CrossRef] [Scilit]
- Xie, X.; Liu, Y.; Wang, X.; Han, Y. On Constructing New-Type Power Systems in China. CSEE J. Power Energy Syst. 2025, 11, 2710–2728. [Google Scholar] [CrossRef] [Scilit]
- Ali, J.S.; Qiblawey, Y.; Alassi, A.; Massoud, A.M.; Muyeen, S.M.; Abu-Rub, H. Power System Stability with High Penetration of Renewable Energy Sources: Challenges, Assessment, and Mitigation Strategies. IEEE Access 2025, 13, 39912–39934. [Google Scholar] [CrossRef] [Scilit]
- Masiello, R.; Pandey, S.; Chatterjee, D.; Harper, A.; Jackson, A.; Takayesu, E. Understanding Grid Flexibility: Flexibility for Integrated Grid Planning with Distributed Energy Resources. IEEE Power Energy Mag. 2024, 22, 60–66. [Google Scholar] [CrossRef] [Scilit]
- Lai, C.; Kazemtabrizi, B. A Novel Two-Stage Framework to Improve the Flexibility of Grid-Connected Wind-Hydro Power System in Real-Time Operation. Appl. Energy 2025, 396, 126211. [Google Scholar] [CrossRef] [Scilit]
- Meng, T.; Yu, J.; Guo, Y.; Yi, Z. Adaptability of Business Models for the Wind Farm-Flexible Load Joint Operation System to Enhance Profit and Grid Integration. Electr. Power Syst. Res. 2026, 252, 112366. [Google Scholar] [CrossRef] [Scilit]
- Zhang, M.; Li, P.; Yao, Y.; Kanji, A.R.; Zhao, Z.; Chen, D.; De Assis Brasil Weber, N.; Hunt, J.D. Unlocking Mid-to-Long-Term Flexibility: Why Seasonal Pumped Storage Outperforms Conventional Pumped Storage in Wind-Solar Dominated Grids. Energy Convers. Manag. 2026, 348, 120750. [Google Scholar] [CrossRef] [Scilit]
- Lai, J.; Liu, Y.; Yin, X.; Wang, Y.; Hu, J.; Yin, X.; Zhou, K. A Novel Hybrid Interlinking Transformer-Integrated DFIG Wind Power and Energy Storage System with Flexible Control Strategy. Int. J. Electr. Power Energy Syst. 2025, 168, 110641. [Google Scholar] [CrossRef] [Scilit]
- Zhao, Y.; Bi, Y.; Xu, Y.; Gao, Y.; Hu, S.; Guo, Y.; Yang, J. Dynamic Programming-Based Energy Storage Siting and Sizing: Application to Enhance Flexibility of Large-Scale Power Grid. J. Energy Storage 2025, 106, 114734. [Google Scholar] [CrossRef] [Scilit]
- Jalalian, H.; Samiei Moghaddam, M.; Vahedi, M.; Davarzani, R.; Hoseinpour, H. Optimization of Integrated Energy Systems for Enhanced Grid Flexibility Using the Meerkat Optimization Algorithm. Int. J. Electr. Power Energy Syst. 2025, 172, 111263. [Google Scholar] [CrossRef] [Scilit]
- Navidi, T.; El Gamal, A.; Rajagopal, R. Coordinating Distributed Energy Resources for Reliability Can Significantly Reduce Future Distribution Grid Upgrades and Peak Load. Joule 2023, 7, 1769–1792. [Google Scholar] [CrossRef] [Scilit]
- Ma, S.; Liu, L.; Cheng, H.; Zhang, X.; Xu, L.; Lou, W.; Wu, J. Transmission Grid and Distribution Grid Flexible Planning under High Level Renewable Energy. Electr. Power Syst. Res. 2025, 245, 111639. [Google Scholar] [CrossRef] [Scilit]
- Zheng, W.; Rao, H. Flexible Grid-Forming Technology and Its Application in New Power System. Autom. Electr. Power Syst. 2025, 49, 1–10. [Google Scholar] [CrossRef]
- Si, J.; Wu, X.; Guo, Q.; Lu, J. A Hierarchical Scheduling Approach for Grid Flexibility Improvement Considering Embedded HVDC Control Modes. IEEE Trans. Power Syst. 2025, 41, 2205–2218. [Google Scholar] [CrossRef] [Scilit]
- Xie, Q.; Huang, Y.; Cai, H.; Wang, G.; Dou, F.; Sun, W. Embedded HVDC System Planning Methods for Typical Scenarios in Regional Power Grids. Electronics 2025, 14, 3292. [Google Scholar] [CrossRef] [Scilit]
- Jiang, L.; Yuan, Y.; Wang, Z.; Wang, S. Evaluation Index System and Comprehensive Evaluation Method of Energy Internet in Innovative Demonstration Area of Smart Grid. Proc. CSU-EPSA 2016, 28, 39–45. [Google Scholar] [CrossRef]
- Ma, Y.; Li, Y.; Zhu, S.; Qin, N.; Zhao, G.; Huang, C. Fuzzy AHP-Based Comprehensive Evaluation for Smart Grid in Energy Internet Systems. Int. J. Perform. Eng. 2018, 14, 1705–1711. [Google Scholar] [CrossRef] [Scilit]
- Ma, R.; Wang, Z.; Ju, S.; Zhu, W.; Jiao, Z.; Wu, J. Comprehensive Appraisal of the Flexibility Modification of Thermal Power Units in Accordance with AHP-Fuzzy Comprehensive Evaluation Technique. In Proceedings of the 2025 IEEE 3rd International Conference on Control, Electronics and Computer Technology (ICCECT), Jilin, China, 25–27 April 2025; IEEE: Piscataway, NJ, USA, 2025; pp. 927–931. [Google Scholar] [CrossRef] [Scilit]
- Chen, C.; Qi, H.-R.; Guo, F.; Xue, W.-J.; Yan, X.-Y.; Kang, Y.-L.; Cai, P.-C.; Li, S.-D.; Ma, S.-Y.; Mi, Y. Comprehensive Evaluation Method for Grid-Connected Rooftop Photovoltaic Based on FAHP-Improved CRITIC and TOPSIS-RSR. J. Electr. Eng. Technol. 2025, 20, 3889–3906. [Google Scholar] [CrossRef] [Scilit]
- Ma, X.; Zhao, Z. Investment Efficiency Evaluation of Electric Power Substation Projects by Stages Using the EWM-DEA Model. Int. J. Ind. Syst. Eng. 2024, 46, 34–57. [Google Scholar] [CrossRef] [Scilit]
- Zhang, S.; Zhang, X.; Bonjesi, B. Cascading Failure Simulation of Cyber-Physical Power Systems with Multi-Timescale Synchronisation and Data Exchange. IEEE Trans. Ind. Inform. 2026, 22, 1–12. [Google Scholar] [CrossRef] [Scilit]
- Rodkumnerd, P.; Pothinun, T.; Phumpho, S.; Watson, N.; Siritaratiwat, A.; Srirattanawichaikul, W.; Khunkitti, S. Fuzzy Analytical Hierarchy Process-Based Multi-Criteria Decision Framework for Risk-Informed Maintenance Prioritization of Distribution Transformers. Energies 2026, 19, 460. [Google Scholar] [CrossRef] [Scilit]
- Moslem, S.; Farooq, D.; Jamal, A.; Almarhabi, Y.; Almoshaogeh, M.; Butt, F.M.; Tufail, R.F. An Integrated Fuzzy Analytic Hierarchy Process (AHP) Model for Studying Significant Factors Associated with Frequent Lane Changing. Entropy 2022, 24, 367. [Google Scholar] [CrossRef] [Scilit]
- Li, W.; Dong, F.; Ji, Z.; Ji, L. Evaluation of Provincial Power Supply Reliability with High Penetration of Renewable Energy Based on Combination Weighting of Game Theory-TOPSIS Method. Sustain. Energy Grids Netw. 2023, 35, 101092. [Google Scholar] [CrossRef] [Scilit]
| Disclaimer/Publisher’s Note: The statements, opinions and data contained in all publications are solely those of the individual author(s) and contributor(s) and not of MDPI and/or the editor(s). MDPI and/or the editor(s) disclaim responsibility for any injury to people or property resulting from any ideas, methods, instructions or products referred to in the content. |




 ,
,