1. Introduction
Fracture–vuggy carbonate reservoirs contain caves, fractures, conduits, vugs, and matrix pores at strongly different scales; consequently, their effective storage and flow behavior are governed by dynamic connectivity rather than by bulk porosity alone [
1,
2,
3,
4]. Under natural depletion, water injection, and gas injection, the flowing volume may change as individual fracture–vug bodies are successively connected or bypassed. This feature weakens the direct applicability of reserve-evaluation methods derived for relatively homogeneous porous media, including conventional decline-curve analysis and classical material balance [
5,
6,
7].
Recent studies have combined static geological descriptions with dynamic data to improve permeability modeling, vuggy facies recognition, porosity characterization, flow-transition analysis, interwell connectivity interpretation, and numerical history matching in carbonate or vuggy reservoirs [
8,
9,
10,
11,
12,
13,
14,
15,
16]. These studies demonstrate the value of static–dynamic integration, but most of them focus on permeability prediction, facies classification, or model updating. For recoverable-reserve evaluation, three issues remain unresolved: (i) how to express connected water volume at the fracture–vug unit scale in a material-balance framework; (ii) how to correct waterflood characteristic curves when sweep is dominated by channels rather than by quasi-uniform displacement; and (iii) how to update reserves by development stage without treating the static model as the only validation target.
In this context, the S48 unit of the Tahe Oilfield was selected as a representative fracture–vuggy unit to test a bounded and reproducible reserve-updating workflow. The novelty of this paper is not the general idea of combining static and dynamic data, but the formulation and field implementation of two unit-scale corrections: (1) a water-body parameter, Rwo, introduced into material balance to represent connected/injected water volume relative to oil-bearing volume; and (2) a heterogeneity coefficient, M, introduced into segmented waterflood-curve interpretation to account for preferential sweep and effective connectivity. The workflow is then closed by numerical-model calibration and uncertainty screening so that reserve estimates are updated at natural depletion, water injection, and gas-injection stages.
2. Geological Setting
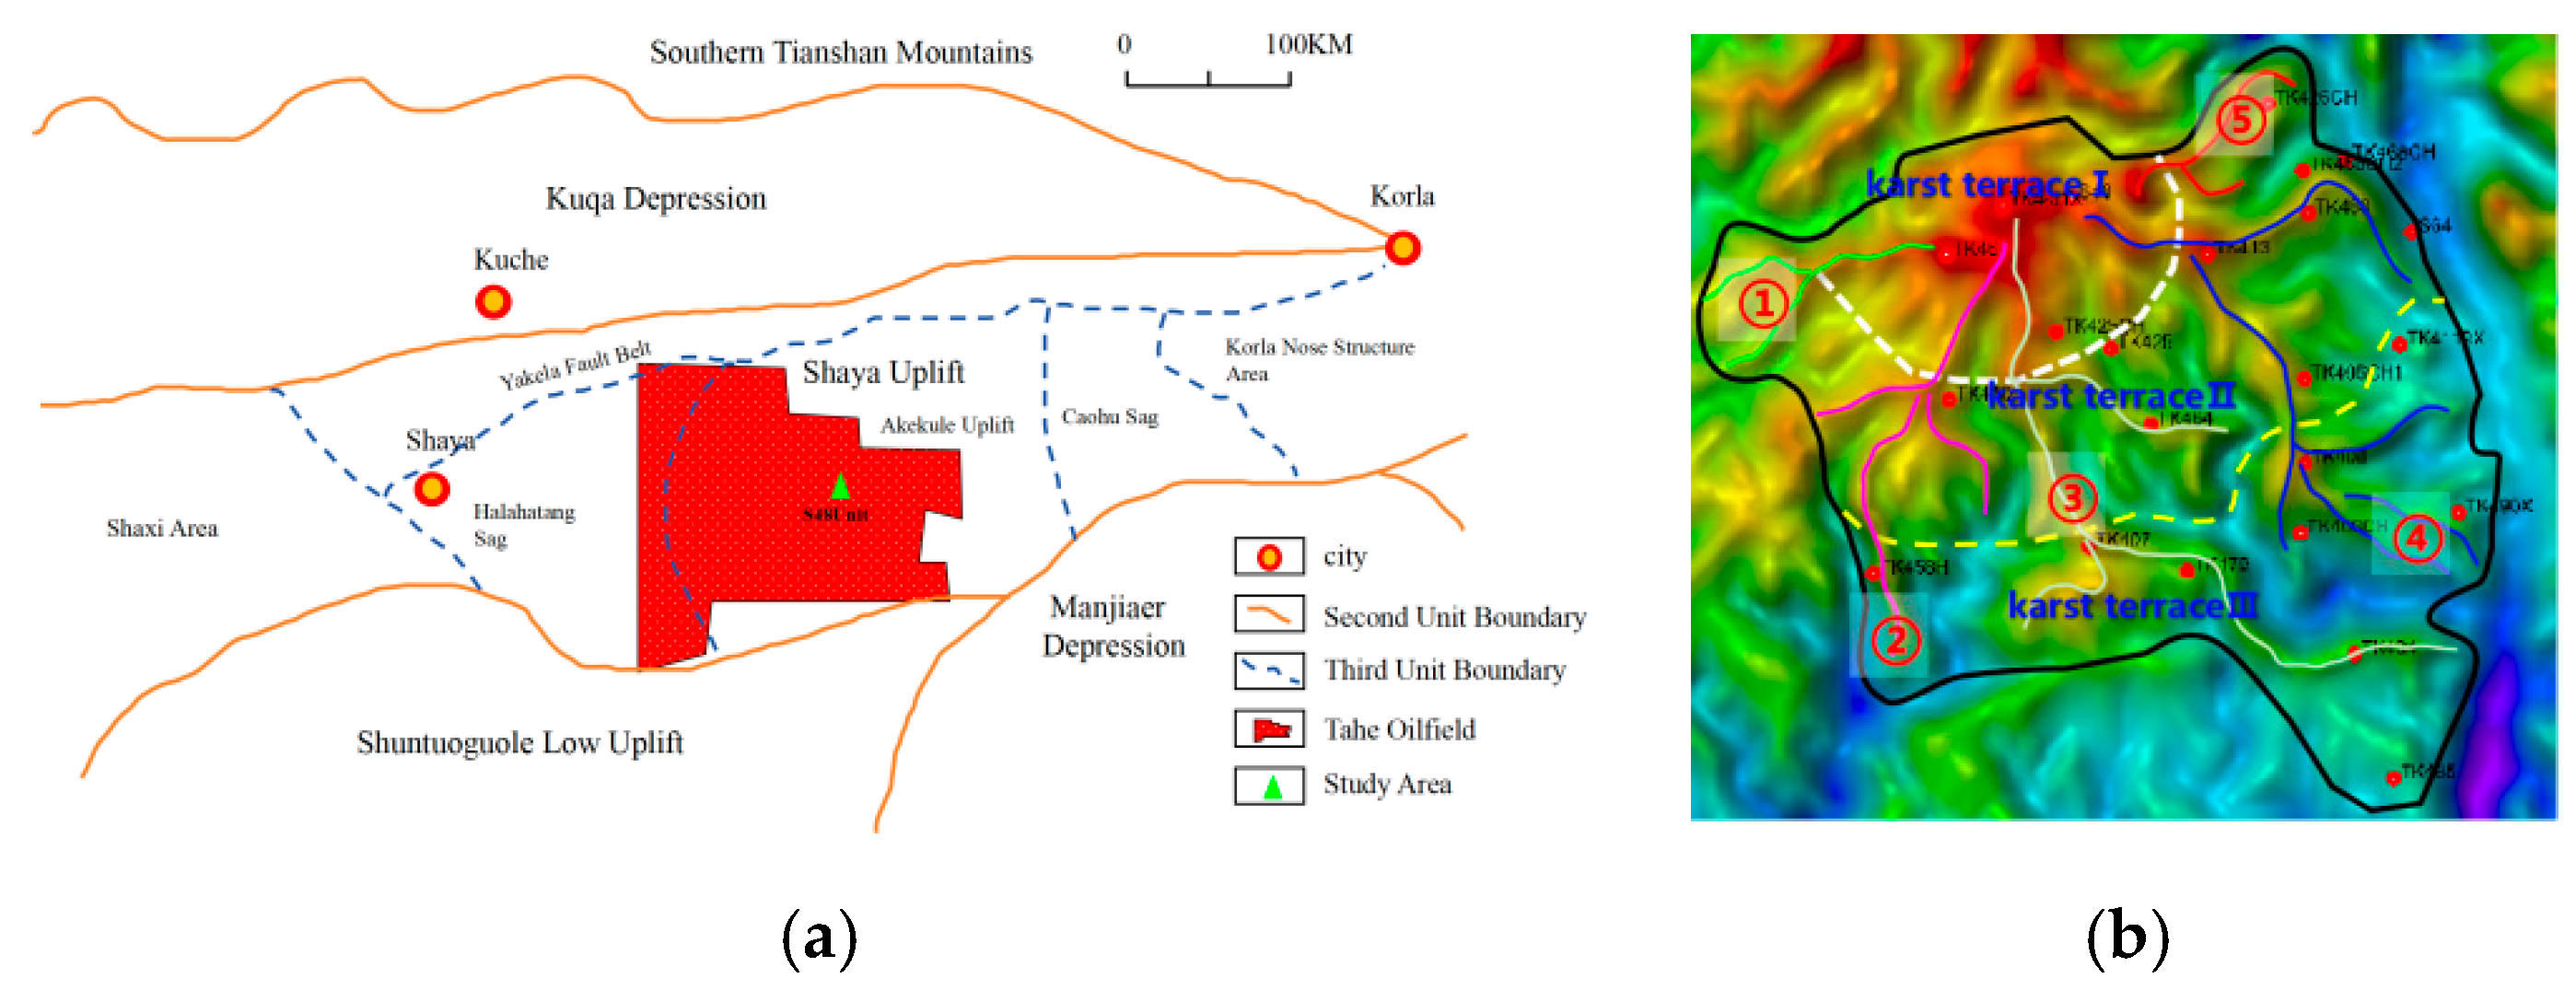
The Tahe Oilfield is located in the southwestern part of the Akekule uplift of the Shaya uplift, Tarim Basin, northwestern China. Its Ordovician carbonate strata experienced multiple episodes of karstification, forming large-scale fracture–vuggy reservoir bodies [
17]. The S48 unit is situated in the southeastern part of Tahe Block 4 and represents a typical weathered-crust composite karst reservoir. The unit exhibits a broad and gentle karst residual-hill morphology with a structural framework of crest–slope–gentle slope. According to topographic relief and structural position, the unit can be divided into three karst terraces, which strongly control fluid migration pathways and reserve mobilization patterns during different development stages.
Figure 1 shows the location map of the study area and the karst terrace landform map within the study area.
3. Methodology
Reserve evaluation in fracture–vuggy reservoirs is essentially an iterative process that moves from static geological recognition toward dynamic characterization of the flowing system. Static modeling alone cannot fully represent dynamic connectivity, whereas dynamic methods alone cannot adequately constrain the spatial architecture of reservoir bodies. Therefore, a workflow integrating static geological modeling, dynamic reserve evaluation, and iterative model correction was established.
3.1. Static Geological Modeling and Reserve Calculation
The objective of static evaluation is to construct a three-dimensional geological-reservoir model that faithfully represents the geometry, spatial distribution, and petrophysical attributes of fracture–vug systems. This model provides both the basis for static geological reserve estimation and the material framework for subsequent dynamic analysis and numerical simulation.
3.1.1. Multiscale Identification and Characterization of Reservoir Bodies
A multiscale characterization strategy combining seismic, logging, core, and production data was used to identify fracture–vuggy reservoir bodies [
18]. At the seismic scale, attributes such as amplitude variation, coherence, curvature, and waveform-indicated inversion were used to delineate large caves (>20 m) and main karst conduits. At the logging scale, image logs were used to identify fracture occurrence and dissolution intervals, while porosity-spectrum analysis decomposed total porosity into matrix, vug, and fracture porosity. At the core and production scales, core observations and well-test responses were used to dynamically calibrate the interpretation results and distinguish effective reservoir bodies from non-productive anomalies.
3.1.2. Three-Dimensional Geological Modeling Workflow and Static Reserve Estimation
Based on the identified reservoir bodies, a 3D geological model of the S48 unit was built following a hierarchy-constrained and genesis-controlled strategy [
19,
20,
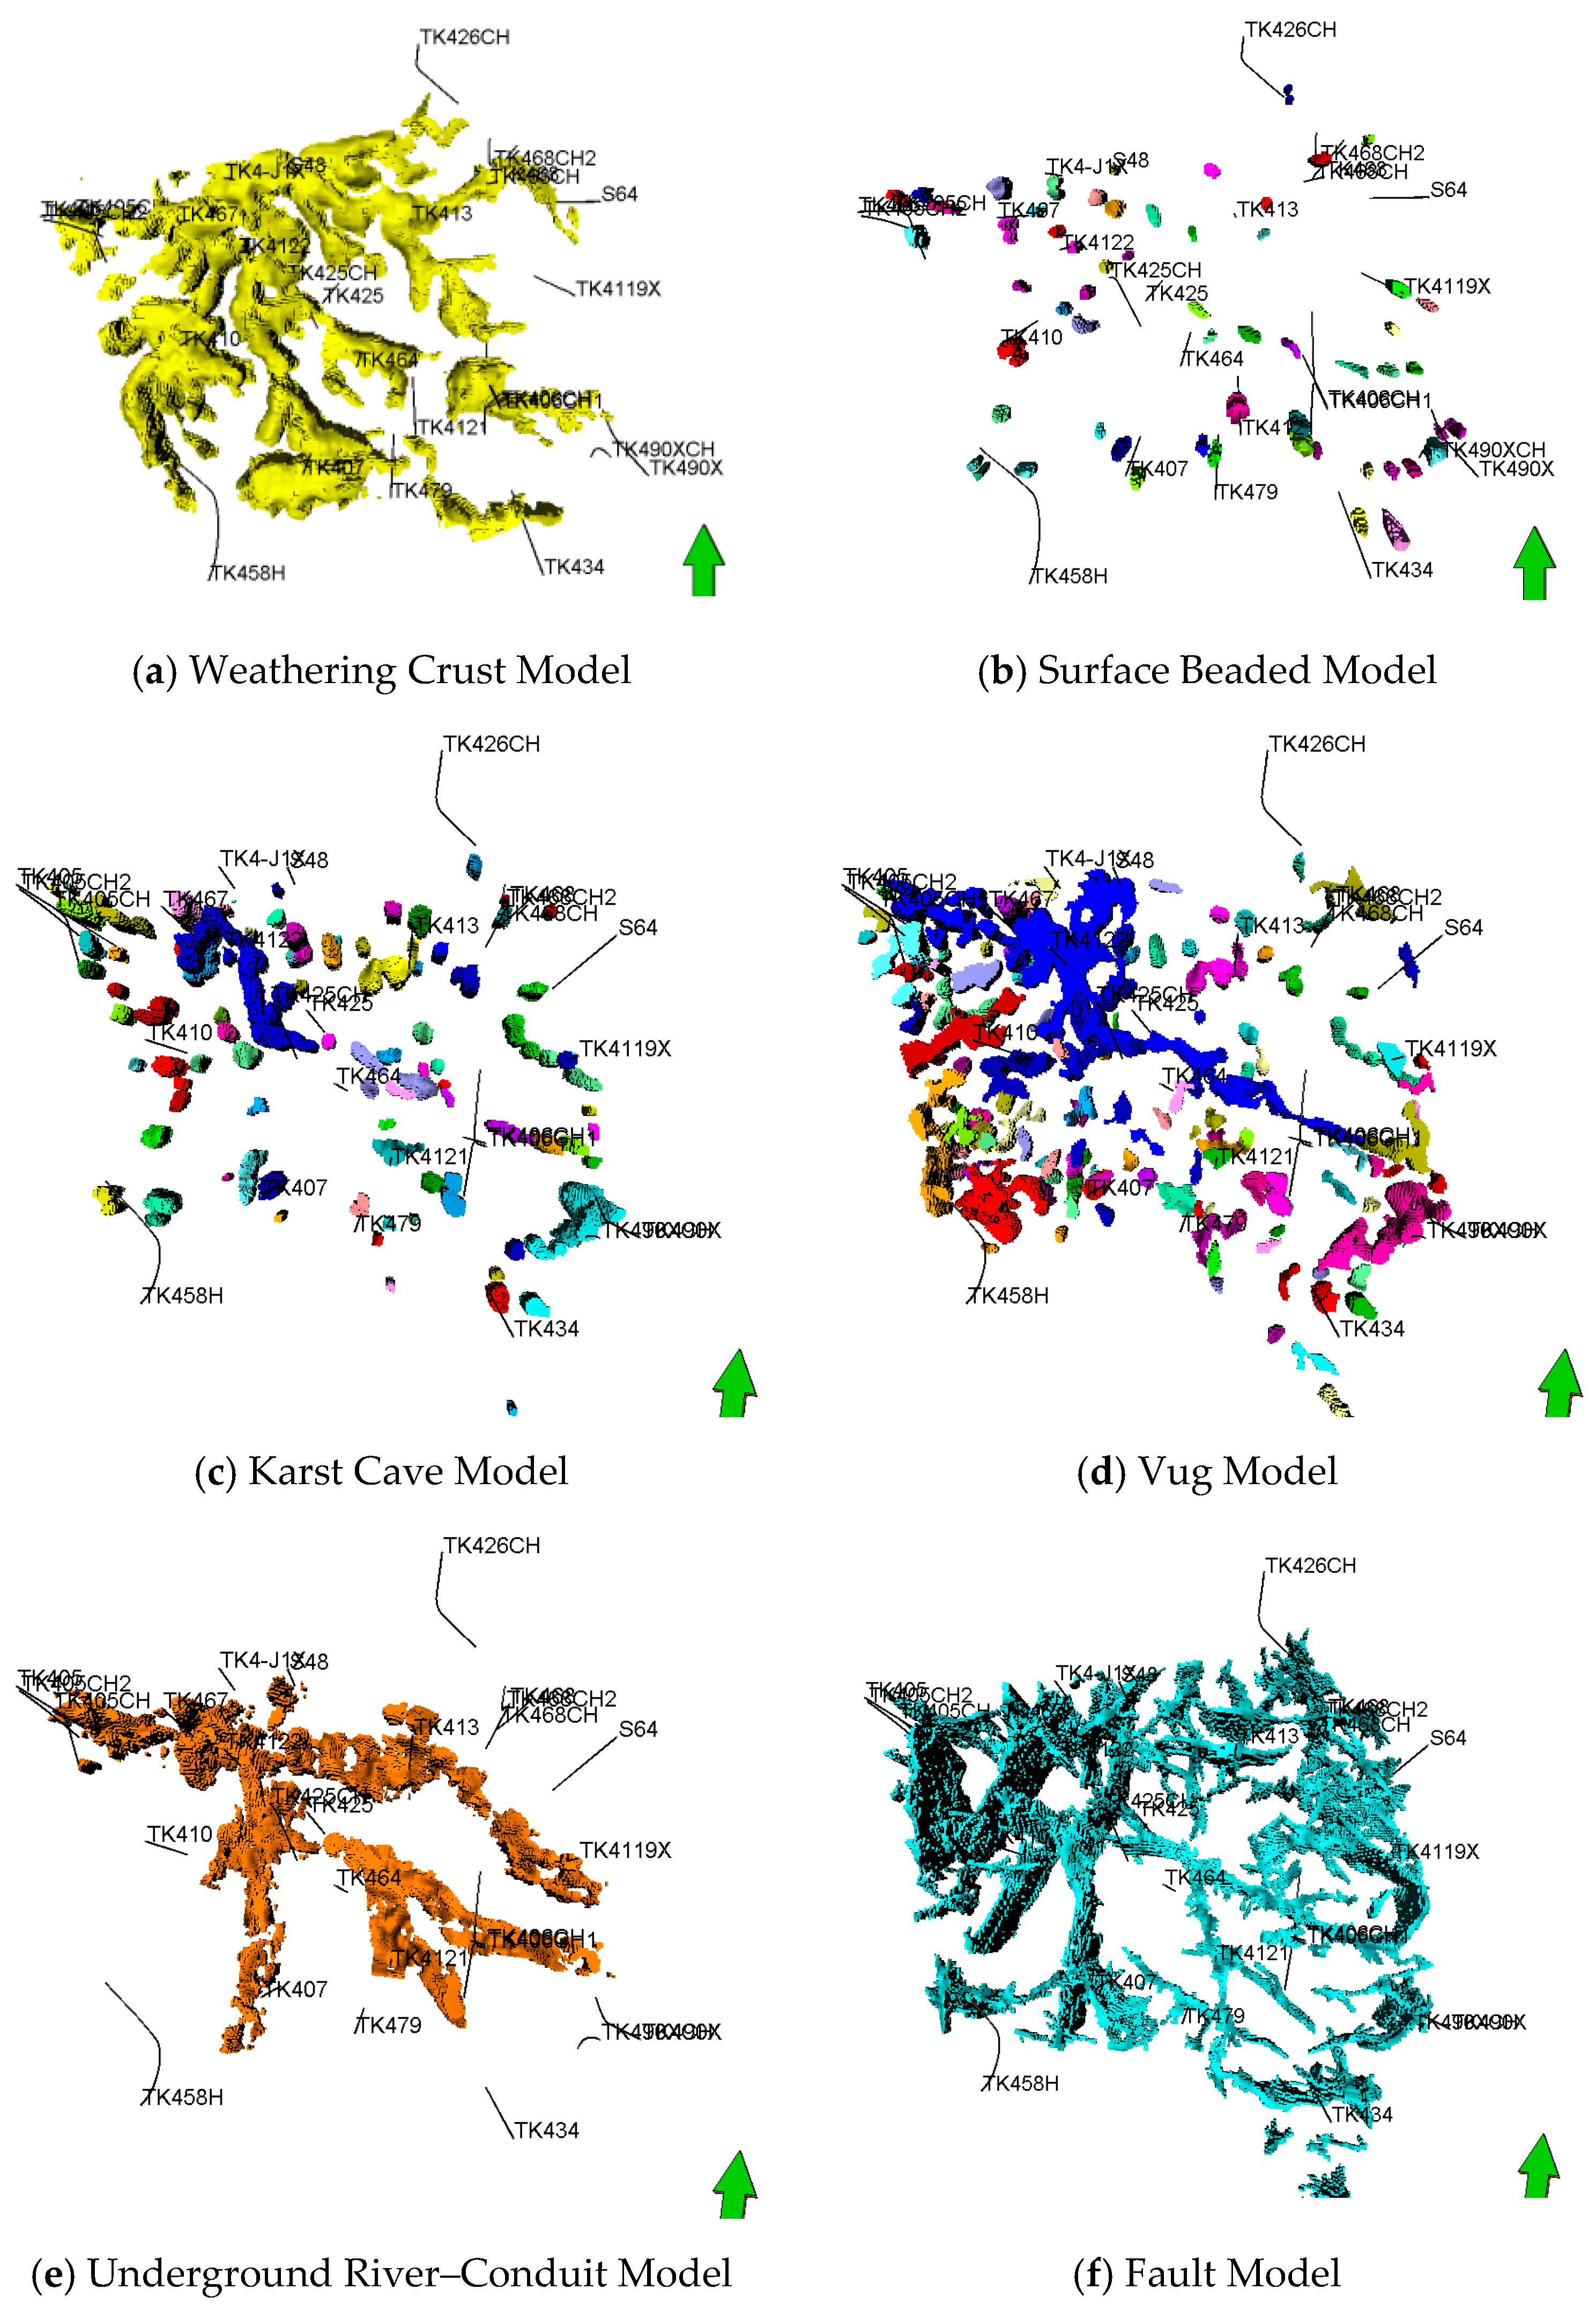
21]. Structural and paleogeomorphic models were used as large-scale constraints. Large caves and main conduits with clear seismic responses were represented deterministically; fractures were first generated as a discrete fracture network and then upscaled into equivalent permeability tensors and transmissibility multipliers; smaller vugs were represented by object-based modeling; and underground-river conduits were reproduced by multipoint geostatistics. To avoid implying perfect compatibility among these approaches, all geobodies were transferred into the simulation grid through a scale-reconciliation step: (i) seismic-scale caves and conduits were preserved as connected high-storage/high-transmissibility cells; (ii) DFN properties were upscaled by length-, aperture-, and orientation-weighted transmissibility; (iii) small vugs below the grid resolution were converted into effective porosity increments; and (iv) non-contributing anomalies were removed using porosity, volume, and dynamic-response filters. The base flow model was therefore an effective single-continuum model with explicit high-conductivity fracture–vug pathways rather than a fully resolved pore-scale or dual-permeability model. Combined with PVT properties and oil saturation, the static geological reserves of the S48 unit were estimated at approximately 9.40 million tons.
Figure 2 shows the 3D geological models of different reservoir body types.
3.2. Dynamic Reserve Evaluation Methods
Dynamic reserve evaluation aims to infer the actually controlled and recoverable oil volume under current development conditions using production data. Considering the highly heterogeneous storage architecture and the coupled cave–fracture flow behavior in the target reservoir, two classical methods were adaptively modified in this study [
22,
23,
24,
25,
26].
3.2.1. Modified Unit-Based Material-Balance Method
The conventional material-balance method assumes that the control volume is hydraulically continuous and that the water-related energy can be included in a single effective compressibility term. This assumption is weak in fracture–vuggy reservoirs, where a producing well may initially drain only one connected cave–fracture subsystem and then suddenly communicate with a connected water body or an injected-water channel. In this study, the control volume was therefore downscaled to a single-well fracture–vug unit or a dynamically connected subsystem. The revised formulation follows the dual-porosity concept that storage and transmissibility may reside in different continua [
27,
28,
29], but it treats caves and conduits as field-scale connected volumes rather than as ideal matrix blocks.
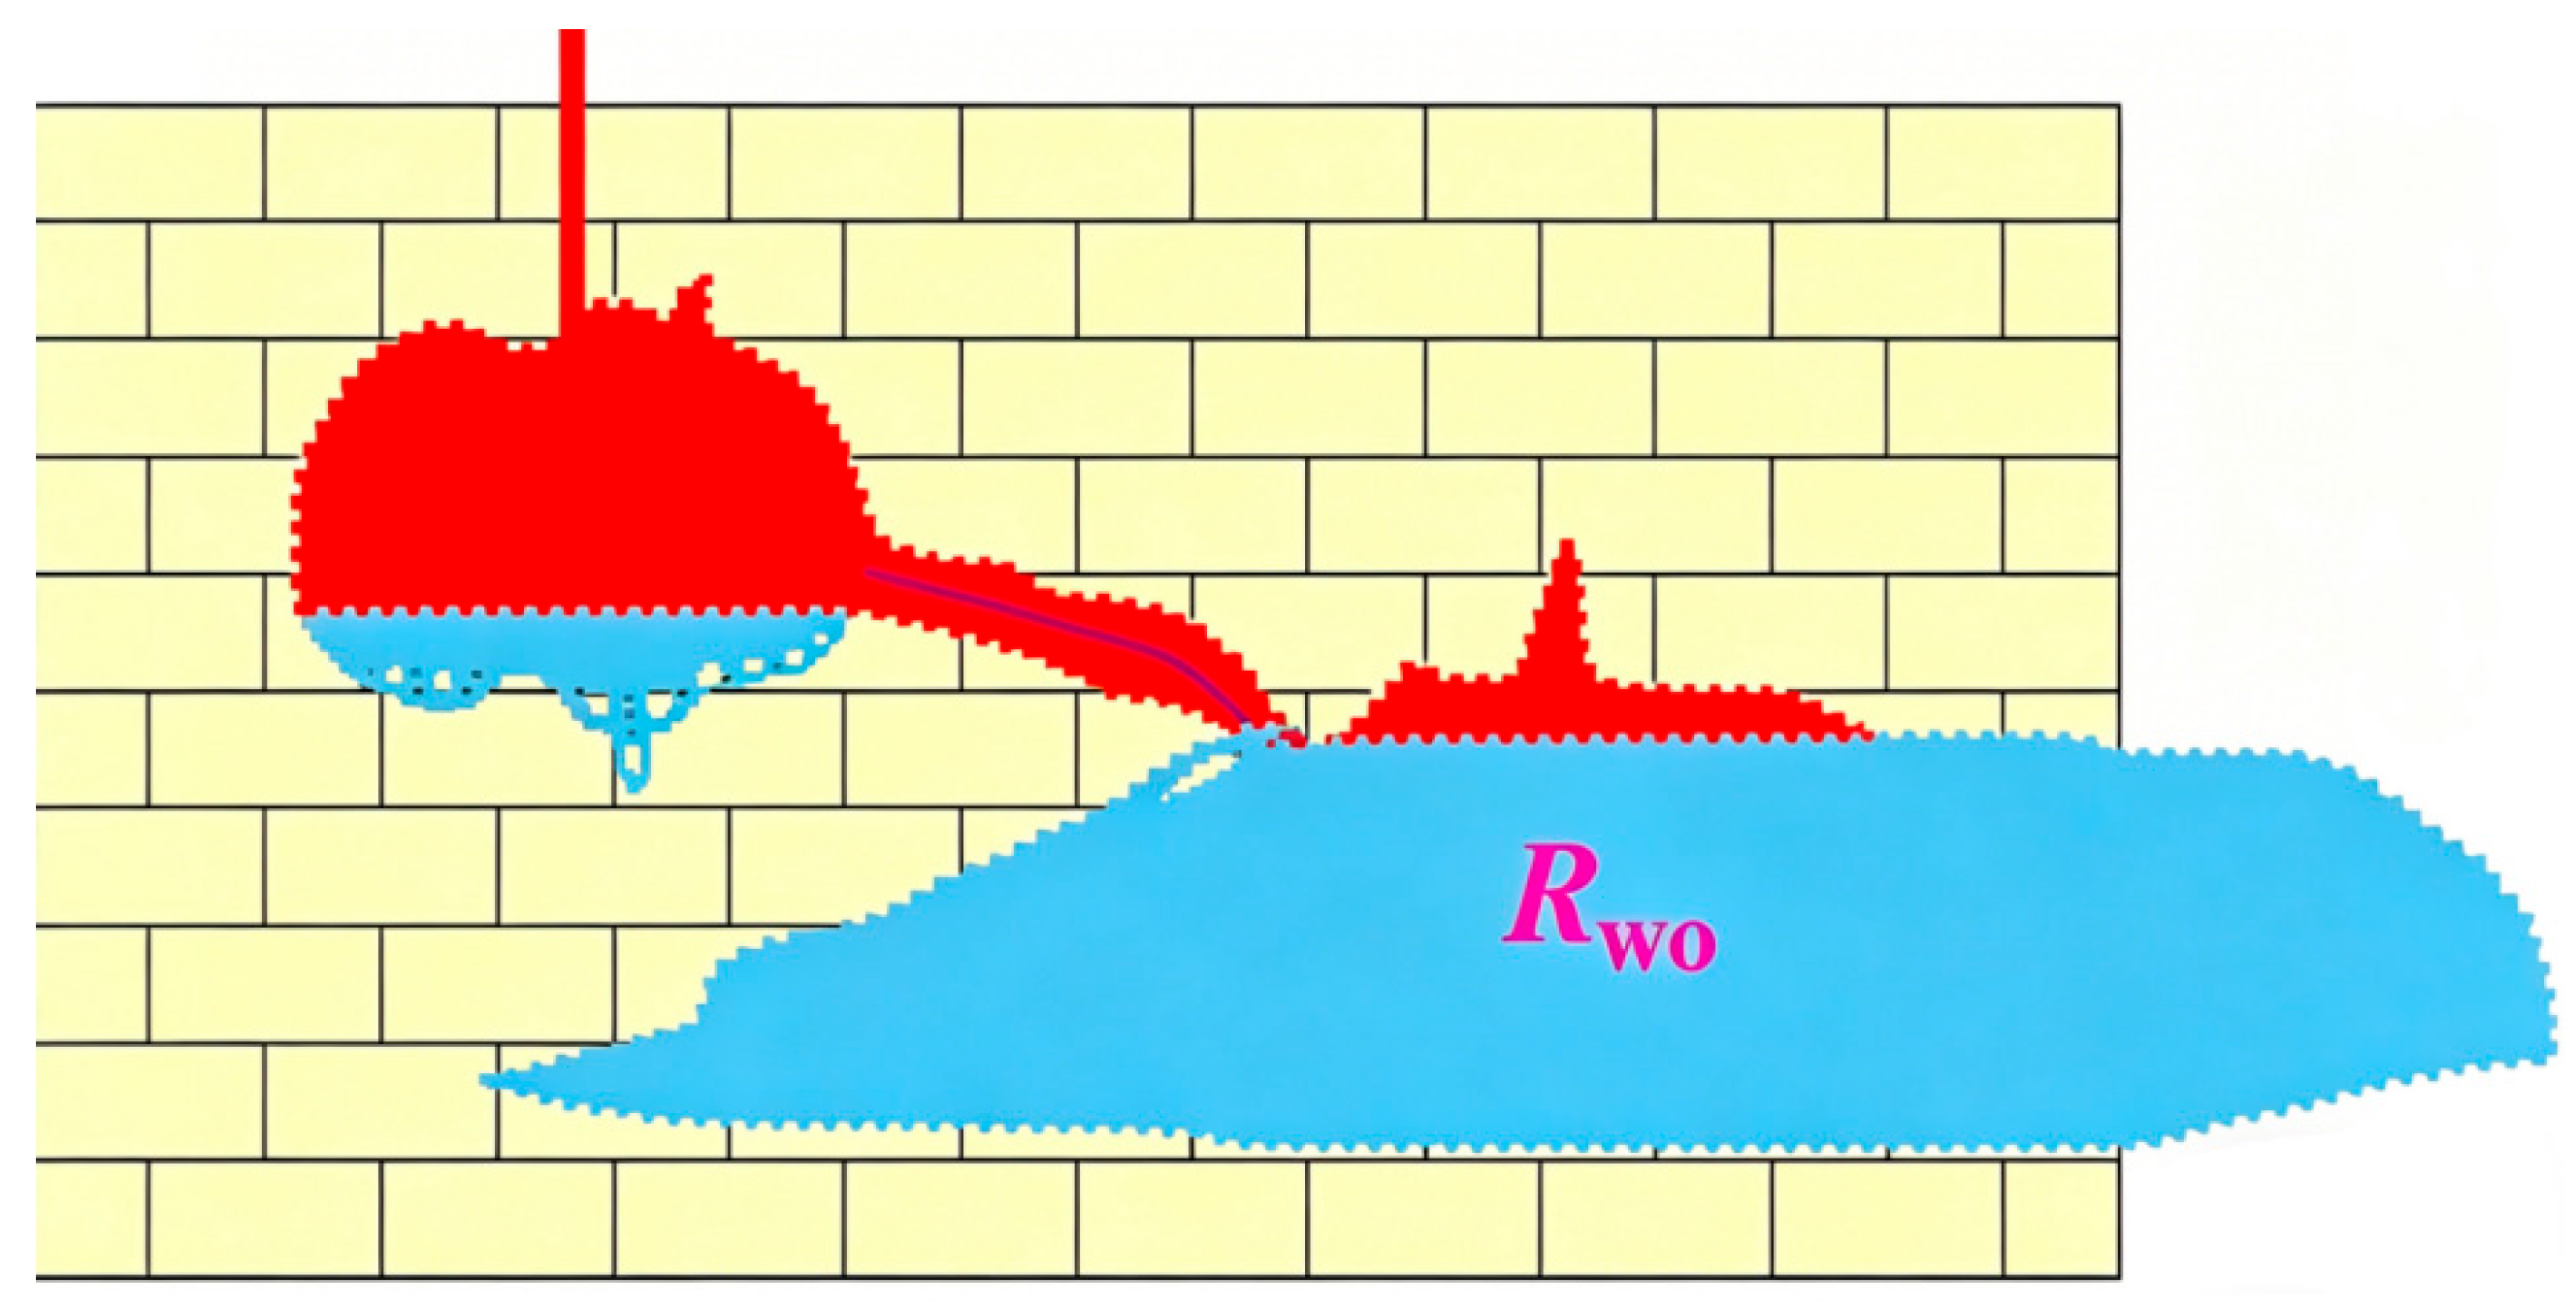
Figure 3 is the schematic diagram of oil-water distribution in fracture-vuggy carbonate reservoirs.
Specifically, production at reservoir conditions is balanced by four pressure-dependent terms: oil expansion, pore-volume compression, connate-water expansion, and expansion of the connected or injected water body. Let Delta p = pi − p, Voi = N Boi, Vp = Voi/(1 − Swc), Vwc = Swc Vp, and Vw = Rwo Voi. Here, Rwo is defined as the ratio of connected/injected water volume to the initial oil volume in the dynamically connected fracture–vug unit. A value close to zero represents an isolated cave- or fracture-dominated unit, whereas a large value indicates strong hydraulic communication with bottom water, edge water, or injected water.
The cumulative produced oil volume at reservoir conditions can then be written as
where the unit-scale expansion coefficient is
The corresponding dynamic geological reserve is obtained as
In these equations,
N is the dynamic geological reserve of the connected unit;
Np is cumulative oil production;
Bo and
Boi are current and initial oil formation volume factors;
Co,
Cp, and
Cw are oil, pore-volume, and water compressibilities, respectively;
Swc is connate-water saturation; and Delta p is pressure depletion. The parameter
Rwo is calibrated jointly with
N by constrained least-squares fitting of pressure-production points. The fitted
N is restricted by the static geological reserve of the corresponding fracture–vug body, while
Rwo is checked against water breakthrough timing, injection response, and adjacent-well pressure interference. For validation, the fitting period was separated from the later prediction period; the accepted solution must reproduce the held-out pressure trend and cumulative oil/water production within the engineering tolerance defined in
Section 3.4.
This modified material balance is most reliable during early natural depletion or before severe multi-path water channeling. After large-scale water injection, the fitted Rwo should be interpreted as an equivalent connected-water coefficient rather than as a unique physical aquifer volume.
3.2.2. Adaptive Waterflood Characteristic-Curve Method
Waterflood characteristic curves are commonly used to estimate dynamic and recoverable reserves in waterflooded reservoirs. Their direct use in fracture–vuggy reservoirs is problematic because the apparent slope of a cumulative water-production/cumulative oil-production curve may reflect conduit breakthrough, intermittent cave connection, and operational changes rather than a uniform displacement front.
To reduce this bias, the production history was first divided into quasi-stable segments using three rules: (i) no major shut-in or stimulation event within the segment; (ii) monotonic or weakly fluctuating water-cut increase; and (iii) linear semi-log behavior with R2 >= 0.80. For each segment, the semi-log relationship ln(Wp) = A1 + B1 Np was fitted, where B1 is the apparent waterflood slope. A heterogeneity coefficient M was then introduced to correct the reserve estimate for non-uniform sweep and preferential connectivity. In physical terms, M is an equivalent multiplier that links the apparent swept volume inferred from the waterflood curve to the larger static volume that may be successively connected through fracture–vug pathways.
The adapted cumulative water-production/cumulative oil-production relation was retained in the conventional semi-log form so that the proposed method remains comparable with the baseline waterflood characteristic curve:
The commonly used waterflood indicator curve is written as follows:
where
Wp is cumulative water production, 10
4 t;
Np is cumulative oil production, 104 t;
A1 and B1 are empirical constants.
After differentiation, the water–oil ratio (
WOR) can be introduced into the formulation.
By further introducing geological reserves
N and recovery degree
R, the curve can be transformed into a form suitable for reserve estimation.
A new parameter
M is then defined to characterize the heterogeneity of sweep and the effective interwell connectivity in the fracture–vuggy system.
Parameter
B1 is dynamically fitted using production data from each development segment.
The Tahe calibration data set contained approximately 150 wells or well segments. Samples were retained only if the segment duration exceeded 18 months, cumulative production was non-zero and continuous, the dominant drive stage was identifiable, and abnormal workover periods were excluded. The resulting empirical distribution of M ranged from 2.3 to 9.2, with a median near the middle of the range; the S48 values fall within the interquartile interval because its waterflood response is controlled by channelized but not completely disconnected fracture–vug systems. For a target unit, the final M is selected by segmented fitting and then checked against pressure response, injection allocation, and the mapped connectivity of the geological model.
The method is applicable to wells or units that have entered a relatively stable waterflood stage. It should not be used as a single deterministic estimator when water breakthrough is abrupt, when several disconnected reservoirs contribute sequentially, or when water production is dominated by operational changes; in such cases, the segmented waterflood interpretation must be cross-checked by material balance and simulation results.
3.3. Integrated Dynamic–Static Updating Workflow
The proposed workflow is a closed-loop process of static constraint, dynamic diagnosis, simulation calibration, and reserve updating. The static model provides the initial spatial framework and static geological reserves. The material-balance and waterflood-curve methods provide independent dynamic reserve estimates for different development stages. The numerical model is then adjusted only within geologically plausible ranges. Permeability and transmissibility multipliers are modified along mapped fractures, conduits, and fault-related pathways; isolated vug bodies are activated only when supported by pressure interference, injection response, or production evidence. The update is performed after each major development stage and also after major operational changes such as water-injection conversion, gas-injection initiation, or sustained water breakthrough. Iteration stops when (i) reserve estimates from static, material-balance, waterflood, and simulation methods are mutually consistent within the uncertainty interval; (ii) pressure and cumulative-production mismatches satisfy the criteria in
Table 1; and (iii) no geologically unreasonable connectivity adjustment is required.
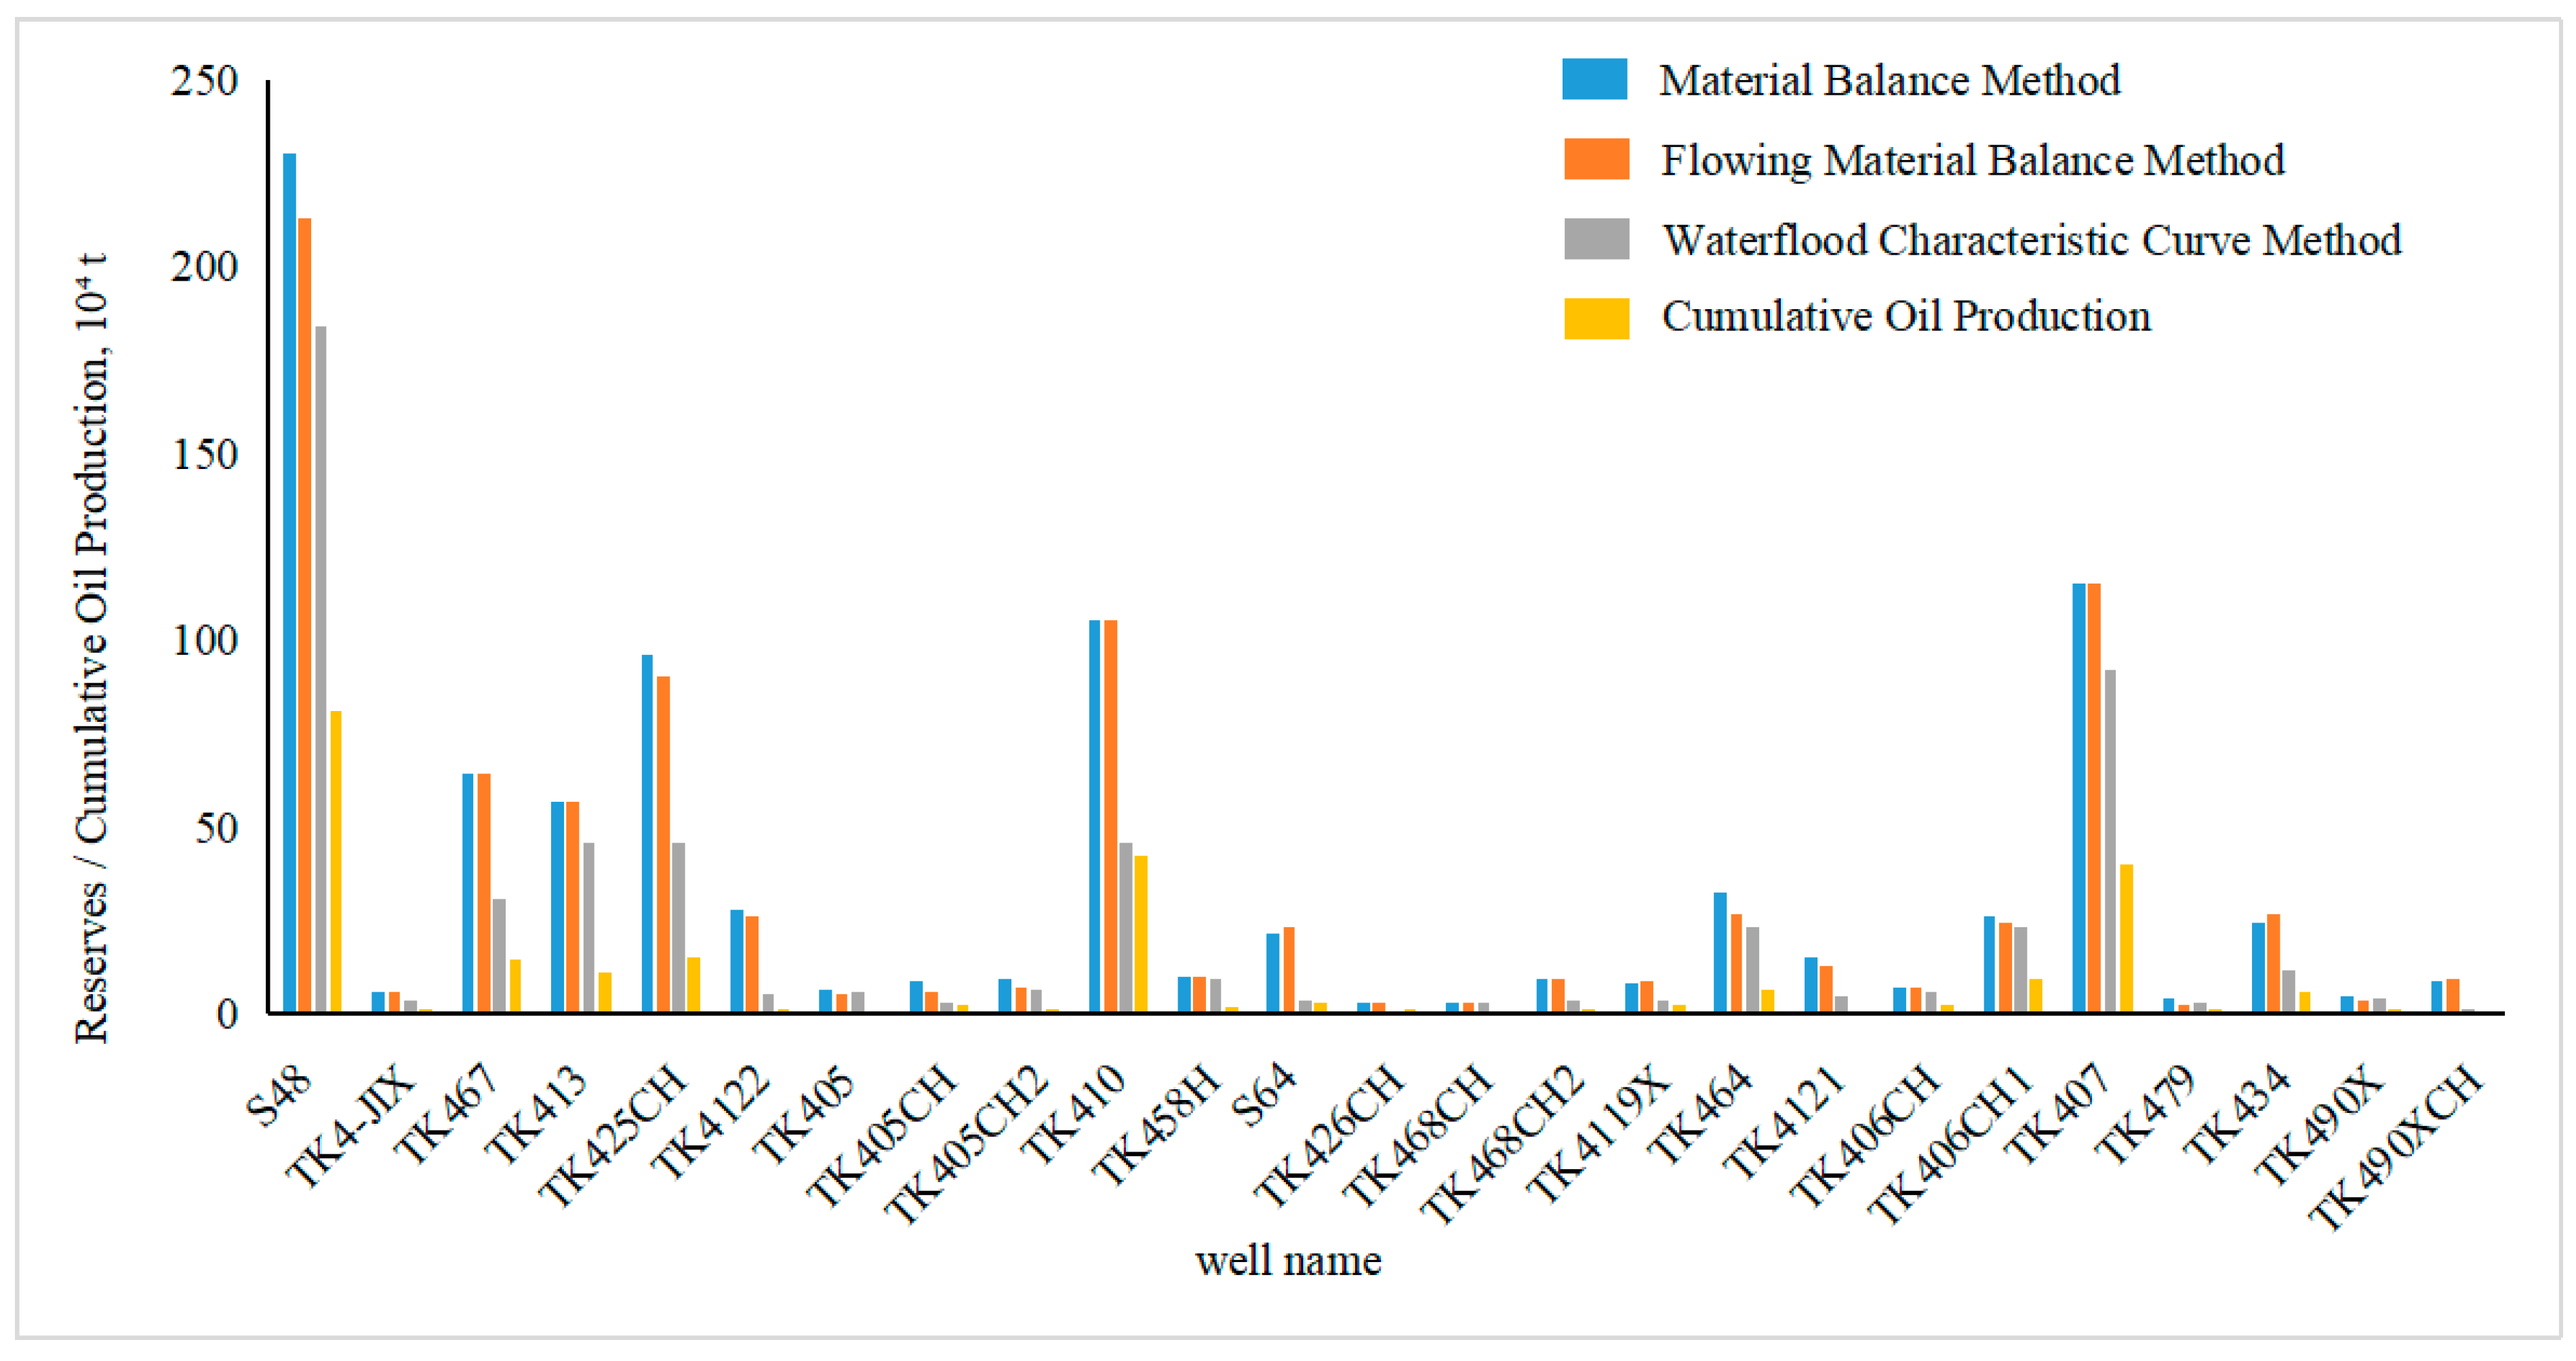
Figure 4 compares the results of single-well reserve calculation by different methods.
3.4. Numerical Simulation Model and Calibration Protocol
The simulation model was built from the static geological model and used as a dynamic consistency check rather than as the sole reserve estimator. The grid architecture followed the structural framework of the S48 unit, with local refinement around producing wells, injection wells, mapped caves, and major conduit-fault intersections. Fractures from the DFN model were upscaled into equivalent directional permeability and transmissibility multipliers. Caves and main conduits were represented by high-porosity/high-permeability cells constrained by seismic and logging interpretation, whereas small vugs below grid resolution were represented through effective porosity and storage multipliers. The base model used an effective single-continuum formulation for field-scale history matching; dual-porosity theory was used as conceptual support for storage-flow separation, but was not imposed as a full dual-permeability simulation model.
History matching proceeded in three steps. First, pressure and cumulative oil production were matched by adjusting connected volume and pore-volume compressibility within measured ranges. Second, water breakthrough timing and cumulative water production were matched by adjusting transmissibility along mapped channels and faults. Third, gas-injection response was checked by gas–oil mobility, gravity override tendency, and structural high-position sweep. The main acceptance indicators were average pressure RMSE, cumulative oil mismatch, cumulative water mismatch, and blind-period prediction error. The final model was accepted only when the dynamic match could be obtained without creating pathways that contradicted the geological model.
3.5. Baseline Comparison, Uncertainty Analysis, and Sensitivity Screening
To avoid treating one deterministic reserve estimate as unique, the revised workflow compares the proposed corrections against classical baseline methods and evaluates parameter sensitivity. The baseline material-balance calculation omits
Rwo, whereas the baseline waterflood characteristic curve omits
M and uses a single semi-log fit. The modified methods were judged by both reserve consistency and fitting stability. For uncertainty assessment,
Rwo,
M,
B1, pressure, and connectivity multipliers were perturbed within field-supported ranges. The reported uncertainty bounds are therefore engineering confidence ranges based on parameter sensitivity and history-matching acceptance, not formal probabilistic reserves audited under a reserve-booking standard.
Table 2 compares traditional baseline methods with the improved method proposed in this paper.
Table 3 presents the sensitivity screening of key parameters for dynamic reserve calculation.
4. Results
Using the above workflow, the evolution of dynamic reserves in the S48 unit was evaluated for three development stages: natural depletion, water injection, and gas injection. The values below are reported together with sensitivity-derived ranges where possible. The validation basis includes production history, pressure measurements, injection-response data, and blind-period checks from the calibrated simulation model.
4.1. Natural Depletion Stage
During this stage, development relied mainly on natural bottom-water energy and exhibited the characteristic pattern of preferential breakthrough along dominant channels with limited overall sweep.
4.1.1. Driving Mechanism and Mobilization Pattern
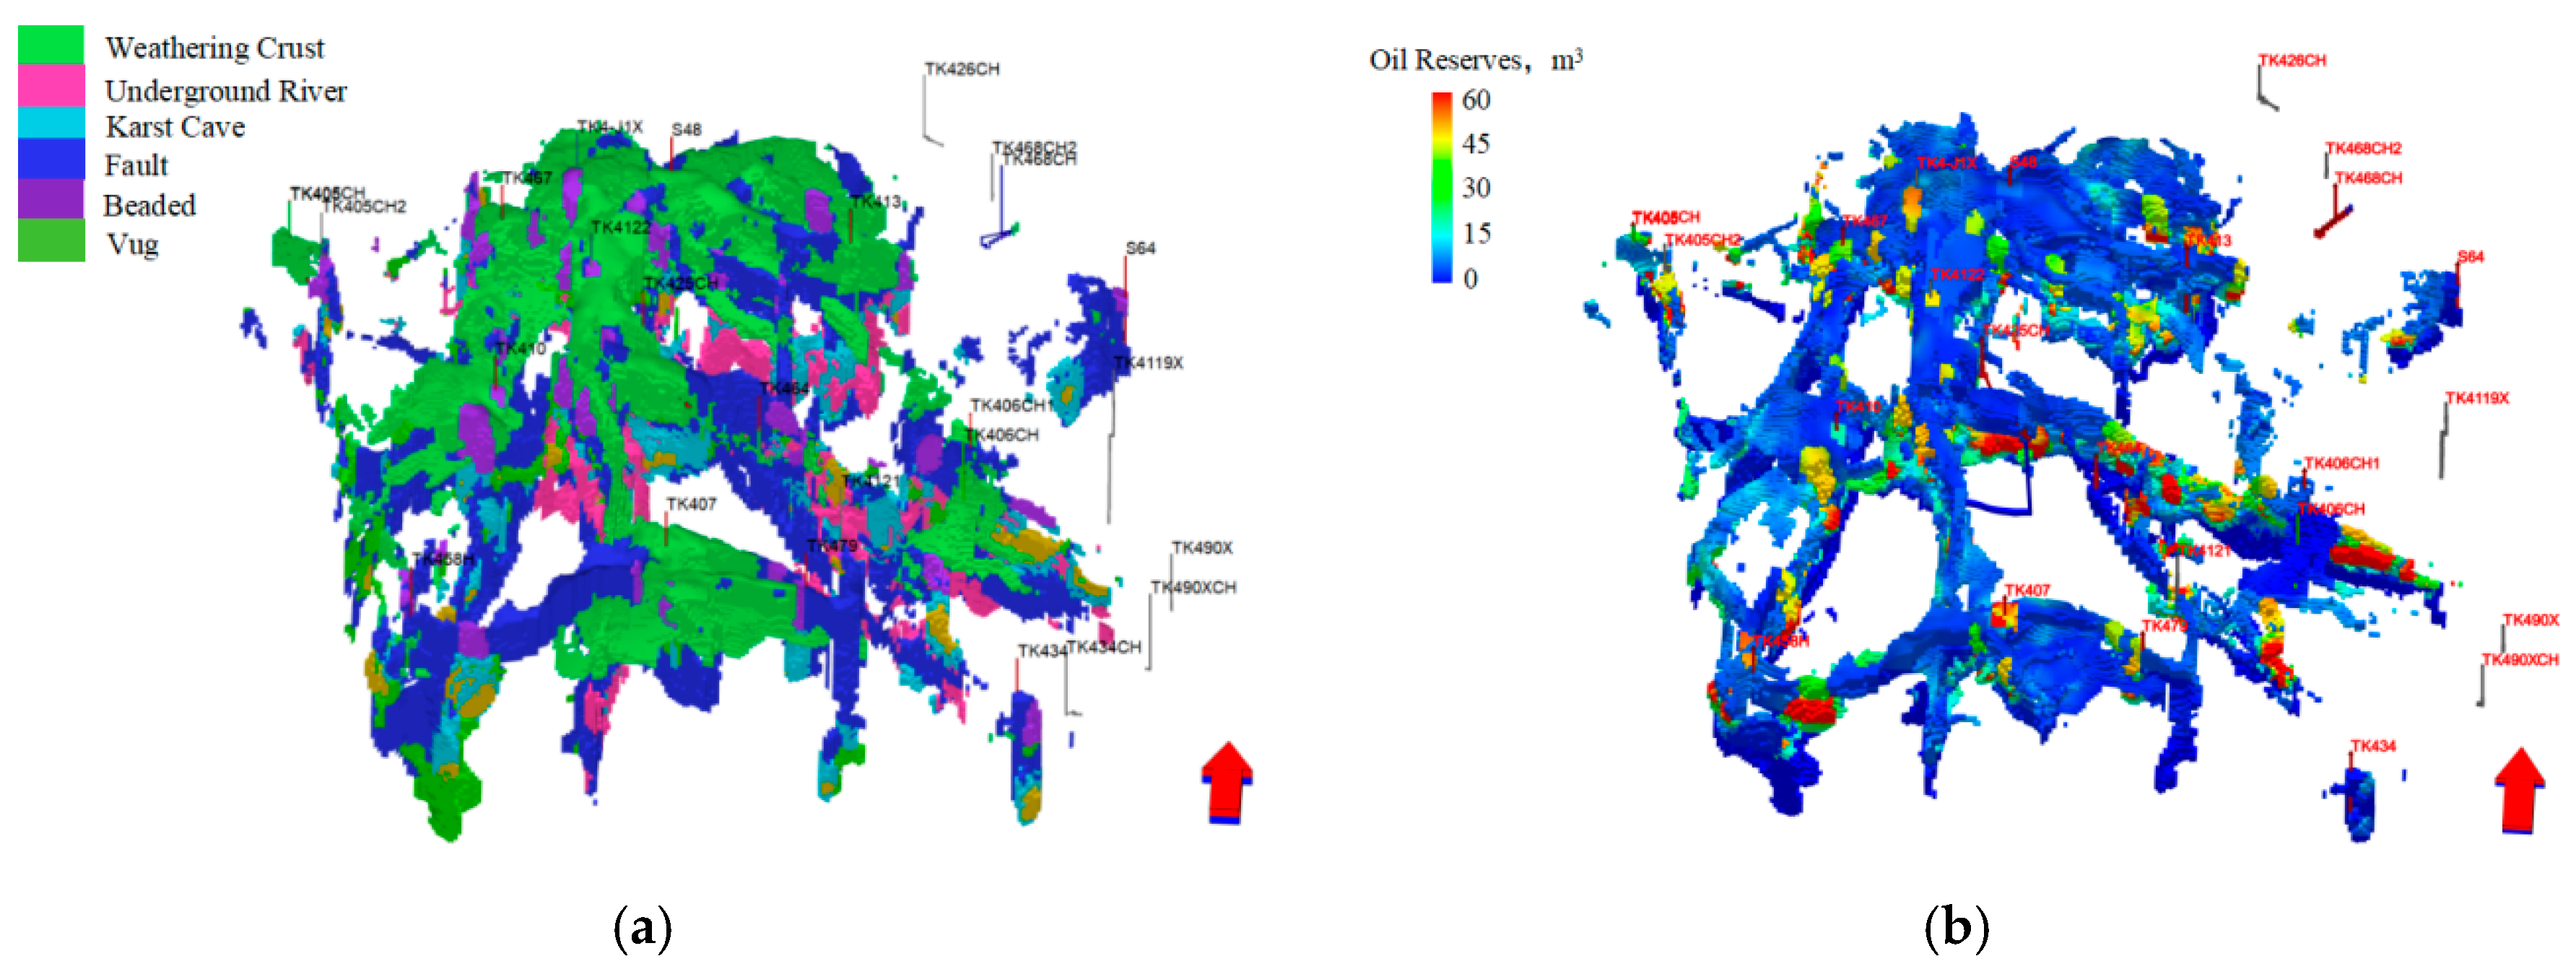
The static model indicates that medium- to deep-level cavities and fault systems are relatively well developed. Dynamic data show that bottom water primarily advanced along a few high-conductivity pathways, such as the TK425CH-TK467 and TK413 well areas, forming a localized strong water drive but only a limited swept region.
4.1.2. Quantitative Evaluation of Reserve Mobilization
Based on the modified material-balance analysis and production data, the end-of-stage mobilization was quantitatively divided into medium-high and low/undeveloped zones. Medium-high mobilization zones are mainly distributed within the swept range of dominant water-drive channels, including the TK425CH, TK467, and S48 well areas. The static geological reserves of this region are approximately 4.7312 × 10⁶ m3, with an uncertainty range of about +/−0.42 × 106 m3 under the tested Rwo and pressure ranges. The reserve utilization degree is 48.77% +/−4.8 percentage points, the cumulative oil production is 1.1923 × 10⁶ m3, and the recovery degree is 25.20%.
In contrast, low or undeveloped zones are located outside the dominant channels or are isolated by relatively tight barriers. Their reserve scale is about 4.6151 × 10
6 m
3, whereas the stage oil production is only 2.293 × 10
5 m
3 and the recovery degree is 4.79%. These results indicate that natural depletion alone can mobilize only a limited portion of reserves. The integrated analysis further suggests that fractures and faults control the dominant water-drive paths, whereas the deeper cave system provides the main production contribution at this stage.
Figure 5 shows the reserve distribution characteristics during the natural depletion stage.
4.2. Water Injection Stage
After artificial water injection was introduced to replenish formation energy, the swept region expanded significantly; however, reserve mobilization was still constrained by the main fracture–vug pathways.
4.2.1. Driving Mechanism and Flow Pathways
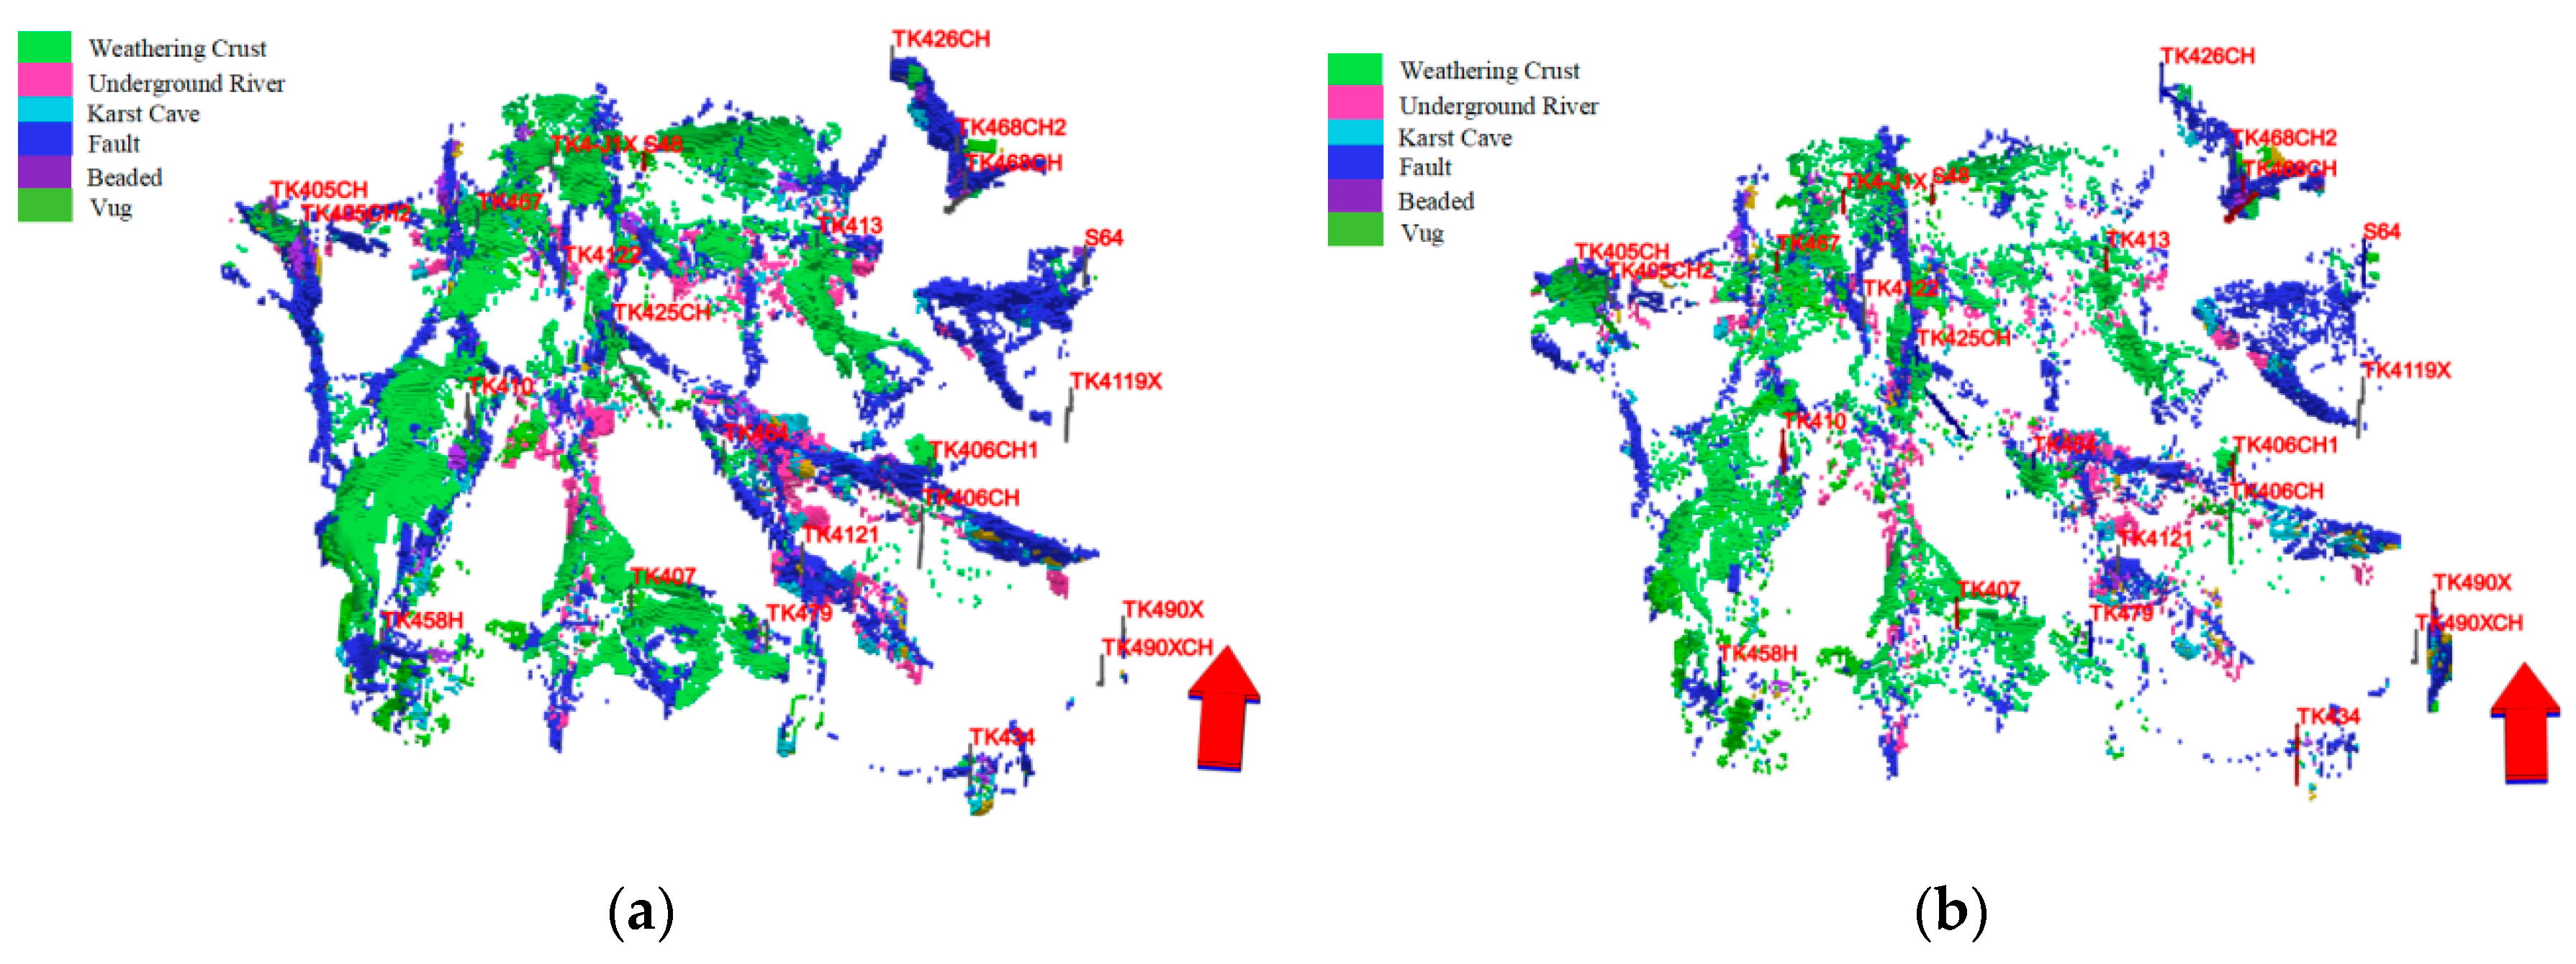
Water injection reshaped the subsurface flow field. Dynamic surveillance data, including injection profiles, pressure response, and fluid-geochemistry indications, together with history-matched simulation results, show that injected water did not diffuse uniformly throughout the unit. Instead, it preferentially migrated along the central fault network and underground-river conduit system with higher transmissibility, forming new dominant oil–water flow channels and connecting previously isolated or weakly mobilized fracture–vug bodies. The spatial correlation between newly mobilized zones and mapped high-transmissibility elements was quantified by overlap ratio and rank correlation: most added medium-high mobilized cells fall within or immediately adjacent to interpreted channels/faults, supporting the interpretation that waterflood reserve growth is connectivity-driven rather than areally uniform.
4.2.2. Quantitative Evaluation of Reserve Mobilization
Comparison of the mid- and late-waterflood models shows that 1.1652 × 10
6 m
3 of additional medium-high mobilized reserves were activated during water injection. Sensitivity analysis gives an approximate uncertainty of +/−0.12 × 10
6 m
3 for this incremental volume. These reserves mainly originated from fracture–vug bodies adjacent to dominant channels and from isolated caves that became newly connected. Oil production from the newly mobilized zones reached 2.010 × 10
5 m
3 during this stage. By the end of water injection, the medium-high mobilized reserves of the whole unit increased to 5.8969 × 10
6 m
3 and cumulative oil production reached 1.8177 × 10
6 m
3, corresponding to an overall recovery degree of 30.82%.
Figure 6 shows the distribution of newly mobilized reservoir bodies during artificial water flooding stage.
4.3. Gas-Injection Stage
To target attic oil and bypassed oil remaining after waterflooding, gas injection was implemented to exploit gas override and diffusion effects, thereby mobilizing residual oil in structurally high positions that had not been effectively swept by water.
4.3.1. Driving Mechanism and Gas Sweep Characteristics
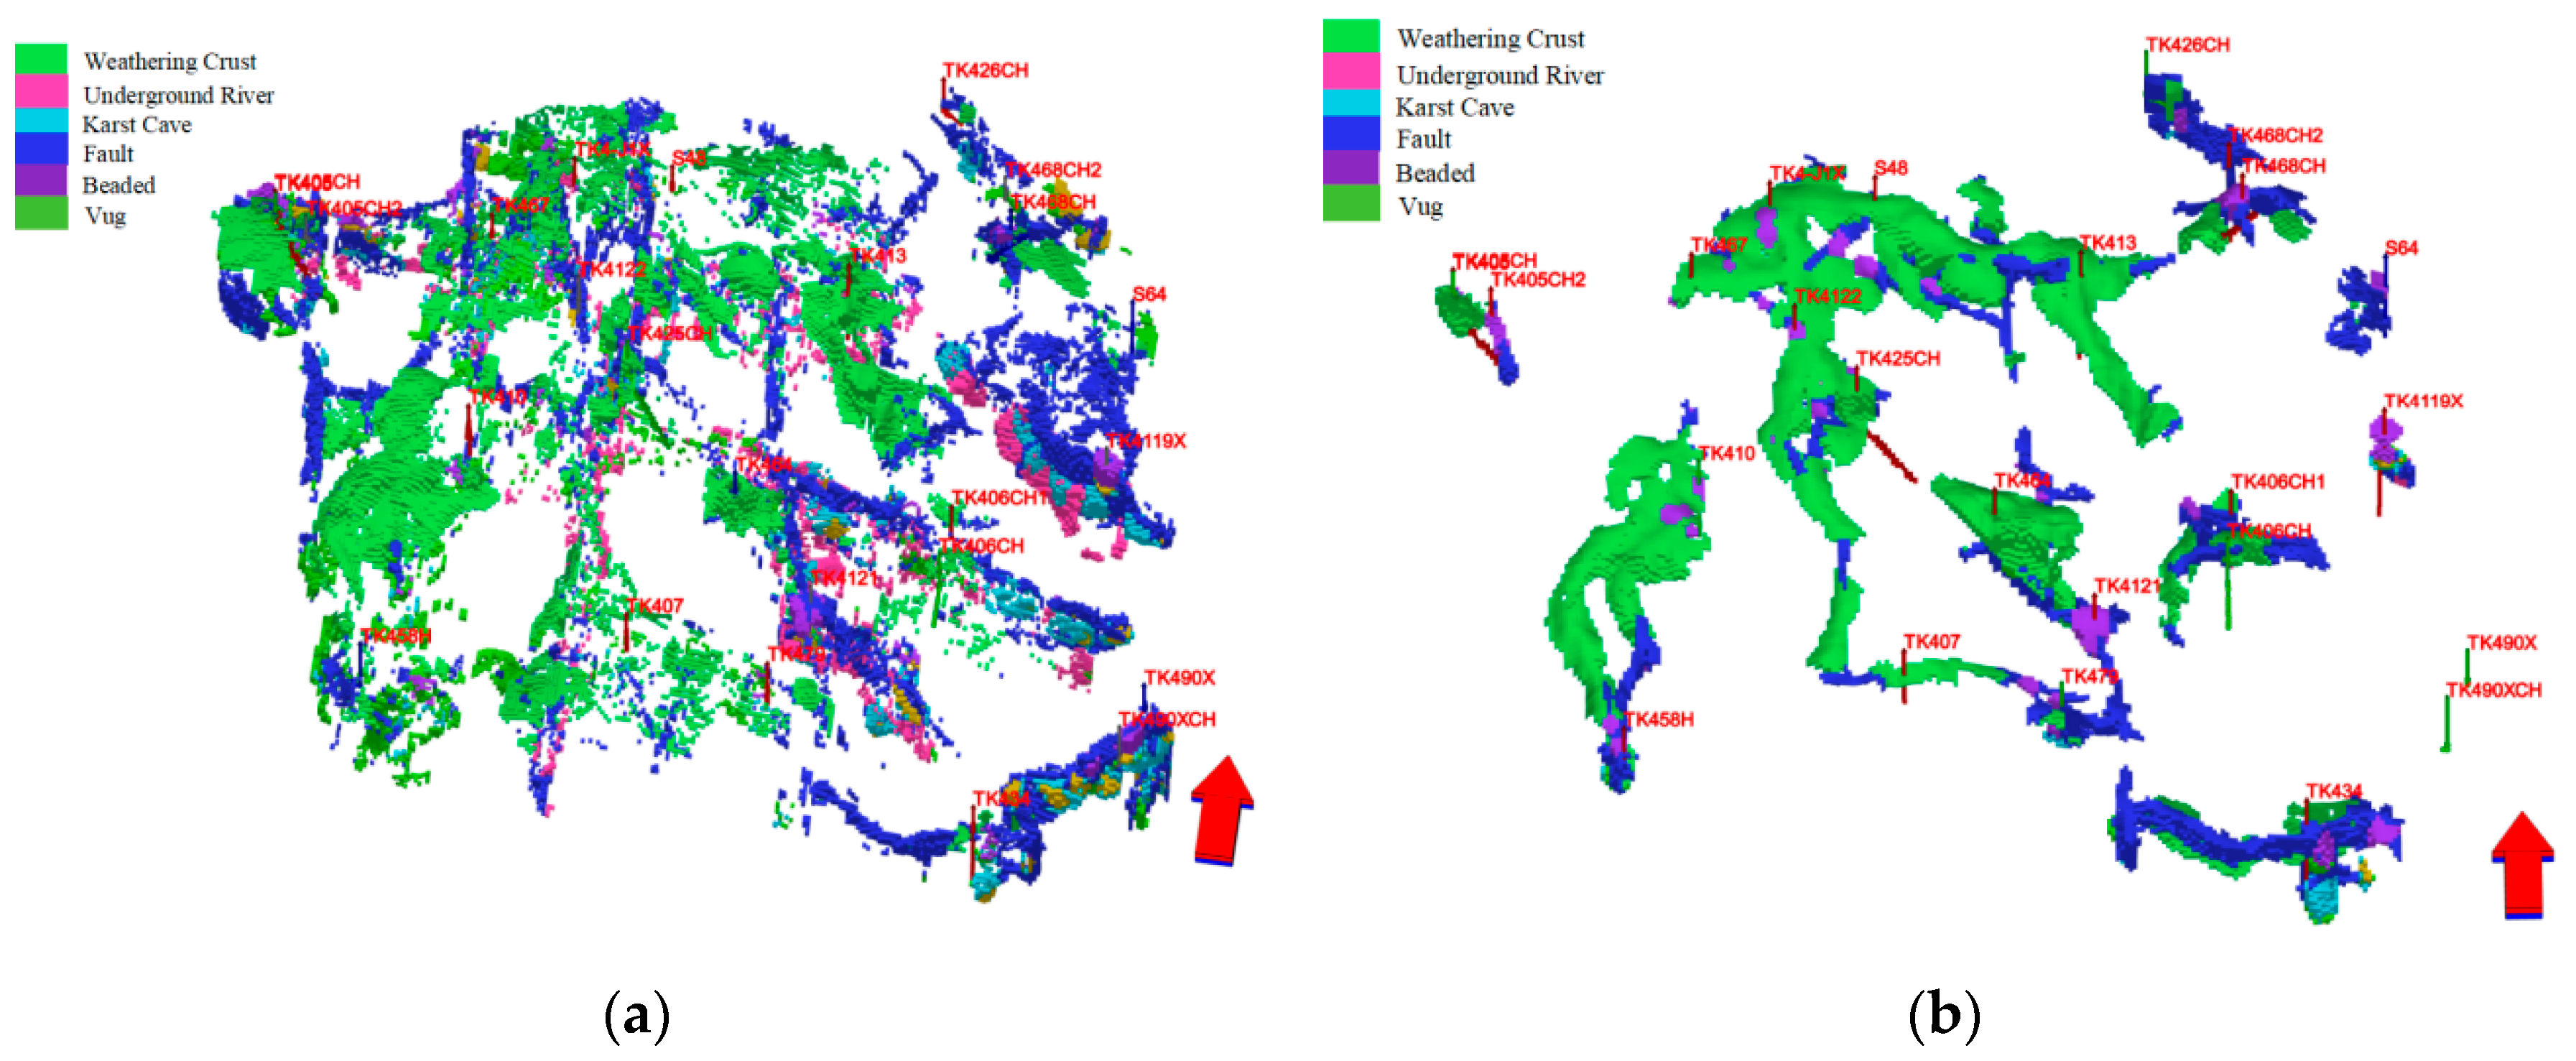
Because of its low density and relatively high mobility, injected gas tends to migrate upward and spread along structural highs in the fracture–vug system. This interpretation is supported by the gravity number, Ng = k Delta rho g H/(q mu), and the mobility ratio, Mmob = (krg/mug)/(kro/muo). In the gas-injection stage, a larger Ng and an unfavorable-to-moderate mobility ratio promote gravity override and high-position sweep; capillary entry pressure and fracture aperture then determine whether gas remains in upper caves or leaks rapidly through connected faults. Dynamic tracking and simulation results indicate a mobilization pattern distinctly different from waterflooding. In the TK458H-TK410 area and around TK425CH, gas effectively displaced remaining oil in the upper weathered crust and high fault blocks. In the S64 area, water injection and gas injection formed a synergistic system, with water mainly mobilizing the lower part and gas primarily affecting the upper part. In well TK464, gas propagated simultaneously through the weathered crust and deep fault system, resulting in a relatively wide sweep range.
4.3.2. Quantitative Evaluation of Reserve Mobilization
By the gas-injection stage, reserve mobilization reached a new level. The medium-high mobilized reserves of the whole unit increased to 7.1132 × 10
6 m
3, accounting for 74.1% +/− 6.7 percentage points of the static geological reserves, and the cumulative recovery degree rose to 33.01%. In addition, gas injection effectively mobilized reserves in low-relief surface residual hills, where newly mobilized reserves reached 3.407 × 10
5 m
3 and the recovery degree reached 34.64%. Overall, gas injection complemented waterflooding by mobilizing high-position residual oil through gravity override, pressure redistribution, and diffusion/dispersion in connected fracture–vug pathways; however, this interpretation remains sensitive to gas mobility, capillary entry, and high-permeability channel continuity.
Figure 7 shows the gas injection mobilization pattern.
5. Discussion
The proposed workflow improves reserve evaluation mainly because it separates connected reserve from static pore volume. In the material-balance step, Rwo prevents connected-water energy from being hidden inside an arbitrary total-compressibility term. In the waterflood step, M prevents the slope of a channeling-dominated waterflood curve from being interpreted as if the displacement were uniform. These two corrections are complementary: Rwo is most useful during depletion and early water communication, whereas M is most useful after a stable waterflood response has developed.
The results also clarify why different development stages mobilize different reserve components. Natural depletion preferentially drains cavities and fractures already connected to bottom-water or fault-related pathways. Water injection expands the connected volume mainly along the fracture–vug trunk system, but its sweep remains limited where barriers or disconnected caves prevent pressure communication. Gas injection targets a different portion of the reserve because gravity override and gas mobility favor structurally high and attic-oil zones. These interpretations are consistent with recent static–dynamic integration and vuggy-permeability modeling studies, but the present study differs by using those dynamic responses to update reserve estimates rather than only to improve permeability or facies models.
Competing interpretations were also considered. Similar reserve estimates from static, material-balance, and simulation methods do not by themselves prove model correctness; compensating errors may exist between connected volume, transmissibility, pressure support, and water production. Therefore, the revised workflow uses baseline-method comparison, segmented fitting, hold-out production checks, and sensitivity ranges to reduce circular validation. Even so, the method remains most reliable when pressure measurements are available, operational changes are well documented, and mapped fracture–vug pathways are supported by dynamic response.
Limitations and Future Work
This study has four principal limitations. First, geological uncertainty remains significant because caves, conduits, fractures, and small vugs are constrained by data of different resolution and reliability. Second, Rwo is an equivalent dynamic parameter; it may represent bottom water, edge water, injected water, or a combination of these effects, and therefore should not be interpreted as a unique aquifer volume without additional evidence. Third, M may be biased when water production is dominated by sudden channeling, workover operations, or sequential connection of isolated reservoirs. Fourth, validation is restricted to one unit in the Tahe Oilfield, so the workflow should not be presented as universally transferable without additional field cases.
Future work should therefore focus on: (i) probabilistic uncertainty analysis of Rwo, M, B1, pressure, and connectivity multipliers; (ii) automated segmented fitting with objective detection of channeling and operational disturbances; (iii) cross-unit testing in reservoirs with different fracture–vug connectivity patterns; and (iv) independent validation using tracer, interference-test, or surveillance data that are not used in history matching.
6. Conclusions
- (1)
A unit-scale dynamic reserve-updating workflow was established for fracture–vuggy carbonate reservoirs by coupling static geological modeling, water-body-corrected material balance, heterogeneity-corrected waterflood-curve analysis, and geologically constrained numerical calibration.
- (2)
In the S48 unit, natural depletion, water injection, and gas injection mobilized different connected reserve components. Natural depletion mainly drained pre-connected dominant channels, water injection expanded mobilization along fracture–vug trunk pathways, and gas injection further swept high-position residual oil where buoyancy and structural relief were favorable.
- (3)
Within the tested sensitivity range, reserve utilization increased from 48.77% +/− 4.8 percentage points during natural depletion to 74.1% +/− 6.7 percentage points after gas injection. These values should be interpreted as case-specific dynamic reserve estimates rather than as proof of universal transferability; the workflow requires reliable static models, pressure-production data, and independent validation when applied to other fields.
Author Contributions
Conceptualization, P.Y. and J.W.; methodology, J.W., P.Y. and Z.J.; validation, J.W. and F.Y.; formal analysis, J.W. and Z.J.; investigation, J.W., Z.J. and F.Y.; resources, P.Y. and L.Z.; data curation, J.W. and Y.Z.; writing—original draft preparation, J.W.; writing—review and editing, P.Y., Z.J. and Z.L.; visualization, J.W. and Y.Z.; supervision, P.Y.; project administration, P.Y.; funding acquisition, P.Y. All authors have read and agreed to the published version of the manuscript.
Funding
This research was funded by the National Natural Science Foundation of China, grant number U24B2019.
Data Availability Statement
The data presented in this study are available on reasonable request from the corresponding author. The data are not publicly available due to field data confidentiality.
Acknowledgments
The authors thank Sinopec Northwest Oilfield Company for providing the geological and production data used in this study.
Conflicts of Interest
Author Jiale Wang, Feiyu Yuan, Liming Zhao, Ying Zhang and Zilong Liu were employed by the company Oil Production Plant No. 1, Sinopec Northwest Oilfield Company. The remaining authors declare that the research was conducted in the absence of any commercial or financial relationships that could be construed as potential conflicts of interest.
References
- Zheng, S.; Ji, B.; Gu, H.; Wang, X.; Song, K. Dynamic description technology for fractured-vuggy carbonate reservoirs based on a node-network model. Acta Pet. Sin. 2024, 45, 1422–1431. [Google Scholar]
- Jiao, F. Practice and knowledge of volumetric development of deep fractured-vuggy carbonate reservoirs in the Tarim Basin, NW China. Pet. Explor. Dev. 2019, 46, 576–582. [Google Scholar] [CrossRef] [Scilit]
- Wang, J.; Liu, H.; Ning, Z.; Zhang, H.; Hong, C. Experiments on water flooding in fracture-vug combinations in fractured-vuggy reservoirs. Pet. Explor. Dev. 2014, 41, 67–73. [Google Scholar] [CrossRef] [Scilit]
- Han, J.; Cheng, H.; Shi, Y.; Wang, L.; Song, Y.; Zhang, W. Connectivity analysis and application of fractured-vuggy carbonate reservoirs in Tazhong. Sci. Technol. Eng. 2016, 16, 120–126. [Google Scholar]
- Li, H.; Wang, C.; Niu, G.; Liang, H.; Bu, L.; Gu, J. Dynamic reserve evaluation of fractured-vuggy reservoirs with closed water bodies: A case study from the Halahatang Oilfield, Tarim Basin. Xinjiang Pet. Geol. 2020, 41, 321–325. [Google Scholar]
- Wang, D.; Li, Y.; Zhang, J.; Wei, C.; Jiao, Y.; Wang, Q. Improved CRM model for inter-well connectivity estimation and production optimization: A case study for karst reservoirs. Energies 2019, 12, 816. [Google Scholar] [CrossRef] [Scilit]
- Guo, M.; Chen, L.; Wang, G.; Qian, H. Reserve evaluation methods for fractured-vuggy carbonate reservoirs under SEC criteria and their application. Pet. Reserv. Eval. Dev. 2020, 10, 11–17. [Google Scholar]
- Hu, X.; Yuan, X.; Hou, J.; Quan, L. Modeling method of carbonate fractured-vuggy reservoirs using multiscale karst facies control. Acta Pet. Sin. 2014, 35, 340–346. [Google Scholar]
- Li, Y.; Hou, J.; Li, Y. Features and hierarchical modeling of carbonate fracture-cavity reservoirs. Pet. Explor. Dev. 2016, 43, 600–606. [Google Scholar] [CrossRef] [Scilit]
- Zhang, D.; Jiang, W.; Kang, Z.; Hu, A.; Wang, R. Automatic evaluation of an interwell-connected pattern for fractured-vuggy reservoirs based on static and dynamic analysis. Energies 2023, 16, 569. [Google Scholar] [CrossRef] [Scilit]
- Popov, P.; Efendiev, Y.; Qin, G. Multiscale modeling and simulation of flows in naturally fractured karst reservoirs. Commun. Comput. Phys. 2009, 6, 1123–1147. [Google Scholar] [CrossRef] [Scilit]
- Zhang, Y.; Lin, C.; Ren, L.; Sun, C.; Li, J.; Wang, Z.; Xu, G. Study on connectivity of fractured-vuggy marine carbonate reservoirs based on dynamic and static methods. J. Mar. Sci. Eng. 2025, 13, 435. [Google Scholar] [CrossRef] [Scilit]
- Gavidia, J.C.R.; Chinelatto, G.F.; Basso, M.; da Ponte Souza, J.P.; Soltanmohammadi, R.; Vidal, A.C.; Goldstein, R.H.; Mohammadizadeh, S. Utilizing integrated artificial intelligence for characterizing mineralogy and facies in a pre-salt carbonate reservoir, Santos Basin, Brazil, using cores, wireline logs, and multi-mineral petrophysical evaluation. Geoenergy Sci. Eng. 2023, 231, 212303. [Google Scholar] [CrossRef] [Scilit]
- Gavidia, J.C.R.; Mohammadizadeh, S.; Chinelatto, G.F.; Basso, M.; da Ponte Souza, J.P.; Dominguez Portillo, L.E.; Eltom, H.A.; Vidal, A.C.; Goldstein, R.H. Bridging the gap: Integrating static and dynamic data for improved permeability modeling and super-K zone detection in vuggy reservoirs. Geoenergy Sci. Eng. 2024, 241, 213152. [Google Scholar] [CrossRef] [Scilit]
- Vasconez Garcia, R.G.; Mohammadizadeh, S.; Avansi, M.C.K.; Basilici, G.; Bomfim, L.d.S.; Cunha, O.R.; Soares, M.V.T.; Mesquita, A.F.; Mahjour, S.K.; Vidal, A.C. Geological insights from porosity analysis for sustainable development of Santos Basin’s presalt carbonate reservoir. Sustainability 2024, 16, 5730. [Google Scholar] [CrossRef] [Scilit]
- Mohammadizadeh, S.M.; Moghaddam, M.A.; Talebbeydokhti, N. Analysis of flow in porous media using combined pressurized-free surface network. J. Porous Media 2021, 24, 1–15. [Google Scholar] [CrossRef] [Scilit]
- Yang, D.; He, X.; Zhang, H.; Wang, Y.; Liu, Y.; Wang, M. Intelligent identification of Ordovician epikarst zones and development laws of fractures and vugs in the main area of the Tahe Oilfield. Acta Pet. Sin. 2024, 45, 374–389. [Google Scholar]
- Deng, G.; Hu, W.; Wang, Z. Quantitative multiscale characterization of fractured-vuggy carbonate reservoirs. Xinjiang Pet. Geol. 2021, 42, 232–237. [Google Scholar]
- Shang, H.; Chen, S.; He, Y.; Wang, L.; Yin, Y.; Xie, P. Structural characterization and 3D geological modeling of fault-controlled fracture-cavity carbonate reservoirs: A case study of the Shunbei No. 4 fault zone. Acta Pet. Sin. 2024, 45, 1662–1679. [Google Scholar]
- Li, T.; Yue, P.; Wang, J.; Zhang, W.; Liang, H.; Li, M.; Zhao, L.; Huang, N. Integrated geological modeling and numerical simulation based on dynamic-static coupling in fractured-vuggy reservoirs: A case study of the T436 unit, Tahe Oilfield. Sci. Technol. Eng. 2024, 24, 14195–14204. [Google Scholar]
- Deng, X.; Liu, Z.; Wang, P.; Wang, Z.; Tu, H.; Li, J.; Ding, Y. Material balance equation for fractured vuggy reservoirs with aquifer multiples: A case study of the Fuman Oilfield. Energies 2025, 18, 3550. [Google Scholar] [CrossRef] [Scilit]
- He, S.; Chen, B.; Yuan, F.; Wang, X.; Wang, T. Dynamic reserve calculation method of fractured-vuggy reservoirs based on a modified comprehensive compressibility coefficient. Processes 2024, 12, 640. [Google Scholar] [CrossRef] [Scilit]
- Zheng, L.; Zhu, B.; Zhang, Y.; Li, X.; Peng, J.; Xiao, W. Types and applicability of waterflood characteristic curves in fractured-vuggy carbonate reservoirs: A case study of the Tahe Oilfield. Pet. Reserv. Eval. Dev. 2024, 14, 899–907. [Google Scholar]
- Zheng, S.; Kang, Z.; Cheng, X.; Li, X.; Zhang, S.; Cui, S.; Jiang, L. Waterflooding characteristics and improvement strategies for fractured-vuggy carbonate reservoirs in the Tahe Oilfield. Pet. Geol. Recovery Effic. 2022, 29, 95–104. [Google Scholar]
- Pan, Y.; Liu, X.; Yang, Z.; Sun, Y.; Chen, C.; Sun, L. Study on the stabilization mechanism of gas injection interface in fractured-vuggy reservoirs. Energies 2025, 18. [Google Scholar] [CrossRef] [Scilit]
- Zhao, Q.; Zhang, J.; Ding, B.; Wang, Y. Physical simulation of gas-enhanced oil recovery in fractured-vuggy carbonate reservoirs of the Tahe Oilfield. Sci. Technol. Eng. 2017, 17, 55–62. [Google Scholar]
- Barenblatt, G.I.; Zheltov, I.P.; Kochina, I.N. Basic concepts in the theory of seepage of homogeneous liquids in fissured rocks. J. Appl. Math. Mech. 1960, 24, 1286–1303. [Google Scholar] [CrossRef] [Scilit]
- Warren, J.E.; Root, P.J. The behavior of naturally fractured reservoirs. SPE J. 1963, 3, 245–255. [Google Scholar] [CrossRef] [Scilit]
- Kazemi, H. Pressure transient analysis of naturally fractured reservoirs with uniform fracture distribution. SPE J. 1969, 9, 451–462. [Google Scholar] [CrossRef] [Scilit]
| Disclaimer/Publisher’s Note: The statements, opinions and data contained in all publications are solely those of the individual author(s) and contributor(s) and not of MDPI and/or the editor(s). MDPI and/or the editor(s) disclaim responsibility for any injury to people or property resulting from any ideas, methods, instructions or products referred to in the content. |




 ,
,