Article

Analysis of the Impact of Thermal and Electrical Energy Storage Solutions Coupled with PV and CSP Plants in Microgrids


by
Gabriella Ferruzzi
and
Raffaele Liberatore
*
ENEA, Italian National Agency for New Technologies, Energy and Sustainable Economic Development, Lungotevere Thaon di Revel 76, 00196 Rome, Italy
*
Author to whom correspondence should be addressed.
Energies 2026, 19(10), 2327; https://doi.org/10.3390/en19102327
Submission received: 20 February 2026 / Revised: 19 April 2026 / Accepted: 1 May 2026 / Published: 12 May 2026
(This article belongs to the Section A1: Smart Grids and Microgrids)

Abstract

This study analyzes the impact of thermal and electrical storage solutions coupled with Photovoltaic (PV) and Concentrating Solar Power (CSP) plants, proposing an innovative model to test a Hybrid Energy Storage System (HESS). The work presents an innovative Mixed Integer Linear Programming (MILP) model to determine the optimal configuration and operational strategy of a HESS within a grid-connected Microgrid (MG). The research focuses on the synergistic integration of PV with Lithium-ion Electrical Energy Storage (EES) and CSP with Thermal Energy Storage (TES). The MG includes dynamic residential, commercial, and hospital loads. The MILP model is optimized over a 24 h horizon across four season-representative days, utilizing a multi-criteria objective function that balances economic performance and CO2 emissions via a weighting factor ω ∈ [0, 1]. Three distinct CSP options such as Parabolic Trough Collectors with varying Heat Transfer Fluids (molten salt or thermal oil) and TES types (direct and indirect dual-tank, or Phase Change Material) are analyzed, each coupled with a Rankine or Organic Rankine Cycle. Key constraints address energy balances, component efficiencies, power limits, and storage dynamics. The comprehensive results identify the most suitable technology portfolio mix and optimal hour-by-hour operational rules, providing transparent decision-making criteria based on storage size, process temperatures, and specific demand profiles.

1. Introduction

1.1. Motivation

Global energy production for both electrical and thermal applications remains heavily reliant on carbon-intensive commodities, such as coal, methane, and petroleum [1]. Consequently, energy-related greenhouse gas emissions are a primary driver of global warming [2]. Mitigating these effects requires a two-pronged approach: a substantial increase in energy efficiency and the widespread integration of Renewable Energy Sources (RES) to satisfy rising global demand [2]. In this context, Energy Storage (ES) emerges as a critical enabling technology, enhancing efficiency through waste heat recovery and facilitating RES integration by decoupling supply from demand [3]. By incorporating ES, renewable energy availability is no longer dictated by the intermittency of the source, thereby supporting large-scale deployment and the subsequent reduction of CO2 emissions [4,5]. Furthermore, energy storage systems are vital components of the global energy infrastructure, supporting applications ranging from power generation (e.g., Concentrated Solar Power (CSP) plants) to industrial process heat and climate control in buildings. This study proposes an energy community characterized by a diverse mix of power plants, storage systems, and thermal and electrical loads. The primary objective is to generate and sell heat and power, while leveraging the capability to manage flexible energy exports. To achieve this, a Smart Microgrid (SMG) is employed to coordinate various renewable installations, including Photovoltaic (PV) plants and CSP systems. To maximize operational continuity and minimize grid reliance, the SMG integrates strategic energy storage solutions within the community infrastructure. A simulated representation of the energy grid serves as a basis for the decision-making analysis.
Its core is represented by a multi-objective and multi-criteria optimization model that jointly considers technological, economic, and environmental aspects. For each investigated configuration, the model determines the optimal operating strategy under representative operating conditions. Uncertain exogenous variables, such as electricity prices and renewable generation, are addressed upstream through forecast-based input data, which are then provided to the optimization model as deterministic inputs.
The optimization is based on an economic objective function that maximizes the difference between revenues and costs for the overall system, guarantying the energy balancing and the respect of technical constraints. It is possibly considered as revenue the earnings derived by the energy sold to the energy market, while costs are the production costs of all generators. It aims to coordinate the needs and capabilities of all generators, grid operators, end users and electricity market stakeholders to operate all parts of the system as efficiently as possible, minimizing costs and environmental impacts while maximizing system reliability, resilience, and stability.
The European Project STORIES [6] aimed to support growth in energy storage technology by making high-end research tools and expertise available to the community. It analyzed in a specific task devoted to the framework for modelling Energy Storage Systems a Benchmarking of Hybrid Thermal and Electrical Storage for Renewable Energy Communities [7]. Here, a deeper analysis of the integration of renewable energy producers, especially thermal, and users has been carried out.
In the renewable energy sector, thermal demand is typically characterized by fluctuating loads and significant peaks. Consequently, Thermal Energy Storage (TES) systems are essential for bridging the temporal gap between heat availability and demand, enabling peak shaving and optimized energy management [8,9]. In Concentrated Solar Power (CSP) plants, TES offers a distinct advantage over photovoltaics by allowing for electricity production even in the absence of solar radiation, utilizing stored thermal energy [10,11,12,13,14]. Furthermore, TES systems are widely employed for waste heat recovery across various industrial sectors [15] and are frequently integrated with heat pumps to enhance overall system efficiency [16,17].
Despite extensive research efforts [18], the widespread industrial integration of TES faces inherent challenges, primarily driven by the need for rapid returns on investment and proven profitability [19]. High initial capital expenditure remains a significant barrier [20,21,22]. Moreover, the practical viability of TES is critically dependent on specific process requirements, technical constraints—such as energy conversion mechanisms and thermodynamic boundaries—and the mismatch between the long operational lifespan of industrial infrastructure [23] and the rapid evolution of process demands. The following subsections introduce TES, Electrical Energy Storage, and Microgrids to provide the necessary context for the present study.

1.2. Thermal Energy Storage

Thermal Energy Storage (TES) systems are generally based on sensible heat storage (SHTES) or latent heat storage (LHTES). Sensible Heat Storage (SHS) involves storing heat via a temperature change in a material without a phase transition [24]. Stored energy is proportional to the material’s mass, specific heat, and temperature differential. Key properties include specific heat, density, thermal conductivity, stability, and cost. While these systems are low-cost, engineering and testing are still necessary. Water is the optimal SHS medium due to its high heat capacity and availability. For temperatures above 100 °C, materials such as oils, molten salts, ceramics, or concrete are used, with applications up to 1000 °C [25]. Latent Heat Thermal Energy Storage (LHTES) utilizes Phase Change Materials (PCMs) to absorb or release significant heat during a phase change (typically solid–liquid) at a quasi-isothermal temperature [26]. This provides LHTES with a high energy storage density and the advantage of charging/discharging at a nearly constant temperature. The theoretical energy stored is the product of the latent heat of fusion and the molten mass of PCM. A major advantage of LHTES is the ability to supply thermal energy at a constant temperature, allowing optimal operation of equipment (e.g., turbines) without costly SHS double-tank configurations. The high energy density of PCMs also reduces system size, costs, and heat loss. Their integration with sensible heat modules [27,28,29,30,31,32,33,34,35,36,37,38,39,40,41,42,43,44,45,46,47] is also possible, facilitating easier system management while ensuring the delivery of high-quality heat. Solid-to-liquid PCMs are preferred over gas-phase PCMs due to minimal volume expansion and ease of management. PCMs are categorized as inorganic compounds (salts, metals), organic compounds, or eutectic compounds. Inorganic PCMs offer high specific heat, high density, and higher thermal conductivity but suffer from undercooling and corrosiveness. Despite extensive research, few PCMs have reached commercial application [48,49,50,51,52]. Persistent challenges include phase separation, undercooling, corrosion, and, most critically, the low thermal conductivity of most PCMs [26,53]. Strategies to enhance heat transfer include adding fins [54,55,56,57], porous media [58], or nanoparticles [59,60].
Thermal energy storage in Concentrating Solar Power or Thermal (CSP/CST) plants is particularly important and represents a peculiarity that allows the continuous use of solar energy.
Concentrated Solar Power (CSP) systems, utilized for electricity generation, and Concentrated Solar Thermal (CST) systems, used for heat production, are facilities designed to supply power and/or thermal energy. They operate by employing an array of mirrors to intercept, reflect, and focus solar radiation onto a photo-thermal conversion system (receiver and absorber). These systems exhibit a broad spectrum of solar concentration factors, ranging from several tens to thousands of suns. Consequently, the operating temperatures achievable for the heat transfer fluid vary considerably, spanning from approximately 120 °C up to temperatures exceeding 1000 °C.
The four primary technologies employed in the CSP plants are [61]:
(1)
Solar Dish (SD) Systems: they use a large, parabolic reflector to focus solar energy onto a receiver located at the focal point, typically powering a Stirling engine to generate electricity. They achieve high temperatures and are well-suited for smaller, distributed power generation.
(2)
Solar Tower Systems (STS): a field of sun-tracking mirrors, called heliostats, concentrates sunlight onto a central receiver atop a tower, heating a fluid (e.g., molten salt) to very high temperatures, which then drives a conventional steam turbine. This design is highly scalable and allows for efficient thermal energy storage.
(3)
Parabolic Trough Collector (PTC) Systems: long, U-shaped mirrors focus solar radiation onto a receiver tube running along the focal line, where a Heat Transfer Fluid (HTF) is circulated and heated. The hot HTF is then used to generate steam, which powers a conventional turbine generator.
(4)
Linear Fresnel Reflector (LFR) Systems: they use multiple rows of long, flat or slightly curved mirrors (reflectors) to focus sunlight onto an elevated linear receiver tube. It offers a simpler, potentially lower-cost design compared to PTC due to the use of simpler, flat mirror segments.
One of the most common and less expensive technologies is the use of two-tank molten salt, one collecting the hot molten salt after the charging process and the other the cold one after the discharging. When using the Heat Storage Medium (HSM) known as “solar salt” (consisting of a mixture of NaNO3 at 60 wt% and KNO3), the cold tank temperature reaches about 290 °C. Meanwhile, the hot tank can reach the maximum temperature of the Heat Transfer Fluid (HTF), e.g., 390 °C with thermal oil or 550 °C. In the latter case, the coupling is direct; however, when using thermal oil as a HTF, an integrated heat exchanger is required (indirect coupling).

1.3. Electrical Energy Storage Technologies

Electrical Energy Storage (EES) systems convert surplus electricity into a storable medium and subsequently discharge it back into the grid. Traditional bulk mechanical storage, such as pumped hydro and compressed air, is geographically dependent. Conversely, electrical and electrochemical systems, including batteries and supercapacitors, offer greater flexibility in deployment.
EES mechanisms rely on the physical and chemical properties of their materials, typically storing energy chemically within electrode materials (batteries) or through charge accumulation at interfaces (supercapacitors).
Batteries store energy via faradaic (redox) reactions at the anode (oxidation) and cathode (reduction), converting chemical energy to electrical energy. Various battery technologies present trade-offs in efficiency, cycle life, and cost:
Lead-Acid Batteries: Favored for bulk storage due to low cost and reliability but limited by low energy density, short lifespan, and restricted depth of discharge (DOD). They also pose environmental challenges due to lead toxicity.
Lithium-ion (Li-ion) Batteries: Offer high energy efficiency (90–95%), superior power density, and longer lifespans, making them ideal for electric vehicles. Their drawbacks include higher initial cost and concerns regarding critical material sourcing (lithium, cobalt).
Flow Batteries: Provide flexibility through independent scaling of power and energy capacity, suiting large-scale grid applications. However, they have lower energy density and larger footprints, and the common vanadium variants are costly.
Nickel-Cadmium Batteries: Exhibit high energy density and durability but are being phased out due to the toxicity of cadmium, replaced by Li-ion and nickel-metal hydride alternatives.
According to Rahman et al. [1], electrochemical battery storage systems rank third in installed capacity (2.03 GW), with Li-ion holding the largest market share (1.66 GW), followed by sodium-based and flow batteries.
Supercapacitors are complementary to batteries, characterized by high power density and exceptional cyclability, though they possess a low energy density. They store energy through charge separation. They are critical in Hybrid Energy Storage Systems (HESS), where their rapid charge–discharge capability and high power density mitigate short-term voltage and frequency fluctuations when integrated with larger-scale systems like batteries [62,63]. Combining storage technologies enhance overall efficiency and resilience [63].

1.4. Microgrids

Since in this analysis a Microgrid is carried out for a Microgrid environment, the present sub-paragraph has been included.
Microgrids (MGs) have become a pivotal paradigm in modern power system design due to their ability to integrate distributed energy resources (DERs), including renewable energy sources (RES), and to operate both autonomously and in coordination with the main grid. An MG comprises a set of time-varying electrical and thermal loads, DERs, and energy storage systems, which collectively form a controllable sub-system capable of bidirectional power exchange with the upstream medium-voltage (MV) network. The presence of energy storage—both electrical and thermal—significantly enhances operational flexibility by decoupling generation from consumption, mitigating intermittency of RES, and enabling multi-energy optimization that incorporates heat generation and high-temperature thermal processes (e.g., combined heat and power (CHP) and conventional boilers) [64,65].
From a system planning and operation perspective, MGs offer reduced capital expenditure, lower emissions, and increased operational flexibility compared to centralized generation models. Their deployment at the demand side reduces transmission losses and supports local load fulfillment, thereby contributing to overall system resilience and reliability [66,67]. Empirical studies indicate that MG participation in deregulated electricity markets can contribute to lower wholesale prices, enhanced reliability, and optimized cost outcomes, particularly when leveraged with advanced control and optimization frameworks [67].
In deregulated environments, MGs must navigate complex market structures that include day-ahead energy markets and ancillary service (reserve) markets. The economic dispatch strategy of an MG hinges on market price signals; when forecasted electricity prices are high relative to internal generation cost, the MG exports surplus power, whereas it imports from the main grid when prices are low to meet internal demand. This strategy is most effectively realized through mathematical optimization models that consider generation cost curves, storage dynamics, load flexibility, and market constraints.
The optimization framework typically integrates both electrical and thermal sub-systems, accounting for CHP units, electric generators, boilers, and storage assets. Participation in reserve markets is enabled via dispatchable generation and flexible loads—modeled as shiftable and curtailable demands—to offer upward and downward regulation services. This comprehensive modeling allows MGs to internalize multi-market participation decisions while satisfying reliability and operational constraints. Furthermore, advanced stochastic and robust optimization techniques are increasingly adopted to manage uncertainties in RES output and market prices [67,68].

1.5. Objective of This Work

Integrating hybrid energy storage within a Renewable Energy Community (REC) yields two primary advantages. Primarily, the inclusion of thermal storage units drives the transition away from fossil-based heating—such as oil burners or CHP plants—by streamlining the adoption of renewable thermal power. Furthermore, the cross-domain nature of the system harmonizes storage operations to maximize both thermodynamic efficiency and grid responsiveness, ultimately enhancing the project’s economic viability [7].
In contrast to traditional methodologies, this study proposes an innovative modeling framework for evaluating Hybrid Energy Storage Systems (HESS) within distributed energy environments. The central premise of this work is that the design of distributed systems necessitates multi-criteria models capable of exploring diverse configurational pathways.
In the proposed framework, as above mentioned, the Microgrid (MG) operates in a grid-connected mode. Within this architecture, the distribution grid functions effectively as a virtual storage medium: excess generation is injected during periods of overproduction and withdrawn during deficits to maintain hourly energy equilibrium. By integrating system design, technology specifications, and operational characteristics during the planning phase, the optimization model facilitates the minimization of the economic objective function. This approach yields the optimal configuration of the technologies involved and determines the hourly electricity exchange profiles with the utility grid.
The developed model enables a comprehensive impact analysis of solar technologies within distributed systems by addressing the following technical dimensions:
  • Solar Technology Integration: A detailed analysis of Concentrated Solar Power (CSP)—including the integration of specialized thermal energy storage—alongside Photovoltaic (PV) systems and their deployment patterns.
  • HESS Contextualization: The definition of HESS within its operational environment. The system is modeled as part of a Microgrid where storage units coexist with traditional power plants, renewable sources, and various load profiles (derived from empirical data, simulations, or literature).
  • Socio-Economic Drivers: The identification of key performance indicators (KPIs) governing the adoption of HESS, with a strategic focus on economic viability and market diffusion.
The novelty of this work does not lie in proposing a new MILP algorithm per se, since MILP is already a well-established approach for the operational optimization of Microgrids and multi-energy systems [69,70,71,72,73,74,75,76,77]. Rather, the contribution of the study lies in the integrated comparative assessment of three alternative CSP–TES configurations within the same grid-connected PV–CSP Microgrid architecture, coupled with hybrid electrical and thermal storage [7,12,40]. The proposed framework enables the joint electro-thermal optimization of the system under techno-economic and environmental criteria [69,70,71,72,73,77], and supports a structured comparison across different operational targets, namely economic performance, environmental performance, and self-sufficiency. In addition, the analysis provides operational insights into the coordination between battery storage, PCM thermal storage, and grid exchanges, highlighting how different storage configurations affect dispatch strategies, peak reduction, and overall system behavior [69,70,71,72,73,74,75,76,77].

1.6. Paper Structure

The following sections detail the materials and methods employed, including the specific setting, analytical techniques, and tools used. This is followed by a description of the Microgrid site use case, leading into the results, discussion, and final conclusions.

2. Materials and Methods

In this chapter, the materials for thermal storage, the setting, and the analysis methods used in the study are presented.

2.1. The CSP Technologies Used in This Work

The determination of the better typology of CSP, including the identification of the size, technical and economical characteristics of the power plant and the development of maps of performance, have been realized and shortly described in the following.
After analyzing different technological configurations and an accurate literature analysis to choose the more important system Key Performance Indicators (KPI), the choice of the CSP to be inserted in the reference case fell on the Parabolic Solar Trough Collectors because they are the most mature CSP technology, can be coupled with a proper TES, and present several technological peculiarities to supply residential buildings, offices, hospitals and even industrial processes. In this work, the commercial double tank has been simulated; in addition, the PCM TES solution has been considered for the CSP plant using oil as an HTF. The identification of the size and some simulations have been here carried out together with some simulations to investigate the power production hour by hour during the year.
Concerning the PCM, a proper model has been implemented as described in the following paragraph.
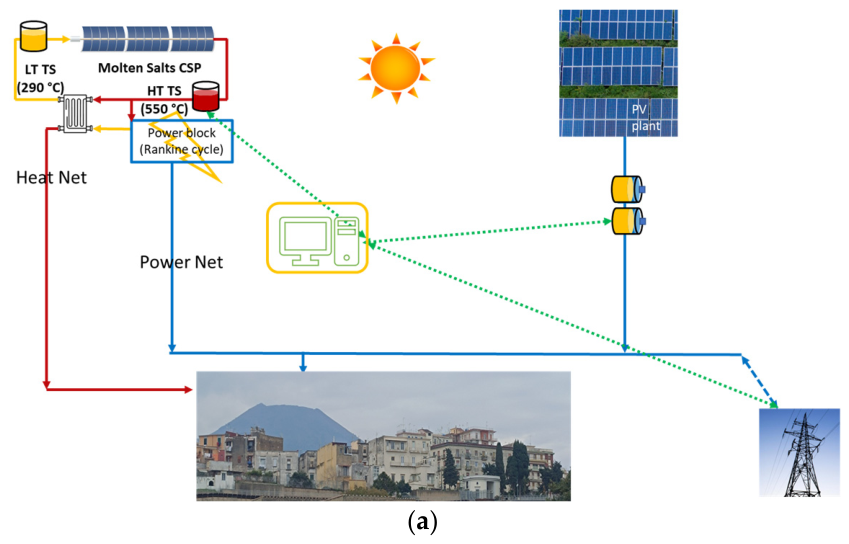
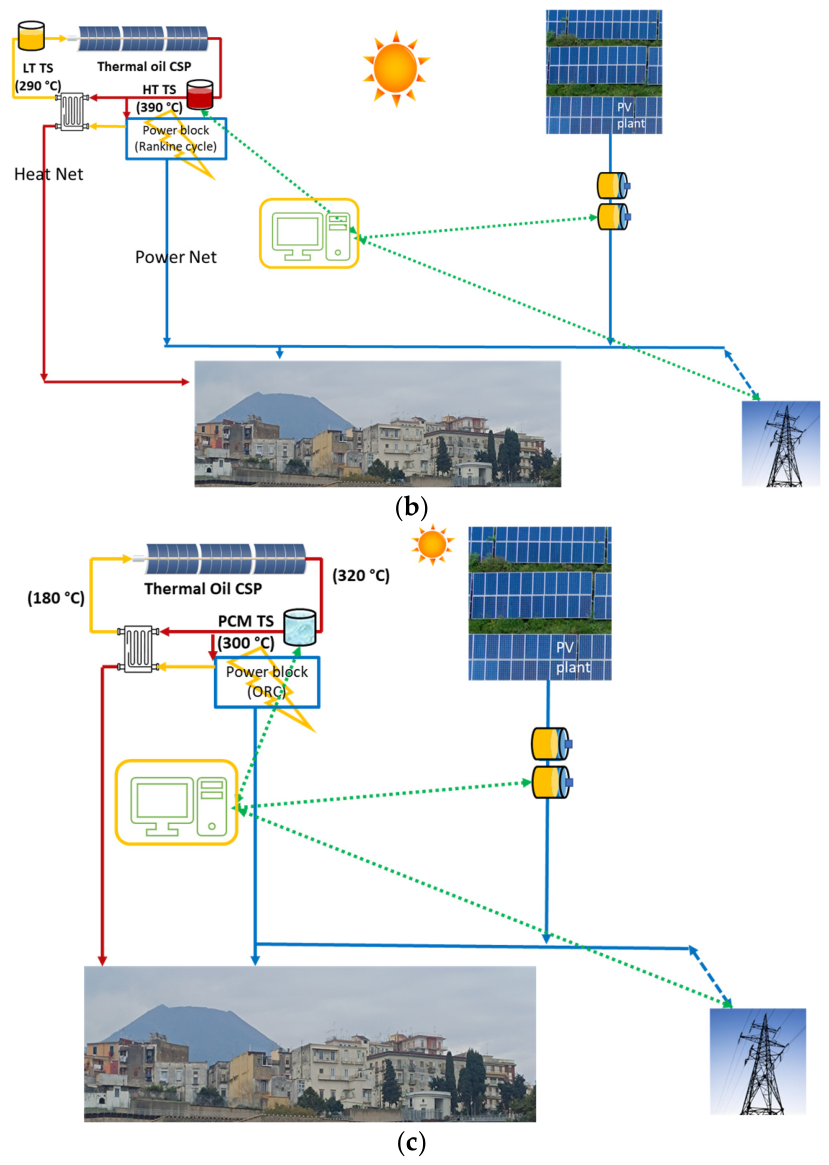
Figure 1 clarifies the case study definition for test facing, where it is possible to see three options and two scenarios to be evaluated. They consist of:
  • A parabolic trough collector CSP system using molten salt (MS) as HTF (60 wt% of NaNO3 and 40 wt% of KNO3) to produce heat at 550 °C coupled with a double tank using the same fluid as a Heat Storage Medium (HSM) and a Rankine Cycle Power block consisting of a reheater, a steam generator and a superheater to produce electricity when requested (option a);
  • A parabolic trough collector CSP system using thermal oil (TO) as HTF (VP-1) to produce heat at 390 °C coupled with an indirect double tank using solar salt as HSM and a Rankine Cycle Power block consisting of a reheater, a steam generator and a superheater to produce electricity when requested (option b);
  • A parabolic trough collector CSP system using TO as HTF to produce heat at 320 °C coupled with a PCM thermal storage and an Organic Rankine Cycle (ORC) using cyclopentane as process fluid to produce electricity when needed. The ORC consists of a pre-heater, a vapor generator, and a superheater, too (option c). In this case, the inlet/outlet range of temperature for the ORC is 180–300 °C;
  • A PV plant, coupled with Li-ion batteries (in options a, b and c);
  • Different residential buildings (about 100) that consume thermal and electrical energy (in options a, b and c);
  • Office buildings (10) that consume thermal and electrical energy (in options a, b and c).
  • A hospital that consumes thermal and electrical energy (in options a, b and c);
It is so clear that this analysis develops on two levels: at the single component, and the system. The presence of interaction between multiple parties and multiple subjects makes the resolution of the problem at the system level more complex.
Table 1 resumes the design of the CSP plant schema. Using the abovementioned design, some simulations have been performed to analyze the energy production and storage behavior during the year. They have been elaborated through the help of the SAM (System Advisory Model) SW by NREL [78] using the solar irradiance data from [79]. In our analysis, only plants equipped with storage systems will be considered; however, for completeness, information on plants without storage has also been provided.

The PCM Module

The proposed Phase Change Material (PCM) Thermal Energy Storage (TES) is a model implemented in Matlab® R2020b (MathWorks, 1 Apple Hill Drive, Natick, MA, USA) of a module prototype.
A PCM TES system stores thermal energy within the operating temperature range of the material used. Fundamentally, it consists of an element containing a suitable Phase Change Material. During charging, this material heats up and melts, while in the discharging step, it cools and solidifies. Typically, the PCM is heated and cooled by a Heat Transfer Fluid (HTF) that flows through an integrated exchanger within the PCM module. For industrial applications, multiple elements containing different PCMs can often be used in cascade to exploit their varying phase change temperatures. Phase change thermal storage systems (PCMTES) offer two characteristics that make them highly attractive for various industrial applications:
-
Compactness: They provide a high density of stored energy (sometimes 3–5 times that of sensible heat TES) due to the exploitation of latent heat.
-
Temperature Stability: The temperature of the heat supplied remains stable, linked directly to the melting temperature of the PCM.
PCM TES systems have already achieved widespread application at low temperatures, but they are still in the study and development phase for applications at medium and high temperatures (above 120 °C).
Above this temperature, the PCMs that can be used are typically salts. In the present work the proposed salts are the so-called solar salts (60%wt NaNO3–40%wt KNO3, with a range of fusion/solidification of about 222–238 °C).
In this system the input is the initial temperature of the PCM at each step [°C], the power required [W] (positive if in charge and negative in discharge), and its time of application [s], while the output is the temperature of the PCM at the end of each step [°C] and its change level [kWht].
The proposed model follows the procedure outlined below. Initially, the maximum energy storage capacity of the PCM is defined across its solid and liquid phases, including the latent heat transition. The thermal state of the material is then determined by evaluating the instantaneous energy balance relative to its temperature. By accounting for the heat power supplied or extracted, the system’s energy level and the resulting temperature are updated iteratively. This new state serves as the input for the subsequent time step until either full charge or discharge is reached. Upon reaching these saturation points, the temperature remains constant unless further energy exchange occurs.
The theoretical validation of the model was conducted using a PCM storage system consisting of a metallic enclosure containing approximately 300 kg of the abovementioned solar salt, able to ensure about 20 kWh of thermal storage. The system is integrated with an internal heat exchanger where a thermal oil serves as the Heat Transfer Fluid (HTF). During the charging phase, the thermal oil provides heat to the PCM, while during discharge, it extracts energy to cool the material.
It has been successfully used for the STORIES project [6,7] for the activity task called “T3.2—Framework for modelling Energy Storage systems”.
The simulations evaluated two distinct charging and discharging operational modes for the PCM module:
Mode 1: Constant Thermal Power. Starting from an isothermal state of 200 °C, the PCM is heated by thermal oil at 310 °C. The oil flow rate is dynamically adjusted to maintain a constant thermal power until the system reaches an average temperature of 300 °C (full charge). The discharge process follows a symmetric logic: oil at 190 °C is circulated with a controlled flow to extract constant power until the system returns to 200 °C (full discharge).
Mode 2: Constant Flow Rate. In this scenario, the thermal oil is supplied at a fixed temperature (310 °C for charging, 190 °C for discharging) and a constant flow rate of 348 kg/h. Consequently, the thermal power progressively decreases as the temperature gradient between the oil and the PCM narrows. The process continues until the target temperatures (300 °C for charge, 200 °C for discharge) are achieved.
The model’s behavior is independent of the specific days selected; these were chosen merely as seasonal examples, which naturally influence the system.
The system can be applied also in cascade with a sensible module, for example, using concrete [80].
The primary advantage of this storage system is its operational flexibility, as it can be charged or discharged regardless of its current state of charge and for an indefinite number of cycles. This capability provides a significant benefit, allowing the system to effectively absorb or release heat as required throughout the day. This functional aspect has been fully integrated into the proposed model.

2.2. The Operational Optimization Module

The increasing complexity of distributed energy systems and Microgrids require advanced modelling tools capable of supporting both operational and strategic decision-making in contexts characterized by high variability, heterogeneous technologies, and multiple objectives. The integration of renewable energy sources, heat pumps, electrical and thermal storage systems, conventional boilers, and distributed generation units makes it essential to adopt optimization methodologies that can simultaneously handle processes at different time scales and constraints of both discrete and continuous nature. In this context, Mixed-Integer Linear Programming (MILP) models have emerged as a reference tool for the planning and operational management of Microgrids and multi-energy systems [69,70,71,72,73].
The literature shows a consolidated use of MILP models for the sizing, management, and optimization of complex energy systems that integrate electrical and thermal components. Gabrielli et al. [69] demonstrate that such models enable optimal coordination between generation, storage, and loads in multi-energy systems with seasonal storage. Similarly, Mansoor et al. [70] apply an extended MILP formulation for planning thermal energy systems in a Microgrid with storage, highlighting the capability of the model to minimize costs and emissions through a coordinated management of thermal and electrical resources. Studies such as that of Li et al. [71] combine evolutionary approaches and MILP-based unit commitment, emphasizing how the MILP framework allows for a rigorous representation of the discrete components of energy systems (on/off decisions, storage state transitions, continuity constraints).
Thermal storage management is another area where MILP models are particularly effective. Steen et al. [72] present a general scheme for the linear modelling of thermal storage systems within distributed energy resource models, integrating thermodynamic charge/discharge constraints and energy content limits. The ability of MILP to simultaneously handle electrical and thermal constraints enables a consistent representation of multi-vector systems, which is particularly relevant in Microgrid contexts.
In parallel, the growing interest in hybrid systems for space heating and domestic hot water production has further encouraged the adoption of MILP models. Pérez-Iribarren et al. [73] propose a MILP-based approach for the integrated optimization of heat pumps, boilers and thermal storage in buildings, showing how such models can be used to assess trade-offs between operating costs, energy performance and environmental objectives. These results highlight the maturity of MILP as a tool for multi-objective analysis of complex energy systems.
In recent years, particular attention has been devoted to Phase Change Materials (PCMs), which, thanks to their high energy density and quasi-isothermal behavior during charge and discharge, represent an advanced solution for thermal energy storage in building and Microgrid applications. The review by Sharma et al. [74] provides a comprehensive overview of PCM technologies and their applications. Wei et al. [75] investigate the integration of PCM-based systems in smart buildings, showing the capability of PCMs to enhance the efficiency of heating and cooling systems and to increase flexibility in thermo-electric management. At the Microgrid scale, Mühlbauer et al. [76] show how PCMs can be incorporated into 100% renewable, islanded electricity systems to reduce costs and improve stability and resilience.
From a methodological standpoint, optimization techniques applied to Microgrid operation have been systematically reviewed by Gao et al. [77], who identify MILP as one of the most robust approaches for multi-objective problems, energy scheduling, integrated electro-thermal management and planning under complex operational constraints. Taking together, these contributions demonstrate that MILP has become a de facto standard for the modelling of Microgrids and multi-energy systems with thermal loads, PCM, heat pumps and boilers. In light of these works, the adoption of a MILP model for the joint management of electrical and thermal loads, PCM storage, heat pumps and auxiliary generation is fully justified. MILP allows for a rigorous formulation of charge/discharge dynamics, discrete component states, seasonal variability and the multi-objective nature of the problem, providing a robust, generalizable and well-established methodological framework within the scientific literature.

2.2.1. Operational Analysis Phase

The operational analysis module determines the optimal hourly dispatch of the multi-carrier energy system by minimizing a weighted sum of total net daily operating costs and CO2 emissions. The optimization is carried out within a multi-objective framework and is applied to representative seasonal days under a deterministic MILP formulation.
Based on the system design, technology characteristics, user demand profiles, energy prices, and renewable generation data, the model identifies the optimal operating strategy of the available technologies, including generation units, thermal and electrical storage systems, and grid exchanges. In this way, the operational analysis supports the evaluation of day-ahead dispatch strategies and the comparison of alternative system configurations.
In the present study, uncertainty is not explicitly modelled within the optimization problem through stochastic, robust, or scenario-based techniques. Instead, uncertain exogenous variables, such as electricity prices and renewable generation, are treated upstream through forecasting tools or representative input profiles and are then provided to the MILP model as deterministic inputs.

2.2.2. Simulation Environment Setup and Description

To take both cost and environmental assessments into account, a MILP problem is formulated, and the goal is to determine types, numbers, and sizes of energy devices with the corresponding operation strategies on the Pareto frontier, thereby providing different design options for planners based on short- and long-run priorities.
In modelling the energy devices, a relevant feature of the framework is that the full-size ranges available on the market, together with the variations in efficiency and specific capital and O&M costs with size, are explicitly considered on the basis of a detailed market analysis. However, the main contribution of the study is the integrated comparative assessment of alternative CSP–TES configurations within a common Microgrid optimization framework.
Given the input data, such as end-user demand, local climate data, energy prices and technical and economic information of the candidate energy devices, the model allows obtaining their optimized combination, and the corresponding operation strategies through cost and energy assessments.
The multi-objective optimization problem is characterized by a single objective function in which economic and environmental aspects are considered. In particular, the optimization function is formulated as a weighted sum of the total cost (CTOT) and the total environmental costs, to be minimized as:
F obj   =   c ω F o b j , e c o + 1 ω F o b j , e n v
Hypothesis underpinning the analysis
  • Electricity demand can be satisfied by grid power, by the electricity provided by CHPs (Combined Heat and Power), PV (Photovoltaic), and by the electricity discharged from the electrical storage.
  • For CHPs, specific capital costs, O&M (Operation and Maintenance) costs, as well as electrical and thermal efficiencies vary greatly with the sizes.
  • It is assumed that electricity generated by CHP and PV systems is self-consumed within the Microgrid, whereas surplus electricity produced by the CSP-based power generation units may be exported to the main grid.
  • Heating demand can be satisfied by thermal energy provided by CHPs, natural gas boilers, heat pumps, and by thermal energy discharged from the storage.
  • The optimization is carried out on an hourly basis for a representative day per season to reduce the number of variables and the model complexity.

2.3. The Problem Formulation

The objective function (1) maximizes the sum of two components: an economic term and an environmental term. The first term represents the total net daily energy cost, including the cost of natural gas consumed by CHPs and boilers, the cost of electricity imported from the grid, and the revenues obtained from surplus electricity exported to the grid.
To solve this multi-objective optimization problem, the weighted-sum method is used to obtain a single objective function, formulated as the abovementioned Equation (1), where c is a constant scaling factor to keep the two objectives at the same order of magnitude, and ω is the weight for the economic objective.
The optimized size of DERs is obtained under economic and environmental optimization as well as under four trade-off points on the Pareto frontier, obtained varying the weight ω in the range of [0, 1].
For ω = 1, the economic optimization is obtained, and the related solution is the one that minimizes the total annual cost. For ω=0, the environmental optimization is obtained, and the related solution is the one that minimizes the total annual CO2 emissions.
The problem formulated above is linear and involves both discrete and continuous variables. Branch-and-cut, which is powerful for mixed integer linear problems, is therefore used.
The model is implemented and tested by using IBM ILOG CPLeEX Optimization Studio Version 12.6 [81]. The optimization problem can be solved within 2 h.
The problem formulated for both tools is linear and involves both discrete and continuous variables. To solve the problem efficiently, branch-and-cut, which is powerful for MILP problems, is used.
System balance constraints
Power balance
In the energy system, the electrical demand and the power required by the heat pumps (either in the heating or cooling mode) must be met by the sum of the electricity provided by the CHPs and the electricity provided by PV together with the battery and power grid:
H P E H P j , h r r e q = j C H P   N G I C E E C H P   N G I C E j , u , h r s e l f + j C H P   N G M T G E C H P   M T G j , h r s e l f + j C H P   F C E C H P   F C j , h r s e l f + E P V j , h r s e l f + E P G j , h r + B a t E B a t j , h r D i s c h E B a t j , h r C h

3. Use Case Description

It is supposed that model is tested on ENEA Portici Research Centre, https://www.portici.enea.it (accessed on 9 February 2026), using data and loads both real and simulated. The campus is in the municipality of Portici, a town in the Metropolitan City of Naples with approximately 54,000 inhabitants.
The Portici site hosts several departments dedicated to chemistry, biology, and energy research, and it is equipped with advanced infrastructures that enable experimentation on energy systems, including:
  • An experimental electric nano-grid with both alternating current (AC) and direct current (DC) buses operating at different voltage levels (low and medium voltage).
  • A variety of generation units, storage systems.
  • Integrated groups of users, comprising both consumers and prosumers.
  • Real and emulated renewable generation sources, including photovoltaic and wind power.
  • A connection to the national electricity grid.
  • Heating and cooling systems, supporting both research and campus energy needs.

3.1. Input Data Connection

Energy demand of users
The hourly energy rate demand for electricity, thermal energy and space cooling is given for four representative season days. Based on the climatic characteristics of the zone, and when it is possible to turn on the heating systems in the relative climatic zone (from 15 November to 1 April), the year is assumed to be composed of 90 days in the cold season (December–February), 92 days in the cold mid-season (22 October–30 November, and 1 March–7 April), 91 days in the hot mid-season (8 April–31 May, and 1 September–21 October), and 92 days in the hot season (June–August).
Electrical Energy: In the base case, the electrical energy required is sourced directly from the grid. Moreover, for the analysis, it has been assumed an average emission factor of 0.354 kg CO2/kWh for grid electricity, which is indicative of typical emissions associated with Italian electricity generation.
Thermal Energy: Thermal energy for heating purposes is provided by a conventional boiler supplied by natural gas, boasting an efficiency rating of 0.85, which represents an average efficiency of such systems. To calculate the energy content of the natural gas used in the boiler, a Lower Heating Value (LHV) of 9.8 kWh/Nm3 for methane (natural gas) was considered. Additionally, the emission factor for natural gas combustion has been considered equal to 1.98 kg CO2/Nm3.
Cooling Energy: Cooling energy is furnished by an electric chiller with a coefficient of performance (COP) set at a value of 3, representing the average efficiency level for such equipment.
Solar energy availability
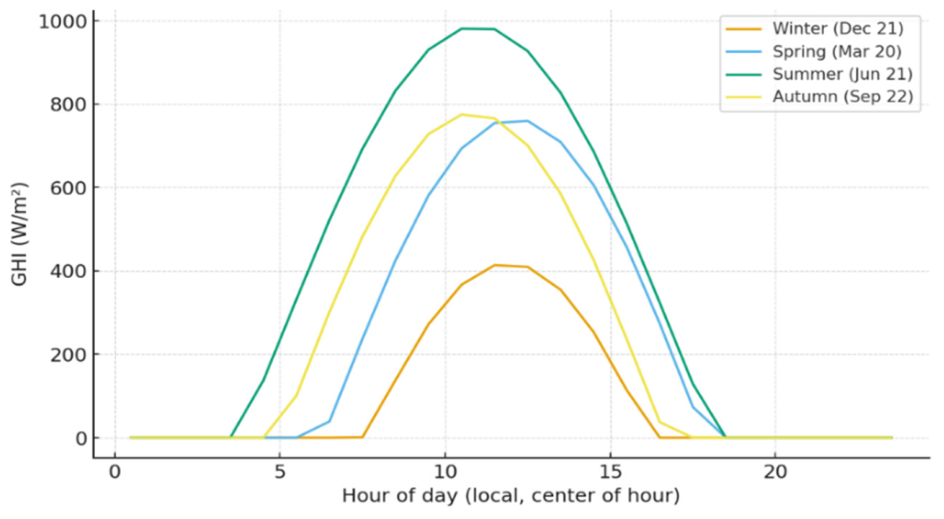
Information about solar energy is taken from the meteorological data in Portici. The hourly solar irradiance for each representative season day is evaluated as the average of the hourly mean values of the solar irradiance in the corresponding hour of all days in the relative season and is shown in Figure 2.

3.2. Energy Data

Energy Demand for season
Table 2, Table 3, Table 4, Table 5, Table 6 and Table 7, the energy demand of the season is reported.
Prices and energy factors of primary energy carriers
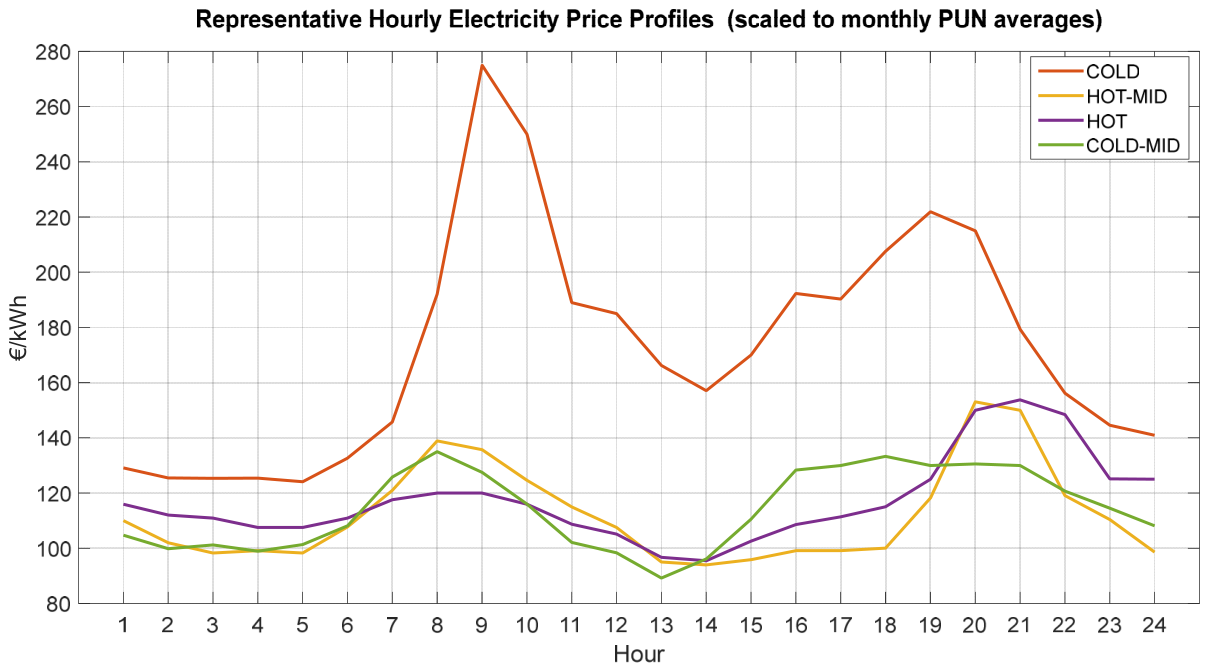
Energy prices are chosen according to the Italian market. The hourly electricity price for each representative season day is evaluated as the average of the hourly mean values of the electricity price in the corresponding hour of all days in the relative season and is shown in Figure 3.
The unit prices of natural gas are reported in Table 8.
Technical and economic information of energy devices
The technical and economic information of energy devices are reported below (Table 9 and Table 10).

4. KPI Definition and Selection

KPIs are the primary instrument by which a benchmark makes solutions comparable. In principle, a broad set of predefined indicators is needed to ensure consistency across cases and studies; in practice, comparison is more effective when the focus is on a small core of truly critical indicators.
For an application-oriented benchmark on multi-technology storage systems, KPIs must be selected that the model can estimate robustly. A list is not enough; metrics are needed that capture both overall performance and operational dynamics, because in operation, results depend on interactions among components over time.
Aggregation: Converting KPIs of individual technologies into a system-level indicator requires explicit criteria (weighted average of contributions, cumulative sum, or metrics driven by the dominant or limiting component). In some contexts, it is advisable to introduce application-level KPIs, which measure the performance of an integrated system for a specific use, after defining the reference case within the benchmark.
Temporal nature: Static indicators depend on intrinsic properties of materials and devices; dynamic ones require representing controlled behavior under representative operating conditions. Further choices concern absolute KPIs, more interpretable because they are not tied to a baseline, and relative KPIs, useful for targeted comparisons but less transferable. Sizing also matters: some metrics reflect operating sizing choices; others assume fixed sizes.
On geographical adaptation, renewable generation data are already geo-referenced; representing consumption profiles and aligning with local constraints, built environment, and regulatory requirements is more complex. An effective approach is adaptation by clusters of project locations, where complete datasets exist, and the benchmark case is representative, implemented by parameterizing the relevant variables.
Finally, KPI selection must make trade-offs explicit. The minimum set should cover technical, economic, and sustainability dimensions, so that improvements on one front and deteriorations on another are immediately visible. The guiding criteria are metrics that are quantitative and comparable, replicable, computable within the defined benchmark, mathematically sound over the full operating range, relevant to the use cases and, where possible, expressed in absolute terms. Under these principles, KPI selection becomes transparent, traceable, and useful for comparing multi-technology solutions with single-component systems.
The selected KPI are shown in Table 11 [7].

4.1. Results and Discussion

This section focuses essentially on the results obtained with the Phase Change Material TES system (Table 12), while, due to space constraints, the results of the other simulations are reported in Table 18.
Designing integrated energy systems requires a careful assessment of alternative storage scenarios that combine three primary technologies: Heat Pump (HP), Battery (BAT), and Phase Change Material (PCM) TES. Each scenario varies in terms of energy capacity and maximum power of the technologies, driving significant impacts on both capital expenditures and operating costs (O&M). The HP is constant across scenarios, providing a stable baseline for thermal management. BAT and PCM, by contrast, are configured differently, which determines the system’s operating characteristics and efficiency.
The Base scenarios are balanced configurations, with the Battery (BAT) dominant in both installed power and energy capacity. For example, in Base_1 the BAT reaches 83 kW and 6806 kWh. The BAT + PCM combination covers electrical peaks and stabilizes thermal management, reducing intensive Heat Pump (HP) use. Base_2 optimizes electrical capacity at the expense of thermal capacity, while Base_3 increases the PCM share, improving thermal flexibility without compromising electrical storage. Capital costs range from M€ 3.366 to M€ 3.381 million, with O&M between k€ 53.5 and k€ 59.3, indicating balanced, realistic investments for mid-scale systems.
While economic optimization favors boilers because of their low investment and operating costs (O&M), the same boiler technology is excluded from the selection when running the environmental optimization with a strong focus on the energetic objective.
While electrical storage is selected for economic optimization, it is excluded from environmental optimization due to its high storage loss fraction.
Thermal storage for space cooling demand increases as the weight for the economic objective increases, reaching the maximum under the economic optimization, while the capacity of thermal storage for heating demand changes with the weight and is maximum under the environmental optimization.
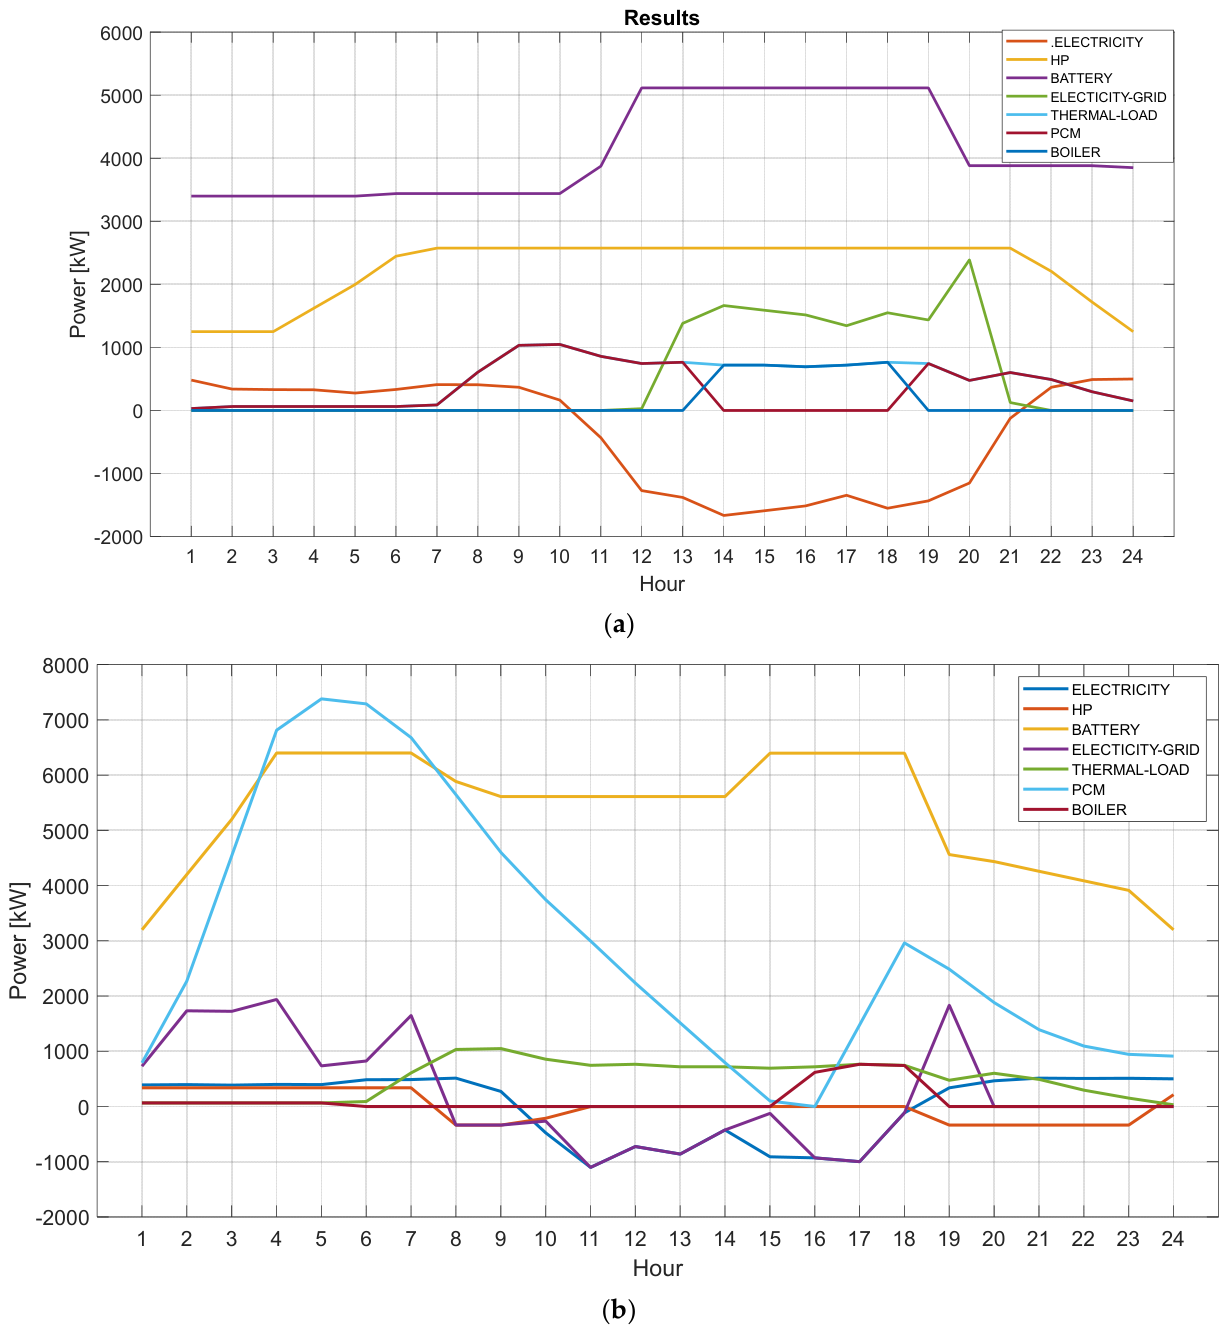
Below are the results for a summer day (Table 13) and a winter day (Table 14) under the environmental optimization scenario. For clarity, the same sign convention is adopted for all storage- and exchange-related variables: positive values denote charging, import, or energy absorption, whereas negative values denote discharging, export, or energy release. Accordingly, positive EL_grid values indicate electricity imported from the distribution grid, while negative EL_grid values indicate electricity exported to the grid.
In Figure 4, the shape of the results is shown.
In Figure 4a the objective is to assess HP, BAT, PCM, and EL_grid exchanges over a typical day, linking production–consumption coherence, dispatch quality, thermal coverage, and peak risk. The storyline is continuous: in the morning the system settles into a base regime; at midday it shifts into a surplus phase with export and battery charging; then it faces the evening transition with a brief import before returning to marginal grid exchanges.
This state change is not accidental. The midday export window arises from alignment between available production and subdued demand: the battery charges because the opportunity cost is low, while the Heat Pump holds the thermal base. Exporting in parallel with charging is rational if prices allow it, but it sets up the evening issue: if the battery does not start discharging early enough, the subsequent demand step becomes an import peak. The evening re-entry is therefore not an outlier; it is the predictable result of the midday strategy.
Thermal behavior explains why this strategy runs without asset stress. In the afternoon the PCM TES covers most of the thermal need and reduces reliance on the boiler; the HP remains the backbone, stable and predictable. This setup lets the battery serve a primarily electrical purpose, but it also requires synchronizing battery control with load dynamics; if PCM absorbs the thermal peak between 14:00 and 18:00, the battery can begin pre-discharging in the tail of that window to soften the 19:00–20:00 step.
PCM TES plays a central role in shaping the thermal load. In the baseline scenario, the boiler activates marginally at certain hours to cover peaks or deficits, while in self-sufficient mode it remains essentially idle thanks to the HP + PCM combination. The HP provides a steady thermal base, while the PCM stores energy during low-load hours and releases it at peak times, stabilizing thermal demand.
Economic logic follows the same thread. The long export phase creates value only if remuneration is adequate; without a price threshold the arbitrage weakens, and the probability of re-import rises. Conversely, the evening peak hurts even if brief because it drives capacity charges and worsens the flexibility of KPIs. Tying the two phases together means using the daytime window not only to export and charge, but to deliberately prepare for the evening landing.
This yields a set of actions that justify one another. Pre-discharging the battery from late afternoon reduces the evening peak without breaking daily balance, especially if the State of Charge minimum ( S o C m i n ) is temporarily eased in that window. A price threshold for daytime exports realigns sales with real value and reduces the need to buy back later. Retiming the HP toward lower-price hours, while keeping PCM as a buffer in the 14:00–18:00 band, stabilizes the profile and limits boiler usage. Each lever feeds the next: less “low value” export leaves more energy for pre-discharge; more pre-discharge lowers the evening peak; a lower peak trims capacity costs and improves margin.
The result is a single narrative, not a checklist: the midday phase creates potential, battery management converts it into value, thermal coordination makes it robust, and price-aware rules prevent leakage. In this way the daily cycle closes with a smoother electrical profile, efficient thermal behavior, and a more defensible economic outcome, with no structural changes and only targeted setpoint adjustments.
In the Figure 4b the results describe the behavior of the integrated energy system under conditions characterized by a sustained and relatively uniform thermal demand. The thermal load remains consistently high, typically between 700 and 1050 kW, indicating a heating-driven operating regime. The absence of sudden peaks or extended periods of inactivity suggests that the demand is associated with space heating rather than domestic hot water production or cooling processes.
The Heat Pump operates with reduced effectiveness throughout the considered period, and several instances show negative values. Such behavior is consistent with winter operation, where lower outdoor temperatures may induce defrost cycles and reduce the seasonal performance of the unit (lower COP). These effects limit the ability of the Heat Pump to meet the entire thermal demand on its own.
The thermal storage system (PCM) contributes continuously and at significant levels. Its activation is distributed across the entire operating horizon, reflecting its role in supporting the Heat Pump and smoothing the thermal demand profile. In this operating context, thermal storage becomes a strategic component, enhancing system flexibility and reducing reliance on direct generation.
The boiler shows frequent and substantial activation. Its contribution compensates for the mismatch between the thermal demand and the combined capacity of the Heat Pump and the thermal storage. This behavior is coherent with a heating-dominated scenario, where auxiliary thermal generation is required to ensure full coverage of the load.
Electrical interactions with the grid present a pattern dominated by high import levels, with occasional export episodes. The predominance of imports suggests that the electric subsystems—particularly the Heat Pump—operate under conditions requiring significant external support. This indicates that the internal electricity generation or storage is insufficient to offset the increased winter energy demand.
Overall, the results depict a configuration in which:
  • The thermal load drives system operation;
  • The Heat Pump provides partial coverage with reduced efficiency;
  • The thermal storage plays a stabilizing role;
  • The boiler ensures supply adequacy;
  • The grid supplies a considerable share of the required electrical input.
This behavior aligns with expectations for operation in a cold-season context, where thermal demand is the dominant variable, and the optimal strategy identified by the MILP model involves a balanced use of storage, Heat Pump output, and auxiliary generation to satisfy the heating needs efficiently.
The two operating conditions exhibit markedly different patterns, primarily driven by the thermal demand profile and its interaction with the available conversion and storage technologies.
From a thermal standpoint, the winter case is characterized by a high and persistent thermal load, with values remaining in a relatively narrow band and indicating a predominantly heating-driven operation. In contrast, the summer case shows lower and more intermittent thermal loads, with short peaks associated with domestic hot water preparation or cooling, followed by periods of reduced or negligible demand. Consequently, in winter the thermal load acts as the dominant constraint in the optimization problem, whereas in summer it plays a more marginal, peak-oriented role.
The behavior of the Heat Pump reflects this difference. Under winter conditions, the unit operates with reduced effectiveness and, in several time steps, exhibits signatures consistent with defrost cycles or degraded performance (e.g., negative or low net contributions). The Heat Pump is therefore unable to cover the entire thermal demand on its own and must be complemented by other technologies. In summer, the Heat Pump operates closer to its favorable regime, with more stable performance and limited stress, as it is mainly required to manage moderate and short-lived thermal demands.
Thermal storage (PCM) also plays a distinct role in the two regimes. In winter, the PCM is used intensively and over extended periods, providing a continuous contribution that supports both the Heat Pump and the boiler. Its function is essentially that of a buffer that smooths the thermal demand and reduces the need for instantaneous high-power generation. In summer, the PCM is still activated but in a more intermittent fashion, primarily to accommodate short peaks in thermal load and to shift limited amounts of energy over time. The strategic relevance of thermal storage is therefore higher in winter, where it directly contributes to maintaining supply adequacy under severe demand conditions.
The boiler shows the most evident contrast between the two operating conditions. In the winter case, boiler operation is frequent and substantial, providing a significant share of the total thermal output whenever the combination of Heat Pump and PCM is insufficient. This behavior is consistent with an auxiliary or backup role under high-load conditions. In the summer case, the boiler is either scarcely used or remains inactive for large portions of the day, indicating that the thermal demand can be satisfied without extensive recourse to conventional thermal generation.
Electrical interactions with the grid further underline the seasonal differences. Winter operation is associated with higher and more sustained imports from the grid, reflecting the increased electrical demand arising from both the Heat Pump and the auxiliary components. Occasional exports may still occur, but they are quantitatively less relevant compared to imports. In summer, grid exchanges tend to be more balanced, with imports reduced due to lower thermal demand and, in some periods, partially offset by local generation and storage. The overall electrical stress on the system is therefore significantly higher in winter.
From a system-level perspective, the optimization results indicate that the same MILP formulation, when subjected to different boundary conditions (winter vs. summer), selects qualitatively different operating strategies. In winter, the optimal solution relies on a coordinated use of all available technologies—Heat Pump, PCM, boiler, and grid import—to guarantee coverage of a large and persistent thermal load. In summer, the optimal strategy is characterized by a reduced involvement of the boiler, a less critical role of the heat pump, and a more moderate interaction with the grid, with storage technologies primarily used to manage short-term fluctuations rather than structural deficits.
Overall, the comparison highlights that the adopted modelling framework is able to reproduce consistent and physically meaningful strategies under heterogeneous operating conditions. In the winter scenario, the optimization favors robustness and adequacy under high thermal demand, whereas in the summer scenario it tends to minimize the use of conventional generation and external supply, leveraging more efficiently the intrinsic flexibility of the system.
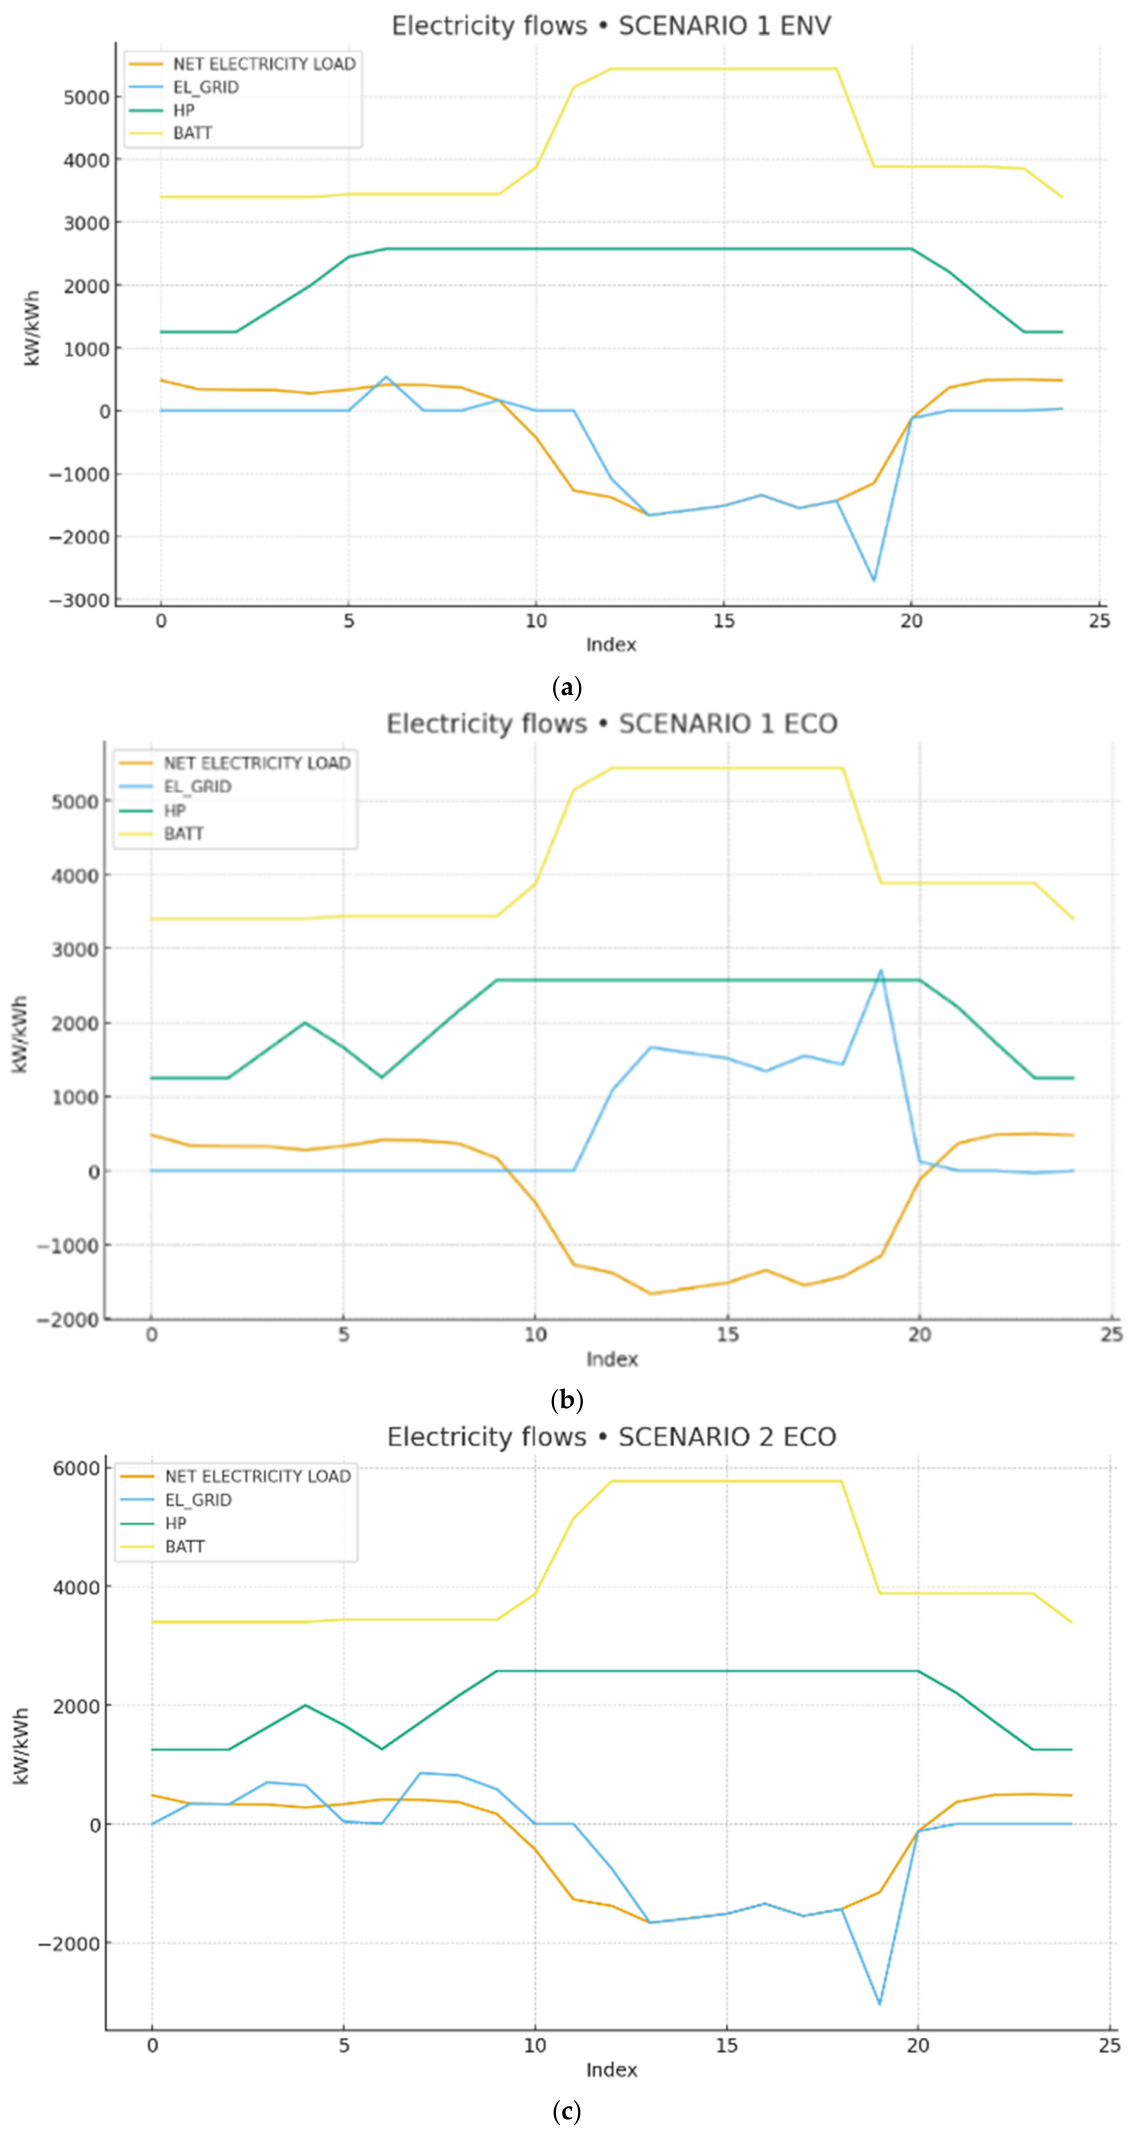
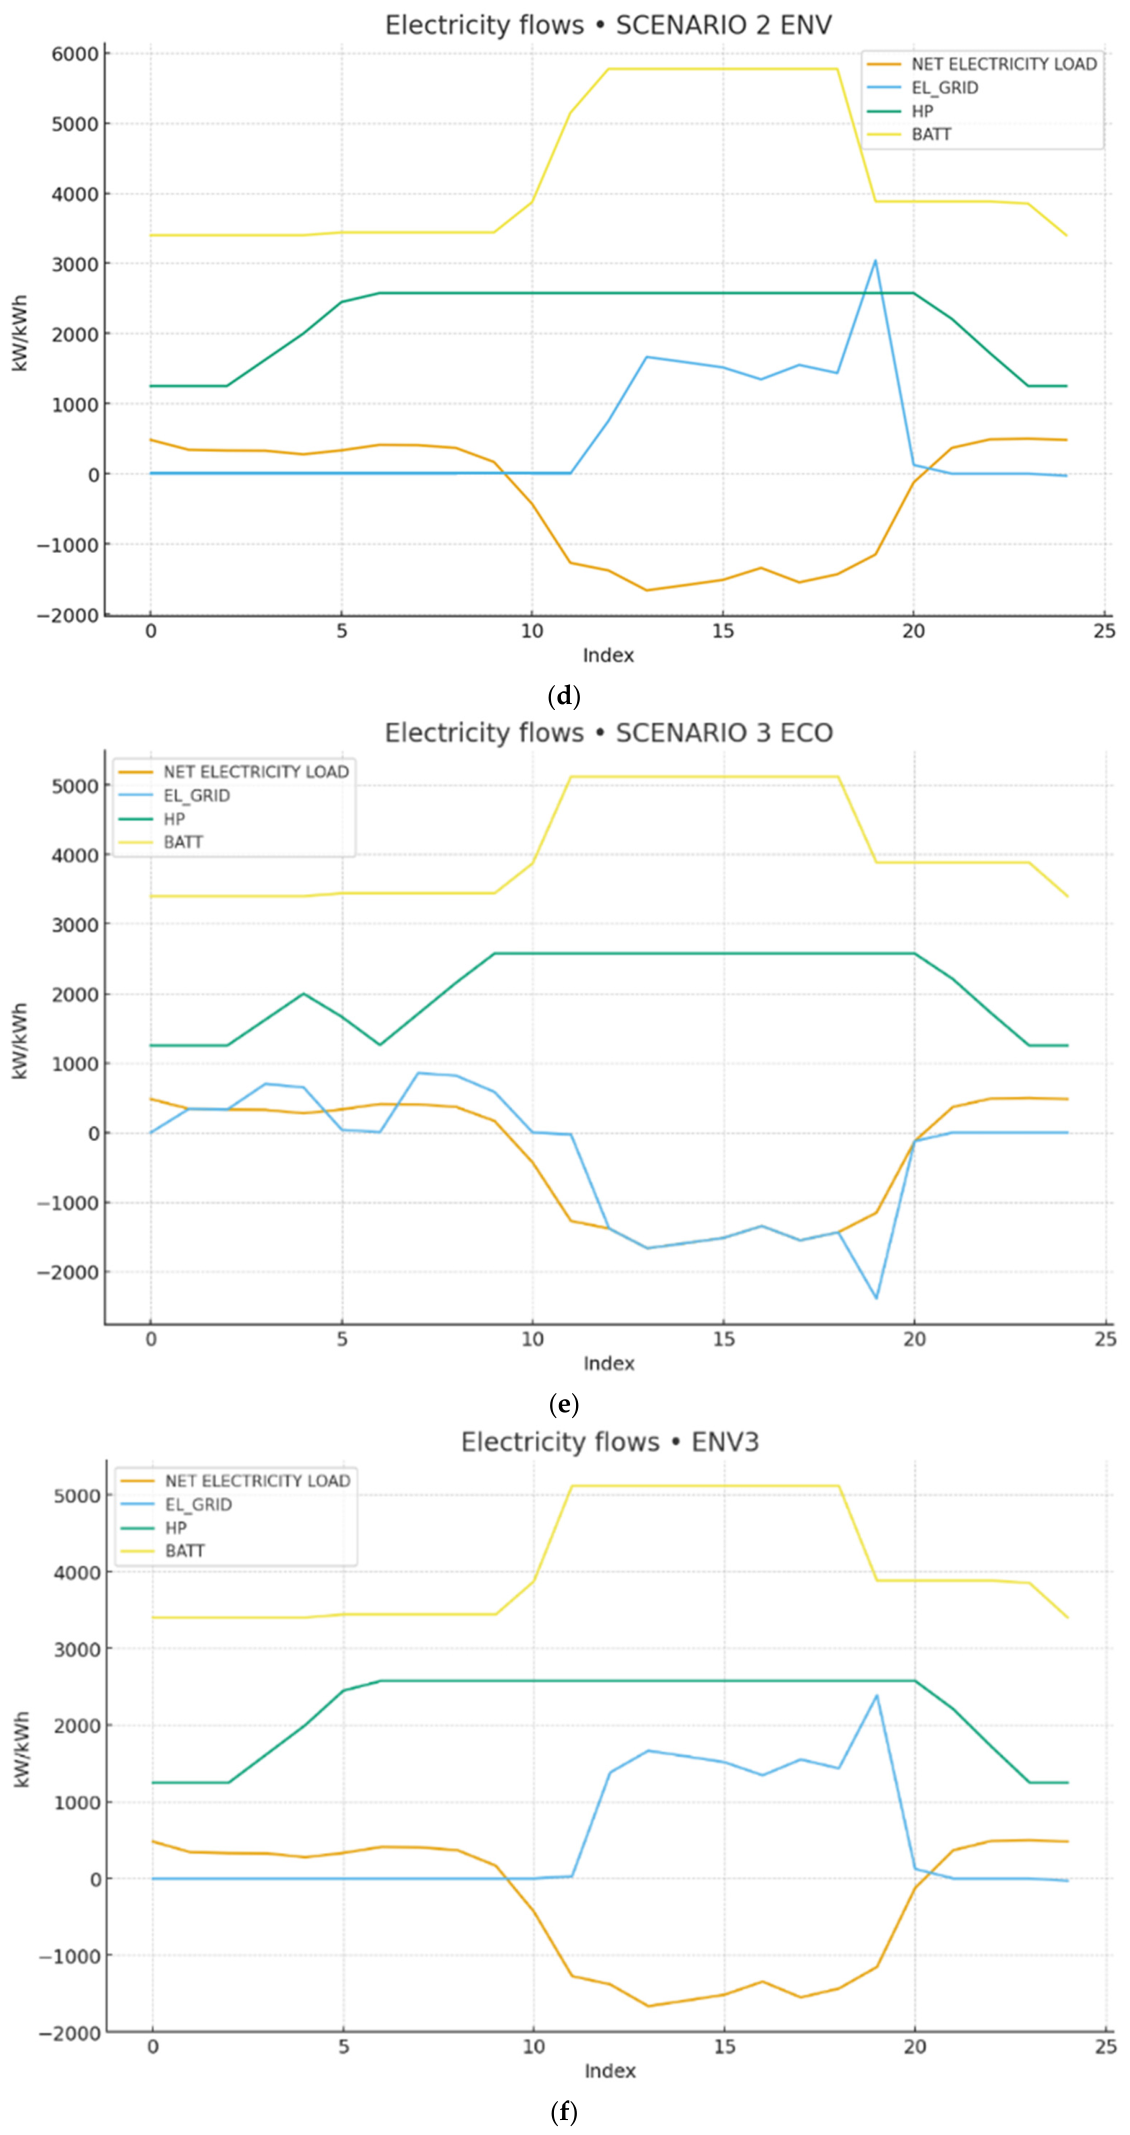
The following charts (Figure 5) visually show how self-sufficiency optimizes the use of BAT and PCM, minimizes grid reliance, and increases self-consumption and overall efficiency for the summer day.
The six profiles show two distinct approaches. With the environmental objective (ENV), the system prioritizes self-sufficiency and stability: daytime surplus is directed to export while the battery charges smoothly; during the evening transition, pre-discharge is brought forward, and grid exchange returns to near-zero. With the economic objective (ECO), dispatch follows the price signal: midday imports increase, discharge is postponed, and the evening return features more pronounced peaks. Operationally, ECO cases exhibit greater grid dependence and lower self-consumption than their ENV counterparts.
In the first scenario the difference is exemplary. The ENV trace shows the battery rising to a plateau during the central hours, negative EL_grid due to export, and timely discharge at the end of the window; the evening profile is free of discontinuities. In the same context, the ECO profile alternates charging and discharging around price signals, with less clear export and an import peak between 19:00 and 20:00. The divergence is not driven by demand but by the timing of storage control.
In the second scenario the contrast widens. ECO executes more aggressive arbitrage, increases imports in the central band, and releases late, generating a significant evening spike. ENV, by contrast, maintains continuous export, linear battery charging, and progressive pre-discharge that allows an orderly evening landing. A pre-discharge policy integrated with the thermal profile appears decisive for the resilience of the electrical profile.
In the third scenario we see the limiting case. The ECO profile records a very negative net load from late morning through afternoon without a timely start of pre-discharge; the result is the highest import peak of the entire set. The ENV profile, by contrast, sustains structured export, disciplined accumulation, and early release that closes the grid curve around zero. The causal link between managing the surplus window and the quality of the evening transition is evident.
Across scenarios, the thermal subsystem plays an enabling role. PCM systematically covers demand in the 14:00–18:00 window, the boiler remains marginal, and the Heat Pump provides the base. This configuration frees the battery from competing thermal needs and allows it to be used almost exclusively for electrical control. In ENV cases, synchronization between PCM and BAT is tighter: PCM flattens demand precisely while storage is charging; BAT discharges when the electrical profile rises. In ECO cases, this coordination is weaker, and price reactivity dominates.
The managerial implications are straightforward. If the driver is sustainability and profile regularity, the ENV approach is coherent because it maximizes self-consumption, minimizes exchanges, and reduces peaks. If the driver is opportunistic cost reduction, the ECO approach can create margin in the central hours but requires operational constraints to avoid shifting costs into evening peaks. In both cases, the link between the surplus window and the evening ramp is the control point: use daytime hours not only to export and charge, but to deliberately set up the pre-discharge that precedes the ramp, keeping PCM as the buffer.
In conclusion, the charts converge on one finding: the quality of the evening transition and the degree of grid dependence are functions of BAT–PCM coordination more than of intrinsic demand. The ENV scenarios show that early pre-discharge and orderly thermal management enable high self-sufficiency and stable electrical profiles; the ECO scenarios require refined dispatch rules to avoid undermining the economic benefit with capacity penalties and lower overall efficiency.
A joint read of the charts and KPIs yields a clear conclusion: the economic gap between ENV and ECO is driven almost entirely by electrical dispatch. Thermal is essentially neutral, and the battery does not change the story. In ENV profiles the grid balance is structurally net-export, with contained ∑import and moderate import peaks. In ECO the logic favors mid-window imports: exports drop sharply, purchased energy rises, and import peaks reach levels that hit both OPEX and potential demand charges. The difference is not demand volume: average net load, minima, and maxima are aligned, indicating the lever is grid exchange policy, not demand.
On thermal, the two modes converge: coverage is PCMt-dominant with the boiler marginal. No variations emerge that explain cost deltas. The battery follows the same SoC trajectory with identical maxima; no differential charge/discharge strategy is evident to justify the economic delta. The real driver is EL_GRID: more import and higher peaks in ECO, more export and lower draws in ENV.
In risk-return terms, ECO carries higher price volatility and possible capacity charges from peaks. ENV remains favorable only as long as export remuneration is not materially discounted versus import price; with a sell-side haircut, margin narrows but does not vanish, while ECO worsens. The operating synthesis is straightforward: if the objective is net cost minimization, constrain ECO with an import cap and reschedule the battery for peak shaving; if the objective is independence and a lower carbon footprint, ENV is coherent, but protect it with a minimum export price threshold and first guarantee local load coverage. In both cases, retime the Heat Pump toward low-price hours to raise effective COP and reduce subsequent grid reliance.
Self-sufficiency almost completely reduces interaction with the power grid and gas use, while the normal Base scenario shows more significant grid flows.
  • BAT and PCM management becomes more active under self-sufficiency; the BAT covers all electrical peaks, and the PCM optimizes thermal demand, preventing boiler activation.
  • The HP keeps its constant baseline role in both scenarios, but in self-sufficient mode it works more tightly with BAT and PCM to maximize self-consumption and efficiency.
  • Self-sufficiency ensures better synchronization between electricity production, storage, and demand, lowering operating costs and improving overall sustainability.
  • The self-sufficient EL profile tracks daily demand more closely than the Base, better synchronizing production and consumption.
  • Under self-sufficiency the BAT is more active and consistently used to cover electrical peaks, while in the normal Base it shows smaller swings and does not always fully cover peaks.
  • Under self-sufficiency the EL_GRID line is essentially zero, while in the normal Base scenario it shows small imports/exports, indicating greater grid dependence.

4.1.1. PCM Results

The ESS specifications are summarized in Table 15 and refer to a single module. To assess the impact of hybrid storage configurations on the Renewable Energy Cost (REC), three variants were defined (Table 16). In each case, the counts of PCM and battery modules vary while keeping CAPEX and OPEX as closely aligned as possible. The goal is to make explicit trade-offs between electrical and thermal storage in the REC context. Each variant is evaluated under two objective functions: self-sufficiency and economics. The economic case minimizes total energy cost; the self-sufficiency case minimizes energy imported from the grid.
Table 17 reports on the economic KPIs—CAPEX, LCOE, and OPEX. The upfront capital requirement is 757.65 €/kWh, reflecting an investment sized for full energy self-sufficiency. The LCOE is 0.097 €/kWh, and the operating cost is €1.54/kW, indicating financial viability. Table 18 compares system performance when targeting self-sufficiency versus cost efficiency. The KPIs shown are averages over the two days analyzed.
Across all scenarios, the PCM solution (option C) shows that flexibility factor remains relatively stable, ranging between 0.62 and 0.65, indicating that flexibility is not a major differentiator in this comparison. More significant variations are observed in efficiency and CO2 emission reduction. It is observed that Scenario 1 (economic) shows the lowest efficiency (0.89) and minimal emissions reduction (0.25 kg/kWh), suggesting it is the least favorable configuration among the three. In contrast, Scenario 2 (environmental) offers strong overall performance, with high efficiency (0.95) and the greatest CO2 emission reduction (0.46 kg/kWh). Additionally, Scenario 3 (self-efficiency) achieves the highest efficiency (0.98) while maintaining a moderate average of emissions reduction (0.40 kg/kWh), making it suitable for performance-driven applications. Finally, the LCOE remains constant at 0.098–0.099 €/kWh across all scenarios, suggesting that this difference in battery and PCM module configurations does not significantly affect the overall cost of electricity generation.

4.1.2. Other Considerations

Similar considerations can be extended to options A and B, as summarized in Table 18. Overall, the comparison does not support a single technology option as universally superior across all KPIs; rather, each option performs better under specific operating priorities.
Option A shows the highest value in terms of electrical yield and is associated with the highest-temperature CSP configuration with direct two-tank TES. In Table 18, this option reaches CO2 reduction values up to 0.41 kg/kWh under the environmental objective, but it is also characterized by the highest LCOE among the three options, around 0.103–0.104 €/kWh, and by higher peak-import ranges under the economic target.
Option B represents an intermediate solution. Its efficiency remains relatively stable around 0.92–0.93, while CO2 reduction ranges between 0.34 and 0.45 kg/kWh depending on the optimization target. Its LCOE remains in an intermediate range, around 0.101–0.102 €/kWh, confirming that this option provides a compromise between electrical performance and system flexibility.
Option C emerges as the most favorable configuration when the focus is on thermal buffering and self-sufficiency-oriented operation. In Table 18, it shows the lowest or joint-lowest LCOE, about 0.098–0.099 €/kWh, the highest efficiency under the self-sufficiency target (0.98), and the strongest CO2 reduction under the environmental target (0.46 kg/kWh). These results indicate that option C is particularly suitable when the priority is to enhance system flexibility, reduce peak imports, and strengthen the coordination between battery storage, PCM thermal storage, and grid interaction.
Therefore, the comparison suggests a differentiated ranking: option A is preferable when electrical yield and high-temperature direct TES performance are the main priorities; option B provides an intermediate and balanced solution; and option C is the most suitable option for thermal buffering, stable low-LCOE operation, and self-sufficiency-oriented strategies. This interpretation is more consistent with the KPI evidence reported in Table 18 than an overall absolute ranking.
In all cases, controlling the day–evening cycle (pre-discharge 16:00–18:00, export price thresholds, import cap) is the lever that converts the CSP+PV+HESS stack into robust KPIs without extra CAPEX.
With the environmental (ENV) target, the system prioritizes self-consumption and stability: continuous export in central hours, linear BESS charging, early pre-discharge late afternoon, and an evening ramp without discontinuities. With the economic (ECO) target, logic follows price: more frequent midday imports, delayed release, and sharper evening import peaks. The delta is not driven by intrinsic demand but by storage control timing.
The PCM systematically covers the 14:00–18:00 window, makes the boiler marginal, and leaves the BESS with an almost purely electrical role. Coordination is tighter in ENV—PCM → thermal smoothing and BESS → pre-discharge—while ECO is more price-reactive. This thermal–electrical coupling drives the quality of the evening transition and the degree of grid dependence.
Self-sufficiency. Enabling the self-sufficiency policy (min import) collapses grid exchange and makes gas residual. EL_GRID ≈ 0, a more active BESS on electrical peaks, and a PCM that optimizes thermal demand yield daily profiles closer to the load and higher overall efficiency.
Governing the midday surplus window as preparation for the evening “landing” is the lever: a minimum price threshold for noon export, an import cap, BESS pre-discharge at 16:00–18:00, and HP retiming in low-price hours with the PCM as an afternoon buffer. This closes profiles with minimal peaks, stable LCOE, and robust environmental KPIs without extra CAPEX.
A further methodological point concerns the treatment of uncertainty. In the present study, uncertainty in exogenous variables, such as renewable generation and electricity prices, is not explicitly represented within the MILP formulation through stochastic or robust optimization techniques. Instead, these variables are incorporated indirectly through forecast-based or representative input data. This modelling choice is consistent with the comparative purpose of the analysis and with the use of representative seasonal days, although future work may extend the framework by explicitly integrating uncertainty-aware optimization methods.

5. Conclusions

This research analyzed, through an MILP-based multi-objective framework, the impact of hybrid thermal and electrical energy storage solutions within a grid-connected Microgrid integrating PV and CSP technologies for both heat and electricity production. In the proposed architecture, the distribution grid acts as a virtual storage medium for hourly balancing, while the optimization model identifies the most suitable technology mix and operating strategy by jointly accounting for economic and environmental objectives.
Parabolic trough technology was selected because it represents the most mature CSP solution, is modular, and can simultaneously support heat and power production. Since the plant considered in this work is smaller than typical commercial CSP facilities, only a portion of the plant was modelled for Microgrid-scale applications. Three CSP configurations were assessed, differing in heat transfer fluid and thermal storage layout: molten salt with direct two-tank TES, thermal oil with indirect two-tank TES, and thermal oil coupled with PCM TES to exploit latent heat storage.
The operational analysis was performed through an hourly MILP optimization over four representative seasonal days, balancing cost and CO2 emissions by means of a weighting factor ω. The formulation includes electrical and thermal balances, storage dynamics, component operating limits, and economic terms such as CAPEX and OPEX. Within this framework, KPIs were used to assess the technical, economic, and environmental implications of hybrid energy storage deployment in distributed energy systems.
The results identify feasible technology portfolios and operating strategies compared with baseline cases, providing decision-support indications based on storage configuration, temperature level, and demand profile.
A key outcome of the study is that the comparison among options A, B, and C does not support the identification of a universally superior configuration. Rather, the results highlight a set of KPI-dependent trade-offs. Option A, based on CSP with direct two-tank molten-salt TES, is the most suitable when the priority is to maximize the electrical contribution of the CSP subsystem and strengthen CO2-abatement performance. Option B, based on CSP with indirect two-tank TES, represents an intermediate pathway, preserving the main advantages of sensible-heat storage while introducing a moderate conversion penalty. Option C, based on CSP with PCM TES, is less favorable when electrical output is the dominant KPI, but it is the most suitable when thermal buffering, self-sufficiency-oriented operation, stable low-LCOE performance, and reduced peak imports/grid dependence are prioritized.
The analysis of typical summer and winter days confirms that system behavior is strongly season-dependent. In summer, the system benefits from midday surplus generation, which enables battery charging and export to the grid, while TES covers thermal demand and facilitates a smoother evening transition. In winter, the system is mainly constrained by high and persistent thermal demand; under these conditions, TES plays a strategic support role, but the boiler and grid imports remain necessary to ensure supply adequacy. Across both seasons, the quality of system performance is largely determined by the coordination between battery operation and thermal storage management.
The comparison between environmental and economic dispatch objectives further shows that the main performance gap is driven less by demand volume than by storage control strategy and timing of grid interaction. Environmental optimization favors self-sufficiency, smoother charging/discharging behavior, and lower peak imports. Economic optimization, by contrast, tends to exploit price-based arbitrage more aggressively, which may increase grid dependence and evening import peaks. In this respect, the coordination between BAT and TES emerges as the main operational lever for converting system flexibility into improved KPIs without requiring additional CAPEX.
Overall, the main contribution of this work is not the identification of a single best-performing option, but the demonstration that different CSP–TES couplings become preferable under different planning priorities. Option A is preferable when electrical performance and CO2 mitigation are the primary targets; option B provides a balanced compromise; and option C is preferable when thermal stability, lower LCOE, self-sufficiency-oriented operation, and reduced grid dependence are the dominant objectives. This makes the proposed framework particularly relevant for decision-making in Microgrid design, where economic, environmental, and operational autonomy objectives may lead to different optimal technology choices.

Author Contributions

Conceptualization, G.F. and R.L.; methodology, G.F. and R.L.; validation, G.F. and R.L.; formal analysis, G.F. and R.L.; investigation, G.F. and R.L.; data curation, G.F. and R.L.; writing—original draft preparation, G.F.; writing—review and editing, R.L.; funding acquisition, R.L. All authors have read and agreed to the published version of the manuscript.

Funding

This research was funded by the European Union—Next Generation EU—National Recovery and Resilience Plan (PNRR)—Mission 4—Component 2—Investment 1.3—Notice no. 341 of 15 March 2022—of the Italian Ministry of University and Research (MUR).

Data Availability Statement

The data presented in this study are available upon request from the corresponding author, as they are not publicly available due to privacy concerns.

Conflicts of Interest

The authors declare no conflicts of interest.

Abbreviations

The following abbreviations are used in this manuscript:
AmbEnvironment
A P V j Installed area of PV (m2)
ACAlternating Current
BATBattery
C E n e r g y Total annual energy cost (€)
C I N V Total annualized investments cost (€)
C O & M Total annual O&M cost (€)
C T o t Total annual cost (€)
C a p B a t j Capacity of battery (kWh)
BESSBattery Energy Storage System
cConstant in Fobj (kg CO2/€)
CAPEXCapital Expenditure
charCharge
CHPCombined Heat and Power
CO2Carbon Dioxide
coibThermal insulator
COPCoefficient of Performance
C O P H P H M COP of Heat Pump in heating mode
C c , i Specific capital cost (€/kW)–(€/kWh)–(€/m2)
CSPConcentrating Solar Power
CSTConcentrating Solar Thermal
CTOTSum of the total cost
DIndex of representative season day
DCDirect Current
DERDistributed Energy Resource
DODDepth of Discharge
discDischarge
DtLength of the time interval (1 h)
E B a t j , d , h r C h Charging power for battery (kW)
E B a t j , d , h r D i s c h , m a x Maximum discharging power of battery (dependent variable) (kW)
E B a t j , d , h r D i s c h Discharging power for battery (kW)
E C H P   N G I C E j , d , h r Power provided by CHP NG ICE (kW)
E P G j , d , h r Grid power (kW)
E P V j , d , h r Power provided by PV (kW)
ECOEconomic Objective
EESElectrical Energy Storage
E d e m , u , d , h r Time-varying power demand of mEH (kW)
E n v N G Total annual CO2 emission related to gas consumption (kg CO2)
E n v P G Total annual CO2 emission related to grid power consumption (kg CO2)
E n v T o t Total annual CO2 emissions (kg CO2)
EL_gridElectricity from/and in the main distribution grid
ENVEnvironmental
F o b j Objective function of the multi-objective optimization problem
H T E S T h j , d , h r D i s c h Discharging heat rate from TES (kW)
H T E S T h j , d , h r C h Charging heat rate to TES (kW)
H H P j , d , h r Heat rate provided by the Heat Pump (kW)
H N G B o i l e r j , d , h r Heat rate provided by natural gas boiler (kW)
HMHeating Mode
HrIndex of hour in representative season day
HESSHybrid Energy Storage System
HPHeat Pump
H T E S T h j , d , h r Thermal energy stored in TES (kWh)
HTFHeat Transfer Fluid
IIndex of technology
I d , h r Hourly solar irradiance (kW/m2)
inInlet
JIndex of powerplant
KNO3Potassium Nitrate
KPIKey Performance Indicator
LCOELevelized Cost of Electricity
LFRLinear Fresnel Reflector
LHTESLatent Heat Thermal Energy Storage
LHVLow Heating Value
maxMaximum
minMinimum
MGMicrogrid
MILPMixed Integer Linear Programming
NaNO3Sodium nitrate
O&MOperation and maintenance
O M i Specific O&M cost (€/kWh)
OPEXOperating Expenditure
ORCOrganic Rankine Cycle
outOutlet
PCMPhase Change Material
P r N G , d Natural gas price (€/N m3)
P r P G , d , h r Time-varying unit price of grid power (€/kWh)
PTCParabolic Trough Collector
PVPhotovoltaic
RInterest rate
R i , j , d , h r Generation level (kW)—(kWh)
RECRenewable Energy Community
SCSpace cooling purposes
SDSolar Dish
SHTESSensible Heat Thermal Energy Storage
SOCState of Charge
S O C B a t j m a x Maximum SOC battery (dependent variable)
S O C B a t j m i n Minimum SOC battery (dependent variable)
S O C B a t j , d , h r Battery SOC
STSolar Thermal
STSSolar Tower
TESThermal Energy Storage
ThThermal purposes
TOThermal Oil
x B a t j , d , h r C h Binary variable for usage of battery for charging process
x B a t j , d , h r D i s c h Binary variable for usage of battery for discharging process
η B a t C h Efficiency of charging process for battery
η B a t D i s Efficiency of discharging process for battery
η P V Electric efficiency of PV
η e , C H P   N G I C E Electric efficiency of CHP NG ICE
η t h , C H P   N G I C E Thermal efficiency of CHP NG ICE
φ T E S T h TES storage loss fraction
ω Weight value in Fobj

References

  1. Rahman, M.; Olufemi Oni, A.; Gemechu, E.; Kumar, A. Assessment of energy storage technologies: A review. Energy Convers. Manag. 2020, 223, 113295. [Google Scholar] [CrossRef] [Scilit]
  2. IEA. World Energy Outlook 2023. 2023. Available online: https://origin.iea.org/reports/world-energy-outlook-2023 (accessed on 22 September 2023).
  3. Leonard, M.D.; Michaelides, E.E.; Michaelides, D.N. Energy storage needs for the substitution of fossil fuel power plants with renewables. Renew. Energy 2020, 145, 951–962. [Google Scholar] [CrossRef] [Scilit]
  4. Arce, P.; Medrano, M.; Gil, A.; Oró, E.; Cabeza, L.F. Overview of thermal energy storage (TES) potential energy savings and climate change mitigation in Spain and Europe. Appl. Energy 2015, 88, 2764–2774. [Google Scholar] [CrossRef] [Scilit]
  5. Cabeza, L.F.; Miró, L.; Oró, E.; de Garcia, A.; Martin, V.; Kronauer, A. CO2 mitigation accounting for thermal energy storage (TES) case studies. Appl. Energy 2015, 155, 365–377. [Google Scholar] [CrossRef] [Scilit]
  6. STOrage Research Infrastructure Eco-System. Available online: https://cordis.europa.eu/project/id/101036910 (accessed on 16 March 2026).
  7. Blanco, M.; Tajalli, S.Z.; Krishnamurthi, S.; Ferruzzi, G.; Liberatore, R.; Nájera, J.; Heussen, K. Benchmarking of Hybrid Thermal and Electrical Storage for Renewable Energy Communities. In Hybrid Energy Storage—Case Studies for the Energy Transition; Hybrid Energy Storage: Case Studies for the Energy Transition; Springer: Berlin/Heidelberg, Germany, 2025; Chapter 9. [Google Scholar]
  8. Cabeza, L.F. (Ed.) Advances in thermal energy storage systems: Methods and applications. In Advances in Thermal Energy Storage Systems, 2nd ed.; Woodhead Publishing Series in Energy; Woodhead Publishing: London, UK, 2021; Chapter 2; pp. 37–54. [Google Scholar] [CrossRef] [Scilit]
  9. Arteconi, A.; Hewitt, N.J.; Polonara, F. State of the art of thermal storage for demand-side management. Appl. Energy 2012, 93, 371–389. [Google Scholar] [CrossRef] [Scilit]
  10. González-Portillo, L.F.; Muñoz-Antón, J.; Martínez-Val, J.M. An analytical optimization of thermal energy storage for electricity cost reduction in solar thermal electric plants. Appl. Energy 2017, 185, 531–546. [Google Scholar] [CrossRef] [Scilit]
  11. Jacob, R.; Belusko, M.; Fernández, A.I.; Cabeza, L.F.; Samana, W.; Bruno, F. Embodied energy and cost of high temperature thermal energy storage systems for use with concentrated solar power plants. Appl. Energy 2016, 180, 586–597. [Google Scholar] [CrossRef] [Scilit]
  12. Wagner, S.J.; Rubin, E.S. Economic implications of thermal energy storage for concentrated solar thermal power. Renew. Energy 2014, 61, 81–95. [Google Scholar] [CrossRef] [Scilit]
  13. Kuravi, S.; Trahan, J.; Goswami, D.Y.; Rahman, M.M.; Stefanakos, E.K. Thermal energy storage technologies and systems for concentrating solar power plants. Prog. Energy Combust. Sci. 2013, 39, 285–319. [Google Scholar] [CrossRef] [Scilit]
  14. Liu, M.; Tay, N.H.S.; Bell, S.; Belusko, M.; Jacob, R.; Will, G.; Saman, W.; Bruno, F. Review on concentrating solar power plants and new developments in high temperature thermal energy storage technologies. Renew. Sustain. Energy Rev. 2016, 53, 1411–1432. [Google Scholar] [CrossRef] [Scilit]
  15. Miró, L.; Gasia, J.; Cabeza, L.F. Thermal energy storage (TES) for industrial waste heat (IWH) recovery: A review. Appl. Energy 2016, 179, 284–301. [Google Scholar] [CrossRef] [Scilit]
  16. Renaldi, R.; Kiprakis, A.; Friedrich, D. An optimisation framework for thermal energy storage integration in a residential heat pump heating system. Appl. Energy 2017, 186, 520–529. [Google Scholar] [CrossRef] [Scilit]
  17. Alimohammadisagvand, B.; Jokisalo, J.; Kilpeläinen, S.; Ali, M.; Sirén, K. Cost-optimal thermal energy storage system for a residential building with heat pump heating and demand response control. Appl. Energy 2016, 174, 275–287. [Google Scholar] [CrossRef] [Scilit]
  18. Cabeza, L.F.; de Gracia, A.; Zsembinszki, G.; Borri, E. Perspectives on thermal energy storage research. Energy 2021, 231, 120943. [Google Scholar] [CrossRef] [Scilit]
  19. Beck, A.; Sevault, A.; Drexler-Schmid, G.; Schöny, M.; Kauko, H. Optimal Selection of Thermal Energy Storage Technology for Fossil-Free Steam Production in the Processing Industry. Appl. Sci. 2021, 11, 1063. [Google Scholar] [CrossRef] [Scilit]
  20. Alva, G.; Lin, Y.; Fang, G. An overview of thermal energy storage systems. Energy 2018, 144, 341–378. [Google Scholar] [CrossRef] [Scilit]
  21. Therkelsen, P.; McKane, A. Implementation and rejection of industrial steam system energy efficiency measures. Energy Policy 2013, 57, 318–328. [Google Scholar] [CrossRef] [Scilit]
  22. Rathgeber, C.; Lävemann, E.; Hauer, A. Economic top–down evaluation of the costs of energy storages—A simple economic truth in two equations. J. Energy Storage 2015, 2, 436. [Google Scholar] [CrossRef] [Scilit]
  23. Halmschlager, D.; Beck, A.; Knöttner, S.; Koller, M.; Hofmann, R. Combined optimization for retrofitting of heat recovery and thermal energy supply in industrial systems. Appl. Energy 2022, 305, 117820. [Google Scholar] [CrossRef] [Scilit]
  24. Alva, G.; Liu, L.; Huang, X.; Fang, G. Thermal energy storage materials and systems for solar energy applications. Renew. Sustain. Energy Rev. 2017, 68, 693–706. [Google Scholar] [CrossRef] [Scilit]
  25. Paul, A.; Holy, F.; Textor, M.; Lechner, S. High temperature sensible thermal energy storage as a crucial element of Carnot Batteries: Overall classification and technical review based on parameters and key figures. J. Energy Storage 2022, 56, 106015. [Google Scholar] [CrossRef] [Scilit]
  26. Ibrahim, N.I.; Al-Sulaiman, F.A.; Rahman, S.; Yilbas, B.S.; Sahin, A.Z. Heat transfer enhancement of phase change materials for thermal energy storage applications: A critical review. Renew. Sustain. Energy Rev. 2017, 74, 26–50. [Google Scholar] [CrossRef] [Scilit]
  27. Elfeky, K.E.; Mohammed, A.G.; Wang, Q. Thermal Performance Evaluation of Combined Sensible-Latent Heat Storage Tank with a Different Storage Medium. Chem. Eng. Trans. 2022, 94, 1267–1272. [Google Scholar] [CrossRef]
  28. Ahmed, N.; Elfeky, K.E.; Lu, L.; Wang, Q.W. Thermal and economic evaluation of thermocline combined sensible-latent heat thermal energy storage system for medium temperature applications. Energy Convers. Manag. 2019, 189, 14–23. [Google Scholar] [CrossRef] [Scilit]
  29. Rahman, K.H.U.; Rahman, M.M. A review of temperature combined sensible/latent heat storage systems. In Proceedings of the 191st The IIER International Conference, Tokyo, Japan, 26–27 September 2018. [Google Scholar]
  30. Geissbühler, L.; Kolman, M.; Zanganeh, G.; Haselbacher, A.; Steinfeld, A. Analysis of industrial-scale high-temperature combined sensible/latent thermal energy storage. Appl. Therm. Eng. 2016, 101, 657–668. [Google Scholar] [CrossRef] [Scilit]
  31. Frazzica, A.; Manzan, M.; Sapienza, A.; Freni, A.; Toniato, G.; Restuccia, G. Experimental testing of a hybrid sensible-latent heat storage system for domestic hot water applications. Appl. Energy 2016, 183, 1157–1167. [Google Scholar] [CrossRef] [Scilit]
  32. Frazzica, A.; Manzan, M.; Palomba, V.; Brancato, V.; Freni, A.; Pezzi, A.; Vaglieco, B.M. Experimental Validation and Numerical Simulation of a Hybrid Sensible-Latent Thermal Energy Storage for Hot Water Provision on Ships. Energies 2022, 15, 2596. [Google Scholar] [CrossRef] [Scilit]
  33. Zauner, C.; Hengstberger, F.; Mörzinger, B.; Hofmann, R.; Walter, H. Experimental characterization and simulation of a hybrid sensible-latent heat storage. Appl. Energy 2017, 189, 506–519. [Google Scholar] [CrossRef] [Scilit]
  34. Liu, M.; Riahi, S.; Jacob, R.; Belusko, M.; Bruno, F. Design of sensible and latent heat thermal energy storage systems for concentrated solar power plants: Thermal performance analysis. Renew. Energy 2020, 151, 1286–1297. [Google Scholar] [CrossRef] [Scilit]
  35. Zhang, S.; Li, Y.; Yan, Y. Hybrid sensible-latent heat thermal energy storage using natural stones to enhance heat transfer: Energy, exergy, and economic analysis. Energy 2024, 286, 129530. [Google Scholar] [CrossRef] [Scilit]
  36. Ahmed, N.; Elfeky, K.E.; Qaisrani, M.A.; Wang, Q.W. Numerical characterization of thermocline behavior of combined sensible-latent heat storage tank using brick manganese rod structure impregnated with PCM capsules. Sol. Energy 2019, 180, 243–256. [Google Scholar] [CrossRef] [Scilit]
  37. Nallusamy, N.; Velraj, R. Numerical and Experimental Investigation on a Combined Sensible and Latent Heat Storage Unit Integrated With Solar Water Heating System. J. Sol. Energy Eng. ASME 2009, 131, 041002-1. [Google Scholar] [CrossRef] [Scilit]
  38. Zahid, M.S.; Ahmed, N.; Qaisrani, M.A.; Mahmood, M.; Ali, M.; Waqas, A.; Assadi, M. Charging and discharging characterization of a novel combined sensible-latent heat thermal energy storage system by experimental investigations for medium temperature applications. J. Energy Storage 2022, 55, 105612. [Google Scholar] [CrossRef] [Scilit]
  39. Ahmed, N.; Elfeky, K.E.; Lu, L.; Wang, Q.W. Thermal performance analysis of thermocline combined sensible-latent heat storage system using cascaded-layered PCM designs for medium temperature applications. Renew. Energy 2020, 152, 684–697. [Google Scholar] [CrossRef] [Scilit]
  40. Becattini, V.; Haselbacher, A. Toward a new method for the design of combined sensible/latent thermal energy storage using non-dimensional analysis. Appl. Energy 2019, 247, 322–334. [Google Scholar] [CrossRef] [Scilit]
  41. Kasper, L.; Pernsteiner, D.; Schirrer, A.; Jakubek, S.; Hofmann, R. Experimental characterization, parameter identification and numerical sensitivity analysis of a novel hybrid sensible/latent thermal energy storage prototype for industrial retrofit applications. Appl. Energy 2023, 344, 121300. [Google Scholar] [CrossRef] [Scilit]
  42. Becattini, V.; Geissbühler, L.; Zanganeh, G.; Haselbacher, A.; Steinfeld, A. Pilot-scale demonstration of advanced adiabatic compressed air energy storage, Part 2: Tests with combined sensible/latent thermal-energy storage. J. Energy Storage 2018, 17, 140–152. [Google Scholar] [CrossRef] [Scilit]
  43. Laing, D.; Bahl, C.; Bauer, T.; Lehmann, D.; Steinmann, W.D. Development of a Thermal Energy Storage System for Parabolic Trough Power Plants With Direct Steam Generation. Sol. Energy 2011, 85, 627–633. [Google Scholar] [CrossRef] [Scilit]
  44. Stückle, A.; Laing, D.; Müller-Steinhagen, H. Numerical Simulation and Experimental Analysis of a Modular Storage System for Direct Steam Generation. Heat Transf. Eng. 2014, 35, 812–821. [Google Scholar] [CrossRef] [Scilit]
  45. Liberatore, R.; Nana, F.; Cardamone, S.; Passera, T.; Carnelli, L.; Russo, V.; Miliozzi, A.; Nicolini, D.; Petroni, G.; Gaggioli, W. JCA Eni ENEA Project: CSP & Thermal Storage. SolarPACES Conf. Proc. 2024, 3. [Google Scholar] [CrossRef] [Scilit]
  46. Miliozzi, A.; Dominici, F.; Candelori, M.; Veca, E.; Liberatore, R.; Nicolini, D.; Torre, L. Development and characterization of concrete/PCM/diatomite composites for thermal energy storage in CSP/CST applications. Energies 2021, 14, 4410. [Google Scholar] [CrossRef] [Scilit]
  47. Dominici, F.; Miliozzi, A.; Torre, L. Thermal Properties of Shape-Stabilized Phase Change Materials Based on Porous Supports for Thermal Energy Storage. Energies 2021, 14, 7151. [Google Scholar] [CrossRef] [Scilit]
  48. Mehling, H.; Cabeza, L.F. Heat and Cold Storage with PCM; Springer: Berlin/Heidelberg, Germany, 2008. [Google Scholar] [CrossRef] [Scilit]
  49. Dincer, I.; Rosen, M. Thermal Energy Storage: Systems and Applications; John Wiley & Sons: Hoboken, NJ, USA, 2002. [Google Scholar]
  50. Bista, S.; Hosseini, S.E.; Owens, E.; Phillips, G. Performance improvement and energy consumption reduction in refrigeration systems using phase change material (PCM). Appl. Therm. Eng. 2018, 142, 723–735. [Google Scholar] [CrossRef] [Scilit]
  51. Zalba, B.; Marín, J.M.; Cabeza, L.F.; Mehling, H. Review on thermal energy storage with phase change: Materials, heat transfer analysis and applications. Appl. Therm. Eng. 2003, 23, 251–283. [Google Scholar] [CrossRef] [Scilit]
  52. Nguyen, T.T.; Martin, V.; Malmquist, A.; Silva, C.A. A review on technology maturity of small scale energy storage technologies. Renew. Energy Environ. Sustain. 2017, 2, 36. [Google Scholar] [CrossRef] [Scilit]
  53. Cabeza, L.F.; Martorell, I.; Miró, L.; Fernández, A.I.; Barreneche, C.; Cabeza, L.F.; Fernández, A.I.; Barreneche, C. Introduction to thermal energy storage systems. In Advances in Thermal Energy Storage Systems, 2nd ed.; Cabeza, L.F., Ed.; Woodhead Publishing Series in Energy; Woodhead Publishing: London, UK, 2021; Chapter 1; pp. 1–33. [Google Scholar] [CrossRef] [Scilit]
  54. Merlin, K.; Delaunay, D.; Soto, J.; Traonvouez, L. Heat transfer enhancement in latent heat thermal storage systems: Comparative study of different solutions and thermal contact investigation between the exchanger and the PCM. Appl. Energy 2016, 166, 107–116. [Google Scholar] [CrossRef] [Scilit]
  55. Yang, X.; Lu, Z.; Bai, Q.; Zhang, Q.; Jin, L.; Yan, J. Thermal performance of a shell-and-tube latent heat thermal energy storage unit: Role of annular fins. Appl. Energy 2017, 202, 558–570. [Google Scholar] [CrossRef] [Scilit]
  56. Augspurger, M.; Choi, K.; Udaykumar, H. Optimizing fin design for a PCM based thermal storage device using dynamic kriging. Int. J. Heat Mass Transf. 2018, 121, 290–308. [Google Scholar] [CrossRef] [Scilit]
  57. Muhammad, M.; Badr, O. Performance of a finned, latent-heat storage system for high temperature applications. Appl. Therm. Eng. 2017, 116, 799–810. [Google Scholar] [CrossRef] [Scilit]
  58. Mesalhy, O.; Lafdi, K.; Elgafy, A.; Bowman, K. Numerical study for enhancing the thermal conductivity of phase change material (PCM) storage using high thermal conductivity porous matrix. Energy Convers. Manag. 2005, 46, 847–867. [Google Scholar] [CrossRef] [Scilit]
  59. Chieruzzi, M.; Miliozzi, A.; Crescenzi, T.; Kenny, J.M.; Torre, L. Synthesis and Characterization of Nanofluids Useful in Concentrated Solar Power Plants Produced by New Mixing Methodologies for Large-Scale Production. J. Heat Transf. 2018, 140, 42401. [Google Scholar] [CrossRef] [Scilit]
  60. Chieruzzi, M.; Cerritelli, G.F.; Miliozzi, A.; Kenny, J.M.; Torre, L. Heat capacity of nanofluids for solar energy storage produced by dispersing oxide nanoparticles in nitrate salt mixture directly at high temperature. Sol. Energy Mater. Sol. Cells 2017, 167, 60–69. [Google Scholar] [CrossRef] [Scilit]
  61. Alami, A.H.; Olabi, A.G.; Mdallal, A.; Rezk, A.; Radwan, A.; Rahman, S.M.A.; Shah, S.K.; Abdelkareem, M.A. Concentrating solar power (CSP) technologies: Status and analysis. Int. J. Thermofluids 2023, 18, 100340. [Google Scholar] [CrossRef] [Scilit]
  62. Zhang, J.; Gu, M.; Chen, X. Supercapacitors for renewable energy applications: A review. Micro Nano Eng. 2023, 21, 100229. [Google Scholar] [CrossRef] [Scilit]
  63. Bocklisch, T. Hybrid energy storage systems for renewable energy applications. Energy Procedia 2015, 73, 103–111. [Google Scholar] [CrossRef] [Scilit]
  64. Guerrero, J.M.; Vasquez, J.C.; Matas, J.; de Vicuña, L.G.; Castilla, M. Hierarchical control of droop-controlled AC and DC microgrids—A general approach toward standardization. IEEE Trans. Ind. Electron. 2013, 58, 158–172. [Google Scholar] [CrossRef] [Scilit]
  65. Katiraei, F.; Iravani, R.; Lehn, P. Microgrid autonomous operation during and subsequent to islanding process. IEEE Trans. Power Deliv. 2008, 20, 248–257. [Google Scholar] [CrossRef] [Scilit]
  66. Lasseter, R.H. Smart distribution: Coupled microgrids. Proc. IEEE 2011, 99, 1074–1082. [Google Scholar] [CrossRef] [Scilit]
  67. Sasikumar, M.; Seenivasan, S.; Vijayakumar, P.; Manikandan, S. Multi-Objective Energy Management in Microgrids with Hybrid Renewable Energy Sources and Battery Energy Storage Systems Using Hybrid Optimization Algorithm. Trans. Electr. Electron. Mater. 2025. [Google Scholar] [CrossRef] [Scilit]
  68. Khaleel, M.M.A.; Ahmed, A.; Alsharif, A. Energy Management System Strategies in Microgrids: A Review. N. Afr. J. Sci. Publ. (NAJSP) 2023, 1, 1–8. [Google Scholar]
  69. Gabrielli, P.; Gazzani, M.; Martelli, E.; Mazzotti, M. Optimal Design of Multi-Energy Systems with Seasonal Storage. Appl. Energy 2018, 219, 408–424. [Google Scholar] [CrossRef] [Scilit]
  70. Mansoor, M.; Stadler, M.; Zellinger, M.; Lichtenegger, K.; Auer, H.; Cosic, A. Optimal Planning of Thermal Energy Systems in a Microgrid with Seasonal Storage and Piecewise Affine Cost Functions. Energy 2021, 215, 119095. [Google Scholar] [CrossRef] [Scilit]
  71. Li, B.; Roche, R.; Miraoui, A. Microgrid Sizing with Combined Evolutionary Algorithm and MILP Unit Commitment. Appl. Energy 2017, 188, 547–562. [Google Scholar] [CrossRef] [Scilit]
  72. Steen, D.; Stadler, M.; Cardoso, G.; Groissböck, M. Modeling of Thermal Storage Systems in MILP Distributed Energy Resources Models. Appl. Energy 2015, 137, 782–792. [Google Scholar] [CrossRef] [Scilit]
  73. Pérez-Iribarren, E.; González-Pino, I.; Azkorra-Larrinaga, Z.; Odriozola-Maritorena, M.; Gómez-Arriarán, I. A MILP-Based Method for Optimizing the Design and Operation of Space Heating and Domestic Hot Water Hybrid Systems in Residential Buildings. Energy Convers. Manag. 2023, 292, 117326. [Google Scholar] [CrossRef] [Scilit]
  74. Sharma, A.; Tyagi, V.V.; Chen, C.R.; Buddhi, D. Review on Thermal Energy Storage with Phase Change Materials and Applications. Renew. Sustain. Energy Rev. 2009, 13, 318–345. [Google Scholar] [CrossRef] [Scilit]
  75. Wei, F.; Li, Y.; Sui, Q.; Lin, X.; Chen, L.; Chen, Z.; Li, Z. A Novel Thermal Energy Storage System in Smart Buildings Based on Phase Change Material. IEEE Trans. Smart Grid 2019, 10, 2846–2857. [Google Scholar] [CrossRef] [Scilit]
  76. Mühlbauer, A.; Fan, Y.F.; Sambor, D.J.; Jacobson, M.Z. Minimizing the Multi-Decadal Cost of Islanded Renewable-Electricity Microgrids for Different Climate Zones. Smart Energy 2025, 20, 100208. [Google Scholar] [CrossRef] [Scilit]
  77. Gao, K.; Wang, T.; Han, C.; Xie, J.; Ma, Y.; Peng, R. A Review of Optimization of Microgrid Operation. Energies 2021, 14, 2842. [Google Scholar] [CrossRef] [Scilit]
  78. System Advisory Model Realized by National Laboratory of the Rockies (NREL), 15013 Denver West Parkway, Golden, CO 80401 (USA). Available online: https://sam.nrel.gov (accessed on 21 December 2025).
  79. Joint Research Center. Photovoltaic Geographical Information System [Internet]. Available online: https://re.jrc.ec.europa.eu/pvg_tools/it/#TMY (accessed on 21 December 2025).
  80. Miliozzi, A.; Nicolini, D.; Napoli, G.; Giorgi, G.; Liberatore, R. Experimental Evaluation of a Combined Sensible and Latent Heat Thermal Energy Storage System. Energies 2025, 18, 5808. [Google Scholar] [CrossRef] [Scilit]
  81. IBM ILOG CPLEX Optimization Studio, Version 12.6.3 User’s Manual. IBM Corporation 1987, 2013 (Armonk, New York, USA). Available online: https://public.dhe.ibm.com/software/products/Decision_Optimization/docs/pdf/usrcplex.pdf (accessed on 16 March 2026).
  82. GME. Available online: https://www.mercatoelettrico.org/en-us/Home/Results/Electricity/MGP/Results/PUN (accessed on 21 December 2025).
  83. Manso-Burgos, Á.; Ribó-Pérez, D.; Gómez-Navarro, T.; Alcázar-Ortega, M. Local Energy Communities Modelling and Optimisation Considering Storage, Demand Configuration and Sharing Strategies: A Case Study in Valencia (Spain). Energy Rep. 2022, 8, 10395–10408. [Google Scholar] [CrossRef] [Scilit]
  84. MODECO. Modelling Study on the Role of Energy Communities in the Energy Transition; Publications Office of the European Union: Luxembourg, 2023. [Google Scholar] [CrossRef]
  85. Bianco, G.; Bonvini, B.; Bracco, S.; Delfino, F.; Laiolo, P.; Piazza, G. Key Performance Indicators for an Energy Community Based on Sustainable Technologies. Sustainability 2021, 13, 8789. [Google Scholar] [CrossRef] [Scilit]
Figure 1. Simplified schema of the main components and interconnection of the case studies related to the Microgrid. It is possible to see 3 options: CSP using MS + DT (a), CSP using TO + DT (b), CSP using TO + PCM (c).
Energies 19 02327 g001aEnergies 19 02327 g001b
Figure 2. Average hourly solar irradiance profiles for the four representative season days.
Energies 19 02327 g002
Figure 3. Hourly mean values of the electricity price in the corresponding hour of all days in the relative season [82].
Energies 19 02327 g003
Figure 4. Shape of the results: (a) summer day; (b) winter day.
Energies 19 02327 g004
Figure 5. Electricity flows scenarios: (a) scenario 1, environmental objective; (b) scenario 1, economical objective; (c) scenario 2, environmental objective; (d) scenario 2, economical objective; (e) scenario 3, environmental objective; (f) scenario 3, economical objective.
Energies 19 02327 g005aEnergies 19 02327 g005b
Table 1. Basic design specifications of the CSP plant options.
Option AABBCC
HTFMolten saltMolten saltThermal oilThermal oilThermal oilThermal oil
HTMMolten saltMolten saltMolten saltMolten saltPCMPCM
Design turbine gross output [MWe]0.380.380.380.380.380.38
Hours of storage at design point [h]010010010
Gross to net conversion factor0.90.90.90.90.90.9
Cycle thermal efficiency0.410.410.370.370.20.2
Solar multiple1.13.3131.13.3
Design point DNI [W/m2]850850850850850850
Loop inlet HTF temperature [°C]290290290290180180
Loop outlet HTF temperature [°C]550550390390300300
Number of loops131326
Field aperture [m2]1880564018805640376011,280
Number of Solar Collectors per loop888888
Table 2. Electrical energy demand for a representative day in each season.
Electricity demand cold season day19,315.49kWh/day
Electricity demand cold-mid season day18,840kWh/day
Electricity demand hot-mid season day18,840kWh/day
Electricity demand hot season day28,716.03kWh/day
Table 3. Natural gas demand for a representative day in each season.
NG demand cold season day
5158.13Nm3/day
NG demand cold-mid season day
1032.45Nm3/day
NG demand hot-mid season day
1032.45Nm3/day
NG demand hot season day
1032.45Nm3/day
Table 4. Primary energy consumption for a representative day in each season.
Primary energy consumption representative cold season day
97,092.96kW/day
Primary energy consumption representative cold-mid season day
55,515.54kW/day
Primary energy consumption hot-mid season day
55,515.54kW/day
Primary energy consumption hot season day
79,313.21kW/day
Table 5. Total emissions for a representative day in each season.
Emission cold season day
17,050.76kg CO2/day
Emission cold-mid season day
8713.59kg CO2/day
Emission hot-mid season day
8713.59kg CO2/day
Emission hot season day
12,304.32kg CO2/day
Table 6. Associated energy electricity costs for a representative day in each season.
Electricity costs for cold season day
1339.191€/day
Electricity costs cold-mid season day
976.5087€/day
Electricity costs for hot-mid season day
967.315€/day
Electricity costs hot season day
1527.227€/day
Table 7. Associated NG costs for a representative day in each season.
NG costs for cold season day
1187.41€/day
NG costs cold-mid season day
205.04€/day
NG costs for hot-mid season day
122.33€/day
NG costs hot season day
168.83€/day
Table 8. Natural gas price.
Representative cold season day0.143 (€/Nm3)
Representative cold-mid season day0.121 (€/Nm3)
Representative hot-mid season day0.107 (€/Nm3)
Representative hot season day0.113 (€/Nm3)
Table 9. Technical and economic information of energy devices for the MG (CSP not included).
Energy DeviceSpecific Capital Cost O&M Costs
(€/kWh)
EfficiencyLifetime
Electrical Thermal
Solar PV 2000 €/kWp0.0100.14 30
Battery350 €/kWh0.005 η C h = η D i s c h = 0.75 5
Thermal storage20 €/kWh0.0012 φTES = 0.0520
NG boiler100 €/kW0.0014 0.915
Table 10. Technical and economic information for CSP and related thermal storage.
Cost UnitsThermal Oil
2 T 0 h 0.38 MW
Thermal Oil
2 T 10 h 0.38 MW
MS 2 T 0 h 0.38 MWMS 2 T 10 h 0.38 MW0.4 MWe Thermal Oil
PCM 0 h
0.4 MWe Thermal Oil PCM 10 h
Specific solar fields cost€/m2220220250250210210
Stored thermal energyMWh03.803.803.8
Specific TES costk€/MWht 100 40 83
TES costk€ 380 152 315.4
Plant CAPEXk€6892701783260313163816
Plant OPEX k€/y10.035.611.234.815.540.3
Annual heat productionMWht9333313944292726706945
Real interest rate%333333
LifetimeY303030303030
annuity factor 19.619.619.619.619.619.6
Thermal energy cost€/kWht0.0480.0520.0540.0560.0310.032
Average annual Th-self efficiency 0.370.380.410.410.20.2
Electrical energy cost€/kWh0.130.140.130.140.150.16
Industrial loadMWht000000
Storage efficiency% 98 98 80
Table 11. List of KPIs for this case study.
NameDescriptionExpected Range for Rec from LiteratureClassification
System energy efficiencyThe ratio of consumed energy to total generated energy. This KPI is mainly relevant to regulatory authorities85–95%
[83,84]
Dynamic absolute application level technical
System operational CO2 emissionThe sustainability performance of an energy system by comparing its carbon emissions to a baseline scenario0.08–0.2 kgCO2/KW
[83,84,85]
Dynamic absolute application level technical, SH all
Flexibility factorQuantifies the technical capability of the system to adjust consumption, generation or energy storage systems to import energy at the lowest price and export energy at the highest price within the overall trade market Dynamic absolute application level technical
CAPEXInitial investment costs required to set up renewable energy infrastructure and related assets, defined here as initial installation cost per kW of installed capacity Dynamic absolute application level economic
OPEX Costs associated with operation and maintenance after the initial set up Static, absolute, application level, economic
LCOEThe total discounted costs incurred over the lifetime of a power generating system—including CAPEX and OPEX by the total electricity generated during its lifespan0.15–0.40 €/kWhStatic, absolute, application level, economic
Table 12. Results obtained with the Phase Change Material.
NESS_HPNESS_BATNESS_PCMTotal Capital Cost of StorageHP (kW)BAT
(kW)
PCM (kW)HP (kWh)BAT (kWh)PCM (kWh)Total O&M Cost of Storage
Base_1983283,373,540450680614002575.16806574056.400
Base_29 88203,380,925450721610002575.17216410053.500
Base_3978363,366,165450639618002575.16396738059.270
Table 13. Summer day—environmental optimization.
T
[time, hour]
NET ELECTRICITY LOADHPBATTEL_gridTHERMAL LOADPCMBOILER
1481.412503400032.0320
2340.412503400062.7403.10
3329.812503400062.7392.50
4327.016243400062.7763.20
5275.619973400062.7711.80
6332.524473440062.7885.20
7411.025753440089.1−449.80
8406.3257534400608.31014.70
9367.02575344001032.81399.80
10166.152575344001047.91214.10
11−432.625753872.50857.7857.70
12−1271.625755116.827.4744.17440
13−1380.525755116.81380.5764.07640
14−1664.325755116.81664.3712.00719.0
15−1590.925755116.81590.9719.60719.5
16−1514.825755116.81514.8694.40694.4
17−1344.1525755116.81344.1720.20720.1
18−1550.3725755116.81550.3765.20765.2
19−1434.4825755116.81434.5745.3745.30
20−1152.6025753881.62387.8475.8475.90
21−123.9625753881.6123.9601.4601.40
22367.5722073881.60491.04910
23489.1117183881.60296.3296.30
24498.86125038510151.9151.90
Table 14. Winter day—environmental optimization.
T
[time, hour]
NET ELECTRICITY LOADHPBATTEL_gridTHERMAL LOADPCMBOILER
1391.7337.53200729.262.75791.562.7
2395.1337.542001732.662.75227162.7
3386.9337.552001724.362.75454262.7
4400.3337.564001937.862.75681362.7
5398.3337.56400735.862.75738062.7
6485.7337.56400823.289.172900
7487.7337.564001648.4608.36681.30
8514.7−337.55885.3−337.51032.85648.20
9272.9−337.55612.5−337.51047.94600.20
10−477.5−212.65612.5−264.9857.73742.40
11−1104.005612.5−1104.0744.12998.30
12−725.205612.5−725.2764.02234.40
13−860.705612.5−860.7719.01515.40
14−423.805612.5−423.8719.6795.80
15−910.706396−125694.4101.40
16−930.306396−930.3720.10617
17−999.706396−999.7765.21480765.2
18−114.506396−114.5745.32960742.3
19337.5−337.545611835475.92484.30
20465.6−337.54432.90601.41882.30
21512.7−337.54257.70491.01391.30
22508.7−337.54086.40296.31094.90
23510.6−337.53913.40151.9942.90
24500.7212.63200032.0910.90
Table 15. Features of the storage systems.
FeaturesPumped Hydro Energy Storage BatteryPCM
Maximum output power (kW)45068061400
Efficiency 75%95%90%
Capacity (kWh)257568065740
Operation and maintenance cost (c€/kWh) 0.0020.0050.003
Table 16. Scenarios for hybrid storage system configurations and capital costs.
ScenariosNumber of Battery StacksNumber of PCM ModulesTotal Capital Cost of Storage [k€]
Scenario 183283373.545
Scenario 288203380.925
Scenario 378363366.165
Table 17. Economic indicators of hybrid storage systems, including CAPEX, OPEX and LCOE.
KPIValue
CAPEX757.64 €/kWh
LCOE0.097 €/kWh
OPEX1.54 €/kW
Table 18. Performance comparison of hybrid storage scenarios under self-sufficiency and economic objectives.
TargetOptionFlexibility Factor“Day” EfficiencyCO2 Reduction
[kg/kWh]
LCOE [€/kWh]Peak Import
[MW]
Economic (Scenario 1)C0.650.890.250.0980.05–0.10
B0.620.920.450.1010.10–0.15
A0.610.890.300.1030.15–0.20
Environ.
(Scenario 2)
C0.650.950.460.099≈0–0.05
B0.640.930.340.1020.05–0.10
A0.620.920.410.1040.10–0.15
Self-sufficiency
(Scenario 3)
C0.620.980.400.098≈0
B0.630.930.390.1010–0.05
A0.650.920.330.1040.05–0.10
Disclaimer/Publisher’s Note: The statements, opinions and data contained in all publications are solely those of the individual author(s) and contributor(s) and not of MDPI and/or the editor(s). MDPI and/or the editor(s) disclaim responsibility for any injury to people or property resulting from any ideas, methods, instructions or products referred to in the content.