Article

Condition Assessment of Field-Aged Composite Insulators Following Incidents of Insulator Flashunder

by
Nikolaos Mavrikakis
1 and
Kiriakos Siderakis
1,2,*
1
Sector of HV/MV Substations-Crete, Islands Network Operation Department, Hellenic Electricity Distribution Network Operator S.A., 71307 Heraklion, Greece
2
High Voltage Laboratory, Department of Electrical and Computer Engineering, Hellenic Mediterranean University, 71410 Heraklion, Greece
*
Author to whom correspondence should be addressed.
Energies 2026, 19(10), 2325; https://doi.org/10.3390/en19102325
Submission received: 12 March 2026 / Revised: 6 May 2026 / Accepted: 8 May 2026 / Published: 12 May 2026

Abstract

A condition assessment of a group of field-aged insulators operated for only 6 years on the island of Rhodes after incidents of intense electrical activity is presented in this paper. The investigated insulators were in service in 150 kV overhead transmission lines operating in proximity to the seacoast, exposed to the action of marine pollution. Although the same type of insulator has been widely used in similar conditions, both on the island of Rhodes and on the island of Crete, incidents of intense electrical activity have only been experienced in a specific area on the southwest side of Rhodes. To understand the deterioration mechanism, in addition to a group of failed insulators, a number of insulators from the same area without indication of deterioration were removed to be tested. In total, 40 insulators were examined: 23 with extensive failure, three without any deterioration and 14 with different levels of tracking and erosion traces along the polymeric housing. A series of tests were performed, including visual inspection, hydrophobicity classification, insulation performance through tanδ measurements, an adhesion test between the polymeric housing and the rod and material identification of the housing material through FTIR-ATR. The results indicate that the main failure mechanism is insulator flashunder due to the poor adhesion between the polymeric housing and the rod, as well as the poor sealing of insulators, favoring the ingress of water on the insulator rod and the initiation of electrical discharges.

1. Introduction

Composite insulators are preferred over ceramic insulators by power utilities for use in power networks, due to reasons such as their improved performance under polluted conditions, low cost (including manufacturing, transportation and installation), ease of installation due to their low weight, low risk of injury from the breakage of sheds and high resistance against vandalism [1,2,3].
The first generation of composite insulators was introduced in the 1950s; however, they were widely implemented in power networks in the late 1990s, when the 3rd generation of composite insulators became available [4]. Based on service experience from the use of composite insulators, the manufacturing process has been upgraded and a lot of standards have been introduced since 1955. However, the need for further improvements is still evident following the application of insulators in different operational conditions. In this direction, a recent revision of the IEC 61109:2025 [5] introduces significant technical changes for the testing of high-voltage composite insulators.
In this study, an investigation of a group of field-aged composite insulators is presented, following incidents of intense electrical activity, after only six years of operation. The considered insulators were installed in 150 kV overhead transmission lines on the Greek island of Rhodes, operating in proximity to the seacoast. A group of insulators was removed from service, including 23 failed insulators, 14 insulators with different degrees of deterioration and three insulators without any sign of activity. In addition, one insulator that had not been used (storage condition) was also tested. The series of tests performed included visual inspection, hydrophobicity classification, insulation performance through tanδ measurements, an adhesion test between the polymeric housing and the rod and material identification of the housing material through FTIR-ATR.
Based on the visual inspection findings, the specific type of the insulator failure experienced was characterized as flashunder according to the Technical Brochure 481 of Cigre [6]. Flashunder failure is recognized as the puncturing of the polymeric housing along the axial length of the insulator, the exposure of the rod and the presence of tracking and erosion traces on the polymeric housing and the rod of the insulator. It is noteworthy that all the failed insulators passed the selection of electrical tests according to the previous version of IEC 61109:2008 [7]. The flashunder failure of insulators has been reported in the literature for earlier generations of composite insulators [6]. Through a Cigre survey, it was found that about 30% of the total referenced failures of the early generations of composite insulators in the USA had been recognized as flashunder [8].
The analysis of the results shows that the main cause of flashunder in this case of the failure of composite insulators is the poor adhesion between the polymeric housing and the rod, as well as between the polymeric housing and the metallic end fittings, favoring the ingress of water and the formation of a conducting path inside the insulators. In addition, the tanδ measurements show that this technique could be a useful tool for evaluating the flashunder process of the insulators.

2. Transmission System of the Island of Rhodes

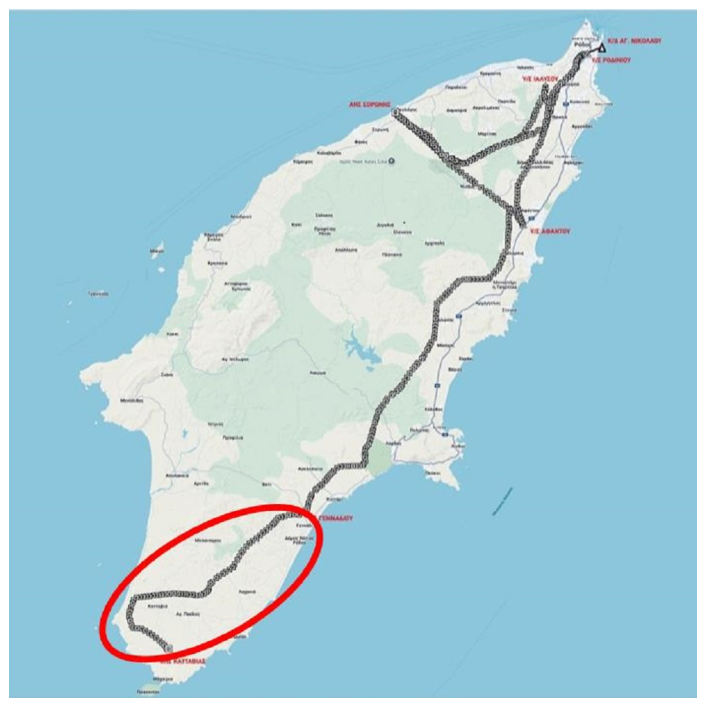
The transmission system of the island of Rhodes (Figure 1) consists of 147 km of 150 kV transmission lines (Table 1). Incidents of deterioration were found on the Genadi–Katavia transmission line, constructed in 2018, connecting the new powerplant in the Katavia area with the transmission system of the island. Due to the proximity of all the transmission lines to the seacoast (Figure 1), the use of composite insulators was adopted following the experience of the Hellenic Electricity Distribution Network Operator (HEDNO), which faced the same problem in the transmission system of Crete [9,10,11,12,13,14].

3. Insulators Under Investigation

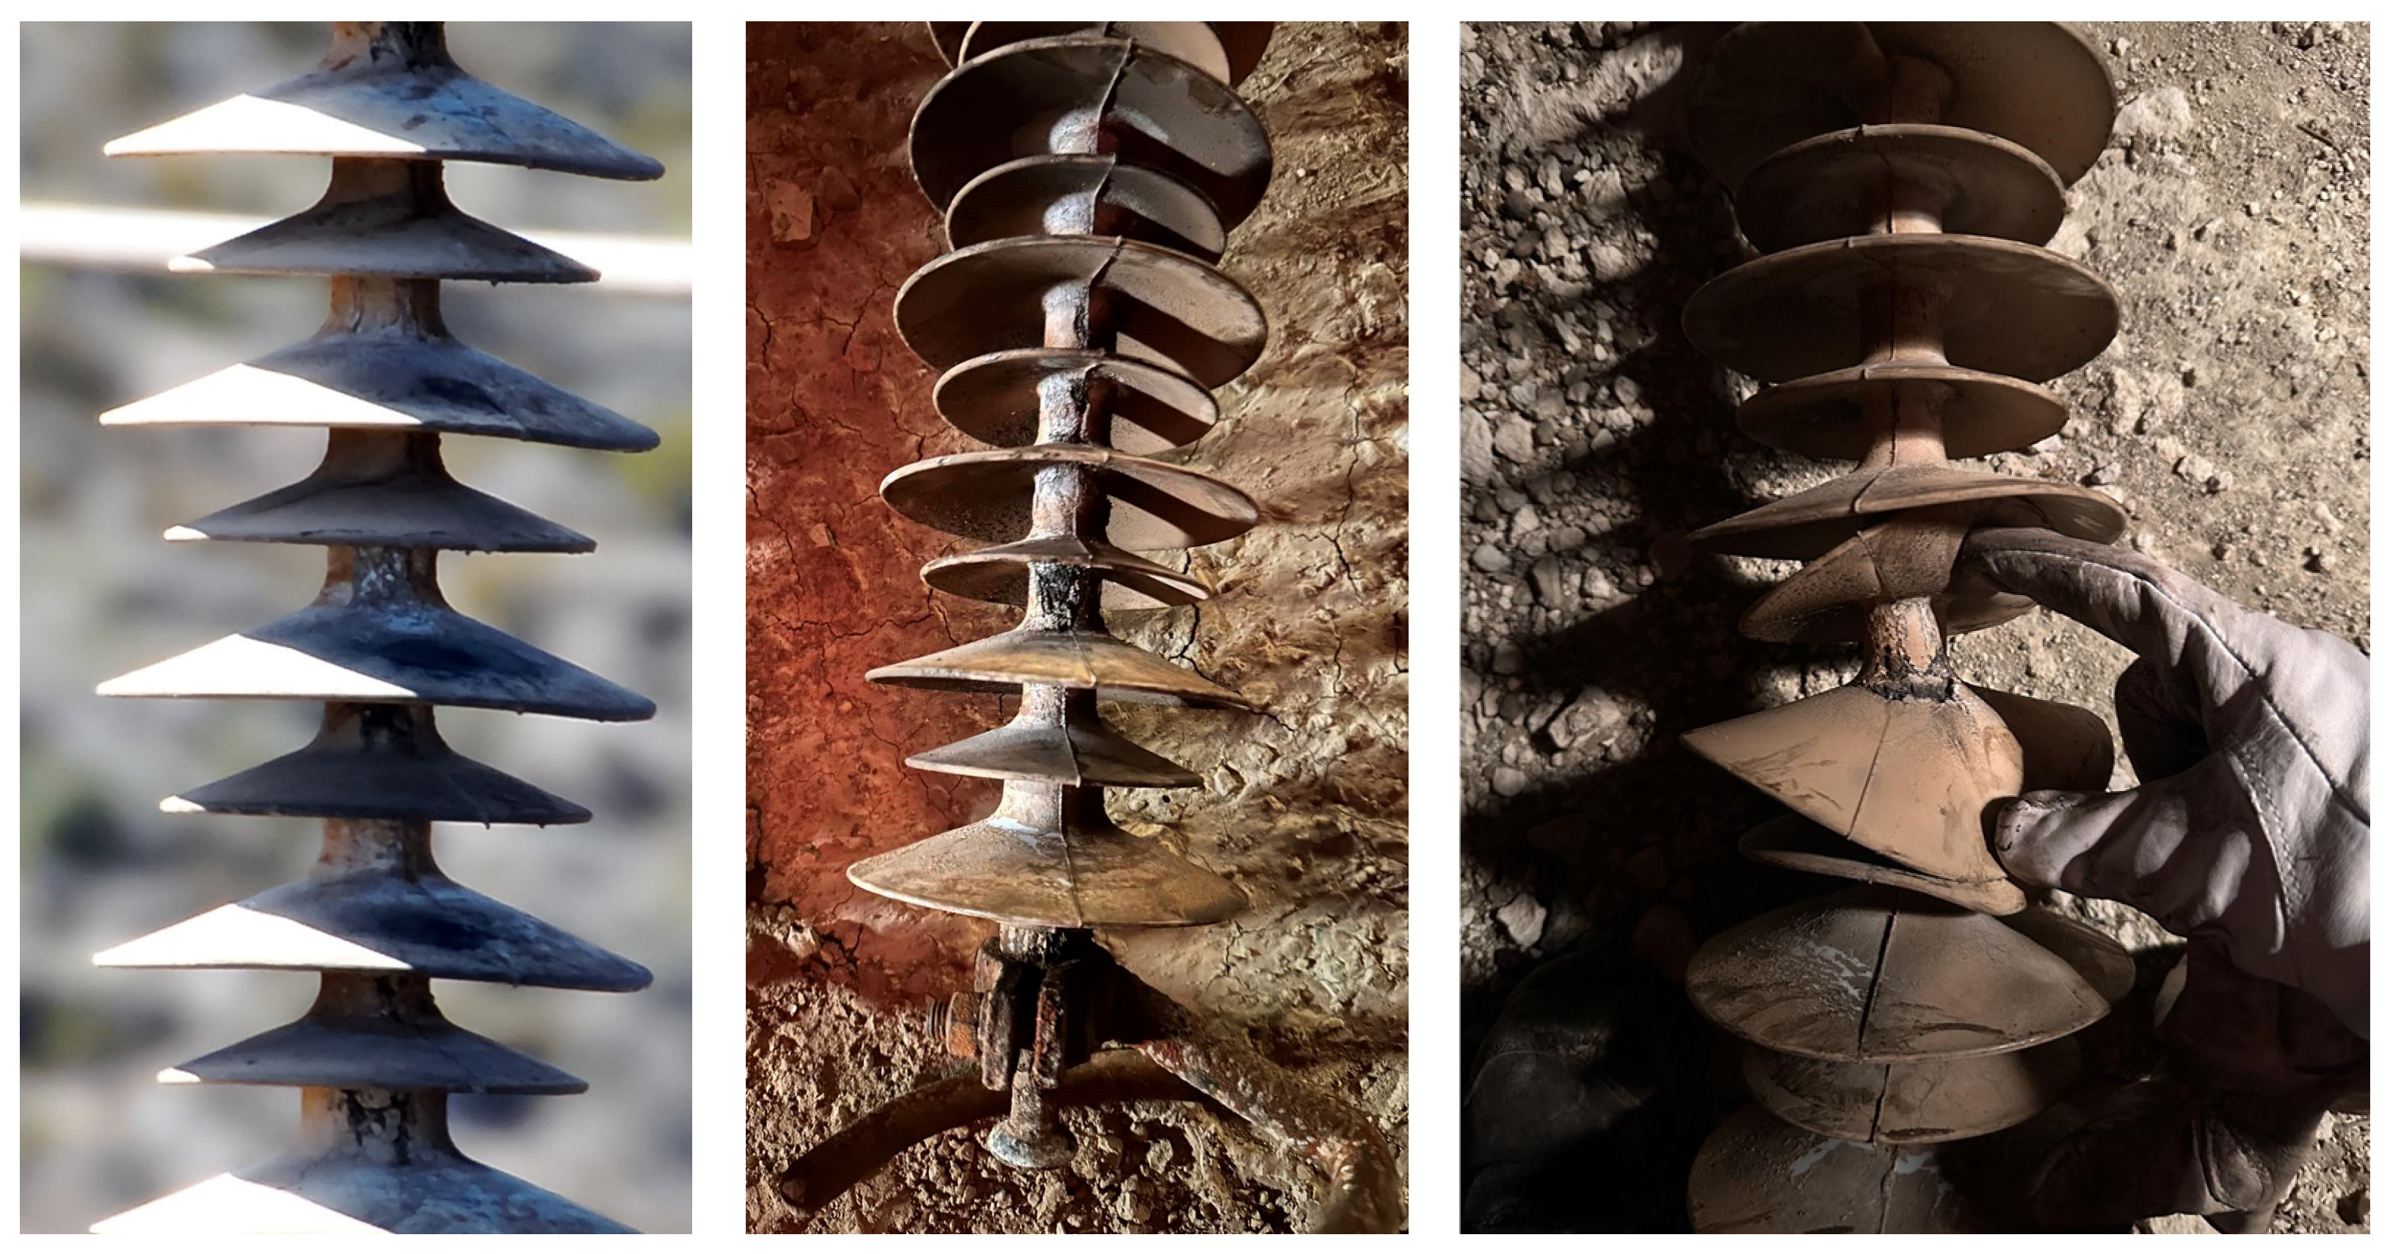
In this study, 40 composite insulators, operated for 6 years in the 150 kV overhead transmission line of Genadi–Katavia on the island of Rhodes, are investigated. The transmission line has been in service since 2018. Six years later, during the summer of 2024, intense surface activity was observed, especially in the early morning hours. A detailed aerial visual inspection was conducted by using the Unmanned Aerial Vehicle (UAV) DJI Matrice 30 T for all the 942 insulators of the line, which were installed in 73 towers. The in situ inspection showed 37 insulators with traces of damage, including electrical treeing traces and scissoring of the polymeric sheath (Figure 2). Specifically, 23 insulators had damage along the full length of their polymeric housing, four insulators had damage in the areas of the polymeric housing close to both end fittings of the insulator and 10 insulators had damage in the area of the polymeric housing close to the high-voltage end fitting.
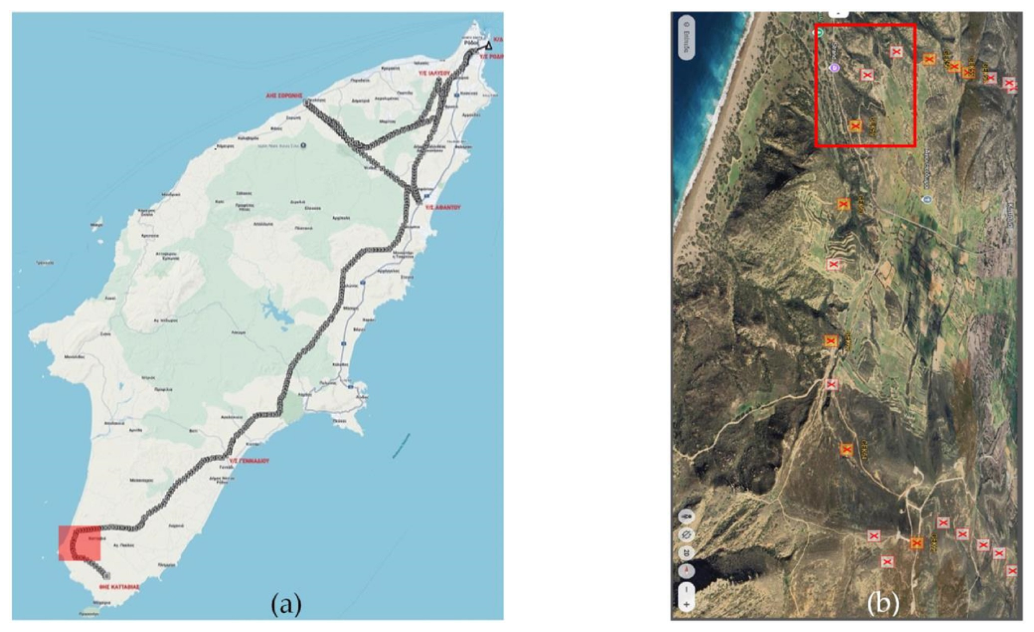
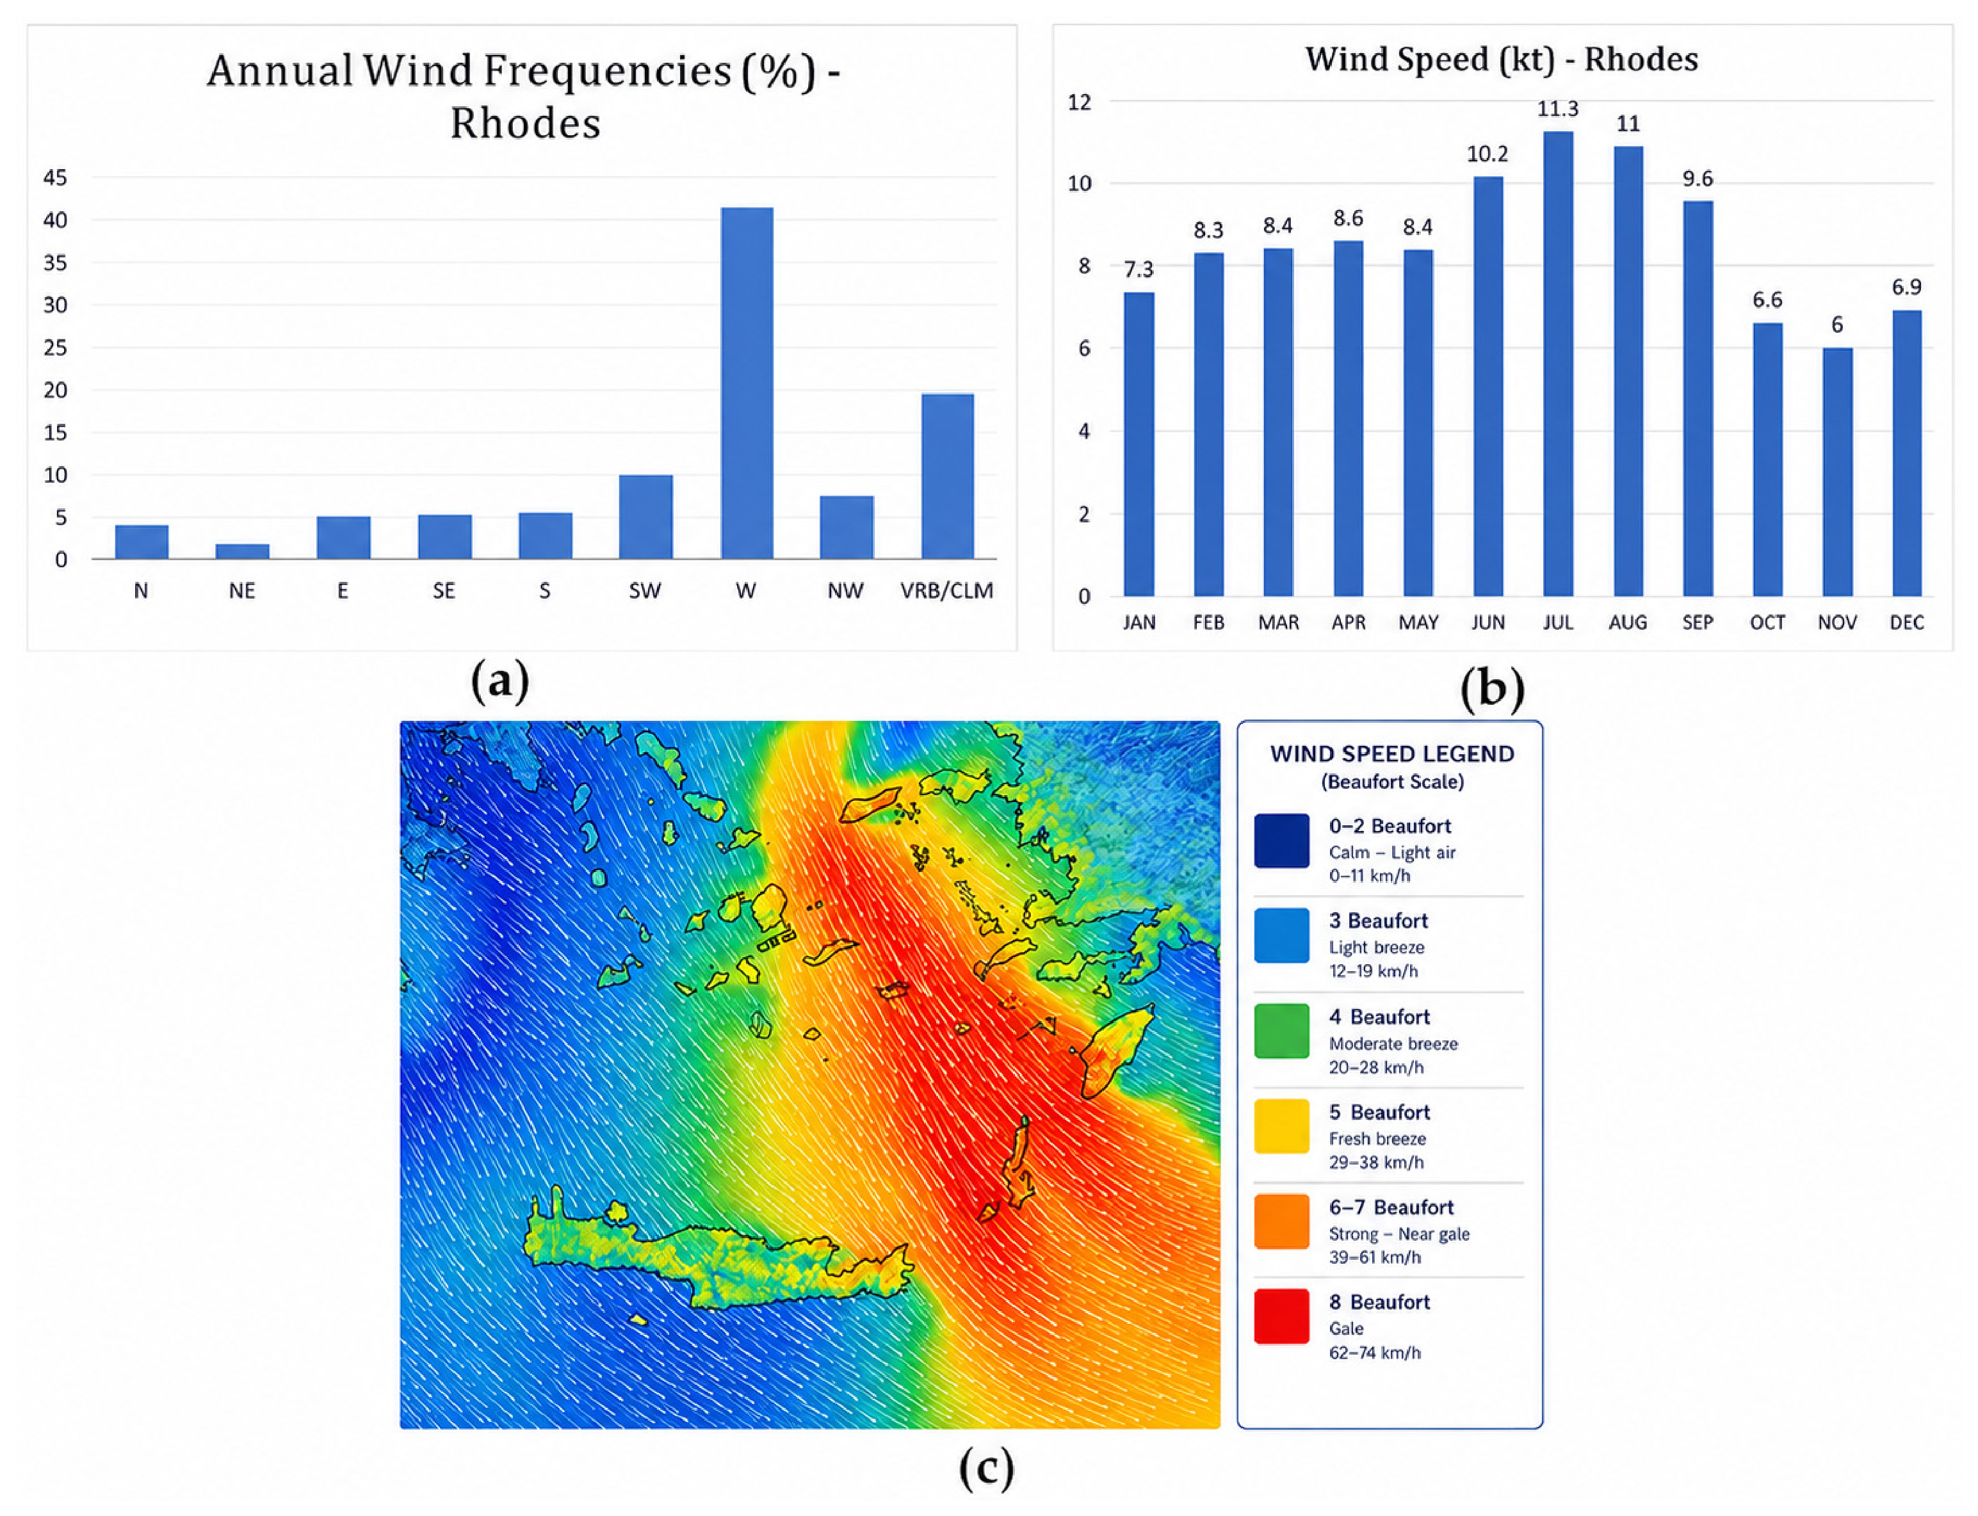
It is noteworthy that all of the 23 extensively damaged insulators were installed in three consecutive towers located in a coastal area with strong marine winds (Figure 3). The southwestern part of the island is the most exposed area to winds, where the dominant winds are northwestern winds (Figure 4a), especially in the period of summer (Figure 4b). In the area where the insulators failed, the northwestern wind is further enhanced due to the funnel effect (Figure 4c). On the other hand, the 14 insulators with traces of damage in some areas of their housing were detected in different towers, which were protected from marine pollution throughout the transmission line, showing that pollution was not the only cause of insulator failure, but assisted the acceleration of the failure.
Aiming to understand the reason for the insulator’s failure, the 37 withdrawn insulators were further investigated in the laboratory. Moreover, three service-aged insulators without obvious damage from the same manufacturer batch were also investigated. All 40 insulators complied with IEC 61109:2008 [7], according to the manufacturer certification.

4. Assessment of Insulators

4.1. Testing Procedure

Visual inspection and wettability classification were the first tests applied, aiming to assess the insulator condition as found in the field. Both are easily applied and can be performed even in field conditions directly after removal. In this direction, Cigre, EPRI, and STRI technical guides [17,18,19] were implemented for recording any morphological changes. Further wettability measurements were performed according to the IEC 62073 technical guide [20].
Then, electrical testing followed. In this case, the insulators were thoroughly cleaned, removing any trace of pollution or any other foreign material which could influence the electrical behavior of the insulation system. During the cleaning process, the careful removal of surface pollution was performed using distilled water, and then the insulators were left to dry for a period of at least 48 h at room temperature (>25 °C). The electrical parameter measured was the dielectric loss tangent (tanδ) of the cleaned insulators for assessing the insulation performance. The tanδ measurement has been performed by many researchers [21,22,23,24,25] to assess the condition of high-voltage insulators. Mechanical testing followed electrical, since the type of test implemented is catastrophic for the housing integrity. Known as the pull-off test, it was implemented according to IEC 61109:2025 [5] on the sheds of composite insulators, aiming to evaluate the adhesion between the polymeric housing and the insulator rod.
Finally, Attenuated Total Reflectance–Fourier Transform Infrared (ATR-FTIR) spectroscopy was performed according to Cigre TB 595 [26] on the polymeric housing of insulators for identifying the chemical composition of the housing material.
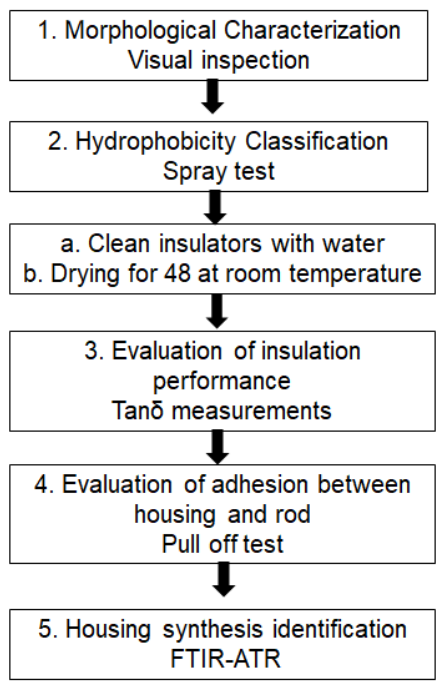
The testing procedure of the investigated insulators is illustrated in Figure 5.

4.2. Visual Inspection Results

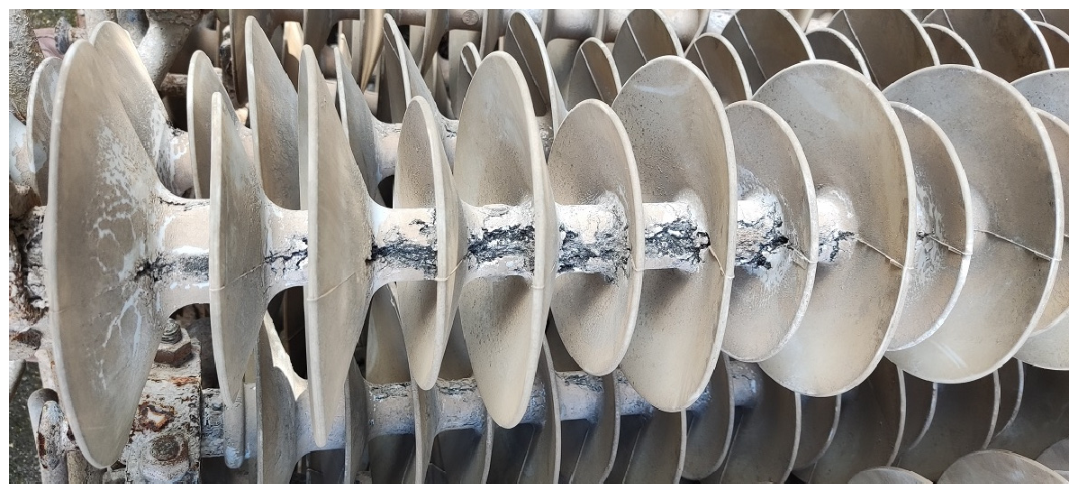
The visual inspection of the investigated insulators was performed according to the Cigre, STRI and EPRI visual inspection guides [17,18,19]. Out of the 40 investigated composite insulators, 37 were found to have visible tracking and erosion paths along the housing (Figure 6). Based on the damage magnitude on the polymeric housing, the investigated insulators were classified into four distinct classes (Table 2).
The main characteristic of the failed insulators was the erosion of polymeric housing which resulted in the exposure of the fiberglass rod (Figure 6). The eroded polymeric housing was burned, showing that the damage was caused by the thermal effect of the electrical discharge’s development. The signs of erosion were found near to and along the insulator rod. In the sheds, puncturing was also noted at the area close to the rod, showing that the electrical discharges were initiated and further developed on the axial length of insulators. There are no signs of surface activity along the creepage distance of the insulator. Therefore, the activity pattern where signs of deterioration are located along the rod indicates the flashunder mechanism.
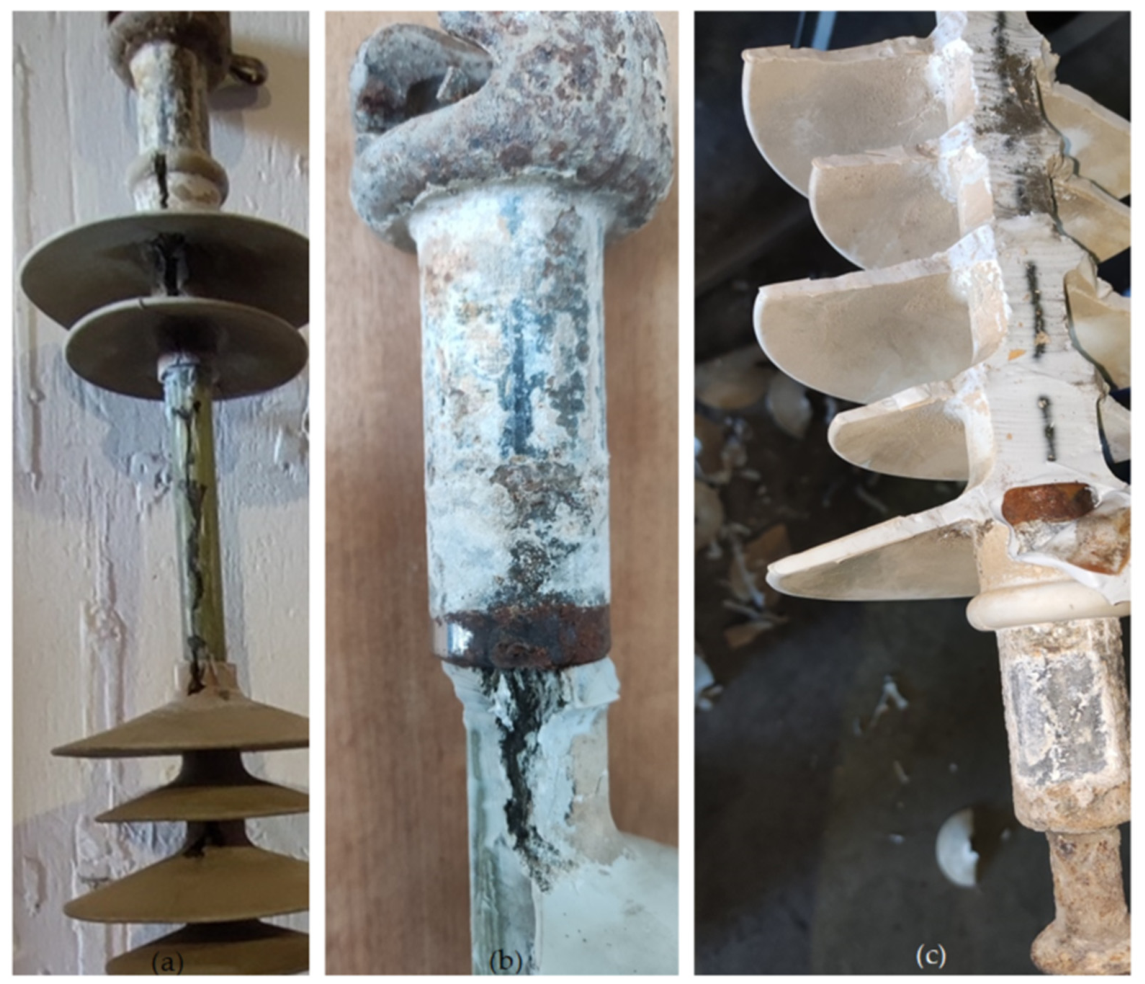
To better understand the reason of the insulators’ flashunder, the polymeric housing was cut and pulled off from the rod and the end fittings of a failed insulator. Following the removal of polymeric housing, electrical treeing traces were detected on the surface of the fiberglass rod (Figure 7a). Also, for both the high-voltage and ground end fittings of the insulator, extensive oxidation and corrosion of the metallic sealing end fitting was found (Figure 7b,c). All findings suggest that the insulator failure occurred due to water ingress through the polymeric housing on the rod. Also, the fact that the electrical discharges developed on the surface of the rod shows that there was poor adhesion between the polymeric housing and the fiberglass rod due to the wetting of the interface between the housing and the rod.

4.3. Wettability Classification

The wettability of every polymeric housing was evaluated according to the spray test (Method C) of the IEC 62073 standard [20]. The evaluation of the insulator hydrophobicity is based on the formation of water droplets or film on the sprayed area. The spray test was performed 3 months from the time when the insulators were removed from service. The ambient room conditions at the time of evaluation were 16 °C temperature and 52% relative humidity.
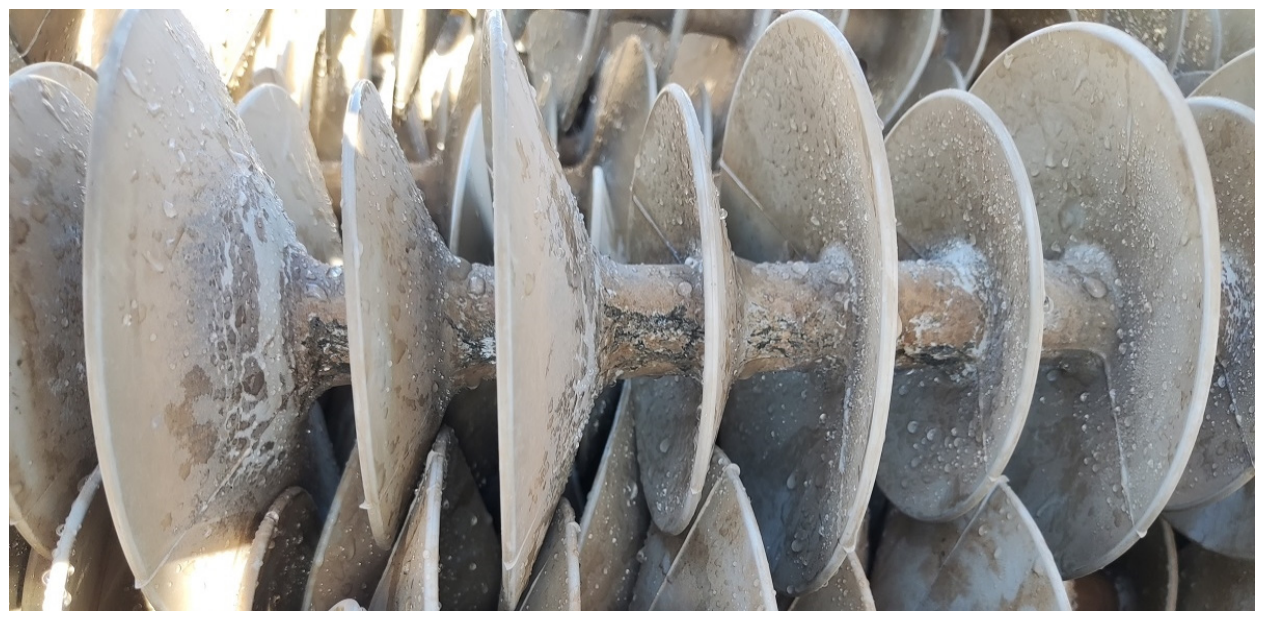
The spray test showed that distinct water droplets were formed on the housing surface of the examined insulators (Figure 8). The wettability class was 2 to 3, even in the eroded areas of the housing of the failed insulators, indicating that the insulators were hydrophobic at the time of the evaluation. It is known that, in the case of silicone rubber, hydrophobicity can be recovered only a few hours after the end of the electrical discharge activity [27].

4.4. Tanδ Measurement

The dielectric loss tangent (Tanδ), known also as the dissipation factor, is a commonly performed measurement in electrical apparatus for evaluating the insulation condition. It is defined as the ratio of the resistive current to the capacitive current when an AC high voltage is applied to the test specimen. While low values of tanδ indicate good insulation performance, elevated values are associated with the increased power losses, typically resulting from aging, humidity, pollution or potential defects [21,22,23,24,25].
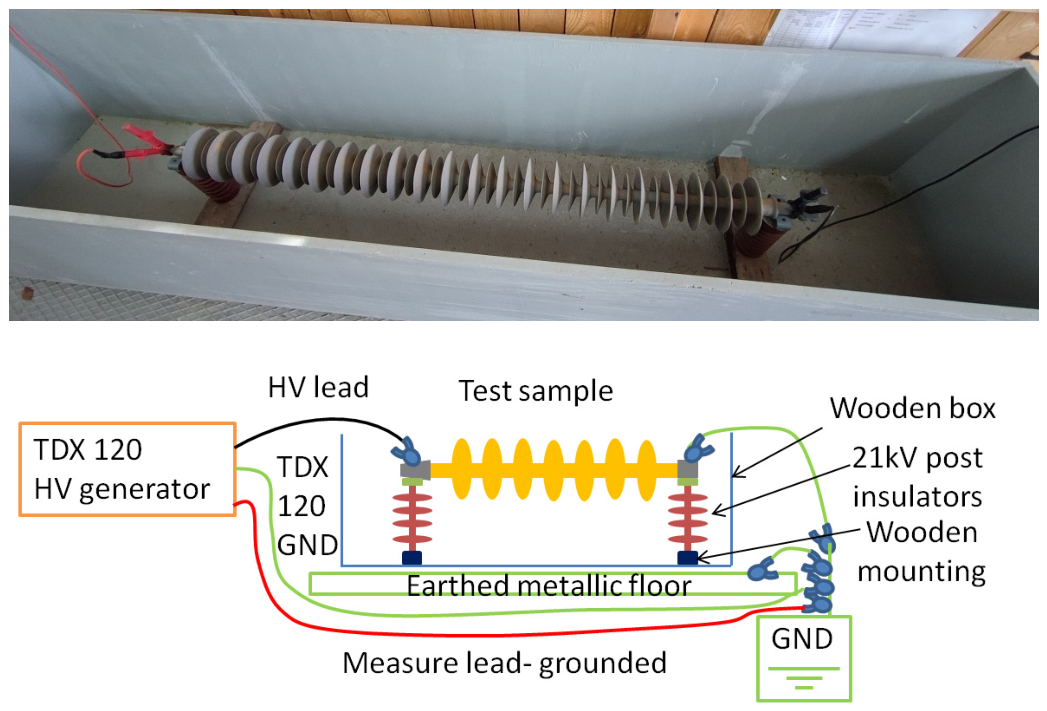
To eliminate the effect of surface pollution on the tanδ measurements, all the investigated insulators were carefully cleaned with distilled water to remove the surface pollution prior to the test. Subsequently, the insulators were dried for 48 h in a laboratory room at 25 °C temperature and 50% relative humidity. The experimental setup shown in Figure 9 was developed to measure the tanδ. For the stable mounting of the investigated insulators, two 21 kV composite post insulators were utilized inside a wooden enclosure, effectively defining the external boundaries of the testing area.
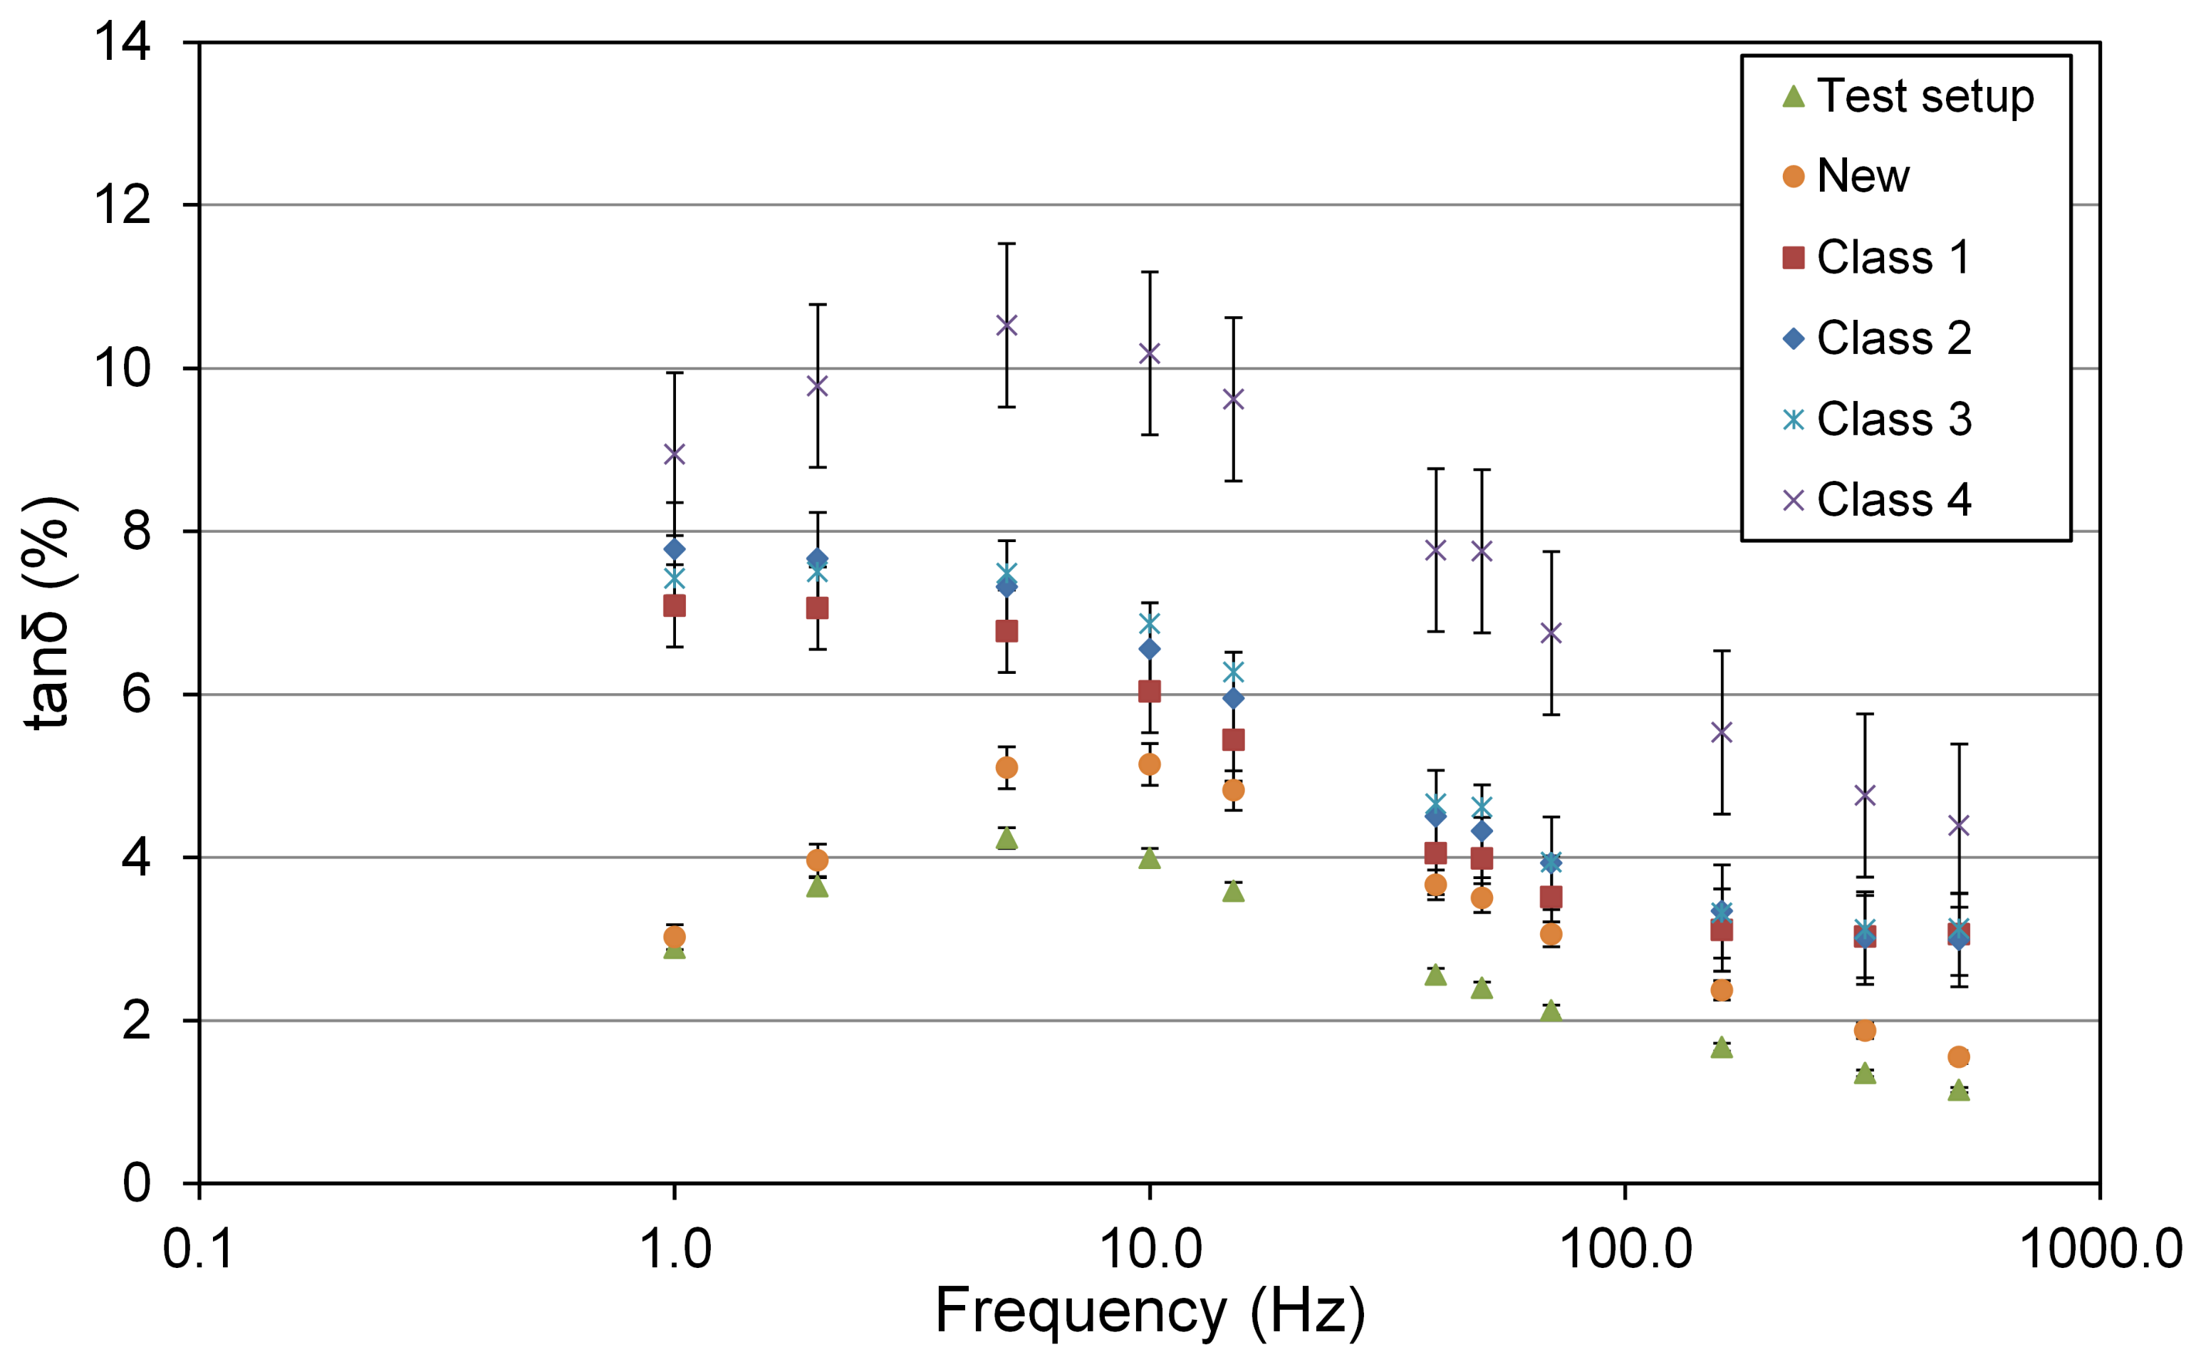
The tanδ measurements were performed by using the Megger TRAX Multifunction transformer and substation test system (Megger Group Ltd., Dover, UK) equipped with the TDX 120 high-voltage generator. The tanδ was measured at different frequencies from 1 Hz up to 505 Hz, and the maximum applied voltage was 10 kV at 50 Hz. The GST–GND (grounded specimen test) mode for measuring the tanδ of insulators was selected within the TRAX interface. Figure 9 presents the wiring diagram of the experimental setup. The high-voltage lead was connected to the high-voltage end fitting of each investigated insulator, and the ground lead was connected to the ground end fitting of the insulator, which was earthed. Thus, the experimental setup captures all the leakage paths to the ground, including the internal and external leakage paths of the tested insulator as well as those inherent to the experimental arrangement itself. All measurements were conducted at 16 °C and 52% relative humidity. The tanδ of the 40 field-aged insulators, as well as that of a new insulator from the same batch, was measured. To understand the effect of the constructed experimental arrangement on the tanδ results, the tanδ of the test setup was measured independently without an insulator. For consistency, three separate measurements were recorded for each insulator as well as for the standalone test setup. Figure 10 presents the average tanδ measurement for all the investigated insulators and the standalone test setup. The error bars correspond to standard deviation.
From Figure 10, it is evident that the tanδ values are higher for the insulators compared to the test setup alone; this is attributed to the increased resistive losses occurring when insulators bridge the experimental arrangement. Also, the tanδ of the damaged insulators is significantly higher than that of a new insulator, possibly due to the formation of resistive tracking paths at the interface between the polymeric housing and the rod. In the frequency range of 5 up to 50 Hz, higher tanδ values are observed as the severity of insulator damage increases. Since tanδ is typically evaluated at the nominal operating frequency of the electrical equipment, Table 3 presents the tanδ measurements at 50 Hz for all the investigated insulators.
At the nominal frequency of 50 Hz, the tanδ value of a damaged insulator (Class 4) is approximately twice that of a new one. In addition, the tanδ for insulators with visible localized damage (Class 2 and 3) exhibits an increase of more than 22%. All the findings suggest that the tanδ measurement can serve as an effective diagnostic tool for detecting the deterioration of the insulating volume of the insulator and especially the fiberglass rod and thus the early stages of the flashunder phenomenon on service-aged insulators. Therefore, further investigation of the technique can be promising.

4.5. Pull-Off Test

Following the measurement of tanδ, the pull-off test was conducted on all the 40 field-aged insulators and a new one from the same batch to assess the adhesion between the polymeric housing and the rod. The ambient room conditions were 16 °C temperature and 55% relative humidity. The pull-off test was recently incorporated into the IEC 61109 standard as a standardized method for evaluating composite insulators. Radial cuts were made through the polymeric sheds down to the rod, dividing each shed into four 90° shed segments. The base of each segment measured approximately 33 mm × 22 mm, resulting in a rectangular cross-sectional area of 726 mm2 for samples that were completely detached. In cases of partial detachment, only the actual detached area of the internal surface was calculated.
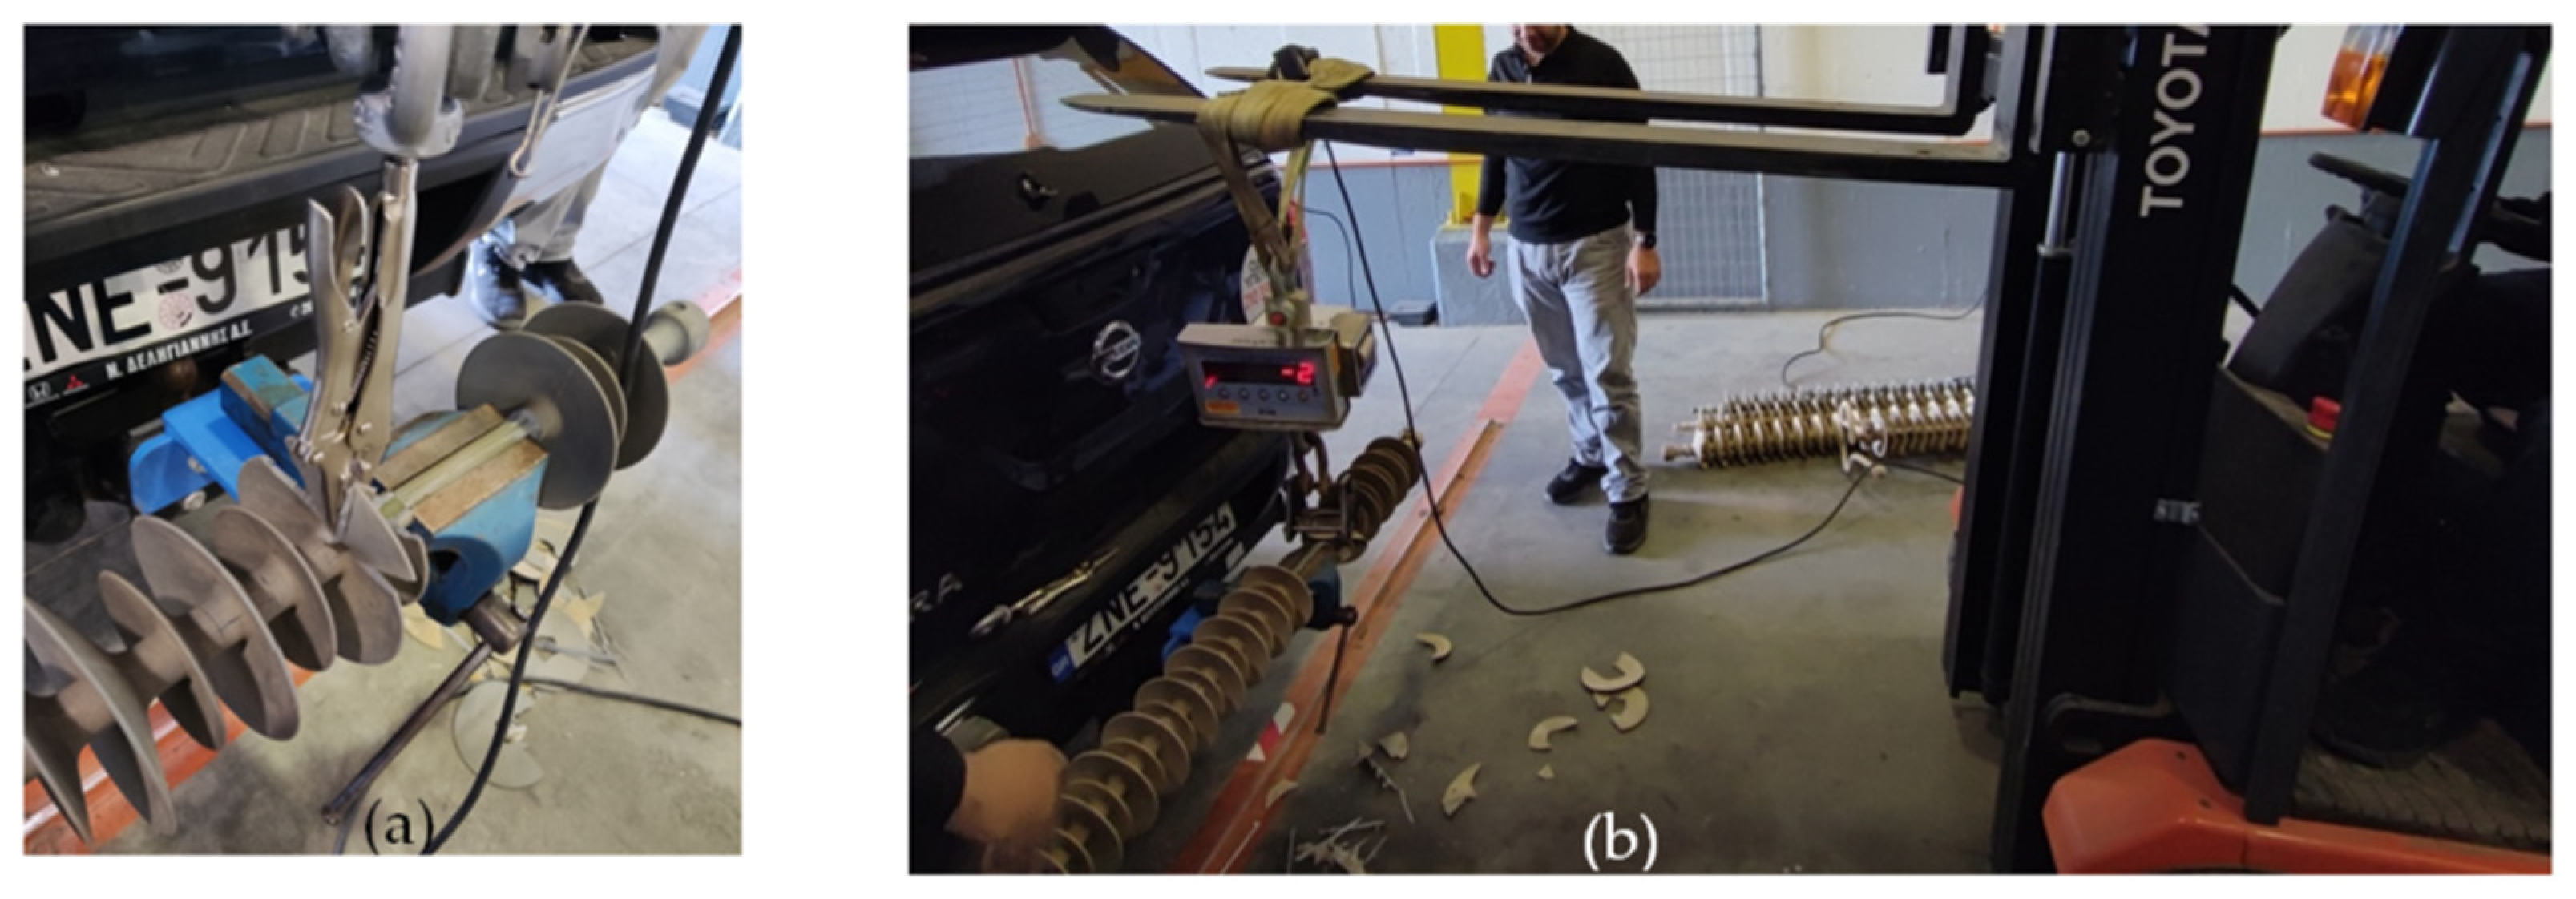
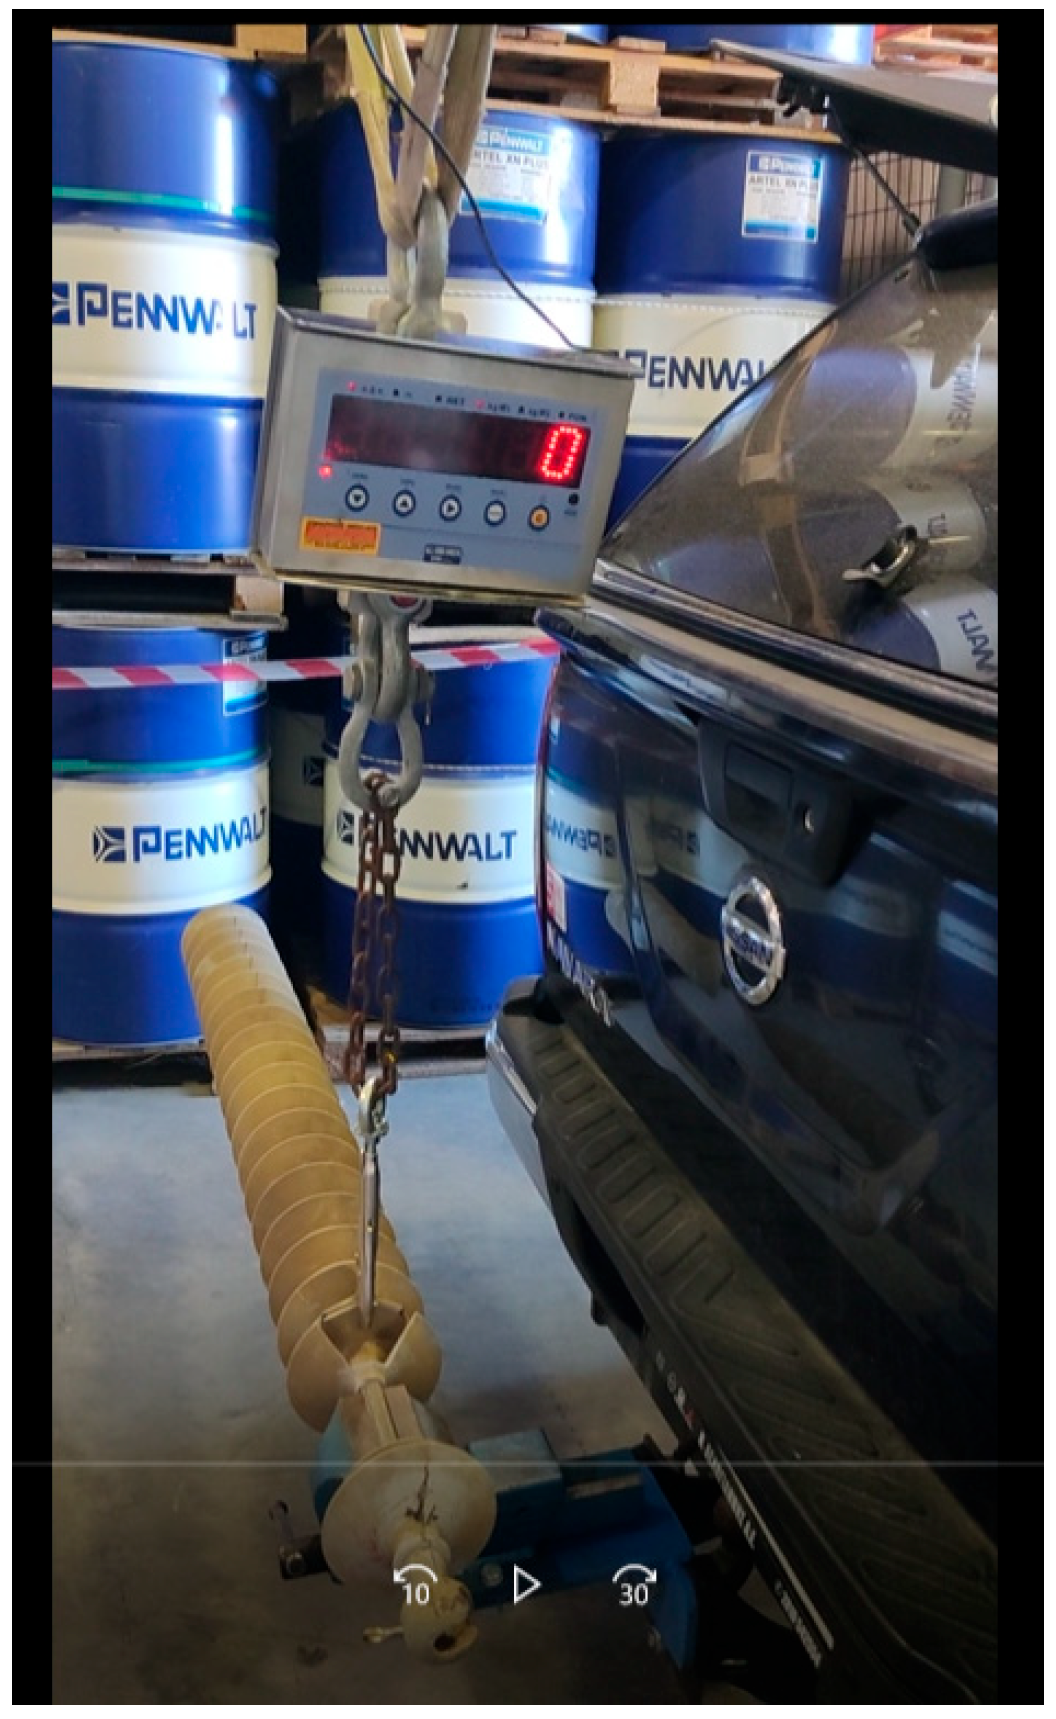
To perform the pull-off test, the insulator was steadily mounted in a horizontal position with the aid of a metallic clamp (Figure 11a). Following that, a perpendicular force was applied to each shed segment using a forklift truck (Figure 11b). The tensile force required to detach each shed segment from the rod was measured using a precision balance which was installed on the forklift’s forks (Figure 12). The applied pull-off loading rate was about 20 N/s. For each insulator, the pull-off test was conducted on 10 shed segments distributed along its entire length.
Table 4 presents the measured tensile forces and the corresponding calculated tensile stresses required to detach the shed segments from the fiberglass rod. The tensile stress was calculated by dividing the measured tensile force by the rectangular cross-sectional area of the interface between the housing and the rod. According to the IEC 61109 standard, the acceptance criterion for sufficient adhesion between the housing and the rod is a tensile strength exceeding 1.5 N/mm2.
Comparing the calculated tensile stress values (Table 4) with the minimum threshold of 1.5 N/mm2 (IEC 61109 [5]), it is deduced that the adhesion between the polymeric housing and the rod is inadequate for all the investigated insulators. Remarkably, the poorest adhesion was observed in the new/unused insulator. Among the field-aged insulators, the adhesion was found poorer for the field-aged insulators without apparent traces of damage on the polymeric housing (Class 1) than those with visible damages (Classes 2, 3 and 4). During the experiments, it was observed that the housing in the vicinity of flashunder traces remained firmly attached to the rod. On the other hand, housing areas without visible traces were easily detached. A plausible explanation is that the heat generated by electrical discharges on the surface of the rod results in an increase in temperature in the adjacent section of the housing, promoting the chemical bonding and crosslinking between the polymeric housing and the fiberglass rod. It is well established that the high-temperature treatment of the substrate (rod) with primer significantly improves the adhesion of polymeric elastomers [28].
In addition, the high standard deviation observed in the tensile force results across all insulators indicates that the adhesion strength between the polymeric housing and the rod varies significantly among the investigated samples. The latter is associated with non-uniform adhesion between the polymeric housing and the rod along the entire length of the insulator.
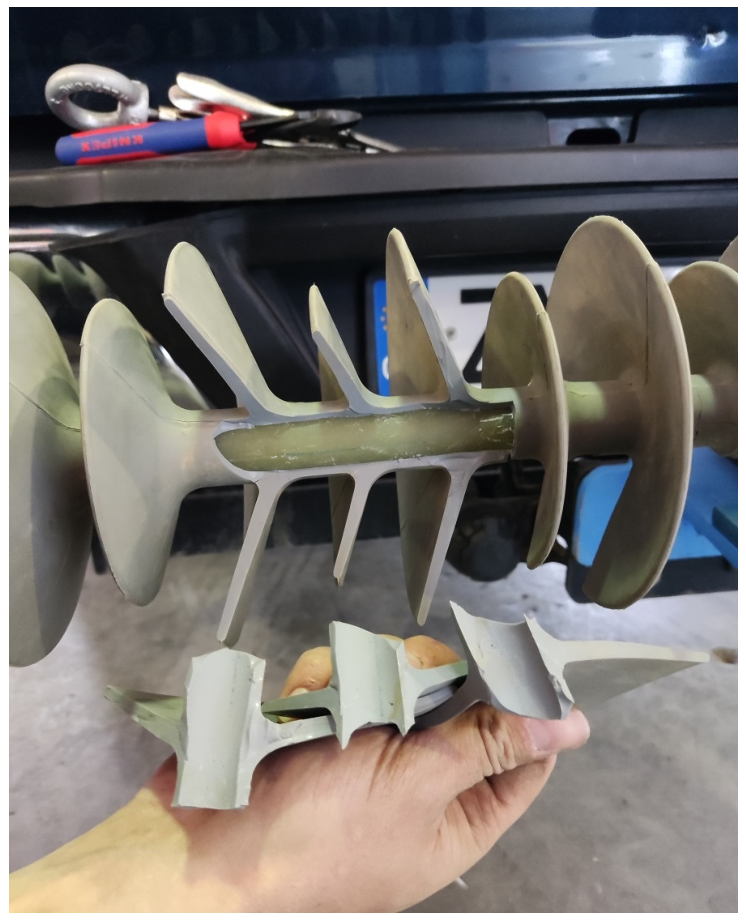
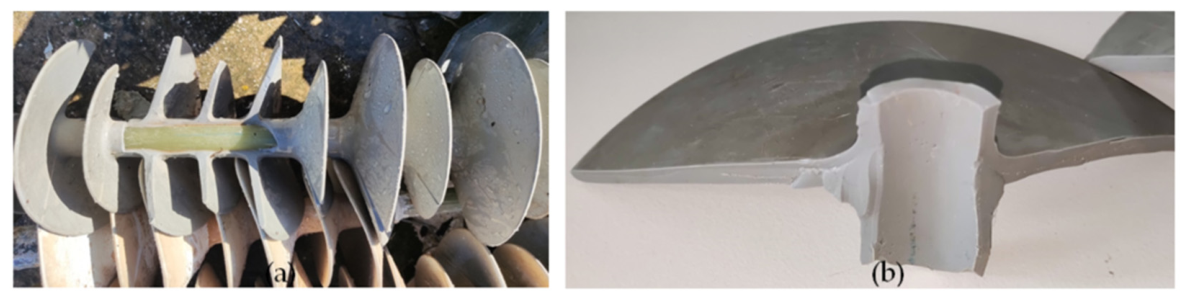
Overall, the pull-off test results suggest that the poor adhesion between the polymeric housing and the fiberglass rod is attributable to defects in the manufacturing process of the insulators. For this reason, the new insulator was further qualitatively investigated by inspecting the morphology of the internal surface of the detached shed segments (Figure 13) through visual inspection and scanning electron microscopy.
Through the visual inspection, it was clear that the piece of the polymeric housing was completely separated from the rod and the insulator rod was revealed (Figure 14a). By inspecting the detached shed segments, voids in the internal surface of the polymeric housing can be observed (Figure 14b). A blue line on both the surface of the rod and the internal surface of the polymeric housing was also found, showing that the primer of the rod was mixed with polymer in the manufacturing process of the insulator.
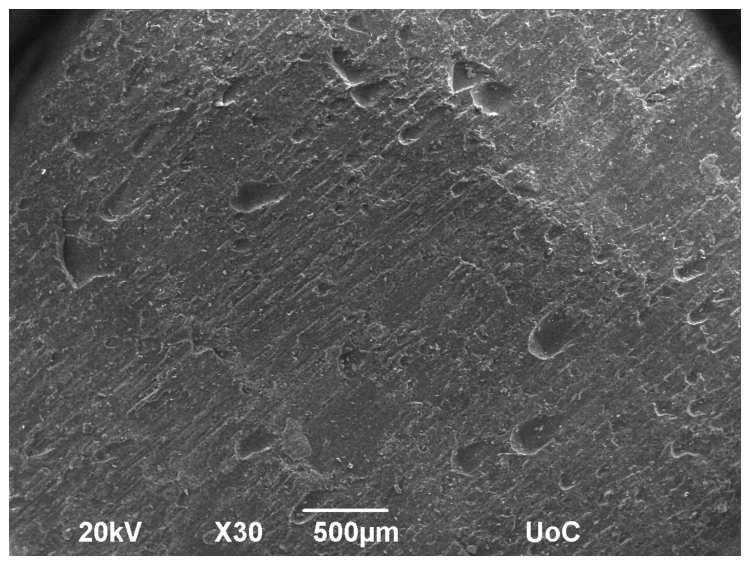
To obtain a more detailed characterization of the internal housing surface and the composition of the blue residue, the surface morphology and the elemental composition of the internal surface of the polymeric housing were further investigated using scanning electron microscopy (SEM) and Energy Dispersive X-Ray spectroscopy (EDX), respectively. A JEOL 6390 scanning electron microscope (JEOL Ltd., Akishima, Japan) equipped with an INCA X Act detector (Oxford Instruments NanoAnalysis, High Wycombe, UK) at 20 kV was employed for this purpose. Prior to SEM and EDX implementation, the insulator samples, taken from the internal surface of the housing, were sputtered with an approximately 10 nm layer of gold to prevent surface charging at the time of measuring. According to [29], the excitation depth for the silicone rubber was estimated up to 7 μm.
SEM images clearly reveal the voids on the internal surface of the polymeric housing which influenced the poor adhesion observed (Figure 15). The elemental composition of the material within the blue line region is presented in Table 5.
The detection of Au is attributed to the gold sputtering process of the sample. The measured elemental composition confirms that the examined material is a silicone primer formulated for the adhesion of silicone elastomers to substrates. In particular, the presence of platinum (Pt) acts as a catalyst for ensuring the proper curing of the silicone rubber and the presence of Titanate (Ti) helps the adhesion of the primer on the substrate [30,31].
Based on the above findings, a possible cause of the poor adhesion of polymeric housing is that the primer was not appropriately applied throughout the full length of the rod and it was not well dried prior to the injection molding process of the polymeric housing.

4.6. Polymeric Housing Identification

FTIR-ATR was employed to characterize the polymeric housing material of the insulators. Spectroscopy was performed using a Bruker Vertex 70 v FTIR spectrometer (Bruker Optics, Ettlingen, Germany), equipped with an A225/Q platinum attenuated total reflection (ATR) diamond crystal (Bruker Optics, Ettlingen, Germany)).
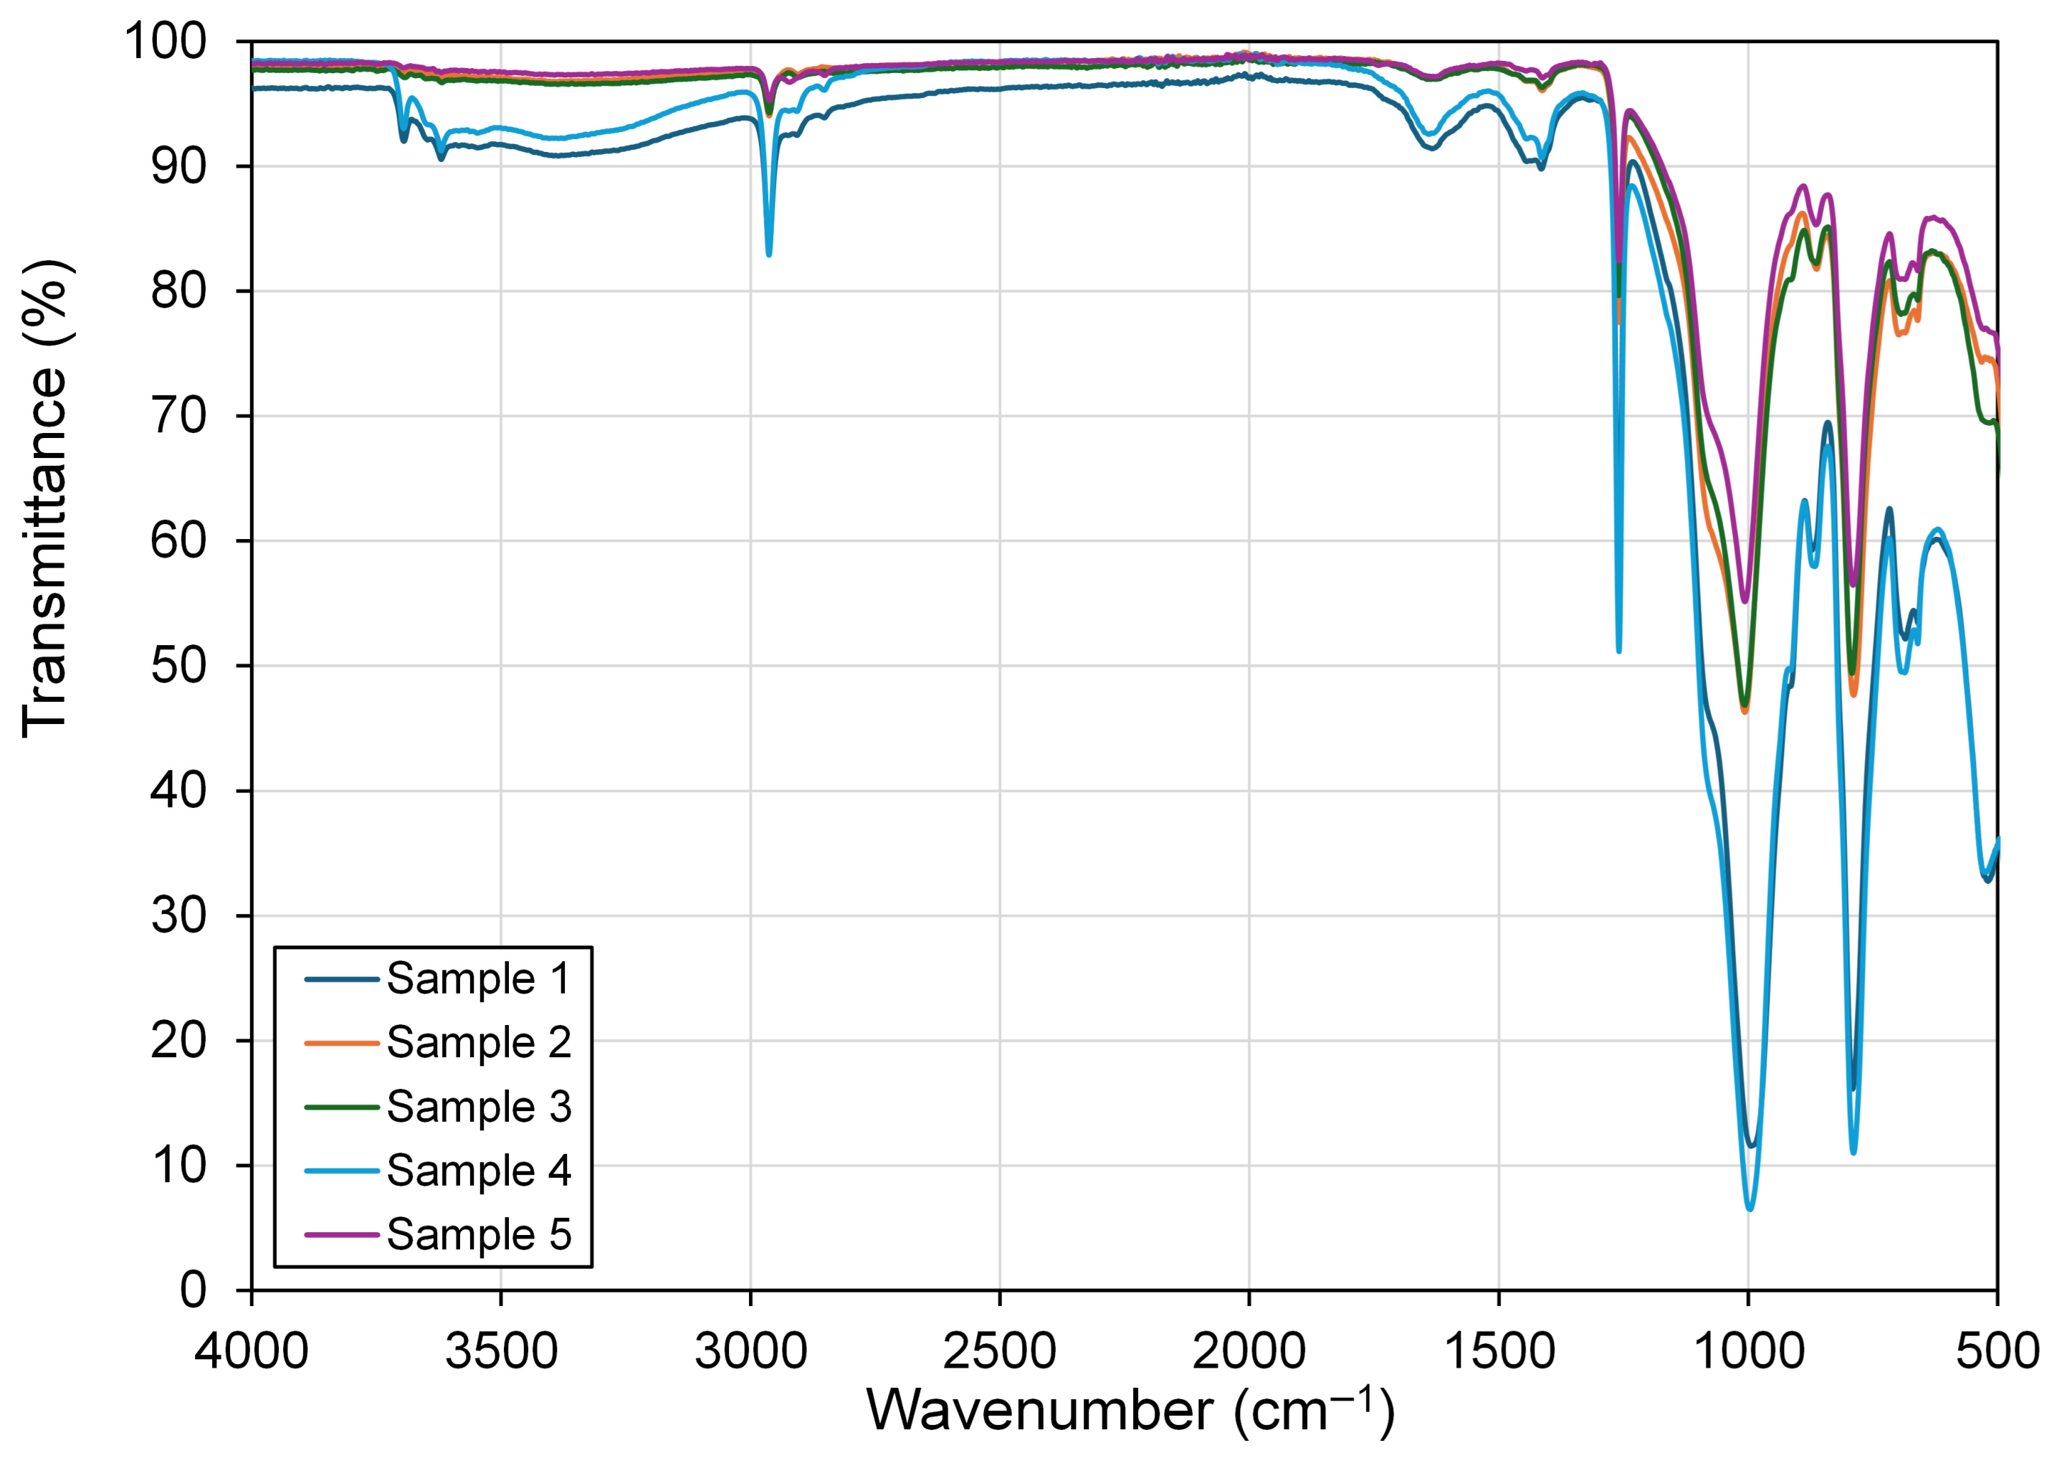
Figure 16 illustrates the FTIR transmittance spectra characteristic of the surface housing material for five shed samples taken along the housing of a service-aged insulator. Similar FTIR spectra were measured for all the investigated insulators. By comparing the measured infrared spectra with those presented in the CIGRE TB 595 [26], the housing material of all the investigated insulators was identified as VMQ/LSR silicone.
Table 6 provides an interpretation of the FTIR transmittance peaks for the investigated specimens. Based on the peaks provided in Table 6, the polymeric housing is confirmed as VMQ/LSR containing kaolin as filler. The wide band between 3000 cm−1 and 3500 cm−1, together with the 1637 cm−1 peak, suggests hydrolysis of the polymer due to the ambient moisture absorbed by the housing, possible due to the hydrophilic nature of kaolin (clay filler). However, the spectra obtained from the failed insulators do not indicate any unusual signs of deterioration; thus, the material condition is like other insulators of the same type and age operating in the same transmission system (environment), which have not demonstrated similar failures.

5. Discussion

Flashunder failure in composite insulators is associated with the formation of a conductive path through the insulator, along the interface formed between the rod and the polymeric housing of the insulator. This kind of insulator failure can be recognized through visual inspection, by the presence of holes or puncturing or treeing traces along the sheath of composite insulators. Based on the investigation of a group of silicone rubber (SIR) insulators installed in a coastal transmission line presented in this study, the following insights and discussions regarding their short-term performance can be summarized.
Consequently, by combining the visual inspection findings of the failed insulators with those of a new unused insulator, the following scenario may be suggested for the flashunder of insulators.
(a)
There are indications of low adhesion (Table 4) and the formation of voids at the interface between the fiberglass rod and the polymeric housing (Figure 15). A possible reason is the inadequate application of the primer on the rod and the end fittings and a lack of sufficient drying time during the manufacturing process.
(b)
During the insulator operation, due to the temperature difference between the insulator rod and the housing surface, humidity condensation from the air trapped in the voids found at the rod and housing interface may develop, leading to the formation of water droplets in the voids due to the hydrophobic nature of polymeric housing. In addition, the poor adhesion between the polymeric housing and the rod possibly permits moisture to ingress within the interface from the sealing area.
(c)
The formation of water droplets in the voids may increase the electric field intensity in those areas and may possibly initiate corona activity, leading to the wetting of the voids and the formation of conductive paths in the voids. The electric field enhancement at the region of the voids within insulating materials, as well as due to the presence of water droplets on insulating surfaces, has been investigated in the literature [35,36].
(d)
Since the wet conductive regions in the voids have different potentials, it is possible to have the inception of surface partial discharges between the conductive areas in the voids.
(e)
The high temperature released by the development of the internal surface partial discharges assists the formation of tracking and the erosion of the polymeric housing.
(f)
The conductivity of the tracking path is constantly increasing due to the ingress of ambient moisture and pollution through the burnt housing, leading to the full bridge of the rod due to internal surface partial discharges (flashunder).
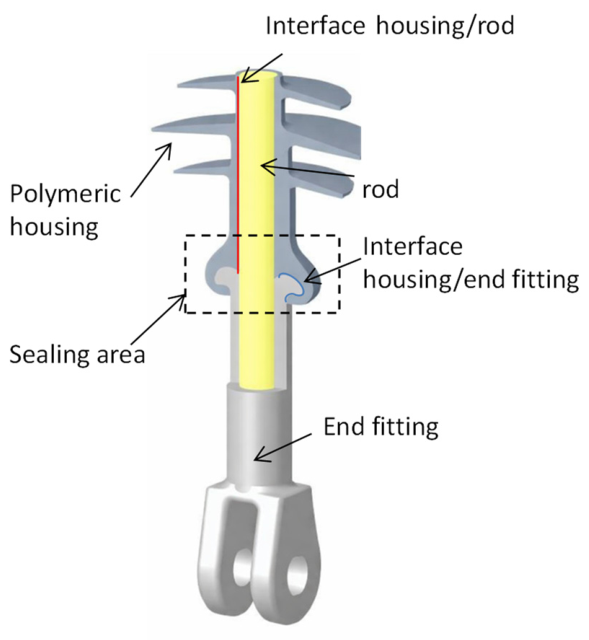
To further clarify the proposed failure mechanism, Figure 17 presents the anatomy of the lower section of a composite insulator with housing made by injection molding and overmolded end fitting according to IEC 61109:2025 [5].
The proposed failure mechanism of flashunder development is in agreement with the mechanism described in [37,38]. An extant review of possible theories for the flashunder failure of composite insulators has been published in [39].

6. Conclusions

An evaluation of forty service-aged silicone rubber insulators operated for 6 years on a coastal overhead transmission line has been performed to understand the flashunder mechanism of composite insulators. By performing FTIR ATR measurements, the housing material was characterized as LSR silicone rubber, and it contained kaolinite as a filler. The visual inspection and SEM images, together with the mechanical pull-off test, showed that the main cause of the flashunder is the poor adhesion of the polymeric housing. By combining the extent of damages with the local pollution at the area of the insulators’ installation, it was deduced that the flashunder process enhances with the pollution severity level. All the service-aged insulators were found to be hydrophobic, characteristic of the excellent hydrophobic properties of silicone rubber materials. The tanδ value increased with the extent of damages on the housing of insulator, showing that this electrical measurement could be a useful tool for assessing the insulation performance of the insulators.

Author Contributions

Conceptualization, N.M. and K.S.; methodology, K.S.; software, N.M. and K.S.; validation, N.M. and K.S.; formal analysis, N.M.; investigation, N.M.; resources, N.M. and K.S.; data curation, N.M.; writing—original draft preparation, N.M. and K.S.; writing—review and editing, N.M. and K.S.; visualization, N.M. and K.S.; supervision, K.S.; project administration, K.S. All authors have read and agreed to the published version of the manuscript.

Funding

This research received no external funding.

Data Availability Statement

The original contributions presented in the study are included in the article; further inquiries can be directed to the corresponding author.

Conflicts of Interest

Both authors were employed by the Hellenic Electricity Distribution Network Operator S.A. The authors declare that the research was conducted in the absence of any commercial or financial relationships that could be construed as a potential conflict of interest.

Abbreviations

The following abbreviations are used in this manuscript:
TanδDielectric Loss Tangent
ATR-FTIRAttenuated Total Reflectance–Fourier Transform Infrared
UAVUnmanned Aerial Vehicle
SIRSilicone Rubber

References

  1. Hall, J.F. History and bibliography of polymeric insulators for outdoor applications. IEEE Trans. Power Deliv. 1993, 8, 376–385. [Google Scholar] [CrossRef]
  2. Pigini, A. HV composite insulator today: Market size & reliability. INMR 2011, 19, 1–10. [Google Scholar]
  3. Hackam, R. Outdoor HV composite polymeric insulators. IEEE Trans. Dielectr. Electr. Insul. 1999, 6, 557–585. [Google Scholar] [CrossRef]
  4. WG B2.57. Experience with and Application Guide for Composite Line Insulators; T.B. 919; CIGRE: Paris, France, 2023. [Google Scholar]
  5. IEC 61109:2025; Insulators for Overhead Lines—Composite Suspension and Tension Insulators with AC Voltage Greater than 1000 V and DC Voltage Greater than 1500 V- Definitions, Test Methods and Acceptance Criteria. International Electrotechnical Commision: Geneva, Switzerland, 2025.
  6. WG B2.21. Guide for the Assessment of Composite Insulators in the Laboratory After Their Removal from Service; T.B. 481; CIGRE: Paris, France, 2011. [Google Scholar]
  7. IEC 61109:2008; Insulators for Overhead Lines—Composite Suspension and Tension Insulators for a.c. Systems with a Nominal Voltage Greater than 1 000 V—Definitions, Test Methods and Acceptance Criteria. International Electrotechnical Commision: Geneva, Switzerland, 2008.
  8. WG 22.03. Worldwide service experience with HV composite insulators. ELECTRA 2000, 19, 27–43. [Google Scholar]
  9. Stefanakis, J.; Thalassinakis, E.; Siderakis, K.; Agoris, D.; Dialynas, E. Fighting pollution in the cretan transmission system: 25 years experience. In Proceedings of the Contamination Issues on High Voltage Installations, Iraklion, Greece, 14–15 June, 2001. [Google Scholar]
  10. Siderakis, K. Pollution maintenance techniques in coastal high voltage installations. Eng. Technol. Appl. Sci. Res. 2011, 1, 1–7. [Google Scholar] [CrossRef]
  11. Znaidi, R. Expanded test station helps greek power system operator assess insulator design and performance. INMR 2015, 107, 54–67. [Google Scholar]
  12. Siderakis, K.; Agoris, D. Evaluation of the pollution performance of SIR materials in the cretan transmission system in correlation to the pollution model of Crete. In Proceedings of the Mediterranean Conference and Exhibition on Power Generation, Transmission, Distribution and Energy Conversion, Athens, Greece, 4–6 November 2002. [Google Scholar]
  13. Thalassinakis, E.; Stefanakis, J.; Siderakis, K.; Agoris, D. Measures and techniques against pollution in the cretan transmission system. In Proceedings of the International Conference on Power and Energy Systems, Marina del Rey, CA, USA, 13–15 May 2002. [Google Scholar]
  14. Mavrikakis, N.C.; Koudoumas, E.; Siderakis, K.; Pylarinos, D.; Thalassinakis, E.; Kokkinaki, O.; Klini, A.; Kalpouzos, C.; Polychronaki, M.; Anglos, D. Insulators’ pollution problem: Experience from the coastal transmission system of Crete. In Proceedings of the 52nd International Universities Power Engineering Conference, Heraklion, Greece, 28–31 August 2017. [Google Scholar]
  15. Hellenic National Meteorological Service. Climatic Data for Selected Stations in Greece. Available online: http://oldportal.emy.gr/emy/en/climatology/climatology_city?perifereia=South%20Aegean&poli=Rodos (accessed on 8 March 2026).
  16. Poseidon System. Surface Wind Forecast. Available online: https://poseidon.hcmr.gr/map?model=meteo&param=w10&date=2026-02-23T17:00:00Z&coords=35.869,25.889,8 (accessed on 23 February 2026).
  17. WG B2.21. Assessment of In-Service Composite Insulators by Using Diagnostic Tools; T.B. 545; CIGRE: Paris, France, 2013. [Google Scholar]
  18. STRI. Guide for Visual Identification of Deterioration & Damages on Suspension Composite Insulators; Guide 5; STRI: Panama City, Panama, 2005. [Google Scholar]
  19. EPRI. Field Guide: Visual Inspection of Polymer Insulators; EPRI: Palo Alto, CA, USA, 2006. [Google Scholar]
  20. IEC Technical Specification 62073; Guidance on the Measurement of Wettability of Insulator Surfaces. International Electrotechnical Commision: Geneva, Switzerland, 2016.
  21. Rawls, J.A. Power-factor testing for finding insulation values. Electr. Eng. 1951, 70, 961. [Google Scholar] [CrossRef]
  22. Ehsani, M.; Borsi, H.; Gockenbach, E.; Morshedian, J.; Bakhshandeh, G.R.; Shayegani, A.A. Effect of aging on dielectric behavior of outdoor polymeric insulators. In Proceedings of the 2004 IEEE International Conference on Solid Dielectrics, 2004. ICSD 2004, Toulouse, France, 5–9 July 2004; pp. 312–315. [Google Scholar]
  23. Gerdinand, F.; Budde, M.; Kurrat, M. Electrical and mechanical strength of mineral filled epoxy insulators in correlation to power loss factor. In Proceedings of the 2004 IEEE International Conference on Solid Dielectrics, ICSD 2004, Toulouse, France, 5–9 July 2004; pp. 320–323. [Google Scholar]
  24. Bashir, N.; Ahmad, H.; Suddin, M.S. Ageing studies on transmission line glass insulators using dielectric dissipation factor test. In Proceedings of the 2010 Conference Proceedings IPEC, Singapore, 27–29 October 2010; pp. 1062–1066. [Google Scholar]
  25. Cheng, L.; Liao, R.; Yang, L.; Zhang, F. An optimized infrared detection strategy for defective composite Insulators according to the law of heat flux propagation considering the environmental factors. IEEE Access 2018, 6, 38137–38146. [Google Scholar] [CrossRef]
  26. WG D1.27. Fingerprinting of Polymeric Insulating Materials for Outdoor Use; T.B. 595; CIGRE: Paris, France, 2014. [Google Scholar]
  27. WG D1.14. Evaluation of Dynamic Hydrophobicity Properties of Polymeric Materials for Non-Ceramic Outdoor Insulation Retenion and Transfer of Hydrophobicity; T.B. 442; CIGRE: Paris, France, 2010. [Google Scholar]
  28. INMR. Optimizing Adhesion Between Silicone Elastomers & Substrates. Available online: https://www.inmr.com/ensuring-optimal-adhesion-between-silicone-elastomers-substrates (accessed on 8 April 2026).
  29. Friel, J.J. X-Ray and Image Analysis in Electron Microscopy, 2nd ed.; Princeton Gamma-Tech: Princeton, NJ, USA, 2003. [Google Scholar]
  30. Wang, F.; Li, Y.; Wang, D. Adhesion enhancement for liquid silicone rubber and different surface by organosilane and Pt catalyst at room temperature. Bull. Mater. Sci. 2013, 36, 1013–1017. [Google Scholar] [CrossRef]
  31. Han, R.; Shao, Y.; Quan, X.; Niu, K. Effects of titanate on the bonding properties of silicone rubber and polyester fabric. Polym. Compos. 2021, 42, 2370–2379. [Google Scholar] [CrossRef]
  32. Smith, A.L. Infrared spectra-structure correlations for organosilicon compounds. Spectrochim. Acta 1960, 16, 87–105. [Google Scholar] [CrossRef]
  33. Socrates, G. Infrared and Raman Characteristic Group Frequencies: Tables and Charts, 3rd ed.; John Wiley & Sons: West Sussex, UK, 2004. [Google Scholar]
  34. Farmer, V.C. The Infrared Spectra of Minerals; Mineralogical Society: London, UK, 1974. [Google Scholar]
  35. Lerchbacher, M.; Sumereder, C.; Lemesch, G.; Ramsauer, F.; Muhr, M. Impact of small voids in solid insulating materials. In Proceedings of the 10th International Conference on the Properties and Applications of Dielectric Materials, Bangalore, India, 24–28 July 2012. [Google Scholar]
  36. Kyere, I.K.; Walker, J.; Nyamupangedengu, C. Simlulation of electric field effects in high voltage insulation material containing air voids. In Proceedings of the 2019 Southern African Universities Power Engineering Conference/Robotics and Mechatronics/Pattern Recognition Association of South Africa, Bloemfontein, South Africa, 28–30 January 2019. [Google Scholar]
  37. Gutman, I.; Lundengard, J.; Ahlort, C. Need of standardized adhesion test for composite insulators: Lessons learned from service experience and testing. In Proceedings of the 20th International Symposium on High Voltage Engineering, Buenos Aires, Argentina, 27 August–1 September 2017. [Google Scholar]
  38. Liu, H.; Yang, T.; Zhou, C.; Jia, R.; Zhang, Y.; Qi, Z. Analysis of 500kV composite insulator fracture fault. In Proceedings of the 3rd International Conference on Mechanical, Electric and Industrial Engineering, Kunming, China, 23–25 May 2020. [Google Scholar]
  39. Pang, G.; Zhang, Z.; Hu, J.; Hu, Q.; Zheng, H.; Jiang, X. Analysis of failures and protective measures for core rods in composite long-rod insulators of transmission lines. Energies 2025, 18, 3138. [Google Scholar] [CrossRef]
Figure 1. The 150 kV transmission lines of Rhodes; the marked area shows the transmission line of Genadi–Katavia.
Energies 19 02325 g001
Figure 2. Findings from the in situ inspection: insulators that failed from flashunder.
Energies 19 02325 g002
Figure 3. Location of the failed insulators: (a) the red box shows the section of the 150 kV transmission line and (b) the red box shows the exact location of the three consecutive towers where the flashunder of insulators was detected.
Energies 19 02325 g003
Figure 4. Details of the wind for the island of Rhodes [15,16]: (a) annual wind frequencies, (b) average annual wind speed per month and (c) map of the dominant wind characteristics.
Energies 19 02325 g004
Figure 5. Flow chart of insulators’ testing procedure.
Energies 19 02325 g005
Figure 6. Visual inspection findings caused by flashunder failure of a composite insulator.
Energies 19 02325 g006
Figure 7. Detecting defects on insulator components following the removal of polymeric housing: (a) tracking path on the rod, (b) oxidation of ground end fitting and (c) oxidation of high-voltage end fitting.
Energies 19 02325 g007
Figure 8. Formation of distinct water droplets on the polymeric housing on an investigated insulator with tracking and erosion traces due to hydrophobic behavior of the housing.
Energies 19 02325 g008
Figure 9. Experimental arrangement for measuring the tanδ of insulators.
Energies 19 02325 g009
Figure 10. Tanδ measurements of the investigated insulators and of the air at various frequencies.
Energies 19 02325 g010
Figure 11. Pull-off test of the investigated insulators: (a) metallic clamp for the mounting of the insulators; (b) experimental arrangement used for performing the pull-off test.
Energies 19 02325 g011
Figure 12. Measuring the tensile force for detaching the housing sample from the rod.
Energies 19 02325 g012
Figure 13. Poor adhesion between polymeric housing and rod.
Energies 19 02325 g013
Figure 14. Evaluation of the adhesion between the housing and the rod on an unused insulator from the same batch of the failed insulators: (a) poor adhesion; (b) internal housing surface of the detached shed sample.
Energies 19 02325 g014
Figure 15. SEM image: the internal surface of the insulator housing.
Energies 19 02325 g015
Figure 16. FTIR transmittance spectra for five shed samples taken along the polymeric housing of an investigated insulator.
Energies 19 02325 g016
Figure 17. Anatomy of a composite insulator.
Energies 19 02325 g017
Table 1. Characteristics of the transmission lines.
Transmission Lines7
Length (km)147
Number of Towers420 + 16 (poles)
Number of Insulators4032
Table 2. Characteristics of the investigated insulators.
ClassesDescriptionExtent of Damage Along the HousingNumber of Insulators
Upper Section MiddleLower Section
Class 1Non-apparent damageooo3
Class 2Damages in the area close to hv insulator fittingoox10
Class 3Damages in the areas close to both end fittings of insulatorxox4
Class 4Damages through the full length of polymeric housingxxx23
Total number of insulators40
o: no signs of deterioration. x: traces of deterioration.
Table 3. Tanδ measurements of the investigated insulators and the test setup at a test voltage of 10 kV and a frequency of 50 Hz.
SampleNumber of tanδ Measurements Average Value tanδ(%)
10 kV @50 Hz
Standard Deviation of tanδ(%)
Test setup32.40.05
New insulator33.50.10
Class 1 insulator93.90.20
Class 2 insulator304.30.30
Class 3 insulator124.60.32
Class 4 insulator697.60.78
Table 4. Tensile force measurements and tensile strength calculations required for the detaching of polymeric housing samples from the insulator rod.
InsulatorNumber of Pull-Off TestsMeasured Tensile Force (N)Calculated Tensile Stress (N/mm2)
AverageMin. Max. Standard DeviationAverage
New1040206013.50.06
Class 130260160420600.36
Class 2100460220620900.63
Class 340440240620900.61
Class 423042040520700.58
Table 5. Elemental composition of the internal surface material of the housing at the area of the blue line.
ElementAtomic Percentage (%)
C33
O23.59
Al0.48
Si31.93
Ca0.90
Ti0.45
Pt0.52
Au8.43
Total100
Table 6. FTIR characteristic peaks for silicone rubber materials [26,32,33,34].
Chemical BondWavenumber (cm−1)Interpretation
Si–C 790 Characteristic for methyl-substituted silicates.
Si–O–Si 1079 & 998 Characteristic of siloxane backbone.
Si–CH3 1260 Characteristic peak for silicone/PDMS.
C–H 1418Characteristic of methyl group structure.
C=C/H2O1637Characteristic of vinyl groups or water molecules.
C–H 2905, 2850 & 2962Characteristic of methylene groups.
O–H 3000–3500Characteristic of O-H in water or silanol.
O–H3696 & 3621Characteristic of O-H in kaolin.
Disclaimer/Publisher’s Note: The statements, opinions and data contained in all publications are solely those of the individual author(s) and contributor(s) and not of MDPI and/or the editor(s). MDPI and/or the editor(s) disclaim responsibility for any injury to people or property resulting from any ideas, methods, instructions or products referred to in the content.