Article

Dielectric Response Characteristics and a Preliminary Ice-Type Discrimination Framework for Ice Accretion on High-Voltage Transmission Lines

Xuefeng Mountain Energy Equipment Safety National Observation and Research Station, Chongqing University, Chongqing 400044, China
*
Author to whom correspondence should be addressed.
Energies 2026, 19(10), 2316; https://doi.org/10.3390/en19102316
Submission received: 3 April 2026 / Revised: 29 April 2026 / Accepted: 9 May 2026 / Published: 12 May 2026

Abstract

Atmospheric ice accretion on transmission lines threatens the safe operation of power systems, whereas existing monitoring methods mainly focus on ice thickness, load, or morphology and provide limited material-related information for distinguishing ice types. This study investigates the dielectric response of ice and snow samples to evaluate its feasibility for preliminary ice-type discrimination. Artificial glaze ice and natural snow samples were measured using a self-built temperature-controlled parallel-plate system within 10–100 kHz. The effects of freezing-water conductivity, temperature, surface water film, and snow density were examined, and representative glaze ice, dry snow, and wet snow samples were further compared under the same measurement framework. The results show that the dielectric constant generally decreases with frequency, while conductivity, water film, and density mainly increase the response magnitude and, in some cases, alter the prominence of loss-related features. These trends are consistent with reported dielectric dispersion, conductive loss, and snow density-related mixing behavior. Dielectric loss provides clearer differences between glaze ice and snow-related samples than dielectric constant alone, whereas dry and wet snow require combined consideration of dielectric constant and loss. A preliminary two-step hierarchical framework is therefore proposed for the tested sample set. Further validation over broader frequency ranges and conductor-like geometries is required before practical application.

1. Introduction

Atmospheric icing has emerged as a significant external factor affecting the safe operation of transmission lines and power generation equipment, with its impact on power system performance and supply reliability garnering widespread industry attention [1]. Icing not only causes mechanical overload and structural damage but also exhibits distinct electrical and physical properties depending on its type [2], thereby inducing differentiated failure modes—ranging from insulator flashover to tower collapse, which in severe cases can lead to regional power outages [3,4]. Consequently, modern grid disaster prevention and early warning systems must extend beyond conventional ice thickness monitoring. Achieving precise ice-type identification has become a critical technological element for enhancing grid proactive defense capabilities and safeguarding energy and power security, forming the core starting point of this research.
Current grid ice monitoring technologies still exhibit significant limitations in type recognition. Ice monitoring techniques based on conductor tension and sag convert ice loads into average equivalent thickness per span, with their underlying principles limiting the ability of such devices to perceive ice types [5,6,7]. Image and optical recognition technologies monitor ice by capturing conductor surface images and analyzing ice morphological features, yet their stability in complex environments is compromised by variations in illumination and environmental interference, making reliable ice-type determination challenging [8,9]. Fiber-optic sensing technology estimates ice thickness and load by measuring variations in optical signals within fibers. However, its focus on conductor strain and temperature changes lacks the dielectric parameters required to distinguish between different ice types, resulting in limited identification capability [10,11]. Emerging electromagnetic monitoring methods (including microwave [12,13], radar [14], capacitive sensing [15,16] and impedance measurement techniques [17,18]) can obtain icing information by analyzing reflected, transmitted, or low-frequency electromagnetic responses. However, most rely on limited electrical parameters at a single frequency point, making it difficult to consistently reflect dielectric differences between ice types. Particularly in the low-to-mid-frequency bands, systematic understanding of the frequency-domain response patterns of different ice types remains lacking. Consequently, electromagnetic methods still exhibit insufficient accuracy and reliability in ice-type identification.
To overcome the limitations of existing monitoring techniques in identifying ice types, academic attention has turned to studying the dielectric properties of ice layers. Early dielectric theory research on sea ice established correlations between microwave and low-frequency electromagnetic responses and internal ice structures [19]. Subsequent studies on ice relaxation mechanisms and the influence of dielectric models for snow and liquid water content further revealed microscopic connections between ice lattice structures, water states, and dielectric spectral characteristics [20,21,22]. With advances in capacitance and impedance-based sensing technologies, related research has begun exploiting the differences in dielectric constants between air, ice, and water for ice thickness monitoring and density estimation [23], gradually finding application in online ice monitoring scenarios for transmission lines [24,25]. However, most existing dielectric or electromagnetic icing-related studies have mainly focused on ice detection, thickness estimation, density inversion, liquid-water-content retrieval, or fundamental dielectric characterization of specific ice or snow materials. Relatively limited attention has been paid to comparing the low-to-mid-frequency dielectric spectra of typical transmission-line ice accretion forms under a unified measurement framework. In particular, the differences in dielectric constant and dielectric loss among glaze ice, dry snow, and wet snow, and their potential use for preliminary ice-type discrimination, still require further investigation.
To address this issue, this paper investigates the dielectric-response characteristics of ice and snow samples within a 10–100 kHz measurement window. The effects of conductivity, temperature, surface water film, and density on the dielectric response are first examined to clarify how external and structural factors influence the measured spectra. Comparative measurements of representative glaze ice, dry snow, and wet snow samples are then conducted under the same dielectric measurement framework. Based on the observed differences in dielectric constant and dielectric loss, a preliminary two-step hierarchical identification framework is proposed for the tested sample set. The purpose of this study is not to establish a universal classification threshold for all icing conditions but to evaluate whether low-to-mid-frequency dielectric spectra can provide comparative information for ice-type discrimination.

2. Materials and Methods

2.1. Experimental Setup and Dielectric Measurement Method

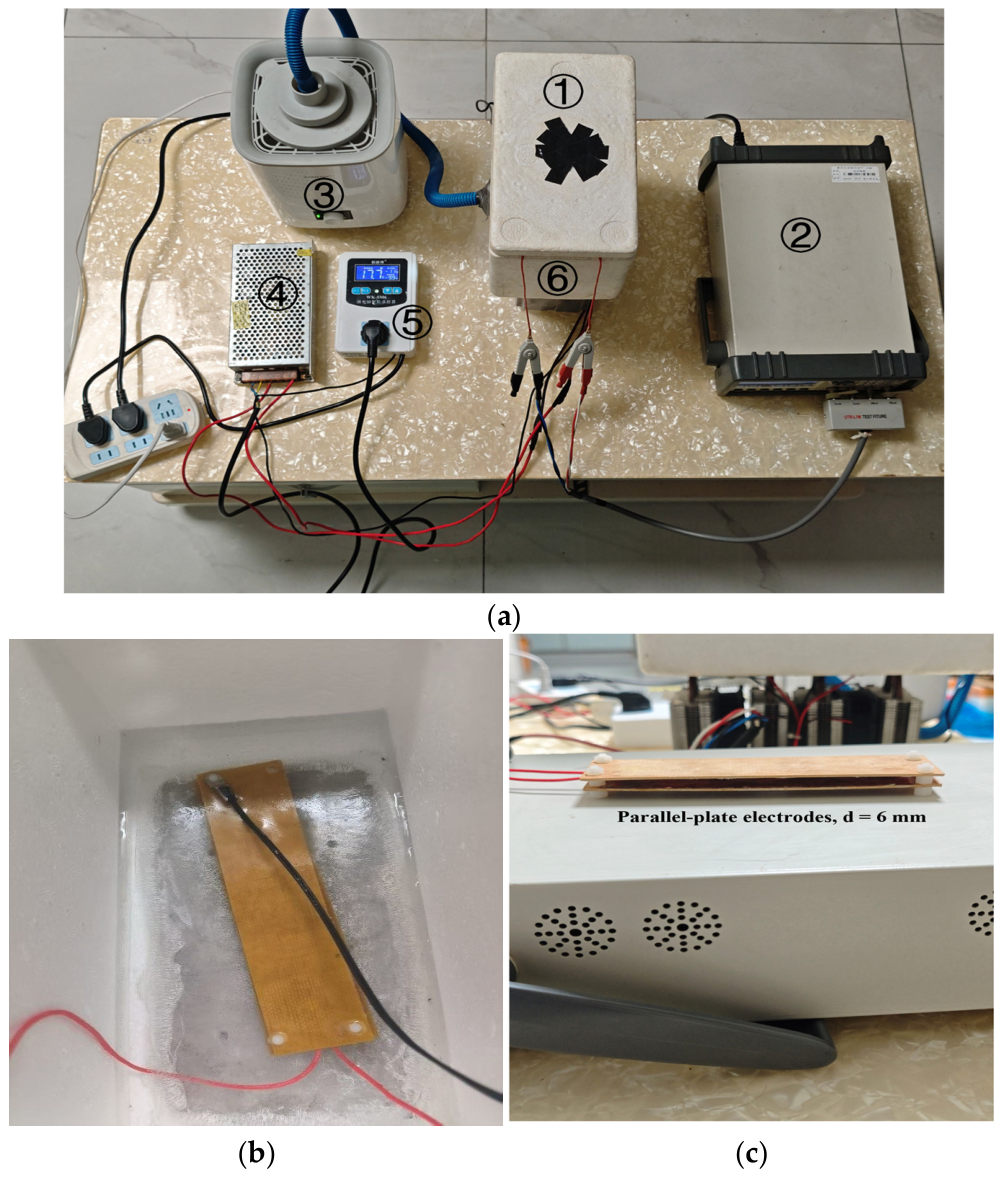
The dielectric measurements were conducted using a self-built temperature-controlled dielectric measurement system, as shown in Figure 1. The system mainly consisted of a UTR2832 LCR meter (UNI-TREND Technology Co., Ltd., Dongguan, China), a temperature-controlled insulated chamber, an XH-W2140 digital thermostat (Mingsuo brand, China), an S-120 DC power supply (Yueqing Mingwei Electric Co., Ltd., Yueqing, China), an HD-1906 industrial atomizer (XinhuShi brand, China), electrode leads, and a pair of parallel-plate electrodes. The figure presents the overall system layout and wiring connections, the measurement arrangement of the glaze ice sample inside the temperature-controlled test chamber, and the detailed configuration of the parallel-plate electrodes with insulating spacers.
In this configuration, temperature regulation and dielectric measurement were implemented through two coordinated paths. For temperature control, the semiconductor cooling unit was embedded at the bottom of the insulated chamber and powered by the DC power supply. A temperature probe was inserted into the chamber to monitor the internal temperature, and the temperature controller regulated the power supply according to the temperature feedback, thereby maintaining the preset low-temperature condition during sample preparation and measurement. For dielectric measurement, the parallel-plate electrodes were placed inside the chamber, and the electrode leads were routed outside the chamber and connected to the test fixture of the LCR meter. The outlet of the industrial atomizer was connected to the side of the chamber, allowing atomized water to be introduced when mist icing conditions were required.
The main structural components of the system were configured to provide controlled thermal and geometric conditions for dielectric characterization. The insulated chamber was constructed from a foam box with dimensions of 25.1 cm × 13.1 cm × 14.6 cm, which provided an enclosed and thermally insulated space for ice formation and sample placement. The parallel-plate electrodes consisted of insulating plates, copper foils, and insulating spacers. The copper foils were attached to the insulating plates to form the upper and lower electrodes, each with nominal dimensions of 17 cm × 5 cm × 1 mm. The electrode gap was fixed at d = 6 mm by the insulating spacers, ensuring a stable and reproducible measurement geometry.
It should be noted that the parallel-plate configuration was selected for material-level dielectric characterization under controlled laboratory conditions. This configuration provides stable sample geometry and is suitable for comparative analysis of dielectric response trends. However, it does not reproduce the curved conductor surface, stranded wire structure, or energized electric field environment of actual transmission lines. Therefore, the results obtained in this study should be regarded as controlled comparative dielectric measurements, and further validation under conductor-like geometries and realistic operating conditions is required before direct engineering application.

2.2. Sample Preparation and Measurement Procedure

Artificial glaze ice samples were prepared under controlled laboratory conditions using the measurement system described above. Deionized water with a conductivity lower than 4 μS/cm was used as the base solution. The solution was introduced into the temperature-controlled insulated chamber, and freezing was initiated from the lower cooling plate. A slow freezing process was maintained for approximately 3–4 h to reduce bubble formation. Through this procedure, transparent and nearly bubble-free glaze ice samples were obtained for subsequent dielectric measurements.
Based on the above preparation procedure, different experimental conditions were further established for the factor-influence tests. For the conductivity test, NaCl was added to the base solution to obtain the specified freezing-water conductivities, and the solution conductivity was measured before sample preparation. For the temperature test, glaze ice samples prepared using the same procedure were measured after the chamber temperature reached each target value and remained stable. For the water-film test, the upper electrode plate was removed after ice formation, and the required volume of deionized water was uniformly added onto the ice surface to form the target water-film thickness. The upper electrode plate was then reinstalled before dielectric measurement.
Natural dry snow and wet snow samples were collected at the Xuefeng Mountain Energy Equipment Safety National Observation and Research Station. The wet snow samples were obtained from naturally wetted snow under field environmental conditions. The field site is located in a typical icing-prone mountainous area with low winter temperatures and high humidity. During the field measurement period, the ambient temperature was generally between −6 and −4 °C, and the relative humidity remained above 60%. Before dielectric measurement, the sample thickness, mass, and volume were recorded. The thickness was measured using a vernier caliper, and the mass was measured using an electronic balance with an accuracy of 0.01 g. The density of each snow sample was then calculated from the measured mass and volume.
For the snow density experiment, snow samples with different target densities were obtained by compression using electrodes with adjustable spacing. This procedure may modify the original snow microstructure, including grain contacts, pore distribution, bonding conditions, and possible liquid water distribution. Therefore, the density-related dielectric differences reported in this study should be interpreted as representative responses associated with density-dominated structural variation, rather than as the isolated effect of density alone in a strictly undisturbed snow state.
Before each measurement, the prepared ice or snow sample was placed between the parallel-plate electrodes, and the sample placement and electrode connection were checked to maintain a consistent measurement geometry. Capacitance and loss factor D were measured using the UTR2832 LCR meter under an applied AC test voltage of 1 Vrms. Open-circuit and short-circuit calibrations were performed before each group of measurements to reduce the influence of stray capacitance, lead impedance, and fixture-related errors. After the sample and chamber temperature reached a stable state, data acquisition was conducted under the selected frequency settings. In this study, the loss factor D was used to represent dielectric loss, i.e., D = tanδ.

2.3. Frequency Range and Data Processing

The main analysis frequency range was set to 10–100 kHz, with one measurement point every 10 kHz. This frequency range was selected by considering both the dielectric response observed in the laboratory measurements and the compatibility with potential miniaturized impedance measurement schemes for future field applications. Although the UTR2832 LCR meter used in this study can operate over a wider frequency range, preliminary evaluations of a potential embedded impedance measurement scheme indicated that the measurement data below 10 kHz were relatively less stable. Therefore, the 10–100 kHz band was selected as the main analysis range to facilitate subsequent comparison and system migration. Within this range, the tested ice and snow samples still exhibited distinguishable dielectric constant and loss-factor spectra.
Nevertheless, this frequency range should be regarded as a practical initial measurement window rather than the complete dielectric response range of ice and snow. Lower-frequency interfacial polarization processes, such as Maxwell–Wagner-type polarization, and higher-frequency dipolar relaxation processes may contain additional discriminative information. Therefore, broader, multi-band measurements will be required in future work to determine the optimal frequency range for ice-type discrimination.
For the artificial glaze-ice experiments, including the conductivity, temperature, and water film conditions, each condition was measured three times under identical settings after the chamber temperature became stable. The curves shown in Figure 2, Figure 3 and Figure 4 were plotted using the mean values and standard deviations of the repeated measurements. The solid lines denote the mean values and the error bands represent the mean ± one standard deviation. If the deviation among repeated measurements exceeded 3%, the sample was re-prepared and measured again.
For the field snow density measurements and natural ice-type comparison, the results were treated as representative comparative measurements obtained under natural field conditions rather than as full repeat-based statistical datasets. Natural snow exhibits strong spatial heterogeneity, and the compression procedure used to obtain different density levels irreversibly modifies the original microstructure. Therefore, strictly matched repeated preparations were difficult to achieve under field conditions. The corresponding results are used to compare dielectric response tendencies among representative natural samples rather than establish a complete statistical classification dataset.

3. Results and Discussion

3.1. Influence of Key Factors on Dielectric Response

Contamination of external insulation in power systems can significantly increase the conductivity of freezing water. According to IEC statistics and domestic artificial contamination tests, the equivalent salt densities under moderate and heavy contamination conditions are 0.01–0.1 mg/cm2 and 0.1–0.5 mg/cm2, respectively, corresponding to surface conductivities of approximately 0.06–0.63 mS/cm and 0.63–3.15 mS/cm for ice-covered water. Therefore, the conductivity range of 4–960 μS/cm investigated in this study covers typical engineering conditions from moderate contamination to the onset of heavy contamination.
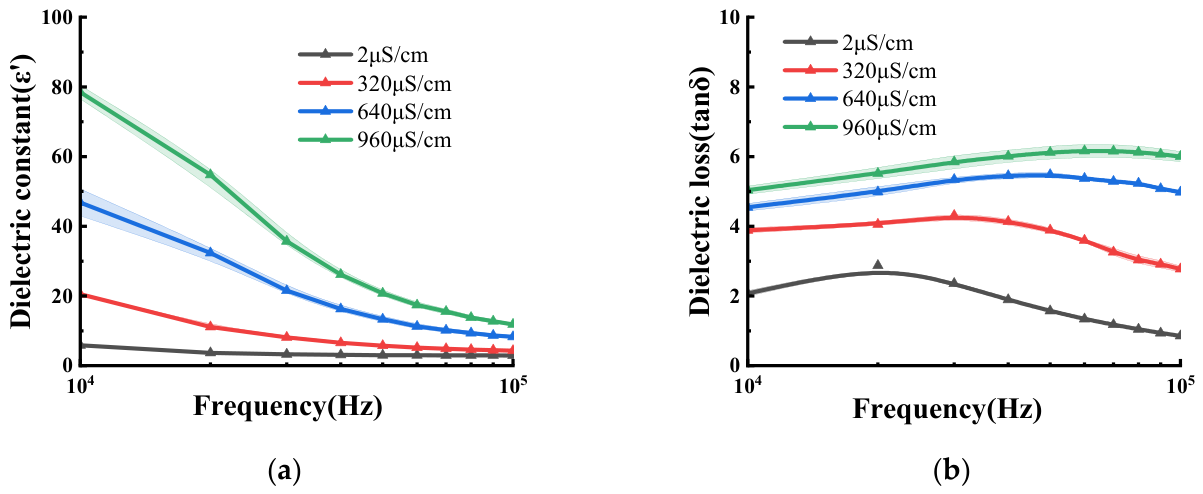
As shown in Figure 2, increasing conductivity leads to an overall increase in both dielectric constant and dielectric loss within the tested frequency range. The rise in dielectric loss is particularly pronounced. At the same time, the dielectric-loss peak becomes broader and less sharp at higher conductivity levels, indicating that conductivity affects not only the response amplitude but also the sharpness of the relaxation feature. The repeated measurements show consistent overall trends, and the relatively narrow error bands over most of the investigated range indicate acceptable repeatability under the present experimental conditions.
This behavior is consistent with the fact that higher ionic content enhances conductive loss and strengthens the low-to-mid-frequency dielectric response of the ice layer. Therefore, within the present 10–100 kHz window, conductivity mainly modifies the response magnitude and the prominence of the relaxation-related feature, while the overall frequency-dependent trend remains similar.
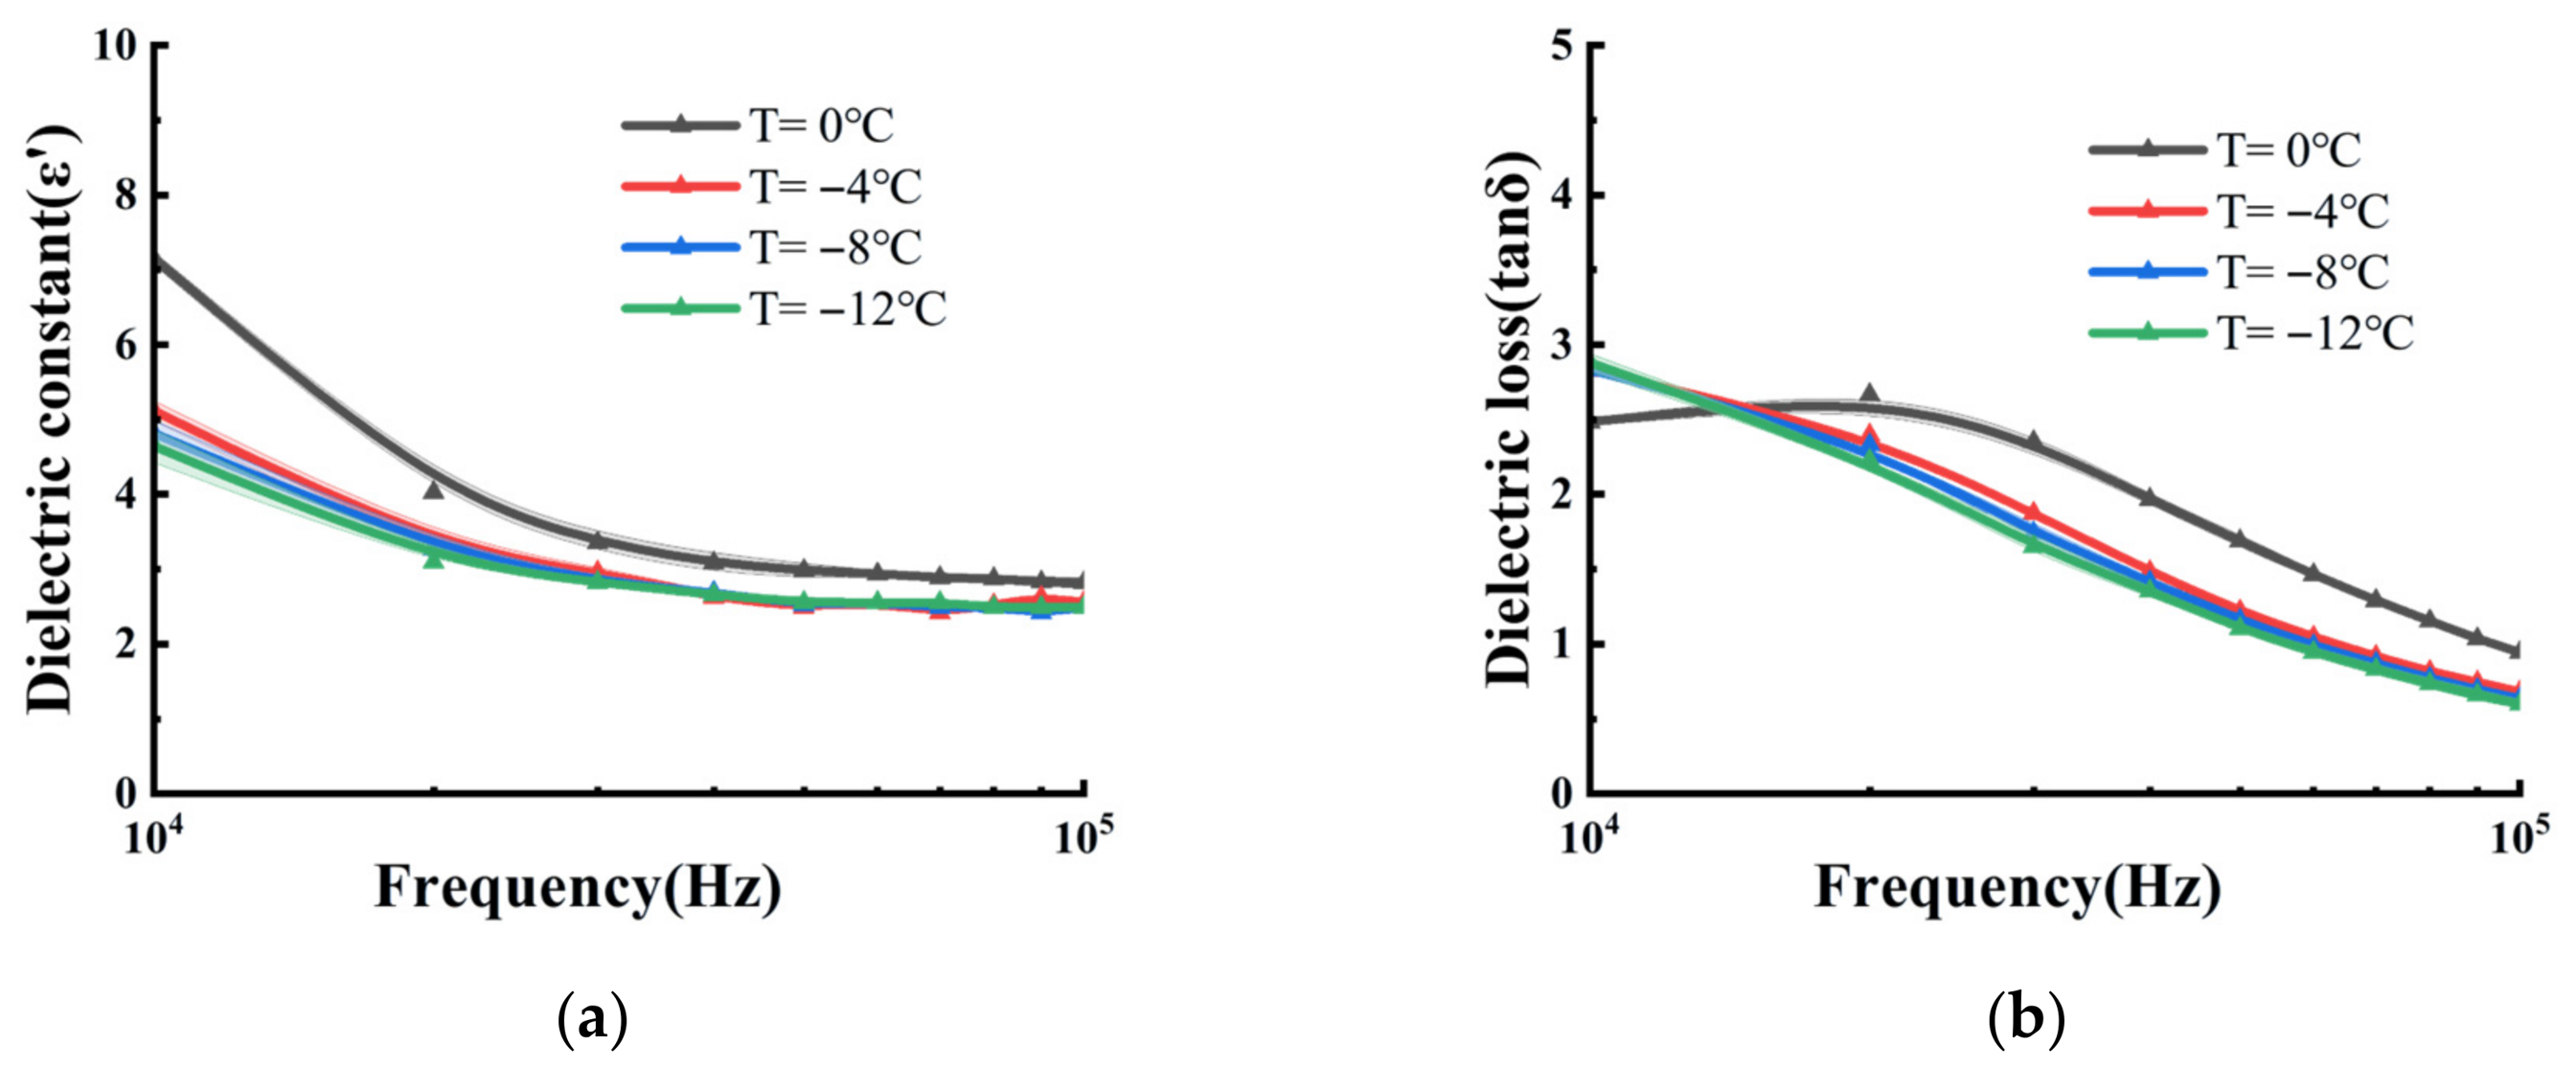
Figure 3 presents the dielectric constant and dielectric loss curves of ice layers at different temperatures. Within the investigated 10–100 kHz range, both dielectric constant and dielectric loss exhibit similar overall frequency-dependent trends at all temperatures. The curves at 0 °C remain slightly higher than those at lower temperatures over most of the measured range, which may be associated with enhanced interfacial response or trace liquid water near the melting point. The repeated measurements show consistent overall trends, and the relatively narrow error bands indicate acceptable repeatability under the present experimental conditions.
Overall, the temperature dependence observed in this study is consistent with thermally activated polarization dynamics. However, within the present 10–100 kHz window, a complete relaxation peak is not resolved. Therefore, the temperature effect is mainly reflected in response magnitude, while the overall frequency-dependent trend remains similar across the investigated temperatures.
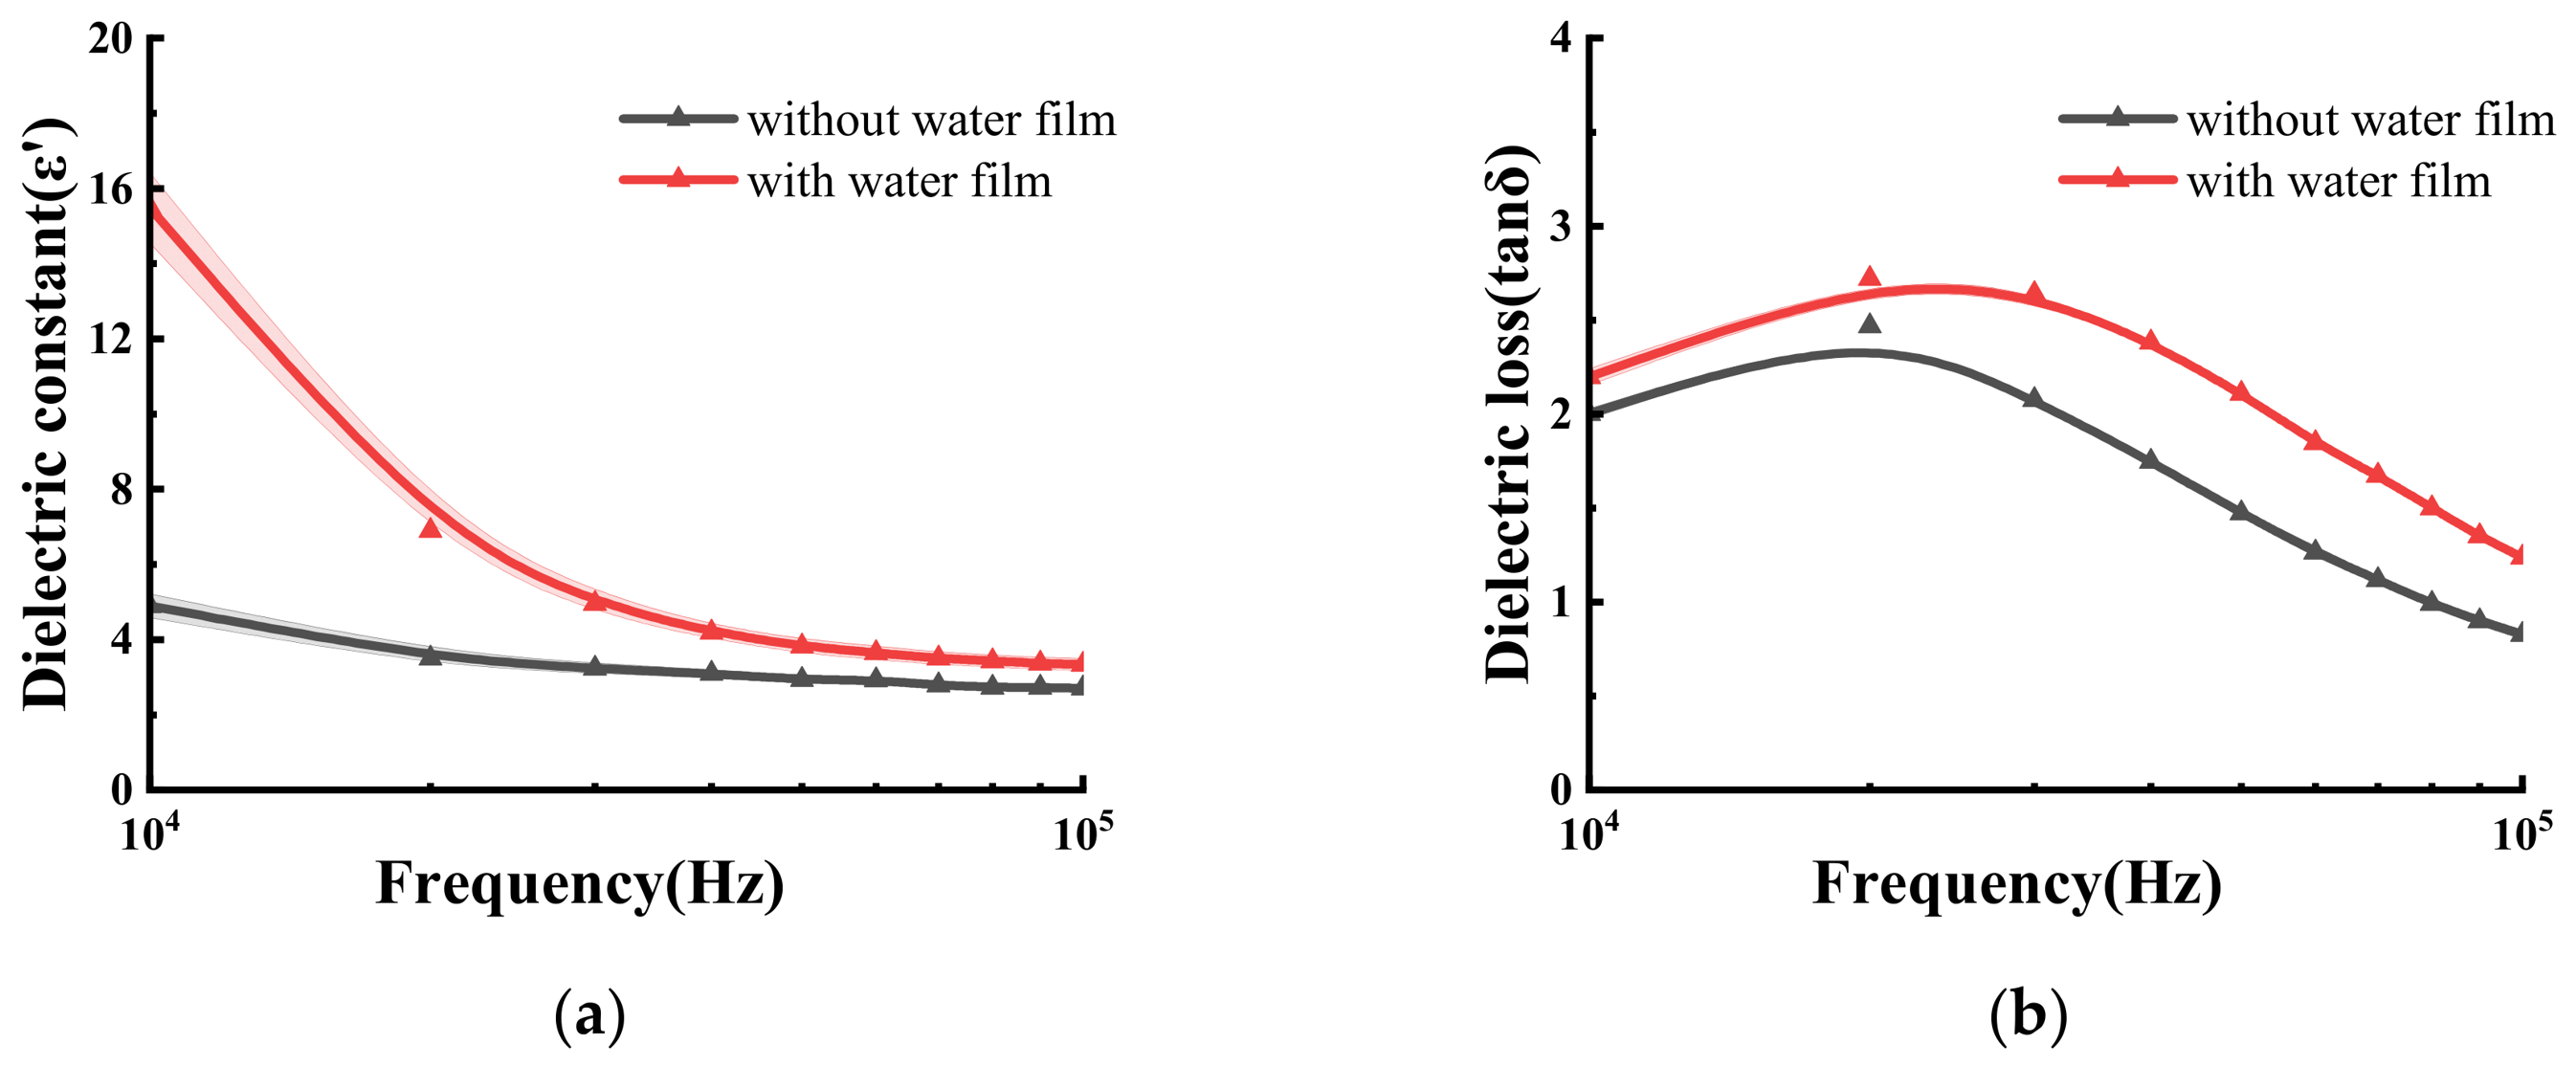
To investigate the effect of a water film on dielectric parameters, the upper electrode plate was removed prior to ice sample preparation. After ice formation, the volume of deionized water required to form a 1 mm surface water film was calculated based on the chamber dimensions and then added uniformly onto the ice surface. The upper electrode plate was subsequently reinstalled for measurement.
Figure 4 compares the dielectric constant and dielectric loss curves of ice layers with and without a water film. As shown in the figure, the presence of the water film leads to an overall increase in both dielectric constant and dielectric loss over the investigated frequency range. In both cases, the dielectric constant decreases gradually with increasing frequency, while the dielectric loss shows a broad maximum in the low-frequency region and then decreases at higher frequencies. The repeated measurements show consistent overall trends, and the relatively narrow error bands indicate acceptable repeatability under the present experimental conditions. Compared with the no-film condition, the main effect of the water film is therefore reflected in response magnitude, while the overall frequency-dependent trend remains similar within the tested range.
This behavior can be attributed to the strong polarity and conductivity of the water film. The additional liquid water layer enhances interfacial polarization and conductive loss, thereby increasing both the dielectric constant and the dielectric loss level. Within the present 10–100 kHz window, no additional dominant spectral feature is resolved, suggesting that the water film effect is mainly manifested as an enhancement of dielectric response intensity rather than a clear change in the overall frequency-dependent pattern.
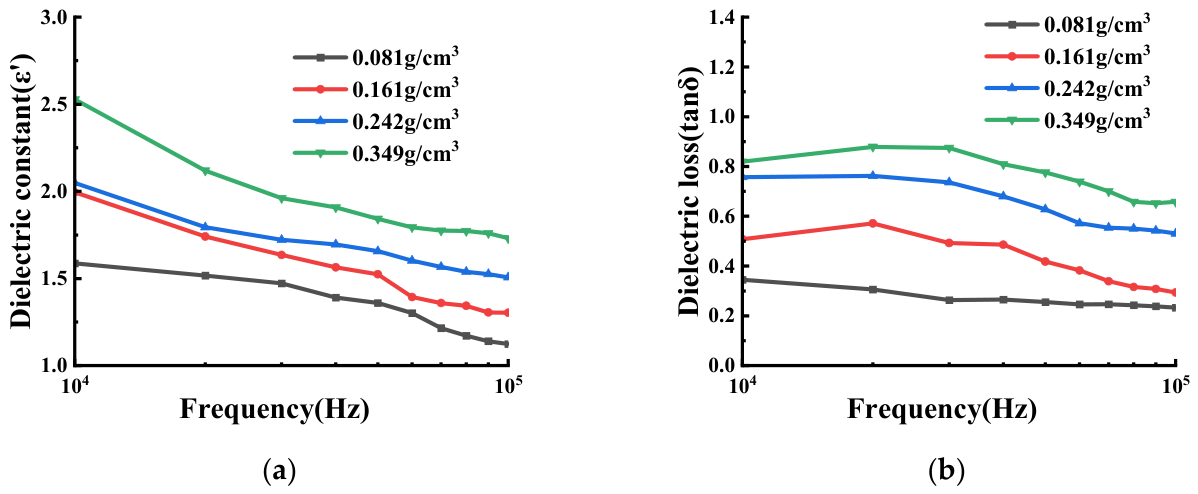
Figure 5 presents the dielectric constant and dielectric-loss curves of dry snow at different densities. As shown in the figure, both dielectric constant and dielectric loss increase with increasing density over the investigated frequency range. This density-related enhancement is more pronounced at lower frequencies and gradually weakens as frequency increases. Within the tested range, the overall frequency-dependent trends of the curves remain similar, and no obvious new spectral feature is introduced.
This behavior can be attributed to the density-dominated structural characteristics of dry snow. Because of its low liquid water content, increasing density mainly enhances the compactness of the ice–air system, reduces air voids, and promotes more continuous ice-phase connectivity. These changes strengthen polarization capability and energy dissipation, resulting in higher dielectric constant and dielectric loss values. Considering that the density levels in this study were obtained through compression under field conditions, the observed dielectric differences should be interpreted as representative responses associated with density-dominated structural variation rather than as the effect of density alone in a strictly isolated sense.
In general, the effects of conductivity, temperature, water film, and density on the dielectric response are mainly reflected in variations in response magnitude and, in some cases, changes in the prominence or sharpness of relaxation-related features, while the overall frequency-dependent trends remain broadly comparable within the tested range. Therefore, these dielectric response characteristics can provide a comparative basis for subsequent ice-type discrimination, although their discriminative performance should still be interpreted in light of environmental and measurement conditions.

3.2. Dielectric Signature of Different Ice Types

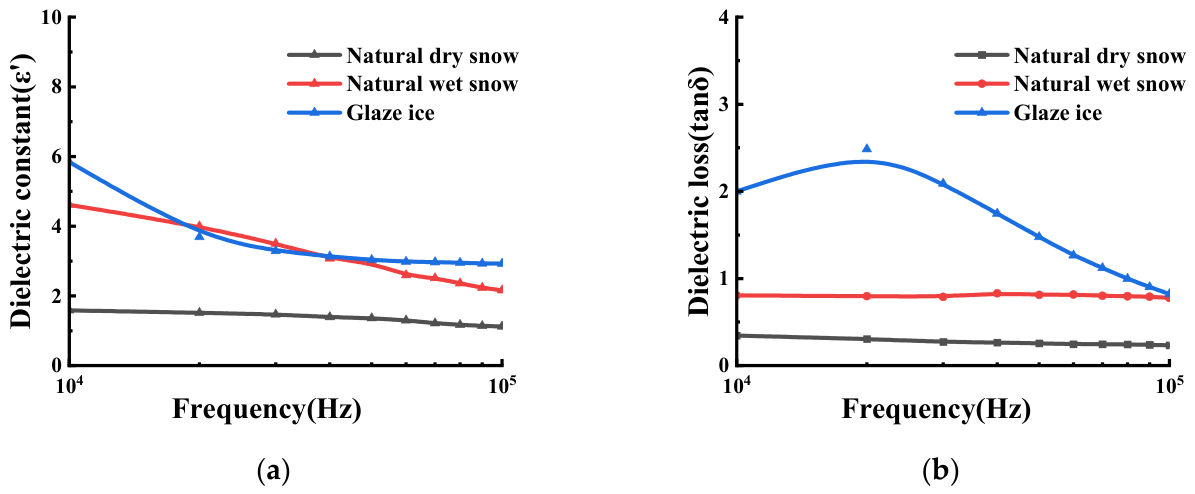
Figure 6 presents the frequency-dependent dielectric response characteristics of three representative ice types. As shown in panel (a), the dielectric constant (ε′) of all three sample types decreases gradually with increasing frequency, and their overall frequency-dependent trends are similar. The differences among the sample types are mainly reflected in magnitude rather than in the general trend of the curves, indicating that the dielectric constant alone is insufficient as a single discriminating parameter.
In contrast, the dielectric loss (tan δ) curves in panel (b) show clearer differences among the tested sample types. Glaze ice exhibits a distinctly higher loss level and stronger frequency dependence than the snow-related samples. By comparison, dry snow and wet snow both show relatively low loss levels and broadly similar curve profiles, indicating that dielectric loss alone has limited discriminating capability for separating these two snow states.
Based on these observations, a preliminary two-step identification framework is proposed for the tested sample set. In the first step, dielectric loss (tan δ) is used as the primary comparative indicator for separating glaze ice from the snow-related samples because glaze ice exhibits a clearly higher loss level within the investigated frequency range. In the second step, dry snow and wet snow are further compared using the combined behavior of dielectric constant and dielectric loss. Under the present experimental conditions, wet snow shows a steeper decrease in dielectric constant with increasing frequency, that is, a larger negative slope of ε′ over the investigated 10–100 kHz range, and maintains relatively higher values than dry snow over most of the measured range.
These differences can be explained by the variations in water content and microstructure among the sample types. Dry snow consists mainly of ice grains and air voids, resulting in weak interfacial polarization and low dielectric response. Glaze ice has a denser structure with stronger interfacial and conductive contributions, leading to enhanced polarization and energy dissipation. In wet snow, the presence of liquid water forms conductive and polarization pathways between ice grains, which enhances dielectric response while also increasing frequency-dependent attenuation.
As frequency increases, the contribution of slower polarization processes gradually weakens, and the dielectric responses of different ice types tend to converge. This behavior provides a comparative physical basis for ice-type discrimination in the present low-to-mid-frequency window. It should be noted, however, that the present study does not establish universal threshold values for classification, and possible overlap may occur for transitional states or ice types not included in the current experiments. Therefore, the above results should be regarded as a preliminary hierarchical identification framework for the tested sample set rather than as a complete decision rule applicable to all atmospheric icing conditions.

3.3. Discussion

3.3.1. Comparison with Previous Dielectric and Icing-Related Studies

The dielectric-response trends observed in this study are generally consistent with previously reported behaviors of ice, snow, and water-containing media. Previous studies on ice dielectric relaxation have shown that the dielectric response of ice is frequency-dependent and closely related to polarization dynamics [21,25]. In the present study, the overall decrease in dielectric constant with increasing frequency agrees with this dielectric dispersion behavior, indicating that the measured spectra follow the expected frequency-dependent response of polar ice/snow media.
The effects of conductivity, surface water film, and snow density also show consistency with established dielectric interpretations. The enhancement of dielectric loss with increasing freezing water conductivity supports the role of ionic impurities and charge migration in energy dissipation. The increase in dielectric response caused by the surface water film is consistent with the high polarity and conductivity of liquid water, which can strengthen interfacial polarization and conductive loss. Similarly, the increase in dielectric constant and loss with dry snow density agrees with snow dielectric mixing concepts because higher density generally corresponds to a larger ice-phase fraction and a lower air-void fraction [22]. These consistencies indicate that the measured responses are physically reasonable, although the compressed snow density samples should still be interpreted as density-dominated structural states rather than undisturbed natural snow.
Compared with previous icing-related dielectric and impedance studies, which have mainly focused on ice detection, thickness estimation, process monitoring, or dielectric characterization of specific materials, the present study further compares the dielectric spectra of representative glaze ice, dry snow, and wet snow under the same 10–100 kHz measurement framework. This comparison indicates that dielectric loss provides clearer differences between glaze ice and snow-related samples than dielectric constant alone, whereas dry and wet snow require combined consideration of dielectric constant and dielectric loss. Therefore, the present work provides a preliminary dielectric response basis for ice-type comparison, rather than a universal classification rule or a fully validated monitoring method.

3.3.2. Scope of the Proposed Framework

Although the dielectric response differences observed in this study provide a basis for ice-type comparison, the proposed framework should be interpreted within the scope of the tested sample set. This study does not establish universal threshold values for separating glaze ice, dry snow, and wet snow, and the use of dielectric loss as a primary indicator is currently valid only under the investigated measurement conditions. Possible overlap may occur for transitional icing states, partially melted snow, rime ice, or other ice accretion forms not included in the present experiments. Therefore, the proposed two-step framework should be regarded as a preliminary hierarchical comparison strategy rather than a complete classification rule. Future work should expand the sample types, environmental conditions, and frequency ranges and further validate the dielectric response features using conductor-like geometries and more realistic transmission-line icing conditions.

4. Conclusions

1. Within the investigated 10–100 kHz range, freezing water conductivity, temperature, surface water film, and snow density all influenced the dielectric response of the tested ice or snow samples. These effects were mainly reflected in changes in response magnitude, while conductivity and water film also affected the prominence of loss-related features. The observed trends are generally consistent with dielectric dispersion as well as conductive loss, liquid water-induced, and snow density-related effects.
2. Comparative measurements of glaze ice, dry snow, and wet snow showed that dielectric loss provided clearer differences between glaze ice and snow-related samples than dielectric constant alone. In contrast, dry snow and wet snow exhibited relatively similar loss levels, indicating that their distinction requires combined consideration of dielectric constant and dielectric loss rather than a single dielectric parameter.
3. Based on the tested sample set, a preliminary two-step hierarchical framework was proposed for ice-type comparison. Dielectric loss was used as the primary comparative indicator for separating glaze ice from snow-related samples, while dry snow and wet snow were further compared using the combined behavior of dielectric constant and dielectric loss. This framework should not be regarded as a universal classification rule because fixed thresholds were not established, and overlap may occur for transitional or untested icing states. Further validation over broader frequency ranges, more sample types, and conductor-like geometries is required before practical transmission-line application.

Author Contributions

Conceptualization, J.H.; methodology, J.H.; validation, J.H. and H.Z.; formal analysis, J.H.; investigation, J.H.; data curation, J.H.; writing—original draft preparation, J.H.; writing—review and editing, H.Z.; supervision, H.Z.; project administration, H.Z. All authors have read and agreed to the published version of the manuscript.

Funding

This research received no external funding.

Data Availability Statement

The data presented in this study are available from the corresponding author upon reasonable request. The data are not publicly available because they are part of ongoing research on transmission-line icing monitoring and will be used in subsequent studies.

Conflicts of Interest

The authors declare no conflicts of interest.

References

  1. Yang, L.; Chen, Z.; Hao, Y.; Lin, X.; Yu, L.; Li, Y.; Yuan, Z.; Li, L. Experimental study on ice monitoring method for 10 kV transmission line with tangent tower in alpine landform. High Volt. 2024, 9, 182–194. [Google Scholar] [CrossRef]
  2. Liu, Y.; Li, C.; Yin, F.; Du, B.; Farzaneh, M. Dynamic interactive characteristics between icicle growth and corona discharge on HVDC outdoor insulators during icing accretion. High Volt. 2023, 8, 570–582. [Google Scholar] [CrossRef]
  3. Fan, C.; Jiang, X.; Xie, Y.; Hu, J.; Zhang, Z.; Hu, Q.; Bi, M. Novel dc flashover model for predicting flashover voltage of the iced insulators. High Volt. 2021, 6, 149–159. [Google Scholar] [CrossRef]
  4. Hao, Y.; Huang, L.; Wei, J.; Pan, R.; Zhang, W.; Yang, L. Interface quasi-distributed fibre Bragg grating positioning detection of glaze icing load on composite insulators. IET Sci. Meas. Technol. 2022, 16, 316–325. [Google Scholar] [CrossRef]
  5. Zeng, M.; Li, Z.; Yan, X.; Yang, Y.; Su, Y.; Wu, J. A Study on Monitoring Wire Icing Based on Tension Correction. In Annual Conference of China Electrotechnical Society; Springer Nature: Singapore, 2024; pp. 171–178. [Google Scholar]
  6. Jiang, X.; Xiang, Z.; Zhang, Z.; Hu, J.; Hu, Q.; Shu, L. Predictive model for equivalent ice thickness load on overhead transmission lines based on measured insulator string deviations. IEEE Trans. Power Deliv. 2014, 29, 1659–1665. [Google Scholar] [CrossRef]
  7. Zhengfei, L.; Qin, H.; Haitao, W.; Xingliang, J.; Jie, L.; Jiankang, B. Method for monitoring the icing thickness of ground wire using sag measurement technology (iSPEC 2023). In 2023 IEEE Sustainable Power and Energy Conference (iSPEC); IEEE: Piscataway, NJ, USA, 2023; pp. 1–6. [Google Scholar]
  8. Weng, B.; Gao, W.; Zheng, W.; Yang, G. Newly designed identifying method for ice thickness on high-voltage transmission lines via machine vision. High Volt. 2021, 6, 904–922. [Google Scholar] [CrossRef]
  9. Hao, Y.; Liang, W.; Yang, L.; He, J.; Wu, J. Methods of image recognition of overhead power line insulators and ice types based on deep weakly-supervised and transfer learning. IET Gener. Transm. Distrib. 2022, 16, 2140–2153. [Google Scholar] [CrossRef]
  10. Luo, J.; Hao, Y.; Ye, Q.; Hao, Y.; Li, L. Development of optical fiber sensors based on Brillouin scattering and FBG for on-line monitoring in overhead transmission lines. J. Light. Technol. 2013, 31, 1559–1565. [Google Scholar] [CrossRef]
  11. Jia, B.; Xia, Y.; Liu, H.; Xu, Y.; Yi, X. Online sensing method for transmission line conductor ice cover based on fiber optic sensing information fusion and continuous wavelet decomposition. Opt. Quantum Electron. 2024, 56, 1418. [Google Scholar] [CrossRef]
  12. Kilani, D.; Niknahad, F.; Shah, A.; Olsen, S.; Meaker, M.; Zarifi, M.H. Wireless microwave sensor network using split ring resonators for ice monitoring applications. IEEE Internet Things J. 2024, 11, 25316–25325. [Google Scholar] [CrossRef]
  13. Shah, A.; Niksan, O.; Zarifi, M.H. Planar Microwave Sensor for Localized Ice and Snow Sensing; SAE Technical Paper; SAE: Warrendale, PA, USA, 2023. [Google Scholar]
  14. Sandven, S.; Johannessen, O.M. Sea Ice Monitoring by Remote Sensing; The American Society for Photogrammetry & Remote Sensing: Baton Rouge, LA, USA, 2006. [Google Scholar]
  15. Jiang, X.L. Research on icing measurement method based on rotating cylindrical three-electrode array. Trans. China Electrotech. Soc. 2024, 39, 1524–1534. [Google Scholar]
  16. Zhu, Y.; Xiong, H.; Tian, Y.; Ji, C.; Hu, J. Monitoring technology of ice-snow-covered photovoltaic modules based on interdigital capacitance. High Volt. Eng. 2022, 48, 20–28. [Google Scholar]
  17. Zheng, D.; Li, Z.; Du, Z.; Ma, Y.; Zhang, L.; Du, C.; Li, Z.; Cui, L.; Xuan, X.; Deng, X. Design of capacitance and impedance dual-parameters planar electrode sensor for thin ice detection of aircraft wings. IEEE Sens. J. 2022, 22, 11006–11015. [Google Scholar] [CrossRef]
  18. Gui, K.; Liu, J.; Ge, J.; Li, H.; Ye, L. Atmospheric icing process measurement utilizing impedance spectroscopy and thin film structure. Measurement 2022, 202, 111851. [Google Scholar] [CrossRef]
  19. Meng, G.; Wang, R. Dielectric Theory of Sea Ice and Its Application in Remote Sensing. Mar. Environ. Sci. 1993, 1, 78–84. [Google Scholar]
  20. Mughal, U.N.; Virk, M.S.; Mustafa, M.Y. Dielectric based sensing of atmospheric ice. AIP Conf. Proc. 2013, 1570, 212–220. [Google Scholar] [CrossRef]
  21. Andersson, O. Dielectric relaxation of the amorphous ices. J. Phys. Condens. Matter 2008, 20, 244115. [Google Scholar] [CrossRef]
  22. Niang, M.; Bernier, M.; Stacheder, M.; Brandelik, A.; van Bochove, E. Influence of snow temperature interpolation algorithm and dielectric mixing-model coefficient on density and liquid water content determination in a cold seasonal snow pack. Subsurf. Sens. Technol. Appl. 2006, 7, 1–22. [Google Scholar] [CrossRef]
  23. Zhu, Y.; Huang, X.; Tian, Y.; Ji, C.; Cao, W.; Zhao, L. Experimental study on the icing dielectric constant for the capacitive icing sensor. Sensors 2018, 18, 3325. [Google Scholar] [CrossRef] [PubMed]
  24. Bhattu, S.K.; Mughal, U.N.; Virk, M.S. Experimental study of relative permittivity of atmospheric ice. Int. J. Energy Environ. 2013, 3, 369–376. [Google Scholar]
  25. Takei, I. Dielectric relaxation of ice samples grown from vapor-phase or liquid-phase water. In Physics and Chemistry of Ice; Kuhs, W.F., Ed.; Royal Society of Chemistry: Cambridge, UK, 2007; pp. 577–584. [Google Scholar] [CrossRef]
Figure 1. Experimental setup, measurement process, and electrode configuration. (a) Overall view of the dielectric measurement system and wiring connection: ① temperature-controlled insulated chamber; ② LCR meter; ③ industrial atomizer; ④ DC power supply; ⑤ temperature controller; ⑥ electrode leads. (b) Measurement of the glaze ice sample inside the temperature-controlled test chamber. (c) Detailed configuration of the parallel-plate electrodes with insulating spacers.
Energies 19 02316 g001
Figure 2. Dielectric constant and dielectric loss spectra of ice layers under different conductivities. (a) Dielectric constant. (b) Dielectric loss. The curves were plotted using the mean values and standard deviations of three repeated measurements. The solid lines denote the mean values and the error bands correspond to the mean ±1 standard deviation.
Energies 19 02316 g002
Figure 3. Dielectric response of ice layers at different temperatures. (a) Dielectric constant. (b) Dielectric loss. The curves were plotted using the mean values and standard deviations of three repeated measurements. The solid lines denote the mean values and the error bands correspond to the mean ±1 standard deviation.
Energies 19 02316 g003
Figure 4. Dielectric response of ice layers with and without a water film. (a) Dielectric constant. (b) Dielectric loss. The curves were plotted using the mean values and standard deviations of three repeated measurements. The solid lines denote the mean values and the error bands correspond to the mean ±1 standard deviation.
Energies 19 02316 g004
Figure 5. Frequency-dependent dielectric response of dry snow with different densities. (a) Dielectric constant of snow. (b) Dielectric loss of snow.
Energies 19 02316 g005
Figure 6. Frequency-dependent dielectric response of different ice types. (a) Dielectric constant. (b) Dielectric loss.
Energies 19 02316 g006
Disclaimer/Publisher’s Note: The statements, opinions and data contained in all publications are solely those of the individual author(s) and contributor(s) and not of MDPI and/or the editor(s). MDPI and/or the editor(s) disclaim responsibility for any injury to people or property resulting from any ideas, methods, instructions or products referred to in the content.