Article

Study on the Economic Benefits of Gas–Wind–Solar Power Alliance Under Gas Peaking Mode

The Natural Gas Economics Research Institute at PetroChina Southwest Oil & Gasfield Company, Chengdu 610017, China
Energies 2026, 19(1), 125; https://doi.org/10.3390/en19010125
Submission received: 28 October 2025 / Revised: 15 December 2025 / Accepted: 23 December 2025 / Published: 25 December 2025

Abstract

Accelerating the integration of wind and solar power is essential for achieving China’s “Dual Carbon” goals, but their inherent intermittency poses significant challenges for grid stability and renewable energy utilization. This study addresses these challenges by proposing a comprehensive economic benefit optimization model for a combined gas–wind–solar power generation system under a natural gas peaking mode. The model systematically incorporates multidimensional economic indicators—including generation revenue, green certificate revenue, curtailment losses, and carbon emission costs—while accounting for operational constraints and the fluctuating nature of renewables. Simulation results show that the hybrid system achieves a total economic benefit of 9.97 million yuan, with operating costs at 20% of income and curtailment plus carbon penalty costs below 2%. Compared to single-source generation, the hybrid approach reduces wind and solar curtailment by over 90%, and maintains high channel utilization. Sensitivity analysis reveals that lower gas prices and higher green certificate prices significantly enhance both renewable energy integration and economic returns, while balanced output scenarios maximize system benefits. This research provides a quantitative assessment of the economic and environmental outcomes of a gas–wind–solar complementary system, offering practical insights to maximize renewable energy utilization and support China’s low-carbon energy transition.

1. Introduction

The Paris Agreement commits the world to reducing greenhouse gas emissions to limit the temperature rise to well below 2 °C above pre-industrial levels [1]. Many countries have set net-zero emission targets, with China proposing its “Dual Carbon” goals [2,3]. As no other nation has attempted to achieve such targets within a comparable timeframe, China’s carbon neutrality pathway is expected to be challenging and demanding. Given China’s heavy reliance on coal for power generation, reducing carbon emissions from the electricity sector will be pivotal to realizing the Dual Carbon goals [4,5]. There is therefore an urgent need to promote and optimize the energy mix for power generation [6,7].
The use of renewable energy sources such as wind and solar as the mainstay is a core feature of modern power systems [8,9]. However, wind and solar energy have characteristics such as randomness and volatility [10,11]. After grid integration, a large number of conventional synchronous generators are replaced by wind and solar units, resulting in reduced system inertia and weakened frequency regulation capabilities, which can easily lead to disconnection issues. The consumption of renewable energy has become a global challenge. This new type of power system, dominated by renewable energy, is characterized by strong uncertainty and requires flexible peaking resources to enhance its peak shaving ability [12,13]. To address this challenge, multiple studies have investigated the complementary potential of various renewable energy sources, including wind and solar power [14,15], wind–solar hybrid generation and hydropower [16,17], and wind–solar–hydro–thermal power generation coupled with energy storage [18]. These studies demonstrate that complementary applications of different power sources can enhance the utilization of clean energy generation, offering a promising solution to the aforementioned issues. However, these studies did not address the effect of natural gas power generation for peak shaving on wind and photovoltaic power. Natural gas power generation has good environmental performance, with greenhouse gas emissions only half of those from coal-fired power generation, a smaller land footprint compared to coal power, fast start-up and shut-down capabilities, and strong peaking performance [19,20,21]. Therefore, natural gas power generation is considered the best partner for the development of renewable energy [22].
Research on natural gas power generation mainly focuses on its economic advantages and its role in the power grid. Some scholars focus on the economic benefits of natural gas power generation [23,24,25]. Clark et al. studied the operating costs of peaking power plants and found that using natural gas as a fuel could reduce the cost by more than half compared to using diesel [26]. Meng et al. analyzed the current status and main issues of natural gas power generation and concluded that the economic competitiveness of natural gas power generation and the natural gas supply model are the main obstacles to its development [27]. Another group of scholars has focused on the role of natural gas power generation in the power grid [28,29]. Andrew et al. studied the design of wind-hybrid power plants operating at different time scales, suggesting that as energy systems transition to more renewable energy, hybrid power plants may need to provide base load or peaking services traditionally offered by coal and natural gas power plants [30]. Mirzaei et al. argued that natural gas power plants have faster start-up and high ramping capabilities compared to other traditional power plants, making them better equipped to handle the natural uncertainty of wind power [31]. Miller et al. stated that the intermittent and variable nature of renewable energy generation presents significant challenges, and current power systems mainly rely on natural gas power plants to balance these fluctuations [32]. Sharifi et al. used deep learning methods to predict wind uncertainty and considered natural gas power plants as flexibility providers on the supply side, finding that the reliable operation of the power system depends on the supply of natural gas [33]. Although scholars have conducted research on the economic viability and externalities of natural gas power generation, wind power, and photovoltaic power generation, no existing literature has comprehensively analyzed these three energy sources as an integrated system. Existing research exhibits significant gaps in understanding the economic benefits and externalities of natural gas peak shaving for renewable energy. To address this research void, this paper proposes a systematic evaluation of the economic benefits of gas–wind–solar alliances under natural gas peak shaving scenarios. This study will focus on exploring the following core scientific questions:
(1)
How can an optimization model capable of quantitatively evaluating the economic benefits of gas–wind–solar alliance power generation systems under natural gas peak shaving modes be constructed?
(2)
How can the overall benefits of gas–wind–solar alliances and the operational characteristics of natural gas power units be evaluated under typical wind and solar output scenarios?
(3)
How sensitive are the economic benefits and environmental impacts of gas–wind–solar alliances to changes in key parameters (such as gas prices, electricity prices, and carbon prices) under different market mechanisms and policy environments?
To systematically address the aforementioned scientific issues, this paper constructs an economic benefit optimization model for gas–wind–solar alliance power generation systems, comprehensively considering multidimensional economic indicators such as power generation revenue, green certificate revenue, power generation costs, wind and solar curtailment losses, and carbon emission costs. Based on this, combined with typical wind and solar output scenarios, the overall economic benefits of the alliance and the operational characteristics of natural gas units are systematically evaluated. Furthermore, employing sensitivity analysis methods, this study explores the mechanism by which changes in key market and policy parameters—such as natural gas prices, electricity prices, and carbon prices—impact the system’s economic benefits and environmental effects.
The main contributions of this paper are as follows: First, this study develops a comprehensive optimization model for the integrated gas–wind–solar power generation system, which simultaneously considers the operational constraints of gas-fired units and the intermittent characteristics of wind and solar power. Compared with existing models, the proposed approach incorporates multi-source coordination and real-time dispatch mechanisms. Second, this paper systematically evaluates the economic benefits and environmental impacts of the gas–wind–solar alliance under various typical output scenarios. In particular, it quantifies the effects of key parameters such as natural gas price, electricity price, and carbon price on system performance, providing valuable insights for stakeholders.
The structure of this paper is arranged as follows: Section 1 elaborates on the research background, relevant literature review, research objectives, and scientific questions, as well as clarifying the main contributions of this study. Section 2 systematically describes the research subject of the gas–wind–solar integrated power generation system and defines the relevant notations. Section 3 details the modeling approach of the gas–wind–solar integrated power generation system and presents the specific solution methods. Section 4 systematically analyzes, based on typical wind and solar output scenarios, the economic benefits of the integrated system and the operational characteristics of the gas-fired units. Furthermore, sensitivity analyses are conducted to investigate the impact of key parameters such as natural gas prices, electricity prices, and carbon prices on the system’s economic and environmental performance. Section 5 summarizes the main research findings, provides policy recommendations, and discusses the limitations of this study.

2. Problem Description and Symbol Definitions

2.1. Problem Description

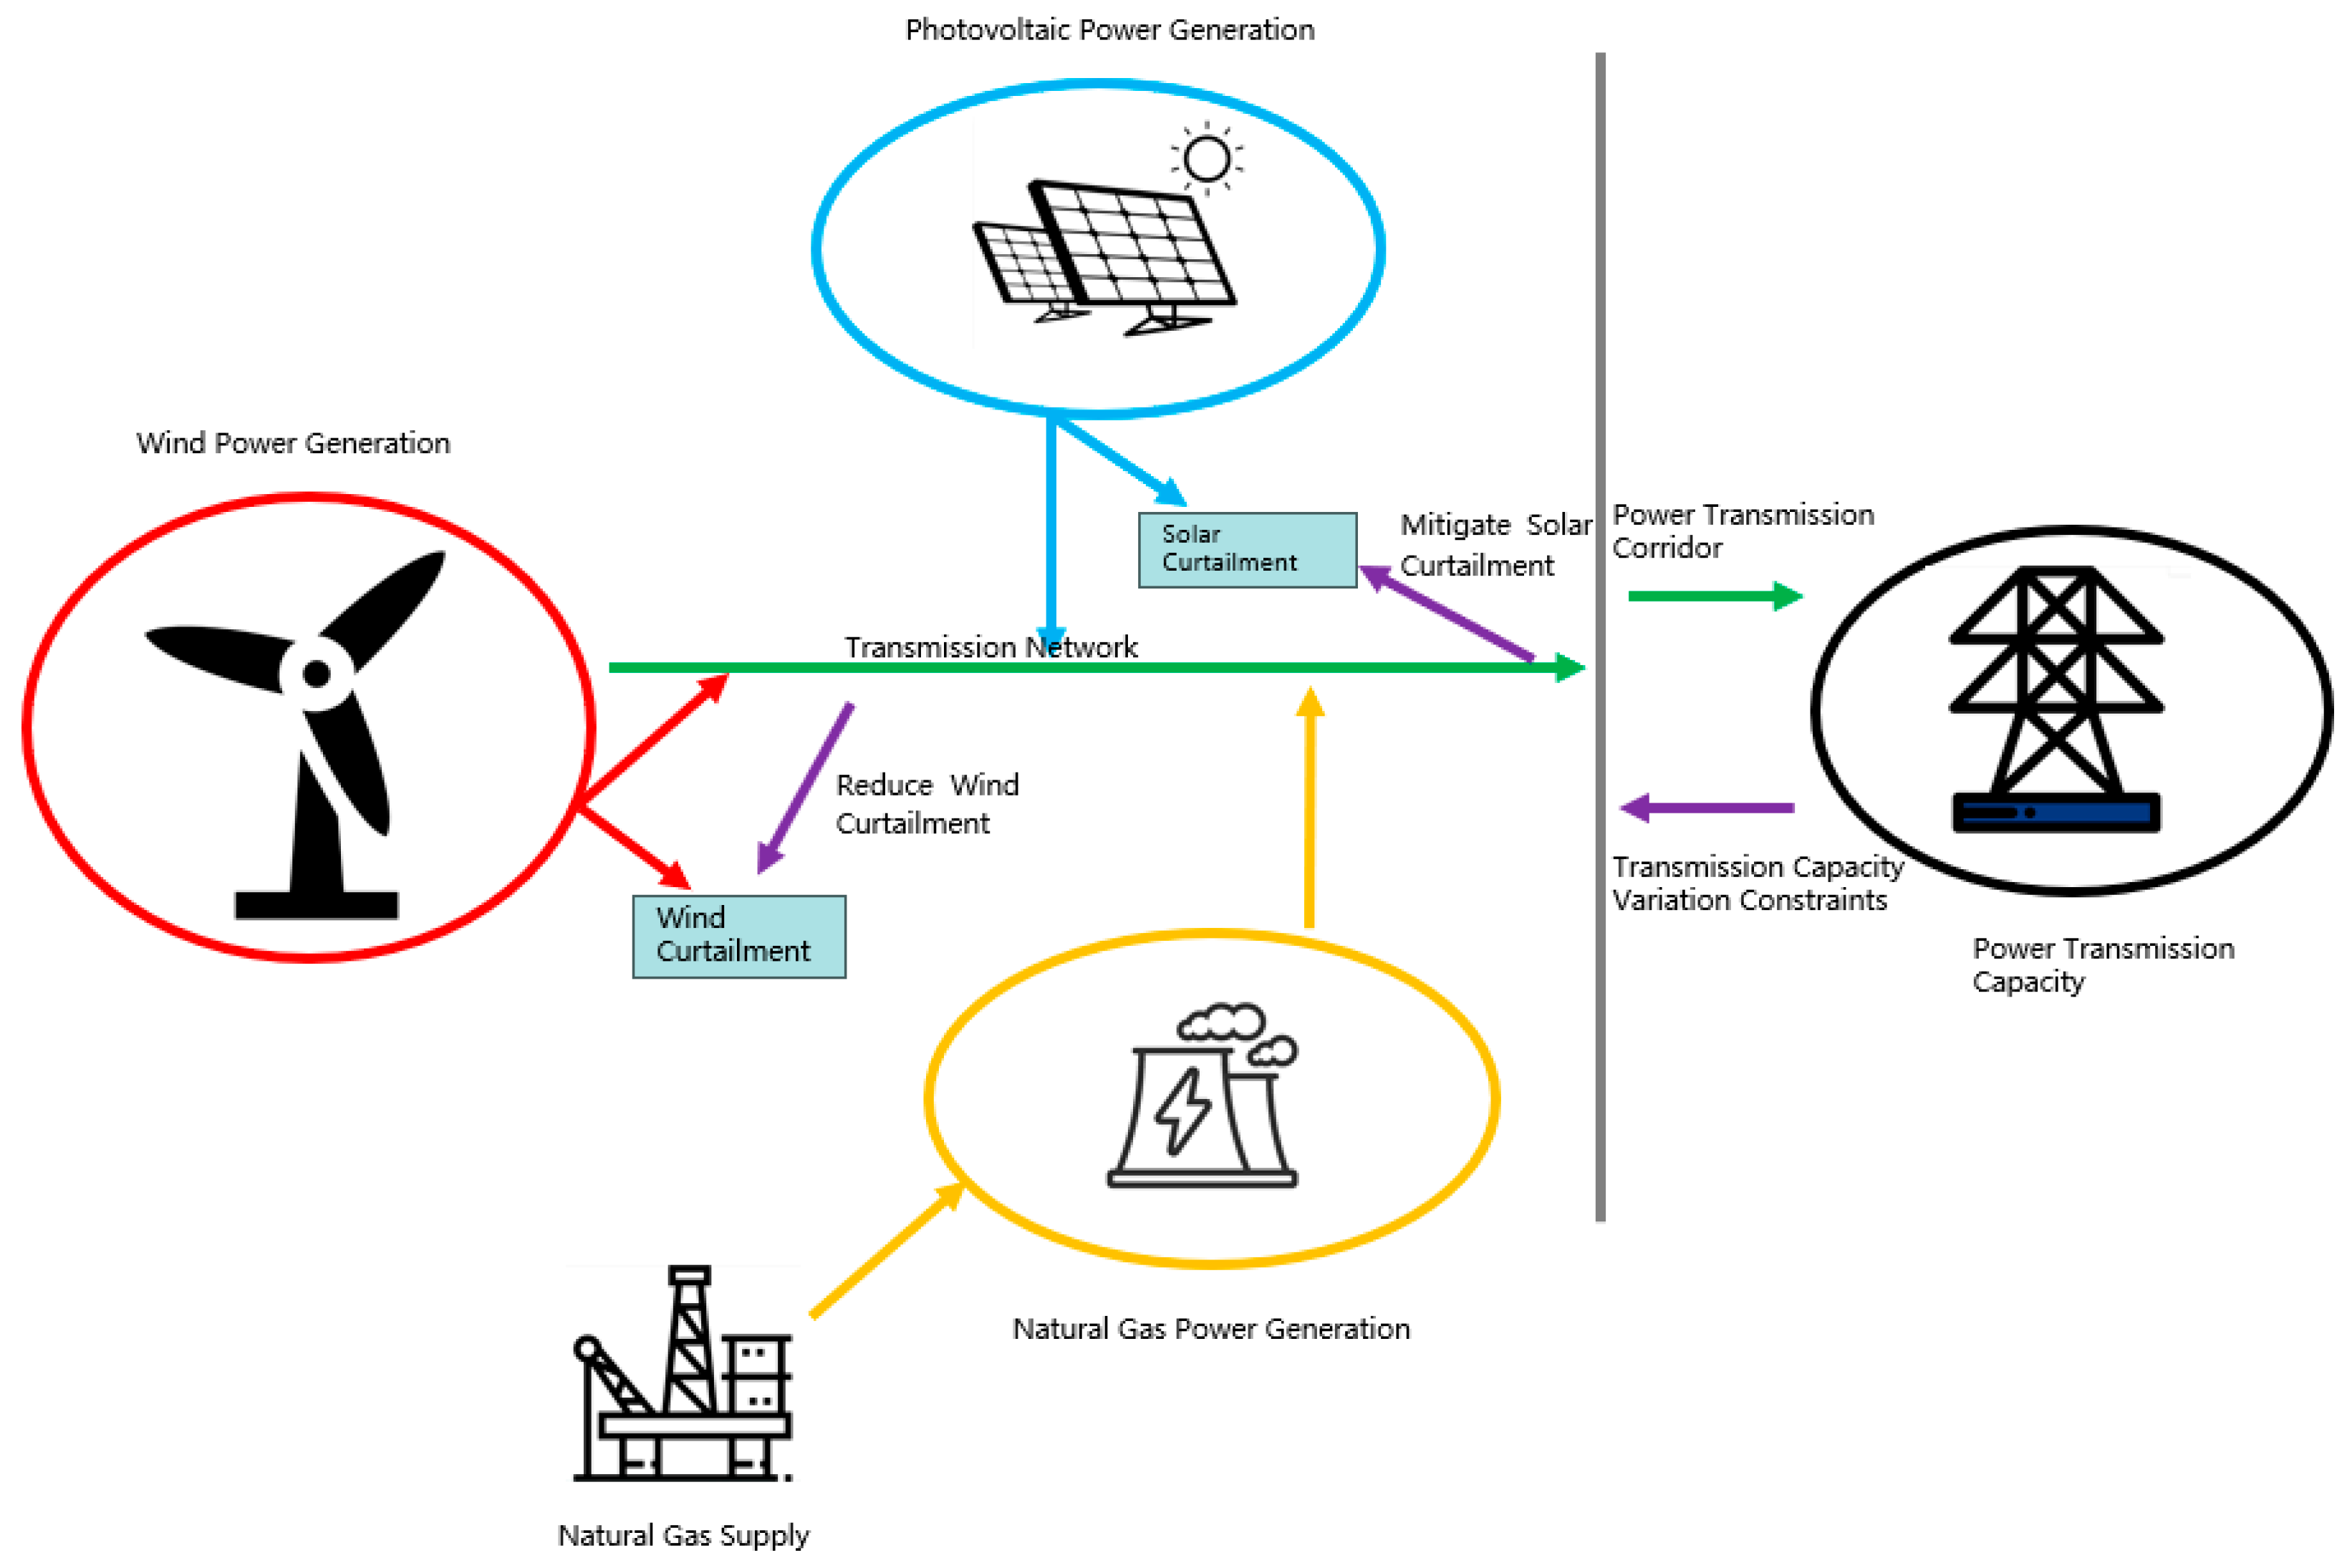
In the gas–wind–solar combined generation mode, gas, wind, and solar power operate in a coordinated and optimized manner. By utilizing the fast start-up and low-carbon, efficient peak-shaving characteristics of gas power plants, the total output of the gas–wind–solar alliance can be increased while meeting the required power regulation rates for power delivery. If, during a certain period, the combined output of wind and solar is low, and the difference in forecasted wind and solar output in adjacent periods fails to meet the power delivery regulation requirements, gas power can increase its output to satisfy the regulation limits, thus avoiding large-scale curtailment of wind and solar power due to their volatility. The reduced curtailment can generate revenue through the grid electricity price and participation in the green certificate trading market to obtain green electricity income. If the combined output of wind and solar is large, and the forecasted output difference in adjacent periods meets the regulation requirements, gas power can reduce its output or shut down. To simplify the problem, this study considers the electricity demand side as an electricity transmission channel. In this mode, the system’s revenue includes the income from the electricity output of the gas–wind–solar alliance, the income from the green certificate trading participation of wind and solar, and the system’s operational costs, which include the power generation costs of gas, wind, and solar, penalties for wind and solar curtailment, carbon emission penalties for gas power, and the start-up and shut-down costs of gas power plants. The natural gas–wind–solar hybrid power generation mode is shown in Figure 1.

2.2. Nomenclature

2.2.1. Indicator Set

The indicator set for the model constructed in this paper is shown in Table 1.

2.2.2. Symbol Definitions

The symbol definitions for the gas–wind–solar combined generation are shown in Table 2.

3. Gas–Wind–Solar Hybrid Power Generation Model Construction and Solution

3.1. Model Construction

3.1.1. Objective Function

The gas–wind–solar hybrid power generation system uses the complementary outputs of gas, wind, and photovoltaic (PV) power to meet the system load demands. Gas turbine units, with their fast start–stop regulation capabilities, track the fluctuations of wind and solar power. Due to the inherent randomness and variability in wind and PV outputs, when the gas turbine’s peak regulation capacity is insufficient, wind and solar power will be curtailed. On the other hand, natural gas power generation produces a certain level of carbon emissions, and to mitigate the environmental impact of these emissions, the carbon emission penalty costs must be considered. Based on the new energy quota system, wind and PV can participate in the green certificate trading market to earn revenue.
The objective of the gas–wind–solar hybrid power generation system is to meet the power delivery requirements while maximizing the system’s overall benefit. The total benefit is the total revenue from the operation of the system minus the total costs. The total revenue includes income from the grid power generated by gas, wind and PV, and income from the participation of wind and PV in the green certificate trading market. The total costs mainly include the operating costs of the gas turbines, wind, and PV, curtailment costs for wind and PV, and the carbon emission penalty costs resulting from the combustion of natural gas in the gas turbines.
Therefore, the system’s economic benefit maximization model can be expressed by the following objective function:
max F = f 1 + f 2 f 3 f 4 f 5
In Formula (1), f 1 , f 2 , f 3 , f 4 and f 5 represent the system operating income, green certificate trading income, system operating cost, wind curtailment and solar curtailment penalty costs, and natural gas power plant carbon emission penalty costs, respectively.
(1)
System Operating Income
The system operating income refers to the revenue generated from the electricity generated by the natural gas, wind, and photovoltaic power plants. The calculation formula is as follows:
f 1 = t = 1 T O p ( P w , t + P p v , t + i = 1 N P g , i , t ) Δ t
where O p is the grid-connected electricity price for wind–solar–gas coordinated peak shaving, CNY/MWh; P w , t is the output of the wind power plant in time period t, MW; P p v , t is the output of the photovoltaic power plant in time period t, MW; P g , i , t is the output of gas power unit i at time t, MW; N is the number of gas power units; and Δ t is the scheduling time interval, hours.
(2)
Green Certificate Trading Revenue
The revenue from green certificate trading is the income obtained from the participation of wind and photovoltaic plants in the green certificate market. The calculation formula is as follows:
f 2 = t = 1 T ( ρ w x w P w , t + ρ p v x p v P p v , t ) Δ t
where ρ w is the green certificate trading price for wind power, in CNY/MWh; ρ p v is the green certificate trading price for photovoltaic power, in CNY/MWh; x w is the green certificate quota coefficient for wind power per unit of electricity; and x p v is the green certificate quota coefficient for photovoltaic power per unit of electricity.
(3)
System Operating Cost
The system operating cost includes the operating costs of gas power, wind power, and photovoltaic power. The calculation formula is as follows:
f 3 = t = 1 T [ ( K w P w , t + K p v P p v , t + i = 1 N G P g , i , t L H V η g , i ) + i = 1 N U g , i , t ( 1 U g , i , t 1 ) S ] Δ t
where K w is the unit operating cost of wind power during the scheduling period, CNY/MWh; K p v is the unit operating cost of photovoltaic power during the scheduling period, CNY/MWh; U g , i , t is the on-off status of gas power unit i (1 for operation, 0 for shutdown); S is the startup/shutdown cost of gas power unit, CNY/MWh; G is the natural gas price, CNY/m3; L H V is the lower heating value of natural gas, MWh/m3; and η g , i is the average efficiency of gas power unit i.
(4)
Wind and Solar Curtailment Penalty Cost
The formula for calculating the wind and solar curtailment penalty cost is as follows:
f 4 = t = 1 T ( C p , w P w , t a b + C p , p v P p v , t a b ) Δ t
where C p , w is wind curtailment penalty cost coefficient, CNY/MWh; C p , p v —solar curtailment penalty cost coefficient, CNY/MWh; P w , t a b —wind power curtailed during time period t, MW; and P p v , t a b —solar power curtailed during time period t, MW.
(5)
Gas-fired Carbon Emission Penalty Cost
The carbon emission penalty cost caused by the combustion of natural gas in gas-fired power plants is calculated using the following formula:
f 5 = t = 1 T i = 1 N C C O 2 P g , i , t Δ t
where C C O 2 is Carbon emission penalty cost per unit of gas-fired electricity, CNY/MWh.
Based on the above, the objective function of the gas–wind–solar hybrid power generation model is as follows:
max F = t = 1 T [ O p ( P w , t + P p v , t + i = 1 N P g , i , t ) + ρ w x w P w , t + ρ p v x p v P p v , t K w P w , t K p v P p v , t i = 1 N G P g , i , t L H V η g , i i = 1 N U g , i , t ( 1 U g , i , t 1 ) S i = 1 N C C O 2 P g , i , t C p , w P w , t a b C p , p v P p v , t a b ] Δ t

3.1.2. Binding Conditions

(1)
Power Constraint of the Gas–Wind–Solar Hybrid Power Generation
In gas–wind–solar hybrid power generation, the output of gas, wind, and solar power is transmitted to the load center via the transmission channel, thus enabling the consumption of clean energy and ensuring electricity supply. During the transmission process, part of the electricity generated needs to be used for internal consumption, i.e., auxiliary power consumption. The total output for delivery, after deducting the auxiliary power consumption, is the effective export power. This total export power must not exceed the capacity of the transmission channel to avoid curtailment of wind and solar power. Therefore, the total export power of the gas–wind–solar hybrid generation system must satisfy the following condition:
P s , t P s , max
P s , t = i N P g , i , t ( 1 φ g , i ) + P w , t ( 1 φ w ) + P p v , t ( 1 φ p v )
where P s , t is the generation power of the gas–wind–solar hybrid system in time period t, MW; P s , max is the transmission line capacity, MW; φ g , i is the auxiliary power consumption rate of gas-fired power plants; φ w is the auxiliary power consumption rate of the wind farm; and φ p v is the auxiliary power consumption rate of the solar plant.
(2)
Power Variation Constraint for Hybrid Power Generation
To avoid excessive pressure on the transmission channel during power regulation, the gas–wind–solar hybrid power generation system needs to satisfy a power variation constraint. Specifically, the absolute power difference between two consecutive time periods must not exceed the power regulation limit of the transmission channel. Therefore, the constraint can be expressed as follows:
P s , t P s , t 1 | Δ P s
where Δ P s is the maximum fluctuation limit of the hybrid power generation system’s output, MW; this value is positively correlated with the peak shaving margin and the reserve capacity of the receiving-end power system.
(3)
Rotational Reserve Capacity Constraint of the Gas–Wind–Solar Hybrid Power Generation System
Due to the randomness and fluctuation of wind and photovoltaic power outputs, when there are forecasting errors in wind and photovoltaic generation, which lead to insufficient power delivery, the system needs to provide a certain amount of reserve capacity. In this chapter, the gas-fired power units are used to provide the system’s reserve capacity. Specifically, the rotational reserve provided by the gas-fired units must be greater than or equal to the reserve capacity required to compensate for the power forecast errors of wind and photovoltaic generation. Therefore, we have the following:
i N R g , i , t r w P w f o r e + r p v P p v f o r e
R g , i , t = min ( P g , i , t max P g , i , t , δ i )
P g , i , t max = min ( P g , i max , P g , i , t 1 + δ i )
P w f o r e = α w , t P w
P p v f o r e = α p v , t P p v
where R g , i , t is the rotational reserve capacity of gas-fired unit i at time t, MW; r w is the reserve capacity demand ratio for gas-fired units due to wind power forecasting errors, generally taken as 15% for wind power; r p v is the reserve capacity demand ratio for gas-fired units due to photovoltaic forecasting errors, generally taken as 5% for solar power; P g , i , t max is the maximum output of gas-fired unit i at time t, MW; P g , i max is the maximum technical output of gas-fired unit i, MW; P g , i , t 1 is the output of gas power unit i at time t − 1, MW; δ i is the ramp-up rate of gas-fired unit i, MW; α w , t is the output coefficient of wind power based on local wind forecasts; α p v , t is the output coefficient of photovoltaic power based on local solar intensity forecasts; P w is the installed capacity of wind power, MW; and P p v is the installed capacity of photovoltaic power, MW.
(4)
Gas-fired unit output constraints
When operating in a gas–wind–solar hybrid power generation system, the output of the gas-fired units is limited by their installed capacity, meaning there are upper and lower output limits. Additionally, the increase or decrease in output of the gas-fired units is constrained by the unit’s regulation capability, and the power adjustment between adjacent periods is also limited. Therefore, the output difference between adjacent periods must be within the ramp rate limits. In other words, the gas-fired unit’s output must be within its allowed upper and lower limits, while also meeting the ramp rate limits between adjacent periods. This can be expressed as follows:
U g , i , t P ¯ g , i P g , i , t U g , i , t P ¯ g , i
P g , i , t P g , i , t 1 + U g , i , t 1 ( P ¯ g , i δ g , i ) + U g , i , t ( P ¯ g , i P ¯ g , i ) P ¯ g , i
P g , i , t 1 P g , i , t + U g , i , t ( P ¯ g , i δ g , i ) + U g , i , t 1 ( P ¯ g , i P ¯ g , i ) P ¯ g , i
where P ¯ g , i is the lower output limit of the gas-fired unit i at time t, MW; P ¯ g , i is the upper output limit of the gas-fired unit i at time t, MW; δ g , i is the ramp rate of the gas-fired unit i, MW/h; and U g , i , t 1 is the start-up/shut-down state variable of gas power unit i at time t − 1.
(5)
Minimum Start-up and Shut-down Time Constraints for Gas-fired Units
To avoid excessive start–stop operations that would lead to higher start-up and shut-down costs, as well as to prevent frequent cycling from causing wear and reducing the lifespan of the gas-fired units, a minimum start-up and shut-down duration must be observed. Specifically, after the gas-fired unit is started, it must remain in operation for a specified minimum time before it can be shut down. Similarly, after being shut down, the gas-fired unit must remain off for a specified minimum period before it can be restarted. Therefore, the following constraint applies:
( T g , i , t 1 o n T g , i o n ) ( U g , i , t 1 U g , i , t ) 0
( T g , i , t 1 o f f T g , i o f f ) ( U g , i , t U g , i , t 1 ) 0
where T g , i , t 1 o n is the continuous operating time of gas-fired unit i in period t − 1, hours; T g , i , t 1 o f f is the continuous shut-down time of gas-fired unit i in period t − 1, hours; T g , i o n is the minimum operating time of gas-fired unit i, hours; and T g , i o f f is the minimum shut-down time of gas-fired unit i, hours.
(6)
Wind Power Output Constraint
During the wind/solar power generation process, the actual output of wind/solar power may be less than the predicted output. Therefore, the predicted output should be the sum of the actual output of wind/solar power and the curtailed wind/solar output. In other words, the actual wind power output plus the curtailed wind equals the predicted wind power output, and similarly, the actual solar power output plus the curtailed solar equals the predicted solar power output. Thus, the equation is as follows:
P w , t f o r e = P w , t + P w , t a b
P w , t 0
P w , t a b 0
P p v , t f o r e = P p v , t + P p v , t a b
P p v , t 0
P p v , t a b 0
where P w , t f o r e is the wind power predicted output at time t, MW; P p v , t f o r e is the solar power predicted output at time t, MW.
Based on the above, the optimization model for the economic benefit of gas–wind–solar hybrid power generation is presented in Appendix A.

3.2. Model Solution Strategy

As shown in Formula (A1), the model constructed in this study is essentially a Mixed-Integer Nonlinear Programming (MINLP) model. Traditional intelligent optimization algorithms often suffer from the “Curse of Dimensionality” when solving problems with high-dimensional decision spaces and nonlinear characteristics, making it difficult to guarantee the global optimal solution within finite computational time. The nonlinear factors in the model significantly increase its computational complexity and solution difficulty.
To enhance the model’s solvable efficiency and feasibility, this study employs linearization techniques to approximate or equivalently reformulate the nonlinear components. This transformation converts the model into a Mixed-Integer Linear Programming (MILP) problem. MILP models typically benefit from more mature and efficient solvers and algorithmic support.
(1)
Objective Function Linearization
Specifically, the model’s objective function contains nonlinear terms representing unit commitment and shutdown costs. To eliminate this nonlinearity, auxiliary variables Y are introduced and corresponding linear constraints are formulated, enabling precise linearization of the nonlinear terms within the objective function. The mathematical expression is as follows:
Y g , m , t l U g , m , t Y g , m , t U g , m , t 1 Y g , m , t U g , m , t 1 l ( 1 U g , m , t ) Y g , m , t [ 0 , l ]
In the formula, l represents the upper limit of U g , m , t 1 .
(2)
Linearization of Constraints
The system reserve capacity constraint, due to its nonlinear characteristics, significantly increases the computational complexity of the model. To achieve efficient solution, the original nonlinear constraints are transformed into the following equivalent linear form:
R g , i , t P g , i , t max P g , i , t R g , i , t δ i
P g , i , t max P g , i max P g , i , t max P g , i , t 1 + δ i
(3)
Model Solving
Through systematic linear processing of the objective function and constraints, the original MINLP model is transformed into a mixed-integer linear programming (MILP) model. This paper integrates the YALMIP modeling toolbox within the MATLAB R2021a environment and invokes the CPLEX 12.10 commercial solver to solve the model.
The relevant solution process code can be found in Appendix B.

4. Results and Discussion

4.1. Basic Information

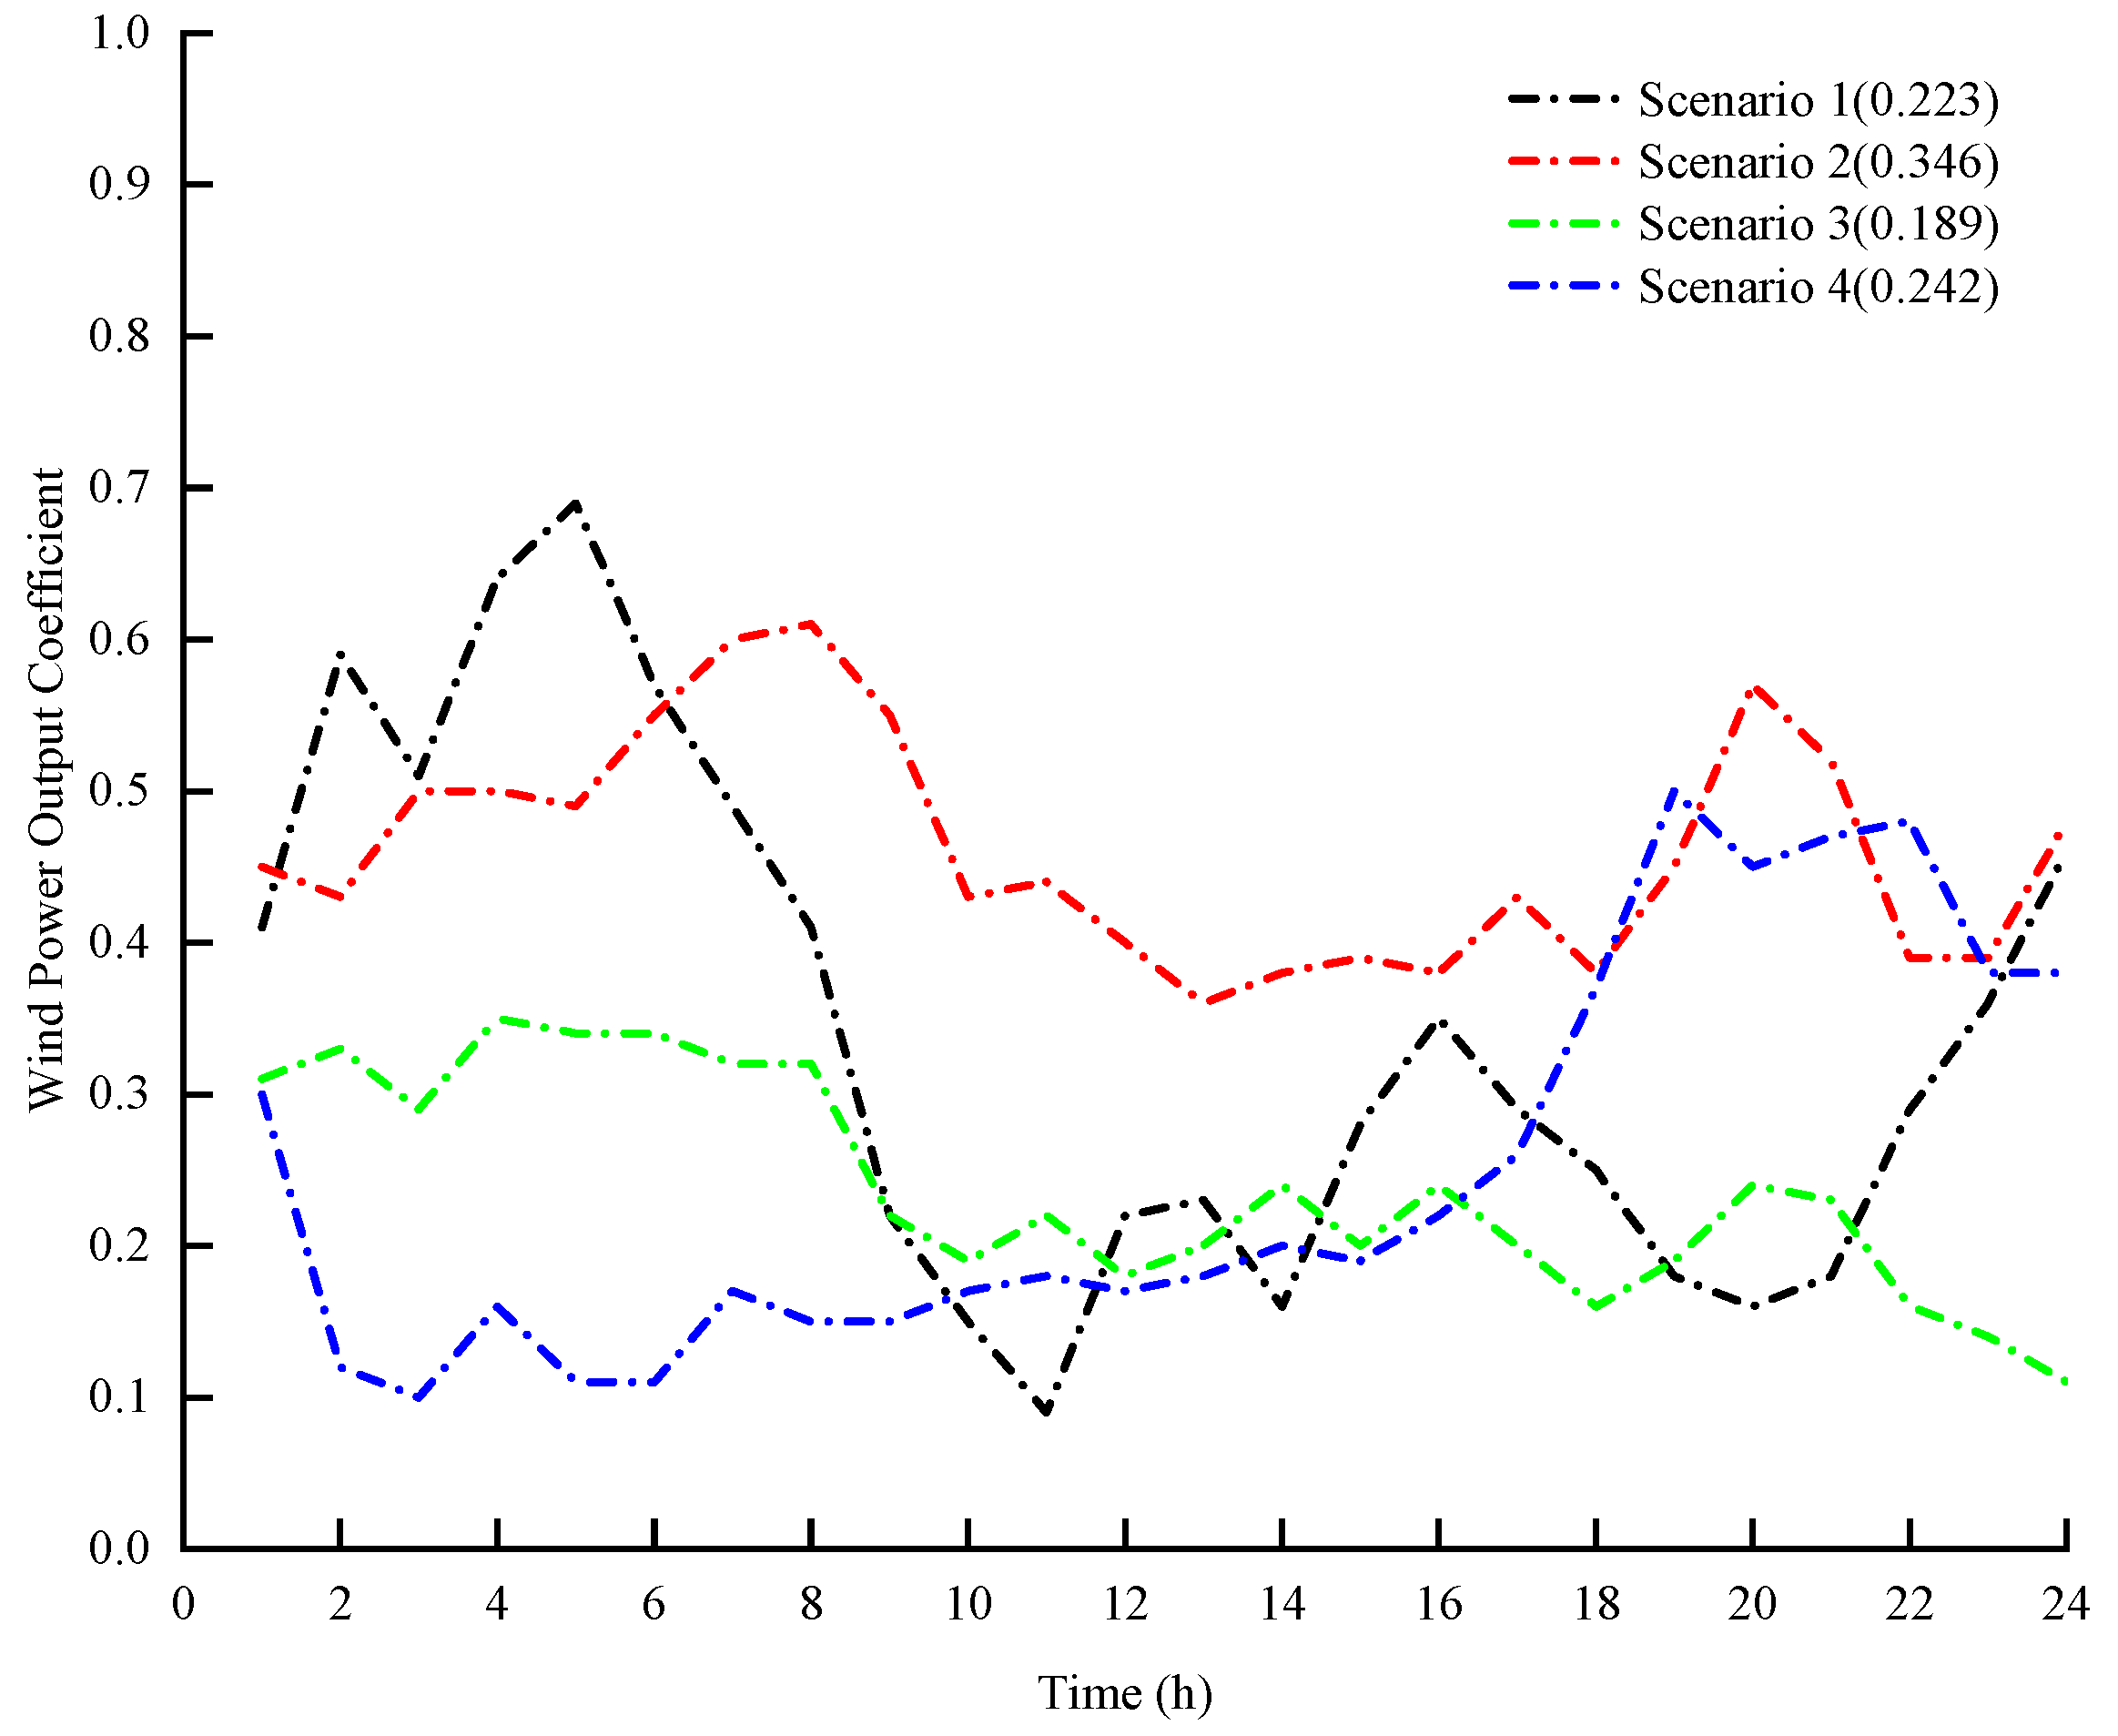
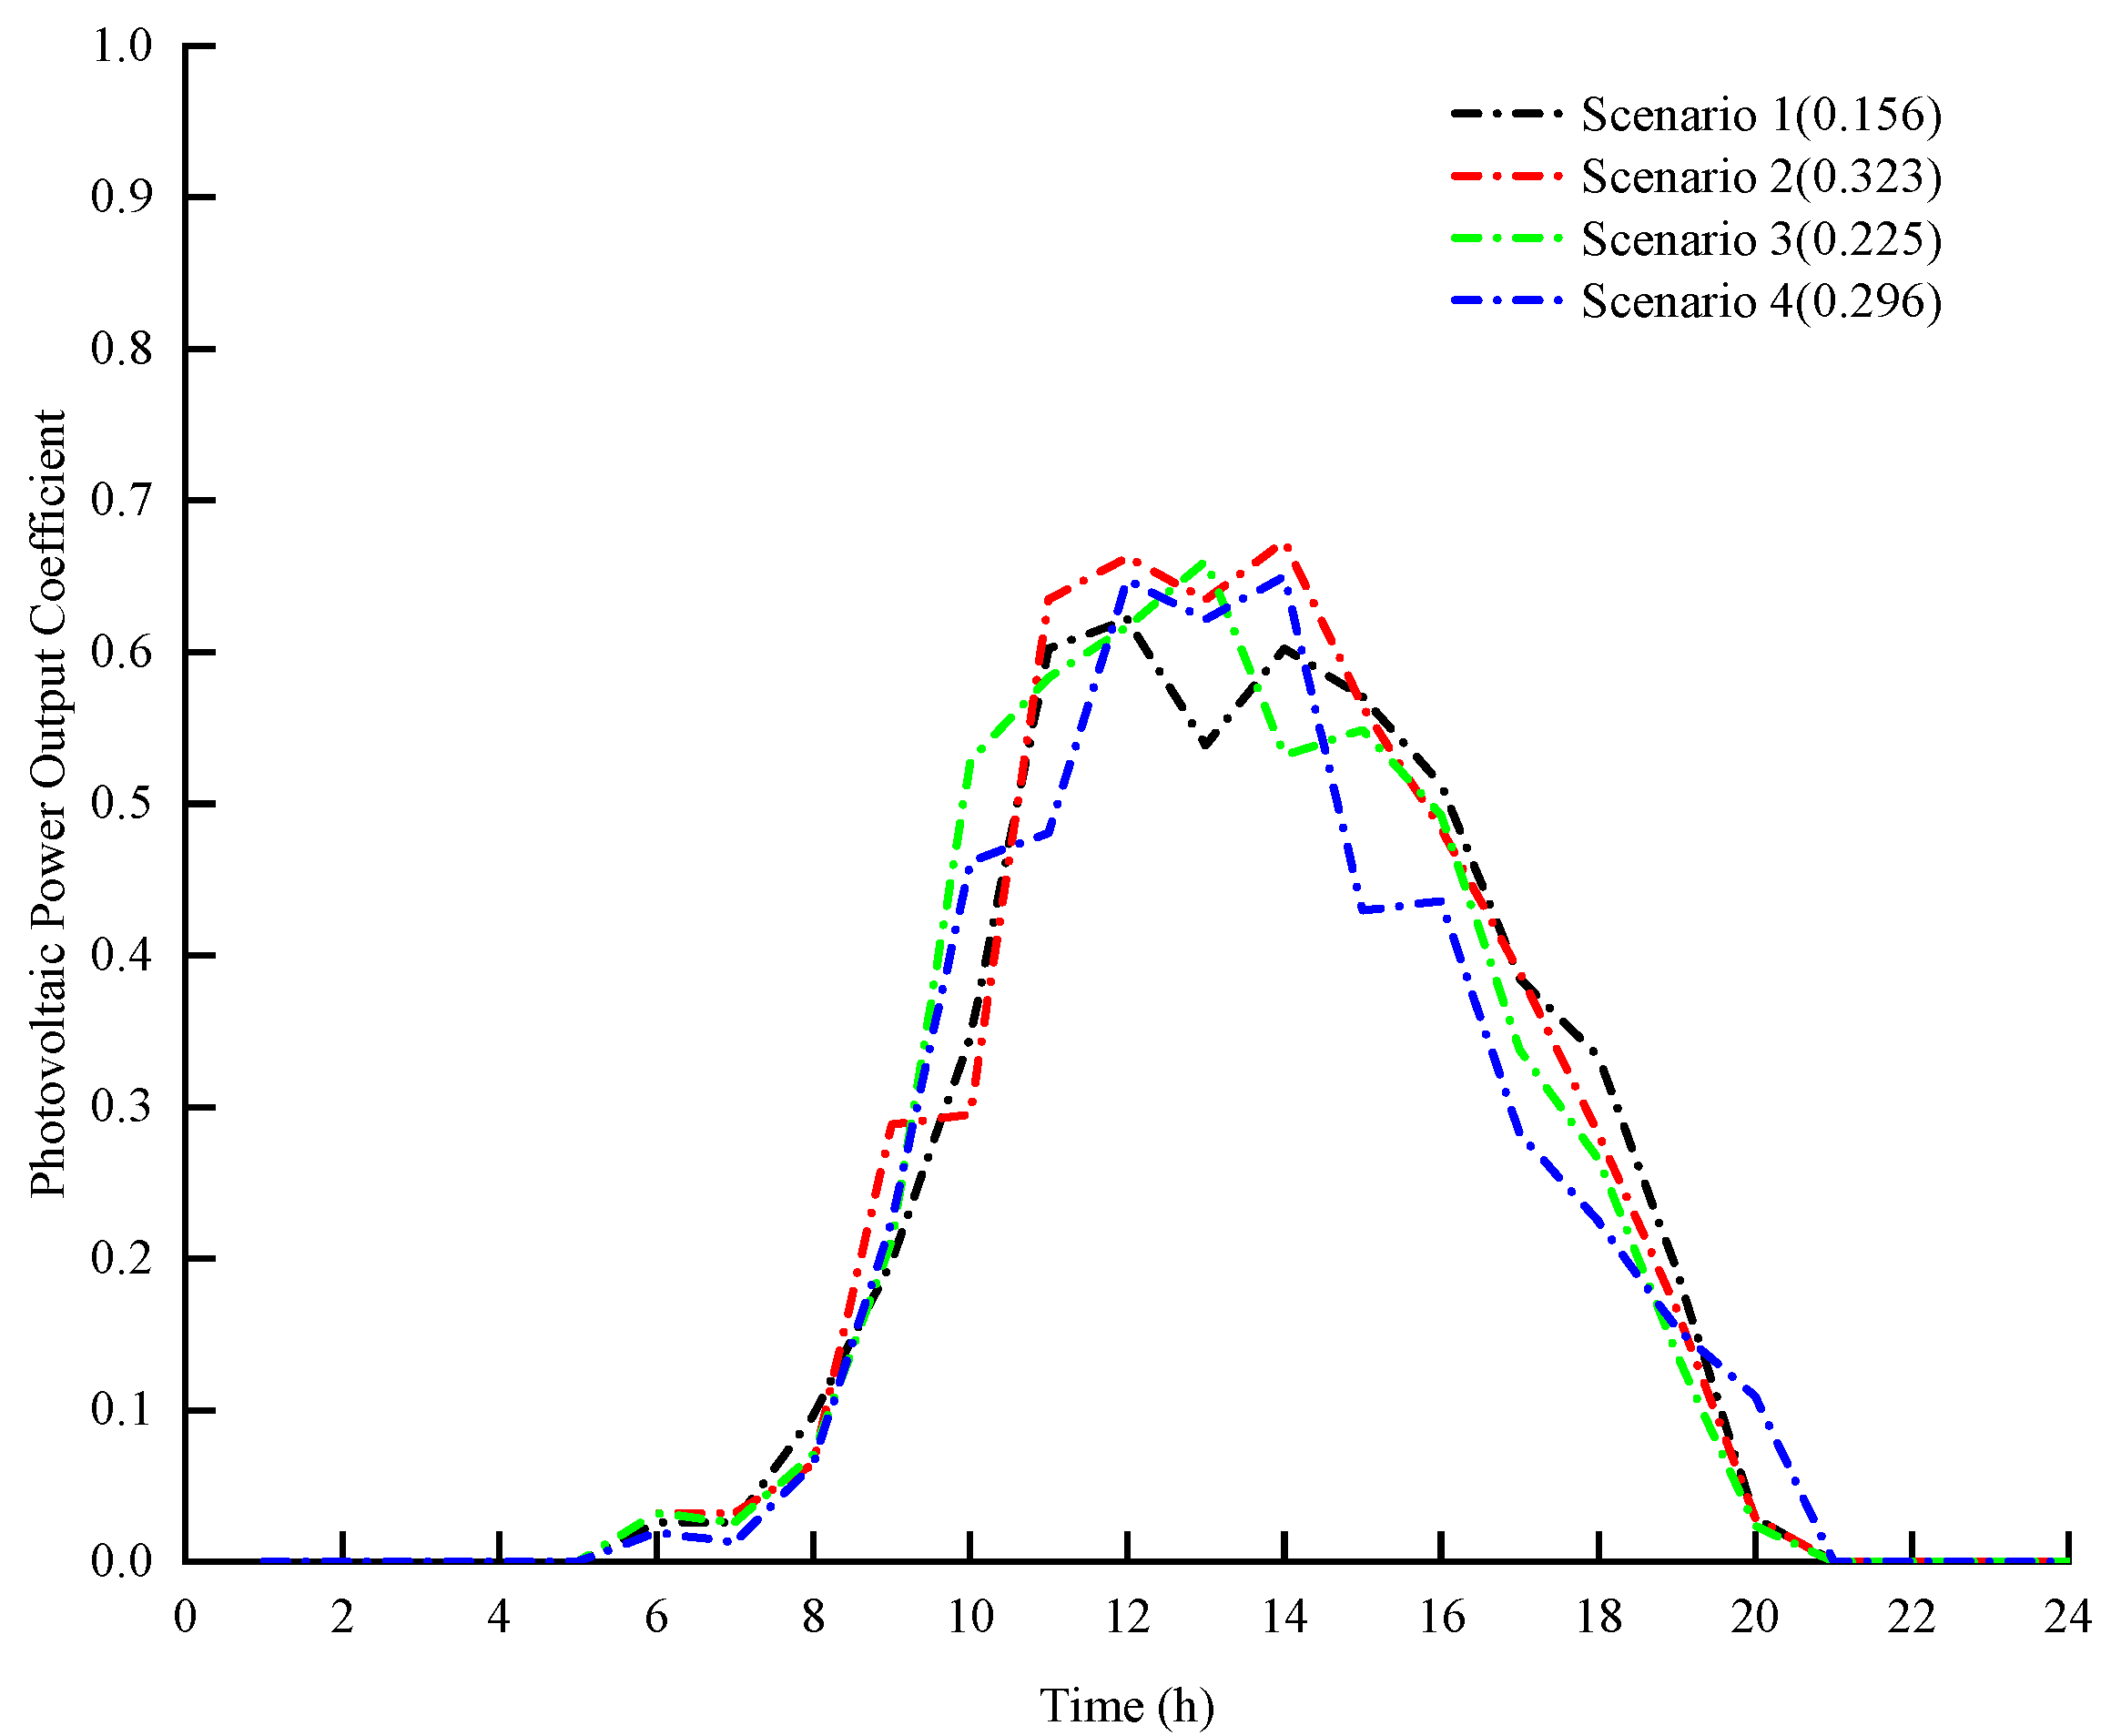
The data in this paper originates from a combined gas–wind–solar power generation system planned for a certain region in Sichuan during the 14th Five-Year Plan period. This system integrates the installed capacity of gas power stations with wind and photovoltaic power stations from other regions. The parameters involved in wind power generation and photovoltaic power generation are listed in Table 3. The parameters involved in natural gas power generation units are listed in Table 4. Based on the annual wind power and photovoltaic output curves for a specific region, the scenario generation and clustering methods described in [34,35,36] were applied to obtain representative scenarios and their corresponding probabilities. Four typical wind power output scenarios and their weights are illustrated in Figure 2; Scenario 1, with a probability of 22.3%, is selected as the representative scenario for the case study. Similarly, four typical photovoltaic output scenarios and their weights are shown in Figure 3; Scenario 2, with a probability of 32.3%, is chosen as the representative scenario for further analysis.

4.2. Simulation Results

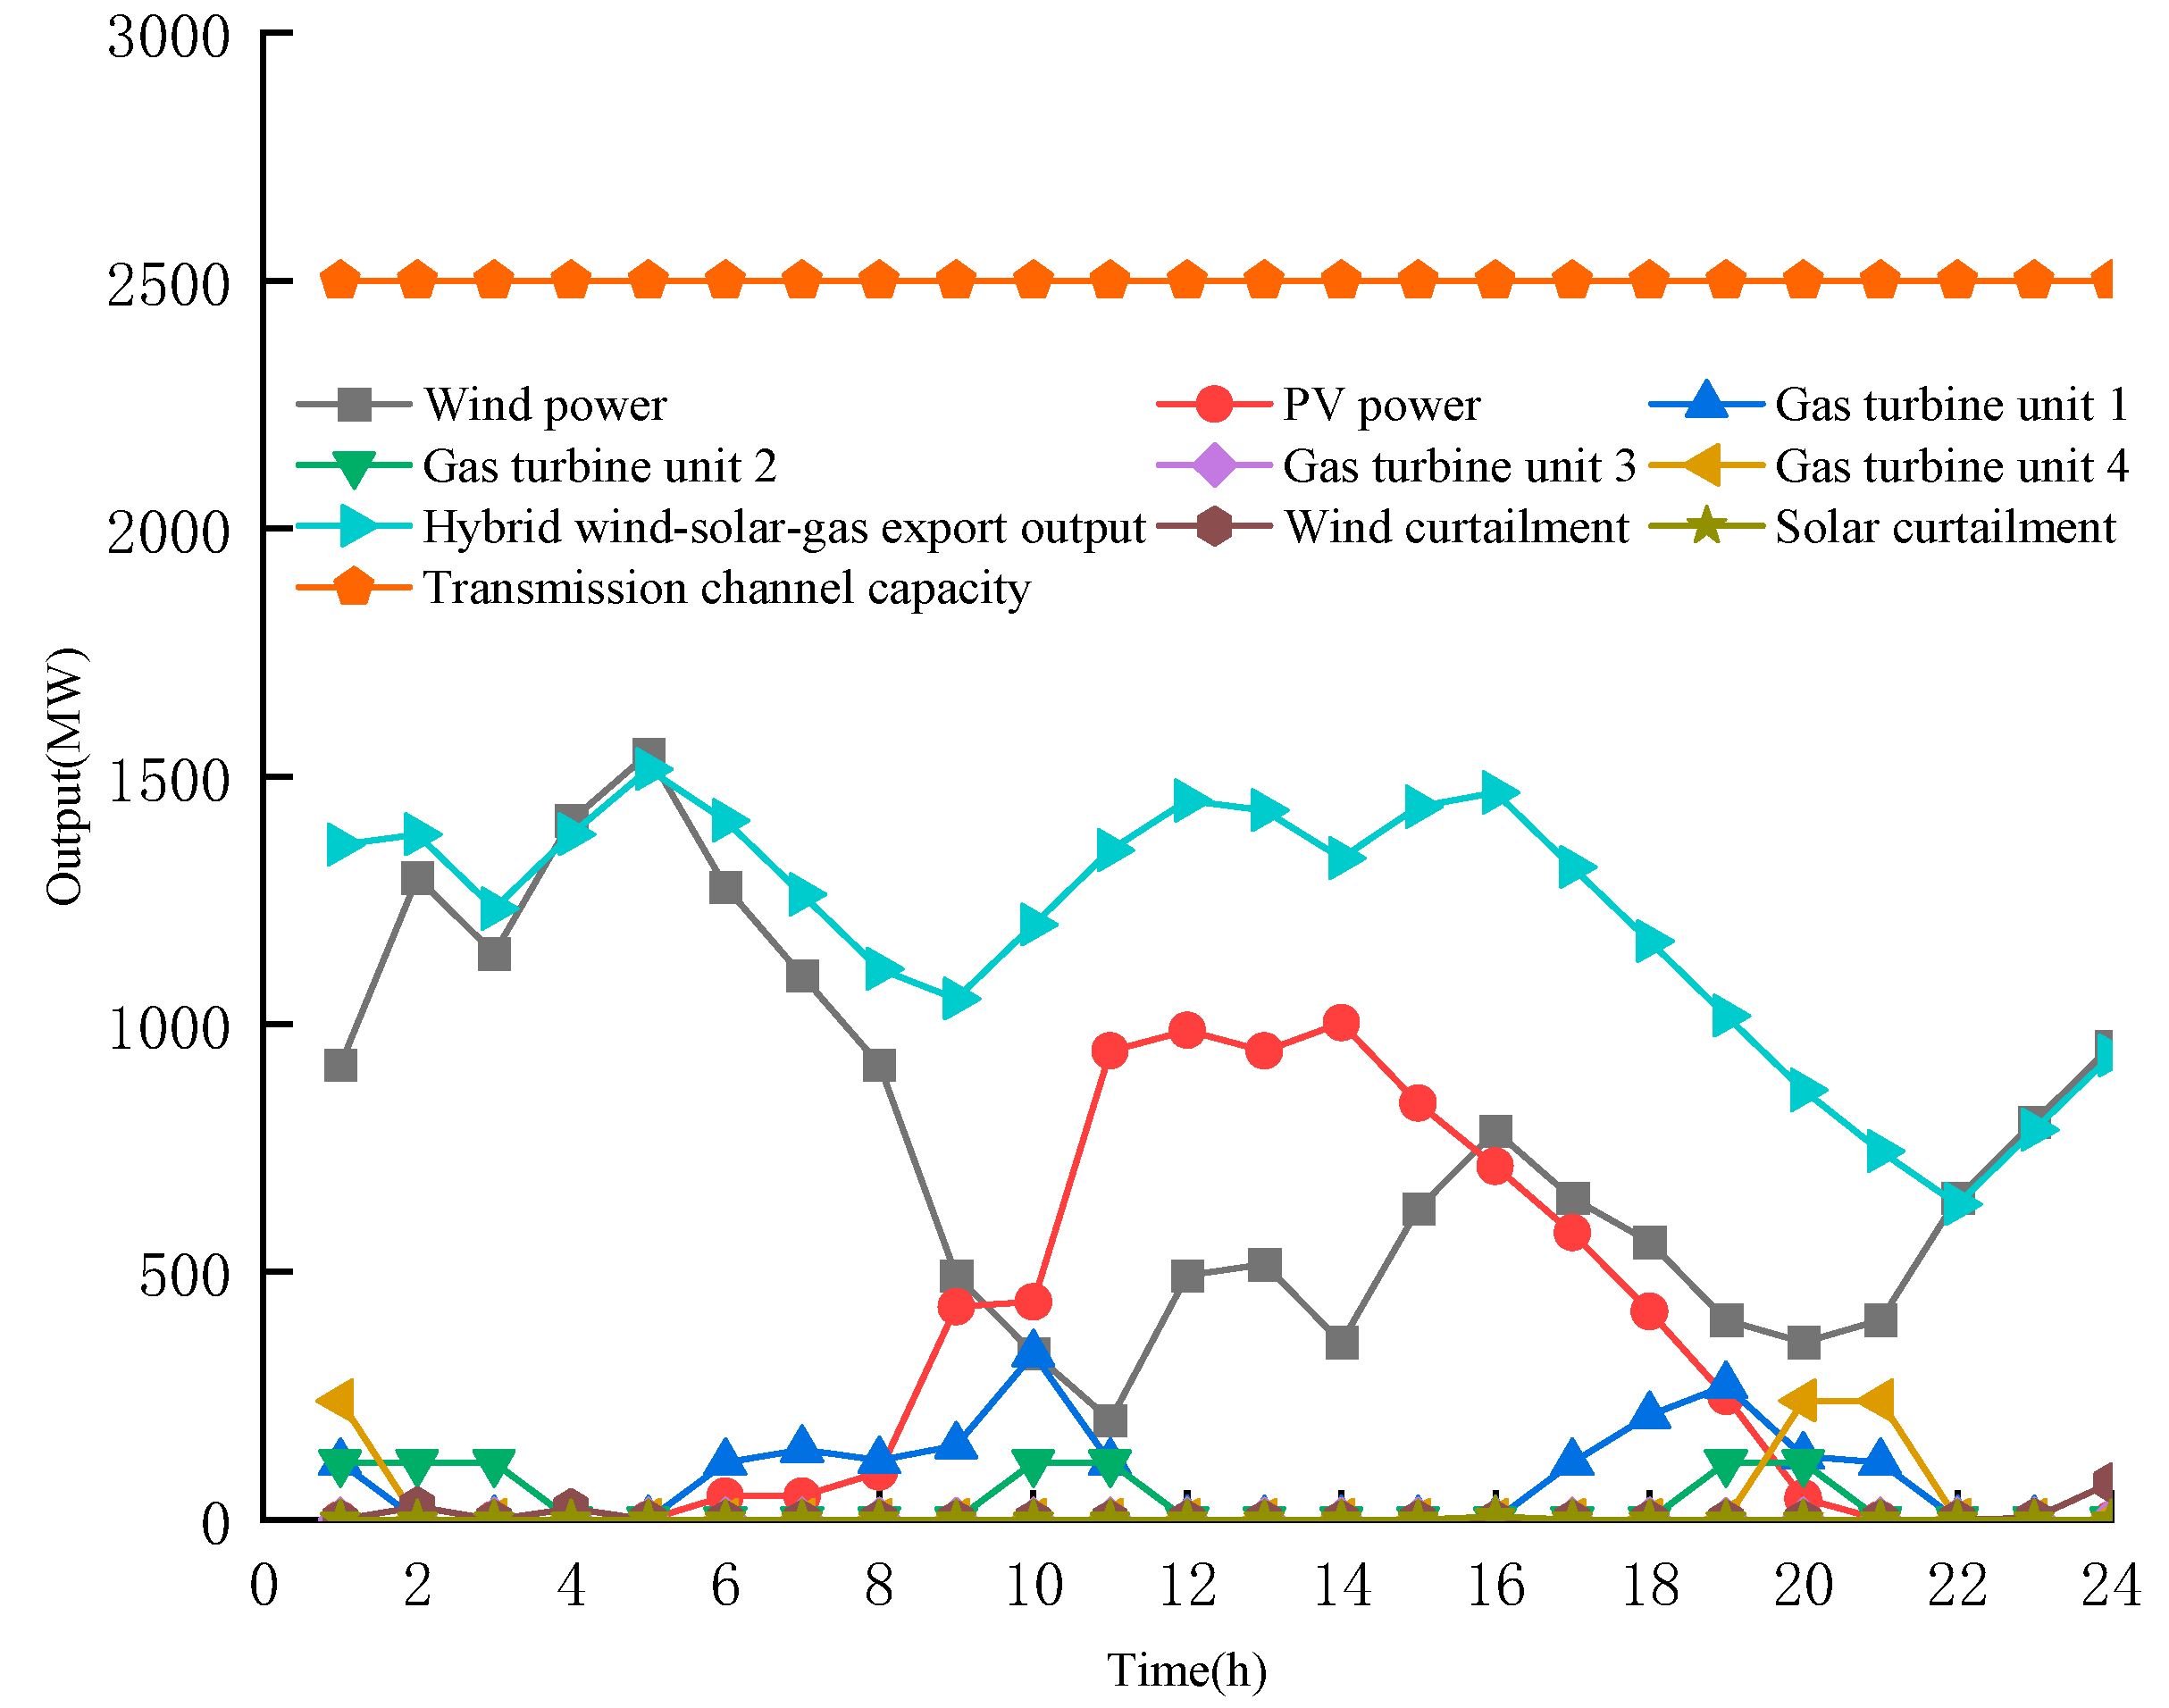
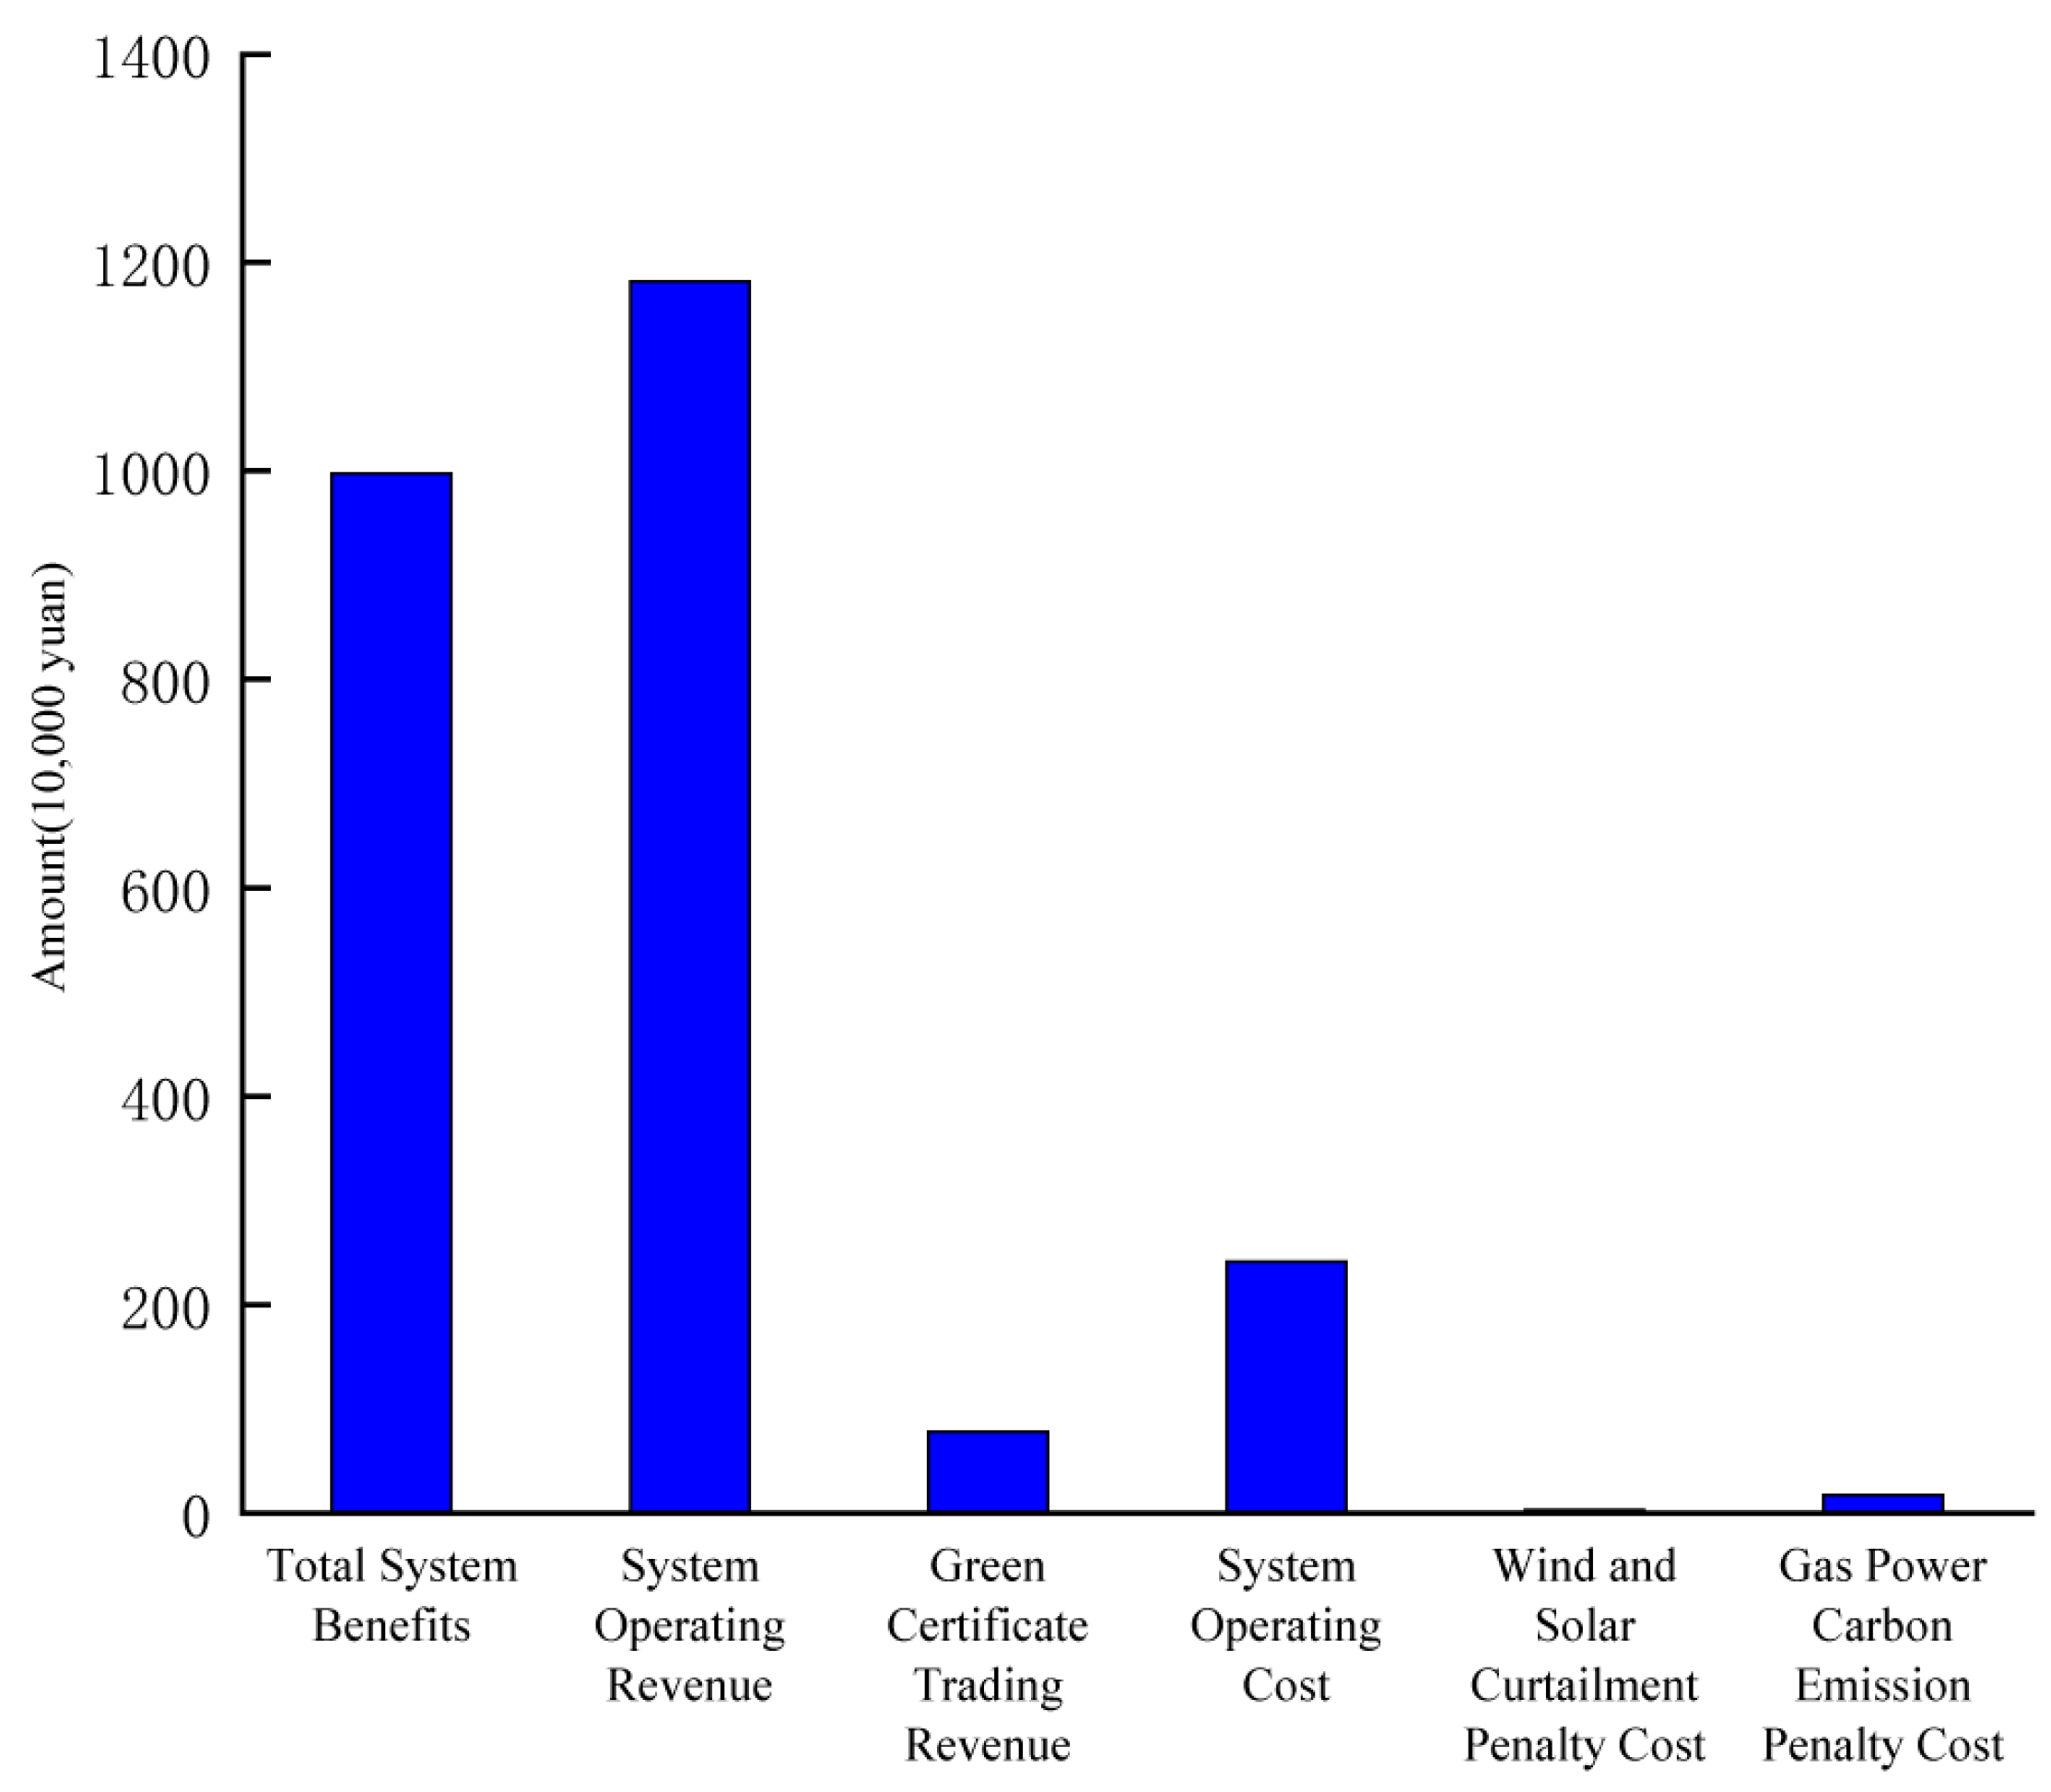
Using the data from the wind power, photovoltaic, and gas-fired power parameters in the case study, the values are substituted into Equation (A1) and solved using Matlab 2021a. The output information for the gas–wind–solar joint operation is shown in Figure 4. By substituting the optimized outputs of gas power, wind power, photovoltaic power, wind curtailment, solar curtailment, and gas-fired unit start–stop states, the economic indicators of the system operation are obtained and shown in Figure 5.
From Figure 4, it can be seen that the gas–wind–solar joint power generation significantly increases the overall delivery power, with a smaller overall fluctuation in the transmission channel. The channel utilization rate is 48.09%, and the wind curtailment and solar curtailment are 127.19 MWh and 7.20 MWh, respectively. From Figure 5, it is observed that the system’s total economic benefit is 9.9734 million yuan. Due to the complementary peak-shaving effect of gas power, the wind curtailment and solar curtailment penalty costs are only 31,000 yuan, while the gas-fired carbon emission penalty cost is 176,000 yuan. This shows that the gas–wind–solar joint power generation model not only enables the system to achieve higher economic benefits but also increases the renewable energy consumption rate and enhances environmental benefits. Although it slightly increases carbon emissions, the carbon penalty cost is not high because of the relatively low carbon emissions per kWh from gas power generation.
(1)
Analysis of Typical Operation Scenarios
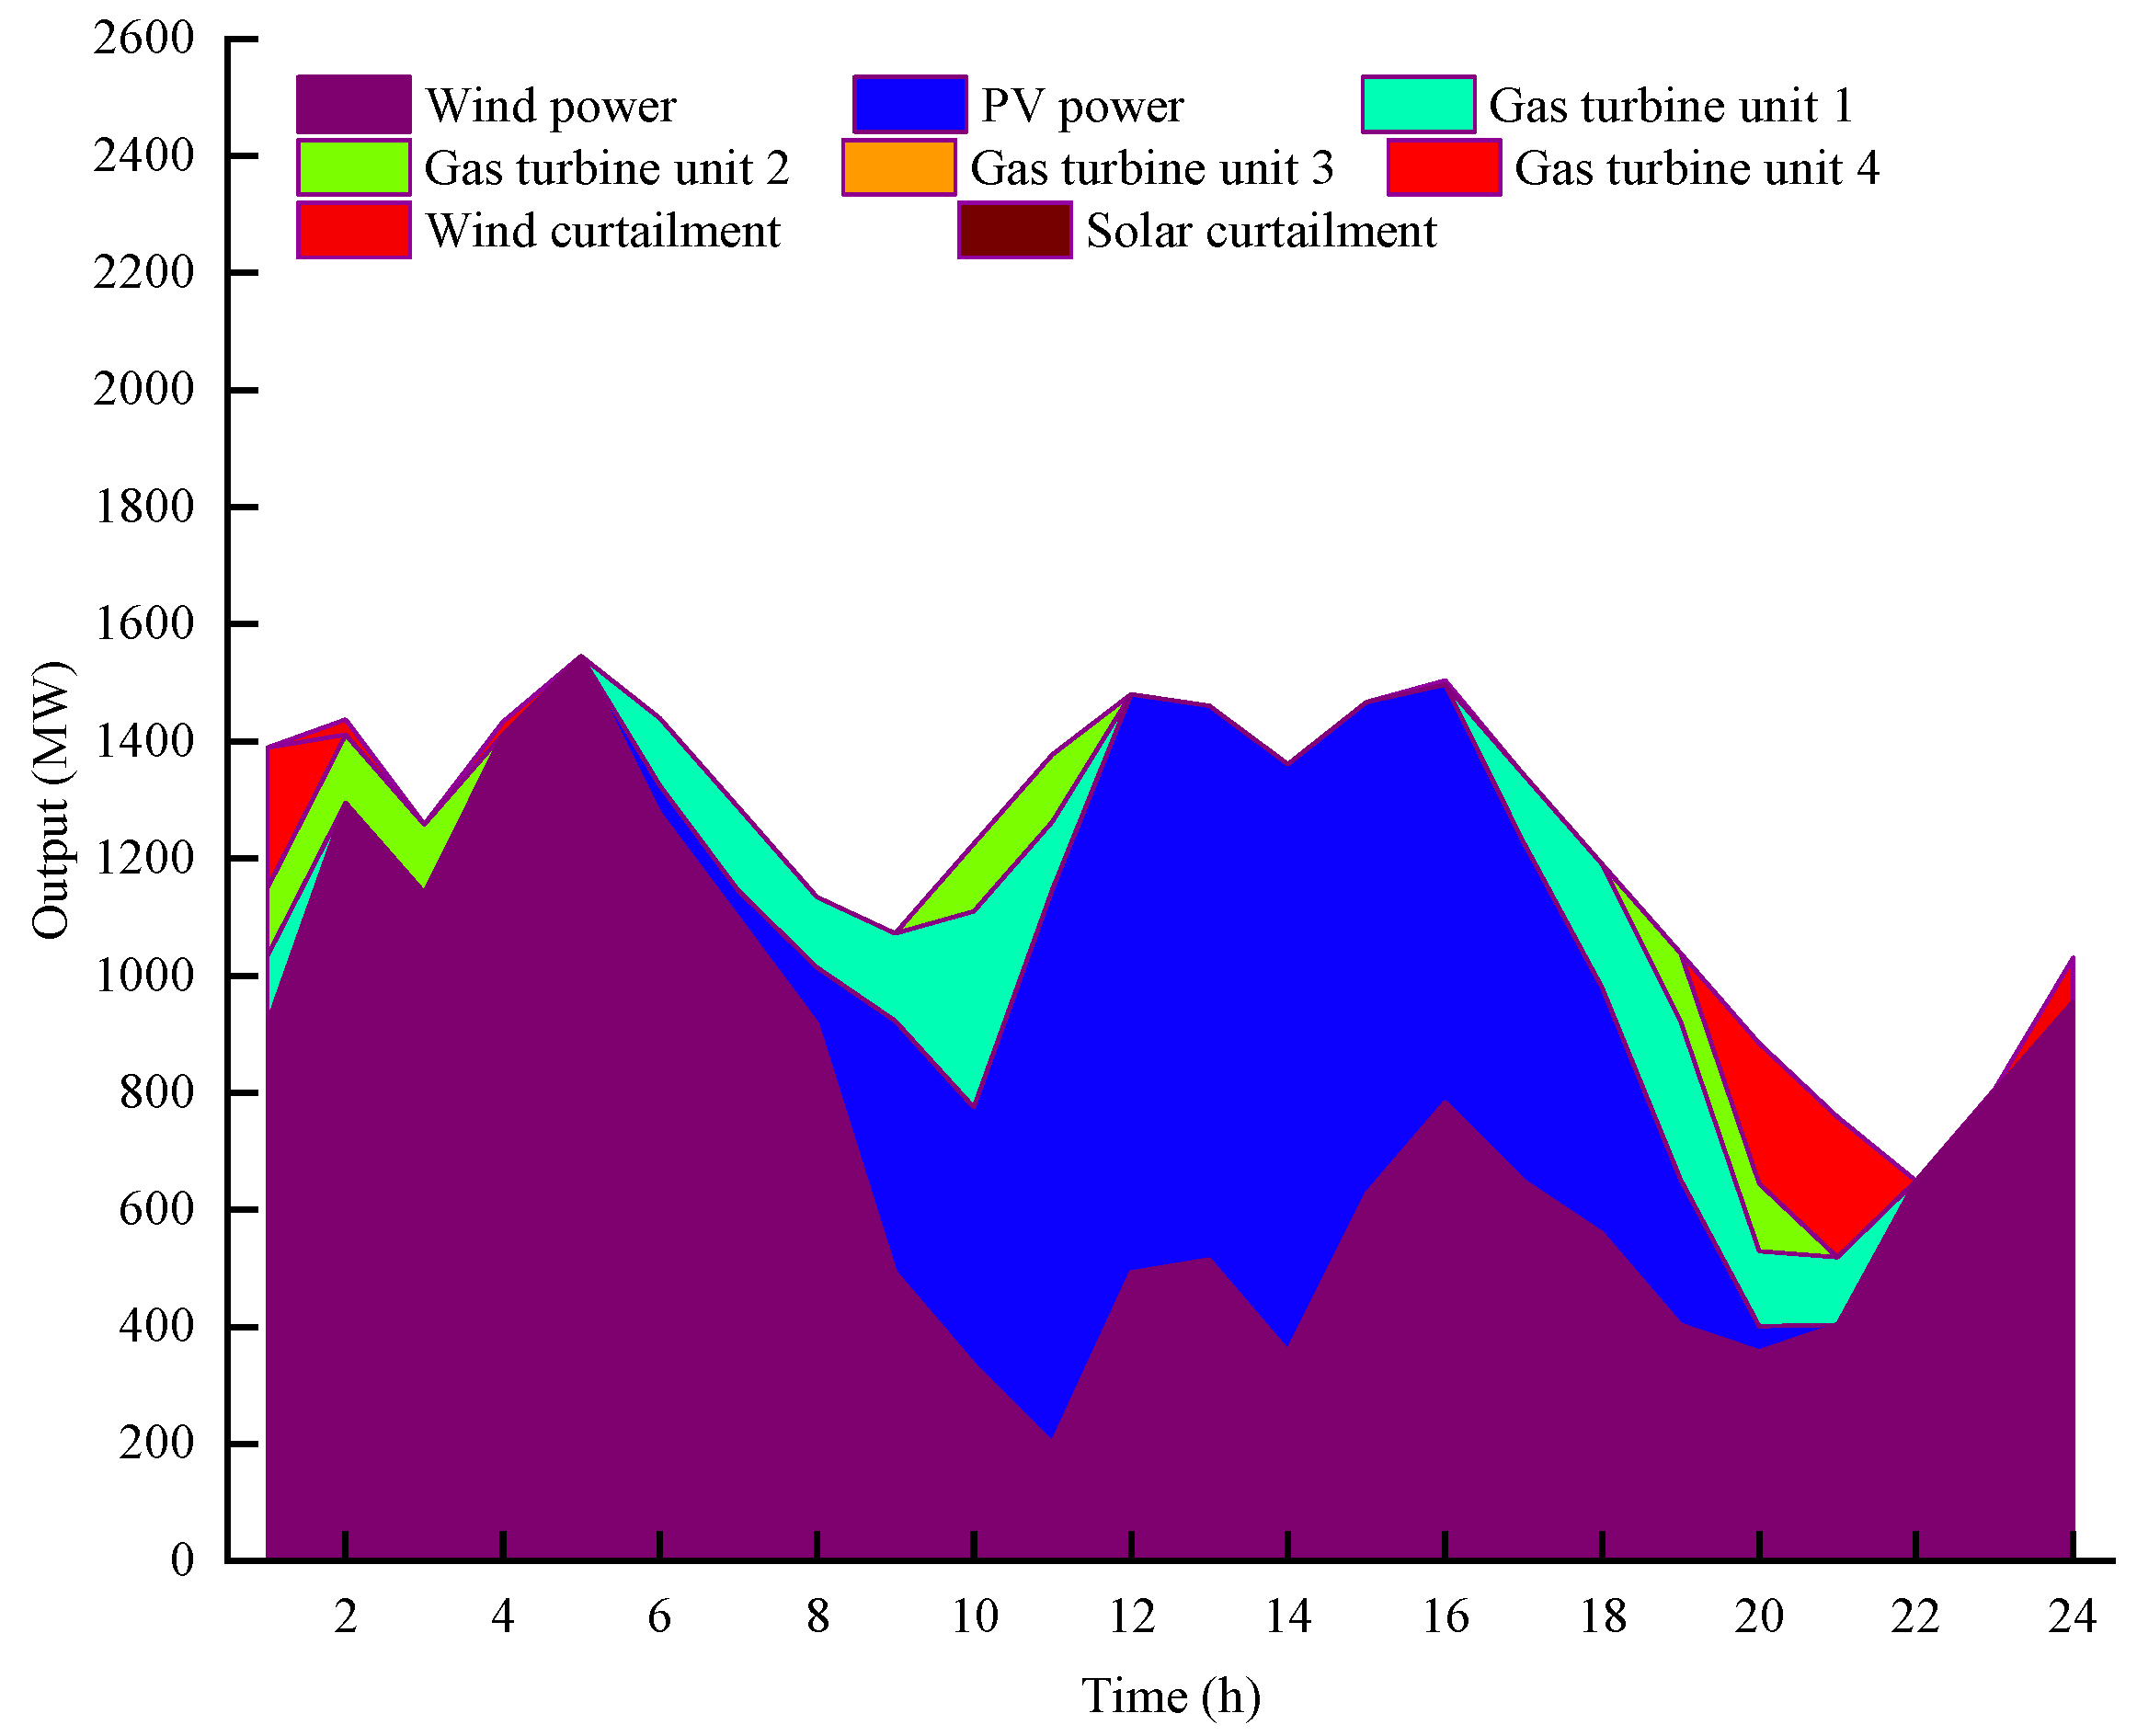
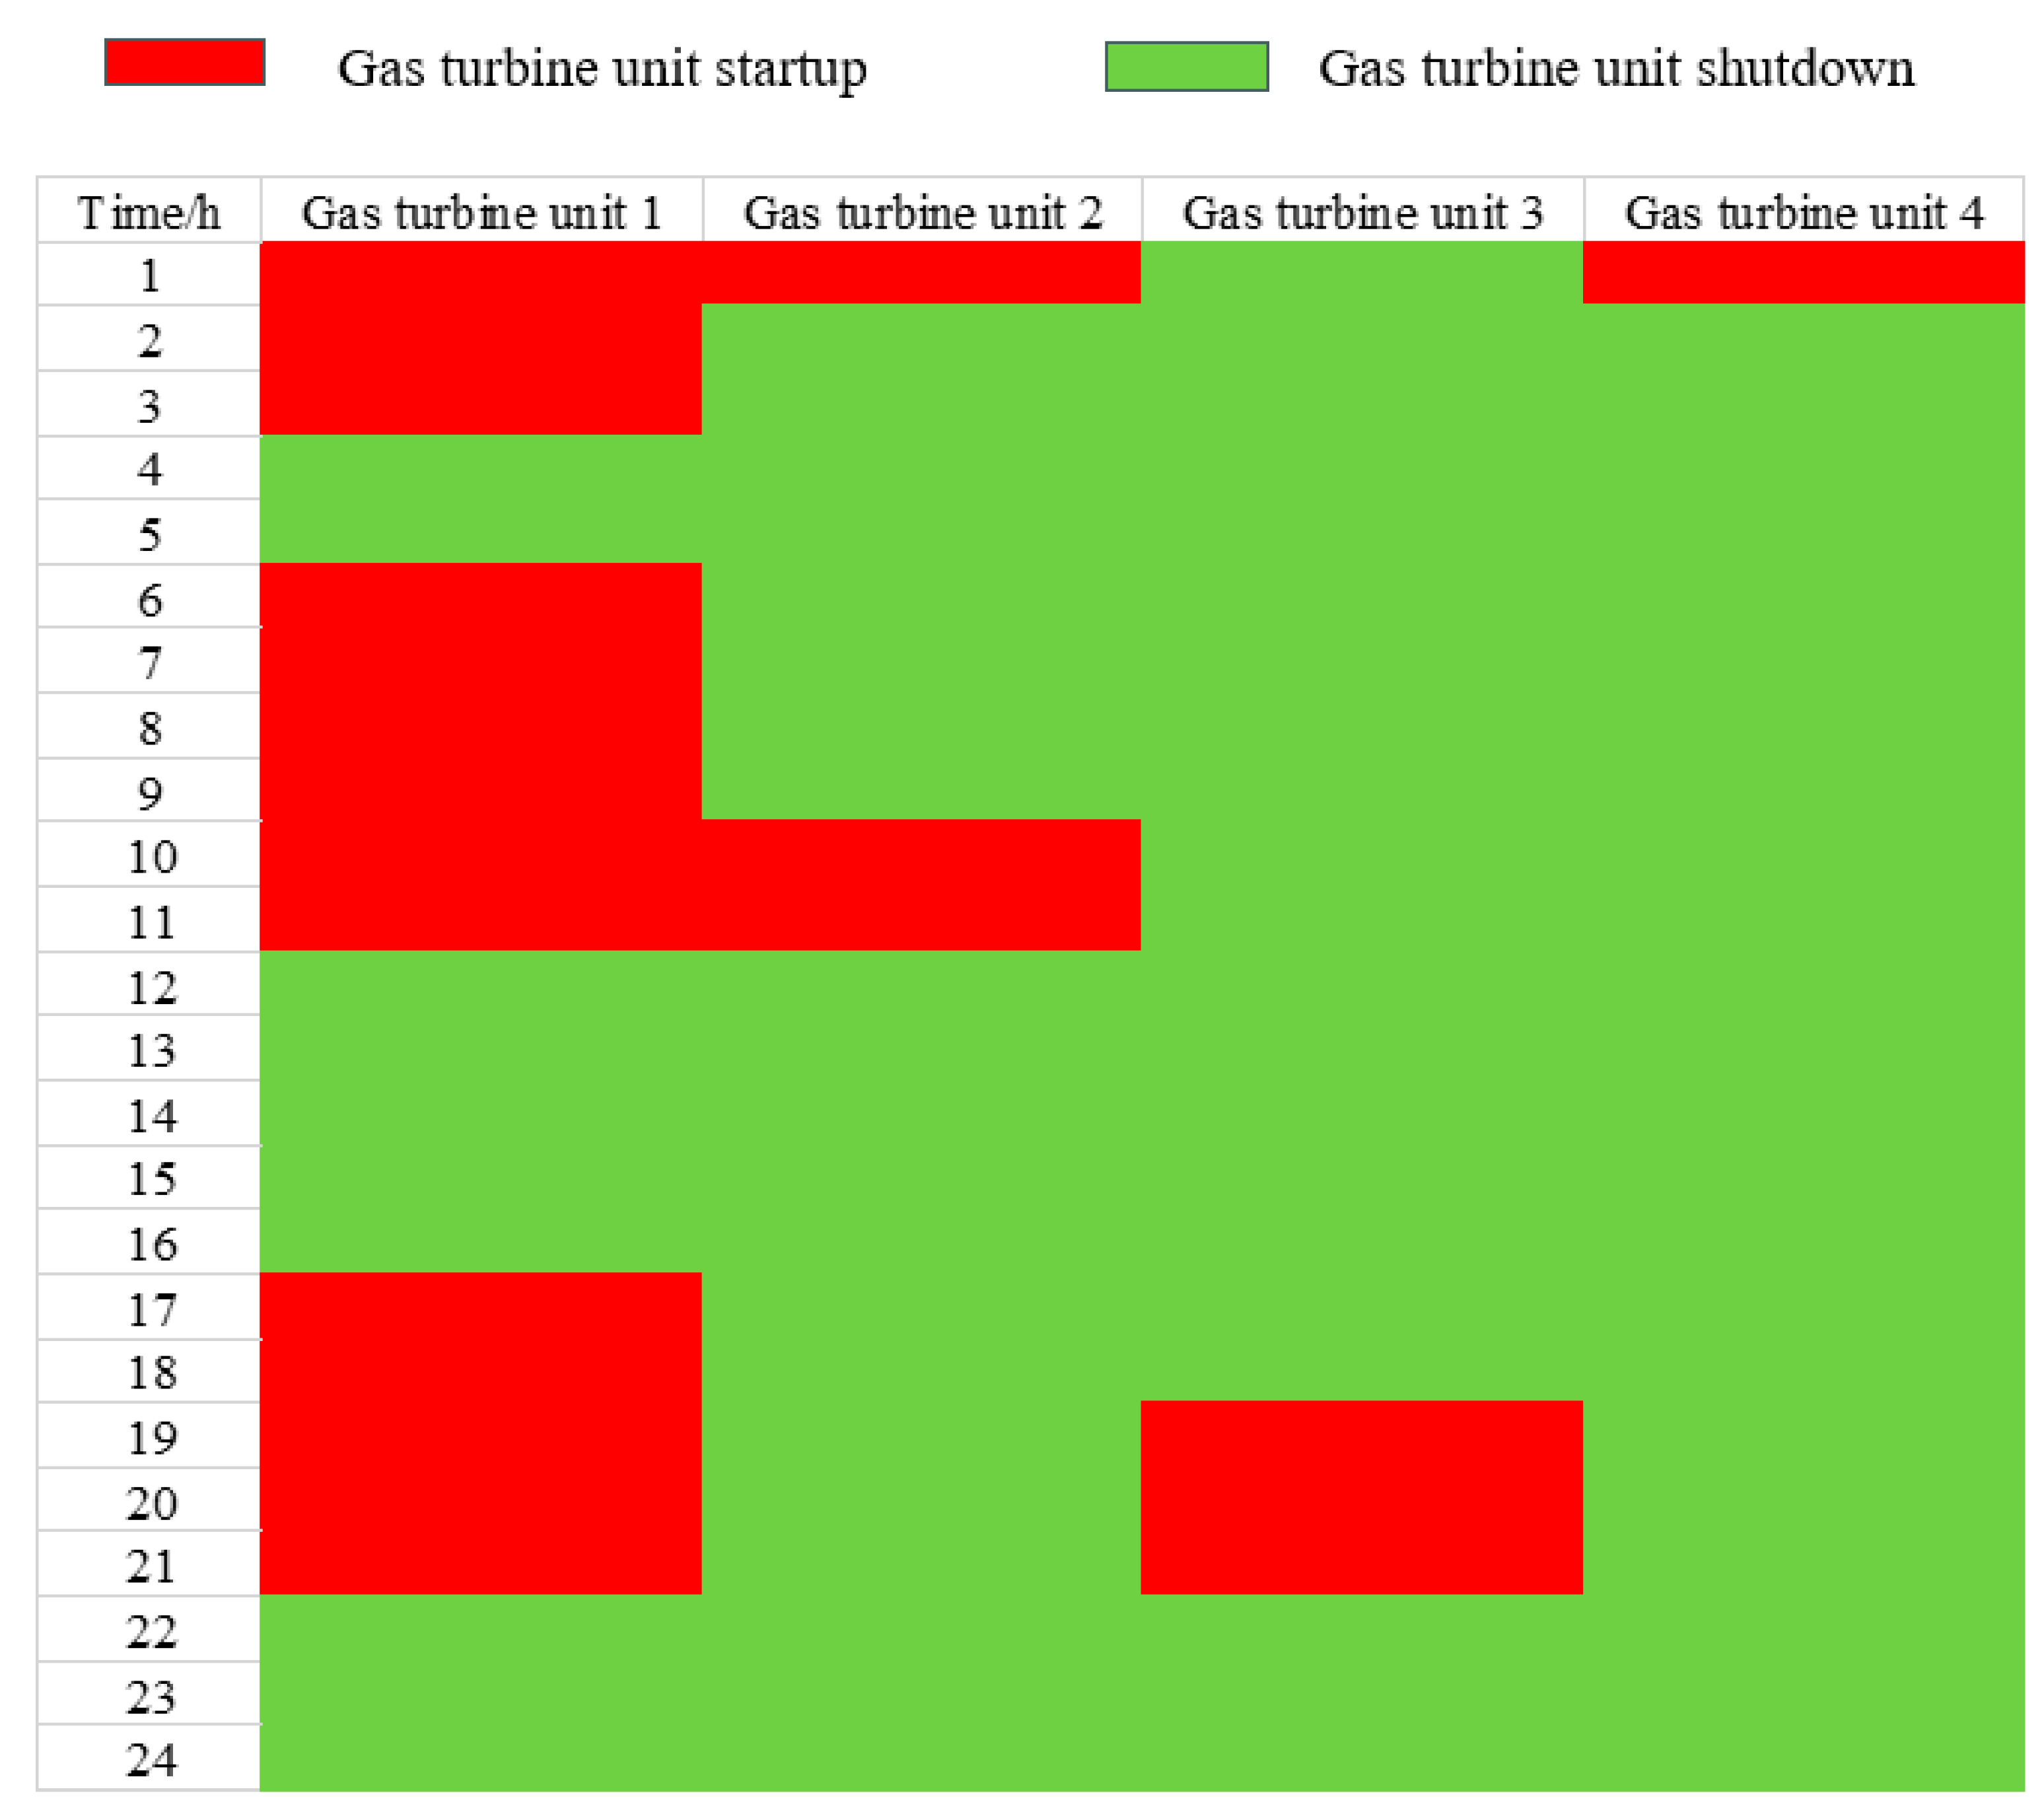
Using wind power output scenario 1 and photovoltaic output scenario 2 as typical daily output data, the gas price is set to the benchmark natural gas price for Sichuan Province, which is 1.53 CNY/m3. The gas–wind–solar joint feed-in tariff adopts the Sichuan coal-fired power generation feed-in price of 0.4012 CNY/kWh. Using the solution method described in Section 3.2, the peak-shaving output information for gas–wind–solar joint generation is shown in Figure 6, and the combination results for gas power units are presented in Figure 7.
From Figure 6 and Figure 7, it can be seen that implementing the gas–wind–solar hybrid power generation for peak shaving allows the gas power units to utilize their rapid start–stop characteristics. Each gas power unit can achieve quick start and stop within 2 h, enhancing the transmission power of the delivery channel. Due to the fluctuation of wind and solar power output exceeding the fluctuation limit of the transmission channel, the gas power units play a complementary coordination role. From 4:00 to 6:00, when the wind power output is high, all gas turbine units are shut down, maximizing the absorption of renewable energy. From 6:00 to 10:00, with wind power output still considerable and solar output beginning to increase, only gas turbine unit 1 is in operation, providing supplementary power while facilitating renewable energy utilization. From 10:00 to 12:00, as wind output decreases and solar output increases, gas turbine units 1 and 2 are both started to stabilize transmission power and reduce fluctuations. From 12:00 to 16:00, when solar output remains high, all gas turbine units are shut down to fully absorb renewable energy. From 17:00 to 22:00, as combined wind and solar output decreases, gas turbine unit 1 is gradually started and gas turbine unit 3 is activated from 19:00 to 22:00, responding swiftly to the reduced renewable generation and supporting system peak load requirements. From 22:00 to 24:00, as renewable energy output remains low, all gas turbine units are shut down, minimizing operational costs and maintaining system efficiency. Overall, the flexible start–stop strategy of the gas turbine units effectively balances the fluctuations of wind and solar generation, enhances the transmission channel’s ability to deliver power, and maintains system stability and economic efficiency.
The economic benefit analysis of the gas–wind–solar hybrid power generation system is shown in Table 5.
From Table 5, it can be seen that the total economic benefit of the gas–wind–solar hybrid power generation system is 9.9734 million yuan, with operating costs accounting for approximately 20% of the operating income. The penalty costs for wind and solar curtailment, along with the carbon emission penalty costs for gas-fired power, only account for 1.75% of the operating income. This indicates that the gas–wind–solar hybrid generation mode can fully utilize the coordination and peak-shaving capabilities of gas power, improving both the economic and environmental benefits of the system operation.
(2)
Impact of Natural Gas Price on System Economic Indicators
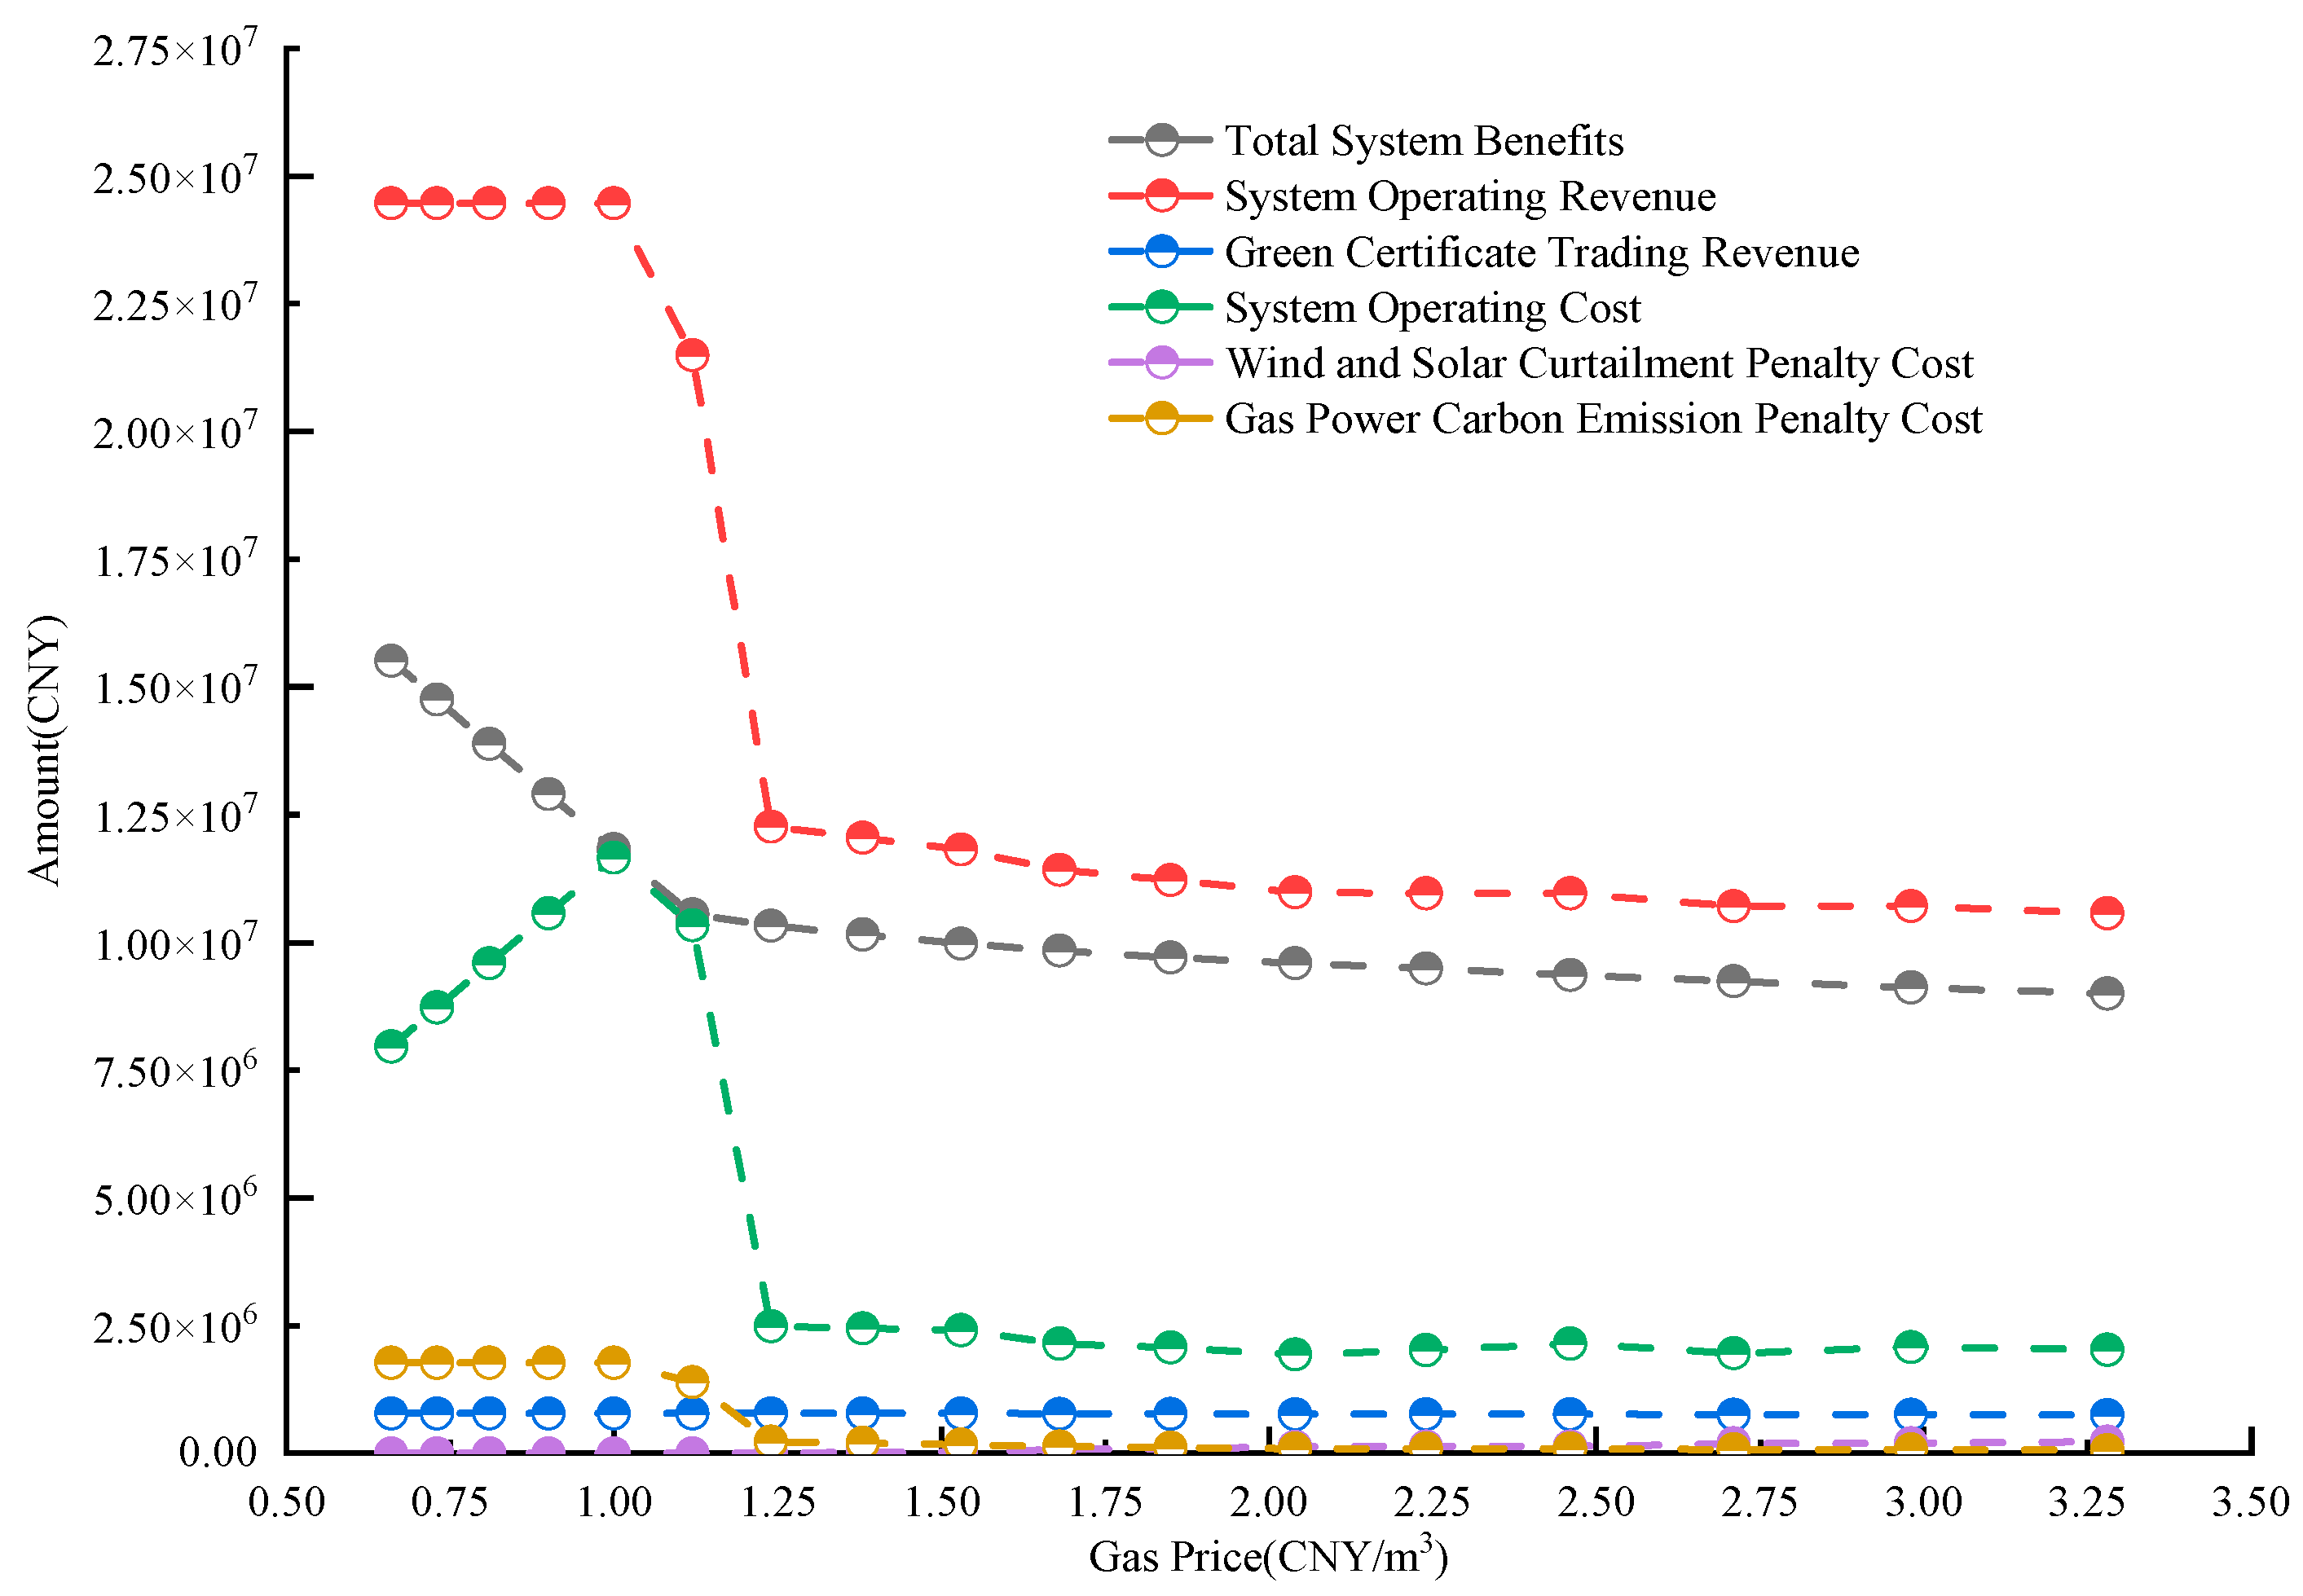
Due to the influence of international gas prices, natural gas prices in China fluctuate significantly. Currently, natural gas prices in Sichuan are relatively lower compared to those in Central and East China. This section explores the impact of natural gas price changes on the system’s total benefits, as shown in Figure 8.
From Figure 8, it can be observed that as the natural gas price changes from 0.66 yuan/m3 to 3.28 yuan/m3, the system’s total economic benefit shows a rapid decline followed by a slower decrease. The system’s operating income and operating costs experience a sharp drop when the gas price reaches 1.12 yuan/m3, while the green certificate trading income, wind and solar curtailment penalty costs, and gas-fired carbon emission penalty costs show minimal changes. This is because, when the gas price is low, the gas power units can operate at base load to generate higher economic benefits. When the gas price increases to 1.3 CNY/m3, the system becomes highly sensitive to gas price fluctuations. The system attempts to improve its total economic benefit by reducing operational costs. Since the primary operational cost in the gas–wind–solar hybrid operation comes from the fuel cost of gas power, gas units tend to reduce output or shut down to lower generation costs and carbon emission penalties, thus reducing the overall output of the system.
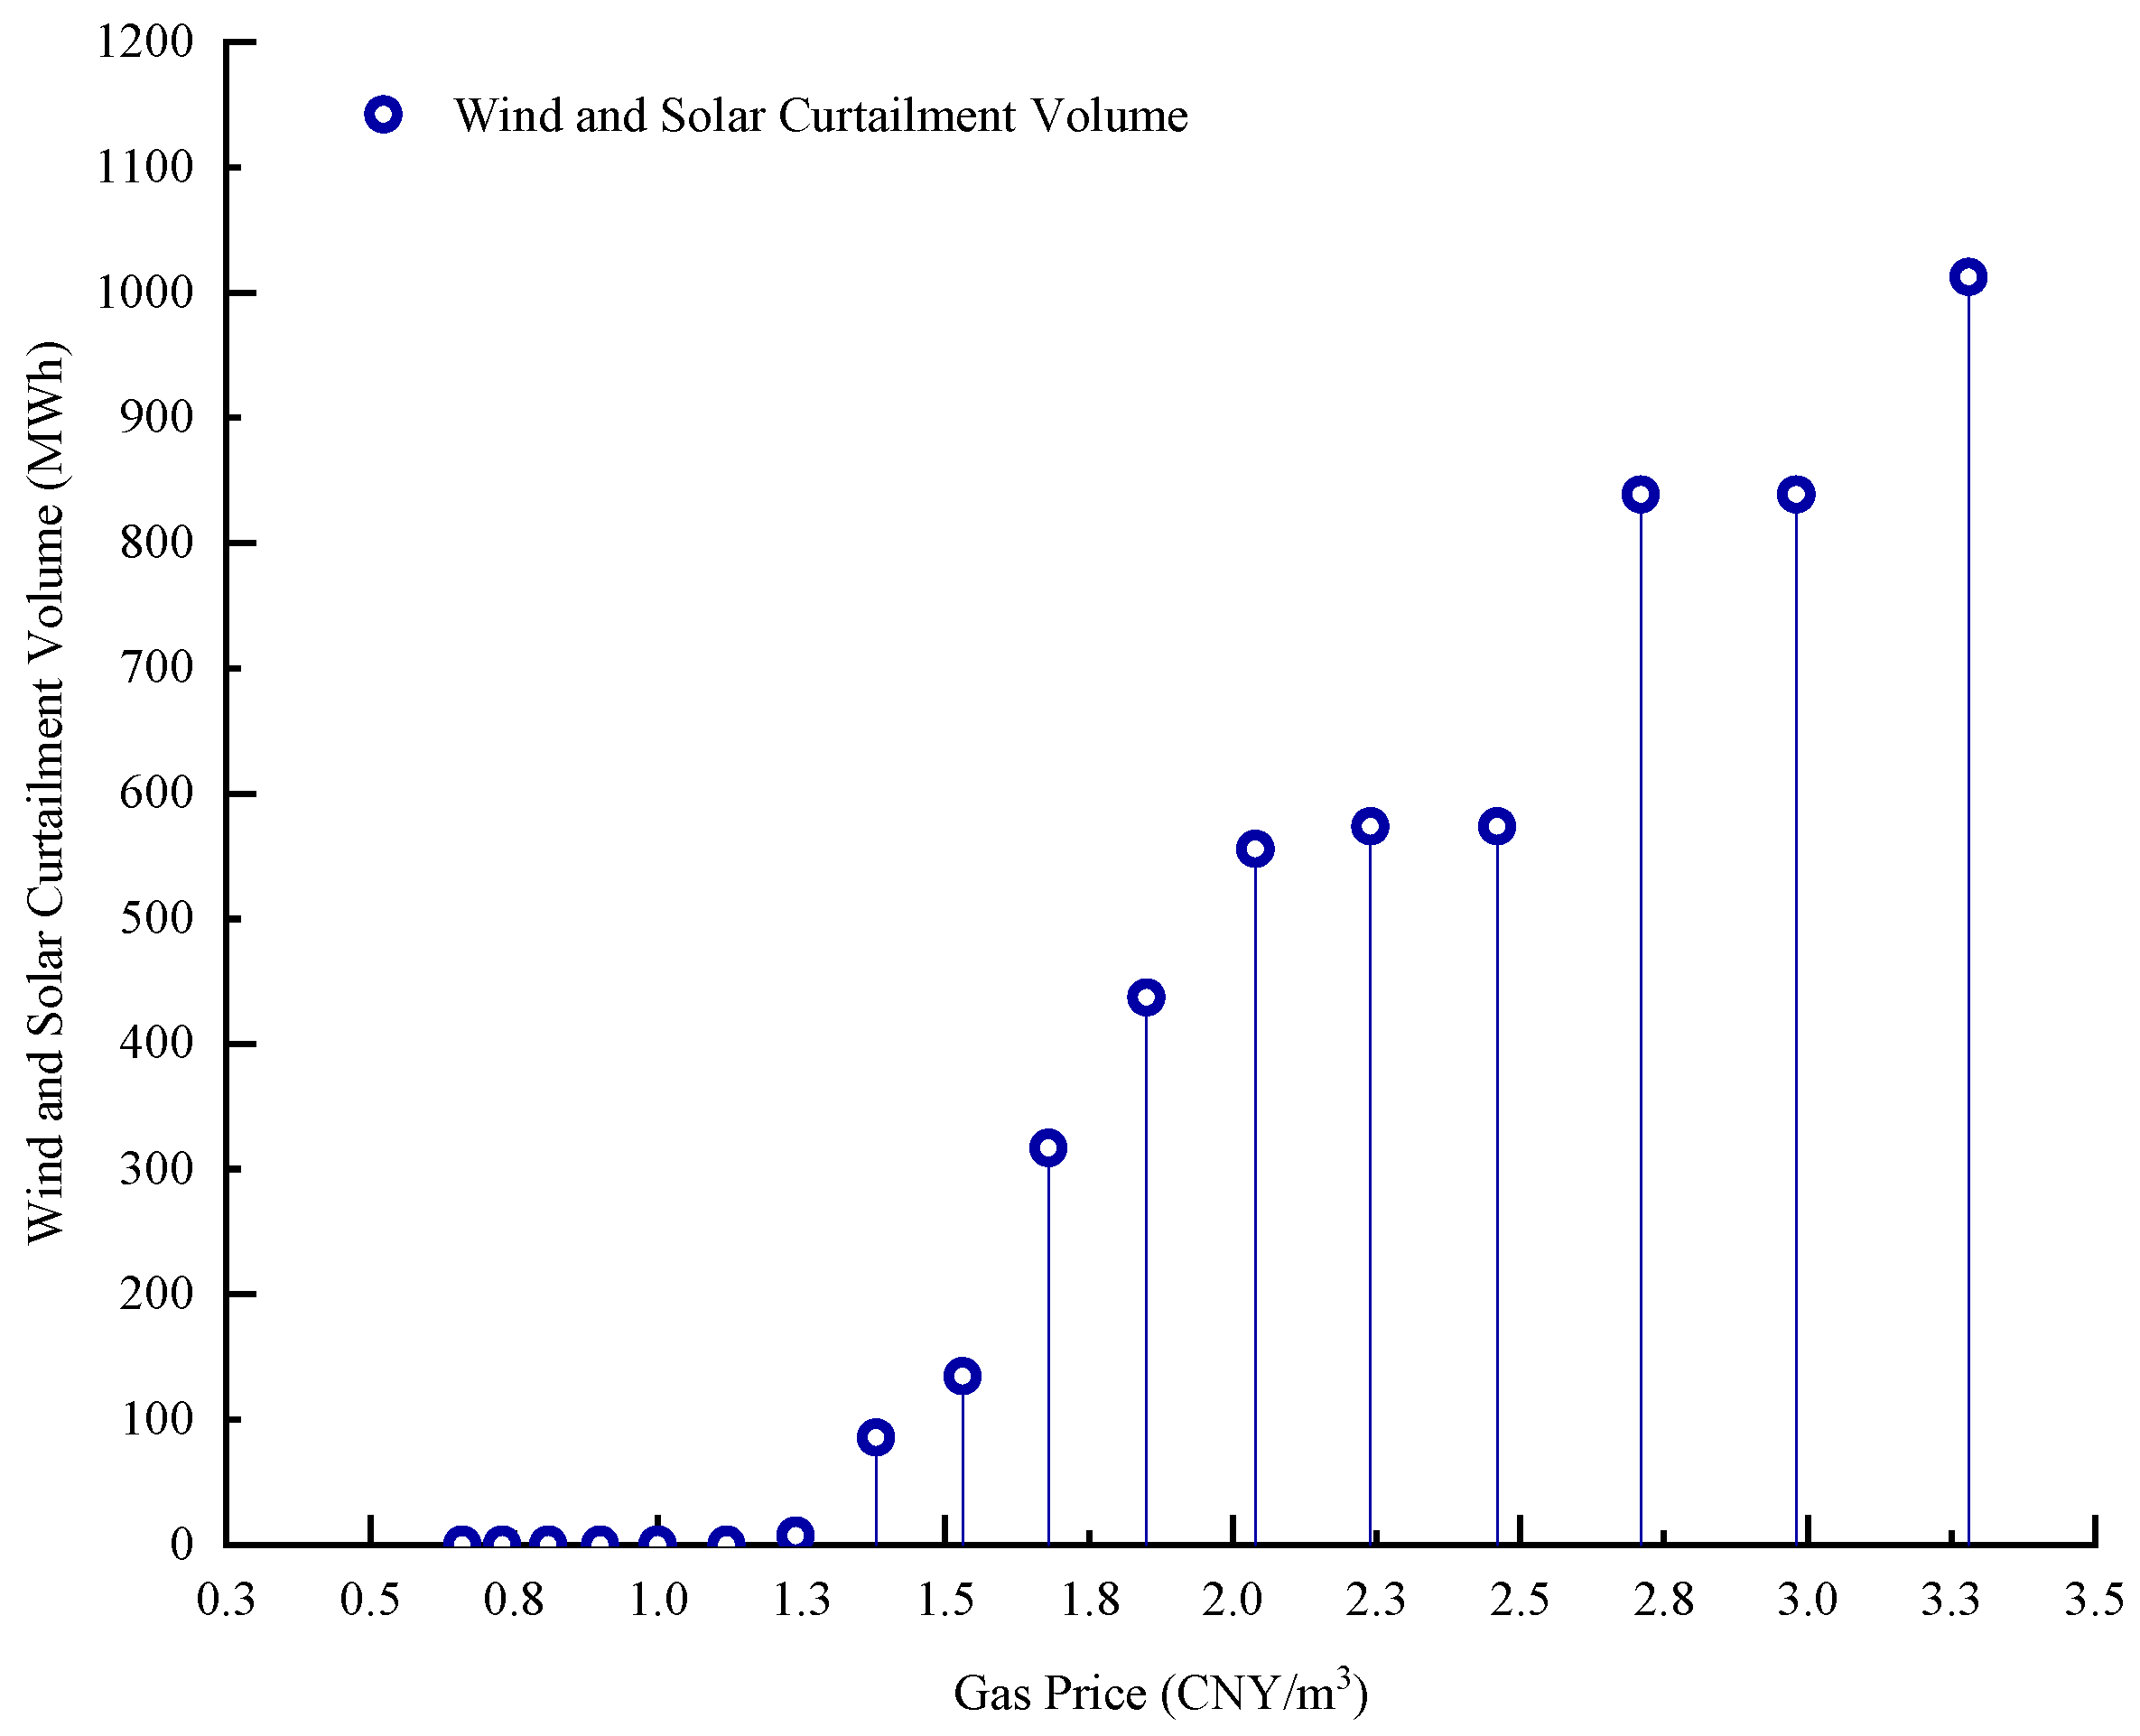
When gas prices rise significantly, the system primarily uses gas power units for peak-shaving. However, the contribution of gas power units to the total dispatchable power remains relatively small, accounting for only about 4.8%. As a result, the impact on the system’s operating costs, income, and overall economic performance is minimal, and the economic indicators show only slight variations under high gas prices. This analysis indicates that higher gas prices force the system to reduce the output of the four gas units. Consequently, when fluctuations in wind and solar power generation approach the limits of the export channel’s capacity, the system is forced to rely on curtailing wind and solar energy to meet operational constraints. The amounts of wind and solar curtailment at different natural gas prices are shown in Figure 9.
From Figure 9, it can be observed that as the gas price increases from 0.66 CNY/m3 to 3.28 CNY/m3, the wind and solar curtailment increases from 0 MWh to 1012.37 MWh, with a growing trend in the amount of curtailment. This indicates that when the gas price is relatively low, the gas-fired peak-shaving output can reduce the wind and solar curtailment in the gas–wind–solar hybrid generation system. As seen in the Figure 8, the reduced curtailment of wind and solar output not only increases the revenue from grid-connected electricity but also generates additional green certificate income. This suggests that taking advantage of low gas prices helps improve the economic performance of gas–wind–solar hybrid peak-shaving generation.
(3)
Impact of Grid-connected Electricity Price on System Economic Indicators
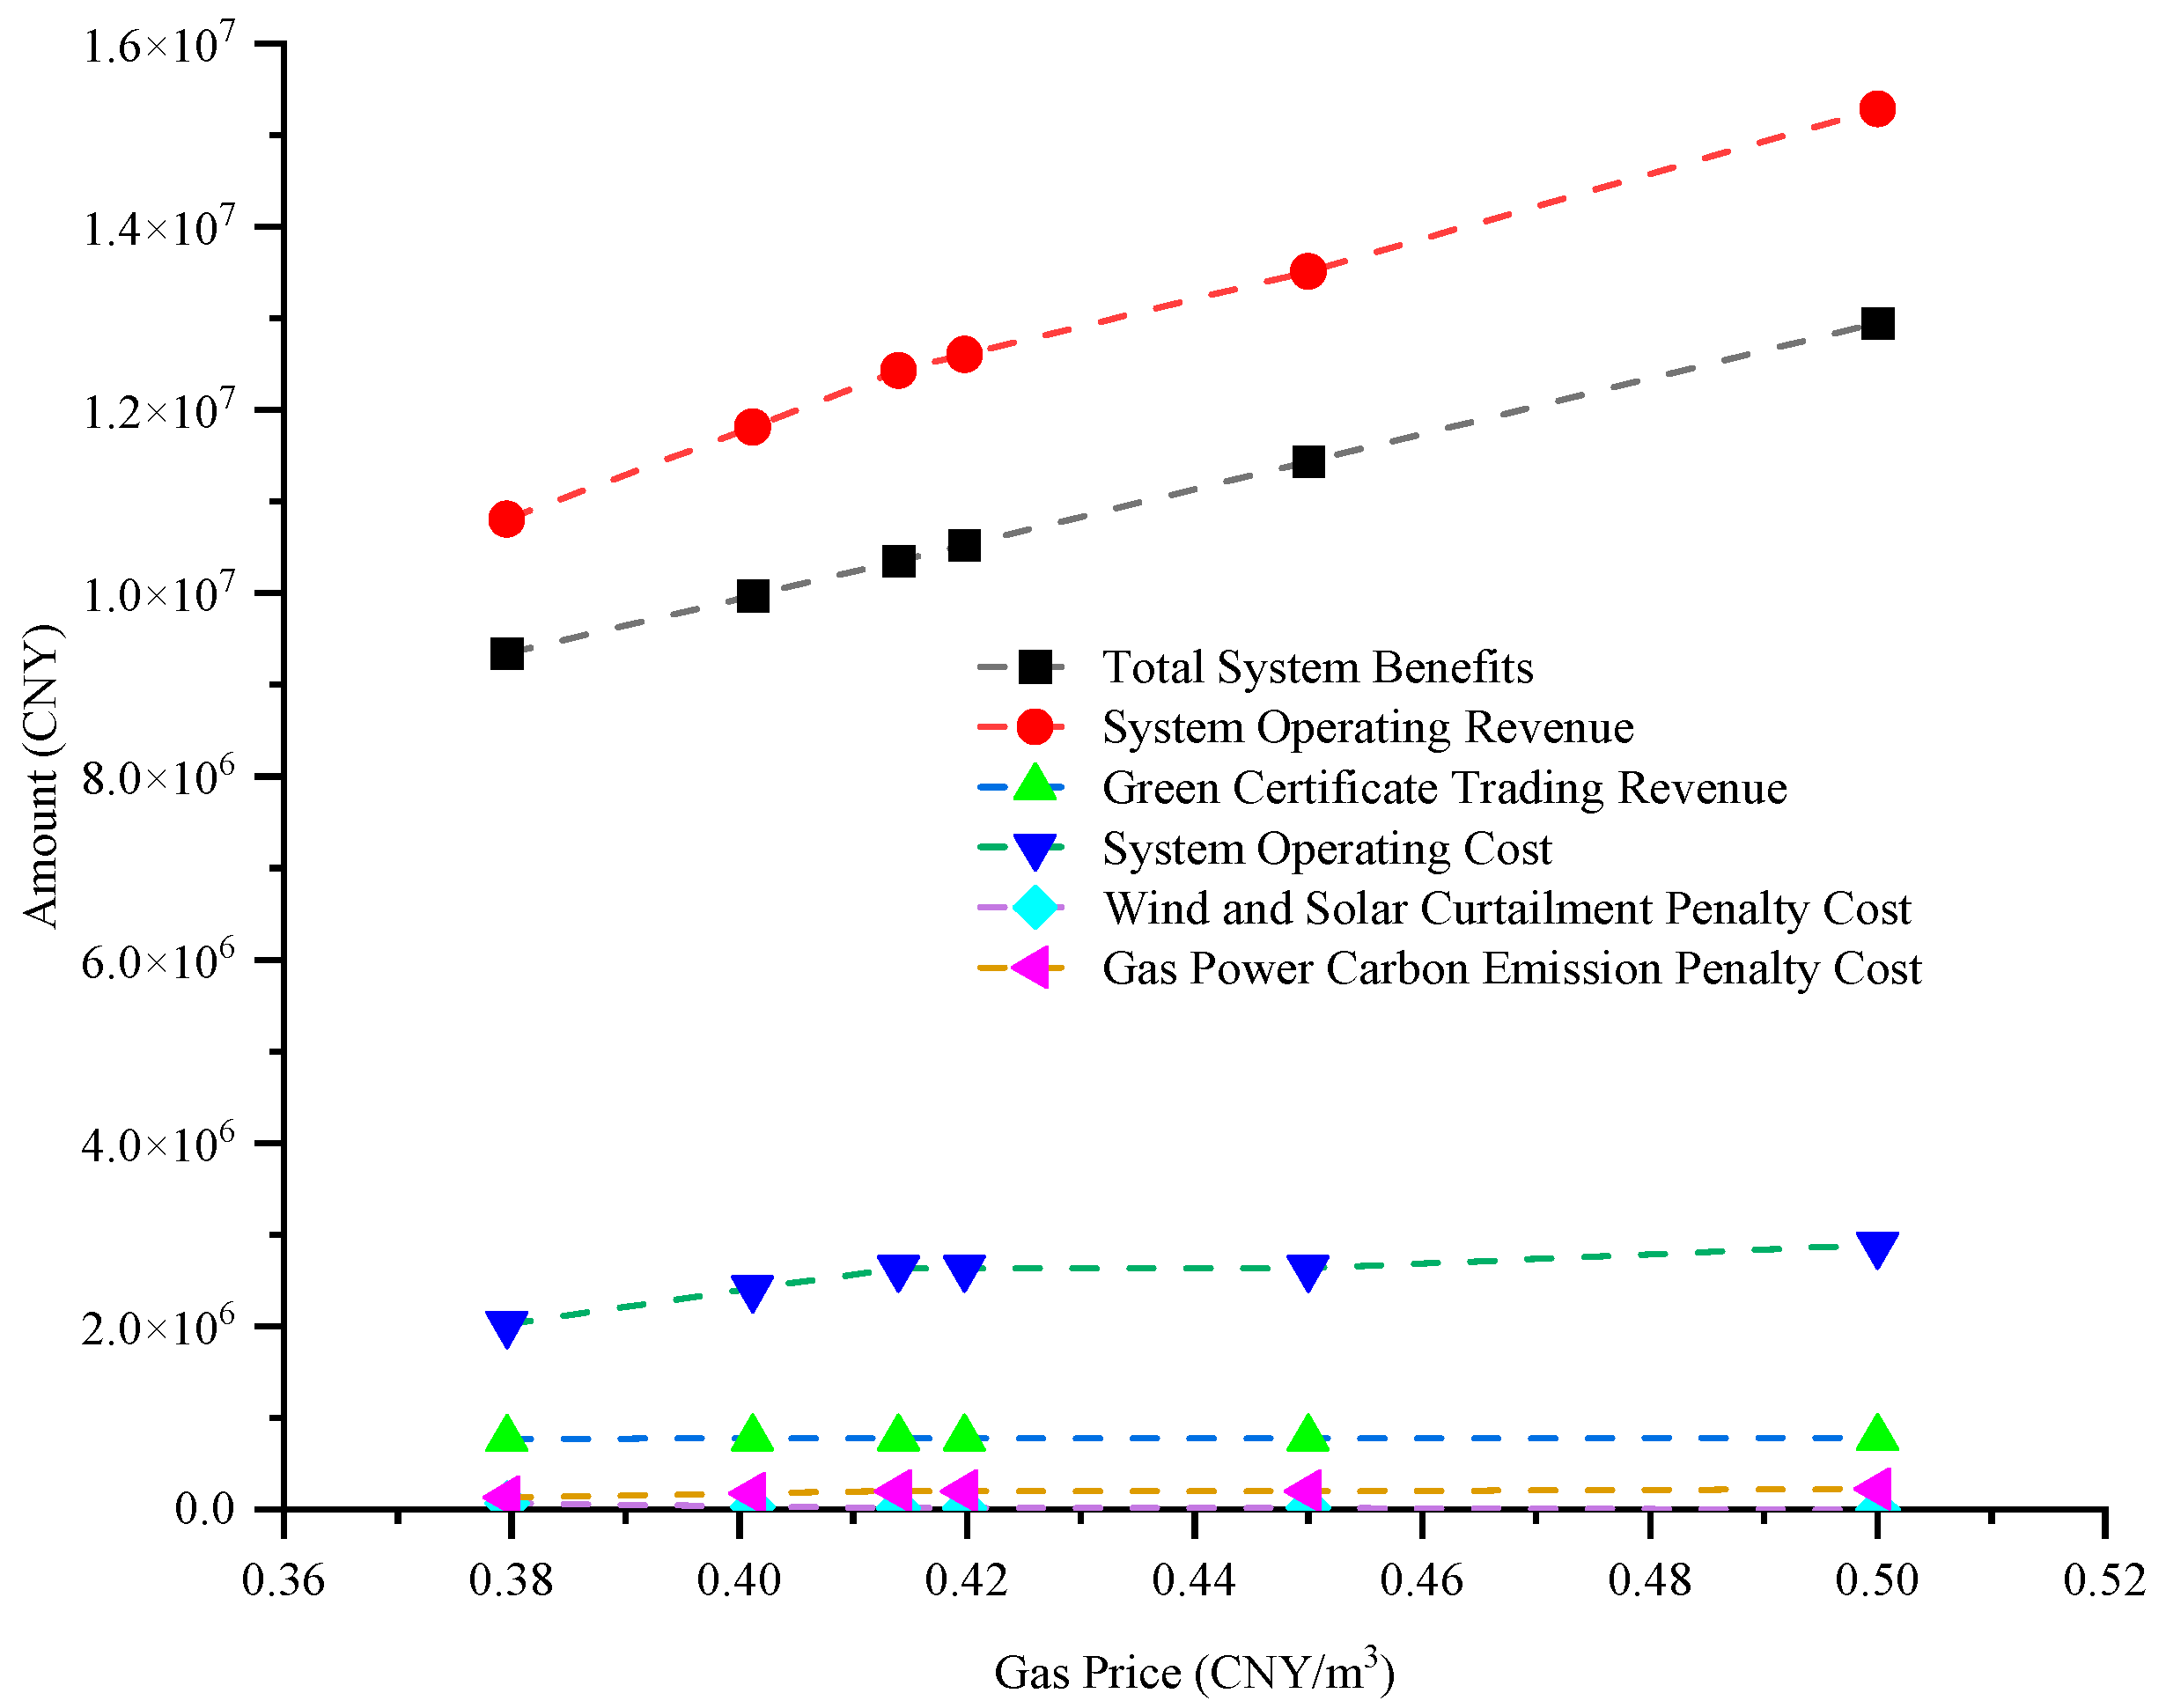
The impact of the grid-connected electricity price on the economic performance of the gas–wind–solar hybrid generation system is analyzed in Figure 10.
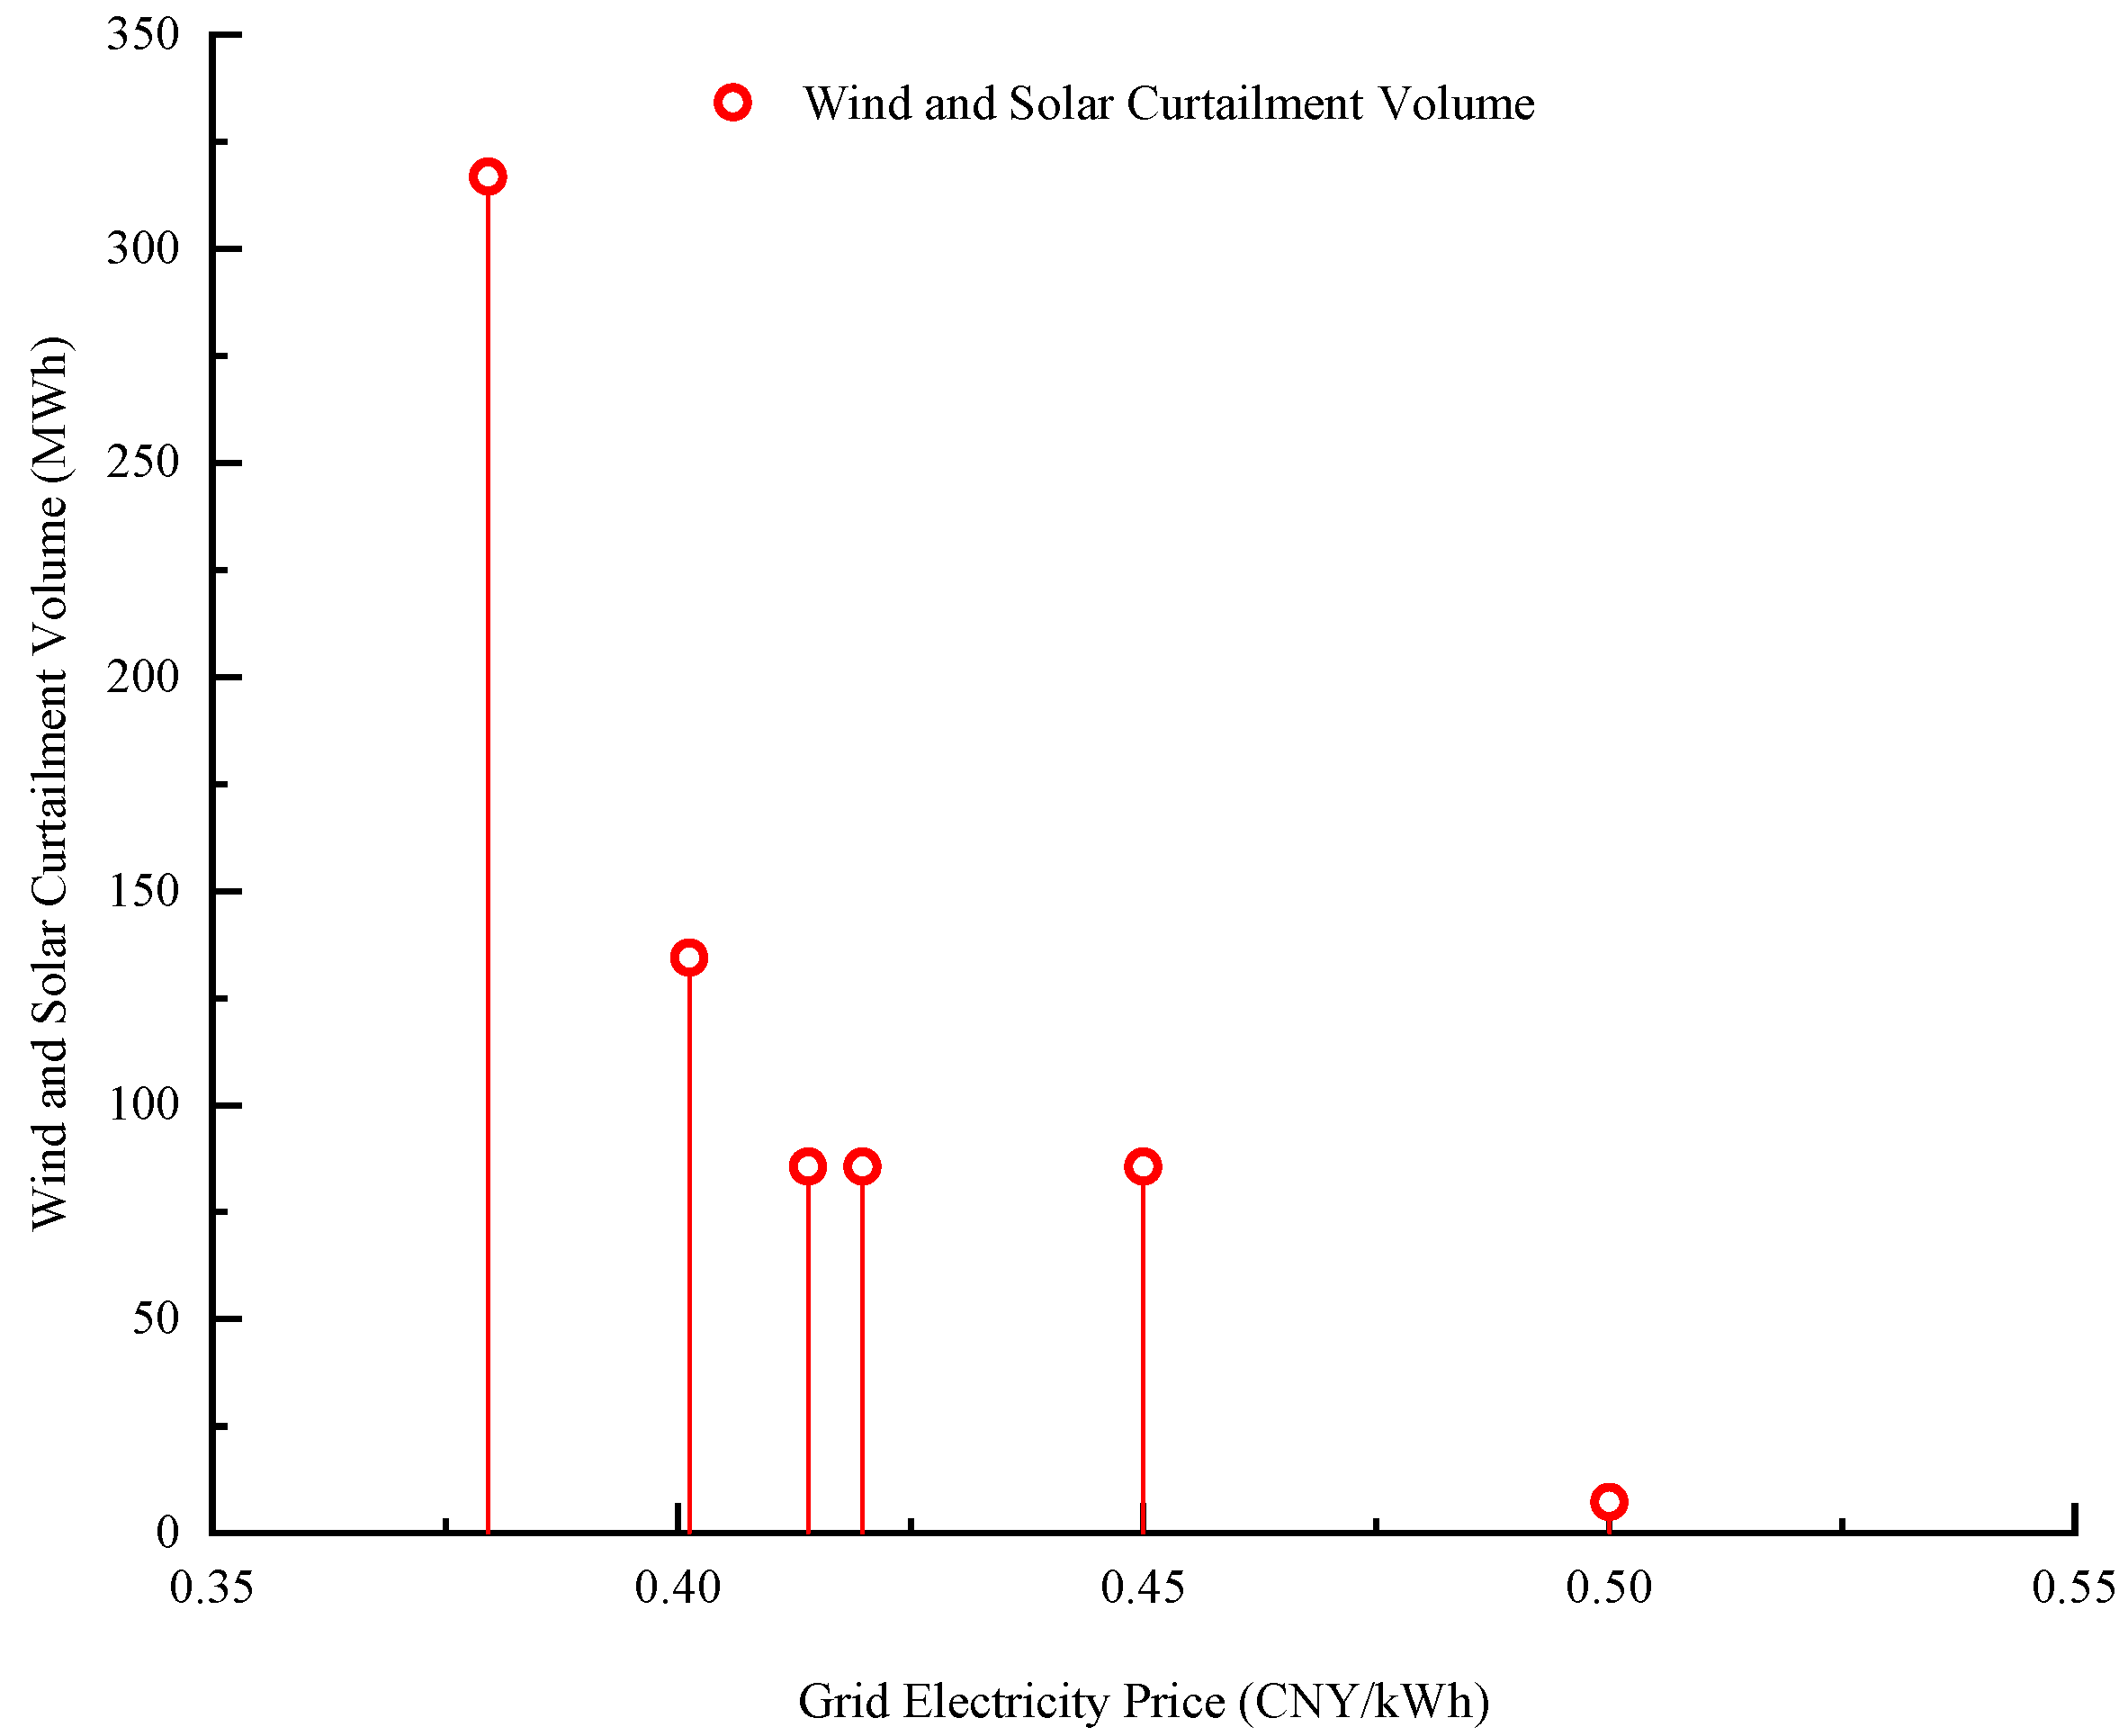
From Figure 10, it can be observed that when the grid-connected electricity price for the gas–wind–solar hybrid generation system increases from 0.38 CNY/kWh to 0.5 CNY/kWh, the total system economic benefit, operating revenue, green certificate trading income, system operating cost, and gas-fired carbon emission penalty cost all show an increasing trend, while wind and solar curtailment costs decrease. This is because, under a fixed natural gas price, an increase in the grid-connected electricity price for the gas–wind–solar hybrid system promotes a significant increase in gas-fired power output, which prevents a rise in wind and solar curtailment, thus increasing the revenue from gas-fired generation. Additionally, the increased electricity generation from wind and solar power enhances the system’s green certificate trading income. The amount of wind and solar curtailment under different grid-connected electricity prices for gas–wind–solar hybrid generation is shown in Figure 11.
From Figure 11, it can be observed that as the grid-connected electricity price for the gas–wind–solar hybrid system increases from 0.38 CNY/kWh to 0.5 CNY/kWh, the amount of wind and solar curtailment gradually decreases from 316.93 MWh to 7.2 MWh. This is because the output of wind and solar power is constrained by the predicted output from the typical scenario. When the grid-connected electricity price reaches a certain level, the system’s wind and solar power transmission approaches the predicted output values, causing the wind and solar curtailment to gradually approach zero. As a result, the system’s green certificate income and operating revenue also stabilize.
(4)
Green Certificate Price on System Economic Indicators
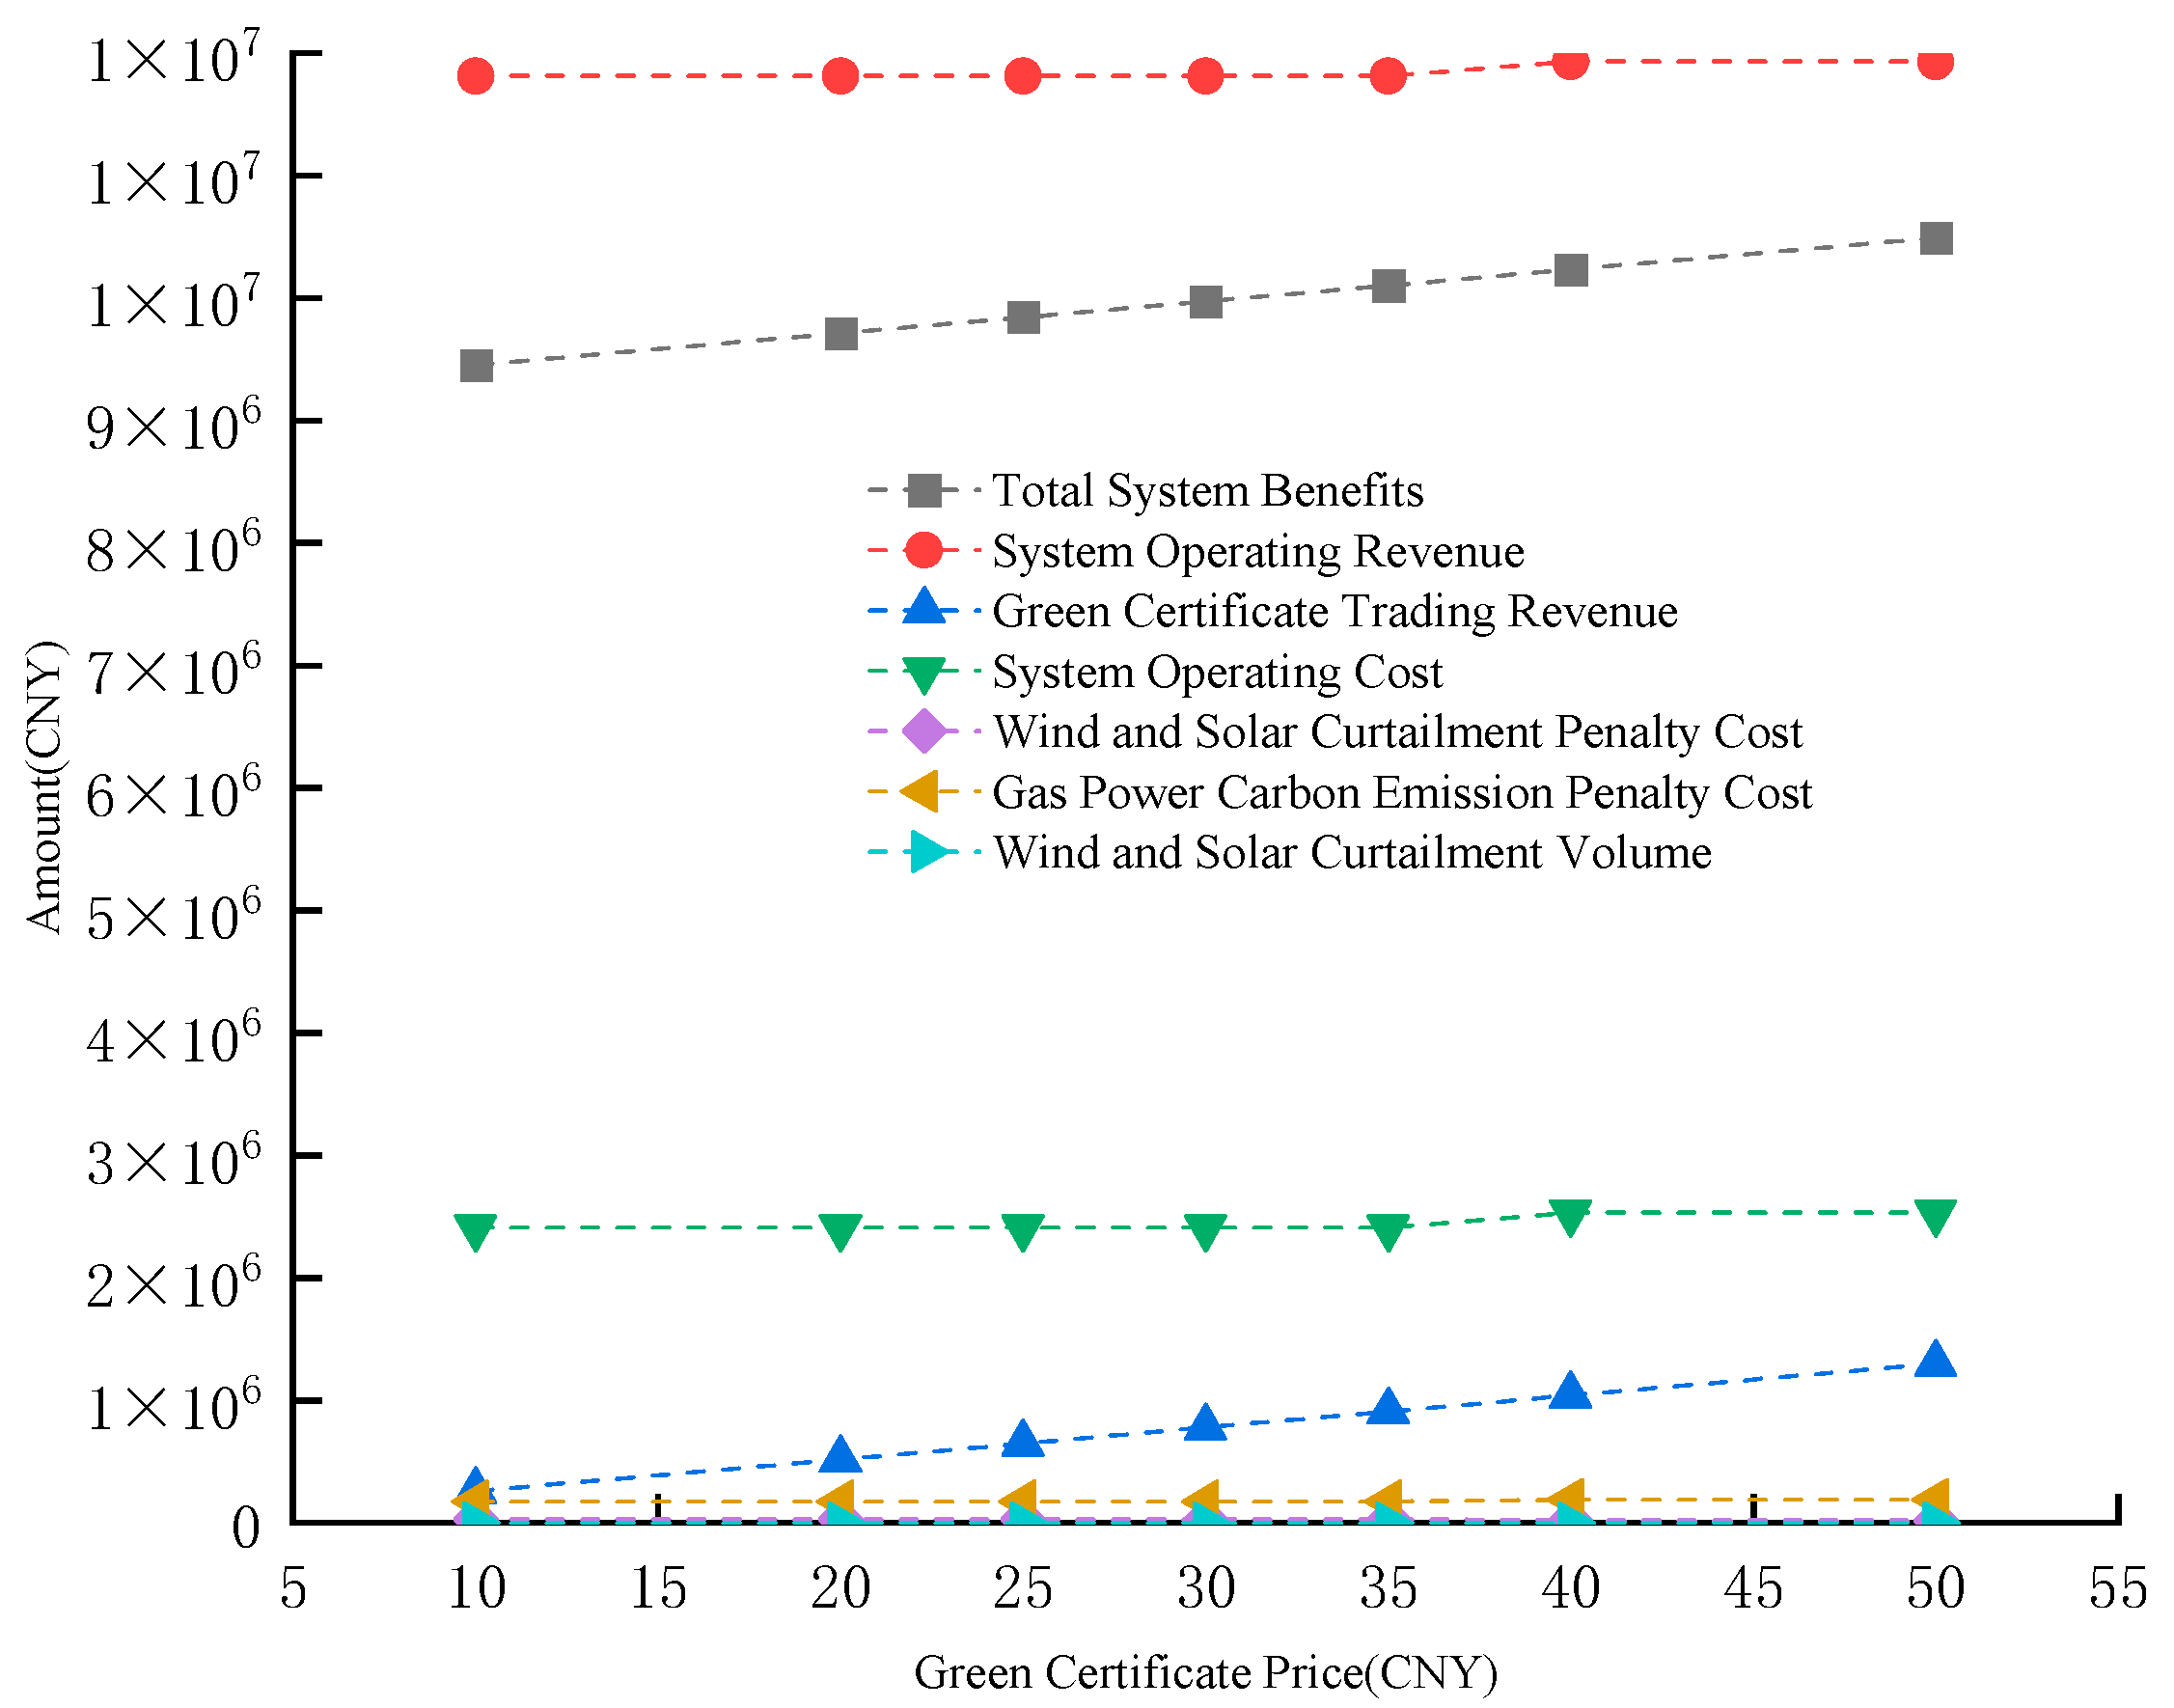
The impact of green certificate price on the economic performance of the gas–wind–solar hybrid generation system is analyzed in Figure 12.
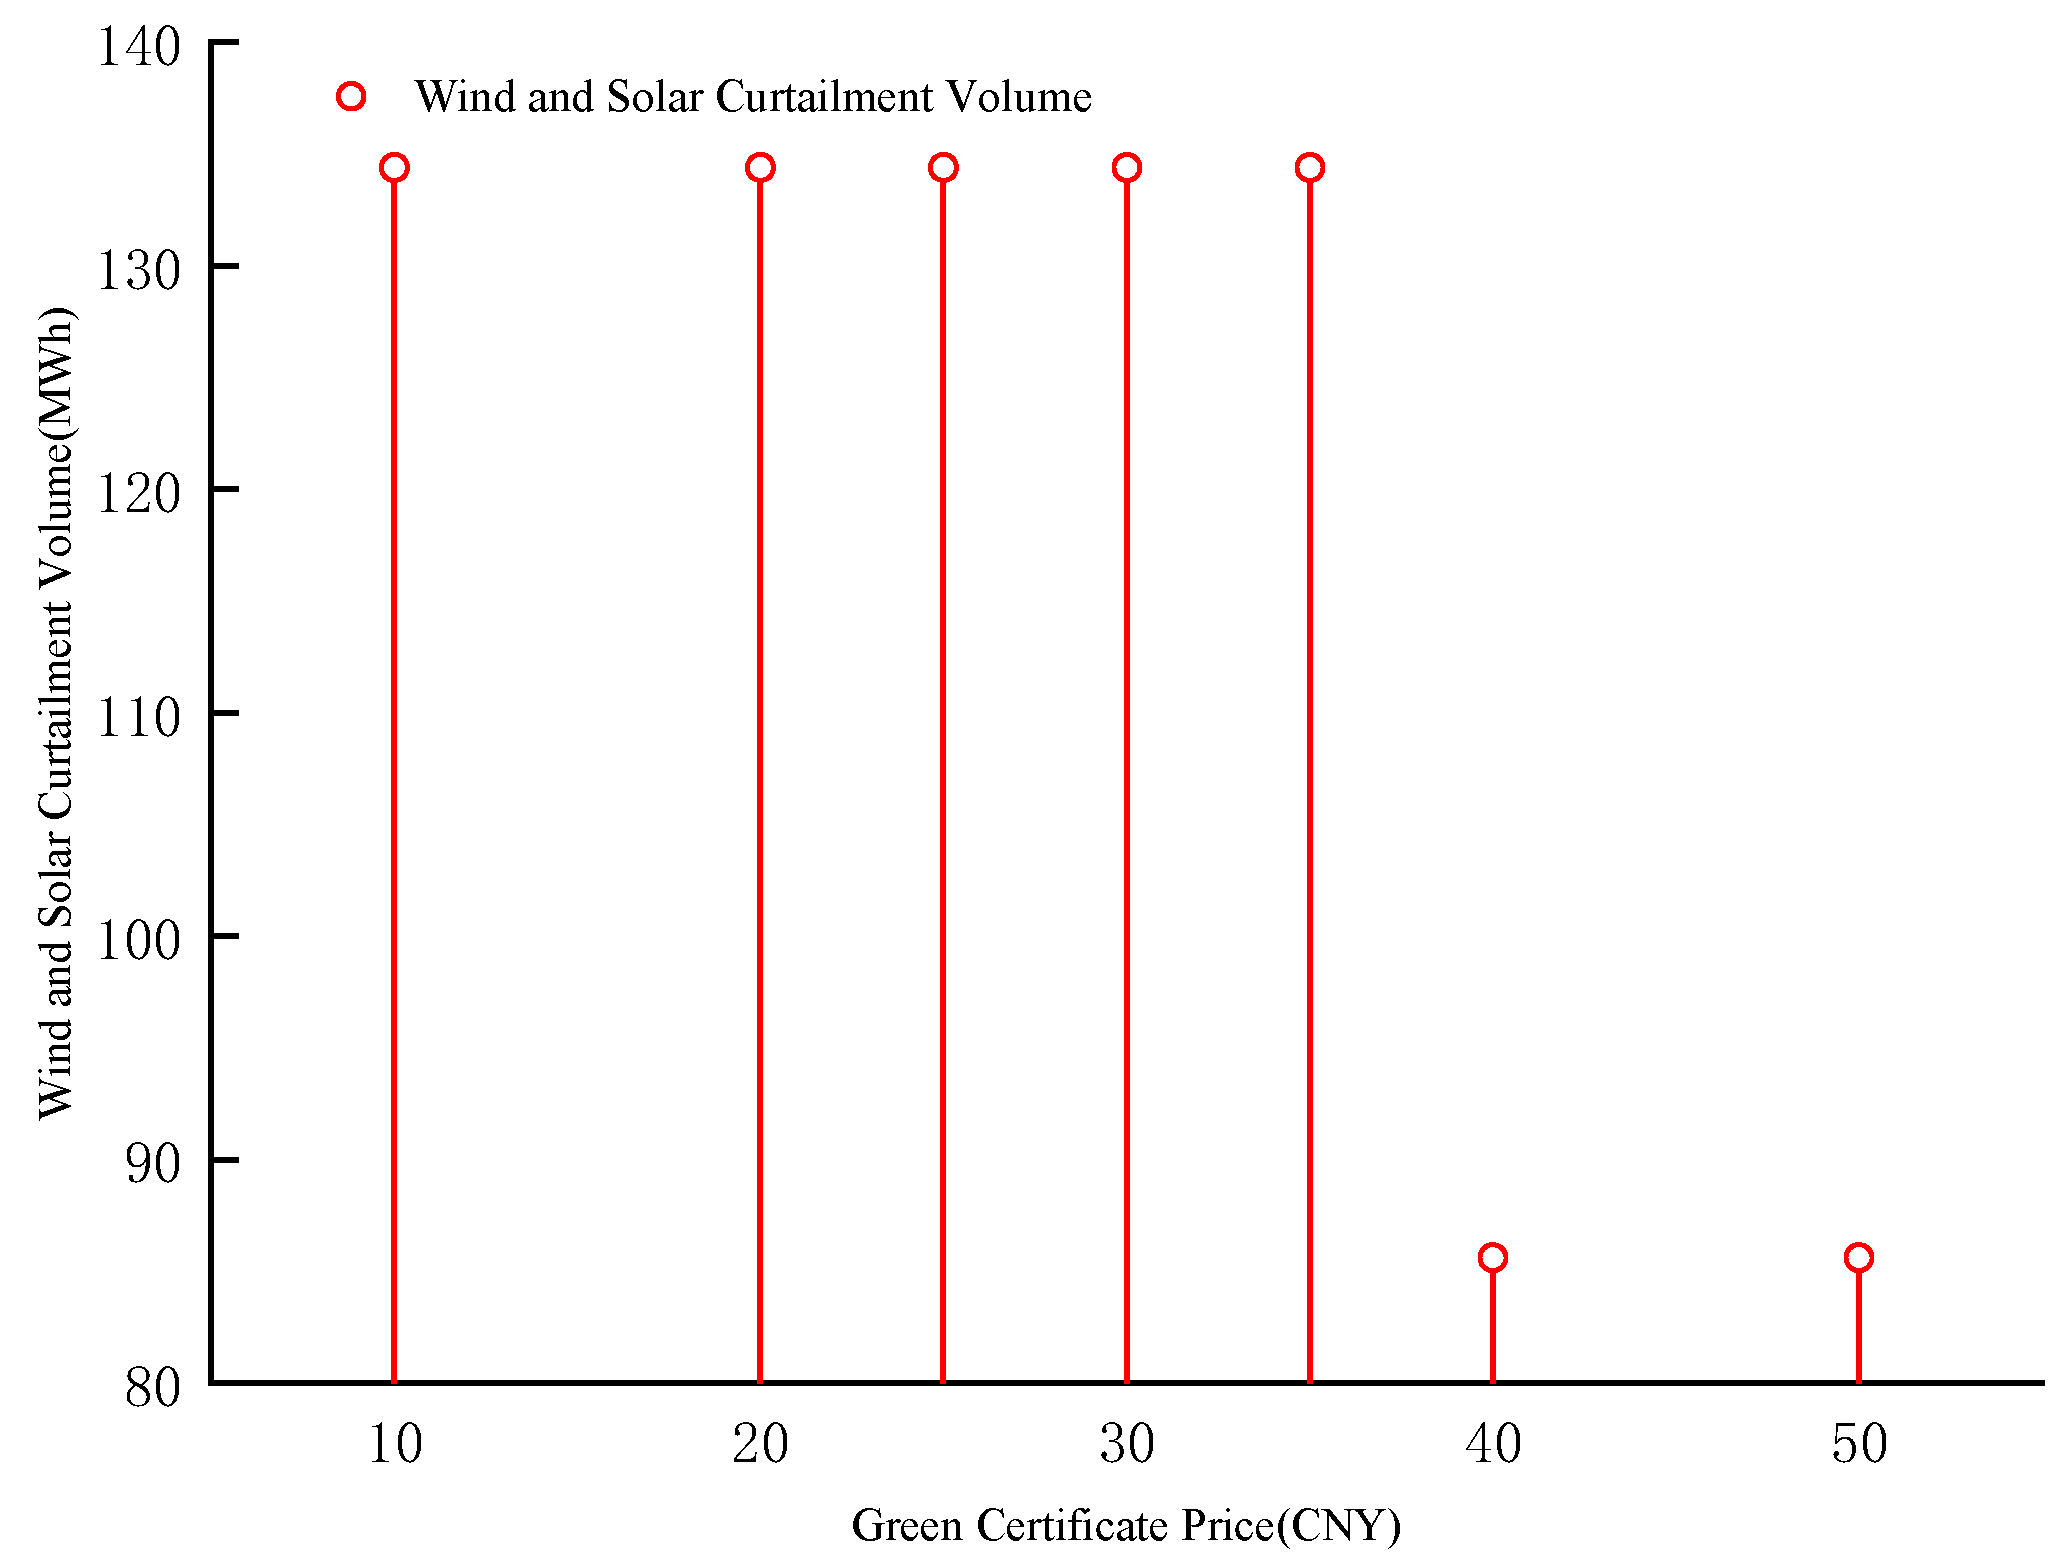
As shown in Figure 12, with the gradual increase in green certificate prices, the system’s total revenue exhibits sustained growth, and green certificate trading revenue significantly increases, becoming a key factor in enhancing the system’s economic performance. When the green certificate price reaches 40 yuan/MWh or higher, the penalty costs for curtailed wind and solar power decrease markedly, reflecting the positive role of the green certificate market mechanism in promoting renewable energy integration. Although system operating costs and carbon penalty costs for gas-fired power generation rise under high green certificate prices, the overall incremental revenue far exceeds the cost increase. The amount of wind and solar curtailment under different green certificate price for gas–wind–solar hybrid generation is shown in Figure 13.
As shown in Figure 13, curtailed generation remained constant at 134.39 MWh when green certificate prices ranged between 10 and 35 CNY/MWh. However, when prices rose to 40 CNY/MWh or higher, curtailed generation decreased significantly to 85.61 MWh. The analysis indicates that the impact of green certificate prices on curtailed generation exhibits a pronounced “threshold effect.” Only when prices rise above a certain level do policy incentives translate into tangible improvements in renewable energy absorption capacity. This finding holds significant reference value for designing green certificate market pricing mechanisms.
(5)
Carbon Dioxide Price on System Economic Indicators
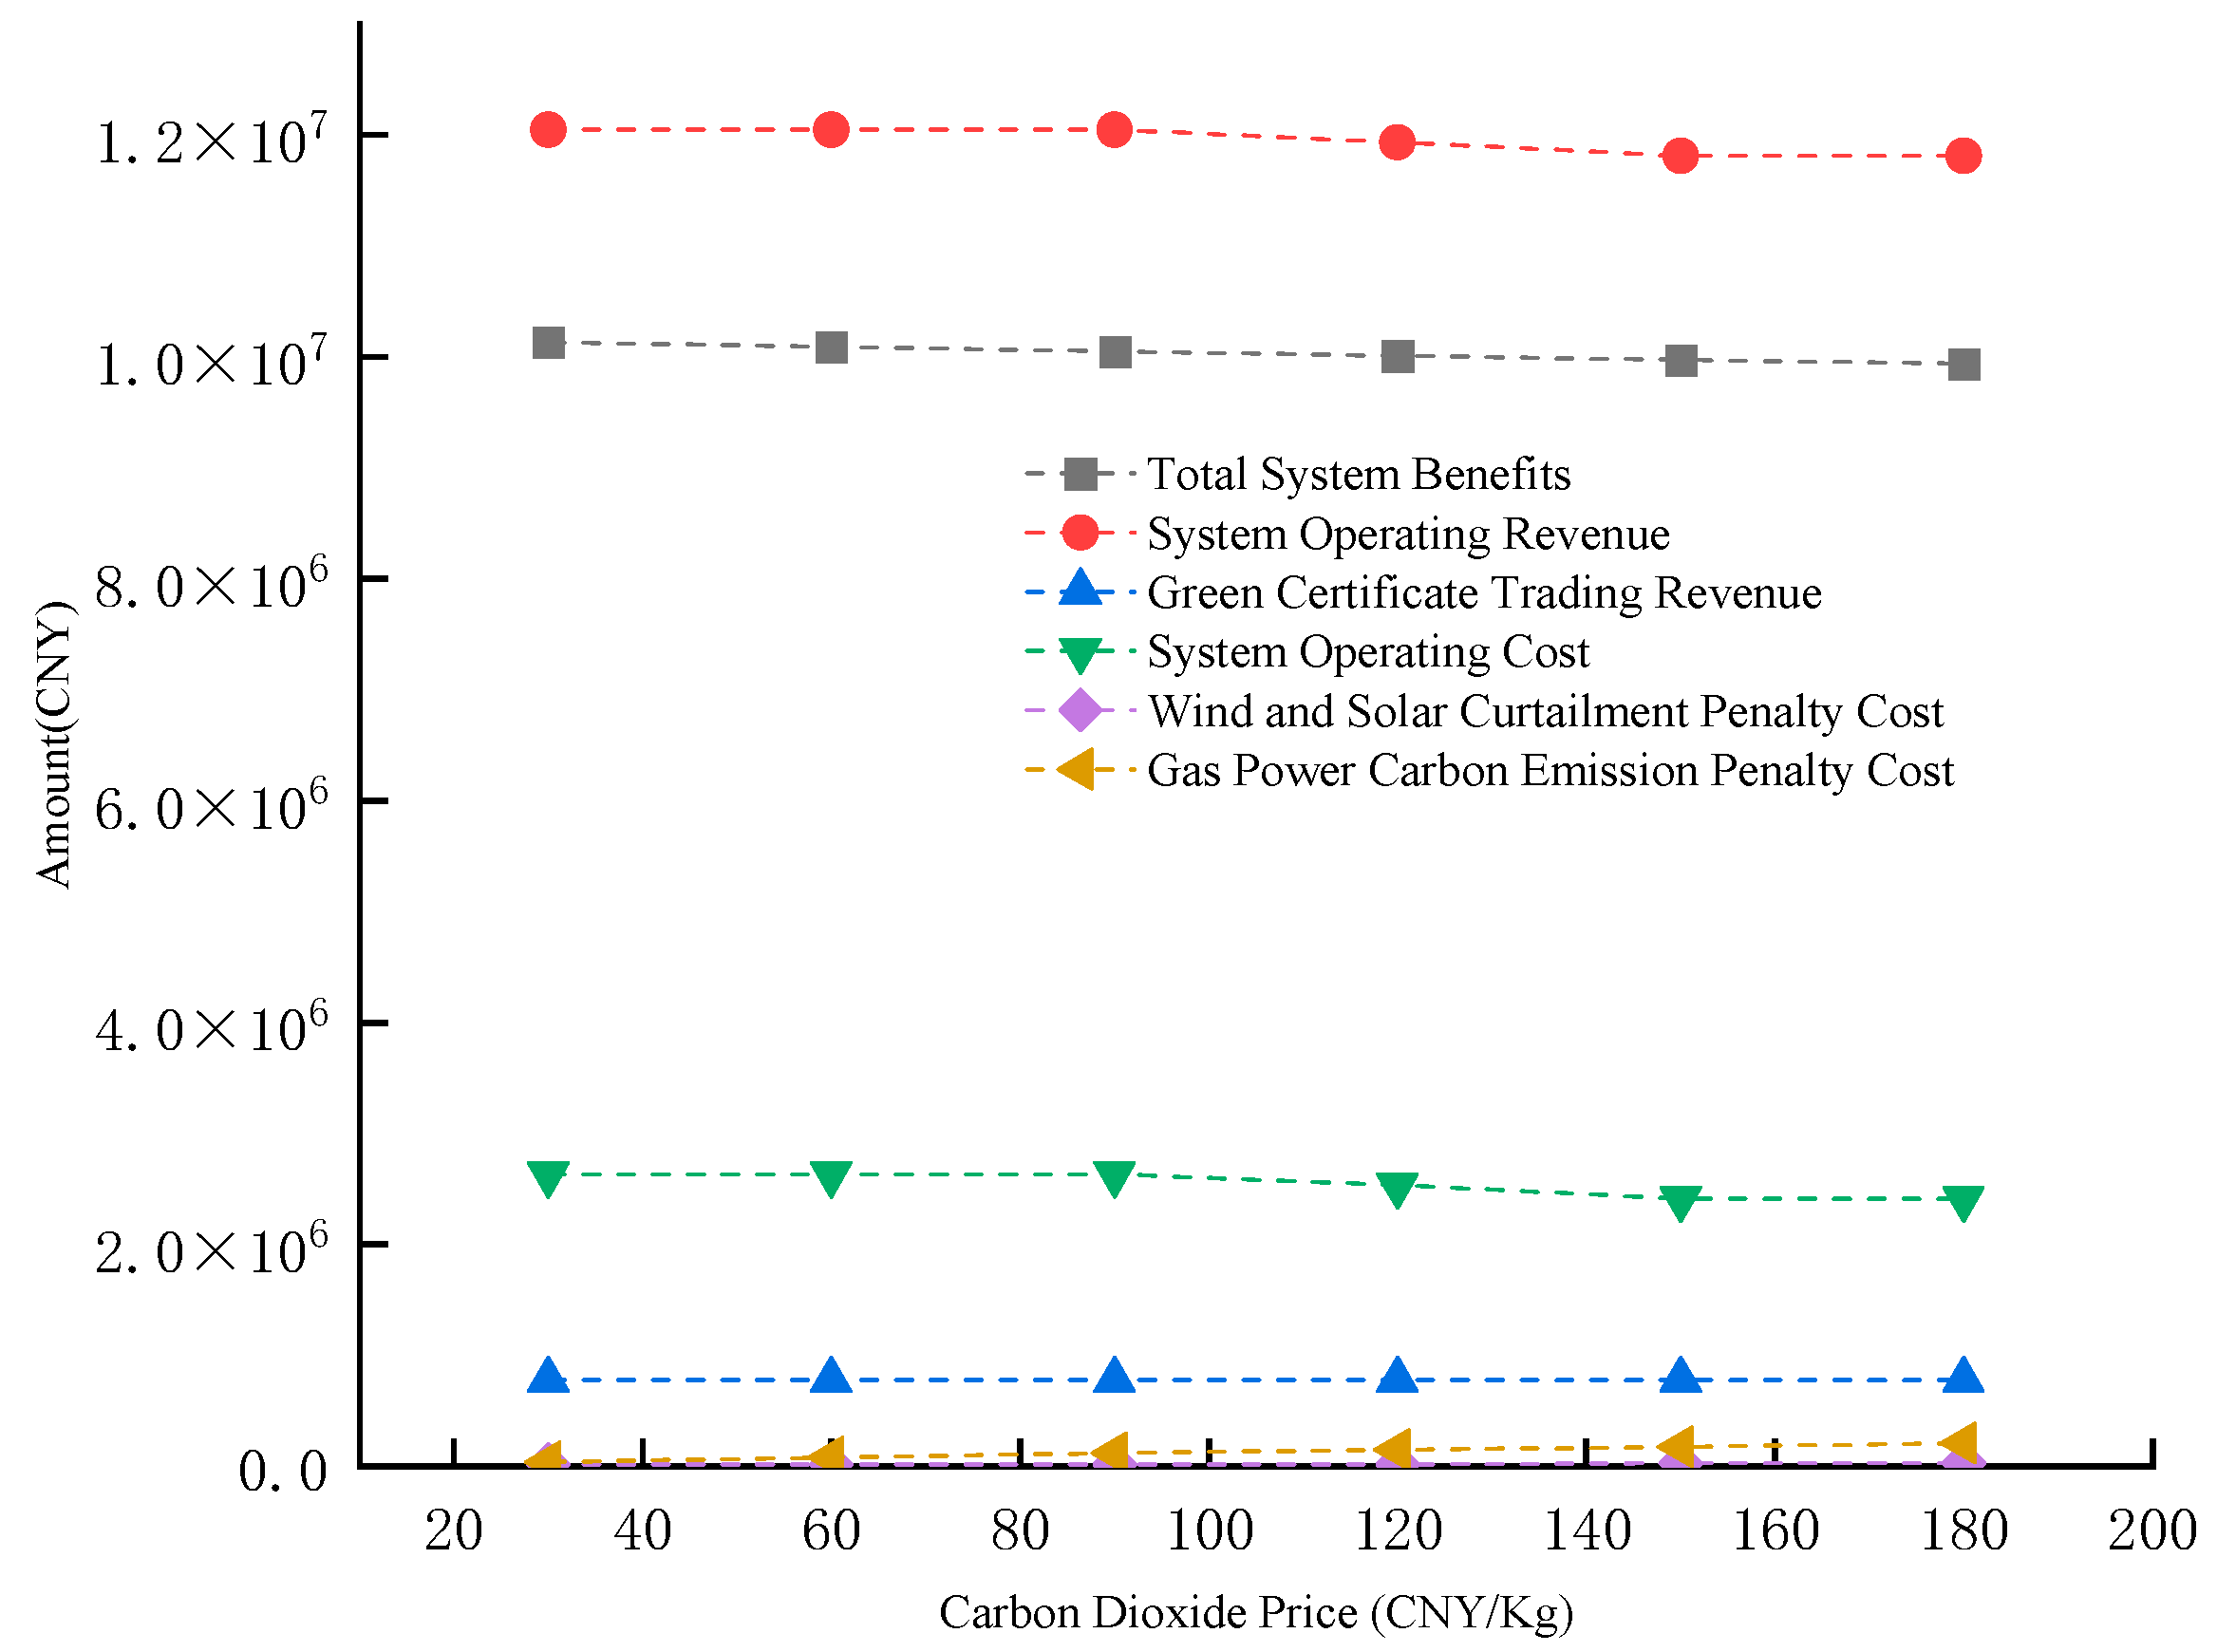
The impact of carbon dioxide price on the economic performance of the gas–wind–solar hybrid generation system is analyzed in Figure 14.
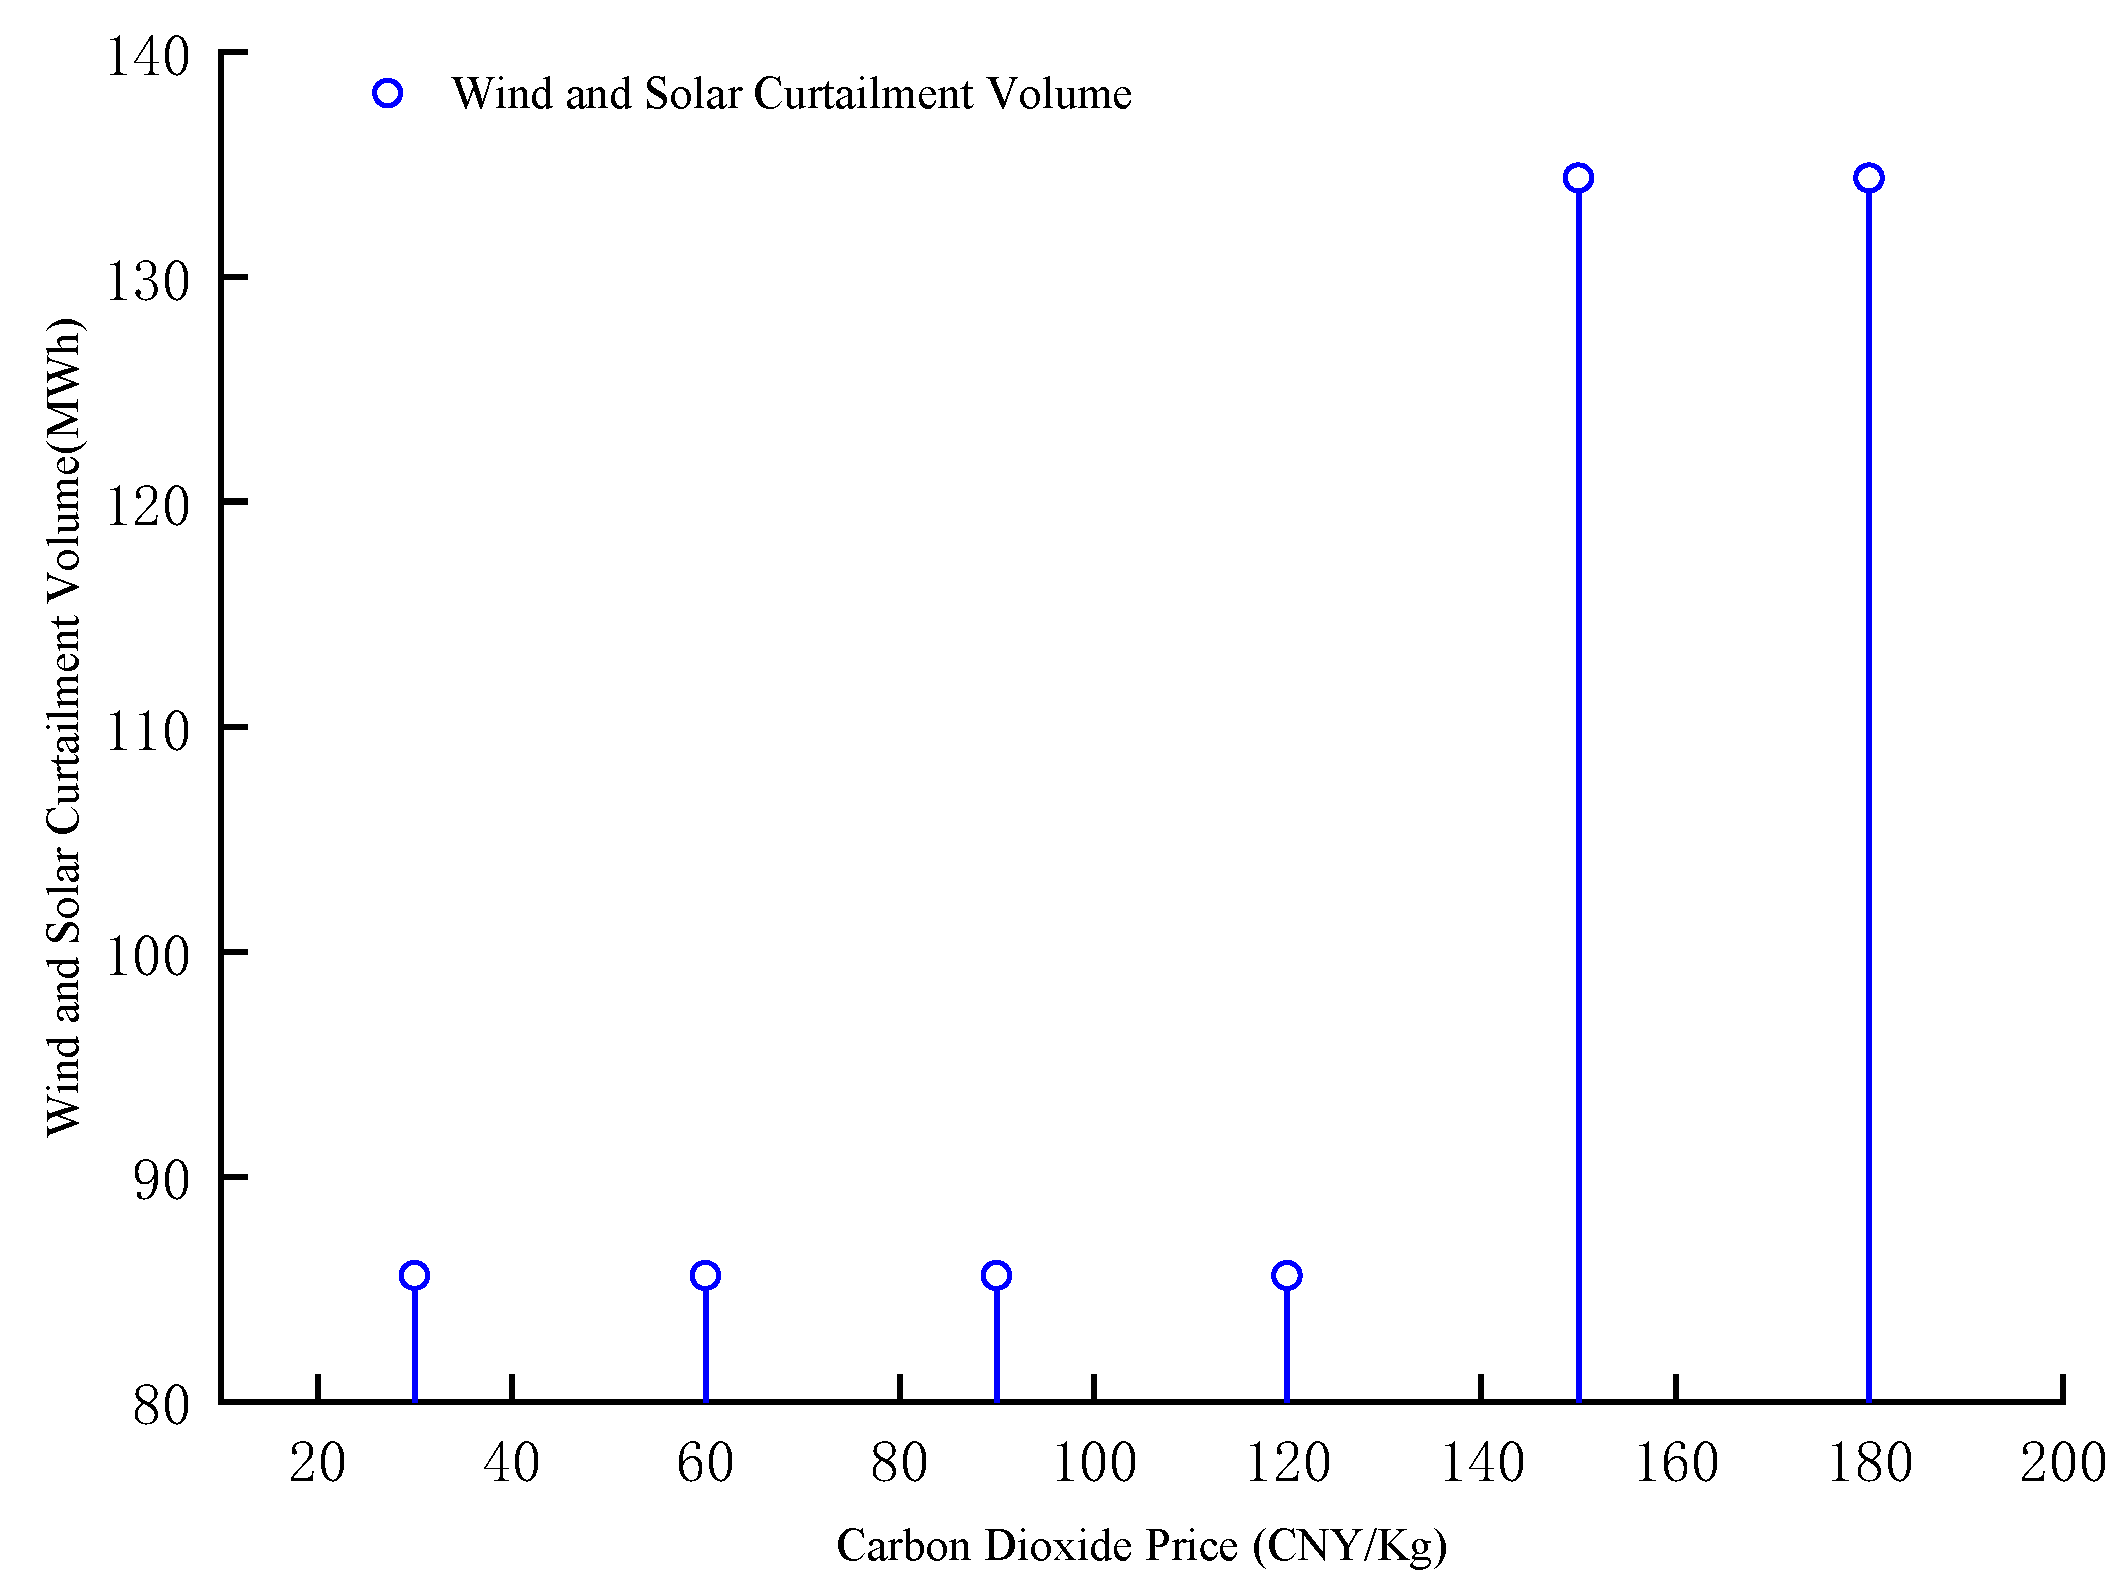
As shown in Figure 14, as the carbon dioxide price increases from 30 yuan/kg to 180 yuan/kg, the total system revenue decreases from 10.13 million yuan to 9.94 million yuan, demonstrating the adverse impact of high carbon prices on system economics. Simultaneously, the penalty costs for carbon emissions from gas-fired power generation increase significantly with rising carbon prices, promoting optimization of the power generation mix and driving the system toward low-carbon development. However, excessively high carbon prices may increase pressure on integrating renewable energy, leading to higher penalty costs for curtailed wind and solar power. The amount of wind and solar curtailment under different carbon dioxide prices for gas–wind–solar hybrid generation is shown in Figure 15.
As shown in Figure 15, as the carbon price increases from 30 yuan/kg to 120 yuan/kg, curtailed solar generation remains stable at 85.61 MWh, indicating that moderate carbon pricing facilitates renewable energy integration. However, when the carbon price rises further to 150 yuan/kg and above, curtailed generation surges to 134.39 MWh, significantly suppressing renewable energy integration. Analysis suggests that excessively high carbon prices exacerbate the system’s lack of scheduling flexibility, thereby limiting the capacity to integrate renewable energy.
(6)
Carbon Dioxide Price on System Economic Indicators
Based on the output data for wind and solar power generation under different scenarios depicted in Figure 2 and Figure 3, the impact of these outputs on the economic indicators of the gas–wind–solar hybrid power generation system is analyzed. The results are presented in Table 6.
Table 6 compares system operation outcomes under different wind and solar power generation scenarios: In wind power generation scenarios, Scenario 2 exhibits relatively balanced wind power output, achieving the highest total system revenue and operational income while incurring relatively low wind curtailment penalties and solar curtailment volumes. This indicates the system effectively integrates wind power with high operational stability. In Scenarios 1 and 4, although wind power output was high during certain periods, total system revenue decreased, while wind and solar curtailment penalty costs and curtailed solar generation increased significantly. This indicates that when wind power output is unstable, the system faces greater integration pressure, severe wind curtailment occurs, and overall system revenue deteriorates. In the PV generation scenario, output is primarily concentrated during daytime hours, with relatively smooth overall fluctuations. Differences in total system revenue and operational revenue across scenarios are minor, with curtailed PV generation and penalty costs remaining low. This indicates that as PV generation increases, the system maintains good integration capacity and operational stability.
Overall, the impact of wind power’s instability on the system is significantly greater than that of PV, particularly during periods of high output fluctuation, which more readily causes system instability. In contrast, increased PV generation has a milder effect on the system, demonstrating greater stability.

5. Conclusions, Policy Implications and Limitations

5.1. Conclusions

This paper investigates the economic optimization of a gas–wind–solar hybrid power generation system and proposes an innovative economic optimization model that incorporates both environmental value and power fluctuation constraints. Through case studies, the output, cost, and benefits of each unit within the hybrid system are analyzed, along with the effects of gas prices and grid-connected electricity prices et al. on the costs, benefits, and curtailment of wind and solar energy. The results demonstrate that the gas–wind–solar hybrid system significantly enhances power export stability and reduces renewable energy curtailment. In typical scenarios, it achieves a total economic benefit of 9.97 million yuan, with operating costs of 2.41 million yuan (about 20% of income). Penalty costs for curtailment and carbon emissions are low, totaling just 31,000 yuan and 176,000 yuan, respectively. The system’s economic benefits are highly sensitive to gas and electricity prices: as gas prices rise from 0.66 to 3.28 CNY/m3, economic benefit drops and curtailment rises sharply; increasing grid electricity prices from 0.38 to 0.50 CNY/kWh boosts economic benefit and reduces curtailment. Higher green certificate prices improve system revenue (up to 779,500 yuan), and carbon prices have a threshold effect—moderate prices aid renewable integration, but excessive prices reduce total benefit. Wind power output instability impacts system economics more than PV; stable wind scenarios yield the highest benefit (up to 12.65 million yuan), while PV output benefits remain steady around 9.7–9.9 million yuan. Overall, the hybrid system effectively balances economic efficiency, reliability, and environmental performance.

5.2. Policy Implications and Limitations

The results of this study demonstrate that gas–wind–solar hybrid energy systems possess significant potential to facilitate the achievement of China’s dual carbon goals. This is particularly evident in western provinces such as Sichuan, Gansu, and Qinghai, which are endowed with abundant natural gas reserves as well as high-quality wind and solar resources. The integrated development of multiple energy sources not only enhances the efficient consumption of renewable energy and the stability and security of power grid operations, but also enables the reliable transmission of renewable energy to eastern regions of China, thereby optimizing the regional energy structure.
To further capitalize on the advantages of gas–wind–solar hybrid systems, it is recommended that relevant authorities strengthen policy support through the establishment of targeted subsidies, the implementation of demonstration projects, and increased investment in technological research and development. Priority should be given to large-scale deployment in provinces with abundant renewable resources and significant grid regulation pressure. In addition, improvements to carbon trading market mechanisms are needed to promote deeper integration of gas–wind–solar systems and emerging technologies such as energy storage, thereby enhancing system flexibility and carbon emission reduction. The formulation of technical standards and incentive policies for multi-energy complementarity and flexible dispatch can help mitigate grid connection and market risks, and foster sustainable industry development.
Nevertheless, the widespread adoption of gas–wind–solar hybrid systems still faces several challenges. In some regions, limited grid transmission capacity restricts large-scale integration of renewable energy; inadequate natural gas infrastructure impedes the stable operation of such systems; and the existing energy regulatory and market frameworks are not yet fully compatible with the requirements of multi-energy hybrid operation, lacking effective market incentives and management mechanisms. Moreover, further optimization is needed in terms of system integration and economic assessment. Future research should incorporate real-world operational data to explore dynamic optimization scheduling, economic and system security constraints, and the synergy between hybrid energy systems and emerging power market mechanisms, thereby providing more comprehensive and scientific decision support for the deployment and application of gas–wind–solar hybrid systems.

Funding

This research was funded by Major Project of the National Social Science Fund in 2022: Research on the High—quality Development Path of the Natural Gas Industry Driven by the Energy Revolution (22&ZD105).

Data Availability Statement

The data and materials presented in the study are included in the article.

Acknowledgments

We would like to thank the reviewers and the editor-in-charge for their valuable time spent on this article. We are also grateful to all the foundations that support us.

Conflicts of Interest

Author Fuping Wang was employed by the company The Natural Gas Economics Research Institute at PetroChina Southwest Oil & Gasfield Company. This research was conducted in the absence of any commercial or financial relationships that could be construed as a potential conflict of interest.

Appendix A

The optimization model for the economic benefit of gas–wind–solar hybrid power generation is as follows:
max F = t = 1 T [ O p ( P w , t + P p v , t + i = 1 N P g , i , t ) + ρ w x w P w , t + ρ p v x p v P p v , t K w P w , t K p v P p v , t i = 1 N G P g , i , t L H V η g , i i = 1 N U g , i , t ( 1 U g , i , t 1 ) S i = 1 N C C O 2 P g , i , t C p , w P w , t a b C p , p v P p v , t a b ] Δ t s . t . i N P g , i , t ( 1 φ g , i ) + P w , t ( 1 φ w ) + P p v , t ( 1 φ p v ) P s , max | P s , t P s , t 1 | Δ P s i N R g , i , t r w P w f o r e + r p v P p v f o r e R g , i , t = min ( P g , i , t max P g , i , t , δ i ) P g , i , t max = min ( P g , i max , P g , i , t 1 + δ i ) P w , t f o r e = α w , t P w P p v f o r e = α p v , t P p v U g , i , t P ¯ g , i P g , i , t U g , i , t P ¯ g , i P g , i , t P g , i , t 1 + U g , i , t 1 ( P ¯ g , i δ g , i ) + U g , i , t ( P ¯ g , i P ¯ g , i ) P ¯ g , i P g , i , t 1 P g , i , t + U g , i , t ( P ¯ g , i δ g , i ) + U g , i , t 1 ( P ¯ g , i P ¯ g , i ) P ¯ g , i ( T g , i , t 1 o n T g , i o n ) ( U g , i , t 1 U g , i , t ) 0 ( T g , i , t 1 o f f T g , i o f f ) ( U g , i , t U g , i , t 1 ) 0 P w , t f o r e = P w , t + P w , t a b P w , t 0 P w , t a b 0 P p v , t f o r e = P p v , t + P p v , t a b P p v , t 0 P p v , t a b 0 i = 1 , 2 , , N t = 1 , 2 , , T

Appendix B

The code is as follows: Define a function.
  function f = Efficiency(x)
    T = length(x);
    a = 0.361;
    k = −0.000842;
    for t = 1:T
      f(t) = a*exp(k*x(t));
    end
  end
Modeling and Solving.
clc
clear
 
close all
T=24;
NM=4;
E=ones(1,T);
E=1*10^3.*[0.43 0.43 0.43 0.43 0.43 0.43 0.43 0.79 0.79 0.79 0.79 1.16  1.16 1.16 0.79 0.79 0.79 0.79 1.16 1.16 1.16 1.16
0.41 0.41];
PL=ones(1,T);
PL=2.65.*[302.4509804 299.0196078 298.4509804 291.0294118 292.745098 294.754902 295.0490196 320.7843137
413.9705882 424.2647059 420.8333333 462.5 462.5 377.9411765 439.7058824 434.5588235 410.5392157 459.0686275
450.4901961  435.0490196 424.754902 416.1764706 414.4607843 416.1764706];
row_w=30
row_pv=30
TS=2;
TO=2;
G_chushi=[0.66 0.73 0.81 0.90 1.00 1.12 1.24 1.38 1.53 1.68 1.85 2.04 2.24 2.46 2.71 2.98 3.28];
G=G_chushi(1,9);
LHV=9.082e-03;
eata=ones(NM,T);
Temp=[20 19 18 17 17 17 20 22 24 26 28 30 32 32 32 31 30 29 28 27 26 24 22 20];
nj_n1=Efficiency(Temp);
eata=nj_n1.*ones(NM,T);
Pg_m_min=ones(1,NM);
Pg_m_max=ones(1,NM);
Pg_m_max=[385,385,800,800];
Pg_m_min=0.3.*Pg_m_max;
deta_g=ones(1,NM);
deta_g=[350,350,450,450];
Kw=0.03*10^3;
Kpv=0.04*10^3;
S=3.16e+04;
Cp_w=230;
Cp_pv=230;
Pw_xishu=[0.41 0.59 0.51 0.64 0.69 0.57 0.49 0.41 0.22 0.15 0.09 0.22 0.23 0.16 0.28 0.35 0.29 0.25 0.18 0.16 0.18 0.29 0.36
0.46
0.45 0.43 0.50 0.50 0.49 0.55 0.60 0.61 0.55 0.43 0.44 0.40 0.36 0.38 0.39 0.38 0.43 0.38 0.45 0.57 0.52 0.39 0.39 0.48
0.31 0.33 0.29 0.35 0.34 0.34 0.32 0.32 0.22 0.19 0.22 0.18 0.20 0.24 0.20 0.24 0.20 0.16 0.19 0.24 0.23 0.16 0.14 0.11
0.30 0.12 0.10 0.16 0.11 0.11 0.17 0.15 0.15 0.17 0.18 0.17 0.18 0.20 0.19 0.22 0.26 0.37 0.50 0.45 0.47 0.48 0.38 0.38];
Ppv_xishu=[0 0 0 0 0 0.025641026 0.025641026 0.096153846 0.198717949 0.346153846 0.602564103 0.621794872
0.538461538 0.602564103  0.570512821 0.512820513 0.384615385 0.333333333 0.192307692 0.028717949 0 0 0 0
0 0 0 0 0 0.032051282 0.032051282 0.064102564 0.288461538 0.294871795 0.634615385 0.662820513 0.634615385
0.673076923 0.564102564 0.483333333 0.388461538 0.282051282 0.166666667 0.028846154 0 0 0 0
0 0 0 0 0 0.032051282 0.025641026 0.070512821 0.211538462 0.528205128 0.583333333 0.616666667 0.66025641
0.532051282 0.548717949 0.492307692 0.337179487 0.265384615 0.137179487 0.023589744 0 0 0 0
0 0 0 0 0 0.019230769 0.012820513 0.064102564 0.224358974 0.461538462 0.480769231 0.647435897 0.621794872 0.65
0.429487179 0.435897436 0.282051282 0.224358974 0.153846154 0.108974359 0 0 0 0];
PW=2240;
Pw_fore=Pw_xishu(1,:).*PW;
PPV=1490;
Ppv_fore=Ppv_xishu(4,:).*PPV;
rw=0.15;rpv=0.05;
fai_g=0.02;
fai_w=0.02;
fai_pv=0.02;
Pd_max=2500;
deta_Pd=150;
K_CO2=150*10^(-3);
p_CO2=0.339;
C_CO2=K_CO2.*p_CO2.*10^(3);
 
Pw=sdpvar(1,T);
Ppv=sdpvar(1,T);
Pg=sdpvar(NM,T);
Pw_a=sdpvar(1,T);
Ppv_a=sdpvar(1,T);
Ug=binvar(NM,T);
Ps=sdpvar(1,T);
Rg=sdpvar(NM,T);
Pg_sum=sdpvar(1,1);
P_price=1*10^3.*[0.3515 0.3514 0.3634 0.3497 0.3205 0.3729 0.2772 0.3685 0.3717 0.3723 0.3035 0.4048 0.378 0.4153 0.3693 0.3737 0.3981 0.4471 0.3551 0.4012 0.3796 0.3993 0.3346 0.2978 0.3247 0.2595 0.4505 0.414 0.3358 0.3363 0.4198];
P_price=sort(P_price);
P_price=1*10^3.*[0.259500000000000,0.277200000000000,0.297800000000000,0.303500000000000,0.320500000000000,0.32
4700000000000,0.334600000000000,0.335800000000000,0.336300000000000,0.349700000000000,0.351400000000000,0.3515
00000000000,0.355100000000000,0.363400000000000,0.368500000000000,0.369300000000000,0.371700000000000,0.372300
000000000,0.372900000000000,0.373700000000000,0.378000000000000,0.379600000000000,0.398100000000000,0.39930000
0000000,0.401200000000000,0.404800000000000,0.414000000000000,0.415300000000000,0.419800000000000,0.4471000000
00000,0.450500000000000];
P_price=1*10^3.*[0.3796,0.3981,0.3993,0.4012,0.4048,0.4140,0.4198 0.65 0.7 0.8];
Cw=P_price(1,4);
Cpv=Cw;
Cg=Cw;
 
C=[];
for t=1:T
   C=[C,Pw(1,t).*(1-fai_w)+Ppv(1,t).*(1-fai_pv)+sum(Pg(:,t).*(1-fai_g))==Ps(1,t),
     Pw_fore(1,t)==Pw(1,t)+Pw_a(1,t),
     Ppv_fore(1,t)==Ppv(1,t)+Ppv_a(1,t),
     Pw(1,t)>=0,
     Ppv(1,t)>=0,
     Pw_a(1,t)>=0,
     Ppv_a(1,t)>=0,
     ];
   for m=1:NM
     C=[C, Ug(m,t).*Pg_m_min(1,m)<=Pg(m,t)<=Ug(m,t).*Pg_m_max(1,m),
       ];
   end
end
C=[C,Ps<=Pd_max,
  Pg_sum==sum(sum(Pg)),
];
for t=2:T
  C=[C,-deta_Pd<=Ps(1,t)-Ps(1,t-1)<=deta_Pd,];
end
for t=2:T
  for m=1:NM
    C=[C,Pg(m,t)-Pg(m,t-1)+Ug(m,t-1).*(Pg_m_min(1,m)-deta_g(1,m))+Ug(m,t).*(Pg_m_max(1,m)-Pg_m_min(1,m))<=Pg_m_max(1,m),
      Pg(m,t-1)-Pg(m,t)+Ug(m,t).*(Pg_m_min(1,m)-deta_g(1,m))+Ug(m,t-1).*(Pg_m_max(1,m)-Pg_m_min(1,m))<=Pg_m_max(1,m),
    ];
 
  k=t;
  T_new1=min(t+TS-1,T);
  T_new2=min(t+TO-1,T);
  C=[C,sum(1-Ug(m,k:T_new1))>=TS.*(Ug(m,t-1)-Ug(m,t)),
    sum(Ug(m,k:T_new2))>=TO.*(Ug(m,t)-Ug(m,t-1)),
    ];
  end
 
end
 
 
Y=binvar(NM,T);
sum_qd=sdpvar(1,m);
for m=1:NM
  sum_qd(1,m)=0;
  for t=2:T
    sum_qd(1,m)=sum_qd(1,m)+Ug(m,t).*S-Y(m,t-1).*S;
    C=[C,Y(m,t)<=Ug(m,t),
        Y(m,t-1)<=Ug(m,t-1),
        Ug(m,t)>=Ug(m,t-1)-(1-Ug(m,t)),
      ];
  end
end
 
 
Pg_max_t=sdpvar(NM,T);
for t=1:T
   C=[C,sum(Rg(:,t))>=rw.*Pw_fore+rpv.*Ppv_fore,
     ];
  for m=1:NM
    C=[C, Rg(m,t)<=Pg_max_t(m,t)-Pg(m,t),
      0<=Rg(m,t)<=deta_g(1,m),
      Pg_max_t(m,t)<=Pg_m_max(1,m),
 
    ];
  end
end
 
 
chengben=sdpvar(NM,T);
sum_chengben=sdpvar(1,T);
for t=1:T
  for m=1:NM
  chengben(m,t)=sum(G.*Pg(m,t)/(LHV.*eata(1,t)));
  end
  sum_chengben(1,t)=sum(chengben(:,t));
end
f1=sum(Cw.*Pw)+sum(Cpv.*Ppv)+sum(Cg.*sum(Pg));
f2=sum(row_w.*Pw)+sum(row_pv.*Ppv);
f3=sum(Kw.*Pw)+sum(Kpv.*Ppv)+sum(sum_chengben)+sum(sum_qd);
Pg_chengben=sum(sum_chengben)+sum(sum_qd);
Pg_shouru=sum(Cg.*sum(Pg));
f4=sum(Cp_w.*Pw_a)+sum(Cp_pv.*Ppv_a);
f5=C_CO2.*sum(sum(Pg));
F=f1+f2-f3-f4-f5;
F1=-F;
ops=sdpsettings('verbose',1,'debug',1,'solver','cplex','savesolveroutput',1,'savesolverinput',1);
ops.cplex.mip.tolerances.mipgap=1e-6;
ops.cplex.exportmodel='gas_wind_pv.lp';
F1_result=optimize(C,F1,ops);
F1=value(F1);
if F1_result.problem == 0
  disp([' Solution found ',' F=', num2str(-F1)]);
else
  error(' Solving error ');
end

References

  1. Huang, Z.; Huang, Y.; Zhang, S. The possibility and improvement directions of achieving the paris agreement goals from the perspective of climate policy. Sustainability 2024, 16, 4212. [Google Scholar] [CrossRef] [Scilit]
  2. Liu, J.; Zhang, P.; Wang, X. Exploring the Mechanisms and Pathways Through Which the Digital Transformation of Manufacturing Enterprises Enhances Green and Low-Carbon Performance Under the “Dual Carbon” Goals. Sustainability 2025, 17, 1162. [Google Scholar] [CrossRef] [Scilit]
  3. Duan, W.; Zhao, W.; Xu, D. Study on the pathway of energy transition in Inner Mongolia under the “dual carbon” goal. Heliyon 2024, 10, e39764. [Google Scholar] [CrossRef] [Scilit]
  4. Yang, B.; Li, Y.; Yao, W.; Jiang, L.; Zhang, C.; Duan, C.; Ren, Y. Optimization and control of new power systems under the dual carbon goals: Key Issues, advanced techniques, and perspectives. Energies 2023, 16, 3904. [Google Scholar] [CrossRef] [Scilit]
  5. Naseem, K.; Khalid, F.; Qin, F.; Zhu, J.; Suo, G.; Shah, B.A. The catalytic role of cubic iron oxide coated graphene oxide for hydrogen generation via hydrolysis of Magnesium. Renew. Energy 2025, 256, 124515. [Google Scholar] [CrossRef] [Scilit]
  6. Jiang, Q.; Yin, Z. The optimal path for China to achieve the “Dual Carbon” target from the perspective of energy structure optimization. Sustainability 2023, 15, 10305. [Google Scholar] [CrossRef] [Scilit]
  7. Yang, B.; Duan, J.; Liu, Z.; Jiang, L. Exploring Sustainable Development of New Power Systems under Dual Carbon Goals: Control, Optimization, and Forecasting. Energies 2024, 17, 3909. [Google Scholar] [CrossRef] [Scilit]
  8. Milligan, M.; Frew, B.; Kirby, B.; Schuerger, M.; Clark, K.; Lew, D.; Denholm, P.; Zavadil, B.; O’Malley, M.; Tsuchida, B. Alternatives no more: Wind and solar power are mainstays of a clean, reliable, affordable grid. IEEE Power Energy Mag. 2015, 13, 78–87. [Google Scholar] [CrossRef] [Scilit]
  9. Adefarati, T.; Sharma, G.; Bokoro, P.N.; Kumar, R. Advancing renewable-dominant power systems through internet of things and artificial intelligence: A comprehensive review. Energies 2025, 18, 5243. [Google Scholar] [CrossRef] [Scilit]
  10. Mo, D.; Li, Q.; Lu, Y. Wind solar thermal storage collaborative low-carbon economic dispatch that adapts to wind solar volatility and dynamic peak shaving capacity of energy storage. Energy Storage Sci. Technol. 2025, 14, 1701. [Google Scholar]
  11. Peng, N.; Miao, J.; Hu, S.; Zhao, L.; Wang, Y.; Meng, F.; Yi, Y.; Zheng, Z. Quantitative Evaluation Of The Complementarity And Capacity Ratio Of Large-scale Wind Power And Photovoltaic. J. Appl. Sci. Eng. 2025, 28, 1243–1252. [Google Scholar]
  12. Alizadeh, M.I.; Moghaddam, M.P.; Amjady, N.; Siano, P.; Sheikh-El-Eslami, M.K. Flexibility in future power systems with high renewable penetration: A review. Renew. Sustain. Energy Rev. 2016, 57, 1186–1193. [Google Scholar] [CrossRef] [Scilit]
  13. Impram, S.; Nese, S.V.; Oral, B. Challenges of renewable energy penetration on power system flexibility: A survey. Energy Strategy Rev. 2020, 31, 100539. [Google Scholar] [CrossRef] [Scilit]
  14. Liu, L.; Wang, Z.; Wang, Y.; Wang, J.; Chang, R.; He, G.; Tang, W.; Gao, Z.; Li, J.; Liu, C. Optimizing wind/solar combinations at finer scales to mitigate renewable energy variability in China. Renew. Sustain. Energy Rev. 2020, 132, 110151. [Google Scholar] [CrossRef] [Scilit]
  15. Jurasz, J.; Guezgouz, M.; Campana, P.E.; Kaźmierczak, B.; Kuriqi, A.; Bloomfield, H.; Hingray, B.; Canales, F.A.; Hunt, J.D.; Sterl, S. Complementarity of wind and solar power in North Africa: Potential for alleviating energy droughts and impacts of the North Atlantic Oscillation. Renew. Sustain. Energy Rev. 2024, 191, 114181. [Google Scholar] [CrossRef] [Scilit]
  16. Zhang, H.; Lu, Z.; Hu, W.; Wang, Y.; Dong, L.; Zhang, J. Coordinated optimal operation of hydro–wind–solar integrated systems. Appl. Energy 2019, 242, 883–896. [Google Scholar] [CrossRef] [Scilit]
  17. Zhang, J.; Wang, H.; Fan, C.; Hu, J.; Zhang, X. Hydro–Wind–PV–Integrated Operation Optimization and Ultra-Short-Term HESS Configuration. Electronics 2024, 13, 4778. [Google Scholar] [CrossRef] [Scilit]
  18. Li, X.; Wang, K.; Xu, M.; Fu, M.; Miao, S. Environmental and economic dispatching strategy for power system with the complementary combination of wind-solar-hydro-thermal-storage multiple sources. Front. Energy Res. 2024, 12, 1338657. [Google Scholar] [CrossRef] [Scilit]
  19. Chen, Y.; Zhang, J.; Wang, F.; Zhang, J.; Wu, W.; Li, H. Study on Carbon Emission Reduction Strategy of CCUS Technology in Natural Gas Supply Chain Considering Government Subsidies. Processes 2025, 13, 550. [Google Scholar] [CrossRef] [Scilit]
  20. Varghese, S.; Dalvi, S.; Narula, A.; Webster, M. The impacts of distinct flexibility enhancements on the value and dynamics of natural gas power plant operations. IEEE Trans. Power Syst. 2021, 36, 5803–5813. [Google Scholar] [CrossRef] [Scilit]
  21. Nyangon, J.; Byrne, J. Estimating the impacts of natural gas power generation growth on solar electricity development: PJM’s evolving resource mix and ramping capability. Wiley Interdiscip. Rev. Energy Environ. 2023, 12, e454. [Google Scholar] [CrossRef] [Scilit]
  22. Mohammad, N.; Mohamad Ishak, W.W.; Mustapa, S.I.; Ayodele, B.V. Natural gas as a key alternative energy source in sustainable renewable energy transition: A mini review. Front. Energy Res. 2021, 9, 625023. [Google Scholar] [CrossRef] [Scilit]
  23. Akbar Akhgari, P.; Kamalan, H. Economical–environmental evaluation of natural gas and renewable energy systems. Int. J. Energy Res. 2013, 37, 1550–1561. [Google Scholar] [CrossRef] [Scilit]
  24. Alavijeh, H.S.; Kiyoumarsioskouei, A.; Asheri, M.; Naemi, S.; Alavije, H.S.; Tabrizi, H.B. Greenhouse gas emission measurement and economic analysis of Iran natural gas fired power plants. Energy Policy 2013, 60, 200–207. [Google Scholar] [CrossRef] [Scilit]
  25. Vandani, A.M.K.; Joda, F.; Boozarjomehry, R.B. Exergic, economic and environmental impacts of natural gas and diesel in operation of combined cycle power plants. Energy Convers. Manag. 2016, 109, 103–112. [Google Scholar] [CrossRef] [Scilit]
  26. Clark, S.; McGregor, C.; Van Niekerk, J. Using liquefied petroleum gas to reduce the operating cost of the Ankerlig peaking power plant in South Africa. J. Energy S. Afr. 2022, 33, 15–23. [Google Scholar] [CrossRef] [Scilit]
  27. Qingmin, M.; Zhonglin, Z.; Fangwei, P. Development Trends of Natural Gas Resources and Gas-Fired Power Generations in China. Environ. Prog. Sustain. Energy 2016, 35, 853–858. [Google Scholar] [CrossRef] [Scilit]
  28. Shabazbegian, V.; Ameli, H.; Ameli, M.T.; Strbac, G. Stochastic optimization model for coordinated operation of natural gas and electricity networks. Comput. Chem. Eng. 2020, 142, 107060. [Google Scholar] [CrossRef] [Scilit]
  29. Shabazbegian, V.; Ameli, H.; Ameli, M.T.; Strbac, G.; Qadrdan, M. Co-optimization of resilient gas and electricity networks; a novel possibilistic chance-constrained programming approach. Appl. Energy 2021, 284, 116284. [Google Scholar] [CrossRef] [Scilit]
  30. Stanley, A.P.; King, J.; Barker, A.; Guittet, D.; Hamilton, W.; Bay, C.; Fleming, P.; Sinner, M. Multi-timescale wind-based hybrid energy systems. J. Phys. Conf. Ser. 2022, 2265, 042062. [Google Scholar] [CrossRef] [Scilit]
  31. Mirzaei, M.A.; Nazari-Heris, M.; Mohammadi-Ivatloo, B.; Marzband, M.; Anvari-Moghaddam, A. Two-stage stochastic day-ahead market clearing in gas and power networks integrated with wind energy. J. Renew. Energy Environ. 2019, 5, 53–59. [Google Scholar]
  32. Miller, I.; Gençer, E.; O’Sullivan, F.M. A general model for estimating emissions from integrated power generation and energy storage. Case study: Integration of solar photovoltaic power and wind power with batteries. Processes 2018, 6, 267. [Google Scholar] [CrossRef] [Scilit]
  33. Sharifi, V.; Abdollahi, A.; Rashidinejad, M.; Heydarian-Forushani, E.; Alhelou, H.H. Integrated electricity and natural gas demand response in flexibility-based generation maintenance scheduling. IEEE Access 2022, 10, 76021–76030. [Google Scholar] [CrossRef] [Scilit]
  34. Sleiman, A.; Su, W. Combined K-means clustering with neural networks methods for PV short-term generation load forecasting in electric utilities. Energies 2024, 17, 1433. [Google Scholar] [CrossRef] [Scilit]
  35. Miraftabzadeh, S.M.; Colombo, C.G.; Longo, M.; Foiadelli, F. K-means and alternative clustering methods in modern power systems. IEEE Access 2023, 11, 119596–119633. [Google Scholar] [CrossRef] [Scilit]
  36. He, Z.; Liu, C.; Wang, Y.; Wang, X.; Man, Y. Optimal operation of wind-solar-thermal collaborative power system considering carbon trading and energy storage. Appl. Energy 2023, 352, 121993. [Google Scholar] [CrossRef] [Scilit]
Figure 1. The natural gas–wind–solar hybrid power generation mode.
Energies 19 00125 g001
Figure 2. Typical daily wind power output.
Energies 19 00125 g002
Figure 3. Typical daily photovoltaic power output.
Energies 19 00125 g003
Figure 4. Output information of the gas–wind–solar hybrid operation.
Energies 19 00125 g004
Figure 5. Economic indicators of gas–wind–solar hybrid operation.
Energies 19 00125 g005
Figure 6. Peak-shaving output of gas–wind–solar hybrid power generation.
Energies 19 00125 g006
Figure 7. Gas power unit combination results.
Energies 19 00125 g007
Figure 8. Analysis of the impact of natural gas price on system economic indicators.
Energies 19 00125 g008
Figure 9. Analysis of the impact of natural gas price on wind and solar curtailment volume.
Energies 19 00125 g009
Figure 10. Analysis of the impact of grid electricity price on the economic indicators of the gas–wind–solar hybrid power generation system.
Energies 19 00125 g010
Figure 11. Analysis of the impact of grid electricity price on wind and solar curtailment volume in gas–wind–solar hybrid power generation.
Energies 19 00125 g011
Figure 12. Analysis of the impact of green certificate price on the economic indicators of the gas–wind–solar hybrid power generation system.
Energies 19 00125 g012
Figure 13. Analysis of the impact of green certificate price on wind and solar curtailment volume in gas–wind–solar hybrid power generation.
Energies 19 00125 g013
Figure 14. Analysis of the impact of carbon dioxide price on the economic indicators of the gas–wind–solar hybrid power generation system.
Energies 19 00125 g014
Figure 15. Analysis of the impact of carbon dioxide price on wind and solar curtailment volume in gas–wind–solar hybrid power generation.
Energies 19 00125 g015
Table 1. Indicator Set of the Proposed Model.
Indicator SetSymbolMeaning
t Set of scheduling time, t T
i Set of power units, i N
Table 2. Gas–Wind–Solar Combined Generation Symbol Definitions.
Gas–Wind–Solar Combined Generation ParametersSymbolMeaning
Decision Variables P g , i , t Output of gas power unit i at time t
P w , t Output of wind farm at time t
P p v , t Output of solar power station at time t
P w , t a b Wind power curtailment at time t
P p v , t a b Solar power curtailment at time t
P s , t Total power delivery at time t
U g , i , t Start-up/shut-down state variable of gas power unit i at time t
Model Parameters a g Gas power grid electricity price
a w Wind power grid electricity price
ρ w Green certificate trading price for wind power
x w Green certificate quota coefficient per unit of wind power
ρ p v Green certificate trading price for solar power
K w Unit operation cost of wind power
K p v Unit operation cost of solar power
S Start-up/shut-down cost of gas power unit
G Natural gas price
L H V Lower heating value of natural gas
η g , i Average efficiency of gas power unit i
Δ t Scheduling time scale
r w ,   r p v Reserve capacity demand ratio of gas power unit i
P g , i , t max Maximum output of gas power unit i at time t
P g , i max Maximum technical output of gas power unit i
δ i Ramping rate of gas power unit i
α w , t Wind farm output coefficient at time t (based on local wind forecast)
α p v , t Solar farm output coefficient at time t (based on local solar forecast)
P w Installed capacity of wind farm
P p v Installed capacity of solar farm
P ¯ g , i Minimum output of gas power unit i
P ¯ g , i Maximum output of gas power unit i
T g , i , t 1 o n Continuous operation time of gas power unit i at time t − 1
T g , i , t 1 o f f Continuous shut-down time of gas power unit i at time t − 1
T g , i o n Minimum run-time of gas power unit i
T g , i o f f Minimum shut-down time of gas power unit i
P w , t f o r e Wind power predicted output at time t
P p v , t f o r e Solar power predicted output at time t
Table 3. The parameters of wind power generation and photovoltaic power generation.
MeaningsWind PowerPhotovoltaic Power
The reserve capacity demand ratio0.150.05
The installed capacity2240 MW1490 MW
The price for green certificate trading30 CNY/MWh30 CNY/MWh
The green certificate quota coefficient11
The penalty cost coefficient 230 CNY/MWh230 CNY/MWh
The self-use electricity rate2%2%
The transmission capacity of the export line2500 MW2500 MW
The power fluctuation range ±150 MW/h±150 MW/h
The grid-connected price401.2 CNY/MWh401.2 CNY/MWh
The unit operation cost30 CNY/MWh40 CNY/MWh
The scheduling period24 h24 h
The time interval of scheduling period1 h1 h
Table 4. The parameters of natural gas power generation.
MeaningsF-ClassH-Class
The reserve capacity demand ratio1.4%1.4%
The transmission capacity of the export line2500 MW2500 MW
The power fluctuation range ±150 MW/h±150 MW/h
The grid-connected price401.2 CNY/MWh401.2 CNY/MWh
The scheduling period24 h24 h
The time interval of scheduling period1 h1 h
The minimum output of the gas turbines115.5 MW240 MW
The ramp-up rates250 MW480 MW
The start–stop duration constraint2 h2 h
The startup–shutdown cost31,600 CNY31,600 CNY
The carbon emission penalty cost50.85 CNY/MWh50.85 CNY/MWh
The natural gas price1.53 CNY/m31.53 CNY/m3
The lower heating value (LHV) of natural gas9.082 × 10−3 MWh/m39.082 × 10−3 MWh/m3
Installed Capacity × Quantity (MW)385 × 2800 × 2
Table 5. Economic indicators of system operation.
Economic IndicatorSystem Total Economic BenefitSystem Operating IncomeGreen Certificate Trading IncomeSystem Operating CostWind and Solar Curtailment Penalty CostGas Power Carbon Emission Penalty Cost
Amount (in 10,000 yuan)997.341181.8277.95241.143.0917.60
Table 6. System operation results under different scenarios.
TypeScenarioTotal System BenefitsSystem Operating RevenueGreen Certificate Trading RevenueSystem Operating CostWind and Solar Curtailment Penalty CostGas Power Carbon Emission Penalty Cost
Wind Power (10,000 yuan)1997.34 1181.22 77.95 241.14 3.09 17.60
21264.67 1390.93 97.28 208.40 3.74 11.40
3785.09 893.20 61.17 154.83 4.93 9.52
4792.80 920.88 62.44 171.58 8.07 10.87
Photovoltaic (10,000 yuan)1984.50 1161.20 76.97 231.54 5.41 16.71
2997.34 1181.22 77.95 241.14 3.09 17.60
3977.56 1183.56 76.96 258.41 4.98 19.57
4971.13 1142.04 75.83 225.38 5.15 16.22
Disclaimer/Publisher’s Note: The statements, opinions and data contained in all publications are solely those of the individual author(s) and contributor(s) and not of MDPI and/or the editor(s). MDPI and/or the editor(s) disclaim responsibility for any injury to people or property resulting from any ideas, methods, instructions or products referred to in the content.