Article

Energy Usage Assessment and Energy Savings Estimation in a Radiology Department in Italy

1
Department of Mechanical and Industrial Engineering, Università degli Studi di Brescia, Via Branze 38, 25123 Brescia, Italy
2
Department of Biomedical Sciences for Health, Università degli Studi di Milano, Via Mangiagalli 31, 20133 Milan, Italy
3
Department of Information Engineering, Università degli Studi di Brescia, Via Branze 38, 25123 Brescia, Italy
4
Department of Radiology, ASST Ovest Milanese Legnano Hospital, Via Papa Giovanni Paolo II, Legnano, 20025 Milan, Italy
5
Department of Civil, Environmental, Architectural Engineering and Mathematics, Università degli Studi di Brescia, Via Branze 43, 25123 Brescia, Italy
*
Author to whom correspondence should be addressed.
Energies 2025, 18(8), 1936; https://doi.org/10.3390/en18081936
Submission received: 22 February 2025 / Revised: 24 March 2025 / Accepted: 7 April 2025 / Published: 10 April 2025
(This article belongs to the Section B: Energy and Environment)

Abstract

:
Growing awareness of the environmental impact of radiology departments highlights the importance of adopting mitigation strategies to increase the energy sustainability of diagnostic activities. This study aims to estimate the energy usage of imaging activities in a radiology department to plan and evaluate different energy waste mitigation strategies. A retrospective analysis of the energy usage of imaging equipment, including computed tomography (CT), magnetic resonance imaging (MRI), X-ray (XR), and workstations of radiology department in Italy, was carried out. The energy used was estimated based on equivalent mean power demand values in kWh. From this analysis, mitigation strategies were planned to reduce energy waste. The daily energy usage of the department is 877.5 kWh. The cone beam CT scanner is the imaging device with the lowest daily energy usage (6.6 kWh). Modalities with the highest mean daily energy usage are XR (18.4 kWh), CT (58.3 kWh), and MRI (214.6 kWh). The proposed mitigation strategies led to a reduction in energy waste quantified between 16.6% and 80.4%. The analysis of the energy usage of all imaging devices and workstations makes it possible to assess the energy waste of a radiology department. Understanding these elements is essential to develop strategies to reduce energy waste in radiology.

1. Introduction

The growing global awareness of the environmental impact and energy sustainability of radiology departments is becoming increasingly evident [1,2,3], and radiology activities contribute significantly to energy usage and are closely linked to greenhouse gas (GHG) emissions [4,5,6]. It is estimated that radiology, considering the production and use of medical imaging equipment, accounts for about 1% of global GHG emissions [7,8]. Therefore, mitigation strategies to reduce these emissions in radiology departments are essential. A large part of the energy used by diagnostic imaging equipment is correlated to a nonproductive idle state [9]. Among the most effective strategies to mitigate energy usage could include switching off equipment when not in use and improving scanner scheduling efficiency to decrease idle periods [10] or choosing lower-energy imaging examinations without reducing clinical appropriateness [11]. To see how effective these strategies are, it is necessary to calculate the energy usage related to radiological activities. The most energy-intensive radiology activities are associated with magnetic resonance imaging (MRI and computed tomography (CT) examinations [12,13,14], and their energy usage has often been analyzed by considering only a small part of a department’s whole diagnostics imaging equipment [15,16,17]. It is also noteworthy that monitors and workstations, though consuming less energy than imaging equipment, still significantly impact departmental energy use [18,19]. Some studies have investigated the overall energy usage or the impact in terms of the CO2 emissions of a radiology department’s activities [12,13], or other studies have hypothesized energy-saving strategies for only single radiology equipment [9,15,18]; but, to the best of our knowledge, no studies have yet been conducted that take into account all the equipment of an entire radiology department and that assume and implement strategies in real-life settings to reduce energy waste.
This study aims to estimate the energy usage of all radiological activities within a radiology department setting: imaging modalities such as cone beam computed tomography (CBCT), computed tomography (CT), dual-energy X-ray absorptiometry (DXA), mammography (MG), magnetic resonance imaging (MRI), mobile chest X-ray (MCXR), ultrasound (US), X-ray (XR), and other equipment, specifically reporting and radiology information system (RIS) and picture archiving and communication system (PACS) workstations. From the result of this analysis, the second objective is to plan, implement, and evaluate different energy waste mitigation strategies.

2. Materials and Methods

2.1. Overview of Methods
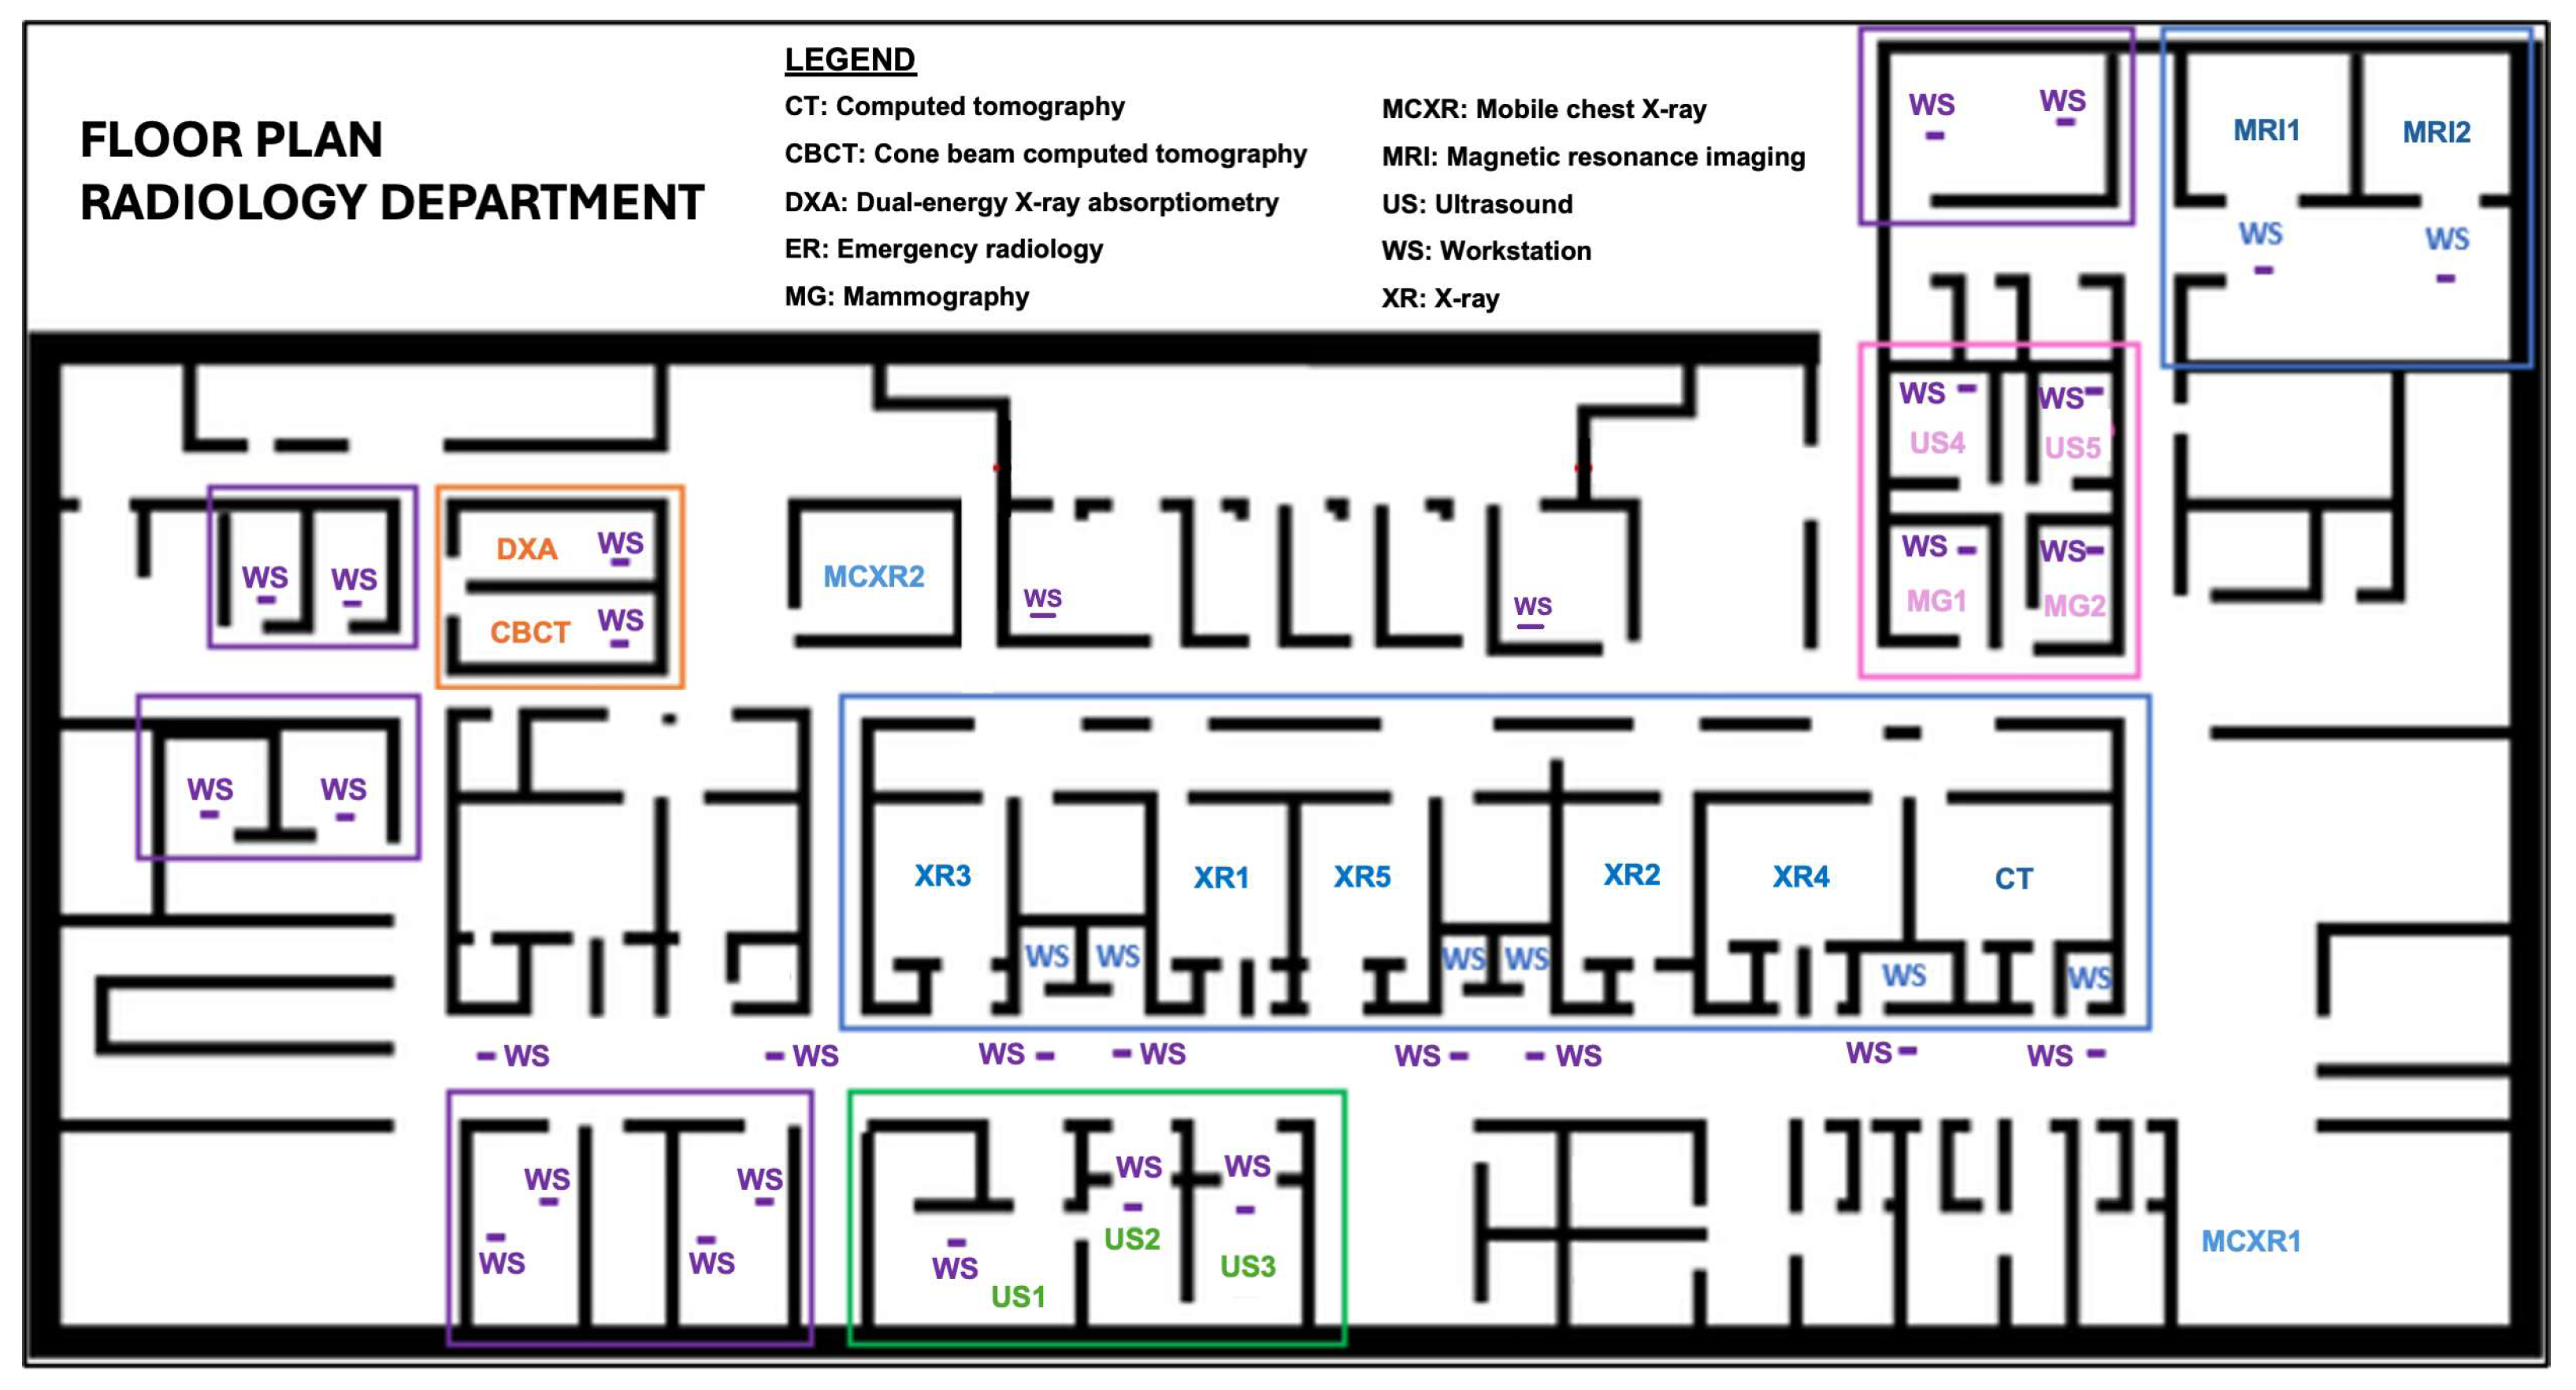
In accordance with the energy audits of processes standard UNI CEI EN 16247-3:2022 [20] and the cycle Plan-Do-Check-Act of ISO 50001 [21], a retrospective analysis of the energy usage of all imaging equipment and reporting and RIS/PACS workstations for diagnostic activities was carried out. Through this, the areas of highest energy usage were determined, and possible energy waste mitigation strategies were planned. Figure 1 presents a graphical representation of the study’s methodological flowchart.

2.2. Study Setting

The energy usage of all imaging devices, CBCT (n = 1), CT (n = 1), DXA (n = 1), MG (n = 2), MRI (n = 2), MCXR (n = 2), US (n = 5), XR (n = 5), and all reporting (n = 10) and RIS/PACS (n = 27) workstations of the operational unit of Radiology at Ospedale Nuovo di Legnano (Legnano Hospital), a 555-bed public hospital in the metropolitan city of Milan, Italy, was evaluated. The floor plan of the department is shown in Figure 2.
The complete list of imaging equipment considered can be found in Appendix A. The working hours considered for the estimation of energy usage were from 8:10 a.m. to 3:30 p.m. (7.3 h) for all XR, DXA, MRI1, MG2, US3, US4, and US5 scanners; from 8:10 a.m. to 12:00 p.m. (4 h) for the CBCT scanner; from 8:10 a.m. to 4:30 p.m. (8.3 h) for the CT scanner; from 8:10 a.m. to 5:30 p.m. (9.3 h) for the US1 and US2 scanners; from 8:10 a.m. to 7:30 p.m. (11.3 h) for the MG1 scanner; from 8:10 a.m. to 11:30 p.m. (23.3 h) for the MRI2 scanner; and 24 h of operation for the MCXR devices of the radiology operational unit.

2.3. Study Design

The study was divided into two parts. The first part estimated the daily energy usage of each diagnostic modality and all reporting and RIS/PACS workstations in relation to the daily diagnostic activities performed, excluding when they are switched off at the end of the working day. The second part hypothesized and tested three different energy usage mitigation strategies: (1) optimizing the energy usage of reporting and RIS/PACS workstations, (2) reorganizing diagnostic activities to reduce energy waste, and (3) selecting for lower-energy imaging examinations without compromising clinical appropriateness.

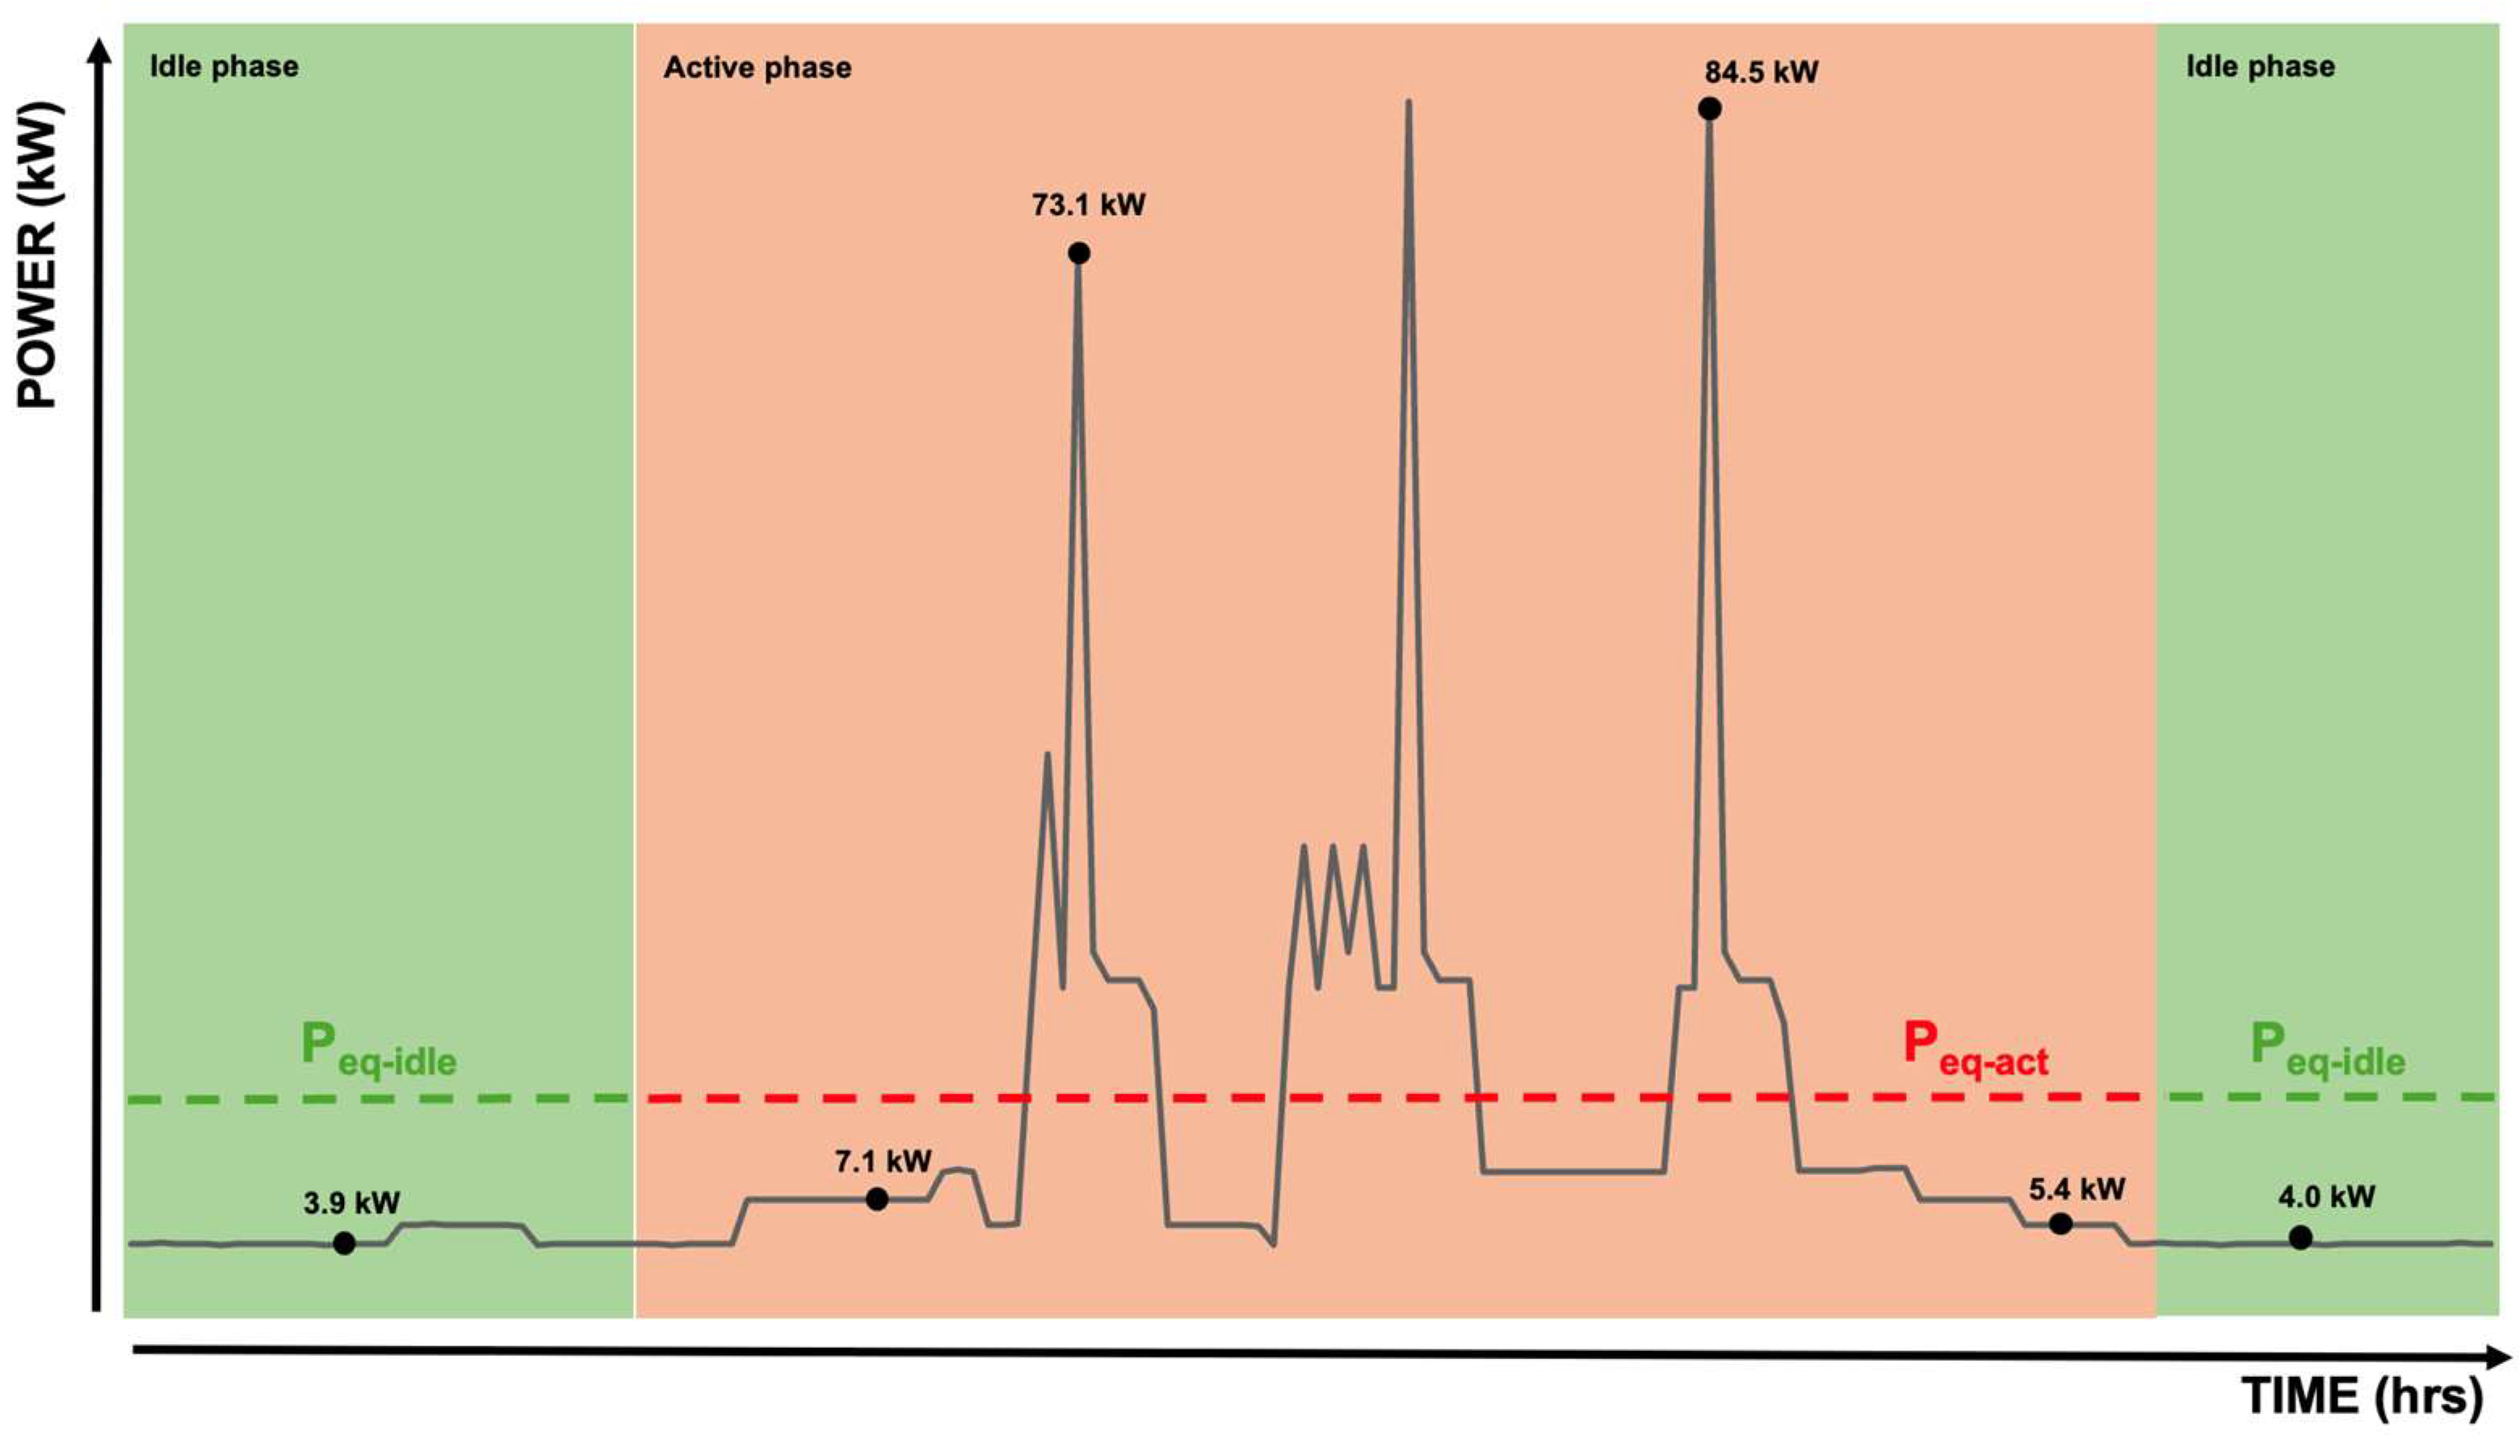
2.4. Estimation of Energy Usage

In order to estimate the energy usage for each diagnostic imaging device and equipment (reporting and RIS/PACS workstations), initially the usage time (expressed in hours, h) per day was collected, considering the radiology department’s activities performed between 1 January 2023 and 28 February 2023.
Regarding all imaging scanners, usage periods were divided into two states:
  • Active period: the productive time, which includes patient or scanner positioning and image acquisition;
  • Idle period: the non-productive waiting time interval between “active” time periods, when devices are “on” but not working.
As only the clinical operating hours of the imaging equipment were considered for this estimation, any energy consumption during the stand-by phase, i.e., when the scanner is switched off or not used after the working hours, was not estimated.
The time (T, expressed in hours) for the active period and the idle period was assessed by considering the total number of working hours per day, the total number of diagnostic examinations performed, and the allocated time duration of planned examinations (Table 1).
RIS/PACS workstation usage periods were associated with three different states:
  • Active period: the production time during which workstations are actively used by department staff;
  • Idle period: the non-productive waiting time interval between “active” time periods, when workstations are “on” but not working;
  • Stand-by period: the non-productive time that the equipment was switched on but there was no related imaging activity. During the stand-by period, workstations are able to consume less power while being able to resume its normal functions quickly.
The hours associated with these different periods can be found in Table 2.
Radiological equipment typically exhibits energy profiles characterized by short bursts of high-power demand followed by extended low-power intervals during the active phase (Figure 3) [15]. To simplify comparisons between these varying consumption patterns, the equivalent mean power demand, representing the total power supplied over the duration of a specific phase, was considered for both activity and waiting periods. This approach provides a single, easily interpretable parameter that consolidates the variable consumption profile and facilitates the straightforward comparison of different power requirements.
On the other hand, for MRI and ultrasound scanners, the equivalent mean power demand during the active phase and the idle phase coincides as the scan, although having some peaks during acquisition, has a rather constant active consumption, with the scanner constantly ready to scan [15,22].
Once the usage time of all imaging devices and all workstations has been calculated, the energy usages (E) (expressed in kWh) were estimated as the product of the equivalent mean power demand (Peq) (expressed in kW) declared by device manufacturers of radiological scanners (Table 3) and workstations (Table 4) and the duration of each time (T), according to the formula:
Energyi = Equivalent Mean Power Demandi · Timei,

3. Results

3.1. Energy Usage

The total estimated number of daily imaging examinations is 489, divided into 2.0% CBCT, 16.4% CT, 2.3% DXA, 6.5% MG, 6.5% MRI, 72% MCXR, 17.4% US, and 41.7% XR.
All imaging equipment in the department stayed in idle mode for a portion of the working time (Table 1) ranging from 8% time in the idle period for XR2 and XR4 to 96% for MG2. The equipment that showed very dense schedules with idle periods of less than 20% during daily work were XR2, XR4, and MRI2.
The imaging scanners that spend a significant amount of working time in idle periods are MCXR2 (84%), XR5 (92%), MCXR1 (93%), and MG2 (96%). Among the workstations, those with the most time spent in the idle period are the RIS/PACS workstations with an average of 43%.
The estimation of the energy usage of each imaging scanners can be found in detail in Table 2. In the operational unit of radiology, MG2 is the scanner that used the least energy per day during the active period (1.3 kWh). Regarding the idle period, XR2 and XR4 used the least energy (0.7 kWh). MRI2 is the scanner that used the highest amount of energy during both the active period (243.2 kWh) and idle period (47.5 kWh), followed by MRI1 (110.2 kWh during the active period and 28.2 kWh during the idle period) and CT (45.9 kWh during the active period and 12.4 kWh during the idle period).
Furthermore, when analyzing the impact of the energy used during idle periods compared to the total daily energy usage of each device, the imaging modalities with the highest non-productive energy usage were MG2 (91%), XR5 (78%), CBCT (55%), and DXA (49%) (Figure 4).
Mean energy usage for each imaging modality for the active period and idle periods is summarized in Figure 5.
Considering the mean energy consumption for each diagnostic modalities, CBCT modality has the lowest daily energy usage (6.6 kWh), followed by DXA (8 kWh), US (8.9 kWh), MCXR (12.5 kWh), XR (18.4 kWh), and MG (23.4 kWh). The diagnostic modalities with the highest mean daily energy usage are CT (58.3 kWh) and MRI (214.6 kWh). In total, it was estimated that all radiological device modalities in the department consume 710.2 kWh per day, divided in 551.5 kWh (78%) during the active period and 158.7 kWh (22%) during the non-productive idle period.
The energy used by the workstations was considered for all devices in the department (Table 2). Overall, the highest energy usage is associated to the RIS/PACS workstations in the operating unit of radiology (active period = 55.0 kWh; idle period = 46.8 kWh; stand-by period: 4.3 kWh).
Concerning the workstations, the total energy usage during daily work is estimated at 167.3 kWh, divided into 100.5 kWh (60.1%) during the active period, 58.8 kWh (35.1%) during the idle period, and 8 kWh (4.8%) during the stand-by period. In total, the department’s energy usage was estimated at 877.5 kWh during the daily work activity.

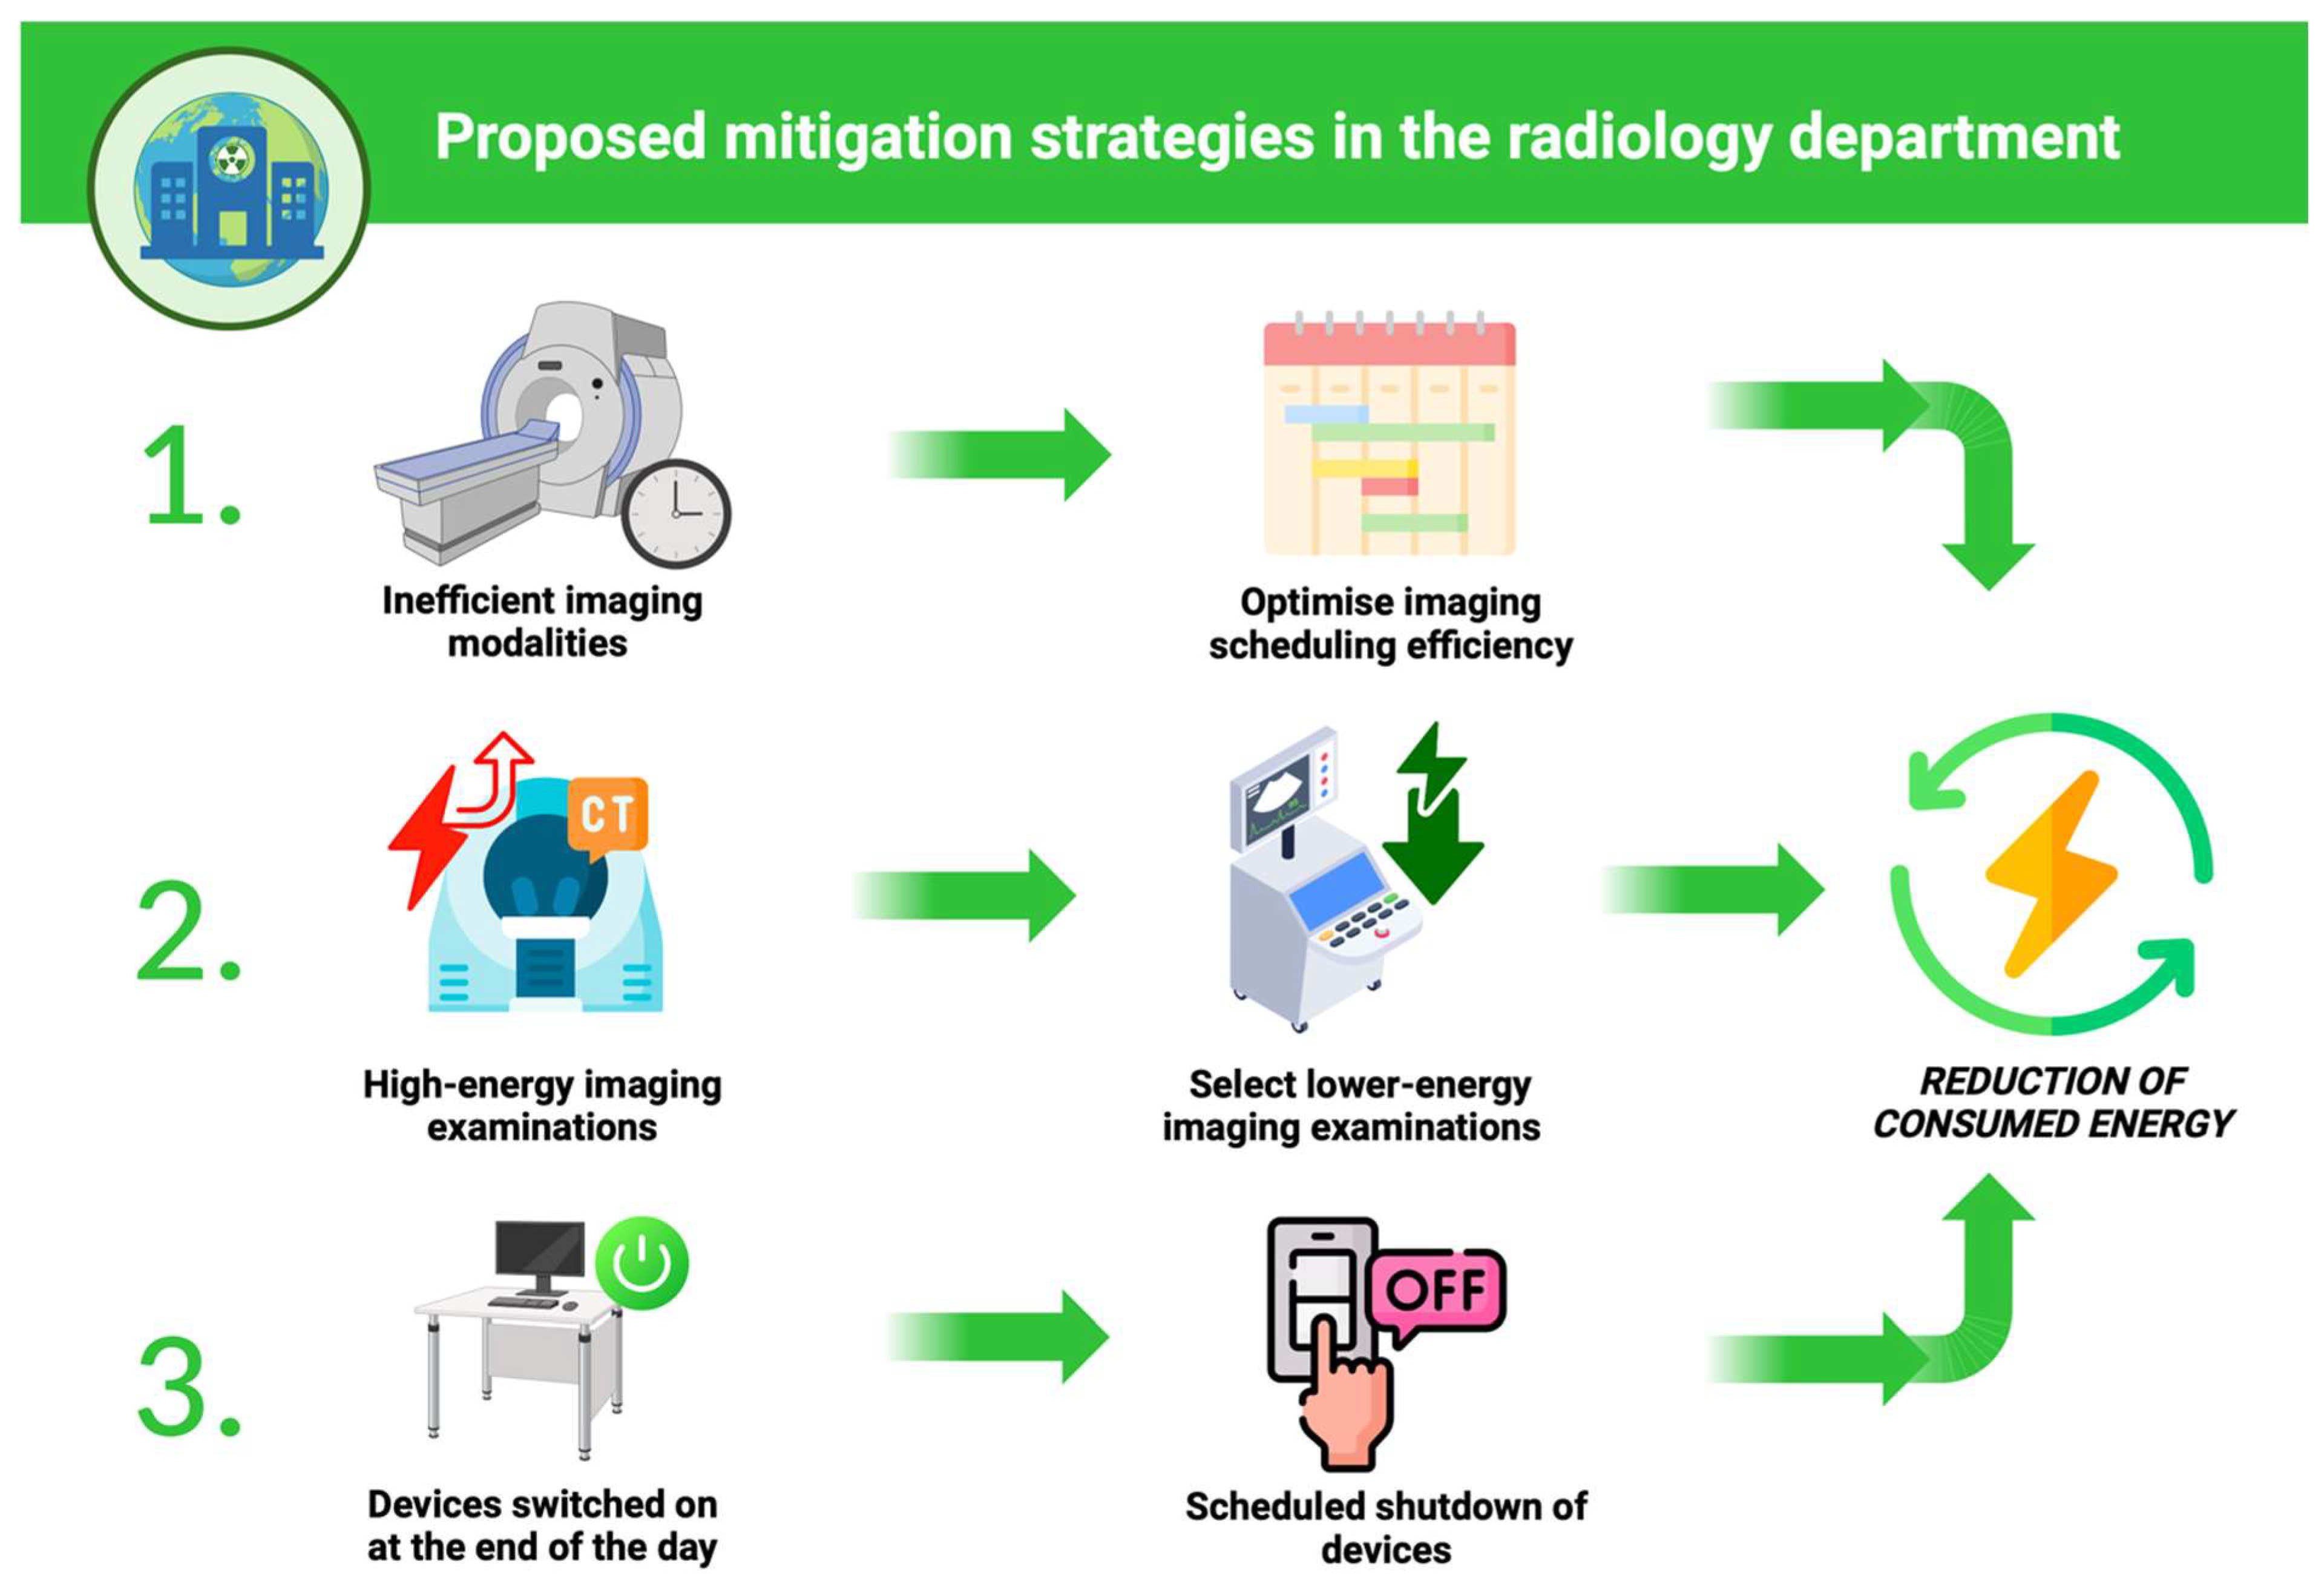
3.2. Mitigation Strategies

Based on the energy usage data estimated, in March 2023, three different mitigation strategies were proposed and evaluated by an audit committee composed by radiographers, radiologists, and clinical engineers of the hospital in the radiology department, considering the needs of the radiology staff. The proposed mitigation strategies were summarized in Figure 6.

3.2.1. Mitigation Strategy 1: Optimize Imaging Scheduling Efficiency

Based on the results of the energy usage analysis of the imaging modalities for active and idle periods, the most energy inefficient imaging modalities will be identified, and energy waste mitigation strategies will be formulated to optimize the efficiency of imaging scheduling.
In the ratio of active period to idle period, as shown above, the greatest energy inefficiencies concern the imaging modalities XR5, CBCT, MCXR1, and MG2. In response, four direct interventions to optimize imaging scheduling efficiency were identified:
  • Reduction in XR5 activity, which is exclusively ambulatory and do not include unscheduled urgent examinations, from 5 to 3 working days by redistributing exams on scheduled days.
  • Reduction in CBCT activity times based on the number of patients booked and the early closure of diagnostics at the end of scheduled activity.
  • Redistribution of MG1 mode activity to MG2, keeping both modes active.
  • Exclusive use of MCXR2, keeping MCXR1 switched off, concentrating activity on a single device.
The results of this mitigation strategy can be seen in Table 5. In summary, an increase of 3.0% in energy used during the active period, a reduction of 38.3% in energy usage during the non-productive idle phase, and a total reduction of 16.6% in the total energy used per day were achieved.

3.2.2. Mitigation Strategy 2: Select Lower-Energy Imaging Examinations

Considering the emergency activities of the unit of radiology, it was identified that for patients affected by abdominal pain, both XR and CT scans were frequently used for diagnosis. However, according to the guidelines of the American College of Radiology Appropriateness Criteria [23], ultrasound imaging could serve as an equally appropriate diagnostic alternative. A retrospective evaluation was conducted to explore the feasibility of substituting US imaging for XR and CT in these cases to achieve a potential reduction in energy usage.
For this analysis, a sample of 41 diagnostic investigations performed for different types of abdominalgia was taken, identifying the diagnostic strategy performed and its low-energy alternative with equal diagnostic appropriateness and identifying total energy usage.
The results of this mitigation strategy are shown in Table 6. In overview, the adoption of low-energy diagnostic strategies with equal diagnostic appropriateness can lead to a −80.4% reduction in energy used in 41 different diagnostic investigations.

3.2.3. Mitigation Strategy 3: Scheduled Shutdown of Devices

Based on the results of the analysis of the energy usage of the workstations, the energy waste mitigation strategy will be planned through the scheduled switch-off of all workstations at the end of the working day in the radiology unit.
Among the calculated energy usage, one of the critical issues is the high energy usage of the RIS/PACS workstations during the non-productive idle and stand-by periods.
The results of this energy waste mitigation strategy can be seen in Table 7. After the implementation of the mitigation strategy, there was a 43.3% reduction in energy used by RIS/PACS workstations in the radiology unit.

4. Discussion

In this single-center study of a medium-sized Italian radiology department, radiology activity volumes were evaluated, and the total electricity usage of all diagnostic imaging equipment and workstations over a full working day was estimated. The total energy usage of the imaging department was estimated at 877.5 kWh per day. Analyzing the usage data of individual devices during a working day, the results of this study showed that more advanced individual imaging equipment (CT and MRI) has a greater impact in terms of both energy usage than individual imaging devices such as XR or US, confirming results already reported by other authors [13,24]. These results underline the importance of choosing the most suitable diagnostic method both for the clinical question and from the point of view of the energy usage required to perform it. This was the focus of the second mitigation strategy proposed by the study, namely, the choice of lower-energy imaging examinations, when clinically appropriate, which showed promising results, ensuring not only energy savings but also benefits in terms of reduced waiting times, patient satisfaction, and lower costs, as confirmed in other studies [25,26].
Considering the energy used during idle periods by imaging equipment, it accounts for 22% of the total energy usage daily, with devices that is mostly inactive due to organizational reasons, some with 90% of energy usage associated with idle periods. These aspects underline the importance of reducing energy waste through mitigation strategies while maintaining the department’s diagnostic effectiveness. Although the energy used during the activity period is necessary for patient care, the idle periods must be the main target of these energy-saving actions.
This study showed that through different energy waste mitigation approaches, encouraging results can be achieved. Through optimized scheduling efficiency, it was possible to achieve an 16.6% reduction in total electricity usage and 38.3% reduction during idle periods maintaining and increasing the use of the equipment, as already demonstrated in the literature with MRI [16]. The third energy waste mitigation strategy considered, the scheduled shutdown of devices during the non-productive idle and stand-by periods, finds confirmation in the literature, still with workstations and other imaging modalities [9,10,18,19]. The results of this study highlight the importance of a systematic approach to energy management. This study has shown that the adoption of energy performance monitoring and identification practices allows inefficiencies to be identified and resource use to be improved. This is consistent with the energy planning principle of ISO 50001, which encourages organizations to identify significant energy consumption and define energy performance indicators to drive continuous improvement [21].
The energy-waste mitigation strategies considered are just a few of those that can be implemented in a radiology department. For example, implementable mitigation strategies may include shortening imaging protocols for examinations with low environmental impact but the same diagnostic value [25], using energy-efficient technologies in the construction and operation of radiological services [27], using artificial intelligence to optimize examination times [28,29], and optimizing data storage, which is associated with high energy usage [29]. Radiology departments of different sizes can implement strategies similar to those proposed or adapt them according to their own workflows and resources, either by identifying and reducing unnecessary examinations [30] or by rescheduling activity and redistributing the necessary resources, also with the help of new technologies [31].
This study shows how decisive it is in the radiology context to consider an entire radiology department and not only individual equipment to be able to introduce energy waste mitigation strategies and achieve an increase in environmental sustainability and energy savings of diagnostic activities.
It is important to emphasize that energy usage is only one aspect of the environmental sustainability of medical radiology departments. CO2 emissions associated with radiology activities also relate to the use of consumables and contrast media [32,33], waste generation [34,35], the sustainable management of helium in MRI [22], and the travelling of patients and staff to and from radiology facilities [36,37]. In the context of a more comprehensive analysis of the radiology department’s environmental impact and the identification of best practices for a more sustainable radiology, it would be useful to also consider all these aspects beyond the energy usage of equipment, through tools designed to calculate carbon emissions, such as life cycle assessment [12,38,39].
This study has limitations. To identify the energy usage of all diagnostic modalities and workstations in the department, work activity over a limited time window (January–February 2023) was considered. Other similar studies have carried out data collection over longer time windows [12,40]. Furthermore, energy usage was estimated as the product of the equivalent mean power demand declared by scanner manufacturers and the duration of each activity, following examples described in the literature [13,16]. The use of power meters would allow a calculation of the real usage considering all variables associated with the activity of a radiology department [9,41]. In addition, the allotted time duration of a planned examination was considered to estimate the duration of the daily examinations of each equipment to obtain the most reproducible data possible. The effective duration of the examinations performed in the time frame considered was not considered because it varies according to the type of patient and the clinical demand. Another limitation is that the study only considered radiological activities in a single hospital environment. Differences in the energy usage of diagnostic modalities were identified due to both variations between the devices, the type of use, and the varying number of examinations per month and per day within a modality and between modalities [15]. Due to this variability, absolute levels of energy usage and emissions in other contexts may differ. Energy usage associated with the non-working time of day and heating, ventilation, and air conditioning systems and ward lighting systems are not included in the study. The effect of these omissions is only to underestimate the total amount of energy usage of the entire department, which is outside the purpose of this study. Mitigation strategy 1 focused on specific equipment within the radiology unit as mitigation actions needed to align with the unit’s normal day-to-day operations. Lastly, the results of mitigation strategy 2 are associated with a retrospective estimate. No patients were included in the study; therefore, it was not possible to actively evaluate the strategy of choice lower-energy imaging examinations. Through an update of the ethics committee approval, the efficacy could be verified prospectively in future studies. It is important to emphasize that all energy waste mitigation strategies can cause inconvenience from an organizational and patient feedback perspective. These aspects must also be considered when planning and possibly introducing mitigation strategies in daily clinical practice.

5. Conclusions

Analyzing the energy usage of all imaging devices and workstations is critical to assessing energy waste in a radiology department. This study highlights energy-intensive diagnostic imaging practices and helps identify potential energy inefficiencies in a radiology department. Energy waste mitigation strategies can help reduce energy usage and can generate effective results such as those described:
  • Optimize imaging scheduling efficiency −16.6% of energy usage;
  • Select lower-energy imaging examinations −80.4% of energy usage;
  • Scheduled shutdown of devices −40.9% of energy usage.
Introducing these strategies could help radiology departments that aspire to become greener, reducing their environmental footprint without compromising the quality of patient care.

Author Contributions

Conceptualization, A.R., A.M., C.M., G.R.B. and F.P.; Methodology, A.M.; Validation, A.R., A.S. and S.Z.; Formal Analysis, A.R.; Investigation, A.M.; Resources, A.M.; Data Curation, A.R. and A.S.; Writing—Original Draft Preparation, A.R.; Writing—Review and Editing, A.S. and S.Z.; Visualization, F.P.; Supervision, C.M. and S.Z. All authors have read and agreed to the published version of the manuscript.

Funding

This research received no external funding.

Data Availability Statement

Data are contained within the article.

Conflicts of Interest

The authors declare no conflicts of interest.

Abbreviations

The following abbreviations are used in this manuscript:
CTComputed tomography
CBCT Cone beam computed tomography
DXADual-energy X-ray absorptiometry
E Energy
GHGGreenhouse gas
MGMammography
MCXRMobile chest X-ray
MRIMagnetic resonance imaging
PeqEquivalent mean power demand
PACSPicture archiving and communication system
RISRadiology information system
RWSReporting workstation
USUltrasound
WSWorkstation
XRX-ray

Appendix A

The full list of radiological equipment examined is as follows:
XR1Samsung AccE GC85A (Samsung Healthcare, Seoul, Republic of Korea)
XR2Samsung AccE GC85A (Samsung Healthcare, Seoul, Republic of Korea)
XR3Carestream DRX-Compass (Carestream Health, Rochester, NY, USA)
XR4Carestream DRX-Compass (Carestream Health, Rochester, NY, USA)
XR5Discovery RF180 Radiography and Fluoroscopy System (GE HealthCare, Chicago, IL, USA)
CTDiscovery HD750 CT scanner (GE HealthCare, Chicago, IL, USA)
MRI1Philips Ingenia 1.5-T MRI scanner (Philips Healthcare, Best, Netherlands)
MRI2Philips Ingenia 1.5-T MRI scanner (Philips Healthcare, Best, Netherlands)
CBCTCone Beam 3D imaging New Tom Giano HD (NewTom Official, Imola, Italy)
DXAGE Lunar iDXA (GE HealthCare, Chicago, IL, USA)
MG1Hologic 3D Dimensions (Hologic Inc, Marlborough, MA, USA)
MG2Hologic 3D Dimensions (Hologic Inc, Marlborough, MA, USA)
MCXR1Carestreams DRX-Revolution (Carestream Health, Rochester, NY, USA)
MCXR2Carestreams DRX-Revolution (Carestream Health, Rochester, NY, USA)
US1Esaote MyLab X8c (Esaote SpA, Genoa, Italy)
US2Esaote MyLab X8c (Esaote SpA, Genoa, Italy)
US3Esaote MyLab X8c (Esaote SpA, Genoa, Italy)
US4Samsung Ultrasound system RS85 (Samsung Healthcare, Seoul, Republic of Korea)
US5Samsung Ultrasound system RS85 (Samsung Healthcare, Seoul, Republic of Korea)
Reporting workstations (RWS) (n = 10)Barco Nio Gray 5.8 MP (Branco NV, Kortrijk, Belgium)
RIS/PACS workstations (WS) (n = 27)HP z600 computer (HP Inc., Palo Alto, CA, USA)

References

  1. McKee, H.; Brown, M.J.; Kim, H.H.R.; Doo, F.X.; Panet, H.; Rockall, A.G.; Omary, R.A.; Hanneman, K.; Atzen, S. Planetary Health and Radiology: Why We Should Care and What We Can Do. Radiology 2024, 311, e240219. [Google Scholar] [CrossRef] [PubMed]
  2. Benmamoun, Z.; Fethallah, W.; Bouazza, S.; Abdo, A.A.; Serrou, D.; Benchekroun, H. A framework for sustainability evaluation and improvement of radiology service. J. Clean. Prod. 2023, 401, 136796. [Google Scholar] [CrossRef]
  3. Zigmund, B.; Hijaz, T.; Northrup, B.E.; Schoen, J.H.; Hanneman, K.; Brown, M.; Dave, P.; Gross, J.S.; Henry, C.E.; Leschied, J.R.; et al. Public Health Statement of the Association of University Radiologists Committee on Climate Change and Sustainability. Acad. Radiol. 2023, 30, 2358–2361. [Google Scholar] [CrossRef] [PubMed]
  4. Woolen, S.A.; Kim, C.J.; Hernandez, A.M.; Becker, A.; Martin, A.J.; Kuoy, E.; Pevec, W.C.; Tutton, S. Radiology Environmental Impact: What Is Known and How Can We Improve? Acad. Radiol. 2023, 30, 625–630. [Google Scholar] [CrossRef] [PubMed]
  5. Sumner, C.; Ikuta, I.; Garg, T.; Martin, J.G.; Mansoori, B.; Chalian, M.; Englander, B.S.; Chertoff, J.; Woolen, S.; Caplin, D.; et al. Approaches to Greening Radiology. Acad. Radiol. 2023, 30, 528–535. [Google Scholar] [CrossRef]
  6. Martin, M.F.; Maturen, K.E.; Foster, C.; Woolen, S.; Dunnick, N.R. Environmental stewardship and healthcare: Global reflections for radiology. Chin. J. Acad. Radiol. 2022, 5, 244–248. [Google Scholar] [CrossRef]
  7. Picano, E.; Mangia, C.; D’Andrea, A. Climate Change, Carbon Dioxide Emissions, and Medical Imaging Contribution. J. Clin. Med. 2022, 12, 215. [Google Scholar] [CrossRef]
  8. Brown, M.; Schoen, J.H.; Gross, J.; Omary, R.A.; Hanneman, K. Climate Change and Radiology: Impetus for Change and a Toolkit for Action. Radiology 2023, 307, e230229. [Google Scholar] [CrossRef]
  9. Woolen, S.A.; Becker, A.E.; Martin, A.J.; Knoerl, R.; Lam, V.; Folsom, J.; Eusemann, C.; Hess, C.P.; Deshpande, V. Ecodesign and Operational Strategies to Reduce the Carbon Footprint of MRI for Energy Cost Savings. Radiology 2023, 307, e230441. [Google Scholar] [CrossRef]
  10. Brown, M.; Snelling, E.; De Alba, M.; Ebrahimi, G.; Forster, B.B. Quantitative Assessment of Computed Tomography Energy Use and Cost Savings Through Overnight and Weekend Power Down in a Radiology Department. Can. Assoc. Radiol. J. 2022, 74, 298–304. [Google Scholar] [CrossRef]
  11. Alshqaqeeq, F.; McGuire, C.; Overcash, M.; Ali, K.; Twomey, J. Choosing radiology imaging modalities to meet patient needs with lower environmental impact. Resour. Conserv. Recycl. 2020, 155, 104657. [Google Scholar] [CrossRef]
  12. McAlister, S.; McGain, F.; Petersen, M.; Story, D.; Charlesworth, K.; Ison, G.; Barratt, A. The carbon footprint of hospital diagnostic imaging in Australia. Lancet Reg. Health West. Pac. 2022, 24, 100459. [Google Scholar] [CrossRef]
  13. Martin, M.; Mohnke, A.; Lewis, G.M.; Dunnick, N.R.; Keoleian, G.; Maturen, K.E. Environmental Impacts of Abdominal Imaging: A Pilot Investigation. J. Am. Coll. Radiol. 2018, 15, 1385–1393. [Google Scholar] [CrossRef] [PubMed]
  14. Javadi, A.; Nezhad, A.E.; Nardelli, P.H.J.; Sahoo, S. Energy Management System for Energy-intensive Radiology Appliances. In Proceedings of the 2023 IEEE International Conference on Environment and Electrical Engineering and 2023 IEEE Industrial and Commercial Power Systems Europe (EEEIC/I&CPS Europe), Madrid, Spain, 6–9 June 2023; pp. 1–6. [Google Scholar] [CrossRef]
  15. Heye, T.; Knoerl, R.; Wehrle, T.; Mangold, D.; Cerminara, A.; Loser, M.; Plumeyer, M.; Degen, M.; Lüthy, R.; Brodbeck, D.; et al. The energy consumption of Radiology: Energy- And cost-saving opportunities for CT and MRI operation. Radiology 2020, 295, 593–605. [Google Scholar] [CrossRef]
  16. Esmaeili, A.; McGuire, C.; Overcash, M.; Ali, K.; Soltani, S.; Twomey, J. Environmental impact reduction as a new dimension for quality measurement of healthcare services: The case of magnetic resonance imaging. Int. J. Health Care Qual. Assur. 2018, 31, 910–922. [Google Scholar] [CrossRef]
  17. Esmaeili, A.; Twomey, J.M.; Overcash, M.R.; Soltani, S.A.; McGuire, C.; Ali, K. Scope for energy improvement for hospital imaging services in the USA. J. Health Serv. Res. Policy 2015, 20, 67–73. [Google Scholar] [CrossRef] [PubMed]
  18. Hainc, N.; Brantner, P.; Zaehringer, C.; Hohmann, J. “Green Fingerprint” Project: Evaluation of the Power Consumption of Reporting Stations in a Radiology Department. Acad. Radiol. 2020, 27, 1594–1600. [Google Scholar] [CrossRef]
  19. Büttner, L.; Posch, H.; Auer, T.; Jonczyk, M.; Fehrenbach, U.; Hamm, B.; Bauknecht, H.C.; Böning, G. Switching off for future—Cost estimate and a simple approach to improving the ecological footprint of radiological departments. Eur. J. Radiol. Open 2021, 8, 100320. [Google Scholar] [CrossRef]
  20. EN 16247-3:2022; Energy Audits—Part 3: Processes. UNI Ente Italiano di Normazione, UNI CEI: Milan, Italy, 2022. Available online: https://www.uni.com (accessed on 31 October 2024).
  21. ISO 50001:2018; Energy Management Systems—Requirements with Guidance for Use. The International Organization for Standardization: Geneva, Switzerland, 2018. Available online: https://www.iso.org/standard/69426.html (accessed on 31 October 2024).
  22. Chaban, Y.V.; Vosshenrich, J.; McKee, H.; Gunasekaran, S.; Brown, M.J.; Atalay, M.K.; Heye, T.; Markl, M.; Woolen, S.A.; Simonetti, O.P.; et al. Environmental Sustainability and MRI: Challenges, Opportunities, and a Call for Action. J. Magn. Reson. Imaging 2024, 59, 1149–1167. [Google Scholar] [CrossRef]
  23. American College of Radiology. ACR Appropriateness Criteria. 2024. Available online: https://www.acr.org/Clinical-Resources/ACR-Appropriateness-Criteria (accessed on 31 October 2024).
  24. Malik, A.; Padget, M.; Carter, S.; Wakiyama, T.; Maitland-Scott, I.; Vyas, A.; Boylan, S.; Mulcahy, G.; Li, M.; Lenzen, M.; et al. Environmental impacts of Australia’s largest health system. Resour. Conserv. Recycl. 2021, 169, 105556. [Google Scholar] [CrossRef]
  25. Ibrahim, F.; Cadour, F.; Campbell-Washburn, A.E.; Allen, B.D.; Vosshenrich, J.; Brown, M.J.; Thavendiranathan, P.; Hanneman, K.; Moy, L. Energy and Greenhouse Gas Emission Savings Associated with Implementation of an Abbreviated Cardiac MRI Protocol. Radiology 2024, 311, e240588. [Google Scholar] [CrossRef] [PubMed]
  26. Leithner, D.; Moy, L.; Morris, E.A.; Marino, M.A.; Helbich, T.H.; Pinker, K. Abbreviated MRI of the Breast: Does It Provide Value? J. Magn. Reson. Imaging 2019, 49, e85–e100. [Google Scholar] [CrossRef] [PubMed]
  27. Klein, H.-M. A New Approach to the Improvement of Energy Efficiency in Radiology Practices. In RöFo—Fortschritte Auf Dem Gebiet Der Röntgenstrahlen Und Der Bildgebenden Verfahren; Georg Thieme Verlag KG: Stuttgart, Germany, 2023; Volume 195, pp. 416–425. [Google Scholar] [CrossRef]
  28. Ayde, R.; Senft, T.; Salameh, N.; Sarracanie, M. Deep learning for fast low-field MRI acquisitions. Sci. Rep. 2022, 12, 11394. [Google Scholar] [CrossRef]
  29. Doo, F.X.; Vosshenrich, J.; Cook, T.S.; Moy, L.; Almeida, E.P.R.P.; Woolen, S.A.; Gichoya, J.W.; Heye, T.; Hanneman, K. Environmental Sustainability and AI in Radiology: A Double-Edged Sword. Radiology 2024, 310, e232030. [Google Scholar] [CrossRef]
  30. Kopparam, R.V.; Redberg, R.F. The environmental impact of unnecessary imaging: Why less is more. Eur. J. Intern. Med. 2023, 111, 35–36. [Google Scholar] [CrossRef]
  31. Shahbandegan, A.; Mago, V.; Alaref, A.; van der Pol, C.B.; Savage, D.W. Developing a machine learning model to predict patient need for computed tomography imaging in the emergency department. PLoS ONE 2022, 17, e0278229. [Google Scholar] [CrossRef]
  32. Rengier, F.; Notohamiprodjo, M.; Weber, M.-A. Thoughts on sustainability in the use of iodinated contrast media in CT: A practice-oriented review based on the example of a hospital and a private practice. In RöFo—Fortschritte Auf Dem Gebiet Der Röntgenstrahlen Und Der Bildgebenden Verfahren; Georg Thieme Verlag KG: Stuttgart, Germany, 2024. [Google Scholar] [CrossRef]
  33. Dekker, H.M.; Stroomberg, G.J.; Van der Molen, A.J.; Prokop, M. Review of strategies to reduce the contamination of the water environment by gadolinium-based contrast agents. Insights Imaging 2024, 15, 62. [Google Scholar] [CrossRef] [PubMed]
  34. Clements, W.; Chow, J.; Corish, C.; Tang, V.D.; Houlihan, C. Assessing the Burden of Packaging and Recyclability of Single-Use Products in Interventional Radiology. Cardiovasc. Intervent Radiol. 2020, 43, 910–915. [Google Scholar] [CrossRef]
  35. Chua, A.L.B.; Amin, R.; Zhang, J.; Thiel, C.L.; Gross, J.S. The Environmental Impact of Interventional Radiology: An Evaluation of Greenhouse Gas Emissions from an Academic Interventional Radiology Practice. J. Vasc. Interv. Radiol. 2021, 32, 907–915.e3. [Google Scholar] [CrossRef]
  36. Patel, K.B.; Gonzalez, B.D.; Turner, K.; Tabriz, A.A.; Rollison, D.E.; Robinson, E.; Naso, C.; Wang, X.; Spiess, P.E. Estimated Carbon Emissions Savings With Shifts From In-Person Visits to Telemedicine for Patients With Cancer. JAMA Netw. Open 2023, 6, e2253788. [Google Scholar] [CrossRef]
  37. Dacones, I.; Cave, C.; Furie, G.L.; Ogden, C.A.; Slutzman, J.E. Patient transport greenhouse gas emissions from outpatient care at an integrated health care system in the Northwestern United States, 2015–2020. J. Clim. Change Health 2021, 3, 100024. [Google Scholar] [CrossRef]
  38. Roletto, A.; Savio, A.; Marchi, B.; Zanoni, S. Towards a Greener Radiology: A Comprehensive Life Cycle Assessment Framework for Diagnostic Imaging. Environ. Clim. Technol. 2024, 28, 303–311. [Google Scholar] [CrossRef]
  39. Thiel, C.L.; Vigil-Garcia, M.; Nande, S.; Meijer, C.; Gehrels, J.; Struk, O.; Thornander, S.; Pullella, D.; Omary, R.A.; Carver, D.E.; et al. Environmental Life Cycle Assessment of a U.S. Hospital-based Radiology Practice. Radiology 2024, 313, e240398. [Google Scholar] [CrossRef] [PubMed]
  40. Hanneman, K.; McKee, H.; Nguyen, E.T.; Panet, H.; Kielar, A. Greenhouse Gas Emissions by Diagnostic Imaging Modality in a Hospital-Based Radiology Department. Can. Assoc. Radiol. J. 2024, 75, 950–953. [Google Scholar] [CrossRef]
  41. Heye, T.; Meyer, M.T.; Merkle, E.M.; Vosshenrich, J. Turn It Off! A Simple Method to Save Energy and CO2 Emissions in a Hospital Setting with Focus on Radiology by Monitoring Nonproductive Energy-consuming Devices. Radiology 2023, 307, e230162. [Google Scholar] [CrossRef]
Figure 1. Study flowchart.
Energies 18 01936 g001
Figure 2. Floor plan of the radiology department of Ospedale Nuovo di Legnano.
Energies 18 01936 g002
Figure 3. Diagram showing the representation of a CT scan is segmented (orange area) according to scan time. The equivalent mean power demand represents the average power required by the scanner during the active phase, considering power peaks during scanning and low power phases. The black dots on the power consumption diagram exemplify the consumption in kilowatts at the respective position on the graph. The green area identifies the waiting phase and defines the area associated with the equivalent mean power demand of that phase.
Energies 18 01936 g003
Figure 4. Energy usage for each imaging modality (active period and idle period during a working day). Modalities with high energy waste during idle period are contoured with dark blue boxes.
Energies 18 01936 g004
Figure 5. Mean energy consumption (kWh) for each imaging modality (active period and idle period during a working day).
Energies 18 01936 g005
Figure 6. Proposed mitigation strategies in the radiology department.
Energies 18 01936 g006
Table 1. Working schedules, number of examinations performed, time spent during activity, and waiting periods for each imaging modality.
StartEndOpening (h)Exams
per Month
Exams per DayExam Time (min)Time (T)
Active Period (h)Idle Period (h)
XR 18:1015:307.360030105.02.3
XR 28:1015:307.380040106.70.6
XR 38:1015:307.320010101.75.6
XR 48:1015:307.380040106.70.6
XR 58:1015:307.3804100.66.7
DXA8:1015:307.38811101.85.5
CBCT8:0012:004.04010101.62.4
CT8:1016:308.335036106.23.1
MRI 18:1015:307.324810355.81.5
MRI 28:1023:3015.3500223512.82.5
MG 18:1019:3011.3660301056.3
MG 28:1015:307.3402100.37
US 18:1017:309.350025208.31
US 28:1017:309.350025208.31
US 38:1015:307.320010203.34
US 48:1015:307.3300152052.3
US 58:1015:307.320010203.34
MCXR 10:0024:0024.0 10101.722.3
MCXR 20:0024:0024.0 25104.219.8
Table 2. Number of hours for active, stand-by, and inactive periods for workstations (WSs) and reporting workstations (RWSs).
Different Energy Consumption Periods of Reporting Workstations in the Unit of Radiology
Active period (h)Stand-by period (h)Idle period (h)
RWS 1–26.52.115.4
RWS 3–45.82.016.1
RWS 5–109.12.312.6
Mean7.22.114.7
Different Energy Consumption Periods of RIS/PACS Workstation in the Unit of Radiology
Active period (h)Stand-by period (h)Idle period (h)
WS (n = 27) Mean6.810.28.0
Table 3. Equivalent mean power demand (kW) and total energy used (kWh) per day during active and idle phases of all radiological scanners.
Equivalent Mean Power Demand (Peq-act) During
Active Phase
(kW)
Equivalent Mean Power Demand (Peq-idle) During
Idle Phase
(kW)
Energy Used (Eact) During
Active Period
(kWh)
Energy Used (Eidle) During
Idle Period
(kWh)
XR 13.71.118.52.5
XR 23.71.124.80.7
XR 33.51.15.96.2
XR 43.51.123.40.7
XR 53.31.02.07.3
DXA2.30.74.13.9
CBCT1.91.53.03.6
CT16.44.045.912.4
MRI 11919110.228.2
MRI 21919243.247.5
MG 14.31.821.511.3
MG 24.31.81.312.6
US 11.11.19.11.1
US 21.11.19.11.1
US 31.11.13.74.4
US 41.11.15.52.5
US 51.11.13.74.4
MCXR 12.80.24.84.4
MCXR 22.80.211.83.9
Total 664.2201.3
Table 4. Equivalent mean power demand (Peq) (kW) and total energy consumed (kWh) per day during active, idle, and stand-by phases of all workstations.
Equivalent Mean Power Demand (Peq) (kW)
[Active/Idle/Stand-By]
Total Energy
Active Period (kWh)
Total Energy
Idle Period (kWh)
Total Energy
Stand-By Period (kWh)
RW (n = 10)0.5/0.28/0.0237.05.82.9
WS (n = 27)0.3/0.17/0.0255.046.84.3
Total 100.558.88
Table 5. Results of mitigation strategy 1: optimize imaging scheduling efficiency.
Active Period Before (kWh)Active Period After (kWh)Δ Active Period (%)Idle Period Before (kWh)Idle Period After (kWh)Δ Idle Period (%)Total Energy Before (kWh)Total Energy After (kWh)Δ Total Energy (%)
XR523.680.0%7.36.2−15.1%9.39.85.4%
CBCT33.723.3%3.60.0−100%6.63.7−44.0%
MG121.511.6−46.0%11.48.3−27.2%32.919.9
MG21.311.6792.3%12.68.3−34.1%13.919.9
Total MG22.823.21.8%2416.6−30.8%46.839.8−15.0%
MCXR211.816.338.1%3.93.6−7.7%15.719.9
MCXR14.80.0−100.0%4.40.0−100.0%9.20.0
Total MCXR16.616.3−1.8%8.33.6−56.6%24.919.9−20.1%
Total
Modalities
83.886.33.0%75.546.6−38.3%159.3132.9−16.6%
Table 6. Results of mitigation strategy 2: select lower-energy imaging examinations.
Num.
Exams
Clinical
Question
Diagnostic Exams
Performed
Low-Energy AlternativeActual Energy Consumption (kWh)Alternative Energy Consumption (kWh)Δ Total Energy (%)
22Generic abdominal painXRUS7724.2−68.6%
5Renal colicXR + CTUS + XR99.523−76.9%
6Air-fluid levelsXR + CTUS + XR119.427.6−76.9%
8Chronic hepatitisCTUS131.28.8−93.3%
Total: 41 427.183.6−80.4%
Table 7. Results of mitigation strategy 3: scheduled shutdown of devices.
Active
Before (kWh)
Active
After (kWh)
Idle
Before (kWh)
Idle
After (kWh)
Stand-By
Before (kWh)
Stand-By
After (kWh)
Total Energy Before (kWh) Total Energy After (kWh) Δ Total Energy (%)
WS
(n = 27)
55.045.346.75.54.39.3106.060.1−43.3%
Disclaimer/Publisher’s Note: The statements, opinions and data contained in all publications are solely those of the individual author(s) and contributor(s) and not of MDPI and/or the editor(s). MDPI and/or the editor(s) disclaim responsibility for any injury to people or property resulting from any ideas, methods, instructions or products referred to in the content.

