
Optimizing Feedstock Selection for Sustainable Small-Scale Biogas Systems Using the Analytic Hierarchy Process †


Abstract
1. Introduction
1.1. Background and Context
- Studies in Uganda by Lwiza et al. [10] found that biogas plants were often abandoned within four years due to several factors including drought (leading to inability to keep enough livestock), disease, shifts in land use priorities, and technical issues with digester performance. Similar findings were reported by Paramonova et al. [11] in Vietnam, where these challenges led to dis-adoption of small-scale biogas systems. In China, pig manure is the primary feedstock for household biogas digesters. However, in 2018, an outbreak of African Swine Fever (ASF) led to the culling of over 1.2 million pigs, resulting in a severe manure shortage and the eventual shutdown of many biogas digesters due to unsustainable feedstock supply [12]. Bhat et al. [13] noted that reductions in manure availability and an increase in alternative uses often lead to insufficient biogas production, causing households to abandon biogas systems and revert to traditional, polluting cooking methods.
- In Bangladesh, Rahman et al. [14] observed that cattle and chicken farmers underfed their digesters with about one-third less manure than recommended. A review of Rwanda’s National Domestic Biogas Program (NDBP) by FAO [15], revealed that over 20% of biodigester operators had fewer cows than needed to produce sufficient manure to sustain biogas production, while another one-quarter had their digesters producing less biogas than expected.
1.2. State-of-the-Art
- Objective and subjective evaluation: It assesses both objective and subjective functions in multicriteria decision-making, aiding in reaching a consensus.
- Optimal judgment guidance: It directs decision-makers towards the optimal judgment for the issue at hand rather than seeking a definitive ‘correct’ solution.
- Hierarchical structure: It provides a broad and balanced framework for decision-making, organizing large problems into smaller, manageable subproblems.
- Criteria prioritization: It identifies and prioritizes significant factors by weighting different criteria, clearly indicating their relative importance numerically.
- Consistency check: It includes the calculation of the consistency ratio, a key feature of AHP, allowing verification of the consistency and rationality of judgments, thus reducing bias.
- Versatility: Applicable to both qualitative (intangible) and quantitative (tangible) criteria, making it adaptable to a wide range of decision-making scenarios.
- Ease of use: Simple to understand and apply, even for complex issues.
1.3. Novelty of the Study
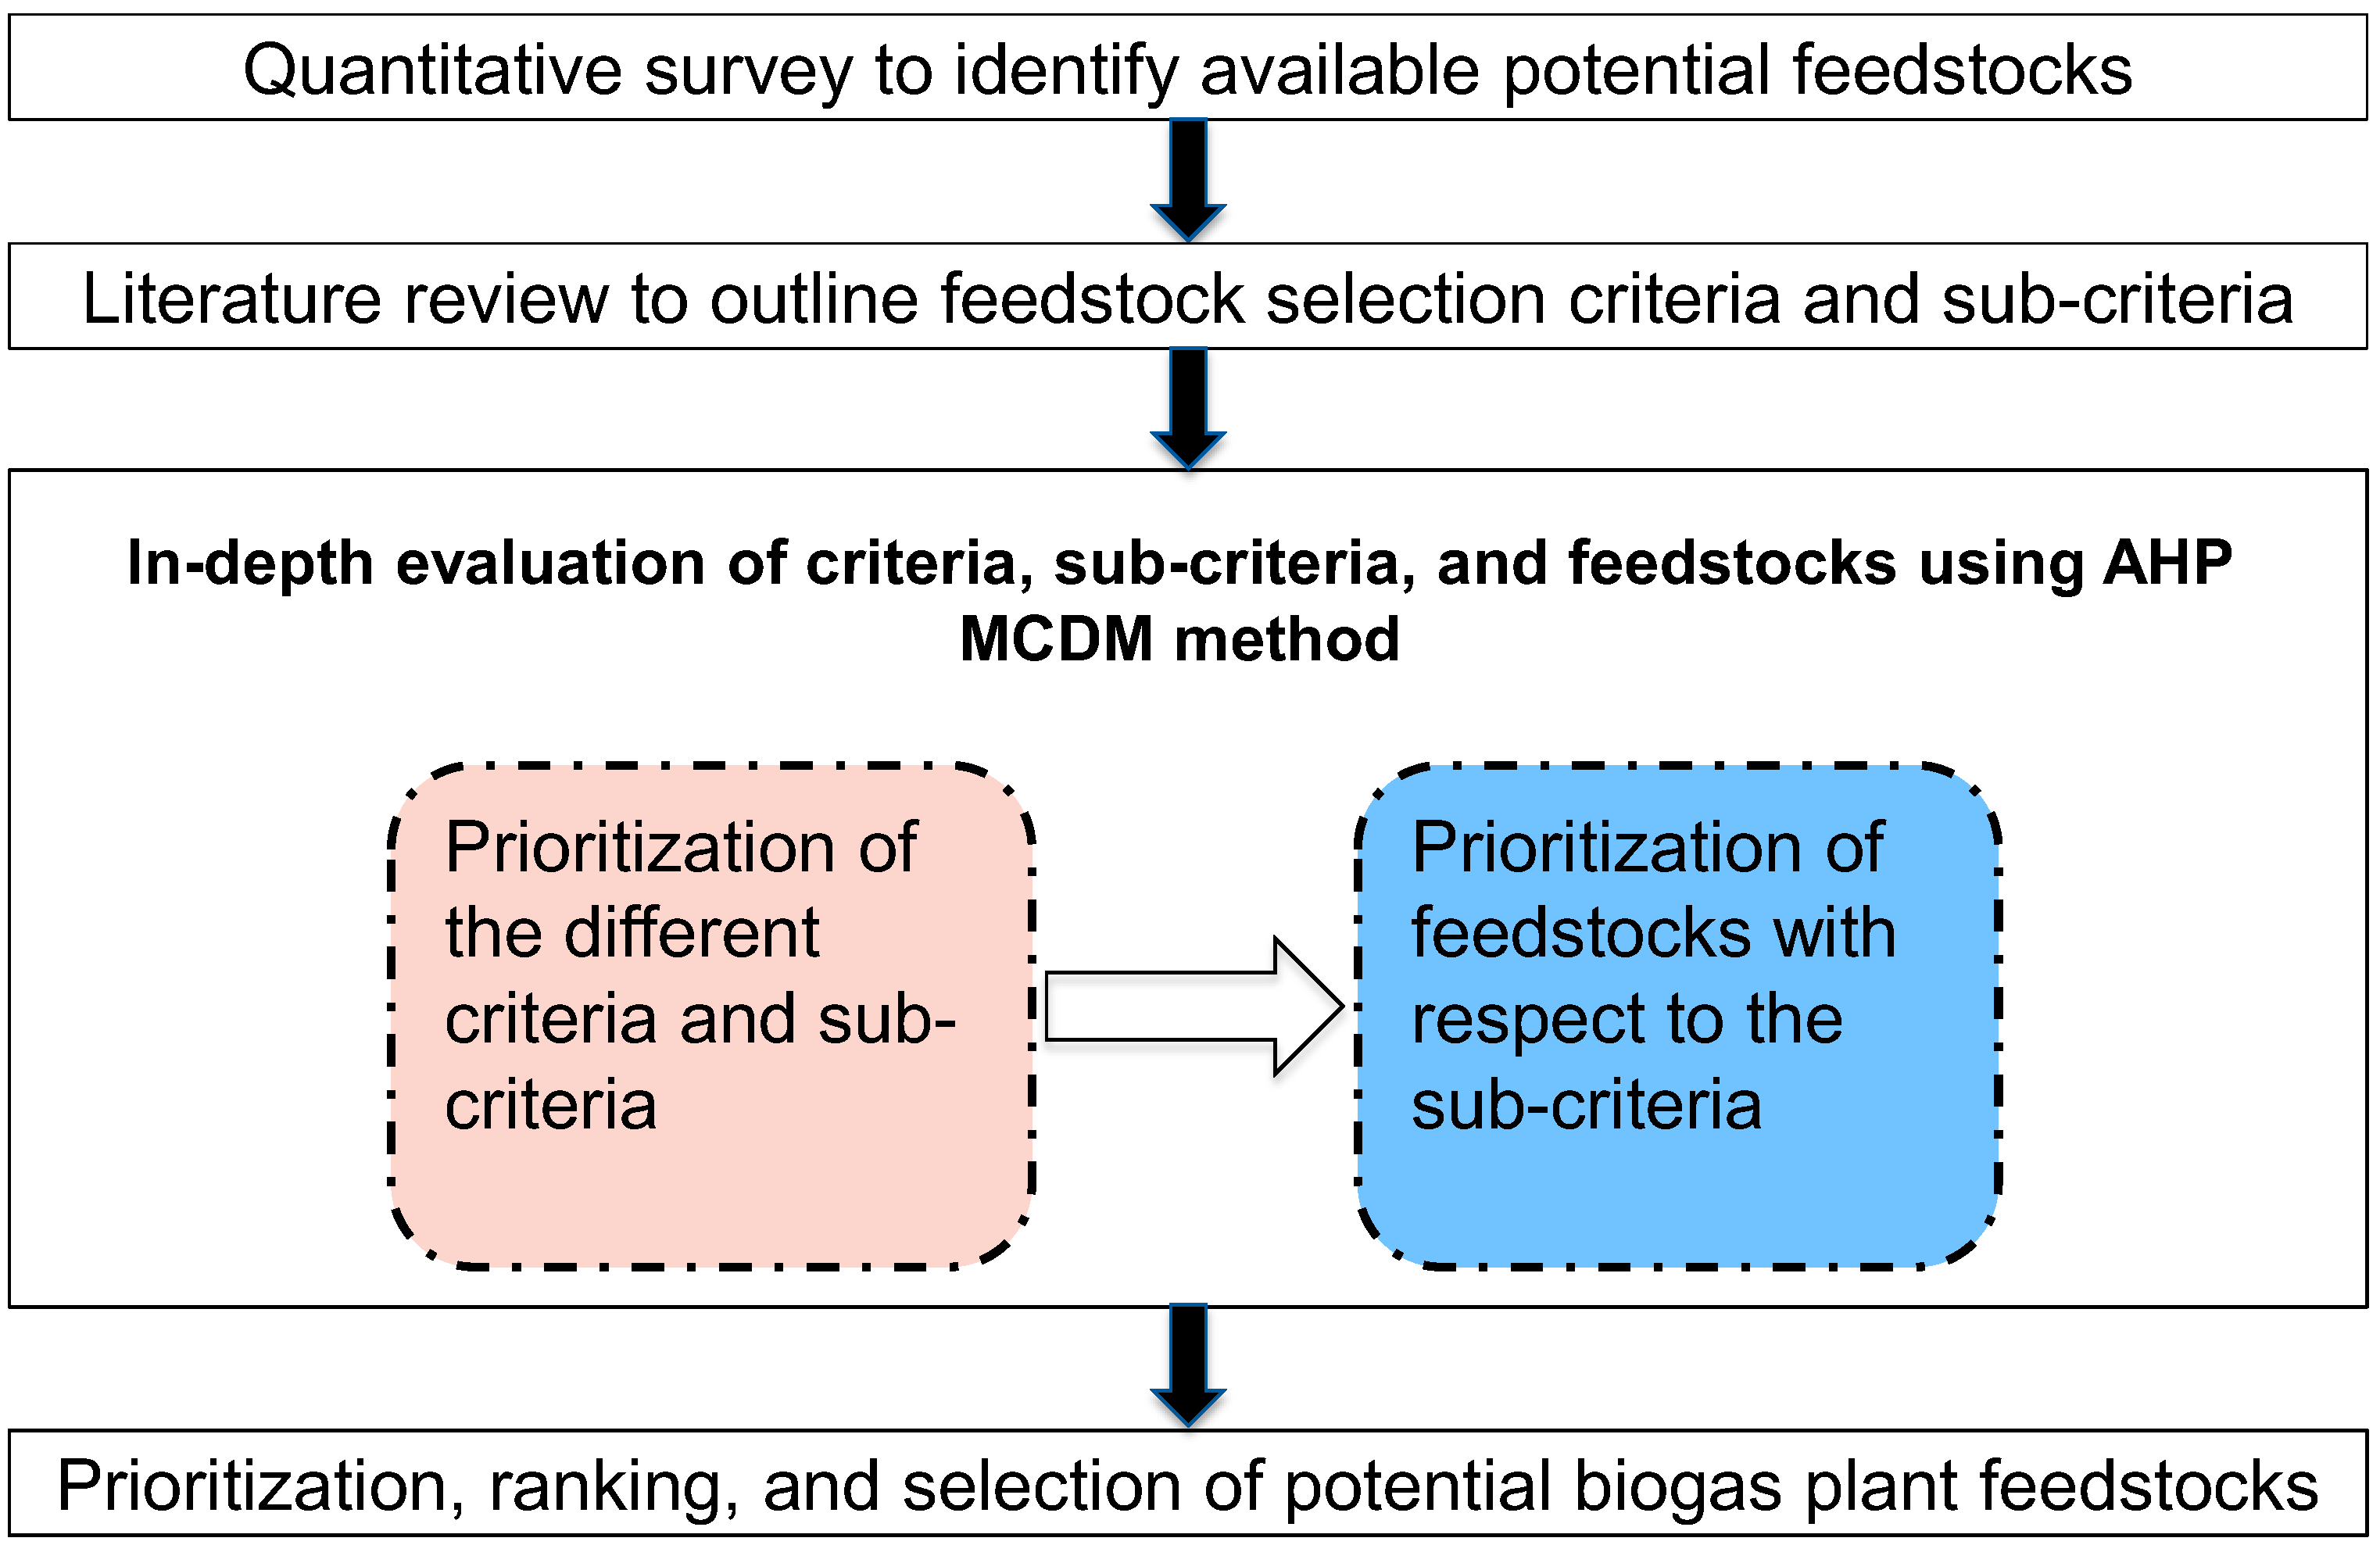
2. Materials and Methods
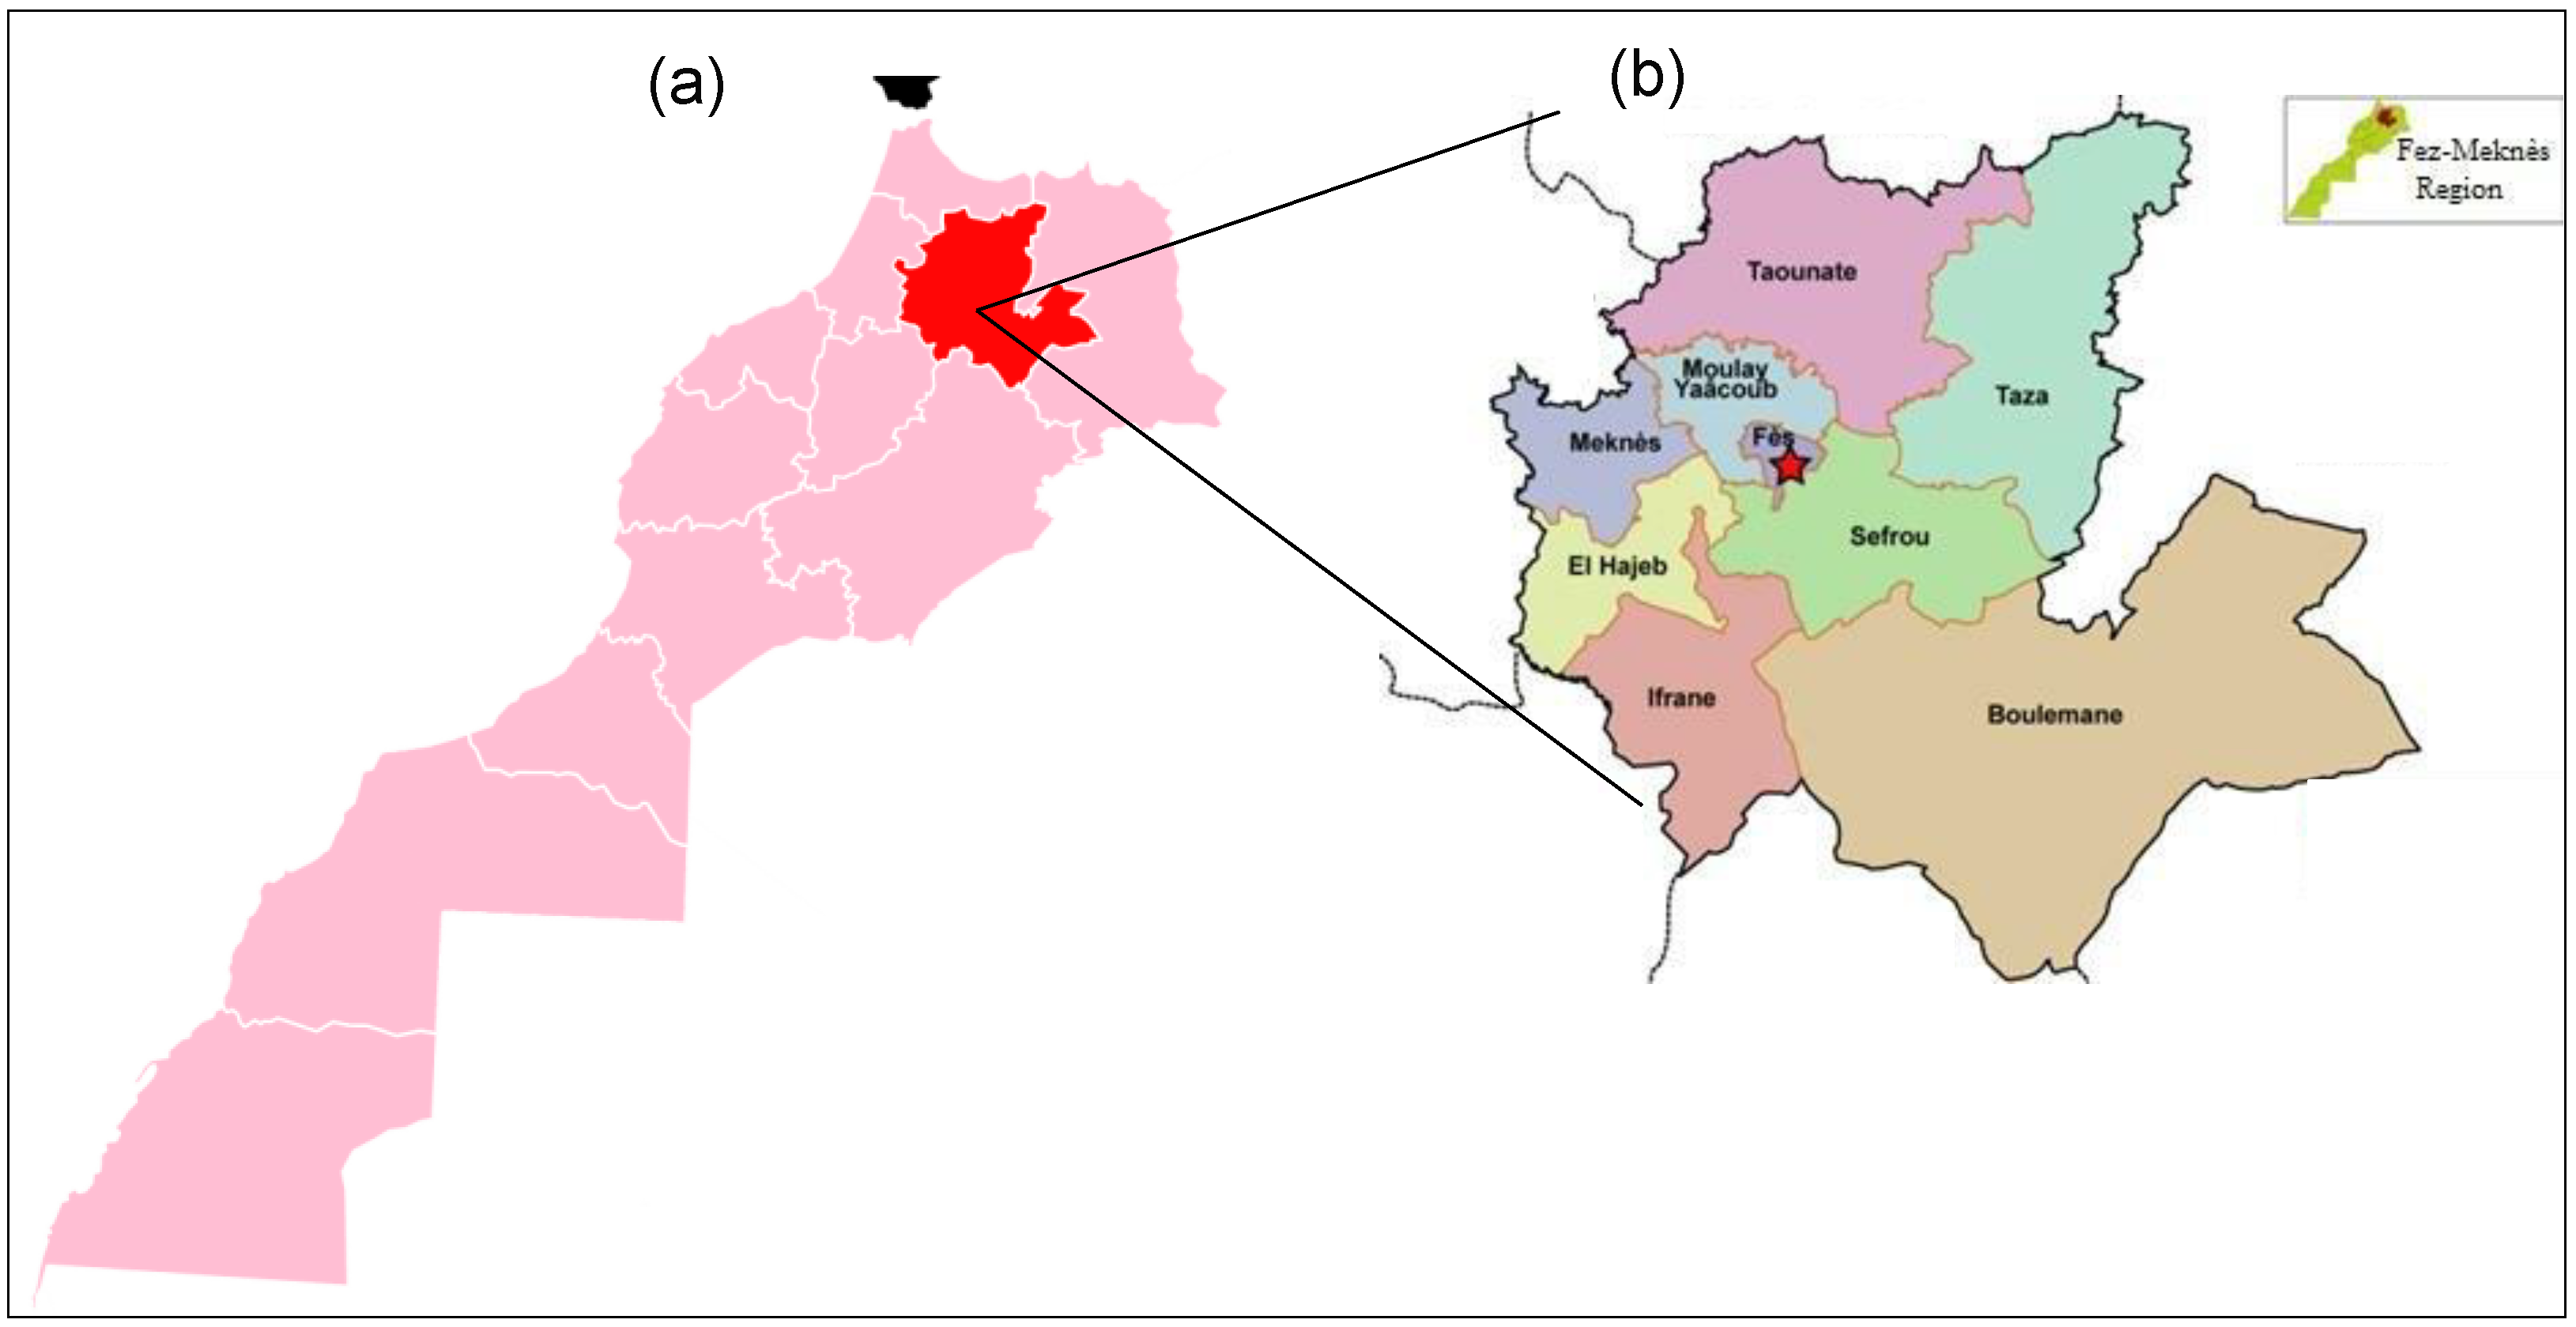
2.1. Feedstock Alternatives in the Fès-Meknès Region
2.2. Feedstock Selection Criteria and Sub-Criteria
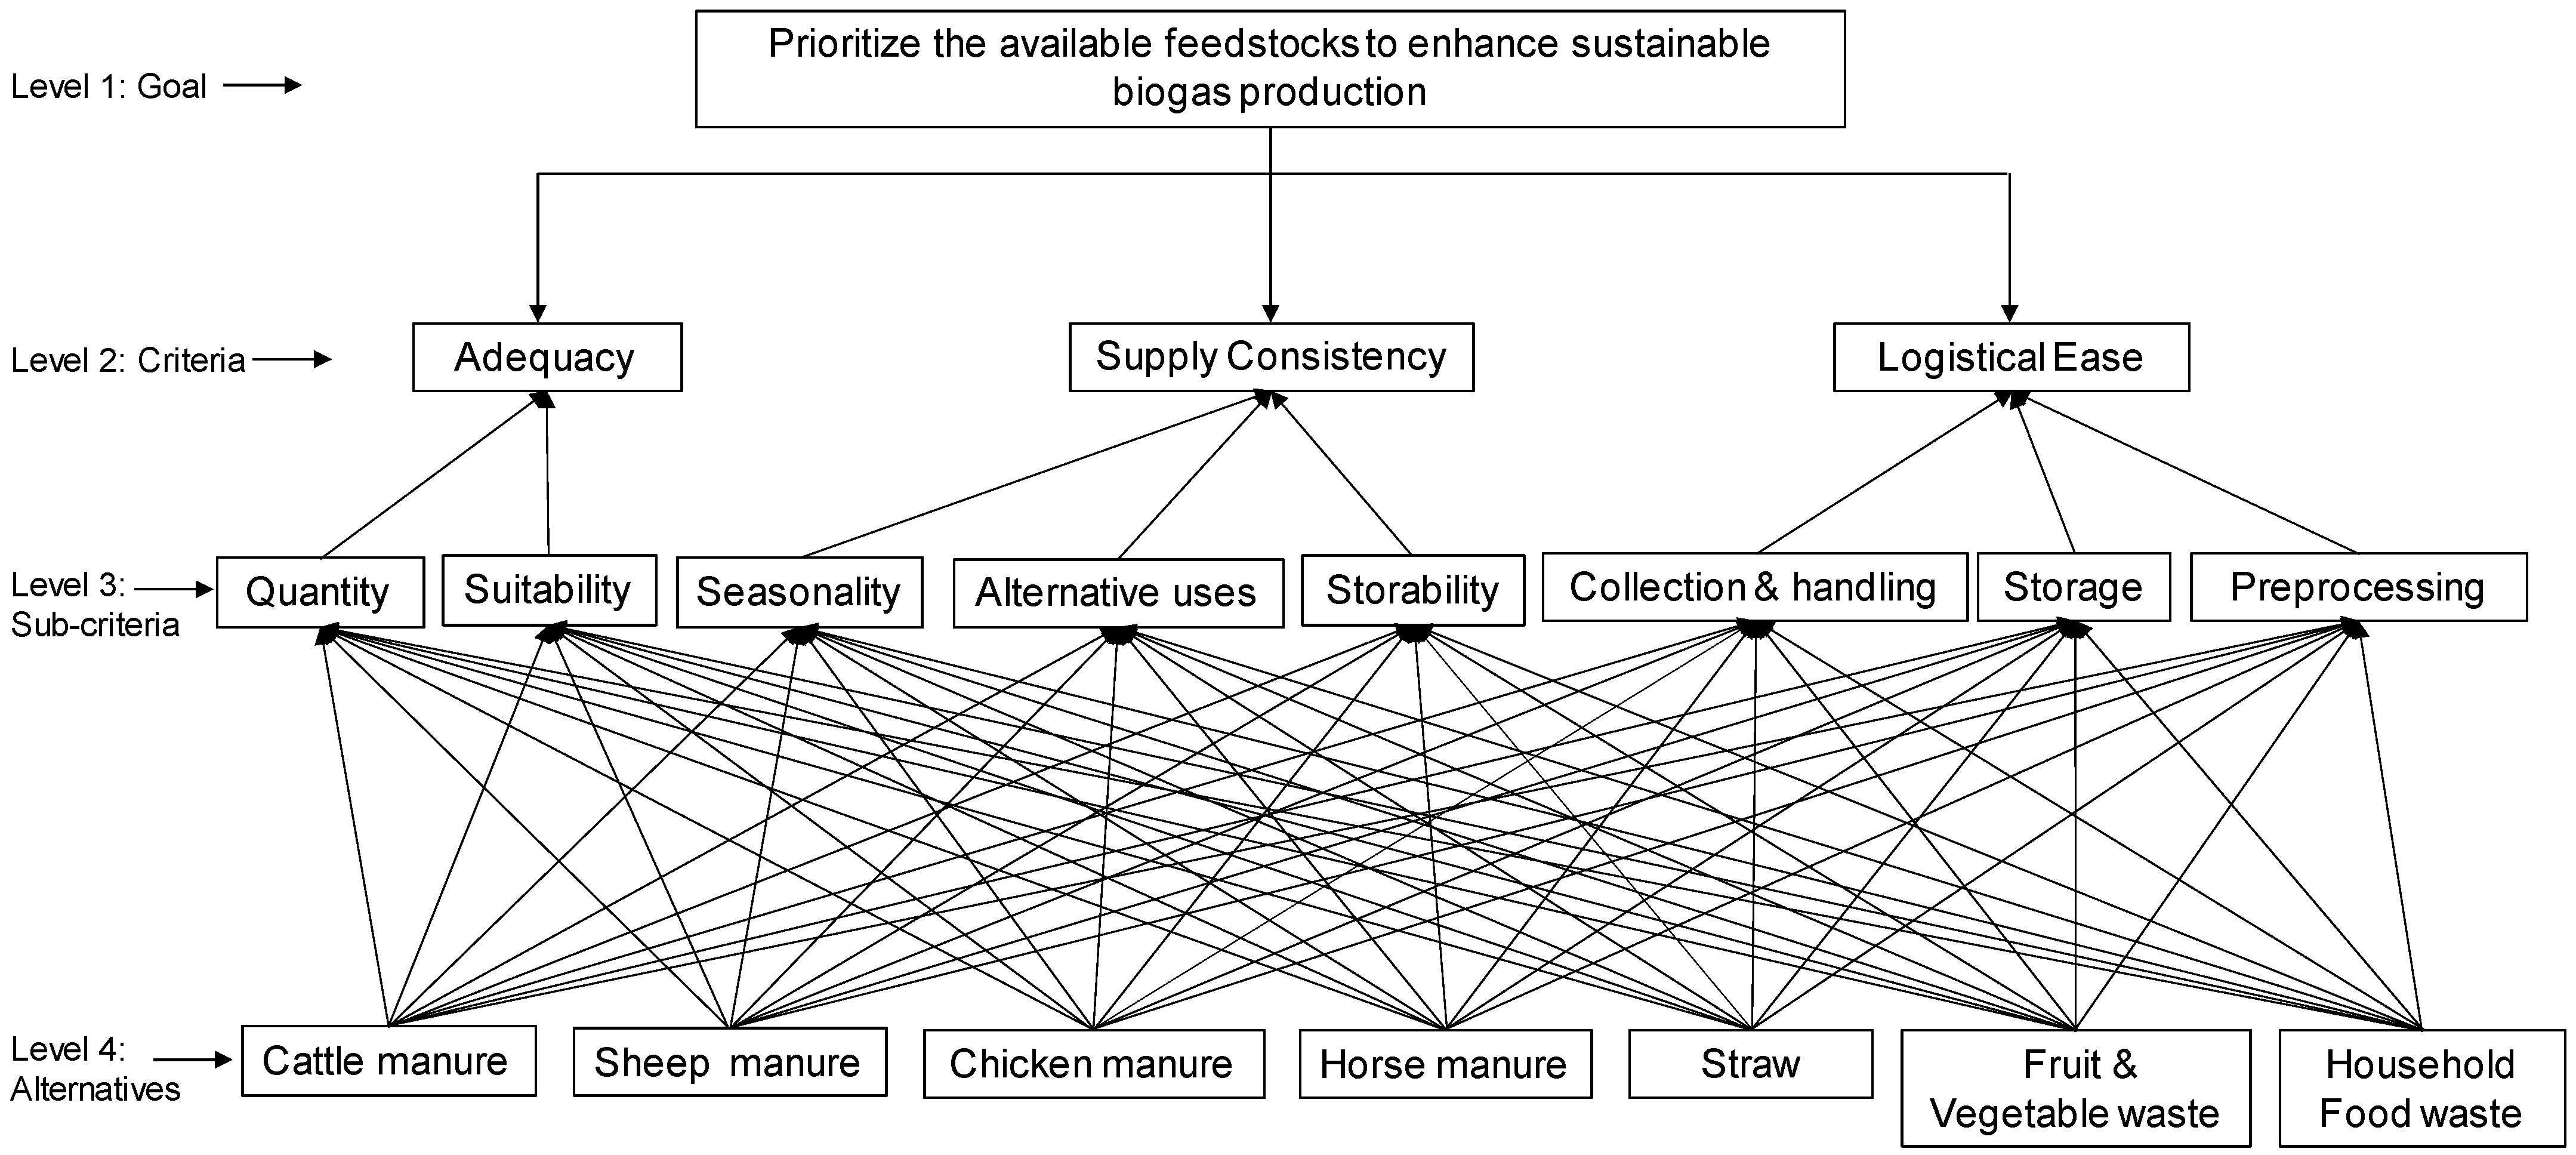
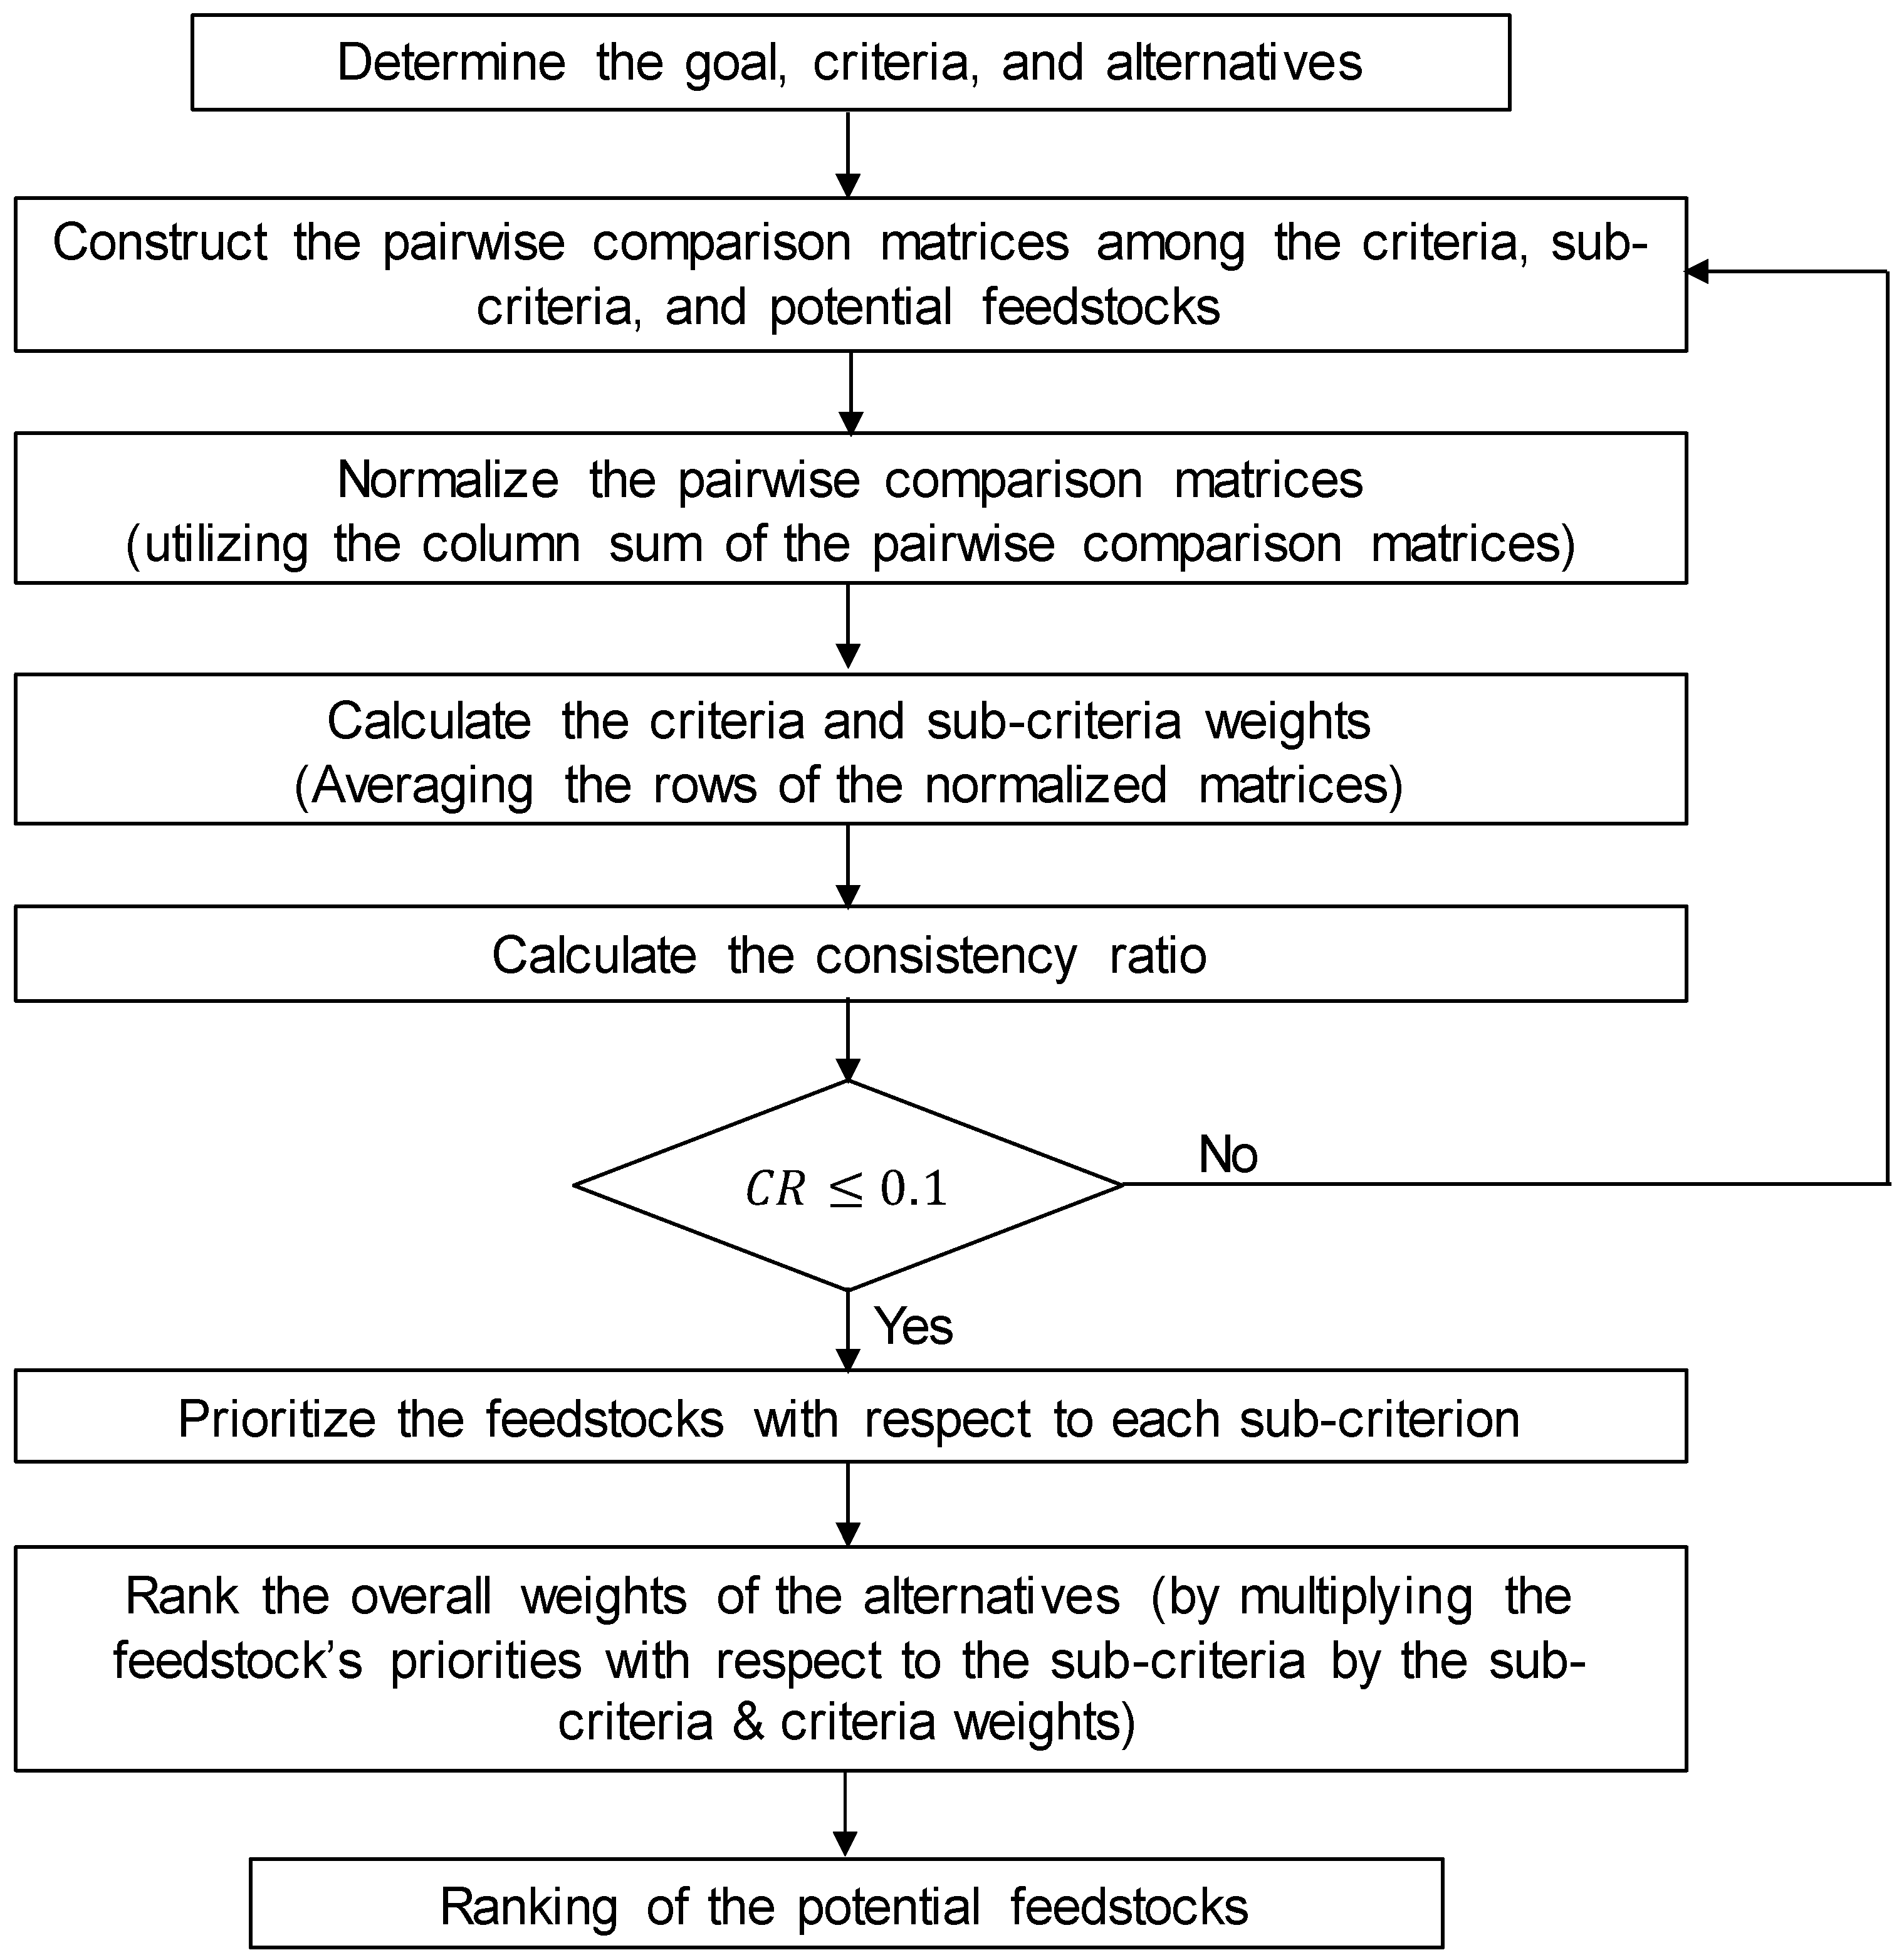
2.3. Application of AHP to Feedstock Prioritization and Selection
- Determine the goal, criteria, and alternatives;
- Using pairwise comparisons, create a set of judgements for all criteria;
- Calculate the relative weights of the different criteria;
- Verify the consistency of the judgements;
- Apply the same method to prioritize the different sub-criteria;
- Repeat for the different feedstocks with respect to each sub-criterion;
- Rank the different feedstocks based on the relative weights of the criteria, sub-criteria, and the prioritization with respect to each sub-criterion.
2.3.1. Pairwise Comparison Matrices
2.3.2. Consistency of the Judgements
3. Results and Discussion
3.1. Determination of Criteria Weights
3.2. Determination of Sub-Criteria Weights
3.3. Prioritization of Potential Biogas Plant Feedstocks
4. Conclusions and Recommendations
Author Contributions
Funding
Data Availability Statement
Acknowledgments
Conflicts of Interest
Appendix A. Pairwise Comparisons of the Criteria and Sub-Criteria

| Criteria | Sub-Criteria | ||
|---|---|---|---|
| C1 | Adequacy | SC1 | Quantity |
| SC2 | Suitability | ||
| C2 | Supply consistency | SC3 | Seasonality |
| SC4 | Alternative uses | ||
| SC5 | Storability (Seasonal) | ||
| C3 | Logistical ease | SC6 | Collection and handling effort |
| SC7 | Operational storage requirements | ||
| SC8 | Preprocessing requirements | ||
| Pairwise Comparison Matrix | Weight Matrix | |||||
|---|---|---|---|---|---|---|
| SC1 | SC2 | SC1 | SC2 | Weight | ||
| SC1 | 1.00 | 1.00 | SC1 | 0.23 | 0.33 | 50.0% |
| SC2 | 1.00 | 1.00 | SC2 | 0.08 | 0.11 | 50.0% |
| Total | 2.00 | 2.00 | ||||
| Pairwise Comparison Matrix | Weight Matrix | |||||||
|---|---|---|---|---|---|---|---|---|
| SC3 | SC4 | SC5 | SC3 | SC4 | SC5 | Weight | ||
| SC3 | 1.00 | 3.00 | 0.33 | SC3 | 0.23 | 0.33 | 0.22 | 26.05% |
| SC4 | 0.33 | 1.00 | 0.20 | SC4 | 0.08 | 0.11 | 0.13 | 10.62% |
| SC5 | 3.00 | 5.00 | 1.00 | SC5 | 0.69 | 0.56 | 0.65 | 63.33% |
| Total | 3.33 | 1.70 | 9.00 | |||||
| Pairwise Comparison Matrix | Weight Matrix | |||||||
|---|---|---|---|---|---|---|---|---|
| SC6 | SC7 | SC8 | SC6 | SC7 | SC8 | Weight | ||
| SC6 | 1.00 | 7.00 | 3.00 | SC6 | 0.68 | 0.64 | 0.69 | 66.87% |
| SC7 | 0.14 | 1.00 | 0.33 | SC7 | 0.10 | 0.09 | 0.08 | 8.82% |
| SC8 | 0.33 | 3.00 | 1.00 | SC8 | 0.23 | 0.27 | 0.23 | 24.31% |
| Total | 1.48 | 11.00 | 4.33 | |||||
Appendix B. Pairwise Comparisons of the Feedstock Alternatives with Respect to the Sub-Criteria
| Sub-Criteria | Feedstock Alternatives | ||
|---|---|---|---|
| SC1 | Quantity | A1 | Cattle manure |
| SC2 | Suitability | A2 | Sheep manure |
| SC3 | Seasonality | A3 | Chicken manure |
| SC4 | Alternative uses | A4 | Horse manure |
| SC5 | Storability (seasonal) | A5 | Straw |
| SC6 | Collection and handling | A6 | Fruit and vegetable waste |
| SC7 | Operational storage requirements | A7 | Household food waste |
| SC8 | Preprocessing requirements | ||
| A1 | A2 | A3 | A4 | A5 | A6 | A7 | |
| A1 | 1.00 | 5.00 | 9.00 | 9.00 | 5.00 | 3.00 | 9.00 |
| A2 | 0.20 | 1.00 | 5.00 | 5.00 | 0.33 | 3.00 | 7.00 |
| A3 | 0.11 | 0.20 | 1.00 | 1.00 | 0.20 | 0.20 | 1.00 |
| A4 | 0.11 | 0.20 | 1.00 | 1.00 | 0.14 | 0.14 | 1.00 |
| A5 | 0.20 | 3.00 | 5.00 | 7.00 | 1.00 | 3.00 | 7.00 |
| A6 | 0.33 | 0.33 | 5.00 | 7.00 | 0.33 | 1.00 | 7.00 |
| A7 | 0.11 | 0.14 | 1.00 | 1.00 | 0.14 | 0.14 | 1.00 |
| Sum | 2.07 | 9.88 | 27.00 | 31.00 | 7.15 | 10.49 | 33.00 |
| A1 | A2 | A3 | A4 | A5 | A6 | A7 | Weight | |
| A1 | 0.48 | 0.51 | 0.33 | 0.29 | 0.70 | 0.29 | 0.27 | 41.02% |
| A2 | 0.10 | 0.10 | 0.19 | 0.16 | 0.05 | 0.29 | 0.21 | 15.56% |
| A3 | 0.05 | 0.02 | 0.04 | 0.03 | 0.03 | 0.02 | 0.03 | 3.15% |
| A4 | 0.05 | 0.02 | 0.04 | 0.03 | 0.02 | 0.01 | 0.03 | 2.96% |
| A5 | 0.10 | 0.30 | 0.19 | 0.23 | 0.14 | 0.29 | 0.21 | 20.71% |
| A6 | 0.16 | 0.03 | 0.19 | 0.23 | 0.05 | 0.10 | 0.21 | 13.72% |
| A7 | 0.05 | 0.01 | 0.04 | 0.03 | 0.02 | 0.01 | 0.03 | 2.88% |
| A1 | A2 | A3 | A4 | A5 | A6 | A7 | |
| A1 | 1.00 | 3.00 | 5.00 | 7.00 | 9.00 | 5.00 | 3.00 |
| A2 | 0.33 | 1.00 | 3.00 | 3.00 | 7.00 | 3.00 | 3.00 |
| A3 | 0.20 | 0.33 | 1.00 | 3.00 | 7.00 | 3.00 | 3.00 |
| A4 | 0.14 | 0.33 | 0.33 | 1.00 | 5.00 | 3.00 | 3.00 |
| A5 | 0.11 | 0.14 | 0.14 | 0.20 | 1.00 | 0.33 | 0.20 |
| A6 | 0.20 | 0.33 | 0.33 | 0.33 | 3.00 | 1.00 | 0.33 |
| A7 | 0.33 | 0.33 | 0.33 | 0.33 | 5.00 | 3.00 | 1.00 |
| Sum | 2.32 | 5.48 | 10.14 | 14.87 | 37.00 | 18.33 | 13.53 |
| A1 | A2 | A3 | A4 | A5 | A6 | A7 | Weight | |
| A1 | 0.43 | 0.55 | 0.49 | 0.47 | 0.24 | 0.27 | 0.22 | 38.29% |
| A2 | 0.14 | 0.18 | 0.30 | 0.20 | 0.19 | 0.16 | 0.22 | 19.98% |
| A3 | 0.09 | 0.06 | 0.10 | 0.20 | 0.19 | 0.16 | 0.22 | 14.60% |
| A4 | 0.06 | 0.06 | 0.03 | 0.07 | 0.14 | 0.16 | 0.22 | 10.61% |
| A5 | 0.05 | 0.03 | 0.01 | 0.01 | 0.03 | 0.02 | 0.01 | 2.31% |
| A6 | 0.09 | 0.06 | 0.03 | 0.02 | 0.08 | 0.05 | 0.02 | 5.18% |
| A7 | 0.14 | 0.06 | 0.03 | 0.02 | 0.14 | 0.16 | 0.07 | 9.04% |
| A1 | A2 | A3 | A4 | A5 | A6 | A7 | |
| A1 | 1.00 | 3.00 | 5.00 | 1.00 | 9.00 | 7.00 | 1.00 |
| A2 | 0.33 | 1.00 | 3.00 | 1.00 | 7.00 | 5.00 | 1.00 |
| A3 | 0.20 | 0.33 | 1.00 | 0.33 | 7.00 | 7.00 | 0.33 |
| A4 | 1.00 | 1.00 | 3.00 | 1.00 | 7.00 | 5.00 | 1.00 |
| A5 | 0.11 | 0.14 | 0.14 | 0.14 | 1.00 | 0.33 | 0.20 |
| A6 | 0.14 | 0.20 | 0.14 | 0.20 | 3.00 | 1.00 | 0.14 |
| A7 | 1.00 | 1.00 | 3.00 | 1.00 | 5.00 | 7.00 | 1.00 |
| Sum | 3.79 | 6.68 | 15.29 | 4.68 | 39.00 | 32.33 | 4.68 |
| A1 | A2 | A3 | A4 | A5 | A6 | A7 | Weight | |
| A1 | 0.26 | 0.45 | 0.33 | 0.21 | 0.23 | 0.22 | 0.21 | 27.36% |
| A2 | 0.09 | 0.15 | 0.20 | 0.21 | 0.18 | 0.15 | 0.21 | 17.08% |
| A3 | 0.05 | 0.05 | 0.07 | 0.07 | 0.18 | 0.22 | 0.07 | 10.10% |
| A4 | 0.26 | 0.15 | 0.20 | 0.21 | 0.18 | 0.15 | 0.21 | 19.60% |
| A5 | 0.03 | 0.02 | 0.01 | 0.03 | 0.03 | 0.01 | 0.04 | 2.42% |
| A6 | 0.04 | 0.03 | 0.01 | 0.04 | 0.08 | 0.03 | 0.03 | 3.69% |
| A7 | 0.26 | 0.15 | 0.20 | 0.21 | 0.13 | 0.22 | 0.21 | 19.75% |
| A1 | A2 | A3 | A4 | A5 | A6 | A7 | |
| A1 | 1.00 | 1.00 | 1.00 | 1.00 | 9.00 | 5.00 | 3.00 |
| A2 | 1.00 | 1.00 | 1.00 | 1.00 | 7.00 | 5.00 | 3.00 |
| A3 | 1.00 | 1.00 | 1.00 | 1.00 | 7.00 | 5.00 | 3.00 |
| A4 | 1.00 | 1.00 | 1.00 | 1.00 | 7.00 | 5.00 | 3.00 |
| A5 | 0.11 | 0.14 | 0.14 | 0.14 | 1.00 | 0.33 | 0.33 |
| A6 | 0.20 | 0.20 | 0.20 | 0.20 | 3.00 | 1.00 | 1.00 |
| A7 | 0.33 | 0.33 | 0.33 | 0.33 | 3.00 | 1.00 | 1.00 |
| Sum | 4.64 | 4.68 | 4.68 | 4.68 | 37.00 | 22.33 | 14.33 |
| A1 | A2 | A3 | A4 | A5 | A6 | A7 | Weight | |
| A1 | 0.22 | 0.21 | 0.21 | 0.21 | 0.24 | 0.22 | 0.21 | 21.90% |
| A2 | 0.22 | 0.21 | 0.21 | 0.21 | 0.19 | 0.22 | 0.21 | 21.13% |
| A3 | 0.22 | 0.21 | 0.21 | 0.21 | 0.19 | 0.22 | 0.21 | 21.13% |
| A4 | 0.22 | 0.21 | 0.21 | 0.21 | 0.19 | 0.22 | 0.21 | 21.13% |
| A5 | 0.02 | 0.03 | 0.03 | 0.03 | 0.03 | 0.01 | 0.02 | 2.58% |
| A6 | 0.04 | 0.04 | 0.04 | 0.04 | 0.08 | 0.04 | 0.07 | 5.24% |
| A7 | 0.07 | 0.07 | 0.07 | 0.07 | 0.08 | 0.04 | 0.07 | 6.87% |
| A1 | A2 | A3 | A4 | A5 | A6 | A7 | |
| A1 | 1.00 | 0.33 | 0.33 | 0.33 | 0.11 | 3.00 | 3.00 |
| A2 | 3.00 | 1.00 | 1.00 | 1.00 | 0.20 | 3.00 | 3.00 |
| A3 | 3.00 | 1.00 | 1.00 | 1.00 | 0.20 | 3.00 | 3.00 |
| A4 | 3.00 | 1.00 | 1.00 | 1.00 | 0.20 | 3.00 | 3.00 |
| A5 | 9.00 | 5.00 | 5.00 | 5.00 | 1.00 | 7.00 | 7.00 |
| A6 | 0.33 | 0.33 | 0.33 | 0.33 | 0.14 | 1.00 | 1.00 |
| A7 | 0.33 | 0.33 | 0.33 | 0.33 | 0.14 | 1.00 | 1.00 |
| Sum | 19.67 | 9.00 | 9.00 | 9.00 | 2.00 | 21.00 | 21.00 |
| A1 | A2 | A3 | A4 | A5 | A6 | A7 | Weight | |
| A1 | 0.05 | 0.04 | 0.04 | 0.04 | 0.06 | 0.14 | 0.14 | 7.19% |
| A2 | 0.15 | 0.11 | 0.11 | 0.11 | 0.10 | 0.14 | 0.14 | 12.45% |
| A3 | 0.15 | 0.11 | 0.11 | 0.11 | 0.10 | 0.14 | 0.14 | 12.45% |
| A4 | 0.15 | 0.11 | 0.11 | 0.11 | 0.10 | 0.14 | 0.14 | 12.45% |
| A5 | 0.46 | 0.56 | 0.56 | 0.56 | 0.50 | 0.33 | 0.33 | 47.03% |
| A6 | 0.02 | 0.04 | 0.04 | 0.04 | 0.07 | 0.05 | 0.05 | 4.21% |
| A7 | 0.02 | 0.04 | 0.04 | 0.04 | 0.07 | 0.05 | 0.05 | 4.21% |
| A1 | A2 | A3 | A4 | A5 | A6 | A7 | |
| A1 | 1.00 | 5.00 | 7.00 | 5.00 | 9.00 | 7.00 | 1.00 |
| A2 | 0.20 | 1.00 | 3.00 | 1.00 | 7.00 | 5.00 | 0.33 |
| A3 | 0.14 | 0.33 | 1.00 | 0.33 | 5.00 | 3.00 | 0.33 |
| A4 | 0.20 | 1.00 | 3.00 | 1.00 | 5.00 | 5.00 | 0.33 |
| A5 | 0.11 | 0.14 | 0.20 | 0.20 | 1.00 | 1.00 | 0.20 |
| A6 | 0.14 | 0.20 | 0.33 | 0.20 | 1.00 | 1.00 | 0.20 |
| A7 | 1.00 | 3.00 | 3.00 | 3.00 | 5.00 | 5.00 | 1.00 |
| Sum | 2.80 | 10.68 | 17.53 | 10.73 | 33.00 | 27.00 | 3.40 |
| A1 | A2 | A3 | A4 | A5 | A6 | A7 | Weight | |
| A1 | 0.36 | 0.47 | 0.40 | 0.47 | 0.27 | 0.26 | 0.29 | 35.96% |
| A2 | 0.07 | 0.09 | 0.17 | 0.09 | 0.21 | 0.19 | 0.10 | 13.21% |
| A3 | 0.05 | 0.03 | 0.06 | 0.03 | 0.15 | 0.11 | 0.10 | 7.59% |
| A4 | 0.07 | 0.09 | 0.17 | 0.09 | 0.15 | 0.19 | 0.10 | 12.35% |
| A5 | 0.04 | 0.01 | 0.01 | 0.02 | 0.03 | 0.04 | 0.06 | 2.99% |
| A6 | 0.05 | 0.02 | 0.02 | 0.02 | 0.03 | 0.04 | 0.06 | 3.34% |
| A7 | 0.36 | 0.28 | 0.17 | 0.28 | 0.15 | 0.19 | 0.29 | 24.57% |
| A1 | A2 | A3 | A4 | A5 | A6 | A7 | |
| A1 | 1.00 | 1.00 | 1.00 | 1.00 | 7.00 | 3.00 | 3.00 |
| A2 | 1.00 | 1.00 | 1.00 | 1.00 | 5.00 | 3.00 | 3.00 |
| A3 | 1.00 | 1.00 | 1.00 | 1.00 | 5.00 | 3.00 | 3.00 |
| A4 | 1.00 | 1.00 | 1.00 | 1.00 | 5.00 | 3.00 | 3.00 |
| A5 | 0.14 | 0.20 | 0.20 | 0.20 | 1.00 | 3.00 | 3.00 |
| A6 | 0.33 | 0.33 | 0.33 | 0.33 | 0.33 | 1.00 | 3.00 |
| A7 | 0.33 | 0.33 | 0.33 | 0.33 | 0.33 | 0.33 | 1.00 |
| Sum | 4.81 | 4.87 | 4.87 | 4.87 | 23.67 | 16.33 | 19.00 |
| A1 | A2 | A3 | A4 | A5 | A6 | A7 | Weight | |
| A1 | 0.21 | 0.21 | 0.21 | 0.21 | 0.30 | 0.18 | 0.16 | 20.88% |
| A2 | 0.21 | 0.21 | 0.21 | 0.21 | 0.21 | 0.18 | 0.16 | 19.67% |
| A3 | 0.21 | 0.21 | 0.21 | 0.21 | 0.21 | 0.18 | 0.16 | 19.67% |
| A4 | 0.21 | 0.21 | 0.21 | 0.21 | 0.21 | 0.18 | 0.16 | 19.67% |
| A5 | 0.03 | 0.04 | 0.04 | 0.04 | 0.04 | 0.18 | 0.16 | 7.67% |
| A6 | 0.07 | 0.07 | 0.07 | 0.07 | 0.01 | 0.06 | 0.16 | 7.26% |
| A7 | 0.07 | 0.07 | 0.07 | 0.07 | 0.01 | 0.02 | 0.05 | 5.17% |
| A1 | A2 | A3 | A4 | A5 | A6 | A7 | |
| A1 | 1.00 | 1.00 | 3.00 | 3.00 | 7.00 | 5.00 | 3.00 |
| A2 | 1.00 | 1.00 | 1.00 | 3.00 | 5.00 | 5.00 | 3.00 |
| A3 | 0.33 | 1.00 | 1.00 | 1.00 | 5.00 | 3.00 | 3.00 |
| A4 | 0.33 | 0.33 | 1.00 | 1.00 | 5.00 | 3.00 | 3.00 |
| A5 | 0.14 | 0.20 | 0.20 | 0.20 | 1.00 | 0.14 | 0.20 |
| A6 | 0.20 | 0.20 | 0.33 | 0.33 | 7.00 | 1.00 | 3.00 |
| A7 | 0.33 | 0.33 | 0.33 | 0.33 | 5.00 | 0.33 | 1.00 |
| Sum | 4.81 | 4.87 | 4.87 | 4.87 | 23.67 | 16.33 | 19.00 |
| A1 | A2 | A3 | A4 | A5 | A6 | A7 | Weight | |
| A1 | 0.30 | 0.25 | 0.44 | 0.34 | 0.20 | 0.29 | 0.19 | 28.45% |
| A2 | 0.30 | 0.25 | 0.15 | 0.34 | 0.14 | 0.29 | 0.19 | 23.47% |
| A3 | 0.10 | 0.25 | 0.15 | 0.11 | 0.14 | 0.17 | 0.19 | 15.77% |
| A4 | 0.10 | 0.08 | 0.15 | 0.11 | 0.14 | 0.17 | 0.19 | 13.43% |
| A5 | 0.04 | 0.05 | 0.03 | 0.02 | 0.03 | 0.01 | 0.01 | 2.75% |
| A6 | 0.06 | 0.05 | 0.05 | 0.04 | 0.20 | 0.06 | 0.19 | 9.11% |
| A7 | 0.10 | 0.08 | 0.05 | 0.04 | 0.14 | 0.02 | 0.06 | 7.02% |
References
- Orskov, E.R.; Anchang, K.Y.; Subedi, M.; Smith, J. Overview of holistic application of biogas for small scale farmers in Sub-Saharan Africa. Biomass Bioenergy 2014, 70, 4–16. [Google Scholar] [CrossRef]
- Sawyerr, N.; Trois, C.; Workneh, T. Identification and Characterization of Potential Feedstock for Biogas Production in South Africa. J. Ecol. Eng. 2019, 20, 103–116. [Google Scholar] [CrossRef] [PubMed]
- World Biogas Association. Global Potential of Biogas. 2019. Available online: http://www.worldbiogasassociation.org/wp-content/uploads/2019/09/WBA-execsummary-4ppa4_digital-Sept-2019.pdf (accessed on 9 August 2024).
- Bennitt, F.B.; Wozniak, S.S.; Causey, K.; Burkart, K.; Brauer, M. Estimating disease burden attributable to household air pollution: New methods within the Global Burden of Disease Study. Lancet Glob. Health 2021, 9, S18. [Google Scholar] [CrossRef]
- World Biogas Association. Global Bioenergy Statistics Report. 2023. Available online: https://www.worldbioenergy.org/uploads/231219%20GBS%20Report.pdf (accessed on 8 September 2024).
- IEA. Outlook for Biogas and Biomethane: Prospects for Organic Growth. 2020. Available online: https://www.iea.org/reports/outlook-for-biogas-and-biomethane-prospects-for-organic-growth (accessed on 12 August 2024).
- Bond, T.; Templeton, M.R. History and future of domestic biogas plants in the developing world. Energy Sustain. Dev. 2011, 15, 347–354. [Google Scholar] [CrossRef]
- Pilloni, M.; Hamed, T.A. Small-Size Biogas Technology Applications for Rural Areas in the Context of Developing Countries. In Anaerobic Digestion in Built Environments; Sikora, A., Ed.; IntechOpen: London, UK, 2021. [Google Scholar]
- FACT Foundation. Manual for the Construction and Operation of Small and Medium Size Biogas Systems. Available online: https://www.bioenergyforumfact.org/sites/default/files/2018-04/10.%20Manual%20for%20the%20construction%20and%20operation%20of%20small%20and%20medium%20size%20biogas%20systems.pdf (accessed on 15 July 2024).
- Lwiza, F.; Mugisha, J.; Walekhwa, P.N.; Smith, J.; Balana, B. Dis-adoption of Household Biogas technologies in Central Uganda. Energy Sustain. Dev. 2017, 37, 124–132. [Google Scholar] [CrossRef]
- Paramonova, K.; Mazancová, J.; Roubík, H. Dis-adoption of small-scale biogas plants in Vietnam: What is their fate? Environ. Sci. Pollut. Res. Int. 2023, 30, 2329–2339. [Google Scholar] [CrossRef]
- Xie, M.; Cai, X.; Xu, Z.; Zhou, N.; Yan, D. Factors contributing to abandonment of household biogas digesters in rural China: A study of stakeholder perspectives using Q-methodology. Environ. Dev. Sustain. 2022, 24, 7698–7724. [Google Scholar] [CrossRef]
- Bhat, P.R.; Chanakya, H.N.; Ravindranath, N.H. Biogas plant dissemination: Success story of Sirsi, India. Energy Sustain. Dev. 2001, 5, 39–46. [Google Scholar] [CrossRef]
- Rahman, K.M.; Melville, L.; Edwards, D.J.; Fulford, D.; Thwala, W.D. Determination of the Potential Impact of Domestic Anaerobic Digester Systems: A Community Based Research Initiative in Rural Bangladesh. Processes 2019, 7, 512. [Google Scholar] [CrossRef]
- FAO. Biogas Systems in Rwanda—A Critical Review. 2021. Available online: https://openknowledge.fao.org/handle/20.500.14283/cb3409en (accessed on 11 June 2024).
- Mwirigi, J.; Balana, B.B.; Mugisha, J.; Walekhwa, P.; Melamu, R.; Nakami, S.; Makenzi, P. Socio-economic hurdles to widespread adoption of small-scale biogas digesters in Sub-Saharan Africa: A review. Biomass Bioenergy 2014, 70, 17–25. [Google Scholar] [CrossRef]
- Wu, T.; Xu, D.-L.; Yang, J.-B. A review on multiple criteria performance analysis of renewable energy systems. In Proceedings of the 2017 13th IEEE International Conference on Control & Automation (ICCA), Ohrid, Macedonia, 3–6 July 2017; pp. 822–827, ISBN 978-1-5386-2679-5. [Google Scholar]
- Jovanović, M.; Afgan, N.; Radovanović, P.; Stevanović, V. Sustainable development of the Belgrade energy system. Energy 2009, 34, 532–539. [Google Scholar] [CrossRef]
- Bozorg-Haddad, O.; Zolghadr-Asli, B.; Loáiciga, H. (Eds.) A Handbook on Multi-Attribute Decision-Making Methods, 1st ed.; Wiley: Boston, MA, USA, 2021; ISBN 9781119563495. [Google Scholar]
- Saaty, T.L. A scaling method for priorities in hierarchical structures. J. Math. Psychol. 1977, 15, 234–281. [Google Scholar] [CrossRef]
- Nhiavue, Y.; Lee, H.S.; Chisale, S.W.; Cabrera, J.S. Prioritization of Renewable Energy for Sustainable Electricity Generation and an Assessment of Floating Photovoltaic Potential in Lao PDR. Energies 2022, 15, 8243. [Google Scholar] [CrossRef]
- Mirjat, N.H.; Uqaili, M.; Harijan, K.; Mustafa, W.M.; Rahman, M.; Khan, M. Multi-Criteria Analysis of Electricity Generation Scenarios for Sustainable Energy Planning in Pakistan. Energies 2018, 11, 757. [Google Scholar] [CrossRef]
- Ossei-Bremang, R.N.; Kemausuor, F. A decision support system for the selection of sustainable biomass resources for bioenergy production. Environ. Syst. Decis. 2021, 41, 437–454. [Google Scholar] [CrossRef]
- Shao, M.; Han, Z.; Sun, J.; Xiao, C.; Zhang, S.; Zhao, Y. A review of multi-criteria decision making applications for renewable energy site selection. Renew. Energy 2020, 157, 377–403. [Google Scholar] [CrossRef]
- Yadav, P.; Yadav, S.; Singh, D.; Giri, B.S. Sustainable rural waste management using biogas technology: An analytical hierarchy process decision framework. Chemosphere 2022, 301, 134737. [Google Scholar] [CrossRef]
- Maleki-Ghelichi, E.; Sharifi, M. Prioritize and choose the best process of anaerobic digestion to produce energy from biomass using analytic hierarchy process (AHP). Geol. Ecol. Landsc. 2017, 1, 219–224. [Google Scholar] [CrossRef]
- Roy, B. Classement et choix en présence de points de vue multiples (la méthode ELECTRE). Rev. Française D’informatique Rech. Opérationnelle 1968, 2, 57–75. [Google Scholar]
- San Cristóbal Mateo, J.R. (Ed.) Multi Criteria Analysis in the Renewable Energy Industry; Springer: London, UK, 2011; ISBN 978-1-4471-2345-3. [Google Scholar]
- Akadiri, O.P. Development of a Multi-Criteria Approach for the Selection of Sustainable Materials for Building Projects. Ph.D. Thesis, University of Wolverhampton, Wolverhampton, UK, 2011. [Google Scholar]
- Ngetuny, J.; Hsaine, J.; Mabrouki, A.; Rachidi, F.; El Asli, A.; Zörner, W. Assessment of agricultural residues for small-scale biogas plants and adoption drivers: A case study of the Fès-Meknès region in Morocco. Biomass Convers. Biorefin. 2025. [Google Scholar] [CrossRef]
- MEME. “Feuille de Route Nationale pour la Valorisation Energétique de la Biomasse (Horizon 2030)”. 2021. Available online: https://www.mem.gov.ma/ (accessed on 27 October 2022).
- Fèz-Meknès|Ministry of Agriculture. Fèz-Meknès|Ministry of Agriculture. Available online: www.agriculture.gov.ma (accessed on 25 April 2023).
- IRENA. Measuring Small-Scale Biogas Capacity and Production. Available online: https://www.irena.org/-/media/Files/IRENA/Agency/Publication/2016/IRENA_Statistics_Measuring_small-scale_biogas_2016.pdf (accessed on 9 July 2024).
- Kingdom of Morocco. Agriculture in Figures 2018. 2019. Available online: http://www.abhatoo.net.ma/maalama-textuelle/developpement-economique-et-social/developpement-economique/reperes-du-developpement-economique/indicateurs-socio-economiques/le-maroc-en-chiffres-2018 (accessed on 11 July 2023).
- Kingdom of Morocco. Le Maroc en Chiffres. 2022. Available online: https://www.hcp.ma/downloads/Maroc-en-chiffres_t22407.html (accessed on 23 August 2024).
- United Nations Environment Programme. Food Waste Index Report 2021, Nairobi. 2024. Available online: https://www.unep.org/resources/report/unep-food-waste-index-report-2021 (accessed on 2 August 2024).
- Roubík, H.; Mazancová, J. Suitability of small-scale biogas systems based on livestock manure for the rural areas of Sumatra. Environ. Dev. 2020, 33, 100505. [Google Scholar] [CrossRef]
- Liebetrau, J.; O’Shea, R.; Wellisch, M.; Lyng, K.-A.; Bochmann, G.; McCabe, B.K.; Harris, P.W.; Lukehurst, C.; Kornatz, P.; Murphy, J.D. Potential and Utilization of Manure to Generate Biogas in Seven Countries. 2021. Available online: https://www.ieabioenergy.com/blog/publications/potential-and-utilization-of-manure-to-generate-biogas-in-seven-countries/ (accessed on 4 March 2024).
- Abubakar, A.M. Biodigester and Feedstock Type: Characteristic, Selection, and Global Biogas Production. J. Eng. Res. Sci. 2022, 1, 170–187. [Google Scholar] [CrossRef]
- Singh, R.; Hans, M.; Kumar, S.; Yadav, Y.K. Potential Feedstock for Sustainable Biogas Production and its Supply Chain Management. In Biogas Production: From Anaerobic Digestion to a Sustainable Bioenergy Industry, 1st ed.; Balagurusamy, N., Chandel, A.K., Eds.; Springer International Publishing; Springer: Cham, Switzerland, 2020; pp. 147–165. ISBN 978-3-030-58826-7. [Google Scholar]
- Saaty, T.L. How to make a decision: The analytic hierarchy process. Eur. J. Oper. Res. 1990, 48, 9–26. [Google Scholar] [CrossRef]
- Saaty, R.W. The Analytic Hierarchy Process—What it is and how it is used. Math. Model. 1987, 9, 161–176. [Google Scholar] [CrossRef]
- Lindfors, A. Assessing sustainability with multi-criteria methods: A methodologically focused literature review. Environ. Sustain. Indic. 2021, 12, 100149. [Google Scholar] [CrossRef]
- Paudel, S.R.; Banjara, S.P.; Choi, O.K.; Park, K.Y.; Kim, Y.M.; Lee, J.W. Pretreatment of agricultural biomass for anaerobic digestion: Current state and challenges. Bioresour. Technol. 2017, 245, 1194–1205. [Google Scholar] [CrossRef]
- Ngan, N.V.C.; Chan, F.M.S.; Nam, T.S.; van Thao, H.; Maguyon-Detras, M.C.; Hung, D.V.; Cuong, D.M.; van Hung, N. Anaerobic Digestion of Rice Straw for Biogas Production. In Sustainable Rice Straw Management; Gummert, M., Van Hung, N., Chivenge, P., Douthwaite, B., Eds.; Springer International Publishing: Cham, Switzerland, 2020; pp. 65–92. ISBN 978-3-030-32372-1. [Google Scholar]
- Ngetuny, J.; Zörner, W. Biogas in the Developing World: Feedstock Availability and Selection using Analytic Hierarchy Process. In Proceedings of the 33rd European Biomass Conference and Exhibition, Valencia, Spain, 9–12 June 2025. [Google Scholar]
| Livestock Type | Number of Farms (N) | Mean | Potential Feedstock (kg/day/head) * | Average Potential Feedstock (tonnes/year/farm) |
|---|---|---|---|---|
| Cattle | 44 | 11 ± 19 | 10 | 40.15 |
| Sheep | 39 | 45 ± 59 | 1 | 16.43 |
| Goats | 6 | 9 ± 5 | 1 | 3.29 |
| Chicken | 33 | 20 ± 12 | 0.08 | 0.58 |
| Horses | 16 | 2 ± 2 | 10 | 7.30 |
| Crop Type | Number of Farms |
|---|---|
| Wheat | 33 |
| Barley | 16 |
| Onions | 16 |
| Potatoes | 15 |
| Fruits | 12 |
| Maize/corn | 8 |
| Other crops * | 15 |
| Yield Range * (Tonnes) | Number of Farms | ||
|---|---|---|---|
| Wheat | Barley | Maize | |
| <1 | 8 | 4 | 4 |
| 1 to 5 | 15 | 4 | 2 |
| 6 to 10 | 4 | 1 | 1 |
| 11 to 20 | 1 | 1 | 1 |
| 21 to 30 | 1 | 0 | 0 |
| Over 30 | 1 | 1 | 0 |
| Criteria | Sub-Criteria | Description | Reference |
|---|---|---|---|
| C1: Adequacy | SC1: Quantity | This criterion evaluates whether the potential feedstock amount is available in sufficient quantities for use as feed to a biogas plant. | [38,39] |
| SC2: Suitability | This criterion analyses whether the potential feedstock has sufficient nutrient quantities and whether it is readily digestible in its collected form in a biogas plant. | [39,40] | |
| C2: Supply Consistency | SC3: Seasonality | This criterion looks at whether there are seasonal fluctuations in feedstock supply and availability. | [37,38] |
| SC4: Alternative uses | This criterion evaluates whether a particular feedstock typically has other competing uses that may affect its availability for use in biogas production. Feedstocks that have popular alternative uses are most often unavailable for utilization in biogas production. | [13] | |
| SC5: Storability | Storability is evaluated by considering whether the feedstock can be stored for extended periods without significant nutrient loss or degradation. This is particularly important for seasonal feedstocks. Storability minimizes the impacts of seasonal (long-term) and sudden shortages. | [23] | |
| C3: Logistical ease | SC6: Collection and handling | This criterion analyses the supply chain processes that are involved in the collection, handling, and transportation of the feedstock. It looks at whether the feedstock is typically collected within the vicinity of the biogas plant. | [23,37,40] |
| SC7: Operational storage | This criterion considers whether the feedstock requires storage to ease operations and act as short-term storage buffers. | [23,40] | |
| SC8: Preprocessing | This criterion evaluates whether the feedstock requires some sort of preprocessing after collection, hence requiring some sort of technology or equipment and, consequently, maintenance. |
| Intensity of Importance, | Explanation |
|---|---|
| 1 | Criterion/alternative i and j are equally important |
| 3 | Moderate importance of i-th criterion/alternative over the j-th |
| 5 | Strong preference of i-th criterion/alternative over the j-th |
| 7 | The i-th criterion/alternative is strongly favoured over the j-th, and its dominance is demonstrated in practice |
| 9 | The i-th criterion/alternative is absolutely favoured over the j-th |
| 2, 4, 6, 8 | Intermediate values between two adjacent judgements |
| Size of Matrix (n) | 1 | 2 | 3 | 4 | 5 | 6 | 7 | 8 | 9 | 10 |
| Random Consistency Index (RI) | 0 | 0 | 0.58 | 0.9 | 1.12 | 1.24 | 1.32 | 1.41 | 1.45 | 1.49 |
| Pairwise Comparison Matrix | Normalized Matrix | |||||||
|---|---|---|---|---|---|---|---|---|
| C1 | C2 | C3 | C1 | C2 | C3 | Weight | ||
| C1 | 1.00 | 0.50 | 3.00 | C1 | 0.30 | 0.29 | 0.33 | 0.309 |
| C2 | 2.00 | 1.00 | 5.00 | C2 | 0.67 | 0.59 | 0.56 | 0.581 |
| C3 | 0.33 | 0.20 | 1.00 | C3 | 0.10 | 0.12 | 0.17 | 0.110 |
| Total | 3.33 | 1.70 | 9.00 | |||||
| Level 2: Criteria | Level 3: Sub-Criteria | Sub-Criteria Weights | Consistency |
|---|---|---|---|
| C1: Adequacy | SC1: Quantity | 0.500 | |
| SC2: Suitability | 0.500 | ||
| C2: Supply Consistency | SC3: Seasonality | 0.260 | |
| SC4: Alternative uses | 0.106 | ||
| SC5: Storability | 0.633 | ||
| C3: Logistical ease | SC6: Collection and handling | 0.669 | 1 |
| SC7: Operational storage | 0.088 | ||
| SC8: Preprocessing | 0.243 |
| Level 2: Criteria | Criteria Weight | Rank | Level 3: Sub-Criteria | Standardized Sub-Criteria wt | Rank |
|---|---|---|---|---|---|
| C1: Adequacy | 0.3092 | 2 | SC1: Quantity | 0.1667 | 3 |
| SC2: Suitability | 0.1667 | 3 | |||
| C2: Supply Consistency | 0.5813 | 1 | SC3: Seasonality | 0.0868 | 5 |
| SC4: Alternative uses | 0.0354 | 7 | |||
| SC5: Storability | 0.2111 | 2 | |||
| C3: Logistical ease | 0.1096 | 3 | SC6: Collection and handling | 0.2229 | 1 |
| SC7: Operational storage | 0.0294 | 8 | |||
| SC8: Preprocessing | 0.0810 | 6 |
| Sub-Criteria | |||||||||
|---|---|---|---|---|---|---|---|---|---|
| SC1 | SC2 | SC3 | SC4 | SC5 | SC6 | SC7 | SC8 | ||
| 16.67% | 16.67% | 8.68% | 3.54% | 21.11% | 22.29% | 2.94% | 8.10% | ||
| A1 | Cattle manure | 0.4102 | 0.3829 | 0.2736 | 0.2190 | 0.0719 | 0.3596 | 0.2088 | 0.2845 |
| A2 | Sheep manure | 0.1556 | 0.1998 | 0.1708 | 0.2113 | 0.1245 | 0.1321 | 0.1967 | 0.2347 |
| A3 | Chicken manure | 0.0315 | 0.1460 | 0.1010 | 0.2113 | 0.1245 | 0.0759 | 0.1967 | 0.1577 |
| A4 | Horse manure | 0.0296 | 0.1061 | 0.1960 | 0.2113 | 0.1245 | 0.1235 | 0.1967 | 0.1343 |
| A5 | Straw | 0.2071 | 0.0231 | 0.0242 | 0.0258 | 0.4703 | 0.0299 | 0.0767 | 0.0275 |
| A6 | Fruit and vegetable waste | 0.1372 | 0.0518 | 0.0369 | 0.0524 | 0.0421 | 0.0334 | 0.0726 | 0.0911 |
| A7 | Household food waste | 0.0288 | 0.0904 | 0.1975 | 0.0687 | 0.0421 | 0.2457 | 0.0517 | 0.0702 |
| Criteria | ||||||
|---|---|---|---|---|---|---|
| C1 | C2 | C3 | ||||
| 30.92% | 58.13% | 10.96% | Overall Weight | Ranking | ||
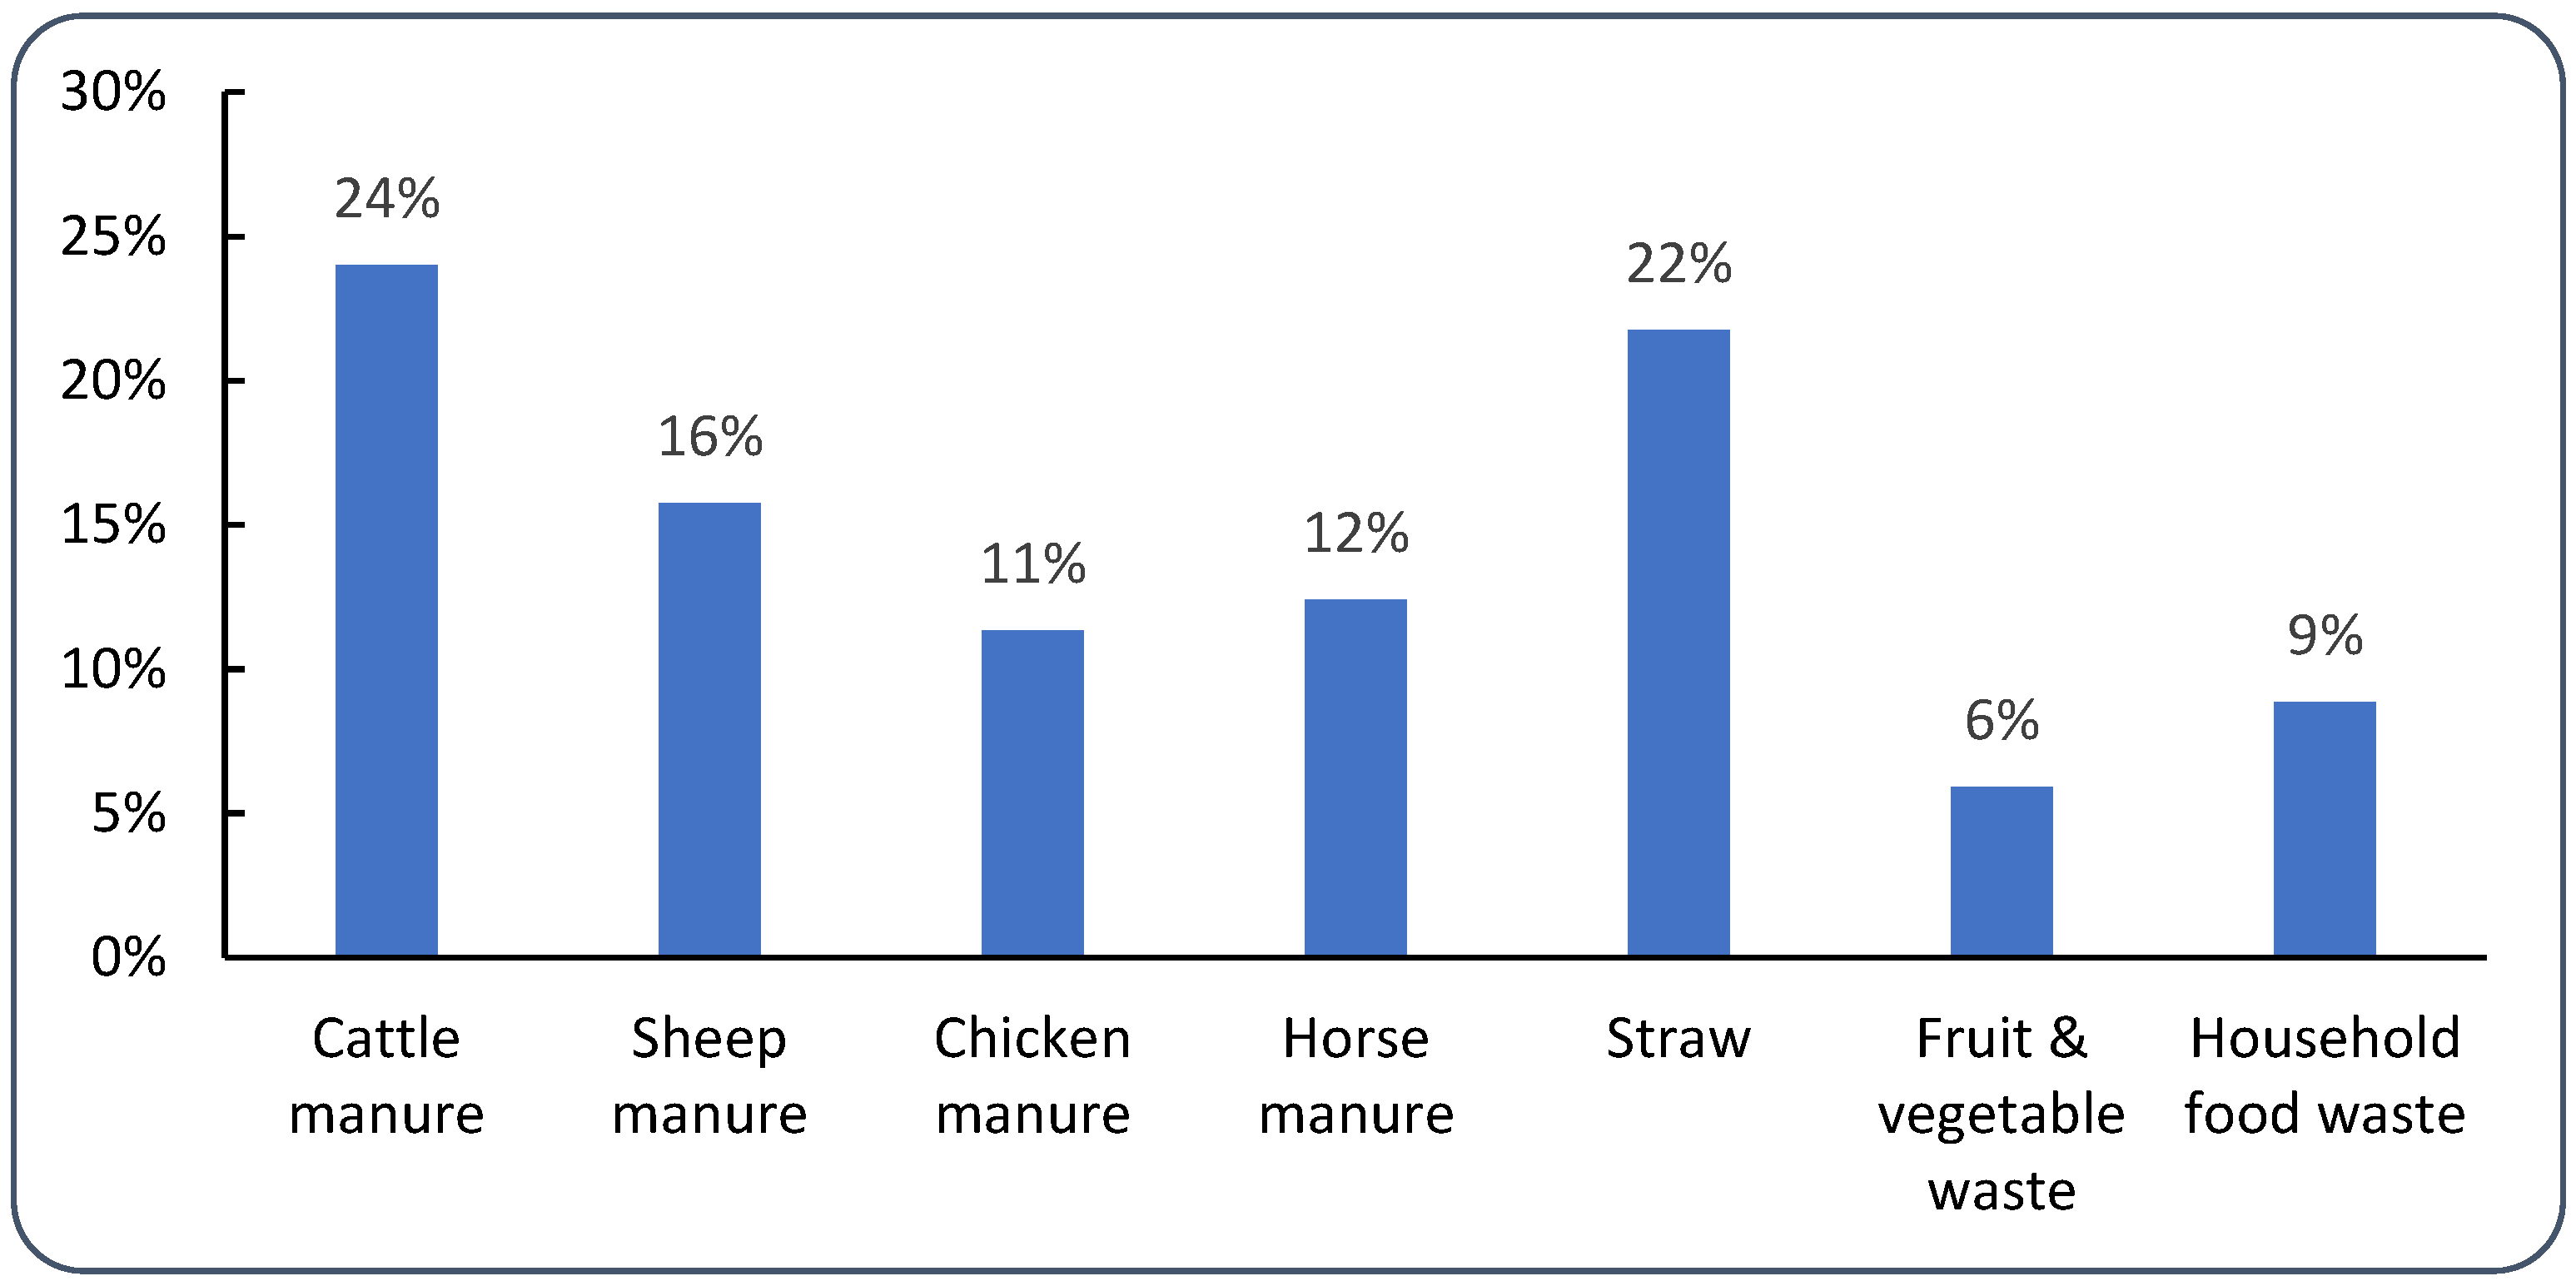
| A1 | Cattle manure | 0.1322 | 0.0467 | 0.1093 | 24.00% | 1 |
| A2 | Sheep manure | 0.0592 | 0.0486 | 0.0543 | 15.75% | 3 |
| A3 | Chicken manure | 0.0296 | 0.0425 | 0.0355 | 11.33% | 5 |
| A4 | Horse manure | 0.0226 | 0.0508 | 0.0442 | 12.41% | 4 |
| A5 | Straw | 0.0384 | 0.1023 | 0.0112 | 21.76% | 2 |
| A6 | Fruit and vegetable waste | 0.0315 | 0.0140 | 0.0170 | 5.91% | 7 |
| A7 | Household food waste | 0.0199 | 0.0285 | 0.0620 | 8.84% | 6 |
Disclaimer/Publisher’s Note: The statements, opinions and data contained in all publications are solely those of the individual author(s) and contributor(s) and not of MDPI and/or the editor(s). MDPI and/or the editor(s) disclaim responsibility for any injury to people or property resulting from any ideas, methods, instructions or products referred to in the content. |
© 2025 by the authors. Licensee MDPI, Basel, Switzerland. This article is an open access article distributed under the terms and conditions of the Creative Commons Attribution (CC BY) license (https://creativecommons.org/licenses/by/4.0/).
Share and Cite
Ngetuny, J.; Baldauf, T.; Zörner, W. Optimizing Feedstock Selection for Sustainable Small-Scale Biogas Systems Using the Analytic Hierarchy Process. Energies 2025, 18, 1739. https://doi.org/10.3390/en18071739
Ngetuny J, Baldauf T, Zörner W. Optimizing Feedstock Selection for Sustainable Small-Scale Biogas Systems Using the Analytic Hierarchy Process. Energies. 2025; 18(7):1739. https://doi.org/10.3390/en18071739
Chicago/Turabian StyleNgetuny, Joshua, Tobias Baldauf, and Wilfried Zörner. 2025. "Optimizing Feedstock Selection for Sustainable Small-Scale Biogas Systems Using the Analytic Hierarchy Process" Energies 18, no. 7: 1739. https://doi.org/10.3390/en18071739
APA StyleNgetuny, J., Baldauf, T., & Zörner, W. (2025). Optimizing Feedstock Selection for Sustainable Small-Scale Biogas Systems Using the Analytic Hierarchy Process. Energies, 18(7), 1739. https://doi.org/10.3390/en18071739