3.2. Dynamic Response of 15 MW OWT Excited by Common Wind, Wave, and Current
The dynamic response of the 15 MW JOWT under the combined wind––wave–current excitation was analyzed in this section, with a focus on SSI effects. To account for wind field stochasticity, six statistically independent three-dimensional turbulent wind fields were generated via different random seeds for each mean wind speed. Additionally, to eliminate transient effects caused by initial conditions (e.g., turbine start-up), numerical results of the first 100 s were discarded.
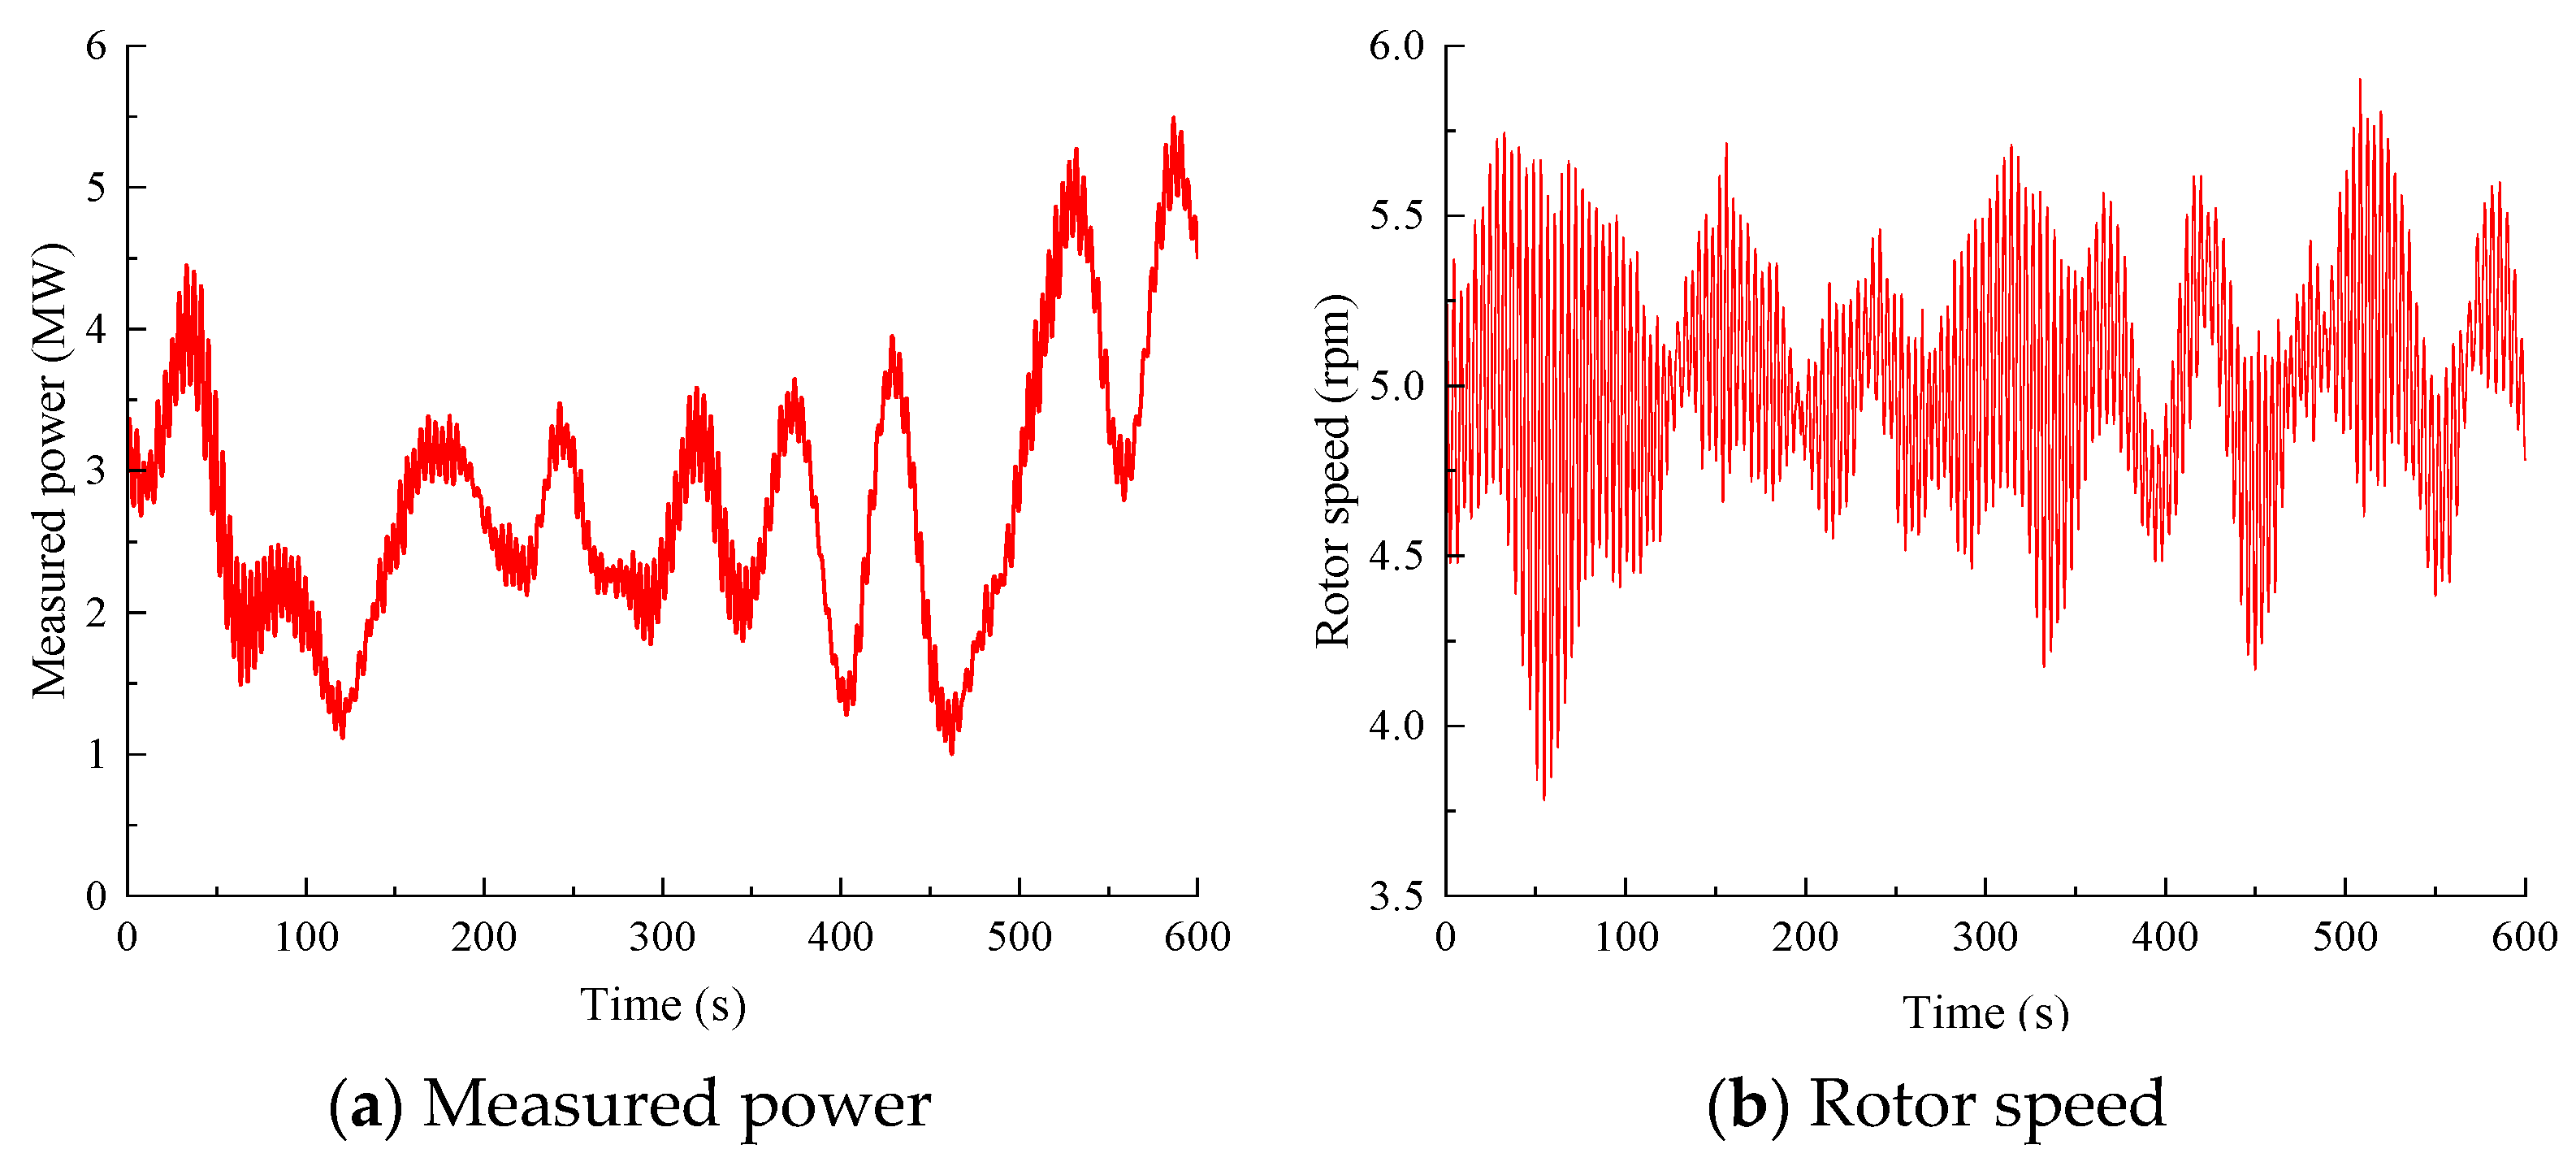
Figure 5 presents the power output and rotor speed when the hub-height mean wind speed is 6 m/s. Below the rated wind speed, the controller regulates rotor speed between 4 and 5.5 rpm by adjusting generator torque, maintaining a tip–speed ratio (ratio of blade tip tangential velocity to inflow wind speed) near 10 to optimize energy capture, with power outputs ranging from 1 to 5.5 MW.
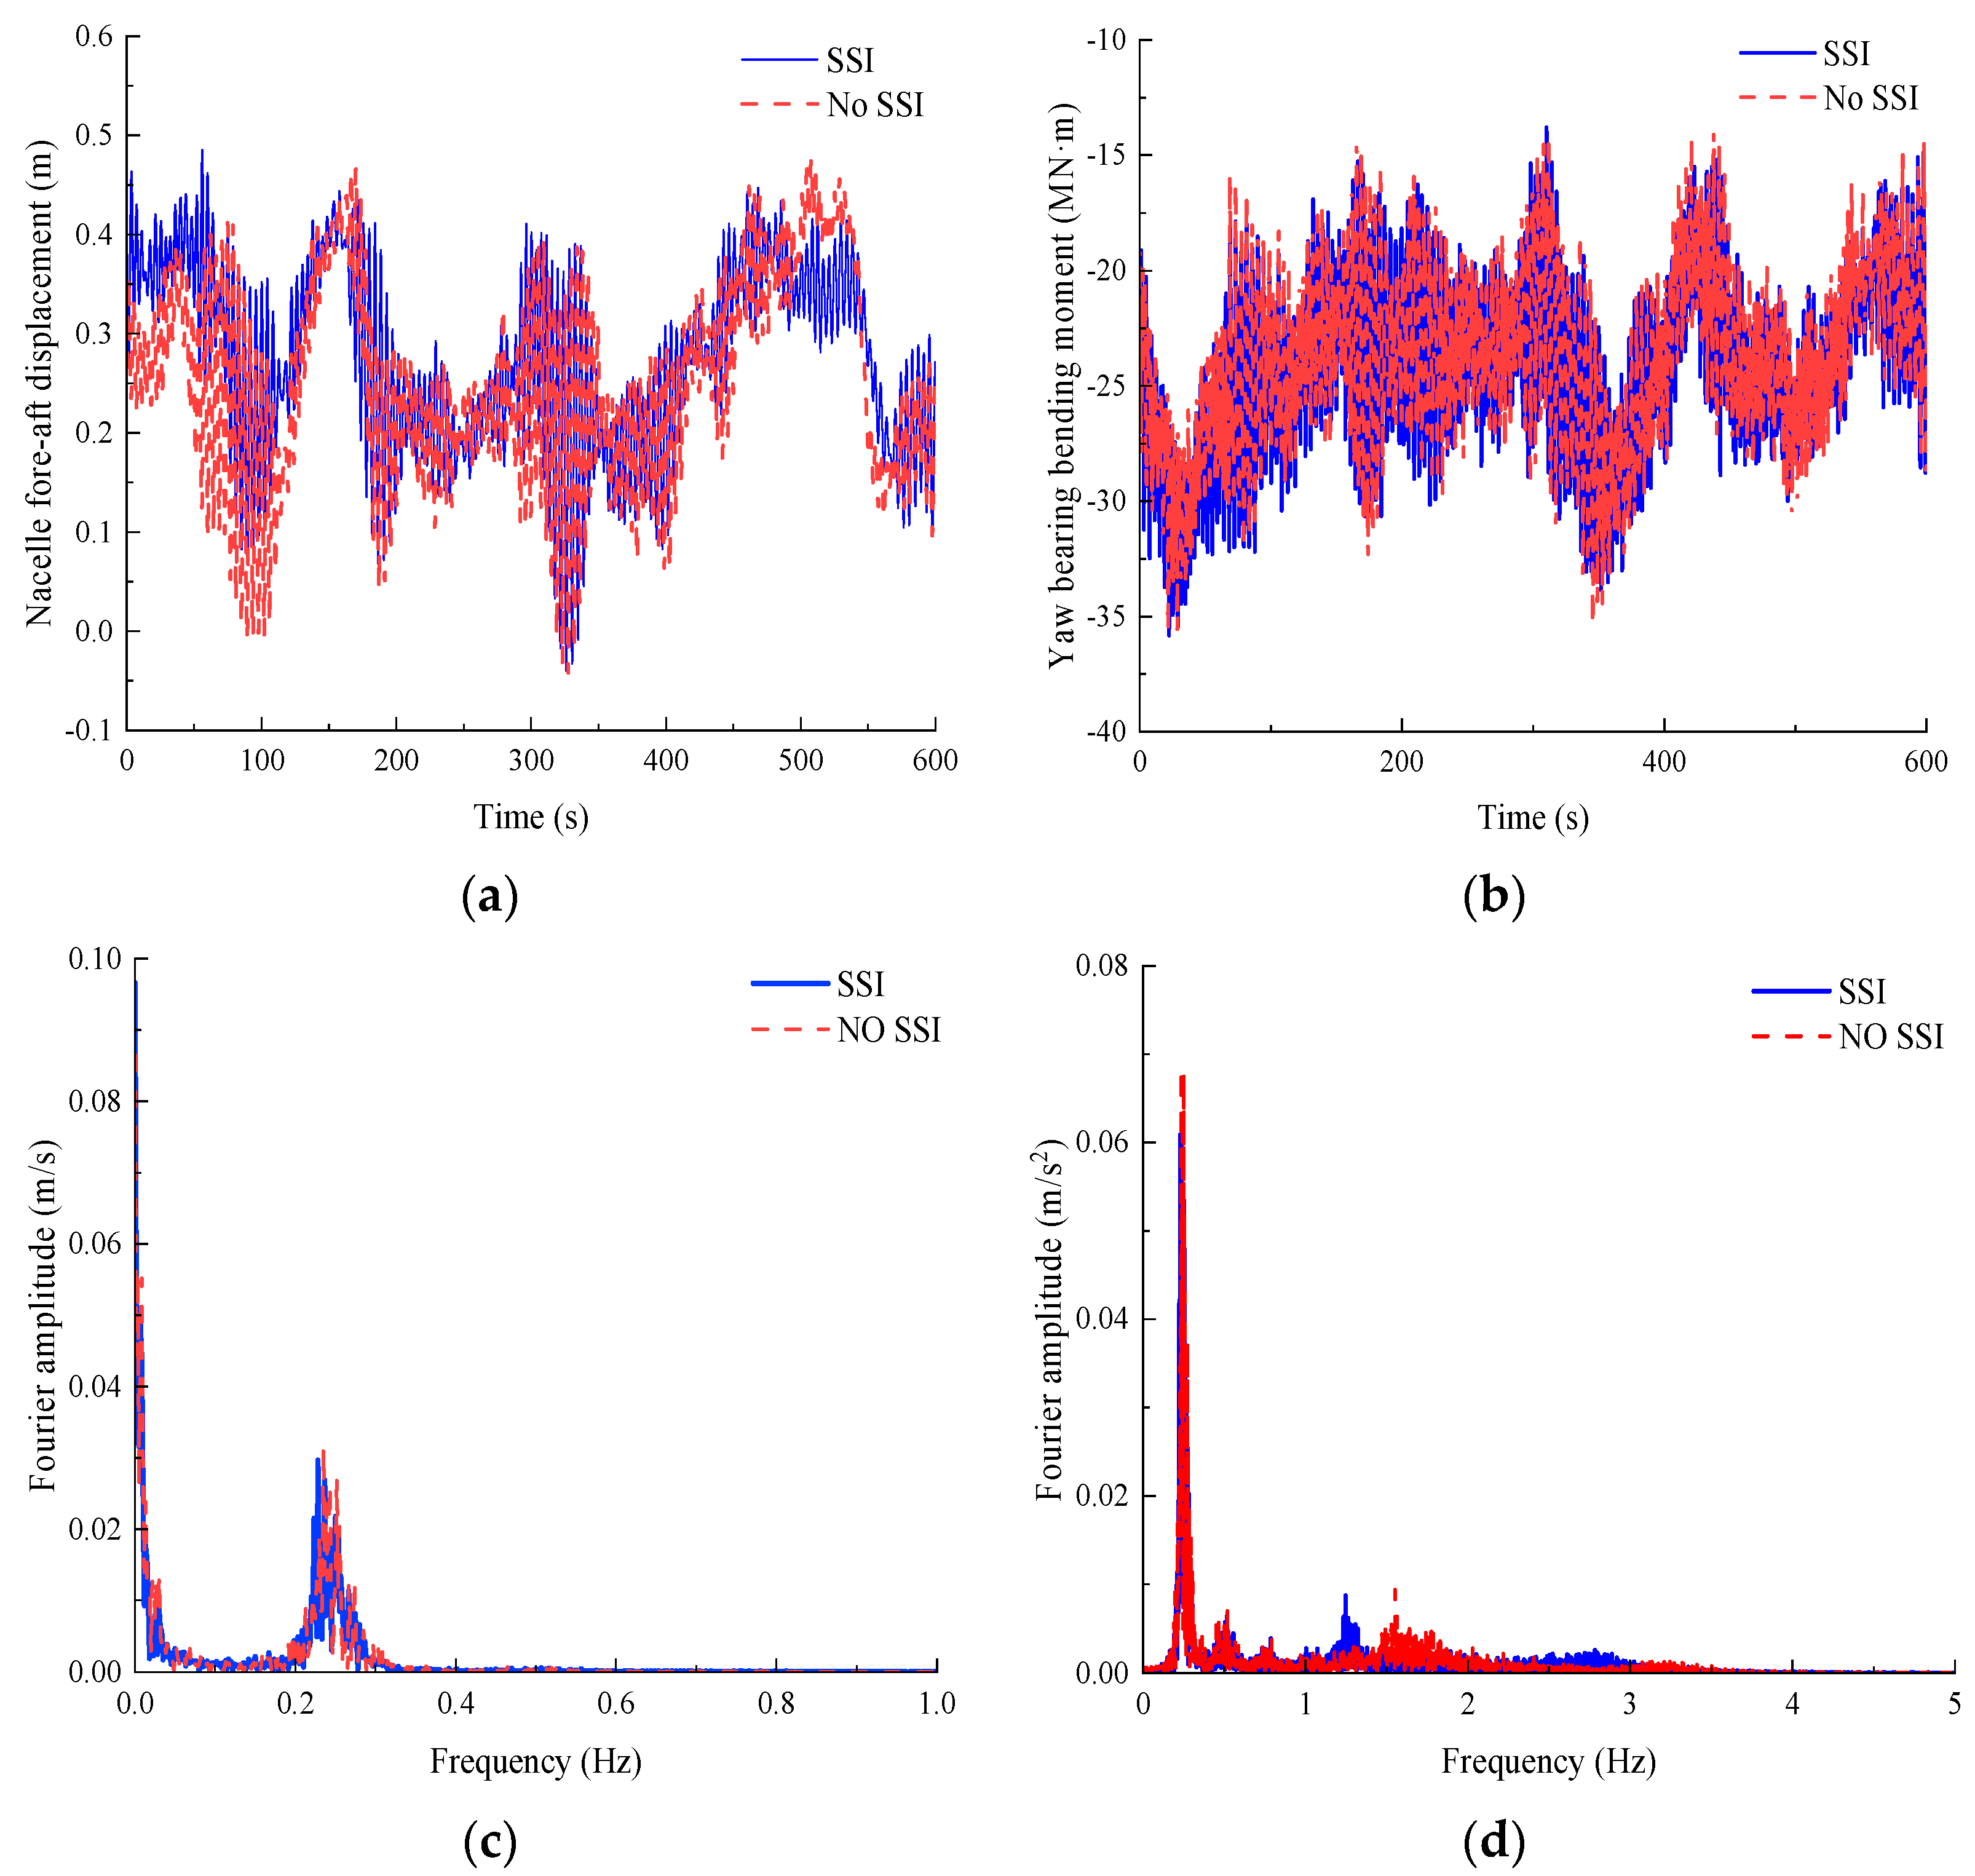
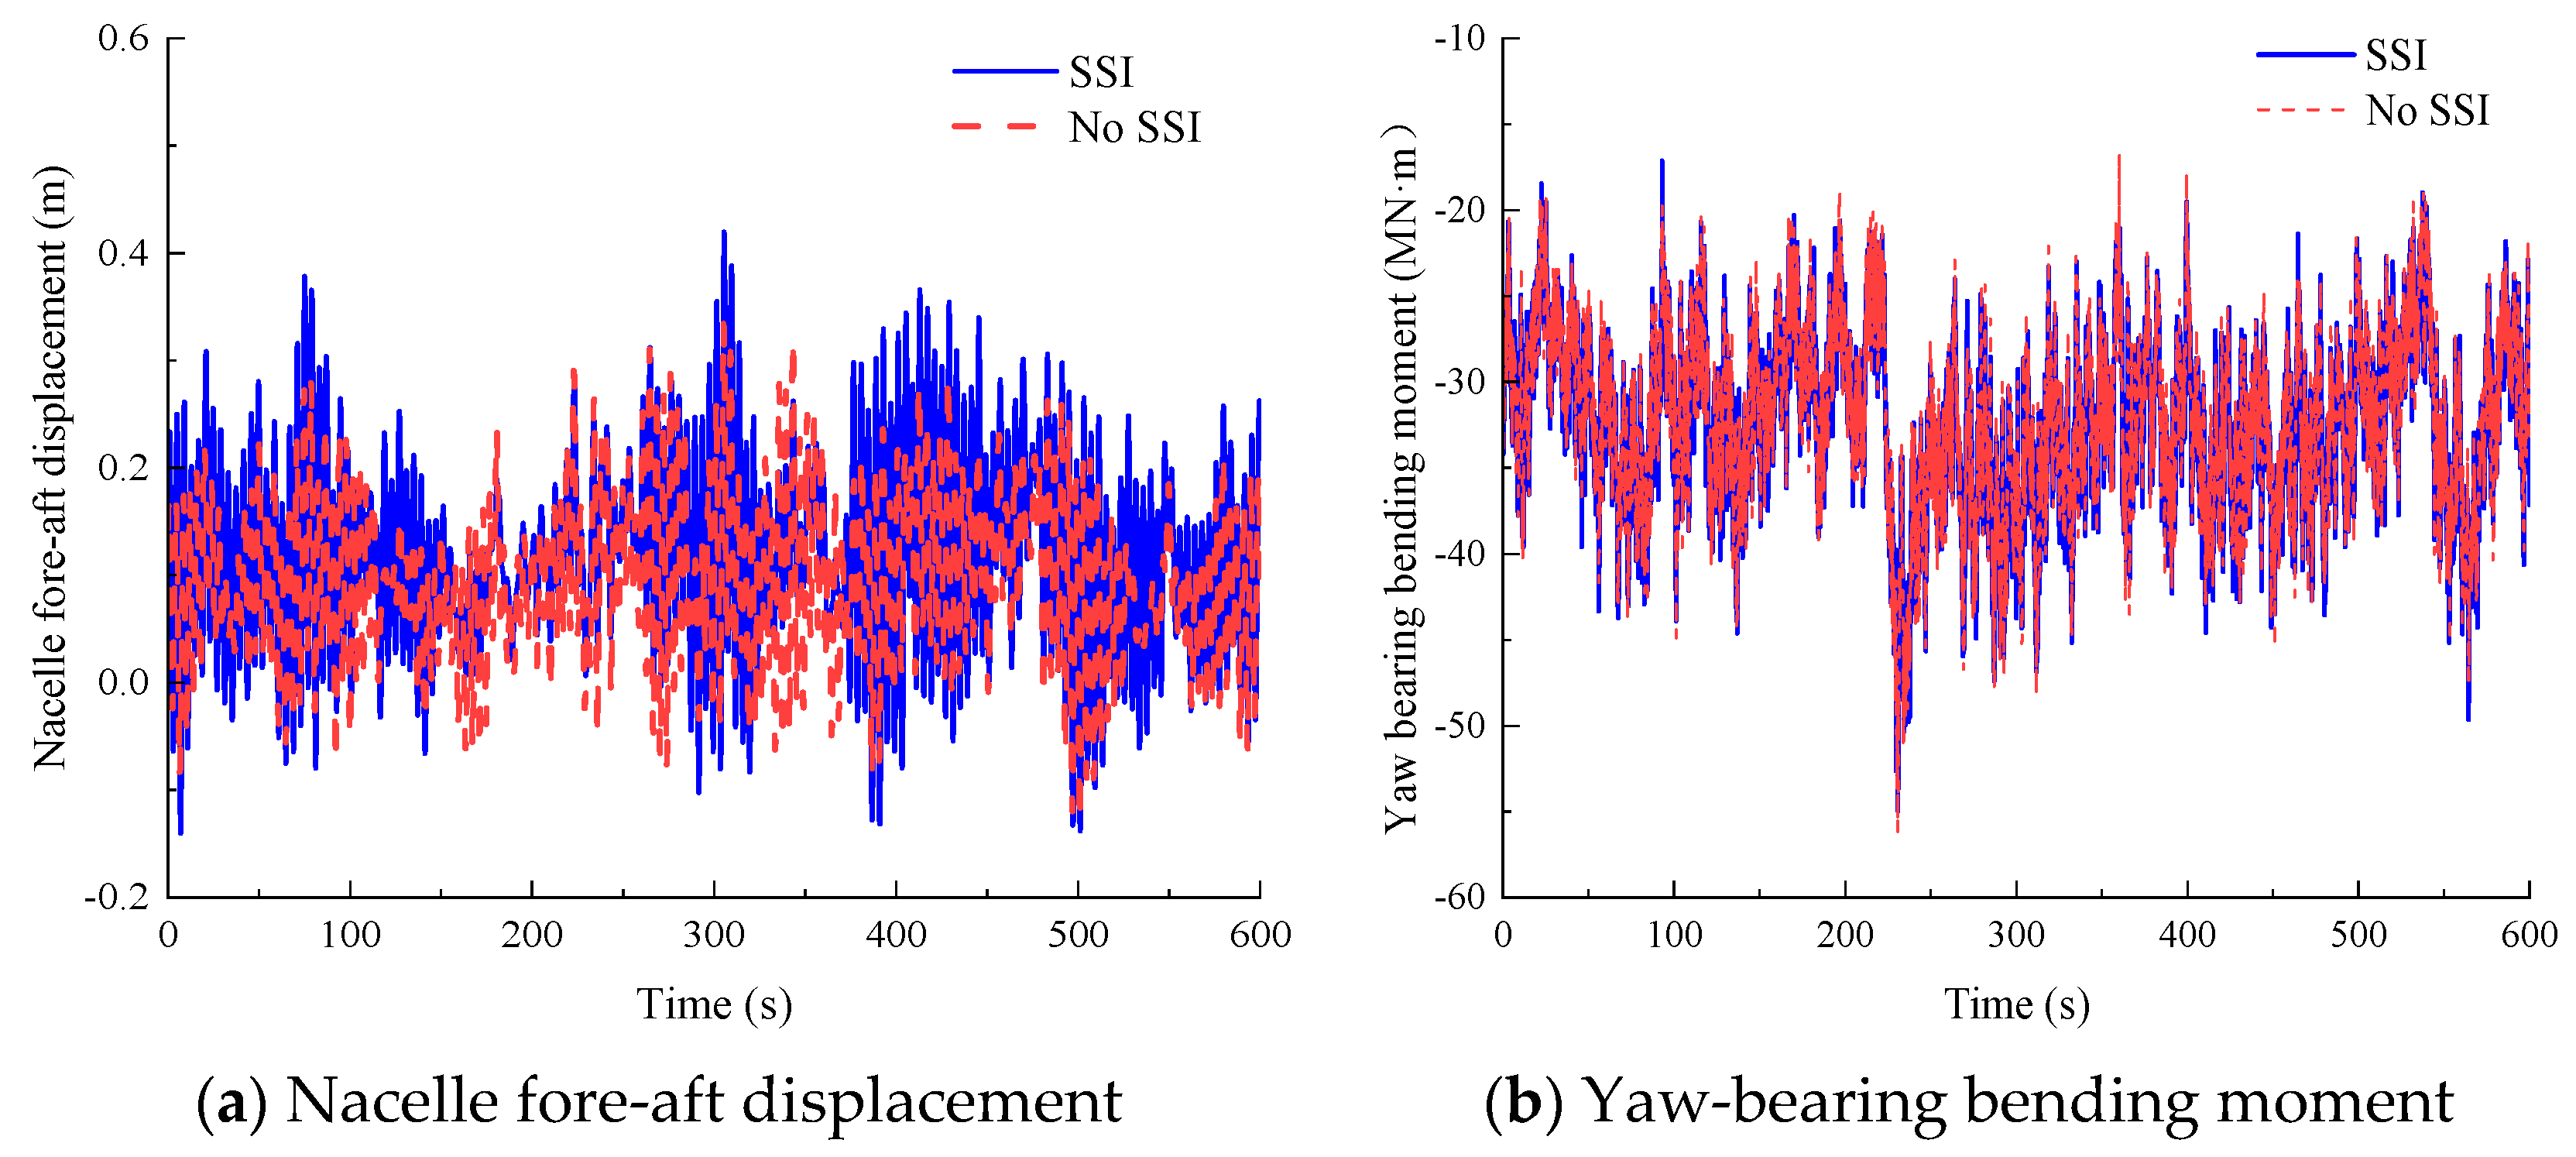
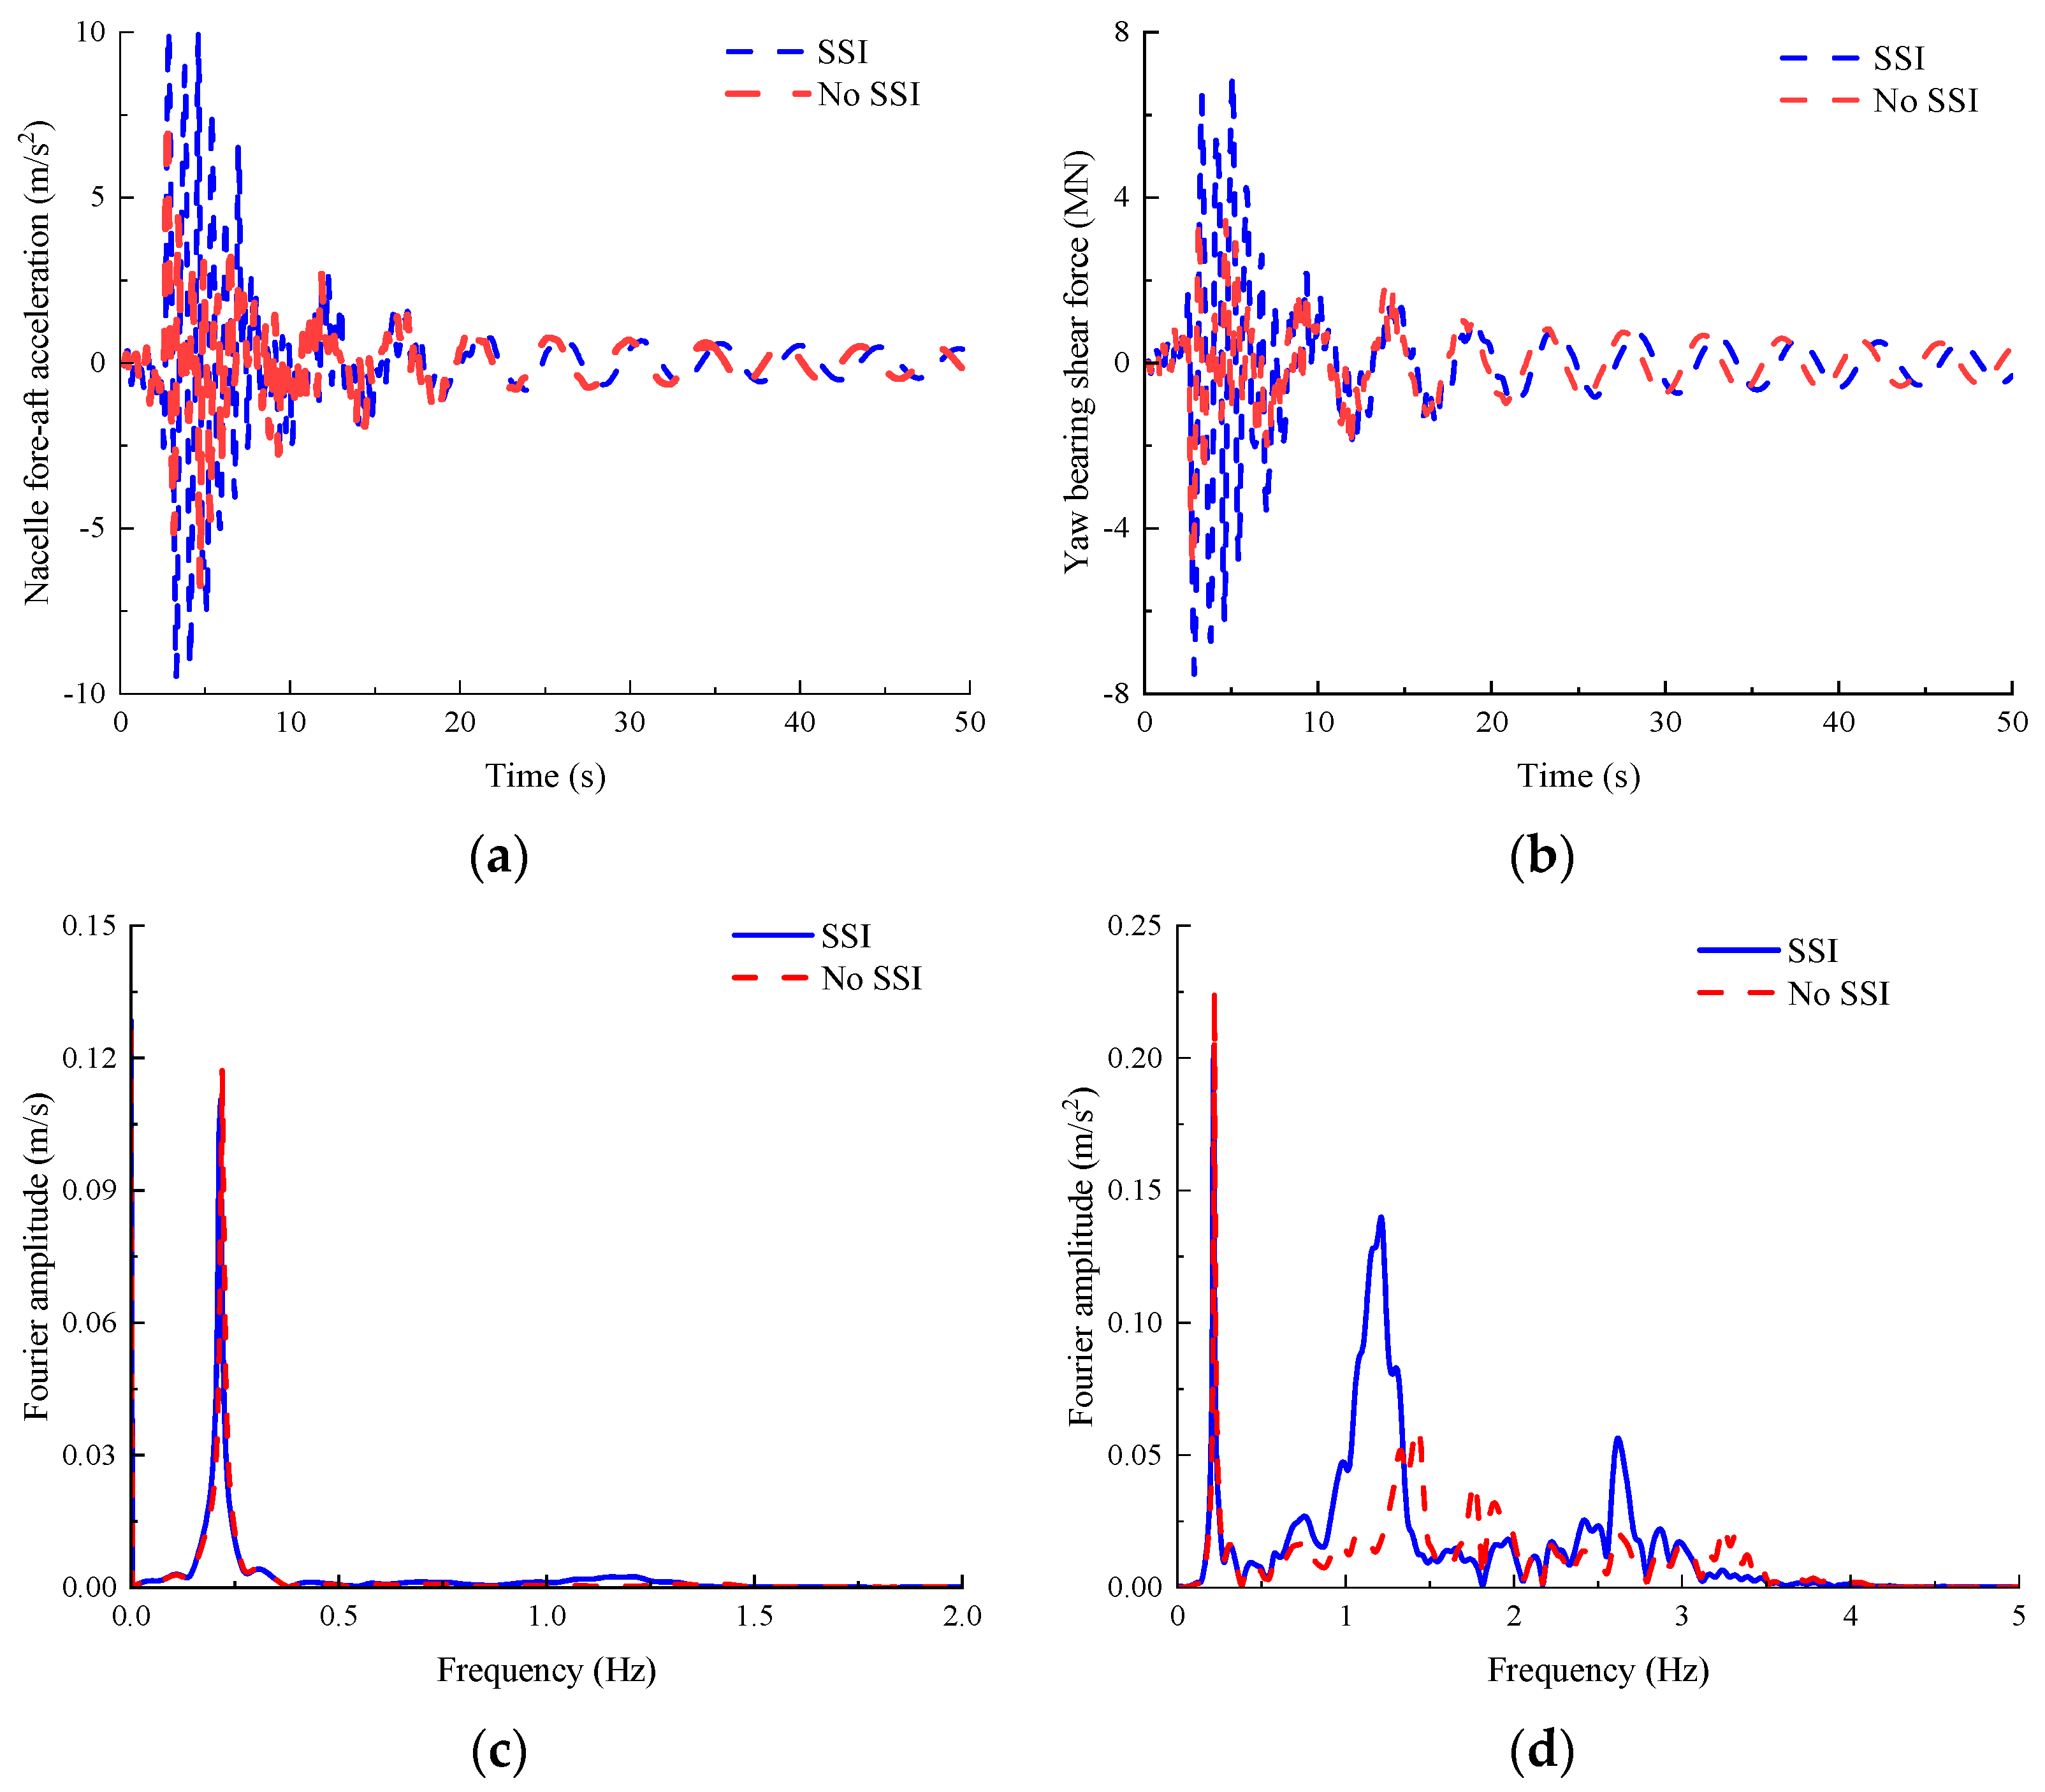
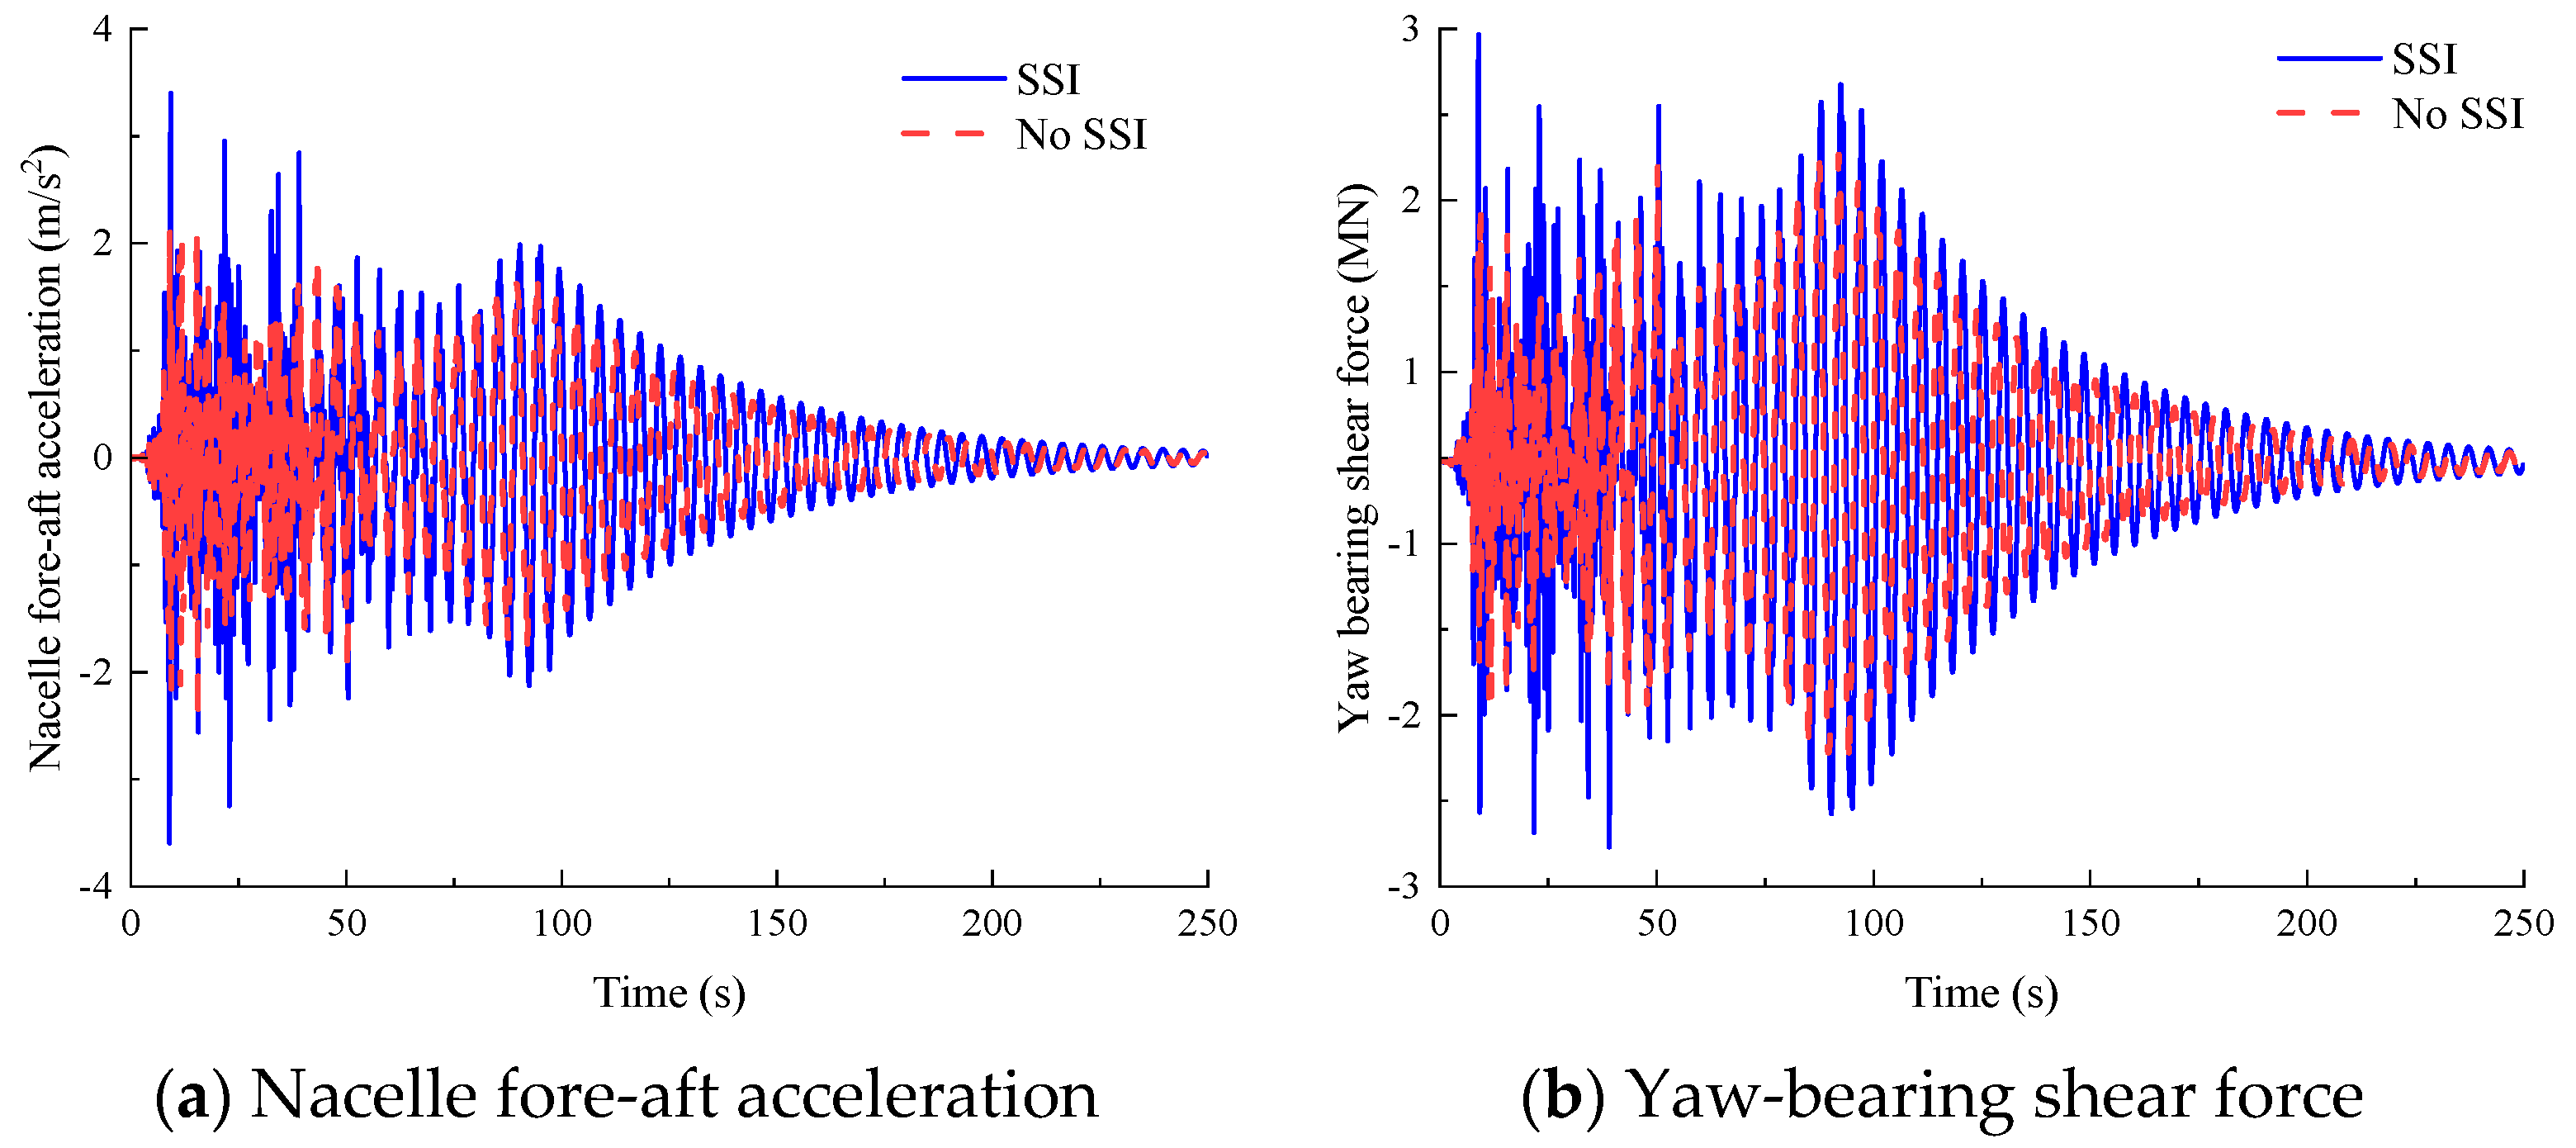
Figure 6a,b present the dynamic responses of the 15 MW JOWT under a mean wind speed of 6 m/s at the hub height, including the nacelle displacement in the
x-axis and yaw-bearing bending moment about the
y-axis. When SSI is considered, the peak values reach 0.485 m for nacelle displacement and 35.83 MN·m for yaw-bearing bending moment.
Figure 6c,d display the Fourier amplitude spectra of nacelle displacement and acceleration, respectively. As shown in these figures, the displacement response is dominated by static displacement and the first mode of the system, while the acceleration response primarily reflects the first mode with measurable contributions from higher-order modes.
Table 10 quantifies relative deviations between SSI and no-SSI models across statistical parameters. Notably, SSI effects remain moderate, with relative errors for all parameters except yaw mechanism shear force standard deviation confined within (−10%, 10%).
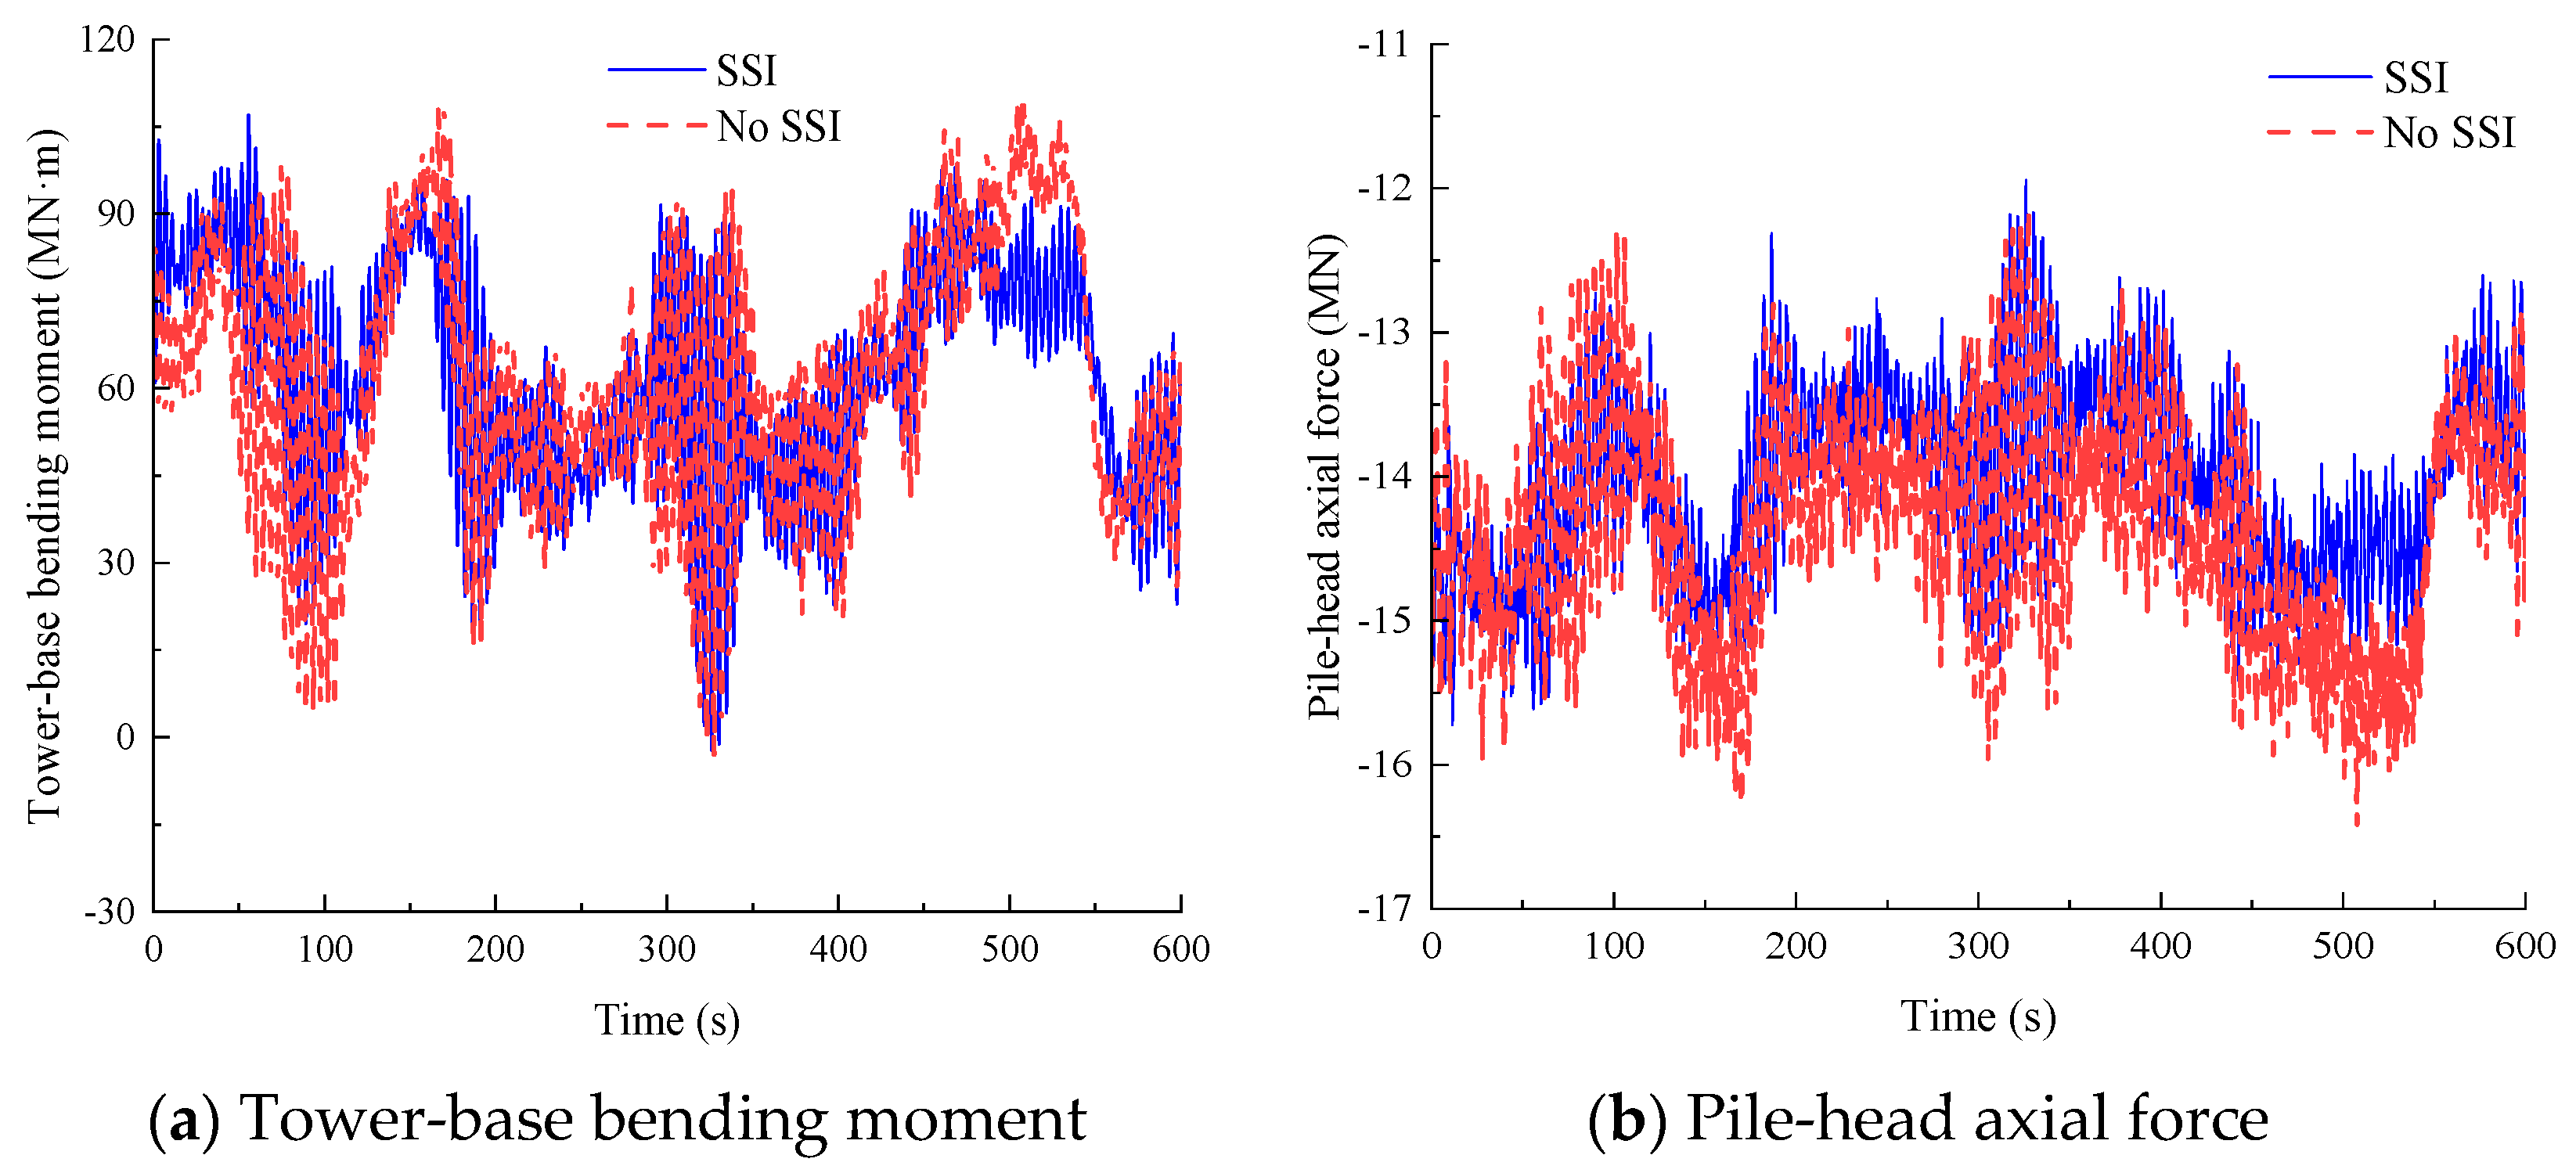
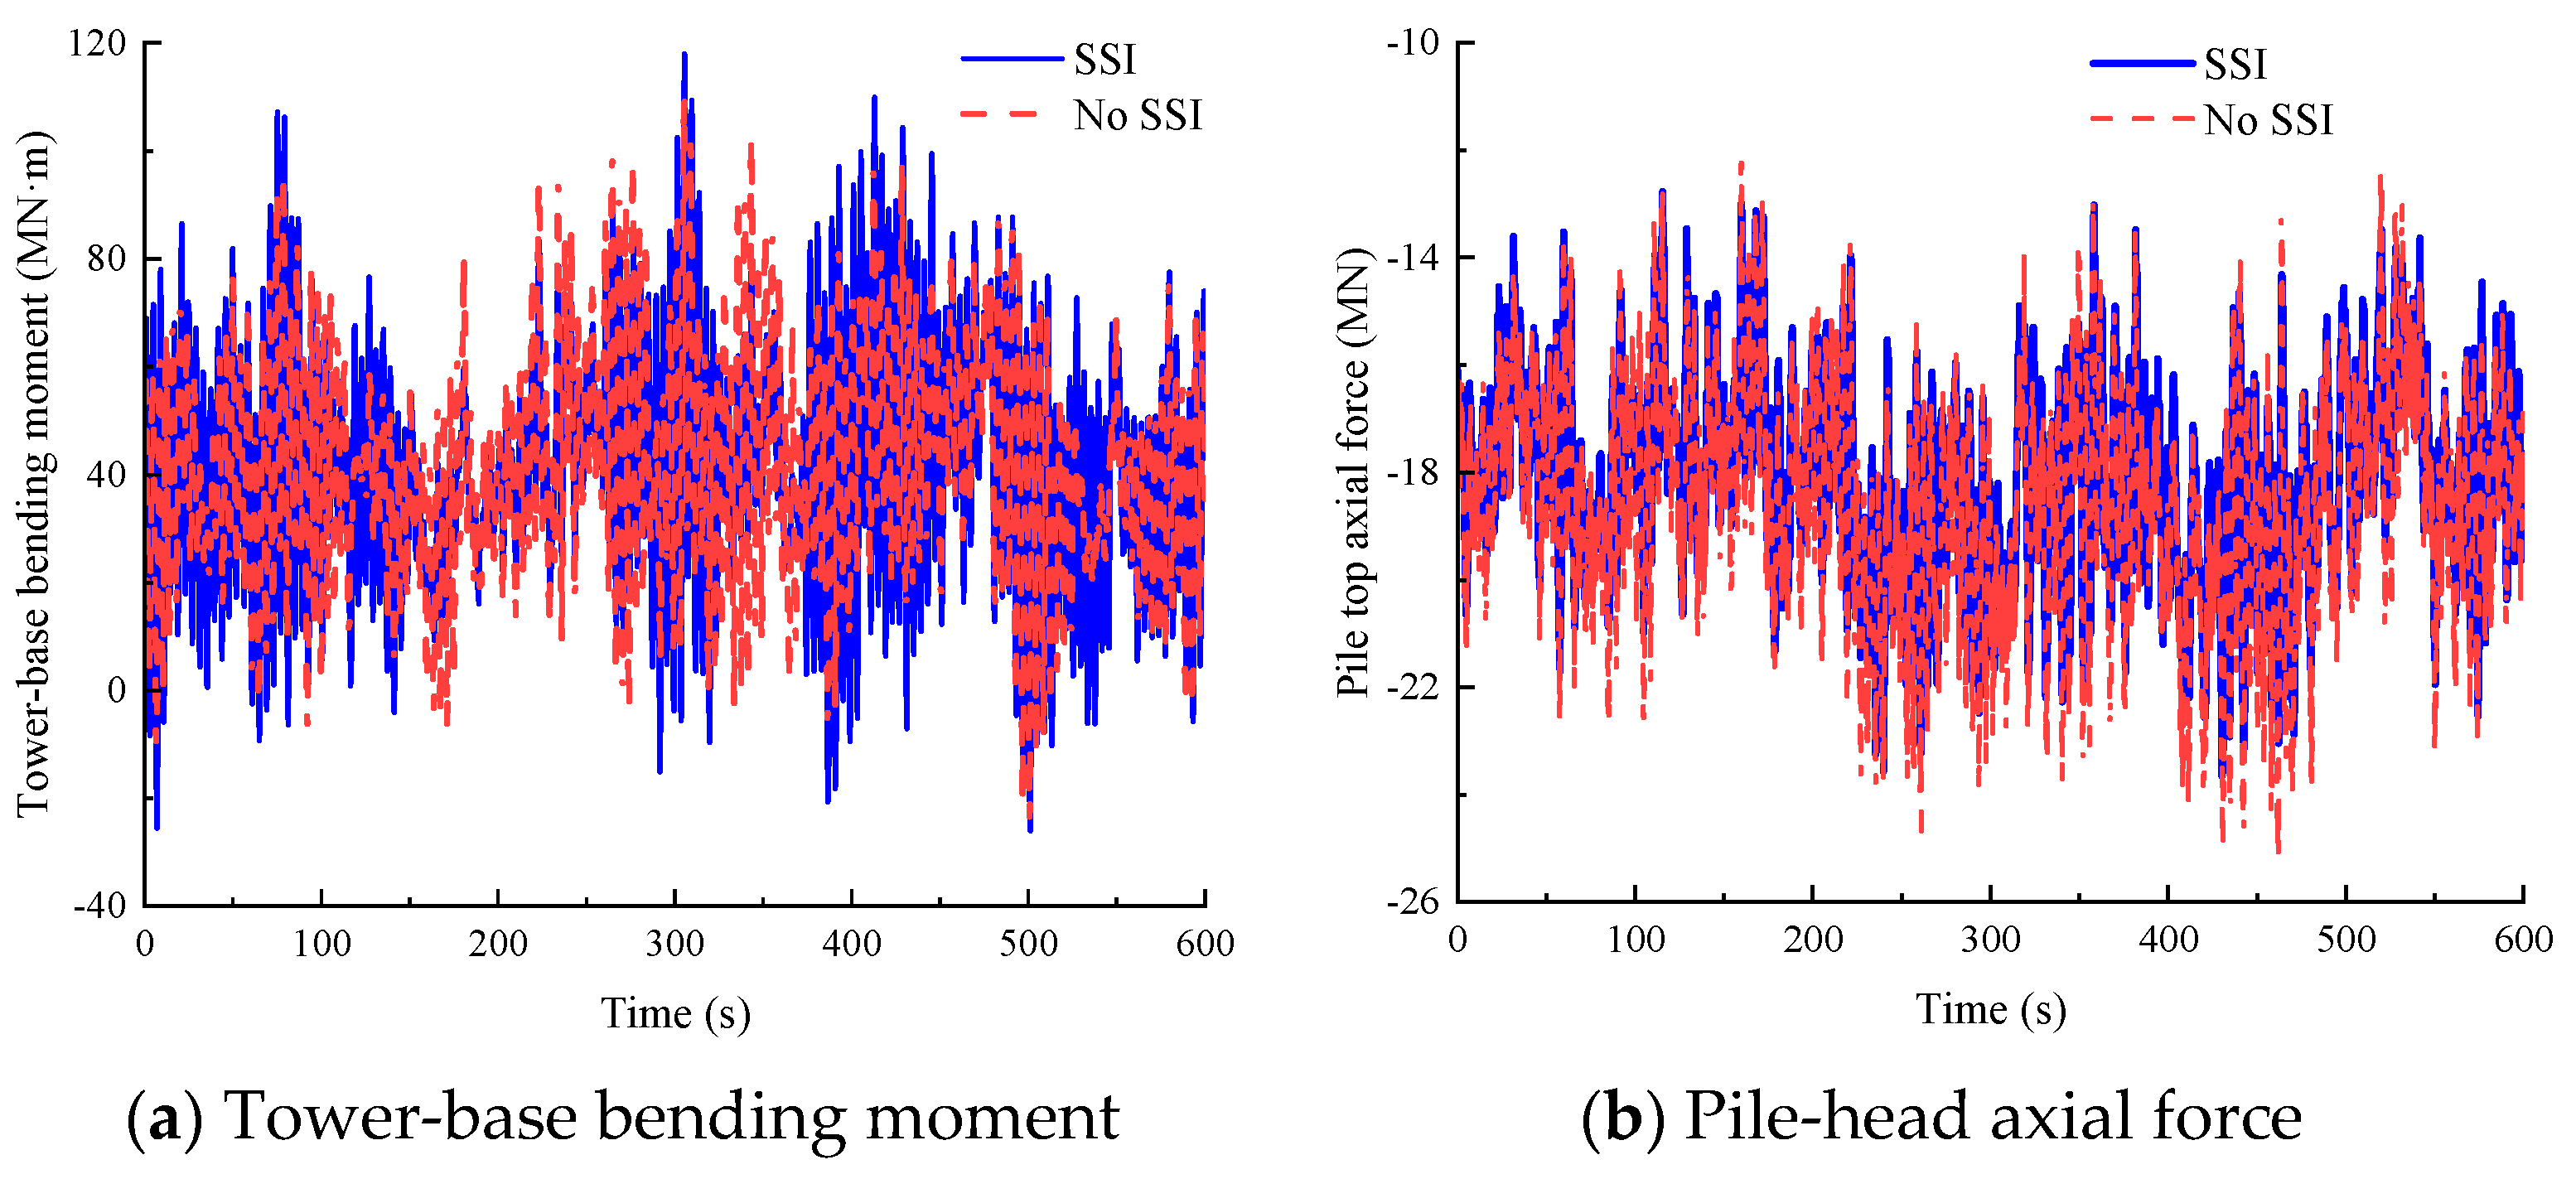
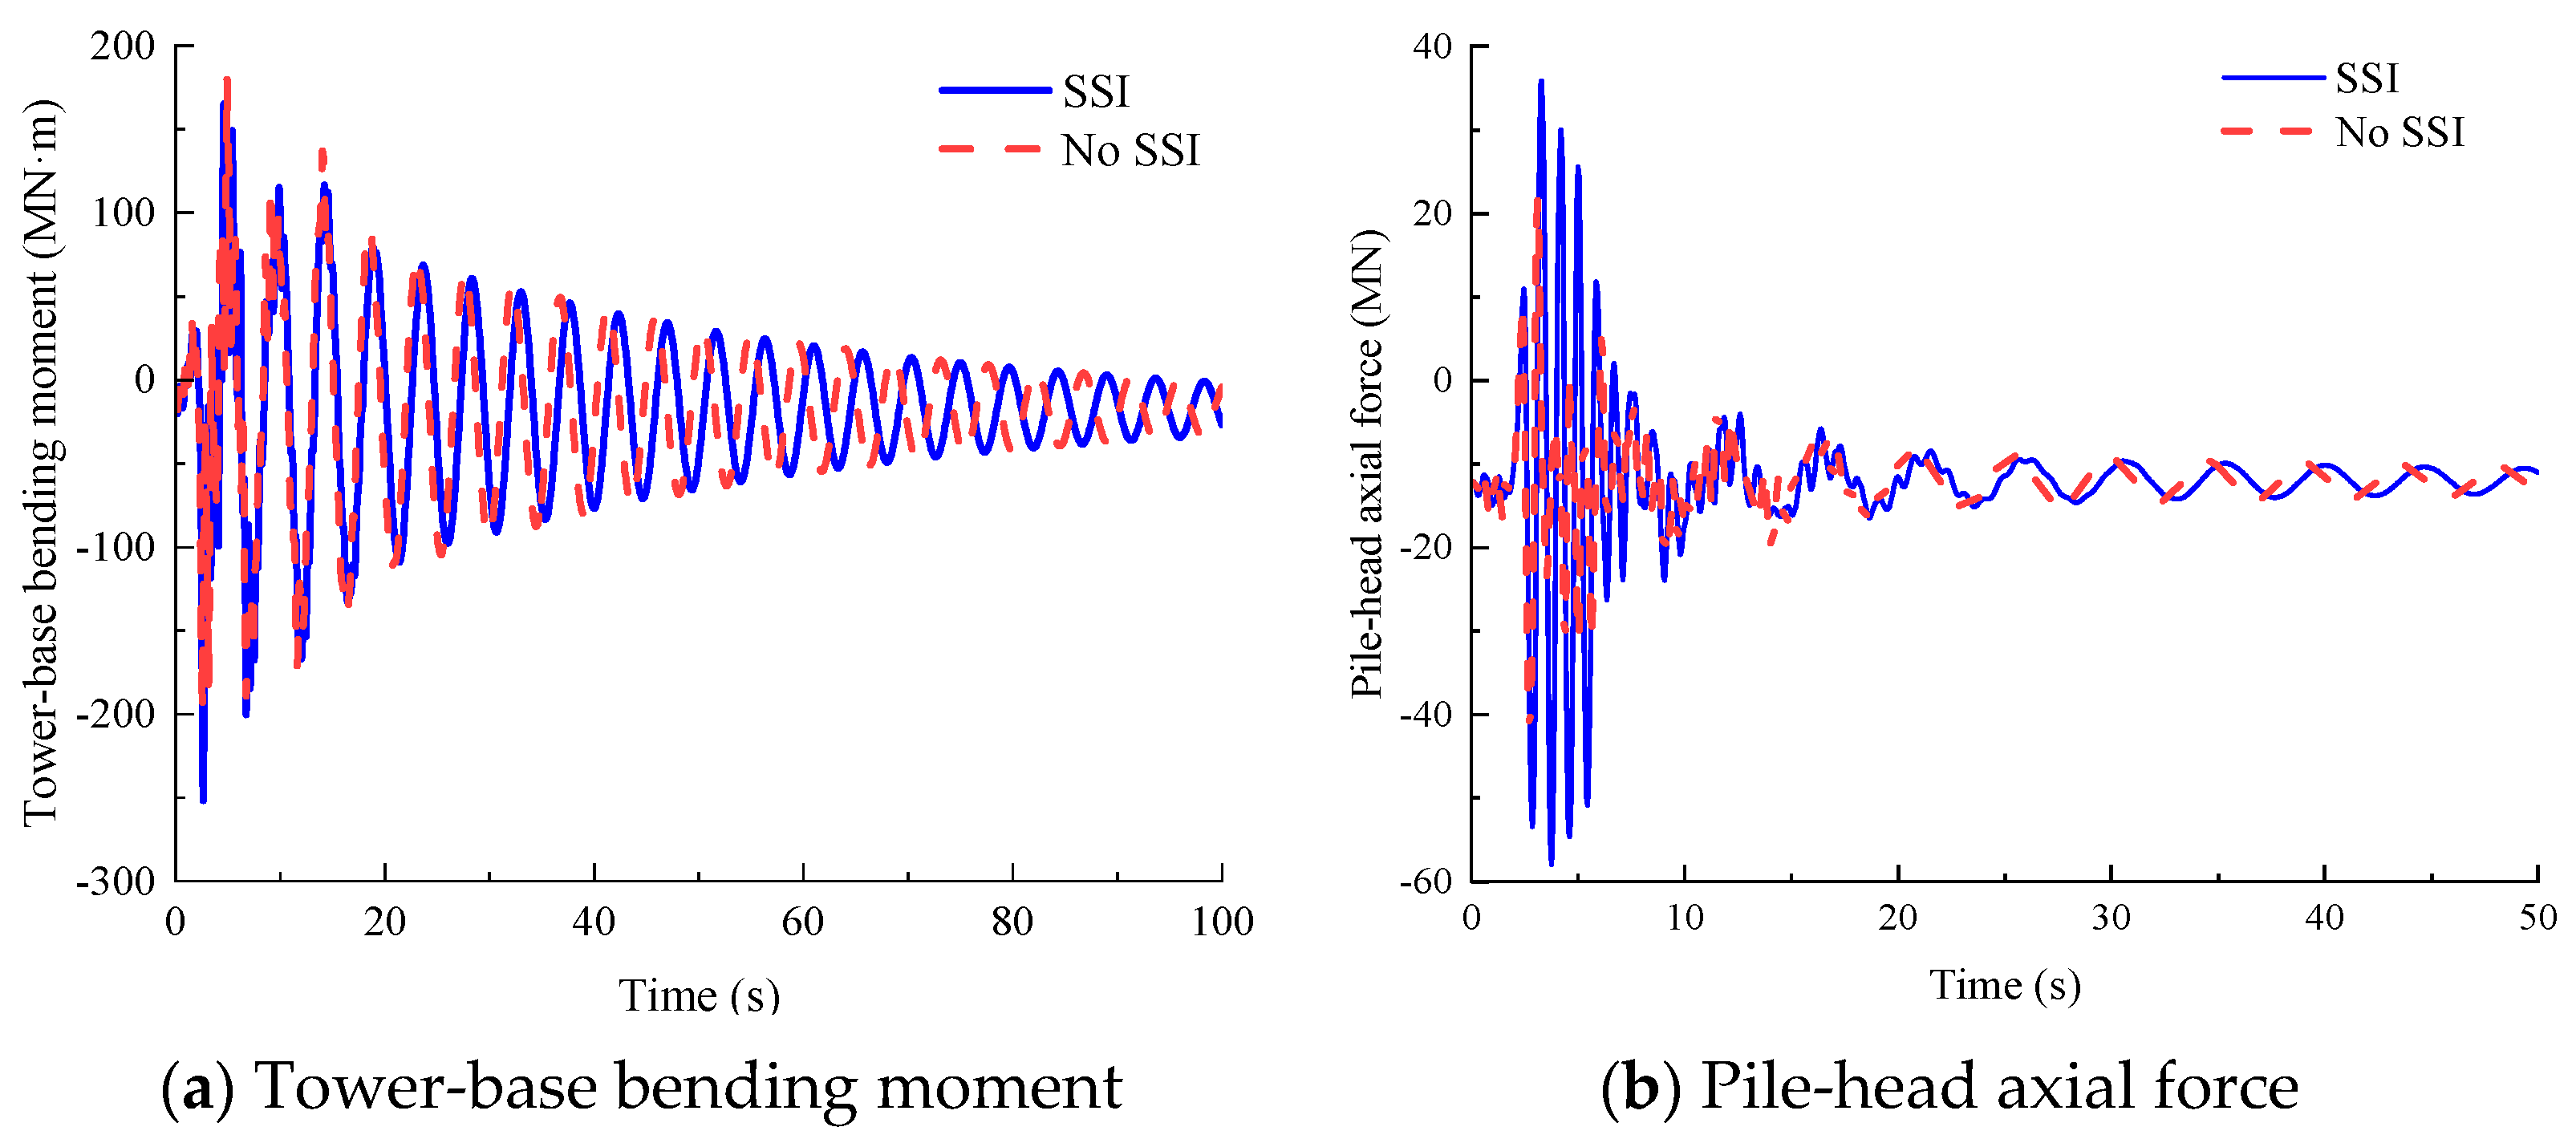
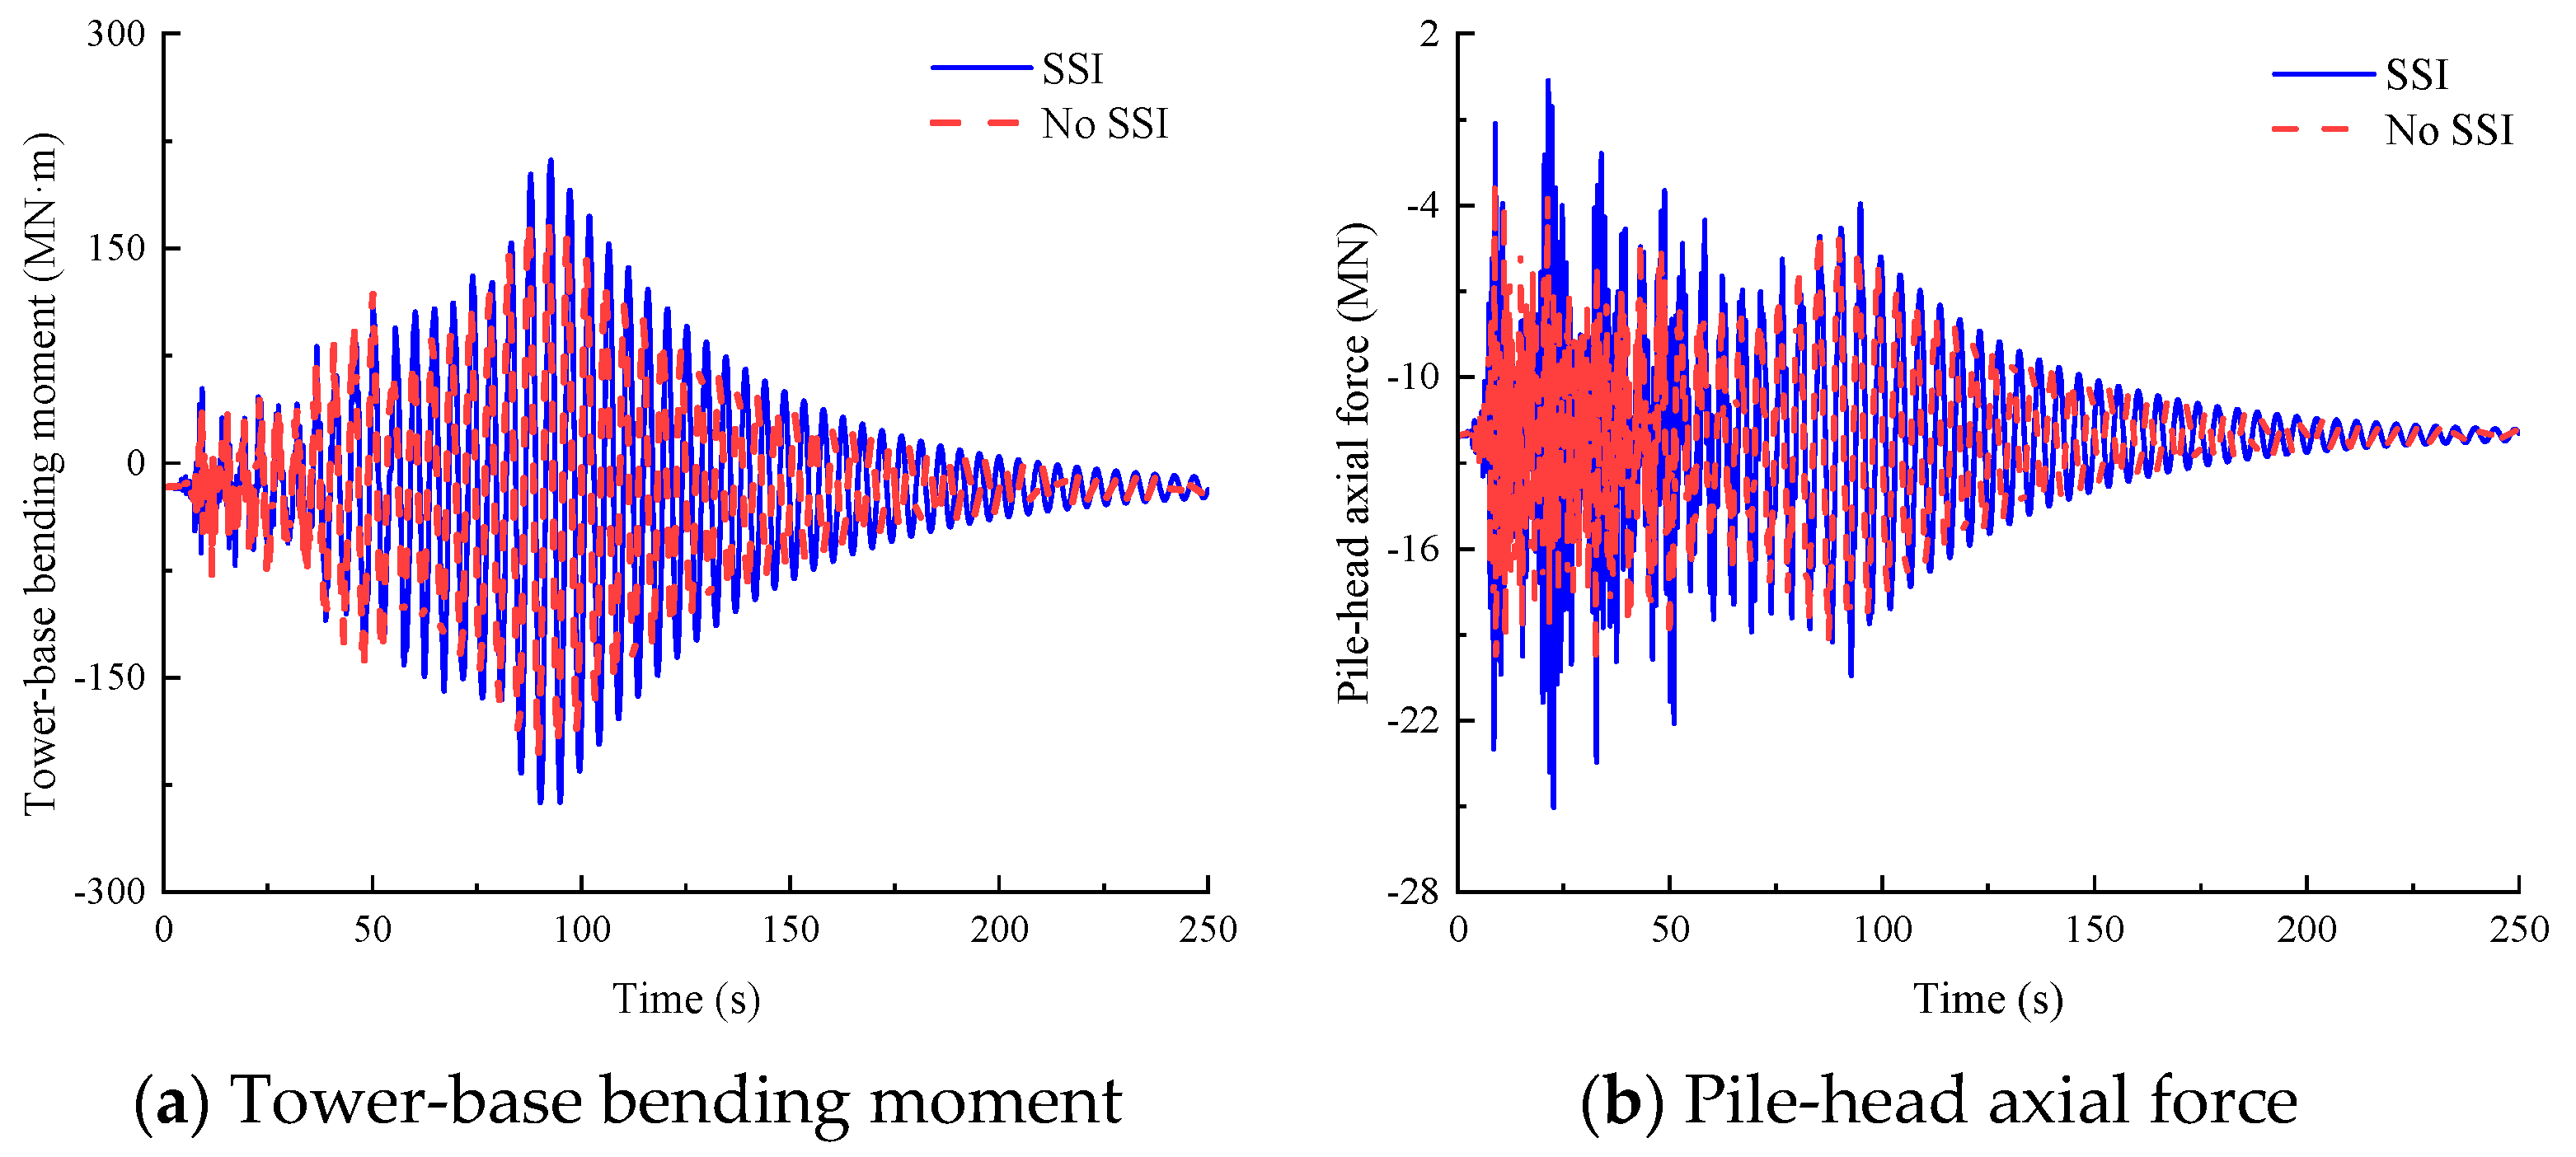
Figure 7 presents time–history responses of critical structural components under a mean wind speed of 6 m/s at the hub height: tower-base bending moment about the
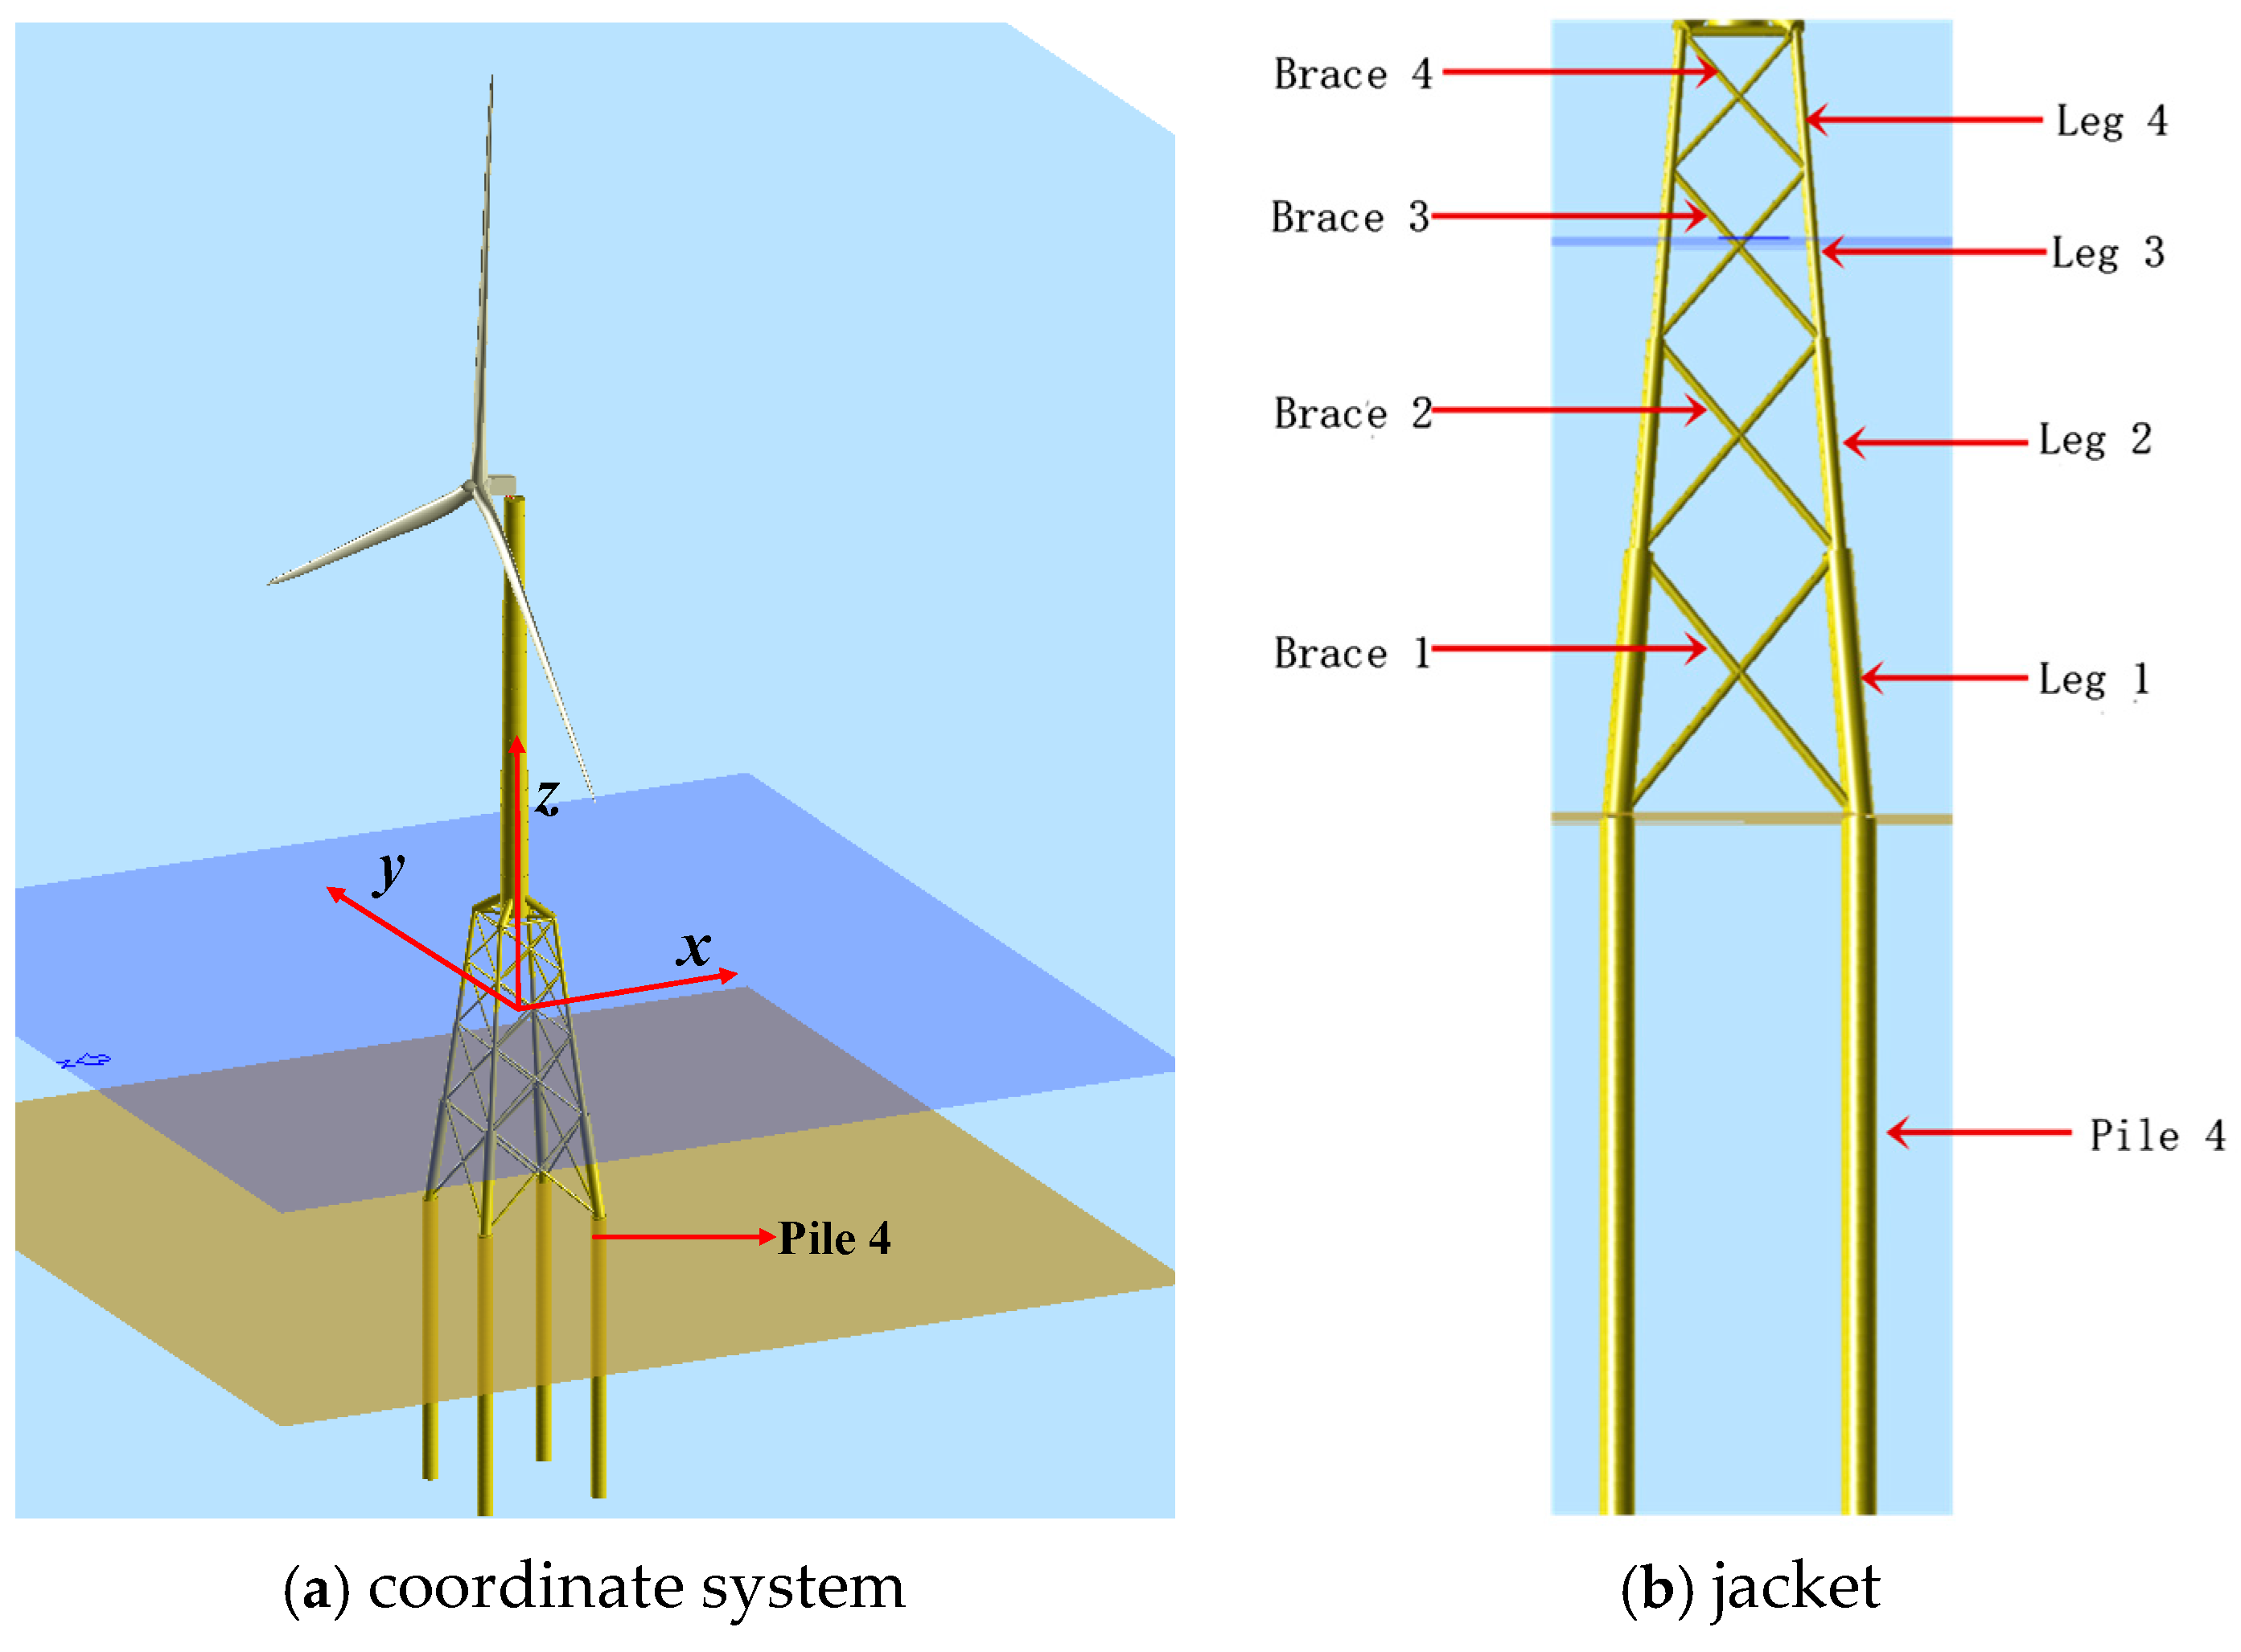
y-axis and pile-head axial force of pile 4 (
Figure 2a). When SSI is considered, the peak values reach 107.09 MN·m for tower-base bending moment and 15.72 MN for pile-head axial force.
Table 11 quantifies the relative errors in statistical parameters when neglecting SSI. The pile-head bending moment demonstrates the highest sensitivity to foundation modeling, with neglecting SSI resulting in underestimations of its peak, mean, and standard deviation by 84.48%, 87.87%, and 65.04%, respectively. Additionally, neglecting SSI introduces relative errors of 18.95% in pile-head axial force standard deviation, 14.43% in tower-base bending moment standard deviation, and 14.46% in tower-base shear force standard deviation. The relative errors for the remaining (e.g., peak of tower-base shear force) parameters remain within the (−5%, 5%) range.
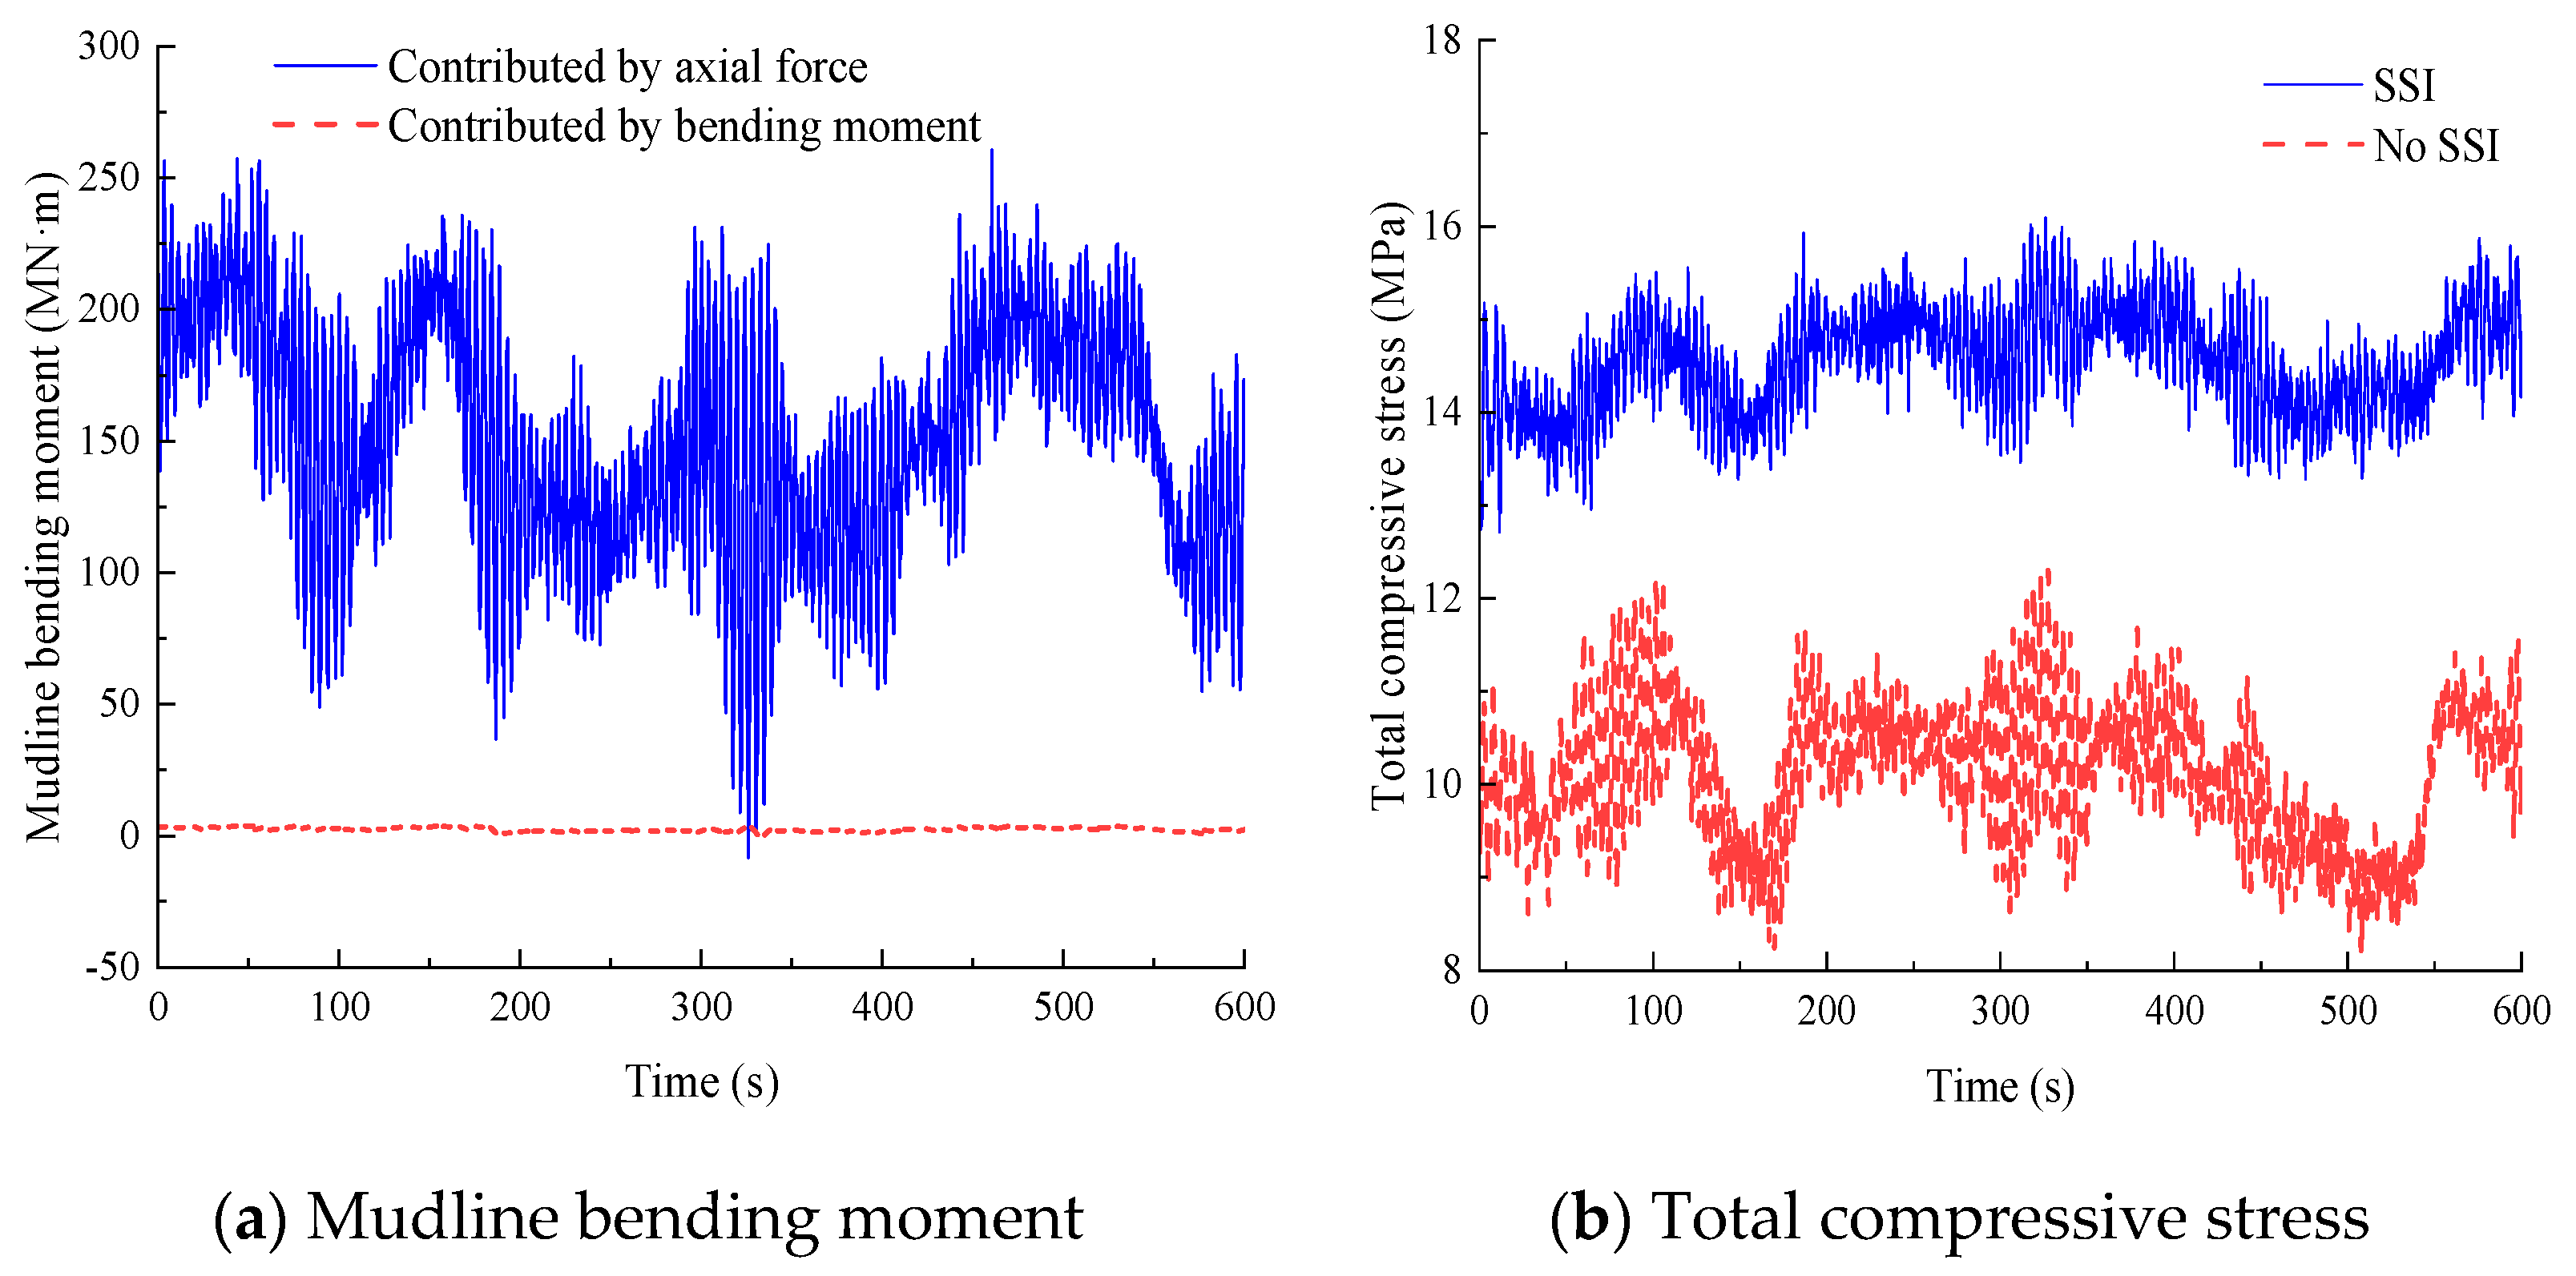
As high-rise flexible structures, the OWTs experience aerodynamic loadings acting on the wind rotor and wave–current forces on the substructures. Consequently, bottom-fixed OWTs are subjected to a large overturning moment, with pile foundations providing anti-overturning resistance through constrained forces at their interface. Based on moment equilibrium analysis at the mudline, the overturning resistance can be decomposed into axial-force-induced and bending-moment-induced components.
Figure 8a quantifies these resistance mechanisms, revealing axial forces dominate overturning resistance with minimal bending moment effects. For graphical clarity, total overturning moment curves are omitted, as their values deviate from axial resistance components by less than 2%. This confirms the piles primarily function as vertical load-bearing elements under operational conditions.
Figure 8b presents time histories of maximum compressive stress at the pile head, showing compressive stress levels of 16.2 MPa in the SSI model, 30% higher than the 12.1 MPa observed in the no-SSI model.
As the mean wind speed exceeds the rated wind speed, the controller increases blade pitch angles to mitigate aerodynamic torque. The power output ranges between 13 and 17.5 MW with rotor speeds maintained at 6.5 to 8.5 rpm.
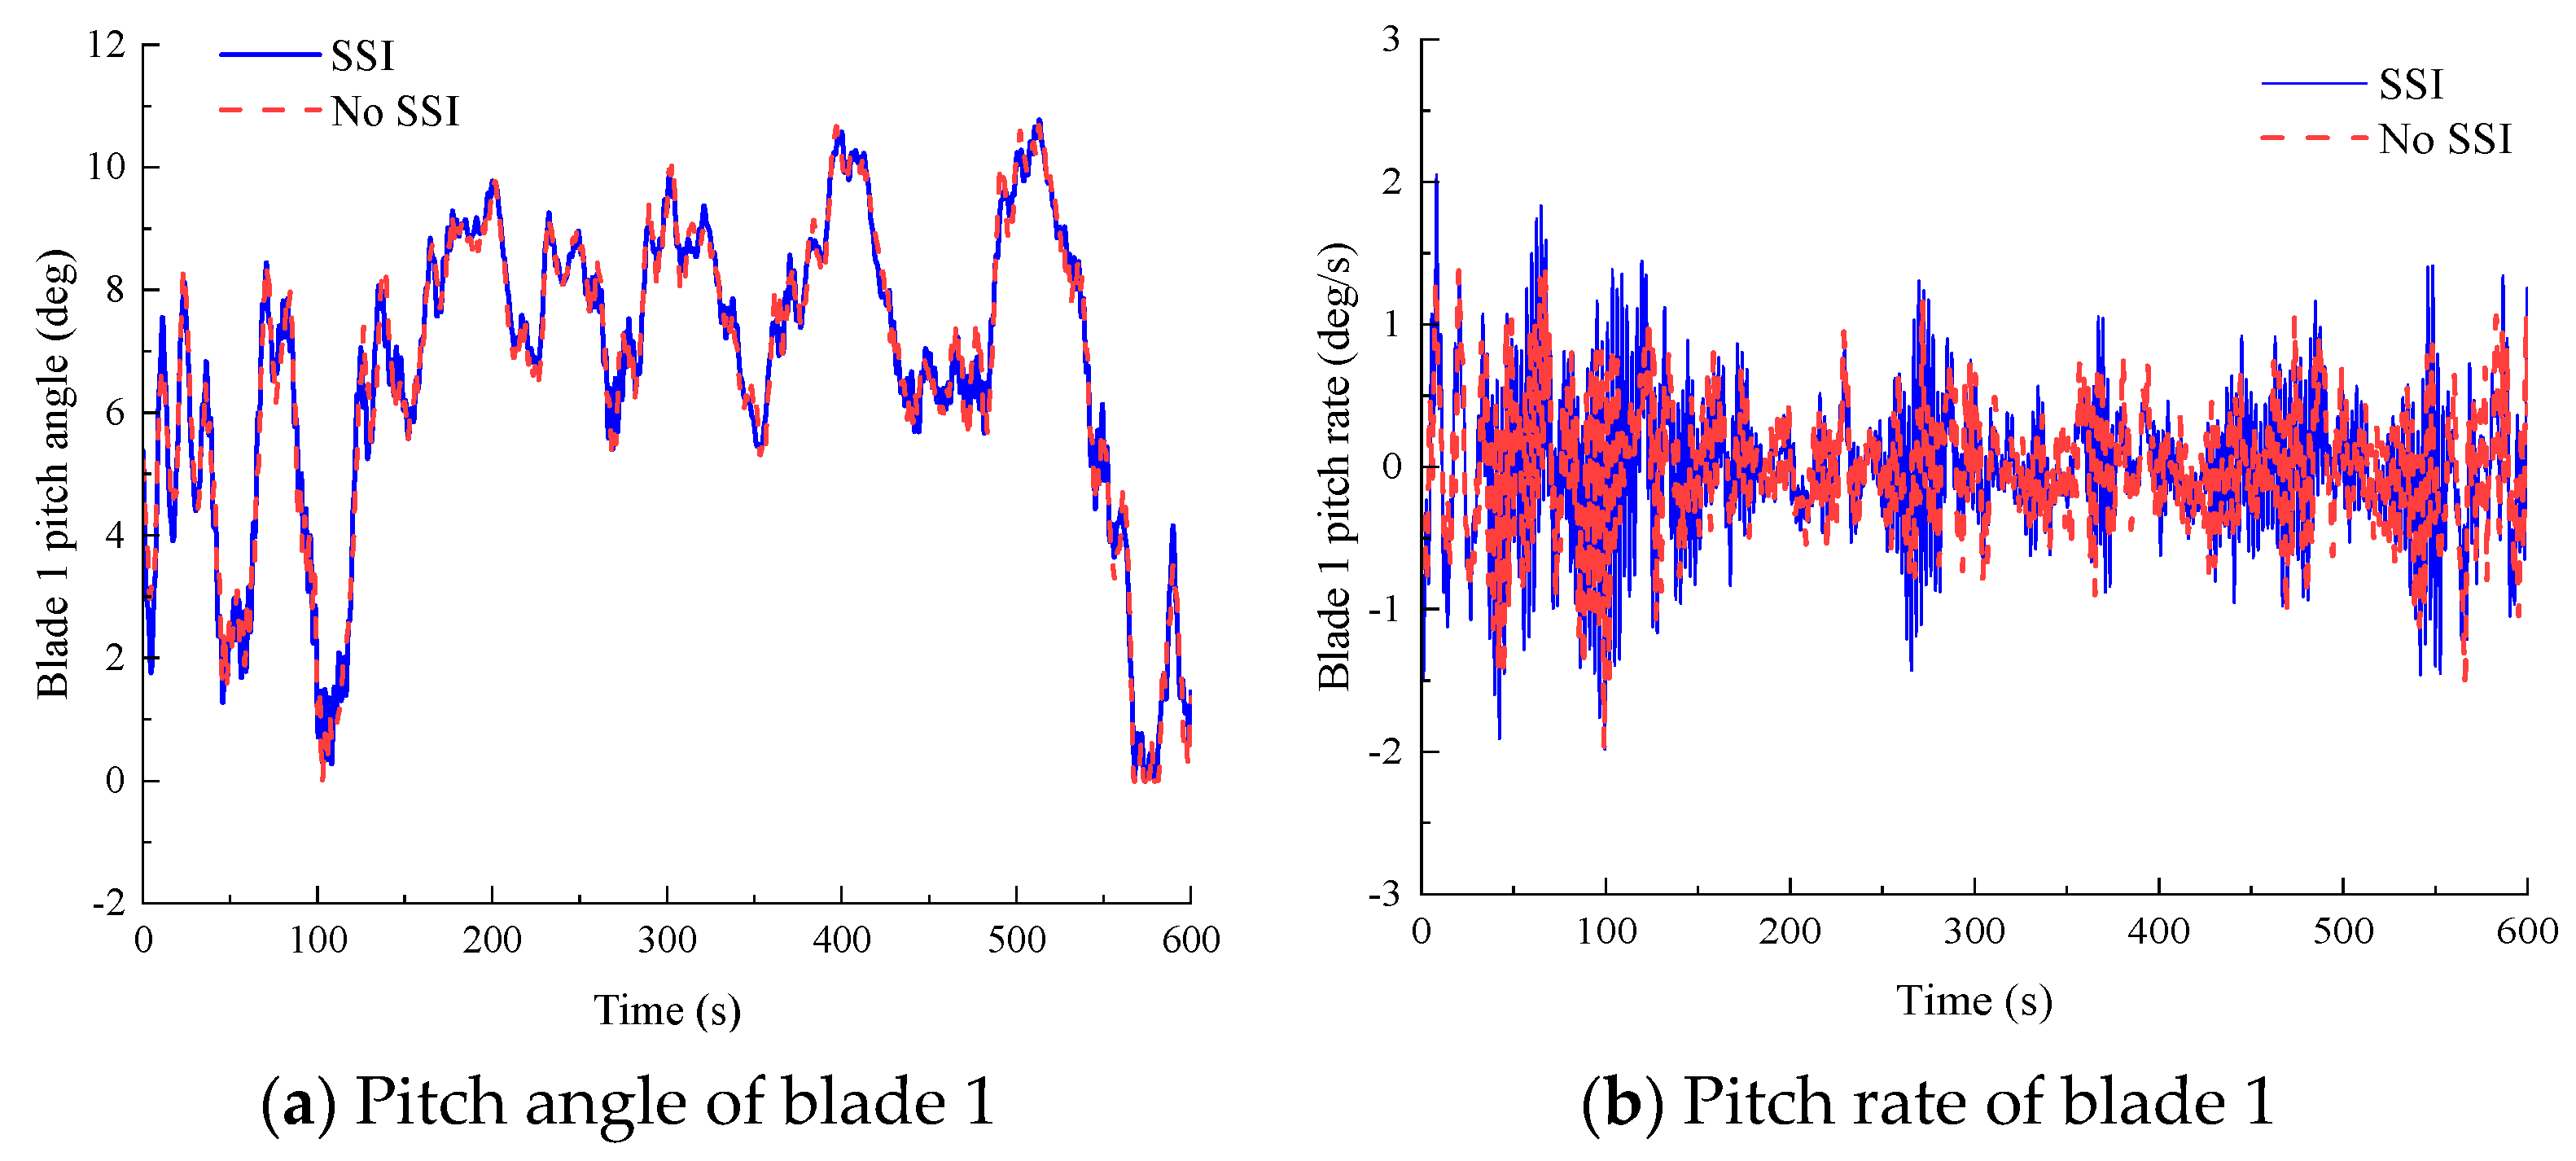
Figure 9a,b compare blade 1 pitch angles and pitch rates between SSI and no-SSI analyses. At a wind speed bin of 11–13 m/s (near-rated operation), pitch angle discrepancies between models are less than 0.5°, with both satisfying controller pitch rate constraints.
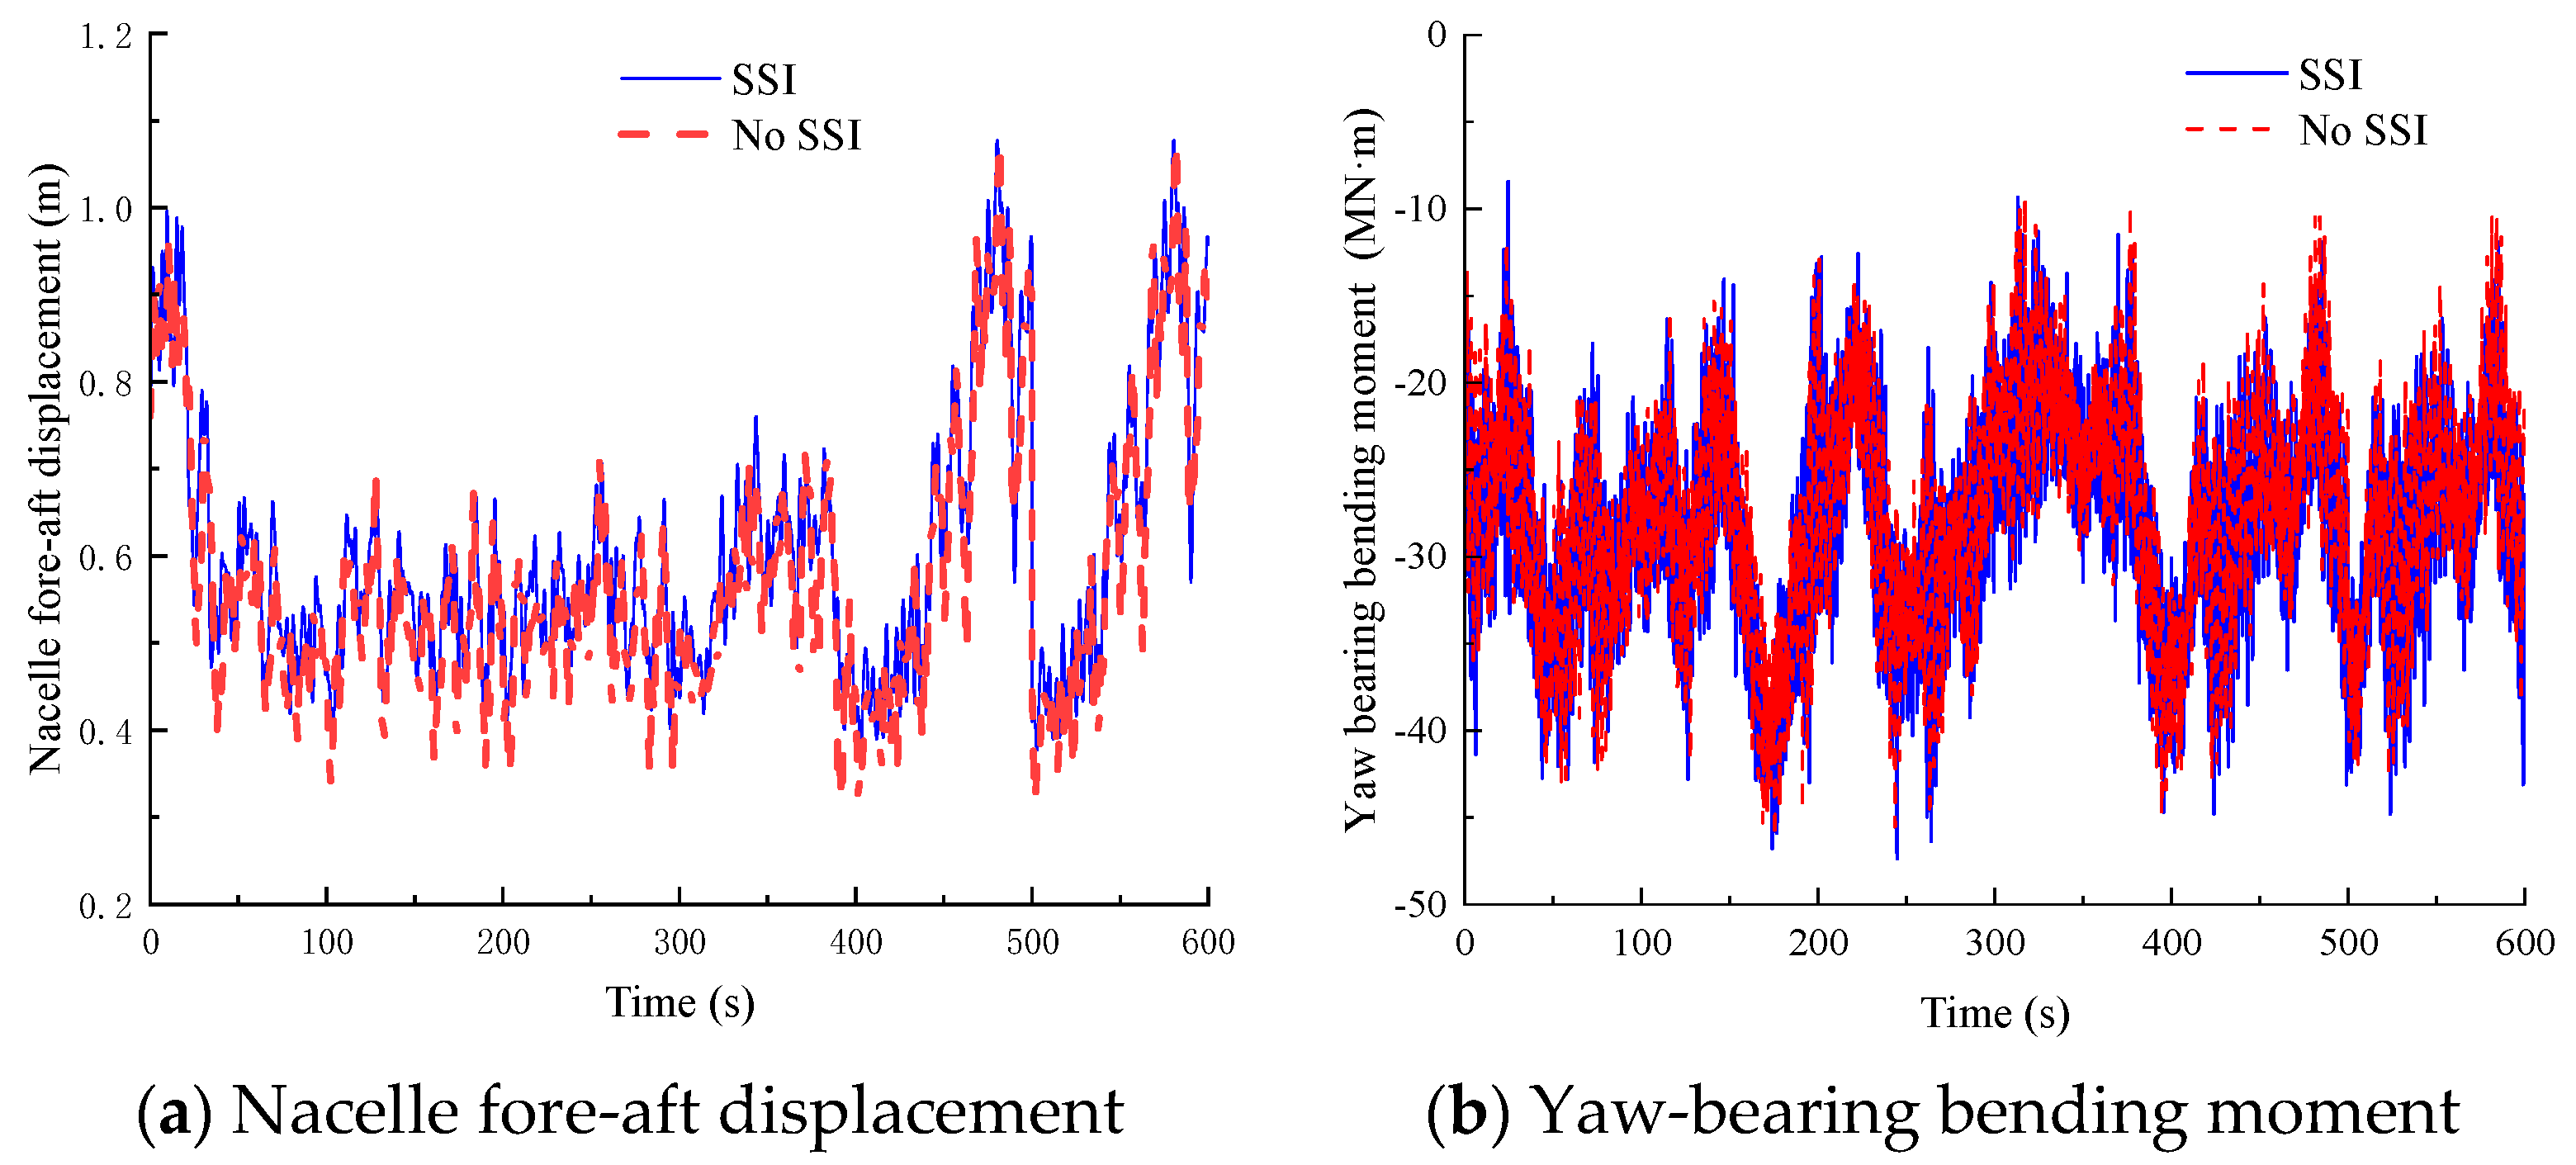
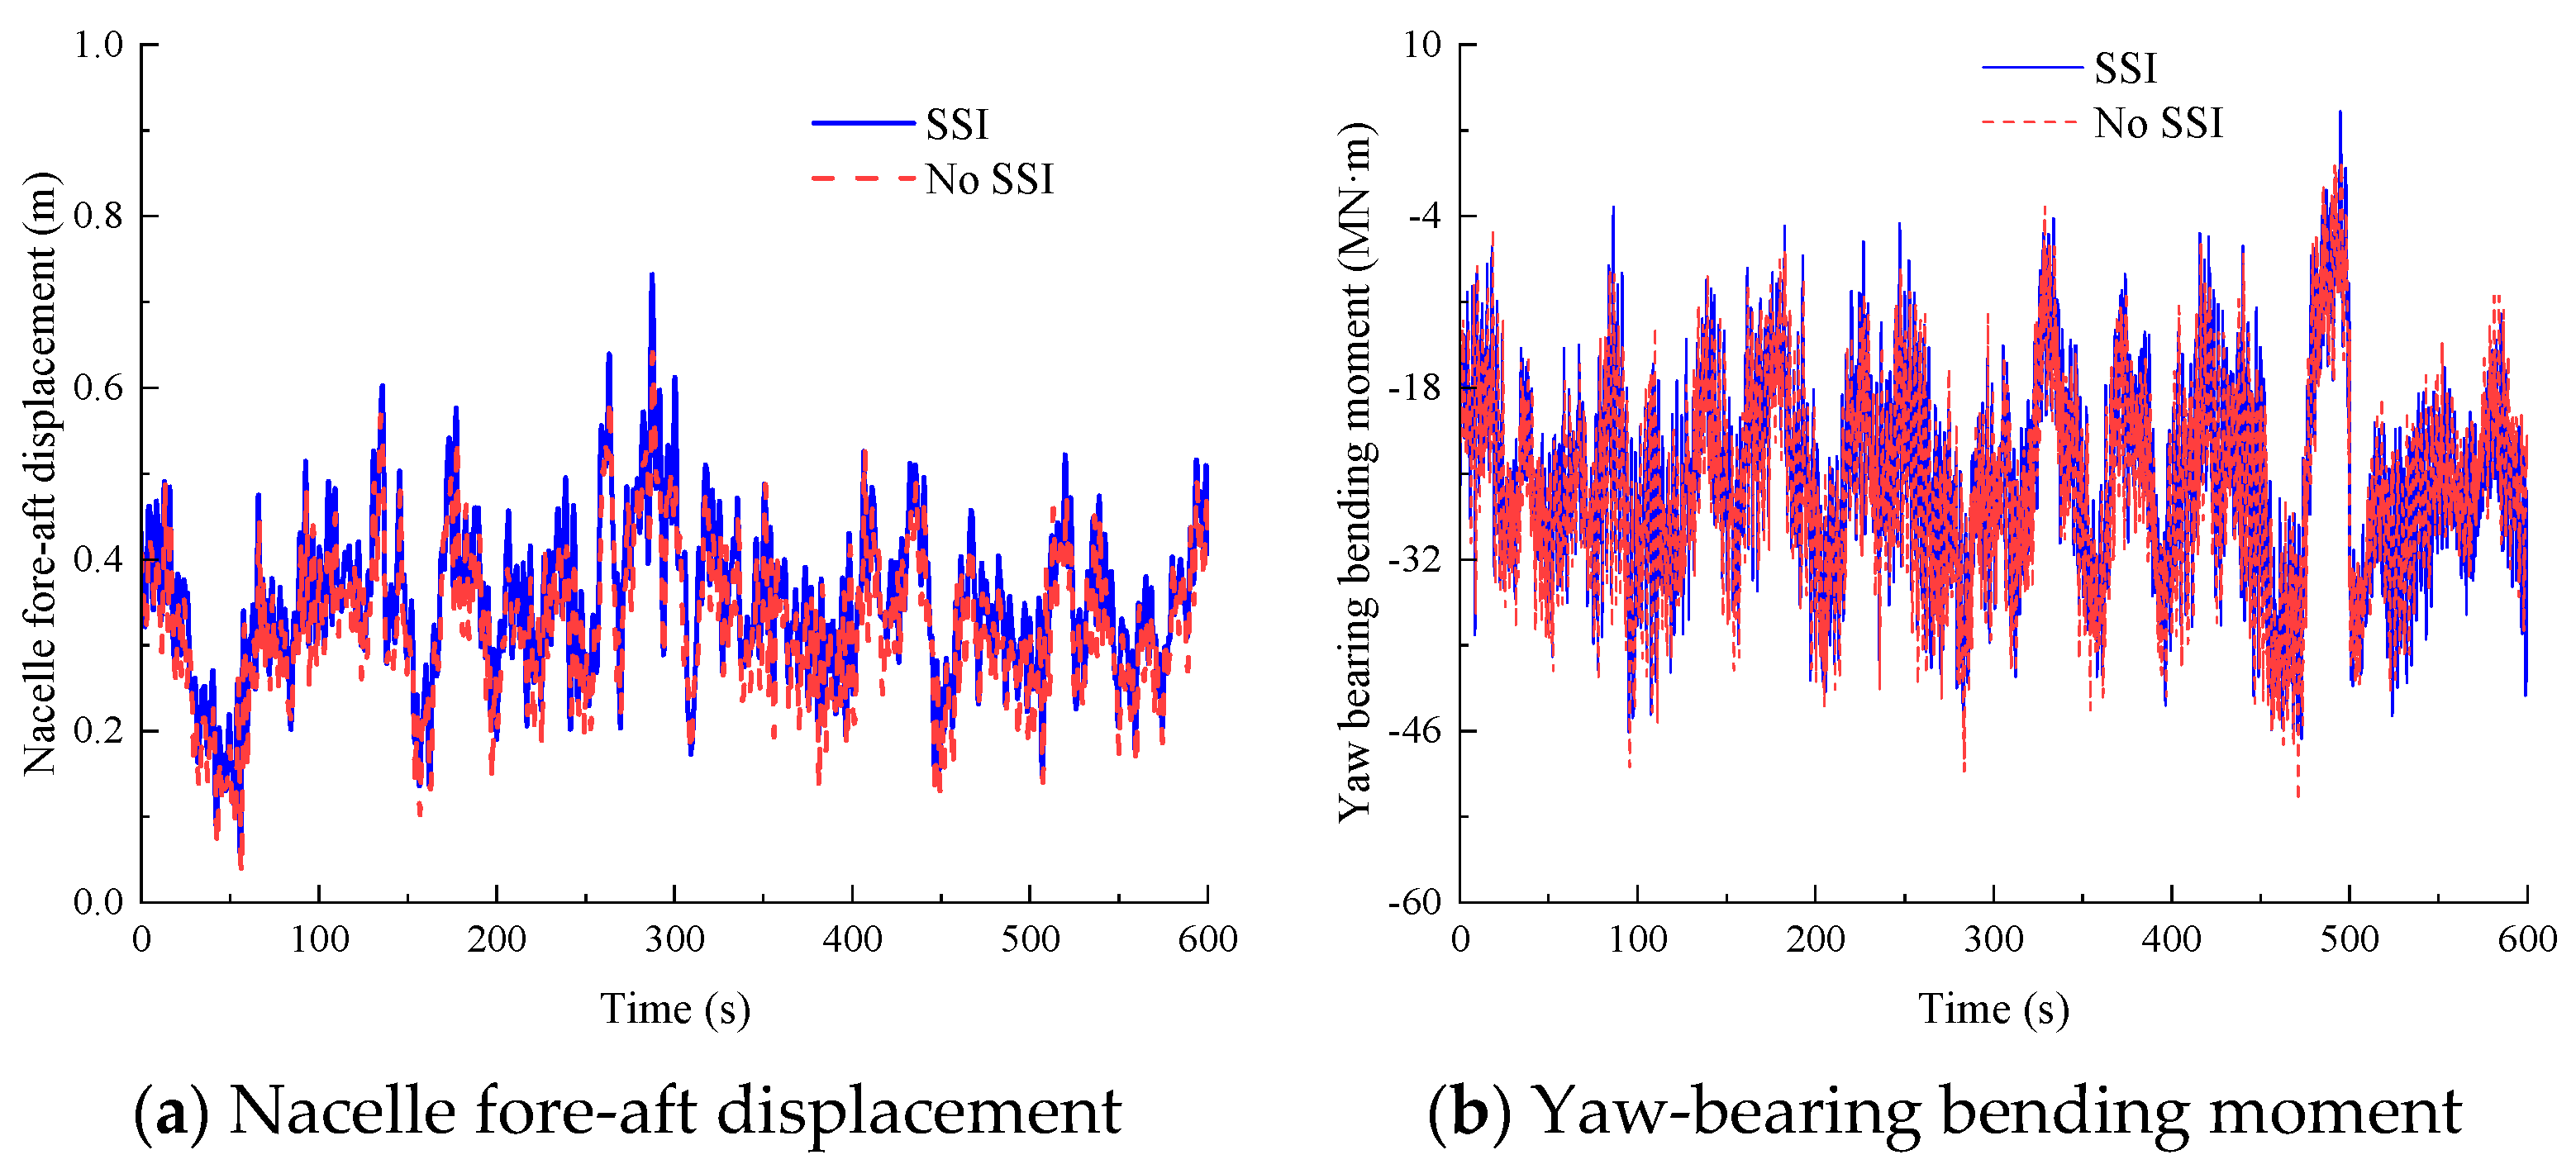
Figure 10a,b present the nacelle displacement in the
x-axis and yaw-bearing bending moment about the
y-axis when the mean wind speed of hub height is 12 m/s. When SSI is considered, peak values reach 1.08 m for nacelle displacement and 47.34 MN·m for yaw-bearing bending moment. The Fourier amplitude spectra of nacelle displacement and acceleration reveal that the first mode dominates the dynamic response of 15 MW JOWT excited by this load case.
Table 12 quantifies relative errors induced by SSI exclusion, revealing a 15% overestimation of nacelle acceleration peaks in no-SSI analyses. Relative errors for other parameters (e.g., peak, mean, and standard deviation of yaw-bearing shear force and bending moment) remain within the (−5%, 5%) range.
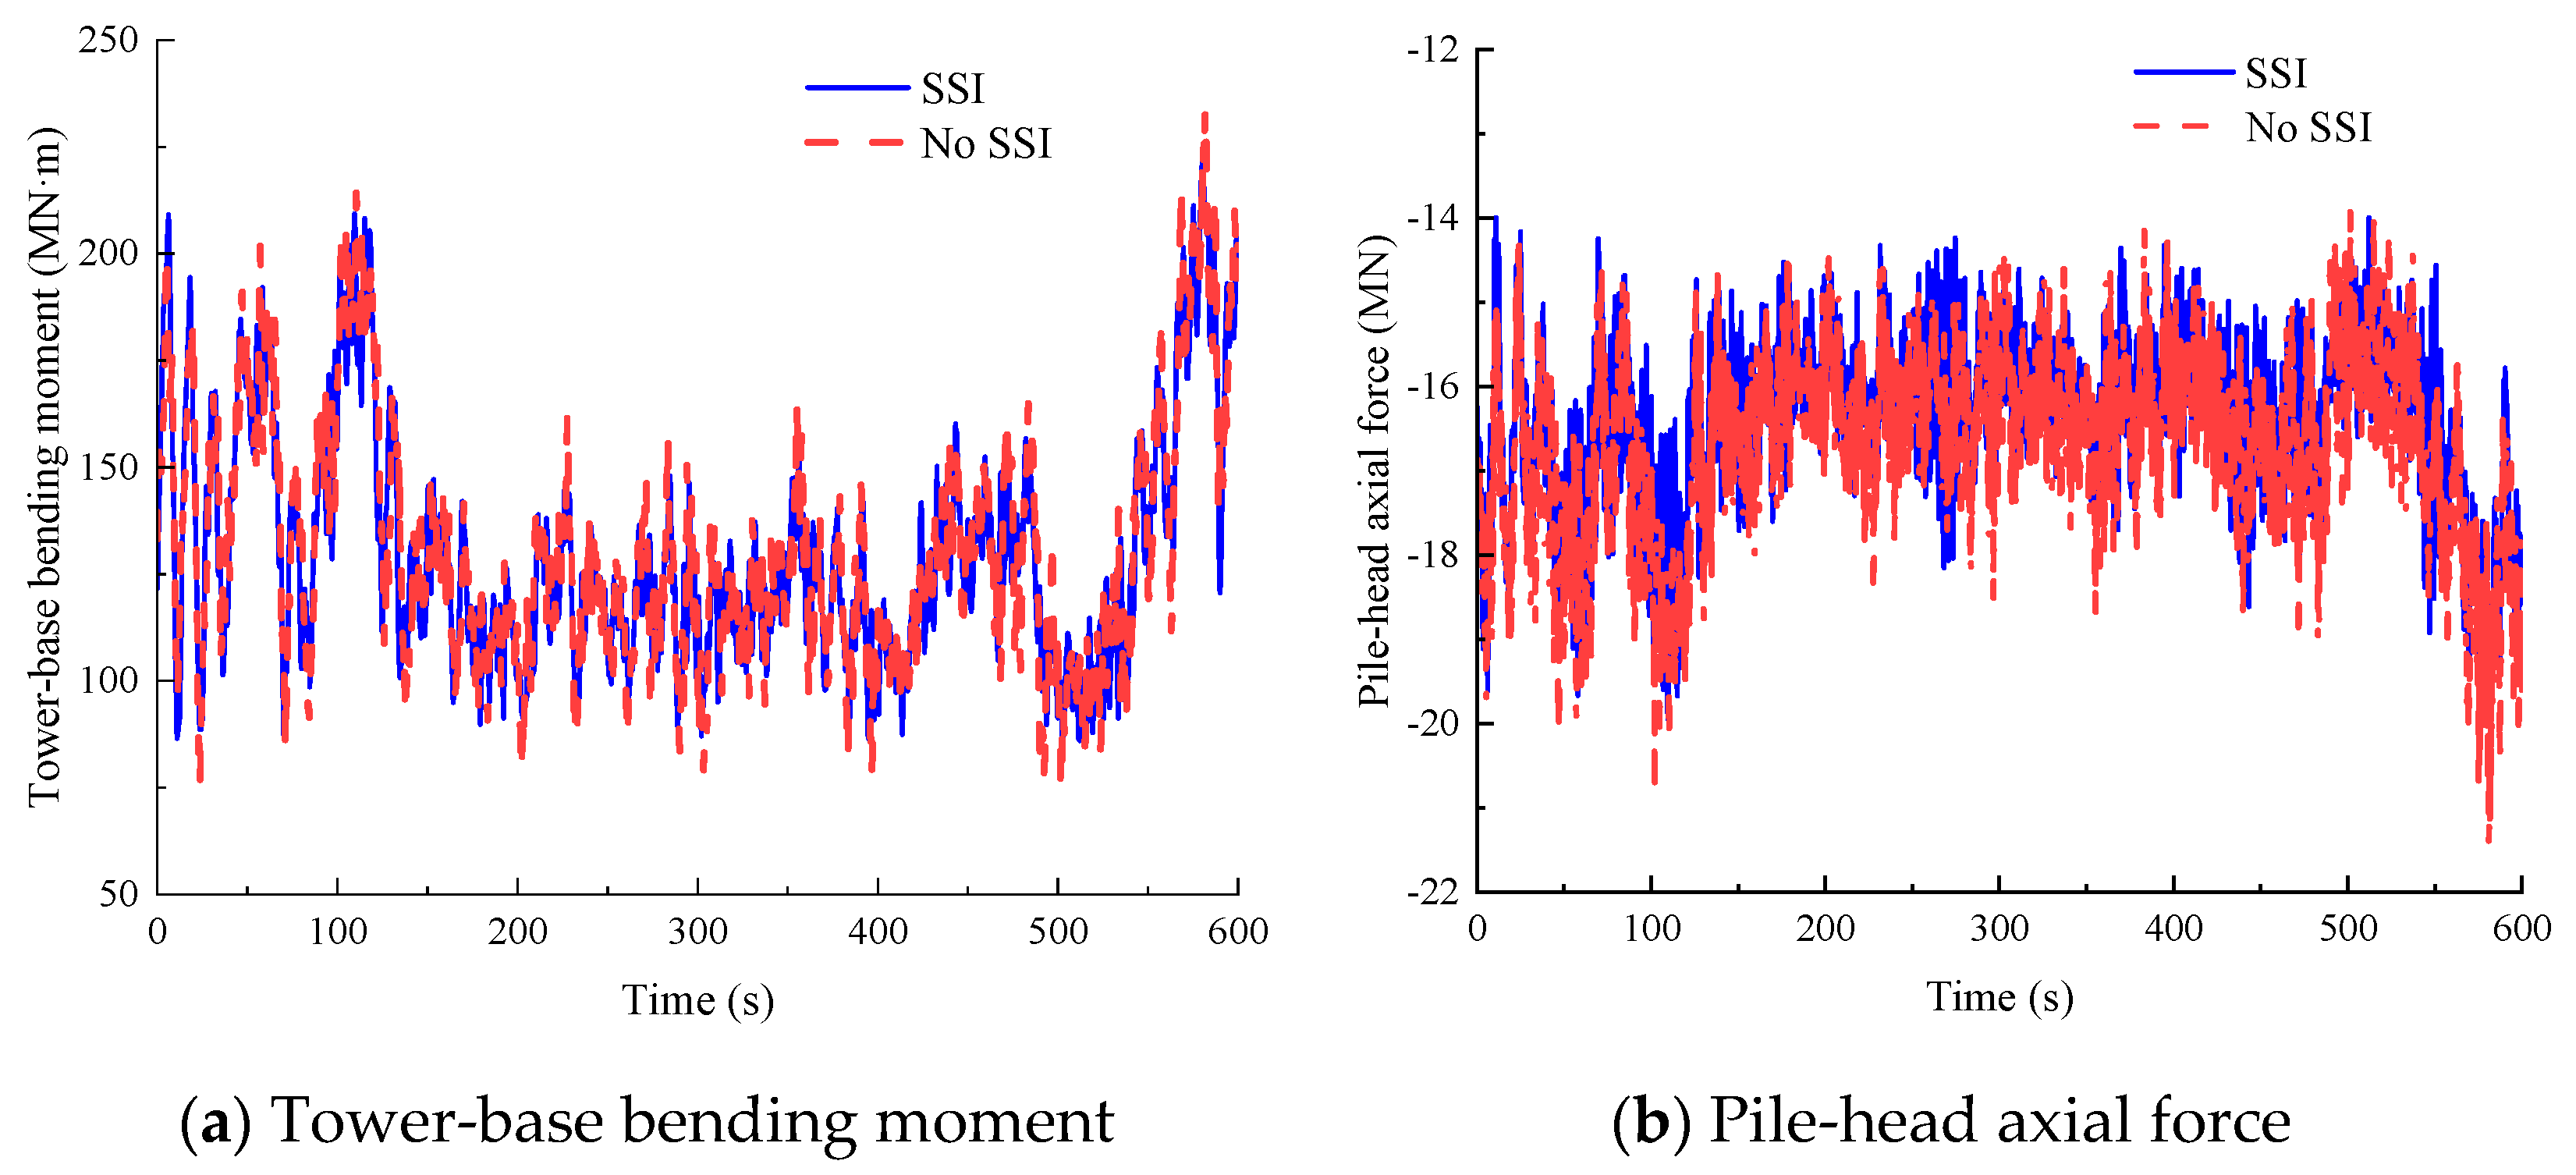
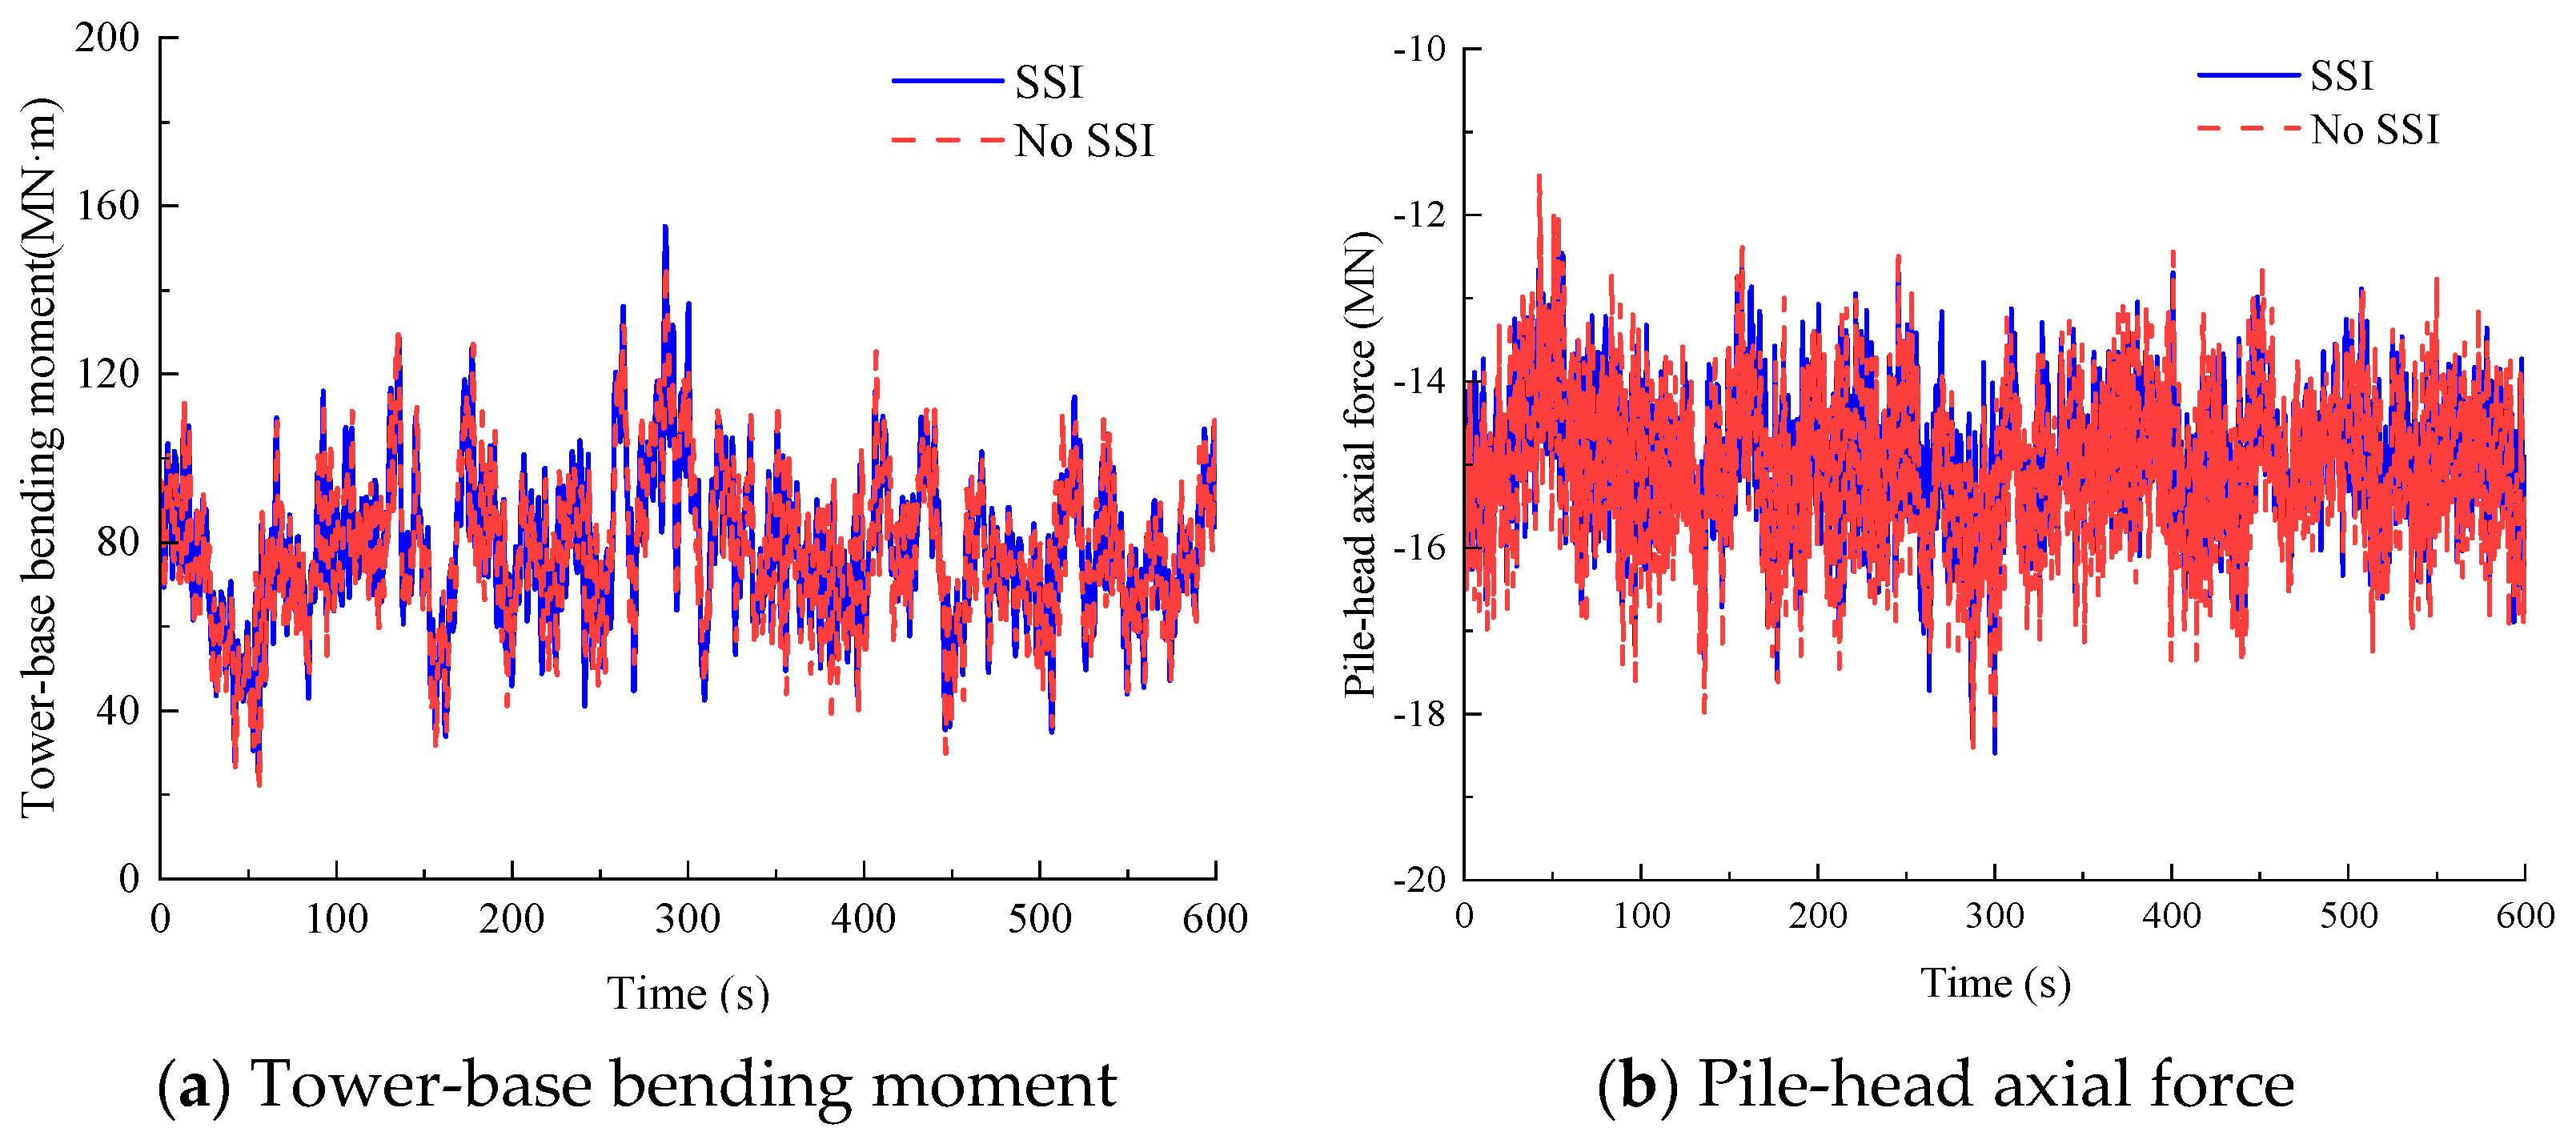
Figure 11 presents time histories of critical structural responses under a mean wind speed of 12 m/s at hub height: tower-base bending moment about the
y-axis and pile-head axial force of pile 4. When SSI is considered, peak values reach 222.65 MN·m for tower-base bending moment and 19.95 MN for pile-head axial force.
Table 13 quantifies relative errors when neglecting the SSI, revealing greater influence on these parameters compared with nacelle motion characteristics and yaw-bearing internal forces. Specifically, the pile-head bending moment exhibits the highest sensitivity to foundation modeling, with the no-SSI model causing underestimations of 91.62% in peak value, 96.47% in mean value, and 57.77% in standard deviation. Additionally, the relative error in pile-head axial force standard deviation reaches 11.4%, while other parameters (e.g., peak, mean, and standard deviation of the tower-base shear force and bending moment) demonstrate relative errors within the (−10%, 10%) range.
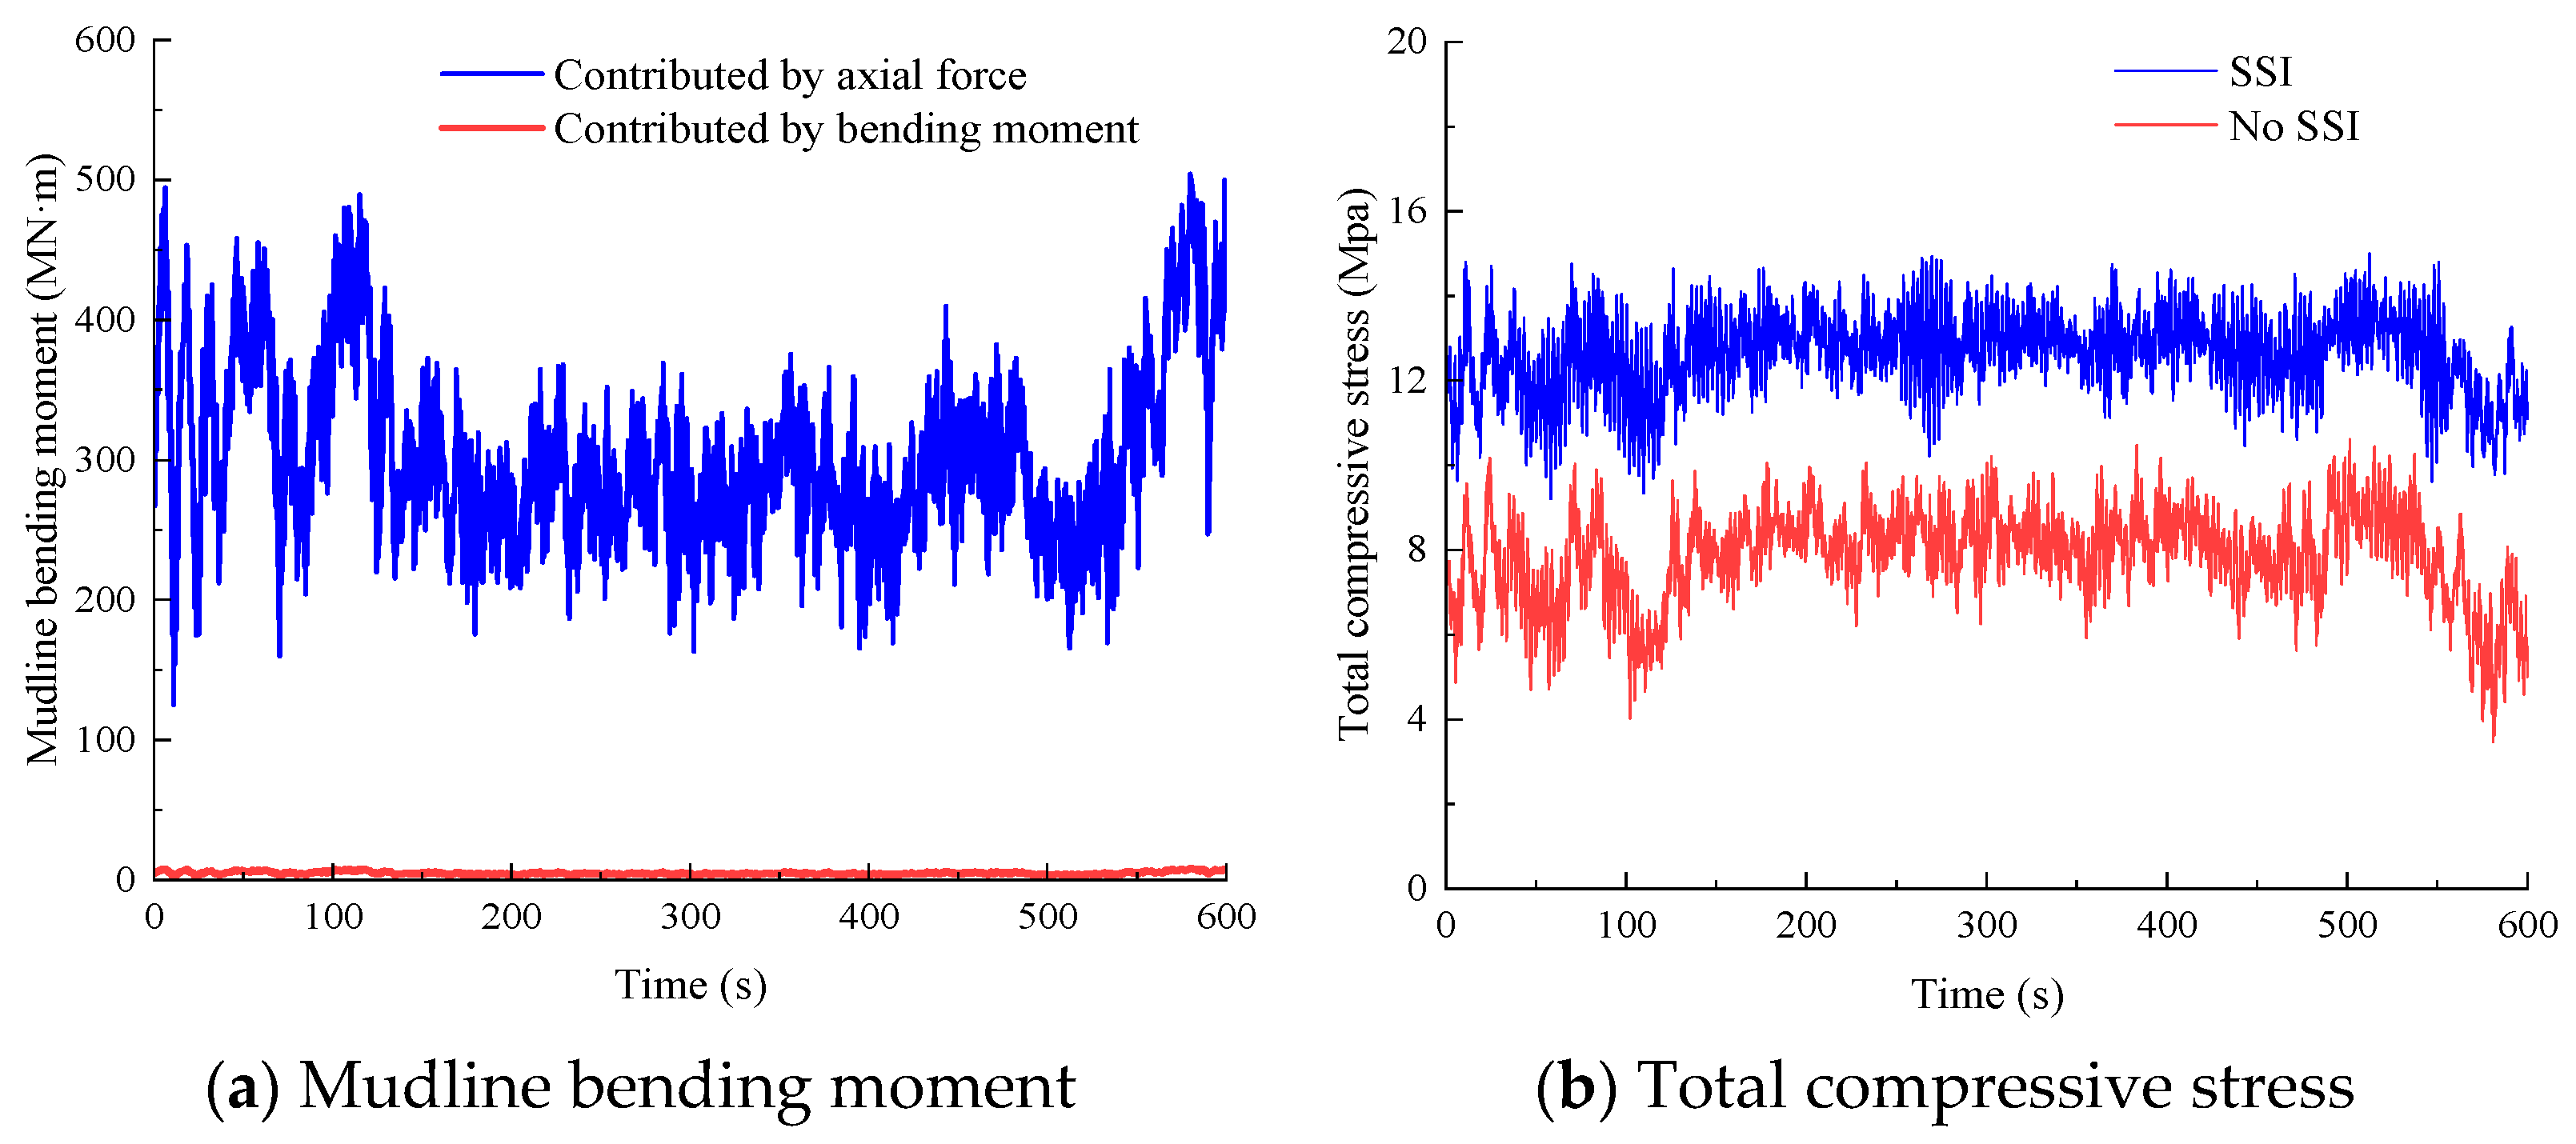
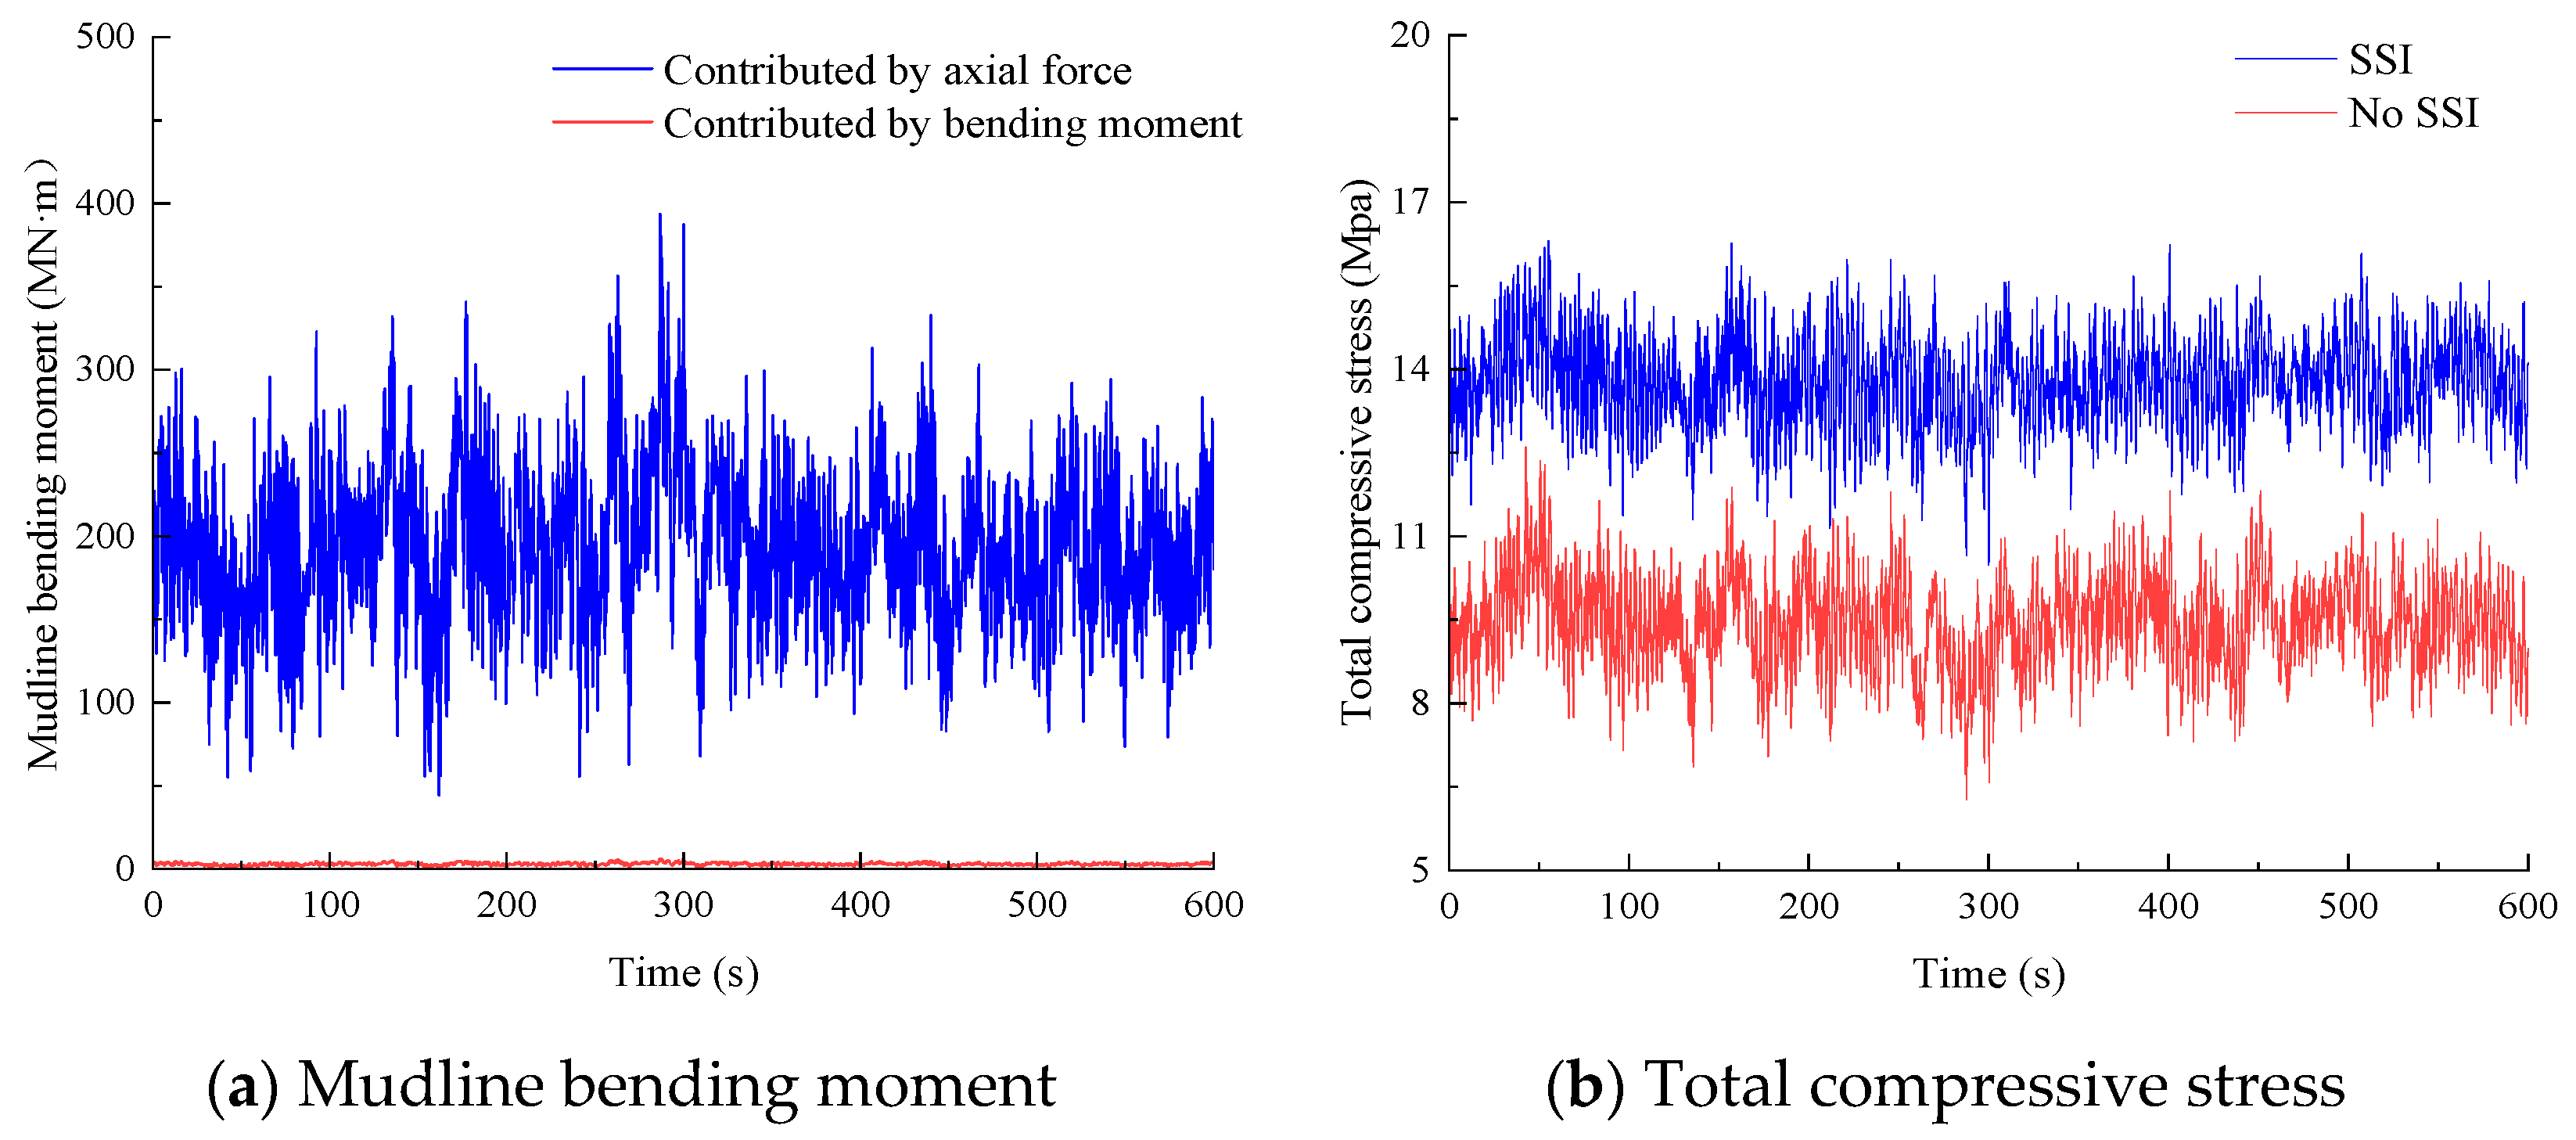
Figure 12a illustrates the anti-overturning moments contributed by pile-head axial forces and bending moments under a mean wind speed of 12 m/s at hub height. The analysis confirms that anti-overturning resistance is predominantly provided by pile-head axial forces, with bending moment contributions remaining statistically negligible. This demonstrates that the jacket foundation piles primarily function as vertical load-bearing members under this operational condition, resisting overturning moments through axial forces.
Figure 12b reveals that the SSI model yields 40% higher maximum compressive stresses at the pile head compared to the no-SSI case.
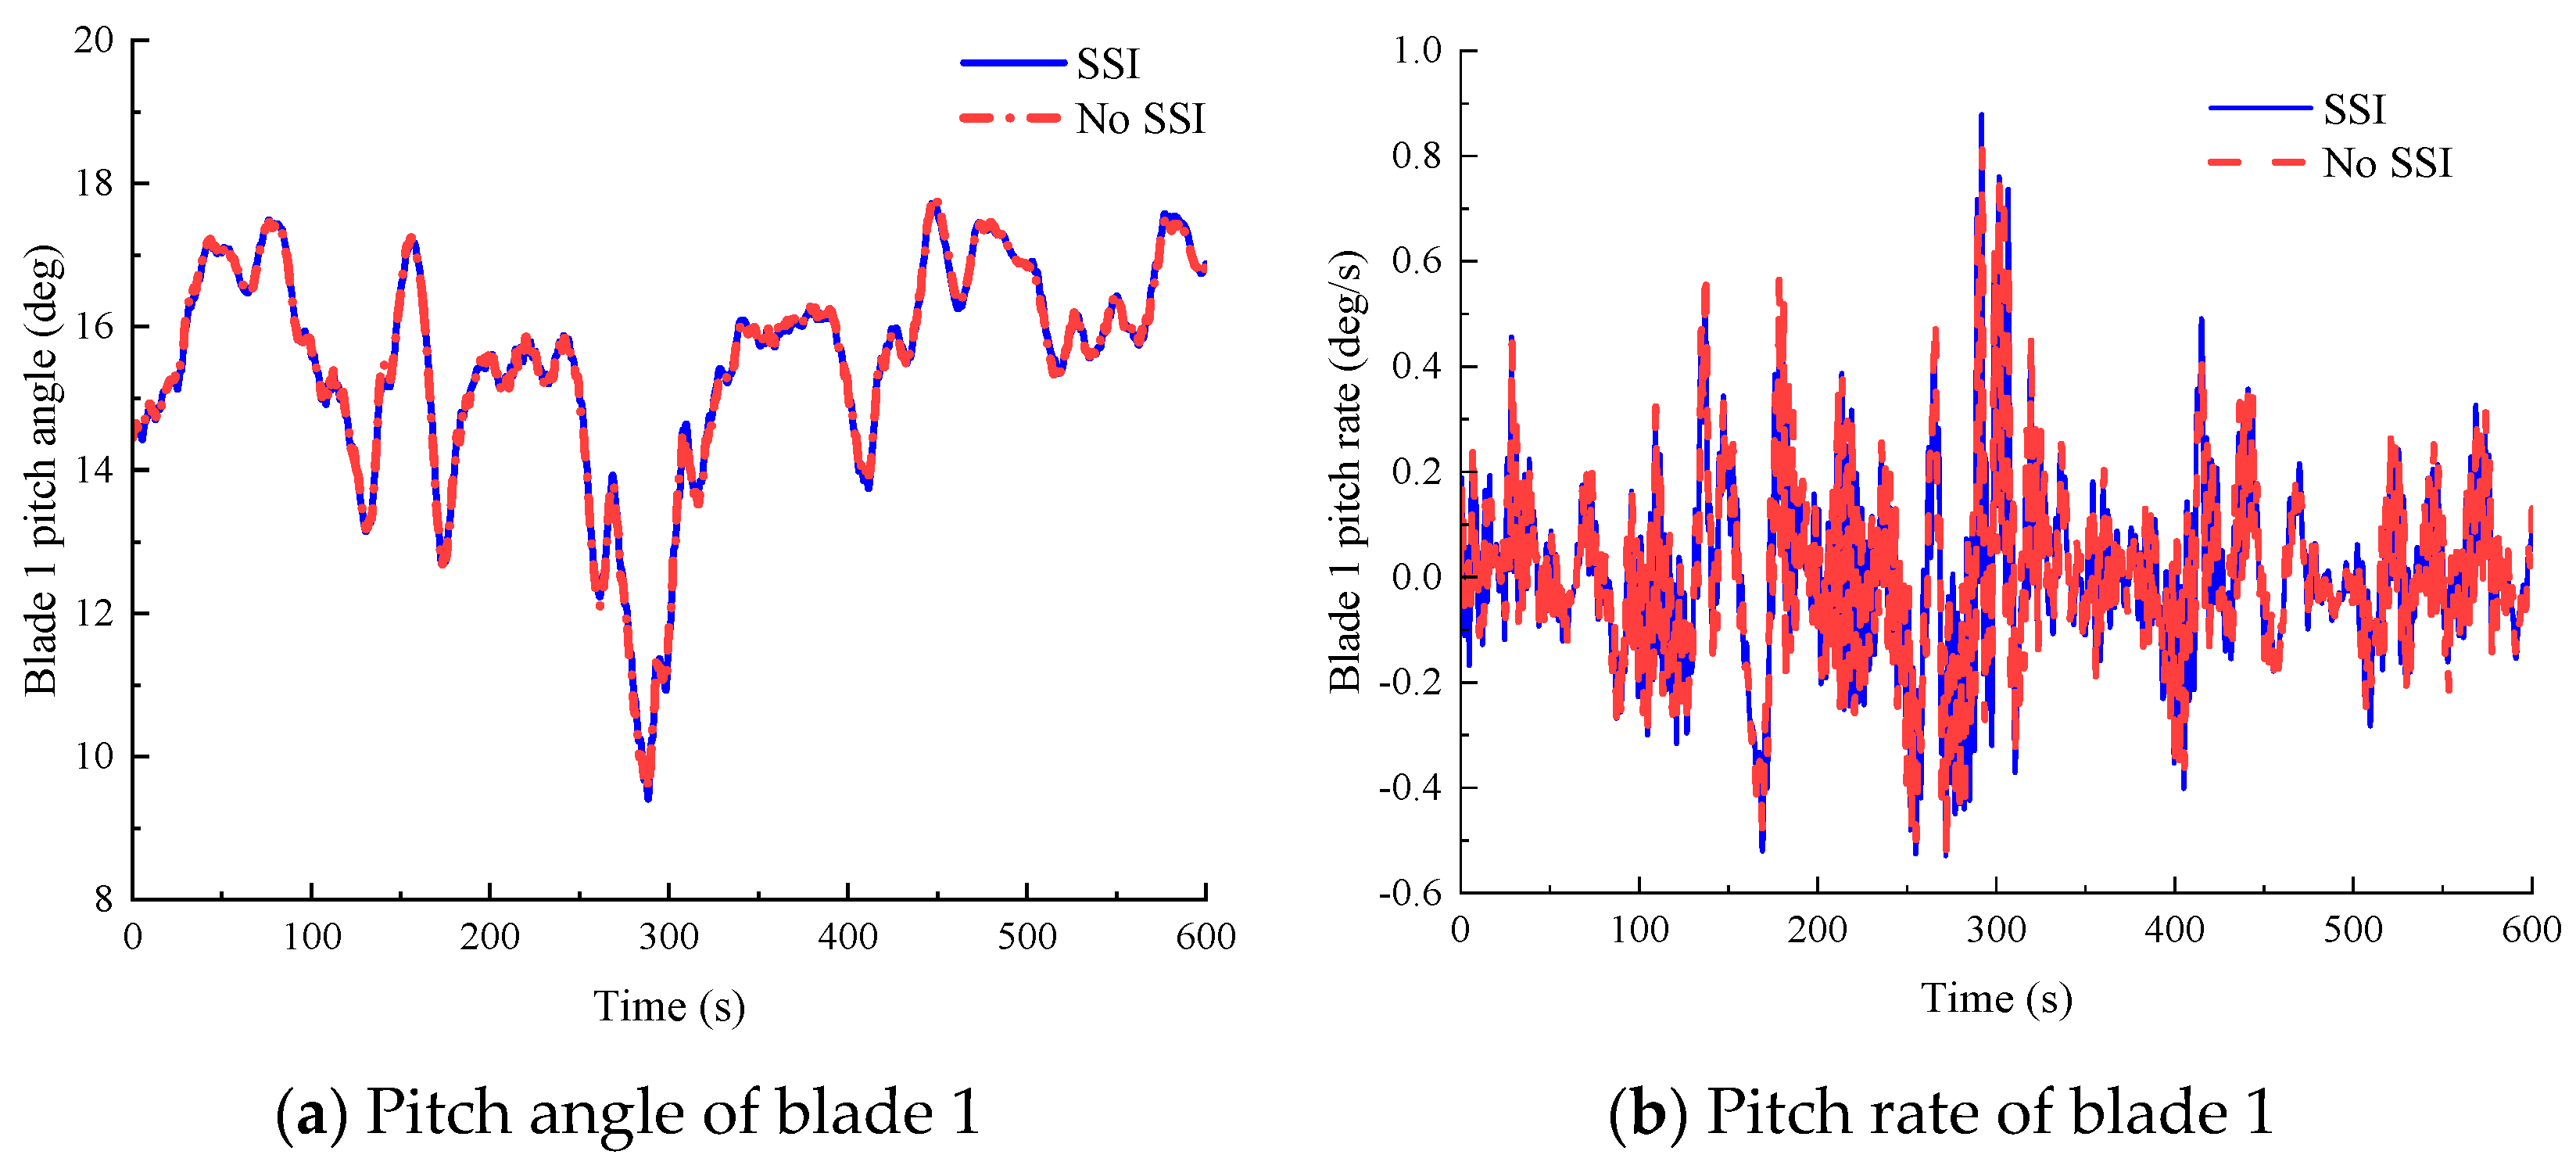
Figure 13a,b compare blade 1 pitch angles and pitch rates between SSI and no-SSI models when the mean wind speed of hub height is 18 m/s. Overall, the pitch angle exhibits a substantial increase compared to the previous load case. The mean pitch angle reaches 15.7° under current conditions, contrasting with 6.6° observed in the scenario with a 12 m/s hub-height mean wind speed. While both models exhibit minimal discrepancies in pitch-angle time histories, the SSI model demonstrates marginally reduced pitch rate variations compared to the no-SSI model.
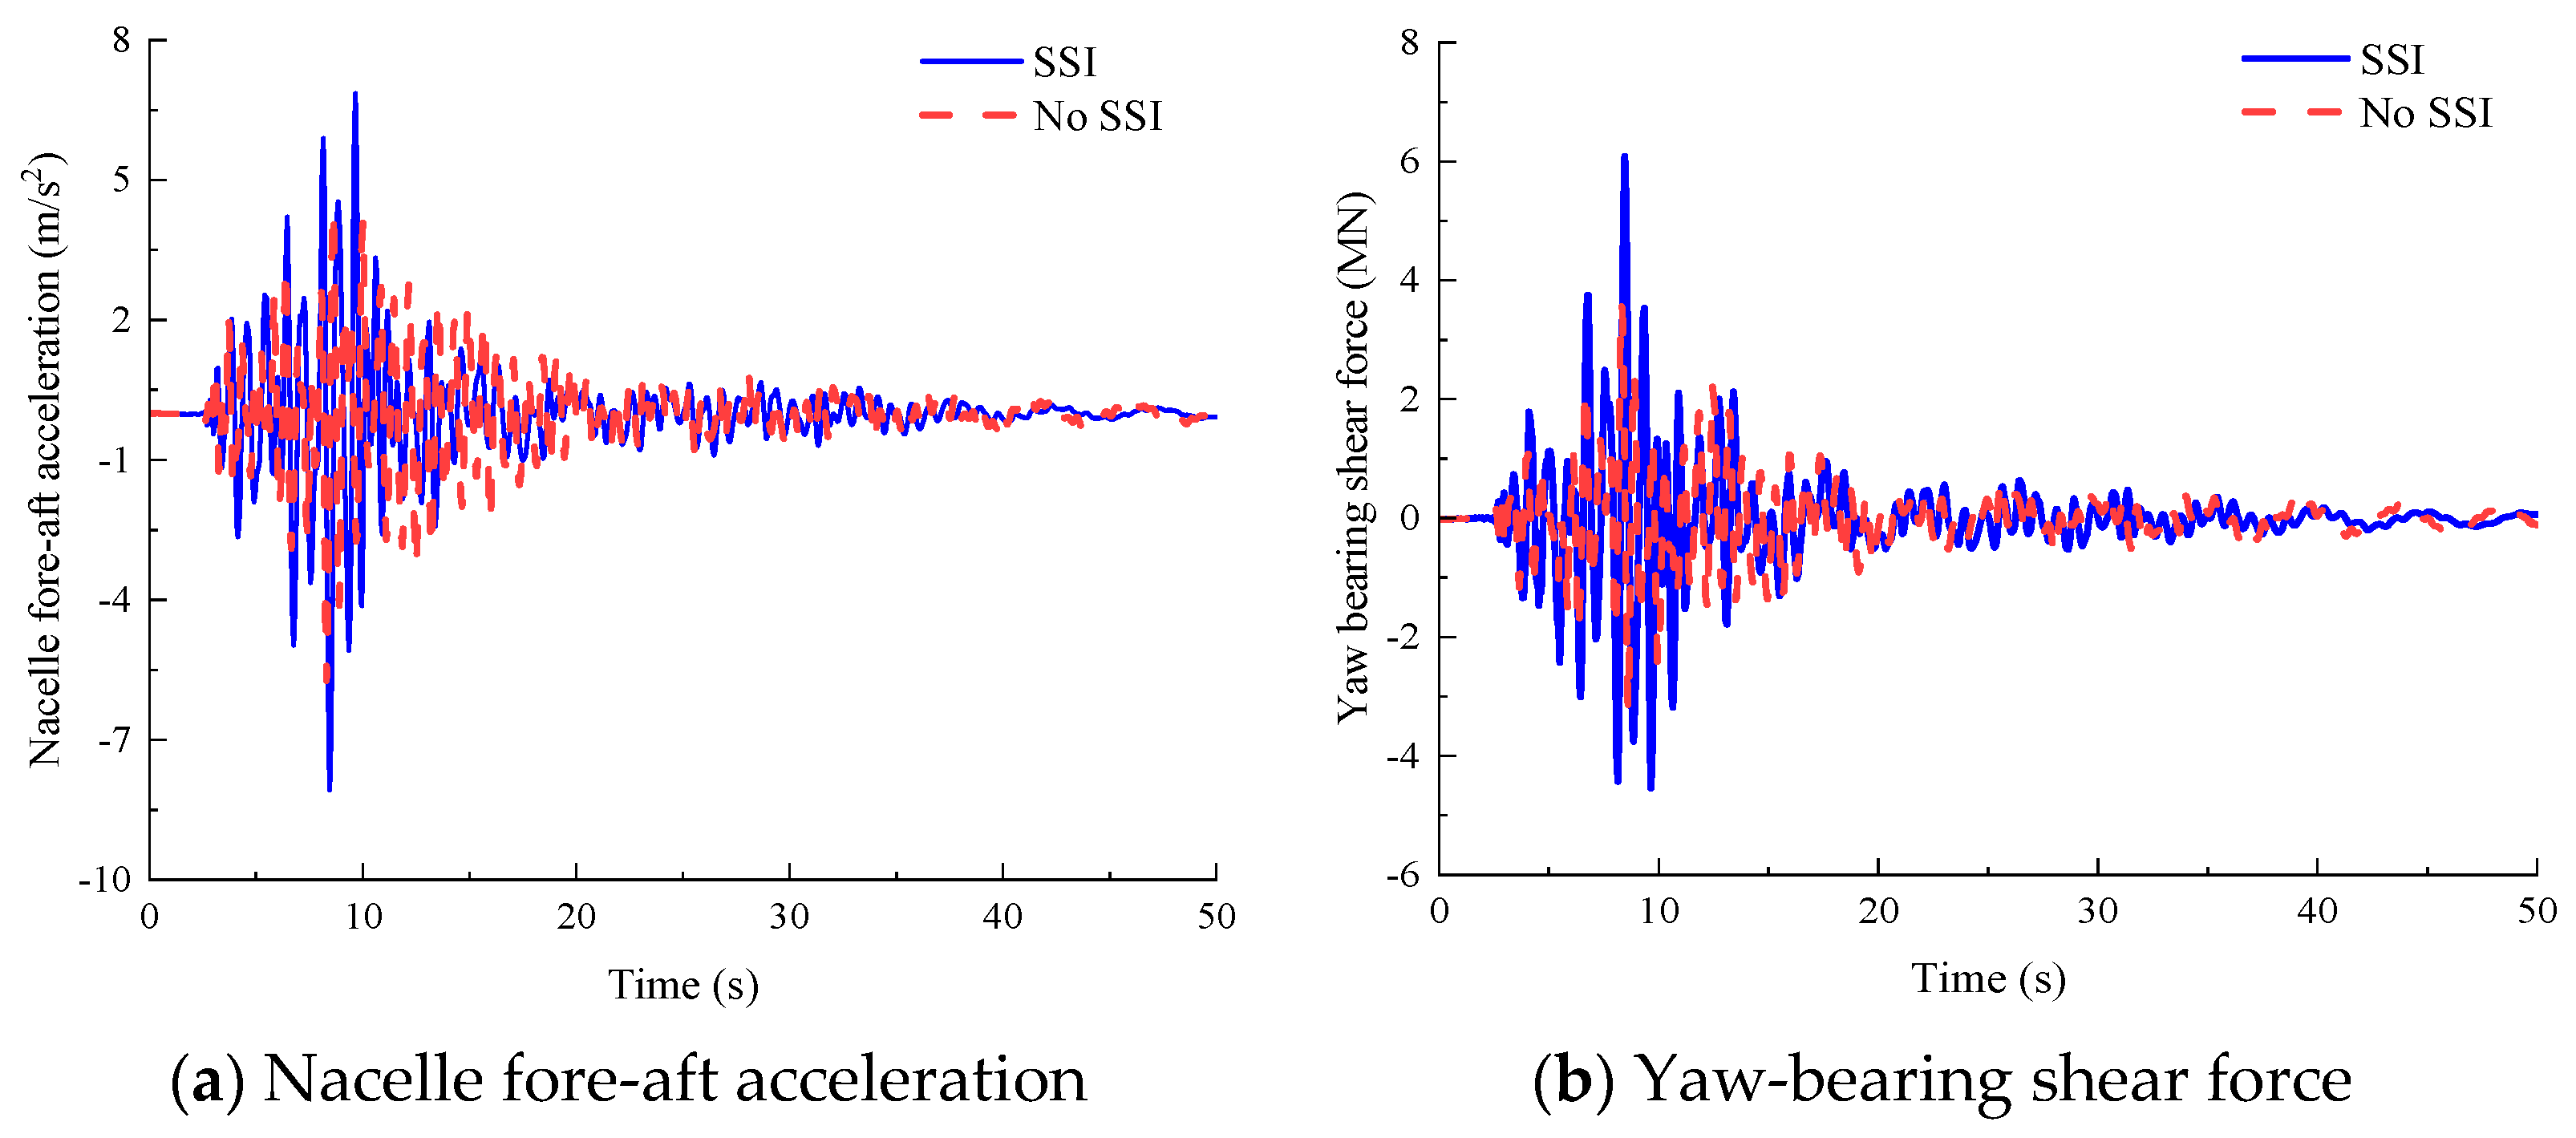
Figure 14 presents the dynamic responses of the 15 MW JOWT under a mean wind speed of 18 m/s at hub height, including time histories of nacelle displacement in the
x-axis and yaw-bearing bending moment about the
y-axis. The Fourier amplitude spectra of nacelle displacement and acceleration reveal that the first mode dominates the dynamic response of the 15 MW JOWT excited by this load case.
Table 14 quantifies relative errors induced by the no-SSI model, revealing a 10.98% error in peak yaw-bearing bending moment. Relative errors for other parameters (e.g., peak, mean, and standard deviation of yaw-bearing shear force) remain within the (−10%, 10%) range, demonstrating moderate SSI effects under this load case.
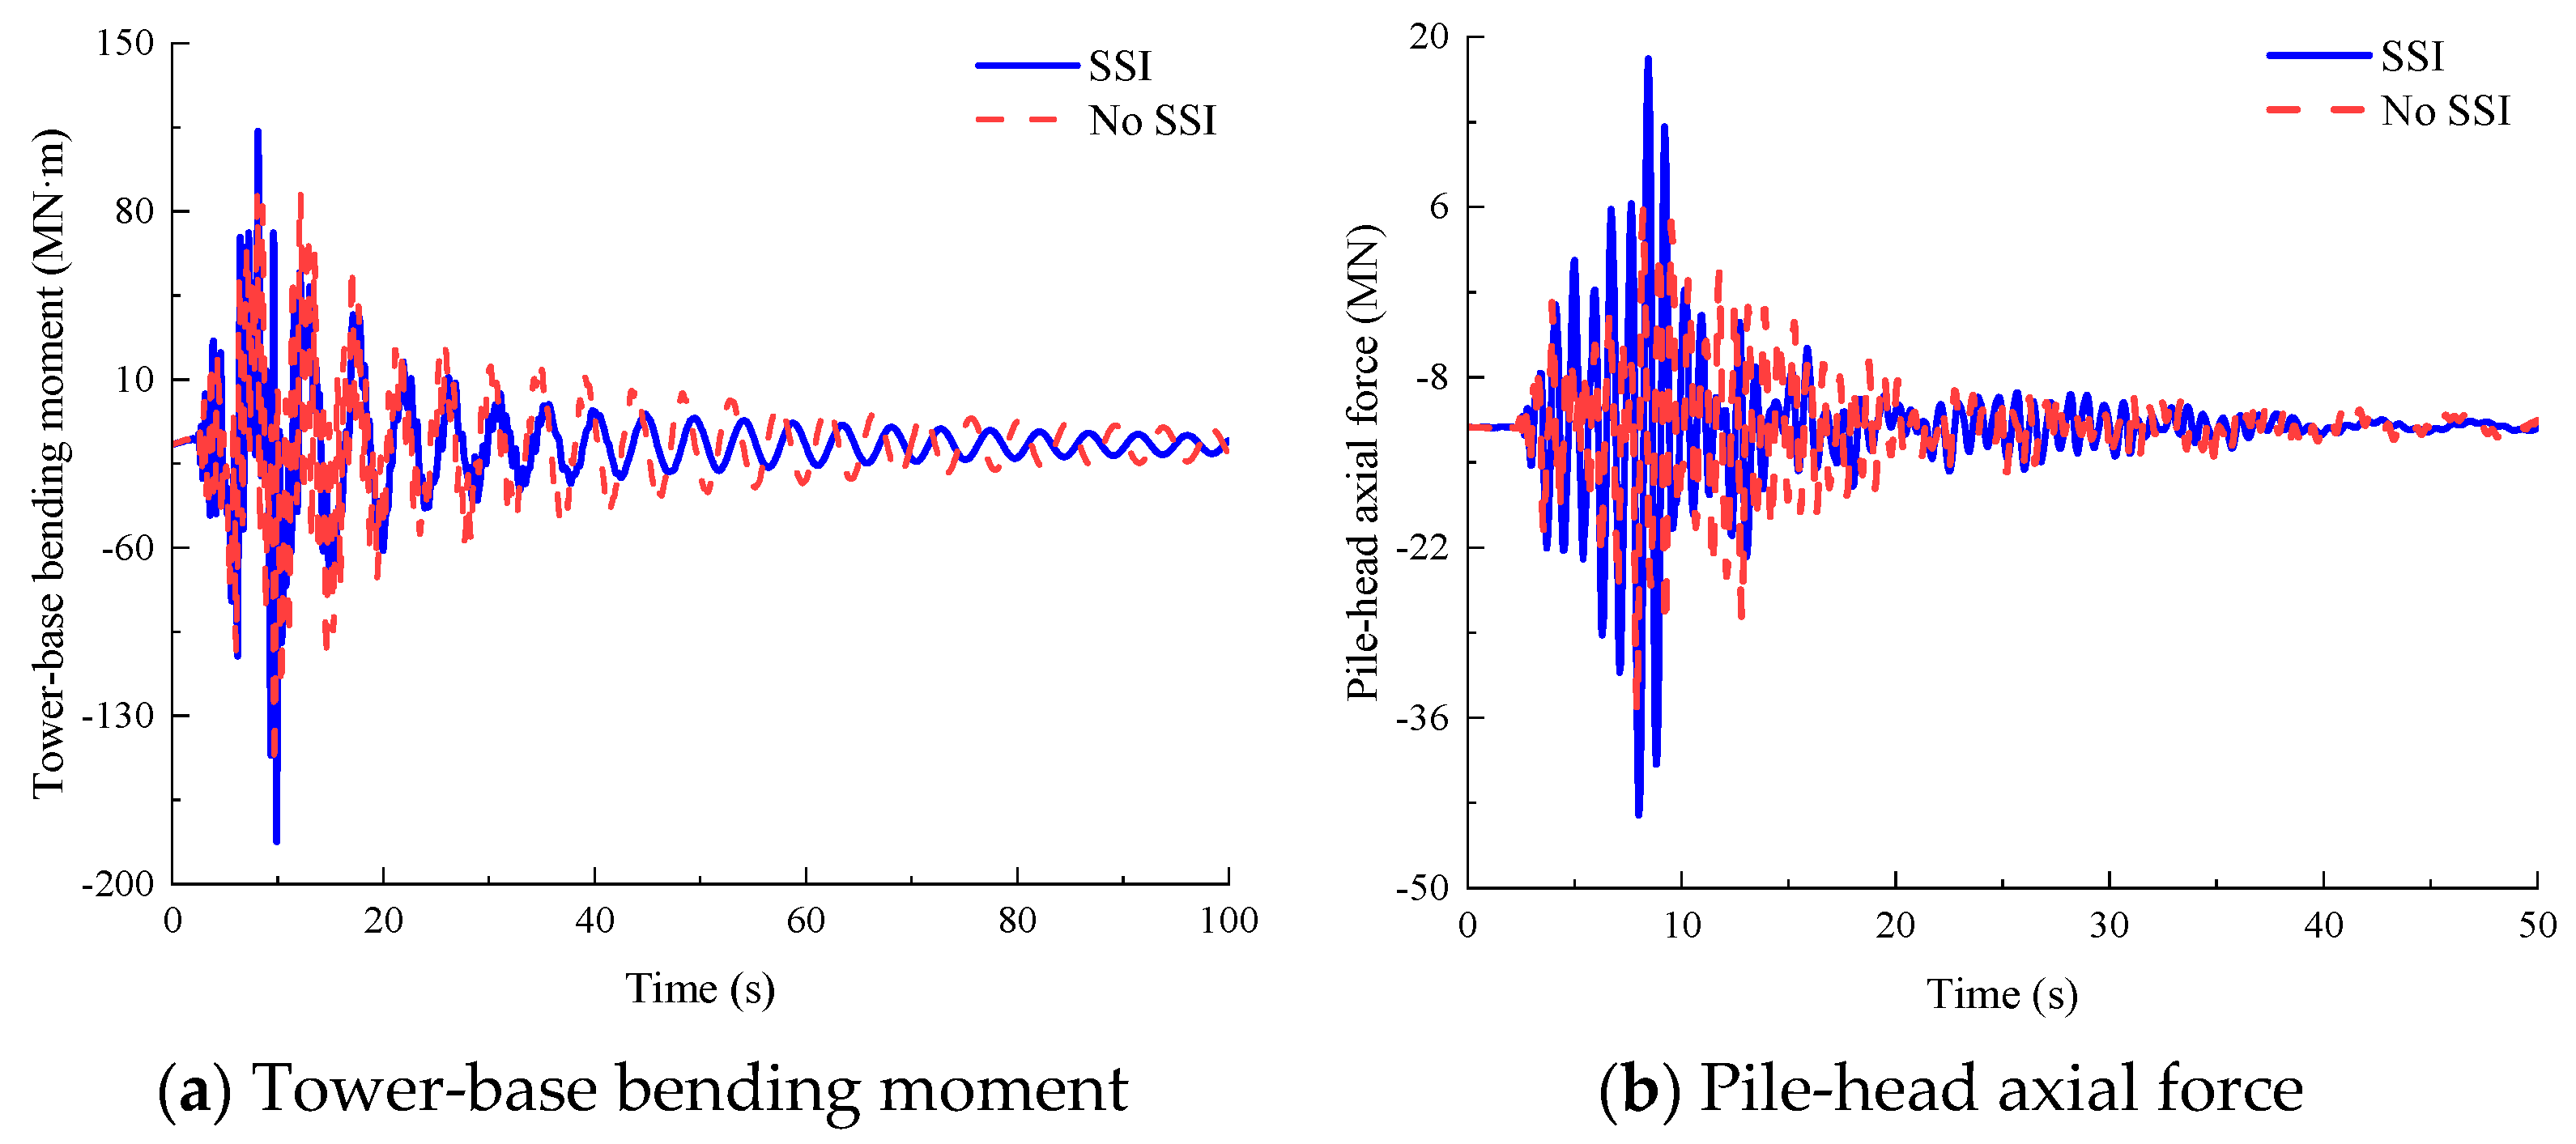
Figure 15 presents time histories of critical structural responses under a mean wind speed of 18 m/s at the hub height, including the tower-base bending moment about the
y-axis and pile-head axial force of pile 4. When SSI is considered, the peak responses reach 155.162 MN·m for tower-base bending moment and −18.47 MN for pile-head axial force.
Table 15 details the effects of no-SSI on these parameters. Specifically, the analysis reveals extreme sensitivity of pile-head bending moment to foundation modeling, with no-SSI causing underestimations of 86.50% in peak value, 91.11% in mean value, and 54.84% in standard deviation. The relative errors for other parameters (e.g., peak, mean, and standard deviation of yaw-bearing shear force and bending moment) remain within (−10%, 10%) except for the pile-head axial force standard deviation (11.97%).
Figure 16a illustrates that the anti-overturning moment is predominantly resisted by pile-head axial forces, while the contribution from bending moment is negligible in comparison.
Figure 16b quantifies maximum compressive stresses at the pile head, revealing that the no-SSI model results in a 38% underestimation of the maximum compressive stress.
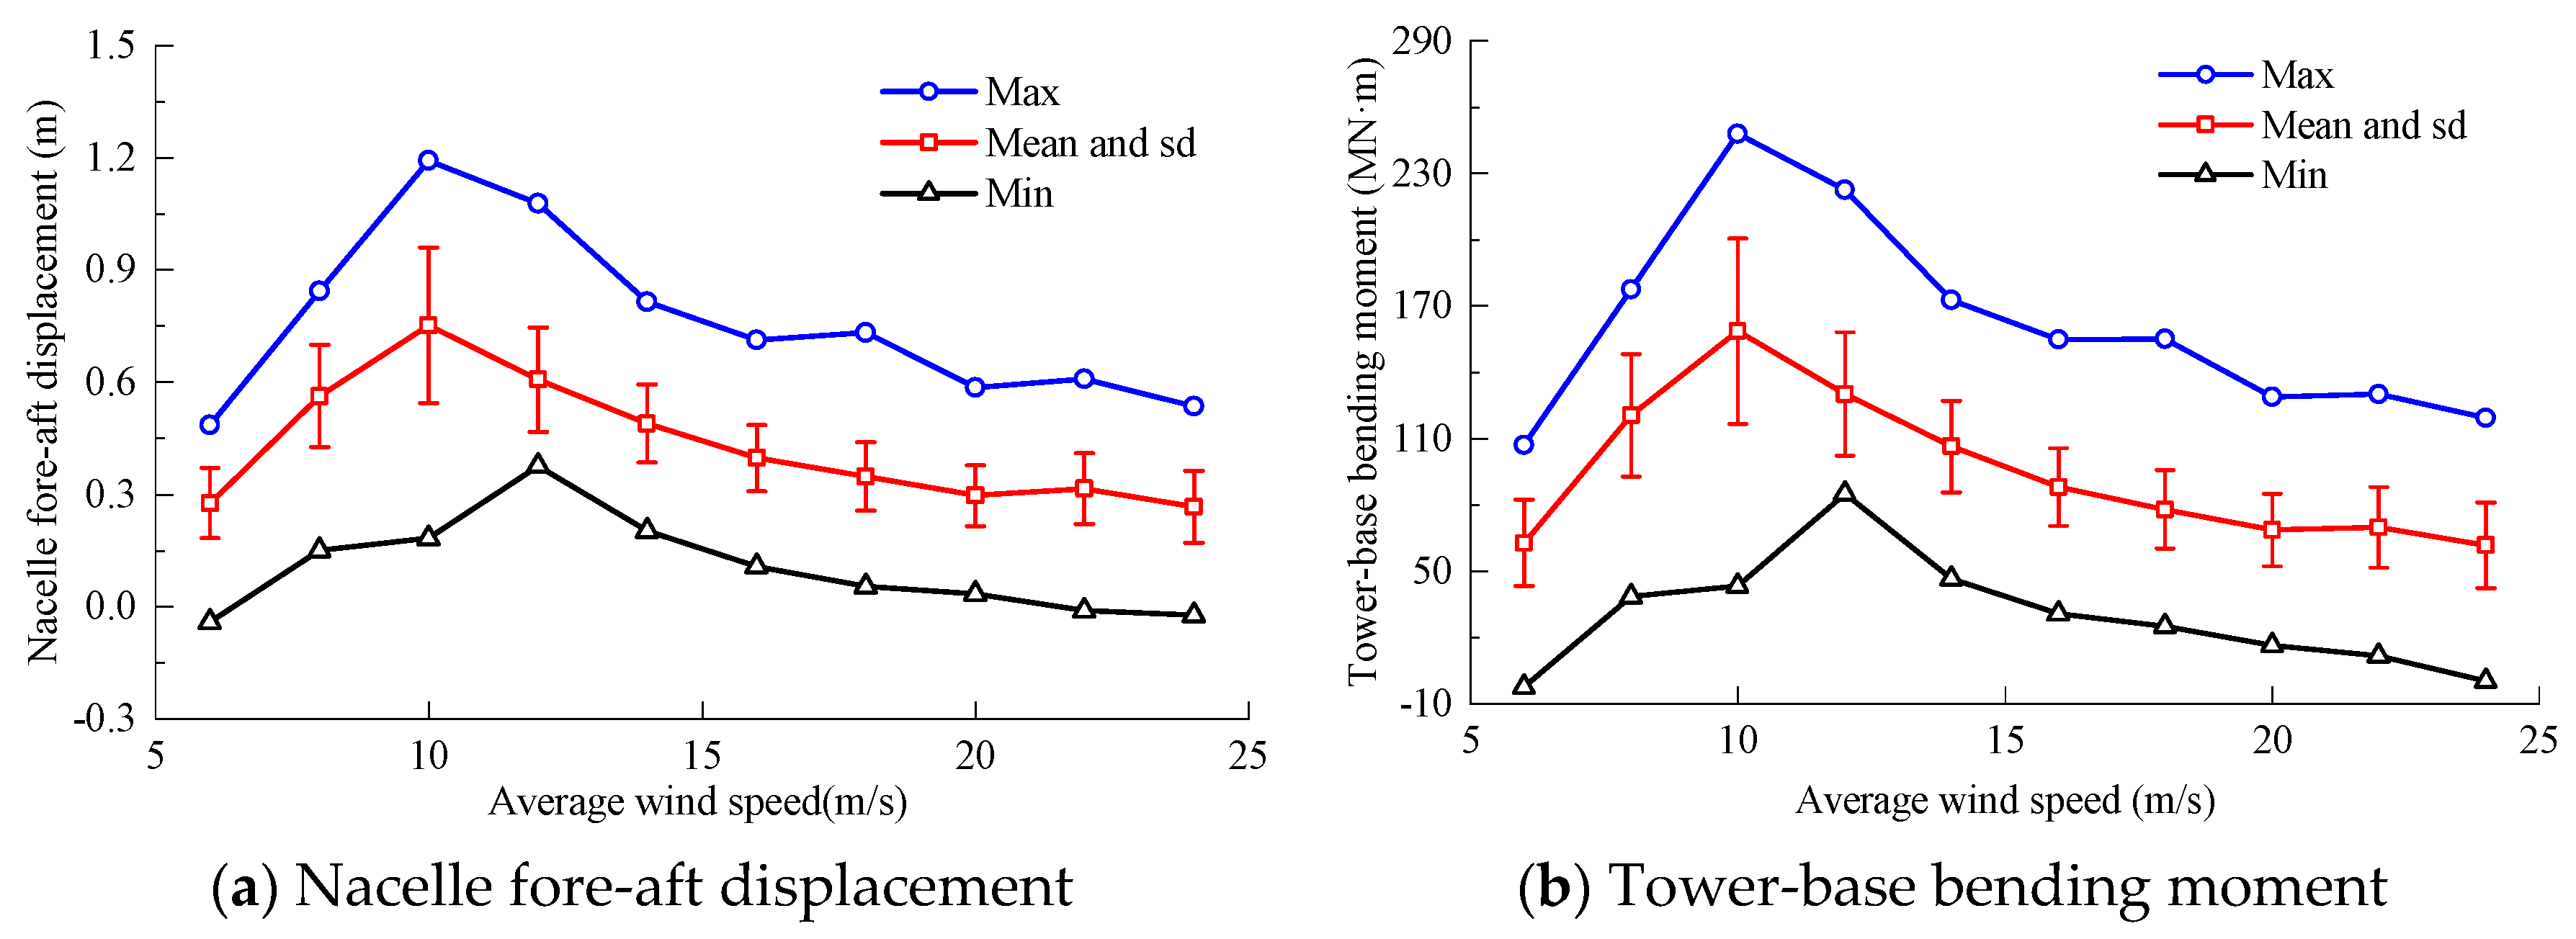
Figure 17 compares peak values, minima, and standard deviations (SD) of nacelle displacement in the
x-axis and tower-base bending moment about the
y-axis for the 15 MW JOWT with SSI considered. The peak values for these statistical parameters consistently occur under load case 3 or 4, which aligns with the rated wind speed of 10.8 m/s. According to the dynamic response of JOWT, the controller described in
Section 2.5 effectively maintains the operational stability of the 15 MW JOWT, thereby demonstrating its suitability for integrated dynamic analyses of running OWTs.
3.3. Dynamic Response of 15 MW OWT Excited by Extreme Wind, Wave and Current
Under extreme wind conditions with a mean wind speed of 50 m/s at the hub height, the JOWT enters the parked condition with blades pitched to 90°.
Figure 18a,b present the dynamic responses of the 15 MW JOWT at this wind speed, including nacelle displacement in the
x-axis and yaw-bearing bending moment about the
y-axis. When SSI is considered, the peak values reach 0.421 m for nacelle displacement and 54.97 MN·m for yaw-bearing bending moment. The Fourier amplitude spectra of nacelle displacement and acceleration reveal that the first mode dominates the dynamic response of 15 MW JOWT excited by this load case.
Table 16 quantifies the relative errors induced by the no-SSI model, revealing significant underestimation of nacelle displacement parameters: 20.33% in peak value, 19.46% in mean value, and 18.09% in standard deviation. The standard deviation of the yaw mechanism shear force is underestimated by 12.46%, while relative errors for other parameters (e.g., peak, mean, and standard deviation of the yaw-bearing bending moment) remain within the range of (−10%, 10%).
Figure 19 shows time histories of critical structural responses under a mean wind speed of 18 m/s at hub height, including the tower-base bending moment about the
y-axis and pile-head axial force of pile 4. When SSI is considered, the peak values reach 117.897 MN·m for tower-base bending moment and −23.65 MN for pile-head axial force.
Table 17 summarizes the significant effects of SSI on these parameters. Specifically, this table indicates significant underestimations by the no-SSI model: pile-head bending moment peak, mean, and standard deviation are reduced by 82.69%, 88.79%, and 73.10%, respectively. In addition, relative errors for the pile-head axial force, tower-base bending moment, and shear force standard deviations reach 10.79%, −10.18%, and −10.14%, while other parameters exhibit errors within the range of (−10%, 10%). In general, under extreme conditions, wave loads increase significantly, leading to more pronounced participation of higher-order modes in the structural dynamic response. The nacelle acceleration and peak yaw mechanism bending moment exceed those under the running condition of OWT.


