1. Introduction
In these times, the hard-to-abate sectors, including the glass one, are confronted both with European and national demands and the market requests to decarbonize their products; therefore, they need to intervene in their production process. Specifically, the hollow glass subsector is one of the most affected by the decarbonisation process and, together with the world of scientific research, is looking for new solutions and technologies to reduce its emissions. The first step to decarbonize this market segment is to breakdown the overall specific consumption across the various sub-phases of the production process and benchmark them with real, updated, and reliable indicators related to the most up-to-date state-of-the-art [
1,
2]. In this manner, it is possible to identify if and where energy inefficiency occurs and intervene to achieve savings. It is well-recognized that saving energy, directly and indirectly, equates to reductions in overall CO
2 emissions. The status and prospects of energy efficiency in the glass industry has already been thoroughly examined, demonstrating the importance of the topic [
3].
After implementing as many energy efficiency measures as possible, it becomes imperative to embrace new technological solutions, as already stated [
4].
Firstly, in the technical background section of the paper, the authors provide an up-to-date overview of the hollow glass sector in the EU and Italy to understand the market capacity and the related benefit of supporting the energy/emissions reduction in the glass sector. The state-of-the-art of a hollow glass production plant and the various sub-phases have been reconstructed. Then, a case study based on a real in-operation plant is presented. The case study is relevant to the scientific community since it represents a real existing scenario in the glass market segment in the Italian context and could serve as a reference for many other applications in the European Union and Worldwide. This is thanks to the real-available data related to the distribution of the energy consumption along with specific consumption indicators for both individual subprocesses of the production process—converting the energy vector consumption into tons of oil equivalent by summing them—as well as for the specific energy vector.
About the energy indicators elaboration, meetings and site inspections were conducted in order to obtain accurate production process data. The main added values of this study are these energy efficiency indicators, rarely or little present in the literature (a collection can be found in [
4]), in this case instead made using real data from a company that decided to make them available anonymously.
2. The Hollow Glass Sector and the Industrial Process
As highlighted in a previous publication [
4], the global production of various types of glass was approximately 130 million tonnes in 2005. The European Union was the largest producer, accounting for about 33 million tonnes, followed by China with 32 million tonnes and the United States with 20 million tonnes [
5]. Over the past decade, the total global glass production has remained largely unchanged, with a 2020 study estimating that global production is still around 130 million tonnes [
6]. The European Union (EUR 27 + UK) produced 39.53 million tons in 2022; 24.5 million of these almost 40 million are related to the production of hollow glass [
7]. In the European Union, there are currently 145 glass production sites for container glass; the highest number of factories is located in Italy, with 27 plants, as shown in
Figure 1 [
8]. Italy is the second largest producer of glass after Germany, and the first country if considering the plants existing; in
Figure 1 is reported a diagram of the plants in Italy registered by The Italian Glass Makers Association-Assovetro.
European producers of hollow glass members of FEVE realize 22 million tons of glass, equivalent to over 80 billion containers per year. The hollow glass industry is a primary industry that sells its products to other industries, mainly to use them as packaging for their goods; the most typical examples are producers of wine, beer, and food, or perfumes and pharmaceutical goods [
1]. In Italy, according to the classification of economic activities adopted by ISTAT—National Institute of Statistics—for statistical purposes, the glass industry is subject to the ATECO (ATtività ECOnomiche—economic activities) code 23.1 linked to
Fabbricazione di vetro e prodotti di vetro (Manufacture of glass and glass products). Specifically, the code for hollow glass is 23.13
Fabbricazione di vetro cavo per food and beverage (Manufacture of hollow glass for food and beverage) [
9]. Sector-specific data are not easily available: only ENEA (
Agenzia nazionale per le nuove tecnologie,
l’energia e lo sviluppo economico sostenibile—National Agency for New Technologies, Energy and Sustainable Economic Development), possesses substantial information on the subject because every 4 years by law it collects the results from energy audits conducted by all Italian energy-intensive companies and large enterprises in the framework of the national implementation of the EU Energy Efficiency Directive. ENEA has categorized these data by ATECO code, and, indeed, the production of hollow glass emerges as an energy-intensive process, and the entire sector falls under the category of “hard-to-abate”. In the ENEA report [
2], it is clarified that the 23.13 ATECO code, representing the hollow glass industry, encompasses not only the manufacture of bottles and other containers, made not only of glass but also of crystal, but also includes the production of glasses and other glassware or crystal for household use or for the pharmaceutical industry. Crystal has peculiarities that make it different in terms of chemical formula and energy consumption from the most common glass bottles, and the same in terms of different energy consumption happens for household items (tableware). The researchers of ENEA tried, however, to isolate the plants based on the type of production and inferred interesting information in terms of specific consumption [
2]. Nevertheless, the identified typical plant appears not entirely representative, and specific consumption data are primarily limited to the overall plant consumption or the melting furnace alone. According to ISTAT data reported in Assovetro’s annual reports, 4.72 million tons of molten hollow glass were produced in 2022. The trend of Italian production, reported in
Figure 2 and
Table 1, has been steadily increasing in recent years, this demonstrates how the sector produces significant quantities and, despite the crisis in Ukraine and high energy prices (especially in Italy), production is increasing. Therefore, the sector remains important, and the issue of energy savings is highly relevant.
Energy consumption and the mitigation of pollutant gas emissions represent critical concerns for the sector. The production process involves high energy consumption, primarily attributed to the elevated temperatures required (with all associated heat losses) and to the endothermal nature of chemical reactions that transform the mixture of raw materials into glass. The most prevalent energy carrier is natural gas, followed by electricity. However, in response to the global crises associated with COVID-19 and the conflict in Ukraine, certain plants have reverted to utilizing a portion of fuel oil, a resource otherwise abandoned for several years, mostly for environmental reasons.
Glass melting accounts for, on average, more than 70% of the total primary energy consumption throughout the production process. To achieve the melting, homogenization, and fining (removal of bubbles) of the vitrifiable mixture, primarily composed of recycled cullet, silica sand and smaller quantities of limestone and soda ash, temperatures around 1500 °C are necessary. Natural gas is predominantly employed for the melting process and for the subsequent controlled cooling of the molten material to the required conditions for the forming phase. Plant shutdowns are not feasible except at the end of the furnaces’ life cycle, which typically spans 10–15 years. The operations are continuous throughout the year, 24 h a day. This also easily emerges from the annual reports by Assovetro, featuring a graph illustrating the monthly energy consumption trends of Italian associates across all glass sectors. The stability and constancy of energy consumption, encompassing both electricity and gas, is evident from these reports [
7,
10,
11,
12,
13,
14,
15,
16].
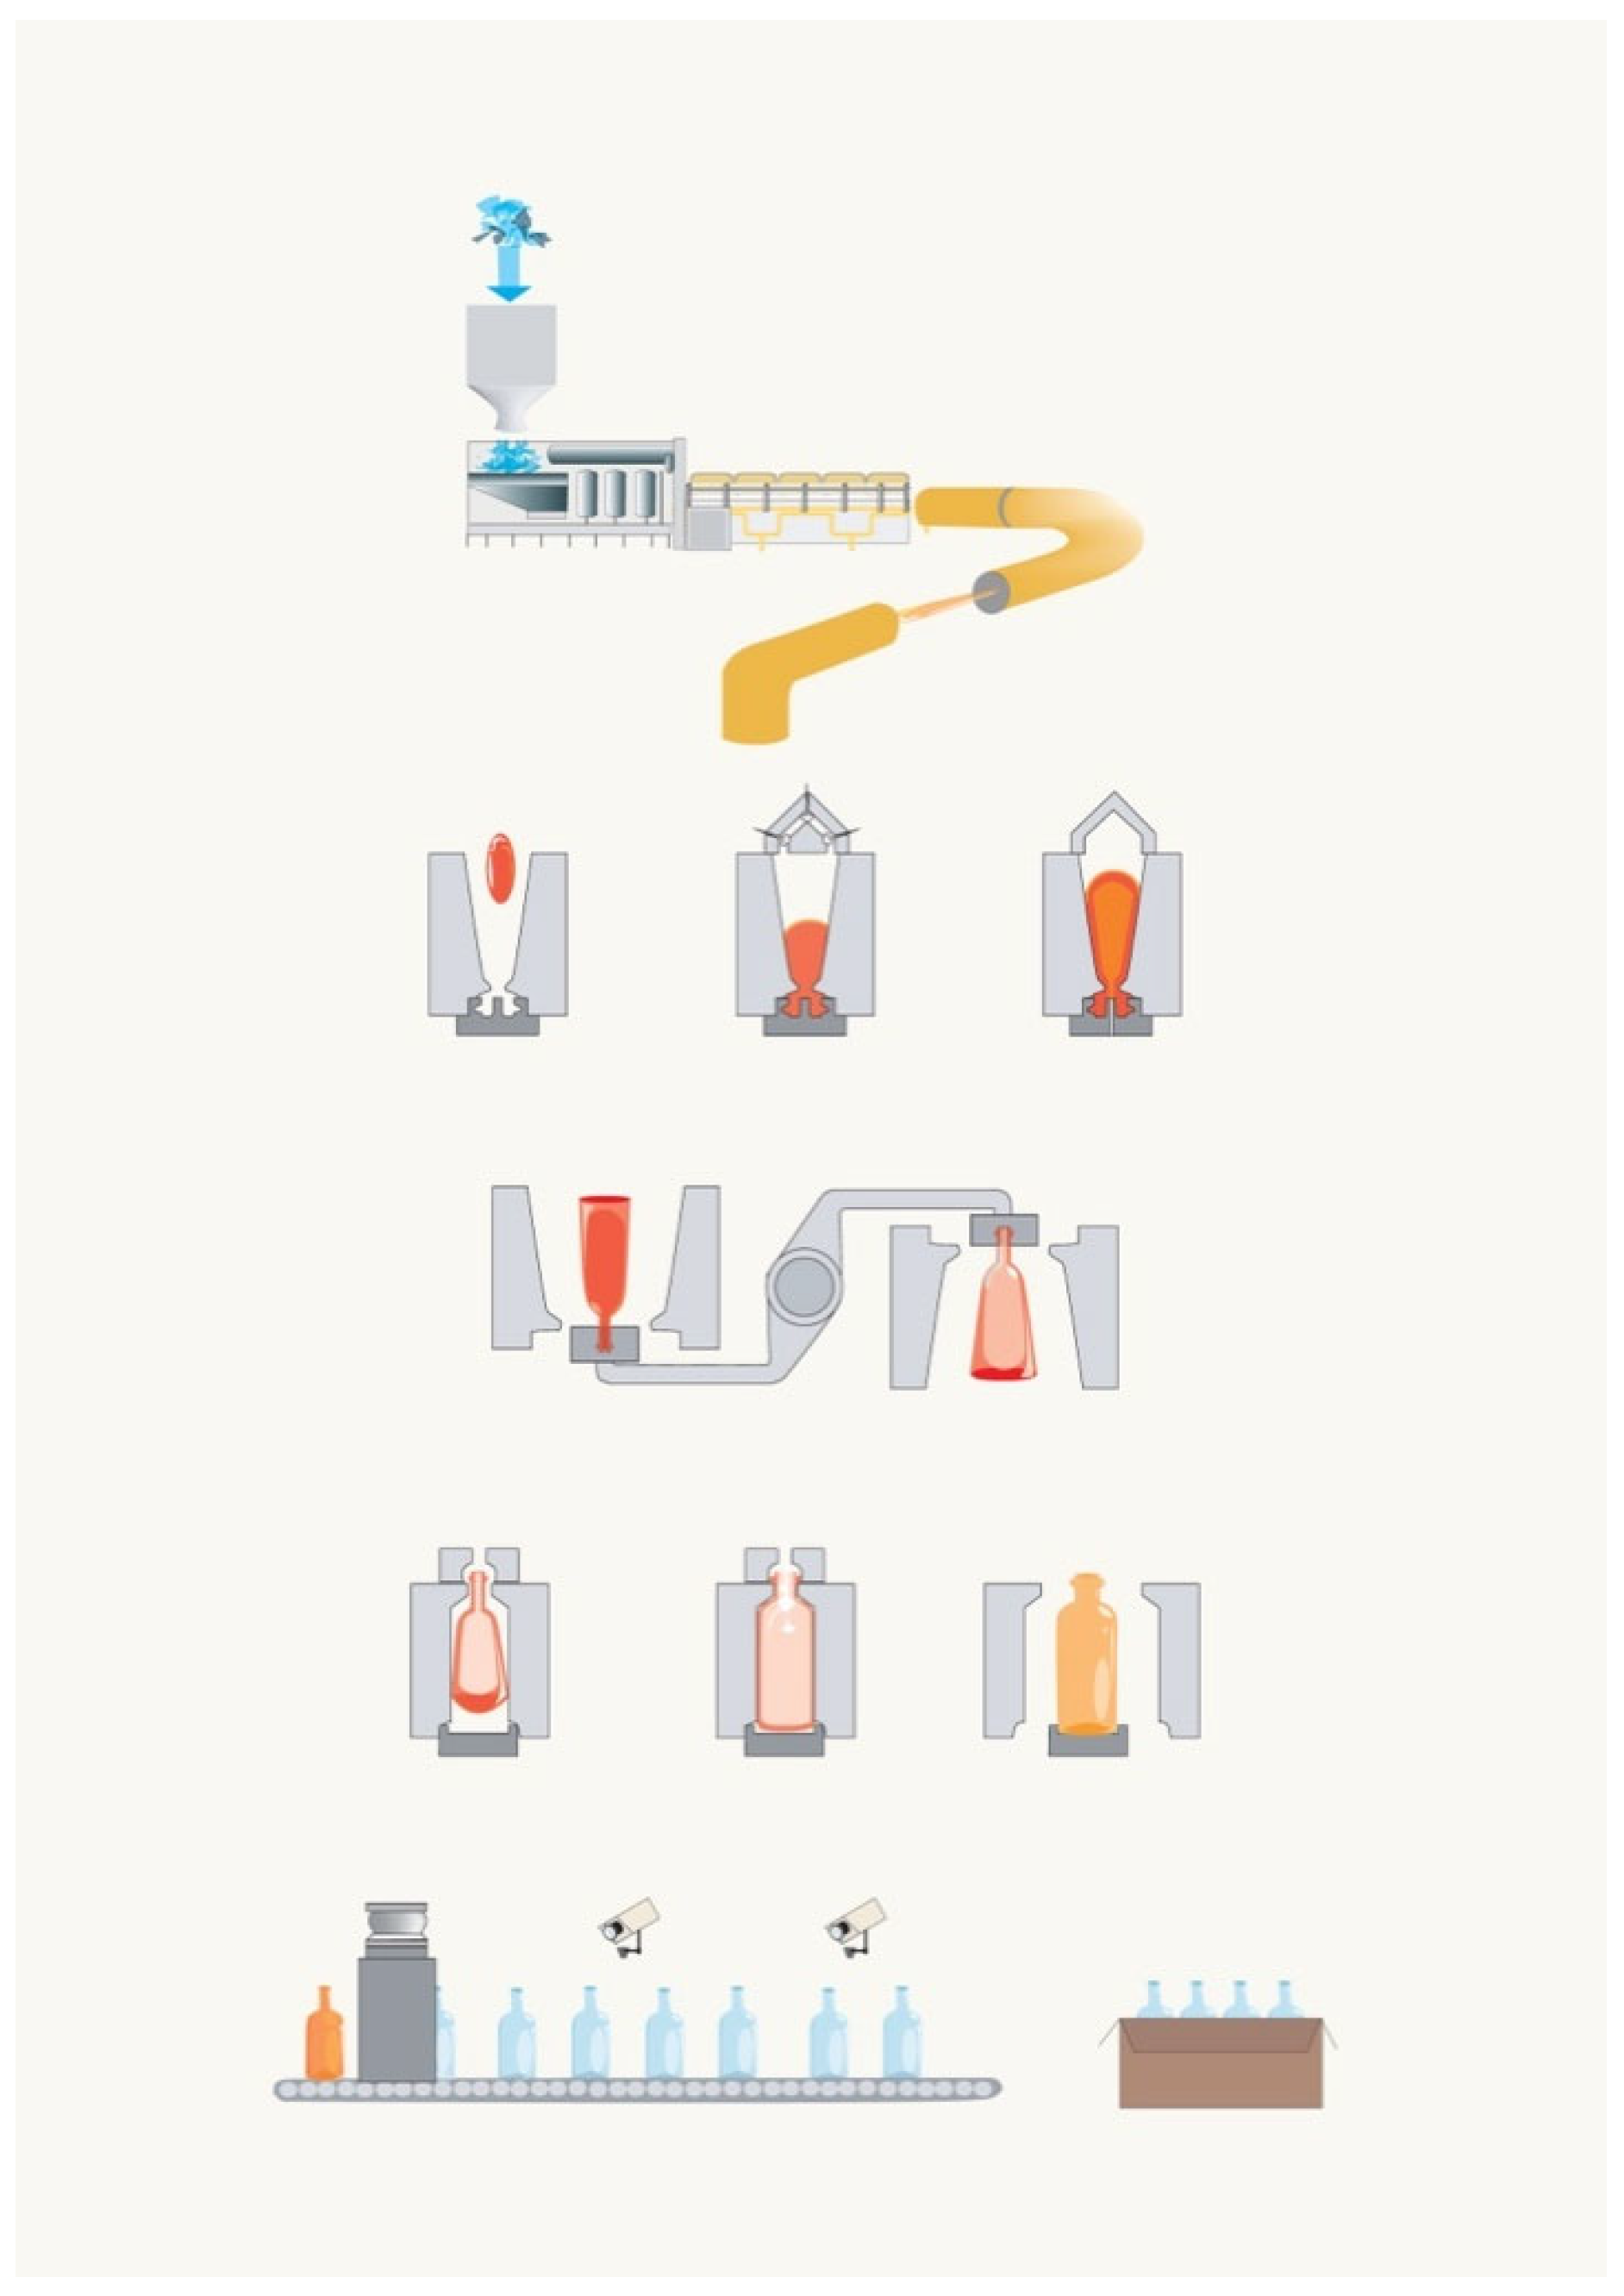
Figure 3 illustrates a schematic representation of the hollow glass production process.
The initial stage of the production process is the preparation of the batch mixture. Through weighing and mixing systems, raw materials, including quarry minerals such as silica sand, feldspar sand, dolomite, and marble, are blended in appropriate proportions with synthetic inorganic chemicals like soda ash or sodium sulfate, and with recycled glass cullet. Glass cullet may be either internal, consisting of crushed bottles rejected by the plant’s quality control section, or external, originating from the treatment of separately collected municipal solid waste. The mixture of raw materials and glass cullet is referred to as the “batch”.
Subsequently, the batch undergoes melting in the furnace, which uses both fuel combustion and electric power to reach temperatures exceeding 1500 °C. The refining phase follows, eliminating gas bubbles trapped in the melt. The molten glass then reaches the forehearth (or “working-end”), where pre-conditioning occurs before entering the channels. In this stage, gradual and uniform cooling is achieved through several small burners.
The subsequent portion involves the channels, employing both gas and electricity for controlled cooling of the melt up to the forming phase. The forming process can be either blow-blow or press-blow. Automatic forming machines of the IS type (with independent Individual Sections) are commonly used. In the blow-blow scenario, the gob is cut from the shears, directed to various sections of the forming machine by the Gob distributor, and dropped into the bottom of the mould. The container mouth is formed during the settling time, followed by the opening of the first small cavity inside the mouth. Compressed air is blown into the cavity, shaping the blank through blowing. The blank mould opens, and the blank is transferred to the finishing mould, where temperature homogenization of the blank occurs, and the blowing head is positioned. Finally, the blank is blown with compressed air until the final shape is achieved, the mould is opened, and the container moves along the exit conveyor. Both the blank mould and finishing mould are cooled using forced air from a dedicated fan system. The consumption during this phase is mostly electrical, and it can be categorized into that associated with machine cooling fans, high-pressure compressed air consumption (for machine movements), low-pressure compressed air consumption (for glass blowing), and vacuum machines.
Upon exiting the IS forming machines, the products undergo a hot treatment where they are sprayed with SnCl4 or mono-butyl-tin-tri-chloride. This process aims to cover the outer surfaces with a thin film of SnO clusters, serving as a “primer of adhesion” for a protective anti-friction treatment (cold treatment) that will be applied further down the line. Subsequently, the treated products enter the annealing tunnel, also known as lehr, where they are maintained at a temperature sufficient to relax the thermal stresses generated in the forming process. They are then allowed to cool in a controlled manner until reaching approximately 100 °C, the temperature at which they exit the tunnel. The annealing lehr is typically heated by natural gas burners.
Following this phase, the products undergo a cold-end treatment involving the application of an aqueous dispersion of an organic compound, typically polyethylene derivatives. This treatment adheres to the SnO clusters deposited earlier during the hot treatment, forming an anti-friction film. In the final stage, the products undergo quality control, with unsuitable items being discarded, crushed, and reintroduced into the batch mixture as internal cullet. On the other hand, suitable products are properly packaged and stored. The packaging phase may entail a small but non-negligible consumption of natural gas, primarily attributed to the machines responsible for the heat shrinkage of pallets [
1,
18,
19].
3. Methods
The selected plant for the present study was chosen to be as representative as possible of hollow glass production. It is crucial to emphasize that each plant is inherently unique, differing in production type, colour, recycled glass usability, plant age, and other factors. The following sections provide a detailed description of the plant’s peculiarities, its production nuances, operational aspects, and the consumption patterns of individual sub-phases. Such an analysis is necessary for a comprehensive understanding of the energy consumption profile of an industrial plant and, through meticulous assessments, to pinpoint opportunities for energy conservation. For what is the knowledge of the authors, the literature offers limited indicators of energy efficiency or CO
2 emissions, with sparse values available for the entire plant or the melting furnace and even fewer for the sub-phases of the production process. Moreover, the existing data, when present, are often outdated. A review of these indicators was made in the previously mentioned manuscript [
4].
For this study, a completer and more updated data set was available. Consequently, an analysis of the energy consumption of individual sub-phases is initially conducted, defining specific consumption indices for gas, electricity, and, when both are employed for the same sub-phase, for both carriers. In this latter situation, the results are then converted into tons of oil equivalent.
The reported data pertain to the operational year 2021 of the plant. The facility, specializing in the production of industrial mechanized hollow glass for containers such as bottles for wines, beers, mineral waters, is situated in Italy and is characterized by high energy intensity.
Meetings and site inspections were conducted in order to obtain accurate production process data. To evaluate the state of energy monitoring networks installed, an initial on-site inspection was conducted at the selected facility in coordination with its energy manager. It was first confirmed that the coverage of energy consumption measurements exceeded 95% compared to total consumption data derived from purchase invoices. Subsequently, a customized spreadsheet was developed for monitoring energy consumption. A series of follow-up telephone and online contacts allowed for corrections and additions to the collected information where necessary. The initial data collection was carried out both during site visits and through periodic telephonic and web conference calls, or via email exchanges, including the sharing of digital documentation. This included tools such as an Excel file for recording energy consumption and meter data or a checklist for supplementary information.
It was observed that continuous monitoring systems using in-line instrumentation were already in place for the most energy-intensive functional areas and systems. In some instances, where continuous monitoring systems were not available, intermittent measurement campaigns were carried out using portable “clamp-on” equipment, such as portable loggers or ammeter clamps.
In order to conduct a quantitative analysis of the plant and obtain indicators comparable to those of other glassworks, the production process has been divided into a set of phases, based on the guidelines from the
Linea Guida per la Stesura delle Diagnosi Energetiche [
20] and from the energy audit studies conducted by ENEA [
2]. The energy model adopted in these documents makes a simple distinction between the phases of batch preparation, melting, forming, and packaging, with the aggregation of other consumptions into “auxiliary services”. These consumptions often include elements that actually belong to specific phases. In the current study, however, the phases have been coherently redefined according to an industrial energy model, effectively applied and allowing for comparisons, as follows:
Batch House/Cullet Systems: Includes the consumption of scales, conveyors, bucket elevators, crushers, mixers, etc.
Main Furnace: Includes consumption from the melting chamber proper, up to the throat, that is its interface with the forehearth.
Channels and Forehearth: The consumption, also available separately, refers to the channels and, upstream, to the forehearth, as already described.
Compressed Air HP and Compressed Air LP: The high- and low-pressure consumption, not aggregated into other plant services.
Cooling Fans: Consumption for the controlled cooling of the melt.
Lehrs: The consumption of the long tunnel furnace with an end-to-end temperature gradient, used for annealing.
Shrinking: Along with the consumption of batch preparation and the furnace, are among the few separately available in the literature.
It is well known and easily understandable that the primary energy consumed by the plant is strongly correlated with the amount of glass produced. Due to this correlation, it is significant to define energy performance indicators as the ratio between energy consumed and glass produced, both as a global plant indicator and as a specific indicator for various sub-phases.
Two types of performance indicators have been identified.
- ○
The indicators that relate energy consumption to the parameter that identifies the general purpose of the plant:
where IPg stands for the energy performance indicator, E is the energy used by the given functional area, and Dg is the general purpose of the plant.
- ○
The indicators that normalize the energy consumption of a single phase of the production process in relation to the specific purpose of that phase, referred to as specific performance indicators IPs, are defined as follows:
where Eas is the energy used by the selected functional area and Ds is the specific purpose of that area.
In this context, both the general purpose and the specific purpose are represented by the tons of molten glass produced.
4. Results
Production runs continuously throughout the year and day, with the plant operating 24 h a day, 365 days a year. The only exceptions are during scheduled maintenance stops, either for cold repairs or hot repairs. Emergency cold repairs are undertaken in the event of severe damage to the melting furnace (e.g., perforations in the furnace bottom or throat causing significant glass loss, potentially impacting surrounding and underlying machinery) or the regenerator (involving partial or total replacement of checker packs).
Most of the time, only hot repairs of varying magnitudes are conducted. For instance, overcoating from outside the soldier blocks may be performed when the corrosive wear at the glass level (the so-called “metal line” or salt line) of the furnace is excessively advanced. Other activities include mechanical or thermal cleaning of the regeneration chambers to remove sulphate fouling, repairs to the superstructure through ceramic welding, and stopping only one of the channels at a time for repair (using a bulkhead to divert the flow to others). A complete shutdown for furnace reconstruction occurs approximately every 10–15 years. Energy consumption remains more or less consistent throughout the year, with fluctuations based on the amount of pull (i.e., molten glass production) from the furnace. The plant operates in three shifts, organized into various areas, including raw material composition, production, finished product warehousing, technical premises, and offices. The annual production of molten glass amounts to about 88 kt/y. The average value of the glass cullet used in the process is a key factor in quantifying energy consumption and emissions; the more cullet used, the lower the energy consumption and direct CO
2 emissions. This is because the cullet is already glass material, so the chemical reactions between raw materials that transform the mixture of minerals into glass are not required. The cullet used in this plant is mostly stable around 80%. The importance of using scrap within the production process for energy savings is a well-known and widely studied element, even in recent research [
21].
The overall plant uses five potential energy carriers: natural gas, electricity, fuel oil, diesel, and acetylene. Among these, natural gas and electricity are the predominant used. Fuel oil was used in the past to partially replace natural gas consumption; although the Russian–Ukrainian crisis has led some plants to partially revert to burning oil (for cost reasons), this plant does not use it. Diesel and acetylene have minimal consumption, associated with powering forklifts and emergency generators (diesel) and automatic lubrication of moulds (acetylene).
Natural gas main consumption occurs during the melting phase, followed by its application in the forehearth and distribution channels, and in annealing tunnels for the finished product. Additionally, a portion of natural gas is allocated for winter heating of offices and production departments. Furthermore, it is utilized for thermo-shrinking during the packaging process. Electricity assumes a pivotal role throughout diverse phases of the production process, encompassing production itself (e.g., electrodes in the melt), auxiliary functions (e.g., compressed air production, cooling fans), and general services (e.g., lighting systems). The most significant electricity consumption occurs in the melting furnace, where so called “boosting electrodes” installed inside the tank facilitate the melting process. Subsequently, electricity is consumed in activities such as compressed air production, operation of forming machines, and the operation of fans for combustion air and cooling air (for furnace refractories and for forming moulds).
In
Table 2 and
Figure 4 the total consumption of the plant and the breakdown by the energy carriers are reported.
The data presented confirm what was reported in the literature, that the dominant component of plant energy consumption is represented by natural gas (mainly used in the melting furnace), followed by electricity [
1].
In
Table 3 the consumption of the production process divided by sub-phases and by type of energy carrier are reported. Specific consumption indicators have also been calculated.
The production process has been divided into a set of phases, based on the guidelines from the Linea Guida per la Stesura delle Diagnosi Energetiche and the energy audit studies conducted by ENEA, which were then grouped into macro-phases (batch preparation, melting, conditioning, forming, annealing, and other). As already mentioned in the previous paragraph, compared to the typical phases found in the literature, it has been possible to reconstruct the energy consumption in greater detail, in particular:
The preparation of the batch mixture includes the batch house and the cullet systems, as stated in the literature, with only electricity consumption.
The melting phase includes the furnace and is consistent with the structure proposed in the literature; both electricity and natural gas are used.
Conditioning has been separated into a new phase, which includes only natural gas consumption for refining and forehearth.
The forming phase identified has the same name as previously proposed, but here it separates the consumption of conditioning and annealing, and analyzes separately the consumption of high and low-pressure compressed air lines, specific cooling fans for that part of the line, and vacuum machines.
The annealing phase includes the electricity and gas consumption of the Lehrs.
The packaging phase is identified in line with what has been proposed, which includes the consumption from the shrinking machine.
A general “other” phase includes the electricity consumption of filtering systems and other minor elements.
In addition to confirming the relative weights of the various phases as already reported, the identified values show that the consumption for glass conditioning, in many energy audits not explicitly reported, but embedded either into the forming or into the melting furnace, is not negligible, nor is the annealing lehrs’ consumption, often times not reported alone, but associated with forming, is also significant.
It should be noted that a collection of available energy efficiency indicators from the literature was recently conducted [
4]. Moreover, in the studies available in the literature, simplified approaches are often adopted to ensure a unified processing of information collected using methodologies that are not always standardized or perfectly comparable. For example, the previously mentioned study published by ENEA limited the analysis to glass container production plants with end-port fired regenerative furnaces. Even in this case, the analysis was conducted at the plant level, with greater detail only on the melting furnaces. So, what is lacking in the literature is not a collection of aggregated data on the entire national sector, but rather an in-depth analysis of a single plant representative of the most common layout and technologies in the glass container industry. This study fills this gap by providing detailed indicators for all energy uses of a typical facility. The innovative aspect also lies in the development of updated and detailed energy efficiency indicators for the different stages of the production process, with a level of granularity that has not been available in the literature so far. In particular, specific subprocesses—such as certain phases of forming, for which no consolidated reference data exist—are analyzed in detail.


