Article

Home Biogas Production from Organic Waste: Challenges and Process Optimization of Methane Fermentation

Oil and Gas Institute—National Research Institute, ul. Lubicz 25a, 31-503 Kraków, Poland
*
Authors to whom correspondence should be addressed.
Energies 2025, 18(7), 1745; https://doi.org/10.3390/en18071745
Submission received: 23 January 2025 / Revised: 14 March 2025 / Accepted: 25 March 2025 / Published: 31 March 2025
(This article belongs to the Special Issue Biomass Resources to Bioenergy)

Abstract

:
This publication presents an analysis of the possibilities for home biogas production using an original method. The assumptions for a biogas-generating system and key principles for the methane fermentation process are outlined. Research on the methane fermentation of both kitchen waste and green waste was conducted using a methanogenic consortium. The studies allowed for the characterization of the microorganisms comprising the consortium, and tests confirmed the feasibility of conducting methane fermentation of both types of waste at both laboratory and technical scales, as well as estimating the biogas productivity of the substrates. Based on the research conducted at both scales, the range of conditions under which the biogas production process is possible was determined, with particular reference to temperature conditions and the pH of the leachate. The tests, primarily conducted at a technical scale, allowed for the definition and implementation of optimization measures that resulted in increased process efficiency at the technical scale. Among the main optimization measures were the use of sand as a phase to maintain an anaerobic zone at the start of the process, the use of wood ash to stabilize pH, and the use of substrates and water at room temperature.

1. Introduction

The production of biogas from organic waste is a well-recognized process that has been carried out worldwide for many years, both on an industrial scale (e.g., agricultural biogas plants) [1,2,3,4,5,6,7] and with small-scale household fermenters [8,9,10,11]. However, the solutions available on the market are dedicated to a limited range of substrates, which, in the case of industrial biogas plants, is relatively broad and quite diverse [12,13]. In the case of household solutions, those utilizing plant-based kitchen waste or animal manure (slurry) are most commonly available. These solutions are not fully adapted to handle all the waste that needs to be processed. The current characteristics of biodegradable waste produced in households are diverse. Available data show that food waste is increasing in the composition of municipal solid waste, mainly due to population growth. The available analyses in this area show that it is the main component of municipal solid waste [10,14]. Around 1.3–1.6 billion tons of food waste are generated worldwide each year. Currently, the European Union generates 89 million tons of FW annually, while China produces approximately 82 million tons [4,14,15]. These are very large quantities.
In Poland, over 13.4 million tons of municipal waste were collected in 2023 [16]. During the same year, the amount of municipal waste collected selectively or picked up separately was nearly 145 kg per capita. Of the selectively collected municipal waste, 37.4% consisted of biodegradable waste [16]. This means that, on average, each resident generates 54.1 kg of biodegradable waste annually.
Currently, a significant portion of the biodegradable waste produced in Poland must be collected (most often in plastic bags) from households for processing in specialized facilities.
The presented data confirm that the issue of managing waste containing food scraps from households or restaurants, as well as biodegradable waste such as grass and other green waste, is a real problem that needs to be addressed. One of the potential solutions for managing such waste is the production of biogas. In order for such solutions to be widely adopted, accessible and cost-effective technologies are needed that enable the production and local management of these wastes.
The significant amounts of green waste generated in cities are difficult to compost, which is why their disposal typically occurs through thermal conversion with energy recovery. This solution is particularly unfavorable in cities like Kraków, which struggles with smog issues, as burning biomass results in significant amounts of nitrogen oxides (a component of photochemical smog and a greenhouse gas). The ability to produce biogas on an industrial scale from this waste and then convert it into biomethane using the purification technologies developed at the Oil and Gas Institute—National Research Institute (INiG-PIB) will allow for the recovery of energy from such waste without exacerbating air quality problems or contributing to climate change via the greenhouse effect. The proposed solution will thus enable the future disposal of large amounts of green waste from areas that cannot be used agriculturally, without the need for long-distance transportation and in a manner that reduces harmful emissions at the waste disposal site.
The inability to process animal-derived waste (other than manure) and so-called green waste, such as mown grass, leaves, small branches, etc., in household biogas plants makes them an unattractive solution for end users. This is because they do not comprehensively address the issue of biodegradable waste produced in households.
However, it should be noted that the production of biogas from waste such as mown grass or leaves is an inefficient process. Therefore, conducting methanogenic fermentation of such products will require the selection of appropriate microorganisms and optimal process conditions to obtain biogas in quantities sufficient for effective management [1,15,17]. One of the solutions for processing organic matter from household-generated waste (food waste and green waste from mown grass) is the application of biological processes such as anaerobic digestion [7,18,19,20].
The available literature data indicate that some of the common technologies used for biomass conversion into biofuels and biogas are biological, physical, chemical, and thermal, depending on the type of product. The solution proposed in this publication demonstrates how the efficiency of the process can be increased. The increase in process efficiency can be achieved through its control, which involves introducing selected bacterial strains into the fermentation mixture [1,12,17,18,21], which will properly influence the effectiveness of the processes enabling the production of flammable gases, such as methane, with energy benefits. The main reactions leading to the formation of methane in the different phases of anaerobic digestion are summarized in Table 1, and the process flow is presented in Figure 1.
The efficiency of the presented process can be controlled or modified by selecting appropriate process parameters, such as temperature conditions, system pH, the composition and nature of the feedstock used in the process, and the controlled composition of a methanogenic consortium. The optimization of the process conditions for biogas production is described in this publication. The results of work conducted on a laboratory and technical scale using green waste (grass) and biological waste generated in households are presented.

2. Materials and Methods

2.1. The Optimal Operating Conditions for a Methanogenic Consortium in Relation to Planned Substrates, Particularly Concerning the pH and Temperature of the Anaerobic Digestion Process

2.1.1. Microorganisms

The microbial consortium employed in this study had been previously obtained from lignite samples and tested for its methanogenic activity [23,24]. The consortium was maintained in nutrient broth (Biomaxima, Lublin, Poland) supplemented with sodium acetate (0,2% w/v). For biogas generation Kievskaya mineral medium was used. It consisted of 1 g of NaCl, 1 g of KH2PO4, 1 g of K2HPO4, 1 g of KNO3, 0.20 g of MgSO4, 0.02 g of CaCl2, and 0.05 g of FeCl3 in 1 dm3 of distilled water, pH = 7.0, with the addition of 1 cm3 of microelements (1 g of iron(III) citrate, 0.01 g of MnCl2·4H2O, 0.005 g of ZnCl2, 0.005 g of LiCl, 0.0025 g of KBr, 0.0025 g of KI, 0.005 g of CuSO4, 1 g of CaCl2, 0.001 g of Na2MoO4·2H2O, 0.005 g of CoCl2, 0.0005 g of SnCl2·H2O, 0.0005 g of BaCl2, 0.001 g of AlCl3, 0.01 g of H3BO3, and 0.02 g of EDTA in 1 dm3 of distilled water). The activity of methanogens was verified on selective media prepared according to the Handbook of Microbiological Media [25]. Initial experiments (with different raw materials, e.g., grass, leaves, etc., as a sole carbon source) were performed in 250 mL DURAN SCHOTT® laboratory borosilicate bottles closed with rubber stopper (Duran, Mainz, Germany).. Quantitative analyses were performed in 3 dm3 Schuett-Biotec anaerobic jars with 200 g of grass (wet mass) and Kievskaya broth. For counting, the same aforementioned media were solidified with 0.15% (w/v) agar (Biomaxima, Lublin, Poland). For large scale experiments, the consortium was grown to a density of 1 × 10⁸–5 × 10⁸ cells in 1 dm3.

2.1.2. DNA Extraction, 16S rRNA Gene Illumina MiSeq-Based Sequencing, and Sequence Processing

DNA extraction, 16S rRNA gene Illumina MiSeq-based sequencing, and sequence processing were performed as described previously [26] by Genomed S.A. (Warsaw, Poland) with the single exception that 2 sets of primers were applied: 515F and 806R for the amplification of V4 hypervariable region and 341F and 785R for the amplification of V3–V4 hypervariable region of the gene encoding for bacterial 16S rRNA. The raw sequences have been deposited in the NCBI Short Read Archive under BioProject accession number PRJNA705174.

2.1.3. Fluorescence In Situ Hybridization (FISH) Analysis

We collected 10 mL samples for FISH analysis. Each sample was fixed for 3 h with 4% formaldehyde, washed twice with PBS (10 mM sodium phosphate, 130 mM NaCl), and stored in PBS/EtOH (1:1) at −20 °C. Then, each sample was filtered onto 0.2 μm pore size polycarbonate filters (GTTP, Millipore, Burlington, USA), washed twice with sterile MiliQ water, and air-dried. The filters were stored frozen at −20 °C until further analysis. The filters were embedded in low-gelling-point agarose (0.1% (m/v), Prona Agarose, Hispanagar SA, Burgos, Spain), dried at 37 °C for 15 min, and dehydrated with ethanol. The embedded cells were permeabilized with proteinase K (EURx, Gdańsk, Poland), then the filters were washed with MiliQ water, dipped in 95% ethanol, and air-dried. The filters were cut into sections and hybridized with a solution of Cy3-labeled oligonucleotide probes (final concentration 1 ng DNA·L−1) obtained from Thermo Electron Corporation (Karlsruhe, Germany). The following probes were chosen: universal archaeal ARC915 [27], MEB859, MC1109, MG1200, and MSSH859, selective for Methanobacteriales, Methanococcales, Methanomicrobiales, and Methanosarcinales, respectively [28,29]. The composition of the hybridization buffer was as follows: 0.9 M NaCl, 20 mM Tris-HCl (pH 8.0), 0.01% SDS, and formamide at a concentration specific for each probe. After 2 h hybridization at 46 °C, the filter was washed at 48 °C for 10 min in a washing buffer (20 mM Tris-HCl (pH 8.0), 5 mM EDTA, 0.01% SDS (w/v), and NaCl at the concentration given in Table 1). Next, the filter was washed in ice-cold, double-distilled water for 1 min, air-dried, and counterstained with DAPI (4′,6-diamidino-2-phenylindole, Sigma Aldrich, Saint Louis, USA) for 10 min in the dark. Then, the filter was mounted on a glass slide using a mixture of Vectashield (Vector Laboratories, Burlingame, USA) and Citifluor (Citifluor Ltd.; London, UK; 1:4). The filter was stored in the dark at −20 °C. Images were taken using a fluorescence microscope (Nikon Eclipse 50i Nikon Instech Co., Ltd., Tokyo, Japan) equipped with a Plan Fluor 100×/1.3 oil immersion objective and an appropriate filter set for DAPI and Cy3. Counting microbial cells was performed as described elsewhere [30].

2.1.4. Methodology for Determining the Molecular Composition of Biogas

Chromatographic analyses of the molecular composition were carried out on two AGILENT 7890 A chromatographs (Agilent, Santa Clara, CA, USA), equipped with FID, TCD, and FPD detectors. A precise methodology and elements of validation of molecular composition determinations were presented elsewhere [31].

2.2. Evaluation of the Quality of Waste Used as Feedstock for the Digester

The average samples of organic waste from a household were analyzed (Sample 1—mixed waste), which included, among others, vegetable and fruit peelings, egg shells, leftover household food, and a sample of mown grass (Sample 2—grass). The physical appearance of samples 1 and 2 is shown in Figure 2 respectively.
The summary of the research methods applied for the study is presented in Table 2.

2.3. The Methodology for Assessing Biogas Productivity from Green and Mixed Waste at a Technical Scale

At the same time as conducting the laboratory-scale experiments, the waste was used as a feedstock in two fermenters operating at full target scale. The technical-scale experiment was designed to investigate two key aspects: temperature variability depending on the season (conducted for mixed household waste) and feedstock variation, with mixed household waste used as the feedstock for Reactor 1 and green waste (grass/leaves) as the feedstock for Reactor 2. Due to the availability of feedstock for Reactor 2 (grass/leaves), this experiment began in late spring and was conducted during the summer and autumn. In contrast, the experiment in Reactor 1 was initiated in winter and carried out during the spring and summer months.
The basic premise of the experiment was that the test would be conducted under generally available conditions. Ultimately, flushing the reactor with nitrogen to displace oxygen would have been cumbersome, expensive, or impossible on the farm. Therefore, the technical-scale experiment did not include a step to ensure anaerobic conditions at the start of the process.
These were placed in two prepared reactors (Figure 3), located in an unheated technical room. The volume of the reactors used was 200 dm3.
Due to the availability of waste substrates for the bioreactors, the biogas plant with mixed waste started operation during the winter period, while the biogas plant with freshly mown grass as a substrate began operation in the spring, when mown grass became available. The basic operating conditions for the anaerobic digestion process in both reactors are summarized in Table 3.
The waste used in the experiment was not specially shredded. Kitchen waste primarily consisted of vegetable peels (e.g., apple, potato, cucumber, and tomato peels), chopped cabbage, processed vegetables, meat, and carbohydrates (waste used in Reactor 1). In contrast, the grass and leaves used in the experiment were only shredded during mowing. After mowing, the waste had a length of approximately 2–5 cm. This process was not quantitatively controlled (waste used in Reactor 2).
It is important to note that the aim of this experiment was to evaluate a method for biogas production using household waste while keeping the entire process as labor- and time-efficient as possible.

2.3.1. Description of the Experiment in Reactor 1

During the first week of the experiment in Reactor 1, the room temperature in the building housing the biogas plant ranged from 7 to 12 °C. For the first week, no pH measurements of the leachate or gas composition in the reactor were taken. These measurements started on the 7th day of the experiment and were carried out 2–5 times per week, depending on staff availability.
The first pH measurement showed that the leachate from the bioreactor had a pH of 4.5, significantly lower than the optimal pH for biogas production. The pH changes were observed without intervention for 7 days, during which the pH fluctuated between 4.04 and 4.24. The decrease in pH to near 4 prompted a decision to attempt to neutralize the acidic leachate by adding wood ash. On the 15th day of the experiment, 300 g of ash and 30 l of water were added to the biogas plant. The lack of significant improvement in pH led to the addition of 1000 g of wood ash and 20 dm3 of water the following day. In the subsequent days, the pH of the leachate increased to values around 5.6.
On the 7th day of the experiment, the temperature of the leachate was measured to be 16.4 °C, which was 8.7 °C higher than the external temperature recorded in the building. This indicates that the temperature of the leachate, which is the temperature inside the reactor, better reflects the conditions of the biogas production process than the external temperature. Throughout the experiment, the leachate temperature ranged from 15.8 °C to 27.4 °C (average 19.5 °C).
The temperature fluctuations are due to the fact that at the time of the experiments for Reactor 1, the ambient temperature fluctuated due to the season. The reactor site was not thermally insulated/stabilized.
By the end of the experiment (on the 214th day of the experiment), the biogas plant operated without significant external interventions, except on the following days:
  • On the 33rd day of the experiment: 50 L of water was added to the reactor to better mix the waste with wood ash and stabilize the pH.
  • On the 124th day of the experiment: 5.8 kg of waste was added.
  • On the 184th day of the experiment: 5.0 kg of waste was added.

2.3.2. Description of the Experiment in Reactor 2

The experiment in Reactor 2, where the substrate consisted of grass, was conducted for 131 days. The substrate for Reactor 2 consisted of 58 kg of grass mixed with 95 dm3 of water; 2 dm3 of microbial consortium together with 16 dm3 of leachate from Reactor 1 were introduced into the reactor.
At the beginning of the experiment, a high oxygen concentration (about 14%) was observed in the gas inside the reactor, which led to the decision to add 20 kg of sand to the bottom of the reactor. The sand was covered with biopreparation and leachate before adding the biomass and water. This procedure aimed to create a small anaerobic zone at the interface between the sand and the remaining substrates, which would allow better survival of anaerobic organisms within the consortium.
Based on previous experience from laboratory tests carried out by the authors, no pH and gas composition measurements were taken during the first 25 days of the experiment, as this period was needed for the reactions in the reactor filled with grass to become identifiable through gas composition and pH measurements. In the following days, pH and gas composition measurements were taken similarly to Reactor 1, 2–5 times per week.
The first pH measurement taken was 5.3, which was below the optimal value established for the consortium used. Consequently, it was decided to add two doses of 300 g of wood ash (ash was added on the 31st and the 63rd days of experiment), which stabilized the pH above 6.0 just 5 days after the second dose of ash.
Throughout the experiment, the temperature of the leachate from Reactor 2 varied between 19.5 °C and 27.4 °C (average 23.0 °C). The temperature fluctuations are due to the fact that at the time of the experiments for Reactor 2, the ambient temperature fluctuated due to the season. The reactor site was not thermally insulated/stabilized.

3. Results

This study presents the results of research on methane fermentation of both kitchen waste and green waste using a consortium available at INiG-PIB. The conducted research allowed for the characterization of the microorganisms within the consortium, and the tests confirmed the feasibility of conducting methane fermentation of both types of waste at both laboratory and technical scales, as well as estimating the biogas productivity of the substrates.
It should be noted that the laboratory-scale experiments were carried out under controlled and stabilized temperature conditions, and the temperature conditions at which methanogenesis can effectively occur using a bacterial consortium were also determined.
Technical-scale tests were already carried out under varying temperature conditions resulting from the ambient temperature in which the experiment was conducted.
The main objective of the tests was to verify the efficiency of the processes in Reactor 1 and Reactor 2 under the ambient conditions in Poland, without the need for additional systems for stabilization of the temperature conditions of the waste biogas production process in a domestic biogas plant.
Based on the experiments conducted at both scales, the range of conditions under which biogas production is possible was determined, considering both temperature conditions and leachate pH. The studies, primarily carried out at the technical scale, enabled the definition and implementation of optimization efforts that resulted in increased process efficiency at the technical scale. Among the main optimization actions, the use of sand to maintain an anaerobic zone at the start of the process, the application of wood ash to stabilize pH, and the use of substrates and water at room temperature should be highlighted.

3.1. The Conditions for the Operation of a Methanogenic Consortium, with Respect to the Planned Substrates, in Terms of pH and Temperature for the Process

3.1.1. Temperature Range of Methanogenic Consortium Activity

The experiments were conducted at three temperatures: 4 °C (psychrophilic biomethanation), 30 °C (mesophilic biomethanation), and 40 °C (upper limit of mesophilic biomethanation). This choice was supposed to reflect optimum and extreme temperature conditions for microorganisms.
As shown in the presented data (Table 4), the activity of the methanogenic consortium was highest at 30 °C (a temperature that is now quite common during summertime in temperate climates). The methane concentration in the biogas reached over 52% within 40 days of the experiment. Satisfactory results were also obtained at 4 °C, where the methane concentration was over 49%, but after 150 days of the experiment. In contrast, 40 °C had an inhibitory effect on biogas formation. The concentration of methane obtained barely exceeded 9% within 150 days. Therefore, these results clearly show that even at temperatures as low as 4 °C, the methanogenic consortium has good potential for biogas formation rich in methane, although the efficiency of such a process could be low.
We also analyzed the composition of the methanogenic consortium. At 30 °C, the relative abundance of Archaea exceeded 20%, and they were represented by three genera: Methanosarcina (17%), Methanoculleus (>3%), and Methanobacterium (0.15%). At 4 °C, archaeal abundance dropped below 2% and only two genera were present: Methanosarcina (1.35%) and Methanoculleus (0.44%). The same was true for 40 °C, where again only two archaeal genera could be detected: Methanoculleus (1.56%) and Methanosarcina (0.58%). Temperature had also a significant influence on the bacterial members of the methanogenic consortium. At 4 °C, the most abundant bacterial genera were Trichococcus (29.12%), Pseudomonas (18.18%), Clostridium (11.67%), Tepidibacter (10.58%), Sedimentibacter (3.93%), Alkaliphilus (3.93%), Acetobacterium (3.82%), Soehngenia (1.42%), Desulfovibrio (1.11%), and Natronincola (1.10%). At the optimum temperature of 30 °C, the bacterial composition was as follows: Acinetobacter (20.08%), Clostridium (13.68%), Tindallia (6.15%), Sedimentibacter (4.87%), Soehngenia (4.37%), Tepidibacter (3.42%), Trichococcus (3.37%), Bacillus (2.19%), Desulfitobacterium (2.10%), Caloramator (2.05%), Syntrophomonas (1.68%), and Dehalobacterium (1.0%), and there was an obvious shift in the dominant genera. At 40 °C, the relative abundance of bacterial members changed again, and the most numerous genera were Clostridium (38.06%), Pseudomonas (8.62%), Propionispora (8.61%), Tepidibacter (7.05%), Blautia (7.05%), Alkaliphilus (5.29%), Natronincola (4.43%), Bacillus (3.97%), Enterobacter (1.41%), and Sedimentibacter (0.89%). There is thus evidence that temperature affected the composition and the activity of the methanogenic consortium. It is worth mentioning that it was only at 30 °C that the abundance of the syntrophic organism Syntrophomonas (important for cooperation with methanogens) reached such a high level (0.17% at 4 °C and 0.01% at 40 °C).

3.1.2. Determination of pH Range of Methanogenic Consortium Activity

We also analyzed the effect of pH on the total numbers of microorganisms. The maximum quantities were observed within the pH range of 6.0–7.75, and the total microbial numbers reached 6.2 × 10⁸ ± 3.6 × 10⁸ cells in 1 cm3 at pH 7.25. The numbers of methanogenic Archaea were also very high: 2.1 × 10⁸ ± 1.2 × 10⁸ cells in 1 cm3 (over 30% of total numbers, a proportion even higher than that determined by 16S rRNA gene sequencing). On the other hand, the microbial number decreased at low (5) and high (9) pH, which was especially evident for methanogenic Archaea: 1.9 × 10³ ± 8.8 × 10² cells in 1 cm3 at pH 5 and 9.5 × 10³ ± 6.6 × 10³ cells in 1 cm3 at pH 9.

3.2. Adjusting the Digester for Efficient Operation in the Polish Climate Throughout the Year Using Only Renewable Energy

3.2.1. The PN-EN ISO 23590:2022-05 [32,33] Standard Requirements

The PN-EN ISO 23590:2022-05 standard outlines requirements for the design and operation of household biogas systems. According to this standard, the fermenter system should be installed outdoors or in a well-ventilated space with an air exchange rate of at least five times per hour. It is also recommended that the biogas plant be located near the source of biomass and the place where the biogas will be used. The location should ensure stable ground, allowing for safe and ergonomic maintenance [32,33].
For safety, all pipes and elements within the fermenter system should be securely anchored to prevent movement under normal operating loads. Regarding the pipeline transporting biogas to the combustion device, it must be:
  • Protected from any damage;
  • Able to be installed aboveground or underground depending on local building requirements;
  • Designed to ensure condensation is properly drained.
The PN-EN ISO 23590:2022-05 [32] standard also emphasizes that pipes in buildings must be capable of withstanding a pressure of 15 kPa. It outlines the key components of a household biogas system, which should include the following:
  • A biomass inlet;
  • A fermenter;
  • Biogas storage;
  • A biogas outlet;
  • A biogas transfer system;
  • A post-fermentation outlet;
  • A hydrogen sulfide filter: to reduce the hydrogen sulfide content to between 50–100 ppm;
  • An excess-biogas relief valve: this valve should automatically open if the pressure exceeds 20% of the system’s normal working pressure;
  • A manual shutoff valve: installed parallel to the automatic excess biogas relief valve, to allow manual control over the flow of biogas from the storage unit.
Considering the requirements of the PN-EN ISO 23590:2022-05 standard [32], it is essential to plan for the possibility of locating the biogas plant either outdoors or in an unheated, well-ventilated room. This setup would expose the system to varying temperature conditions, which could impact the fermentation process. Therefore, the design of the fermenter should take these temperature fluctuations into account, ensuring that it can operate effectively under such conditions.
In the prototype stage of the fermenter construction, it is also necessary to include an automatic excess-biogas relief valve. Although this type of valve has not yet been needed in the current setup—since excess biogas that could not be stored was simply vented outside—future designs should account for the potential need for such a safety feature to ensure proper pressure management within the system. This is particularly important as the biogas system expands or if operating conditions change over time.

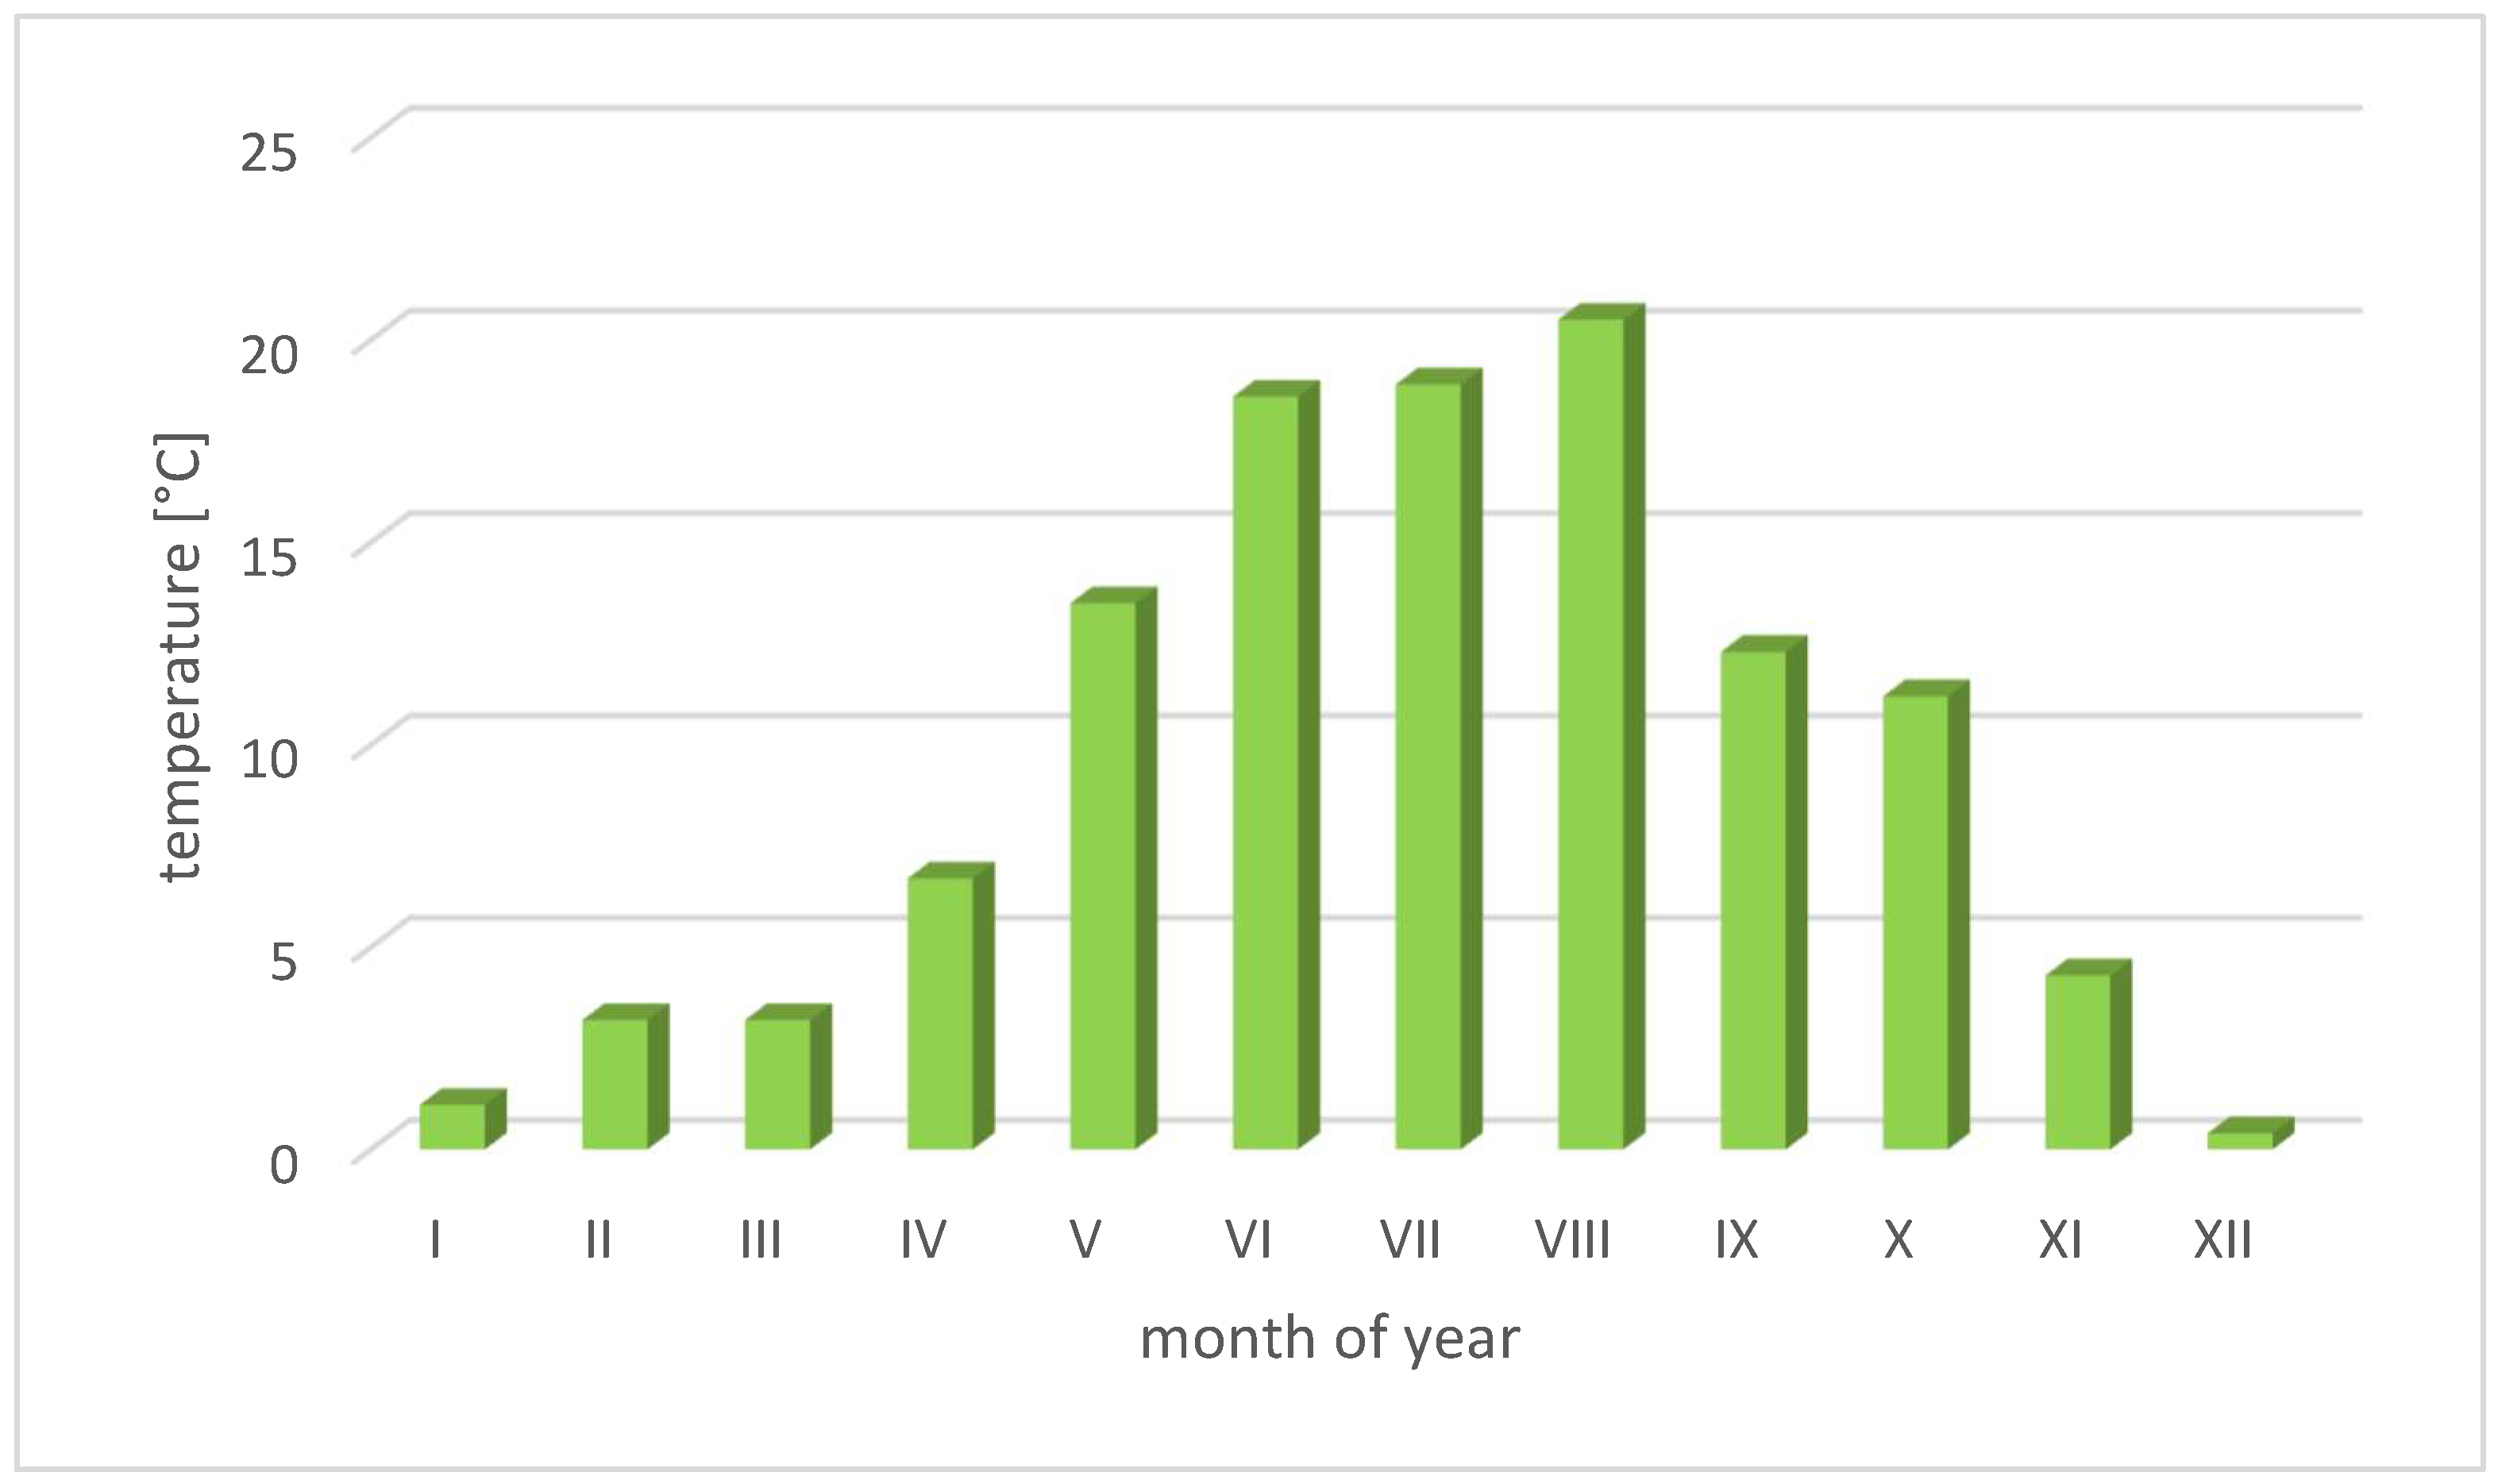
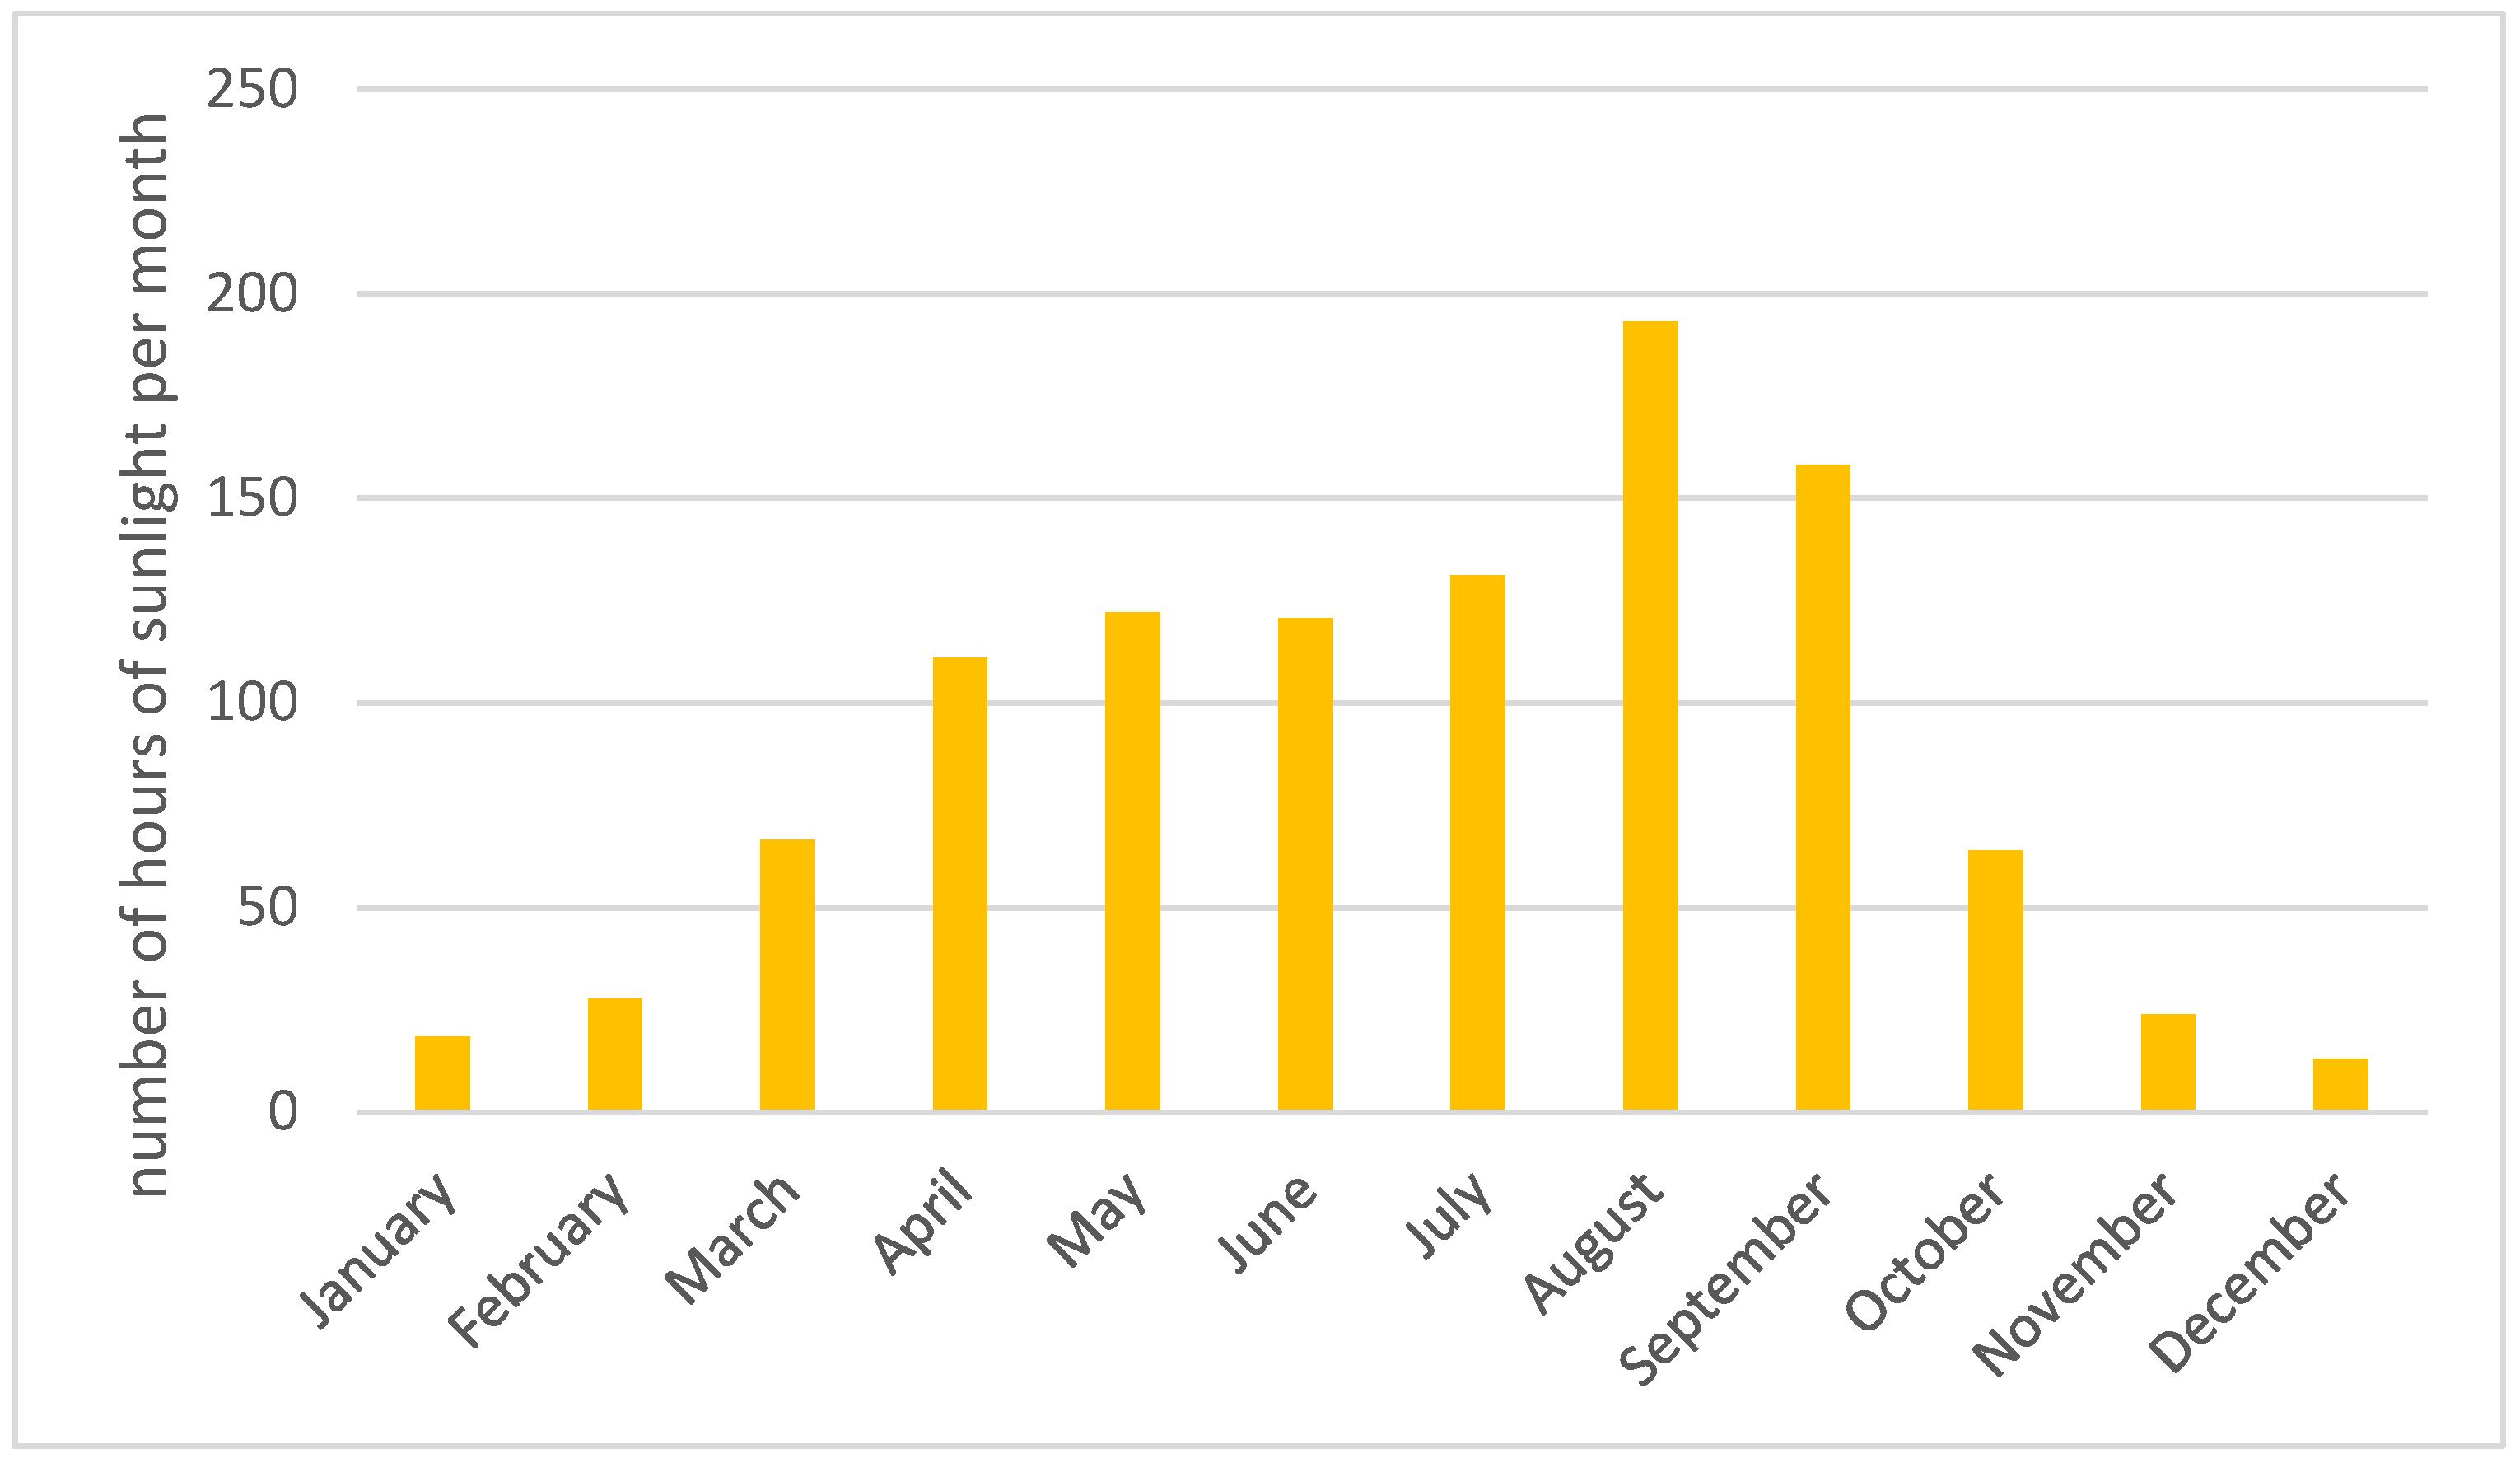
3.2.2. The Variability of Temperature Conditions in Poland

Poland lies in a temperate climate zone with transitional characteristics. The transitional nature of Poland’s climate results from the collision of maritime air masses (moist) coming from Western Europe and continental air masses (dry) from the east, originating from the Asian continent.
An analysis of temperature data available from the Central Statistical Office (GUS) [16] and the Institute of Meteorology and Water Management (IMGW) [34] revealed that in 2022, the average annual temperature in Poland was 9.5 °C. The warmest regions in 2022 were the western part of the lowlands (10.5 °C), the western part of the lake districts (10.1 °C), and the Podkarpacie region (9.9 °C). The coolest regions were the eastern part of the lake districts (8.7 °C) and the areas of the Carpathians and Sudetes (8.9 °C).
August was the warmest month of the year, with a mean temperature of 20.5 °C, while December was the coldest, with an average of 0.4 °C. The distribution of the average monthly temperatures for 2022 in Poland is shown in Figure 4 [34].
Based on the data presented in Figure 4, it can be concluded that the average temperature in Poland remains above 4 °C from April to November. However, temperatures in Poland exhibit not only seasonal variability but also daily fluctuations. The variability of minimum and maximum temperatures on individual days in 2022 was analyzed using data from the Kraków Balice measurement point. The results indicate that daily temperature fluctuations depend on the season, but daytime and night-time temperatures can differ by as much as several degrees over the course of a single day [34].
This daily variability highlights the need for careful consideration when designing processes or systems such as biogas plants that must function efficiently under fluctuating temperature conditions. The significant differences between day and night temperatures, especially in the transitional months, should be factored into system design, possibly through adaptive insulation or temperature regulation mechanisms, to ensure the stability of processes like anaerobic digestion.

3.2.3. Protecting the Fermenter Against Weather Conditions

Laboratory tests have shown that the bacterial consortium used can facilitate the biogasification of green waste even at a temperature of 4.0 °C. In Poland, average monthly temperatures at or above 4.0 °C occur from April to November, suggesting that biogas production in a domestic biogas plant could take place during these months. However, maintaining a stable temperature of 4.0 °C throughout the entire period (including at night) would be required. Achieving this would necessitate isolating the biogas plant from external conditions and providing external heat energy.
The design assumes that the temperature will be maintained at the minimum level necessary for biogas production, while the optimal temperature for the process is typically between 20 and 25 °C. To accomplish this, the fermenter chamber will be placed within a 10 cm thick enclosure made of graphite polystyrene EPS 80, with a thermal conductivity coefficient (λ) of 0.031 W/(m·K) [35]. This insulation will help reduce the energy needed to maintain the required temperature. Energy consumption calculations assume that the biogas plant will operate only during periods when the temperature does not fall below −5.0 °C, as lower temperatures could cause freezing in non-insulated components, potentially damaging the system.
Heat for the fermenter will be supplied through a heating cable arranged spirally around the entire fermenter tank. The heating system will be powered by a thermostat programmed to maintain a temperature of 4.0 °C inside the enclosure (Figure 5). This setup ensures that the biogas production process operates effectively within the required temperature range, preventing the system from falling below the critical threshold where fermentation efficiency would drop or damage could occur due to freezing.
To calculate the electrical energy required to maintain the system temperature under optimal conditions, Equation (11) can be used:
Q s t r a t = l ( t a v t e ) R
where:
R is the total heat flow resistance between the environment and the biogas plant, which is given as 1.53 m⋅K/W.
tav is the minimum process temperature (4 °C).
te is the external temperature (minimum of −5 °C).
l is the substitute length, given as 1340 mm (or 1.34 m).
Based on Equation (11), the heat loss for the insulated biogas plant will be approximately 8 W per hour. This means that maintaining the temperature at 4 °C with an external temperature of −5 °C will require supplying 8 W of energy per hour, assuming the heating system operates at 100% efficiency. Using a heating cable as the heat source can achieve nearly 100% efficiency.
Additionally, the thermostat will consume extra electricity, which has been estimated to use an additional 6 W per hour. Therefore, the total electricity consumption to maintain the system at 4 °C will amount to 0.014 kW per hour.
A zero-waste biogas plant could obtain the energy needed to power the temperature stabilization system from photovoltaic panels. It should be considered that during the summer months, a 1 kWh system can produce up to about 180 kWh of energy per month (6 kWh per day). In the winter months, when the number of daylight hours decreases, the same photovoltaic installation will produce around 20 to 30 kWh per month, during months like January and December [36]. Taking into account the monthly number of sunlight hours in Poland from January 2020 to December 2023 (Figure 6), the energy demand calculated for the proposed system, and the need to store energy for the operation of the installation during the night, calculations were made regarding the power of the photovoltaic installation and the battery capacity, which together would provide the energy for the biogas plant.
In the calculations, the use of the biogas plant was limited to the months of April to September, considering that the average number of sunlight hours in October and November significantly deviates from the average of the other months. This would result in a significant over-sizing of the system and an increase in production costs.
To ensure the system operates effectively in April, where only 3 h of adequate sunlight is available per day for efficient photovoltaic panel operation, the necessary energy reserve must be calculated. This energy storage is determined based on Equations (12) and (13).
I = P U = 14 12 = 1.16
where:
I—current (measured in amperes, A);
P—power (measured in watts, W);
U—voltage (measured in volts, V).
K = I × t = 1.16 × 21 = 33.6
where:
K—battery capacity (measured in ampere-hours, Ah);
I—current (measured in amperes, A);
t—operating time (measured in hours, h).
The battery capacity calculated in this way is approximately 34 Ah, which is sufficient to maintain the operation of the temperature stabilization system under ideal conditions, without energy losses during storage. However, due to the specifics of battery operation and the photovoltaic system’s charge controller, it is necessary to increase the battery capacity by approximately 30%, resulting in a final capacity of 44 Ah.
Based on information available online, it was estimated that to charge a 44 Ah battery in less than 3 h, a system of two photovoltaic panels, each with a maximum power output of 360 W, is required. To supply renewable energy for the biogas plant, two photovoltaic panels with the following specifications could be utilized:
  • Maximum power output: 360 Wp;
  • Module efficiency: 19.2%;
  • Power tolerance: 0~+5 W;
  • Maximum nominal fuse current: 20 A;
  • Number of cells: 120;
  • Panel dimensions: 176.5 cm × 104.8 cm × 3.5 cm;
  • Weight: 19.5 kg;
  • Operating temperature range: −40 °C to +85 °C.
The proper functioning of the designed installation will also require the use of a voltage regulator with a dusk function, which enables the connected receiver to operate for a specified number of hours after sunset. Using renewable energy sources (RESs) to power the biogas plant will increase production costs. However, a significant drawback of this solution is that the energy acquisition and storage system would increase the biogas plant’s weight by approximately 55 kg. This would compromise its mobility, making it unsuitable for winter storage indoors after being emptied.
The authors of the study also argue that powering the biogas plant directly with electricity from renewable energy stored in batteries would result in a larger environmental footprint compared to using grid electricity, regardless of its source. This is primarily due to the inefficiency of photovoltaic systems during summer, where most of the produced energy would go unused. Moreover, the method of battery operation—frequent minor recharges and prolonged periods of full charge—would significantly shorten battery life, necessitating frequent replacements. This, in turn, would considerably increase operating costs.
Considering the disadvantages of this solution—namely:
  • Increased production costs;
  • Increased system weight;
  • Higher operational costs;
  • Waste generation in the form of used batteries—promoting such a system seems environmentally and economically unjustifiable.
For farms already equipped with photovoltaic systems, using surplus energy to power the biogas plant during the summer months could be a beneficial solution. By integrating the biogas system into an existing RES-powered infrastructure, the cost and environmental impact of new installations, including additional photovoltaic panels and batteries, could be minimized. This would allow farms to utilize renewable energy effectively while maintaining the system’s efficiency and reducing dependency on non-renewable energy sources.

3.3. Assessment of Fermenter Operation, Along with Optimization of Process Conditions

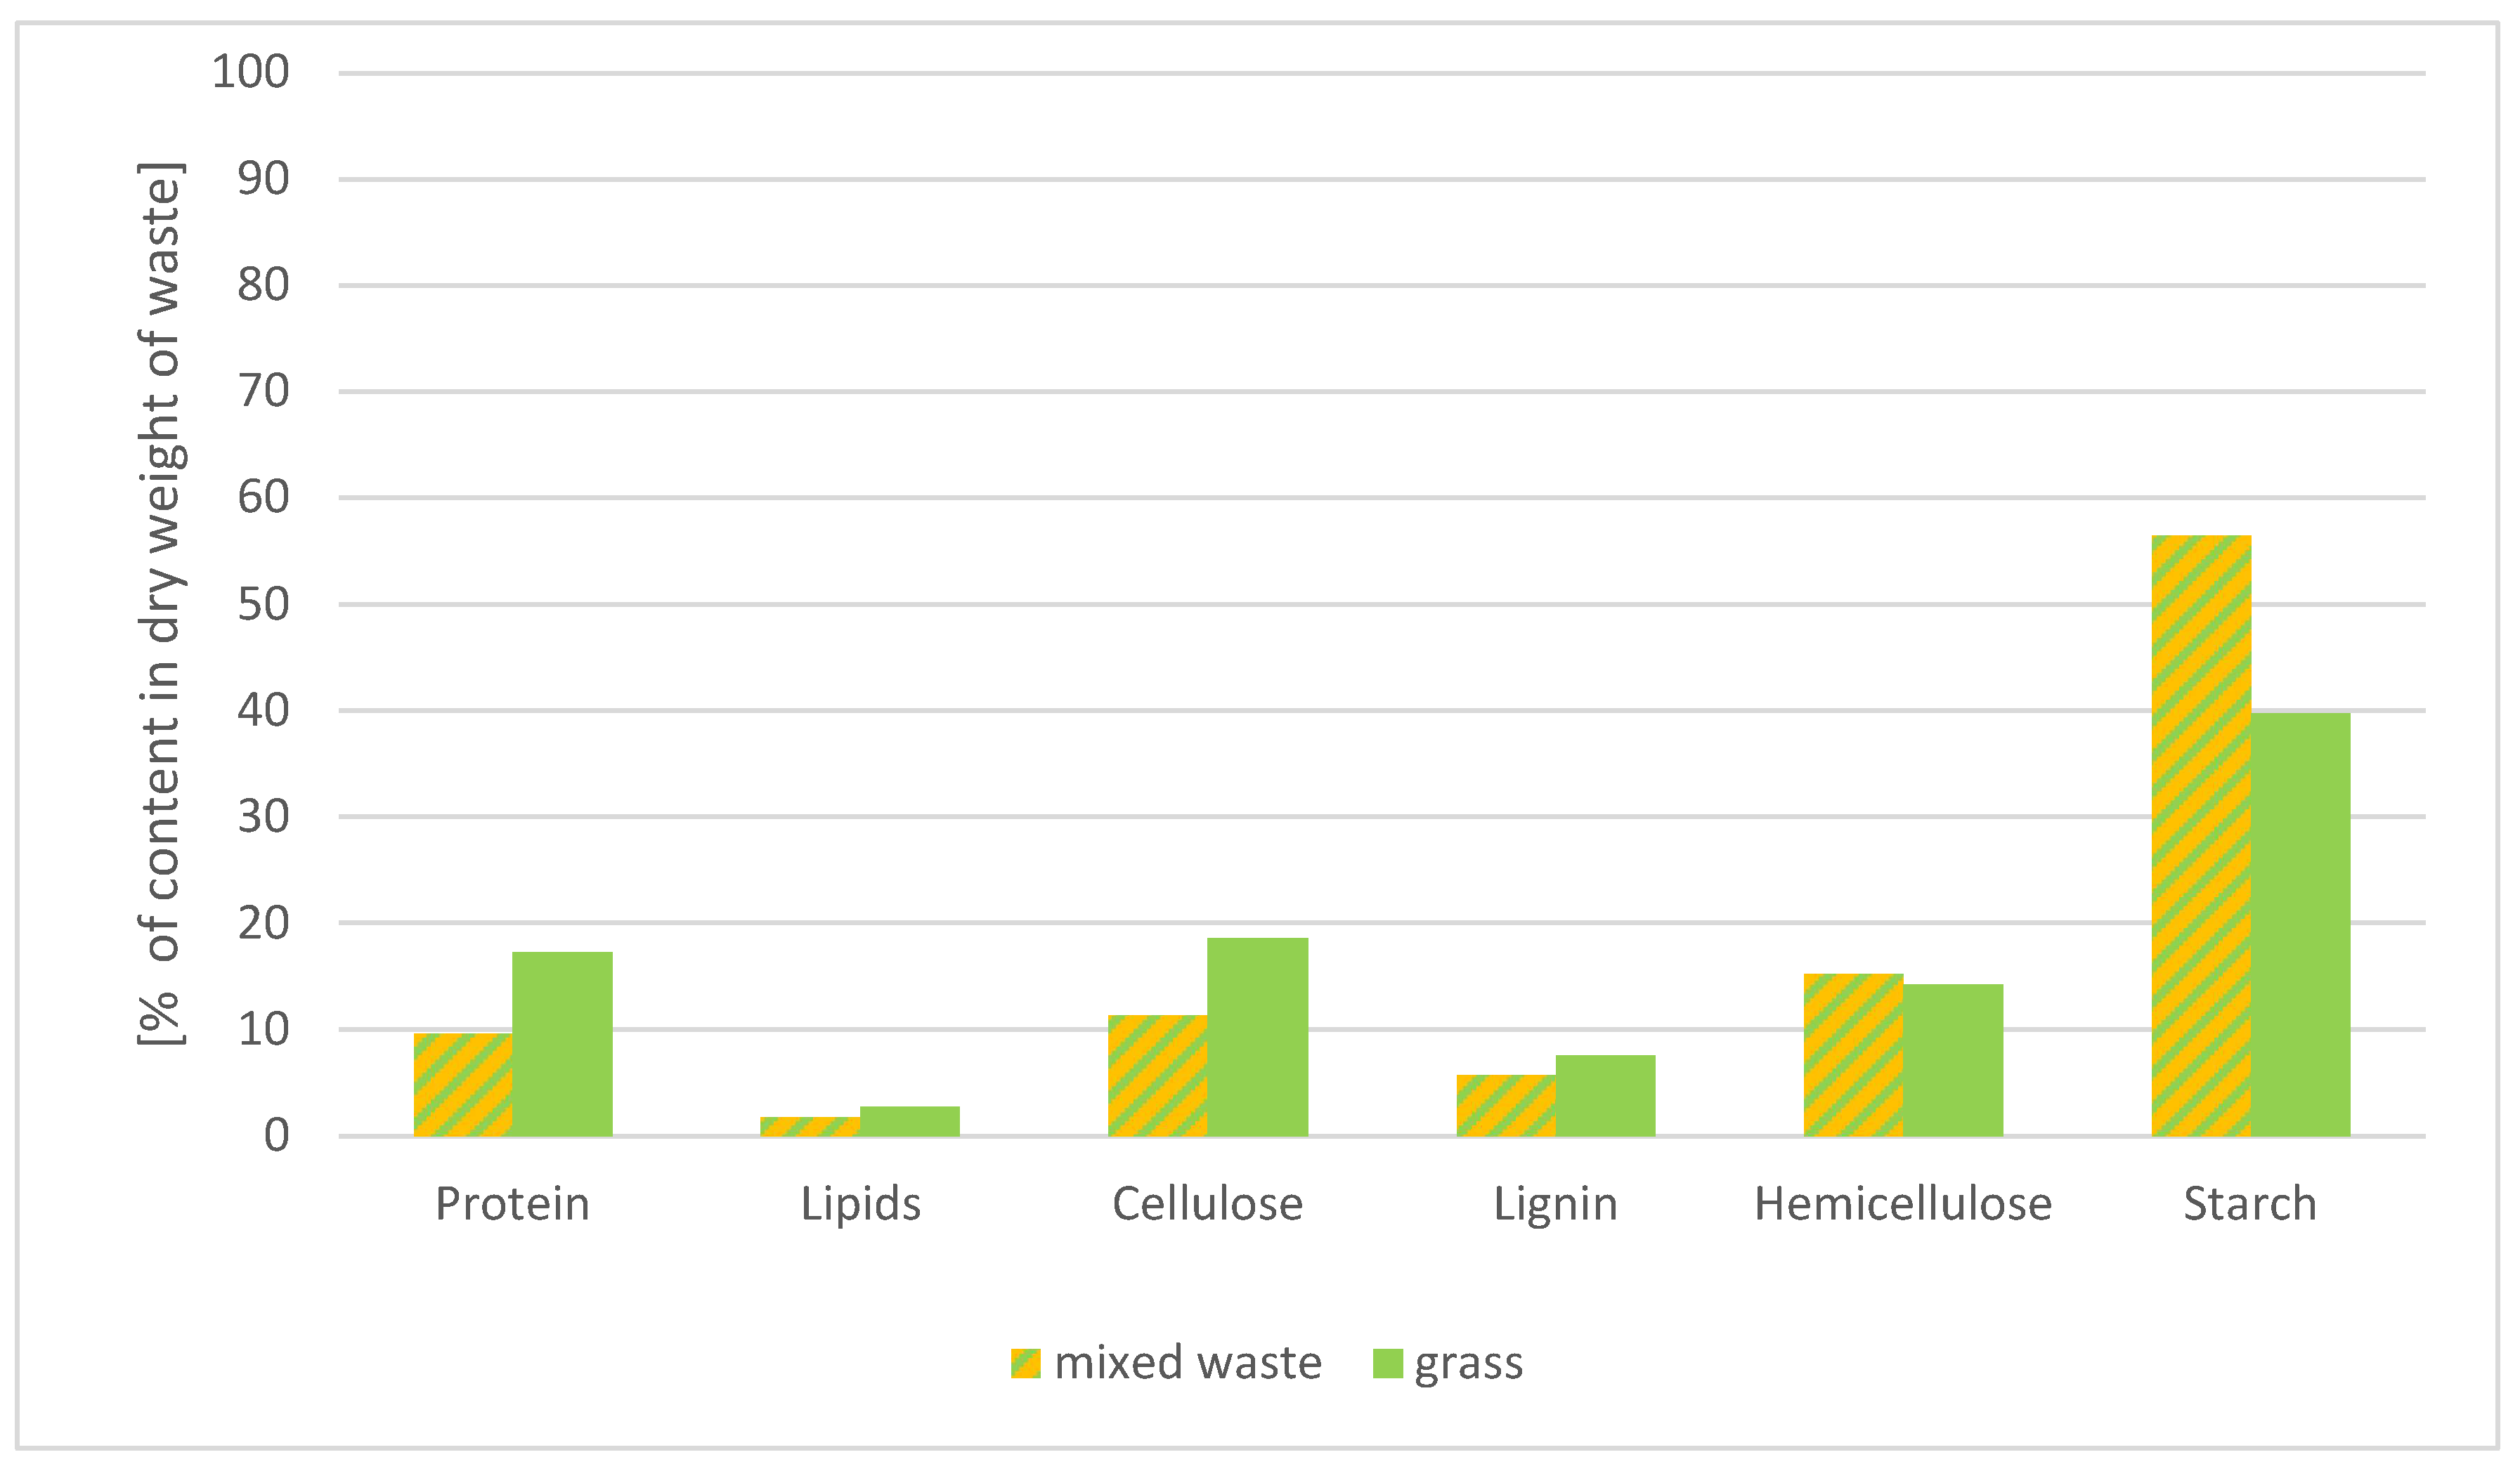
3.3.1. Assessment of the Quality of Waste Used as Input to the Reactor

When planning and modeling the operation of a fermenter, understanding the quality of the biological feedstock to be processed during methanogenesis is crucial. This knowledge is essential because the process of methanogenic fermentation is often defined as a series of anaerobic biochemical processes in which macromolecular organic substances are broken down into smaller organic acids and alcohols, and subsequently into methane, carbon dioxide, and water.
The composition of substrates used as feedstock in bioreactors for biogas production is critical for evaluating the fermentation potential. A qualitative assessment of substrate composition allows for an approximate estimation of the biogas yield.
Research has indicated that such estimations can be conducted using the Anaerobic Digestion Model No. 1 (ADM1) [38,39]. However, this requires the determination of specific parameters, such as:
  • Dry weight;
  • Ash content;
  • Raw protein;
  • Raw lipids or fats;
  • Raw fiber;
  • Neutral detergent fiber;
  • Acid detergent fiber;
  • Acid detergent lignin.
Having data on the listed parameters for the applied feedstock enables the use of the ADM1 model to calculate the quantities of proteins, fats, cellulose, lignin, hemicellulose, and starch in the substrate. This facilitates precise modeling of the biochemical processes involved in anaerobic digestion and optimizes predictions of biogas production potential.
The necessary studies were conducted for two types of waste: mixed household waste (Sample 1) and green waste (Sample 2).
A comparison of the results obtained for both samples is shown in Figure 7.
The data presented in Figure 7 indicate that the mixed waste sample contained more water and sodium chloride, while the grass sample (Sample 2), with dry mass accounting for around 30% of the waste, predominantly consisted of fibers from different fractions and total carbohydrates. To apply the obtained results of the sample analysis to the theoretical simulation of biogas production according to the ADM1 model, they were converted into specific compounds following the formulas presented in Table 5. A comparison of the converted results for both samples is shown in Figure 8.
A summary of the calculated contents of individual fractions included in the substrates used for biogas production in this study is presented in Table 6.
The analysis of the data presented in Figure 7 and Figure 8 indicates that the studied substrates (mixed waste and grass) differ not only in water content but also in other components. Despite this, starch is the dominant component in both samples, constituting between 39.8% and 56.5% of the dry matter. In the grass sample, the total content of cellulose and hemicellulose amounted to 32.8% of the dry matter, while in the mixed waste sample, the levels of protein, cellulose, and hemicellulose were more evenly distributed, ranging from 9.6% to 15.3%.
As part of the second phase of this research, the modeling efforts were conducted using theoretical data to assess the accuracy of the implemented ADM1 model. The theoretical productivity of both substrates was estimated based on the literature data, as presented in Table 6 [40].
Based on the data provided in Table 6, the following estimations can be made:
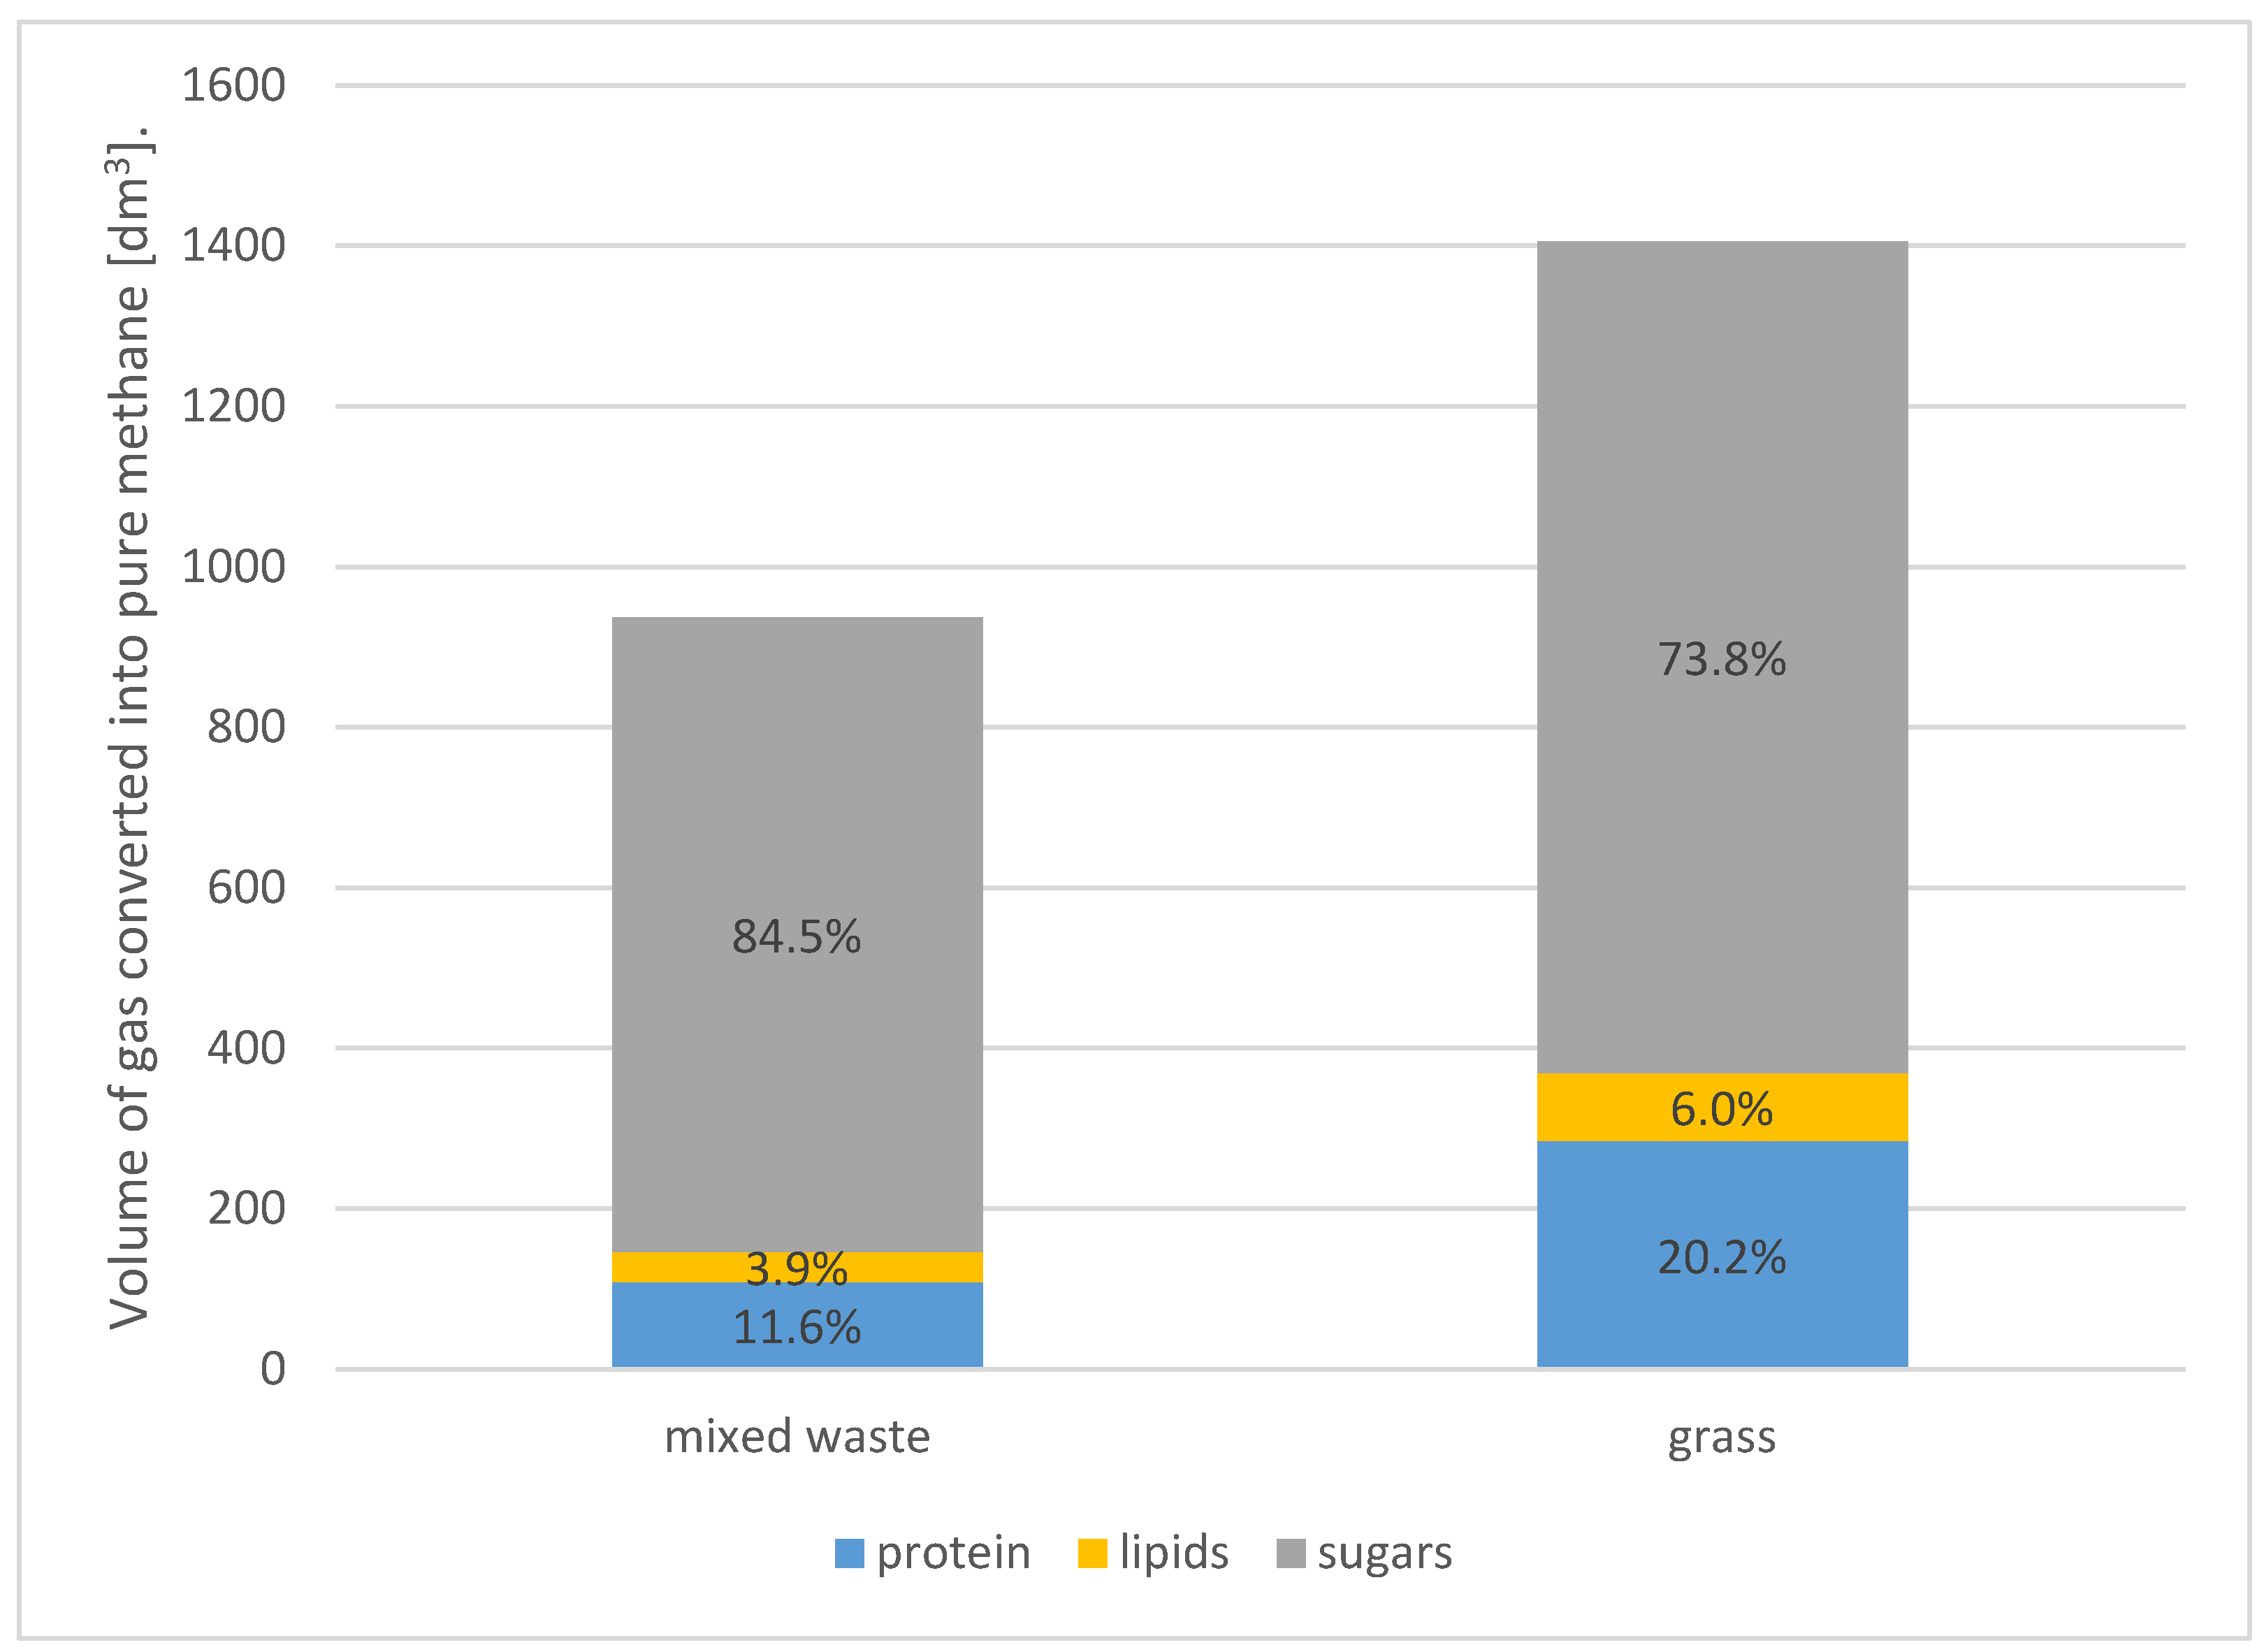
  • Mixed waste (Sample 1): with 21.5% dry matter content, 10 kg of mixed waste can produce approximately 937 dm3 of biogas (converted to pure methane).
  • Grass (Sample 2): with 31.2% dry matter content, 10 kg of grass can produce approximately 1405 dm3 of biogas (converted to pure methane).
Although grass can yield 1.5 times more methane than mixed waste from the same volume, both substrates rely primarily on sugars for biogas production, as shown in Figure 9.
A 10 kg feed into the fermenter allows you to obtain methane with an energy value of 10.4 kWh in the case of mixed waste or 15.5 kWh in the case of grass. This amount of gas will power a 9 kW gas grill burner for approximately 70 min and approximately 105 min, respectively.

3.3.2. Productivity of Biogas Obtained from Green Wastes in Laboratory Conditions

Analyses of biogas productivity under laboratory conditions were conducted over a period of 4 months. The results, including the composition of the obtained biogas (only those with a methane concentration higher than 40%) and its volume, are presented in Table 7.
Taking into account only biogas in which the methane content was at least 35%, it should be noted that the total volume of biogas obtained in 3 months was 1663 cm3, in which methane constituted a total of 761.51 cm3 (0.761 dm3). This does not seem much, but it should be emphasized that this volume was obtained from 200 g of raw grass (62.44 g DW). In addition, the grass was not prepared in any way for the biogasification process (it was not crushed to increase the surface area of the substrates available to microorganisms, and the substrates were not previously subjected to any treatment, for example aerobic biodegradation). Comparing the results of biogas productivity obtained under laboratory conditions with theoretical calculations based on the analysis of substrate composition, it can be stated that the actual productivity of the grass substrate was approximately 11.5 times lower. This may be due to the fact that the assessment of the productivity of the grass substrate did include biogas, which consisted of methane in an amount of less than 35%.

3.3.3. Results of the Assessment of Biogas Productivity from Green and Mixed Waste on a Technical Scale

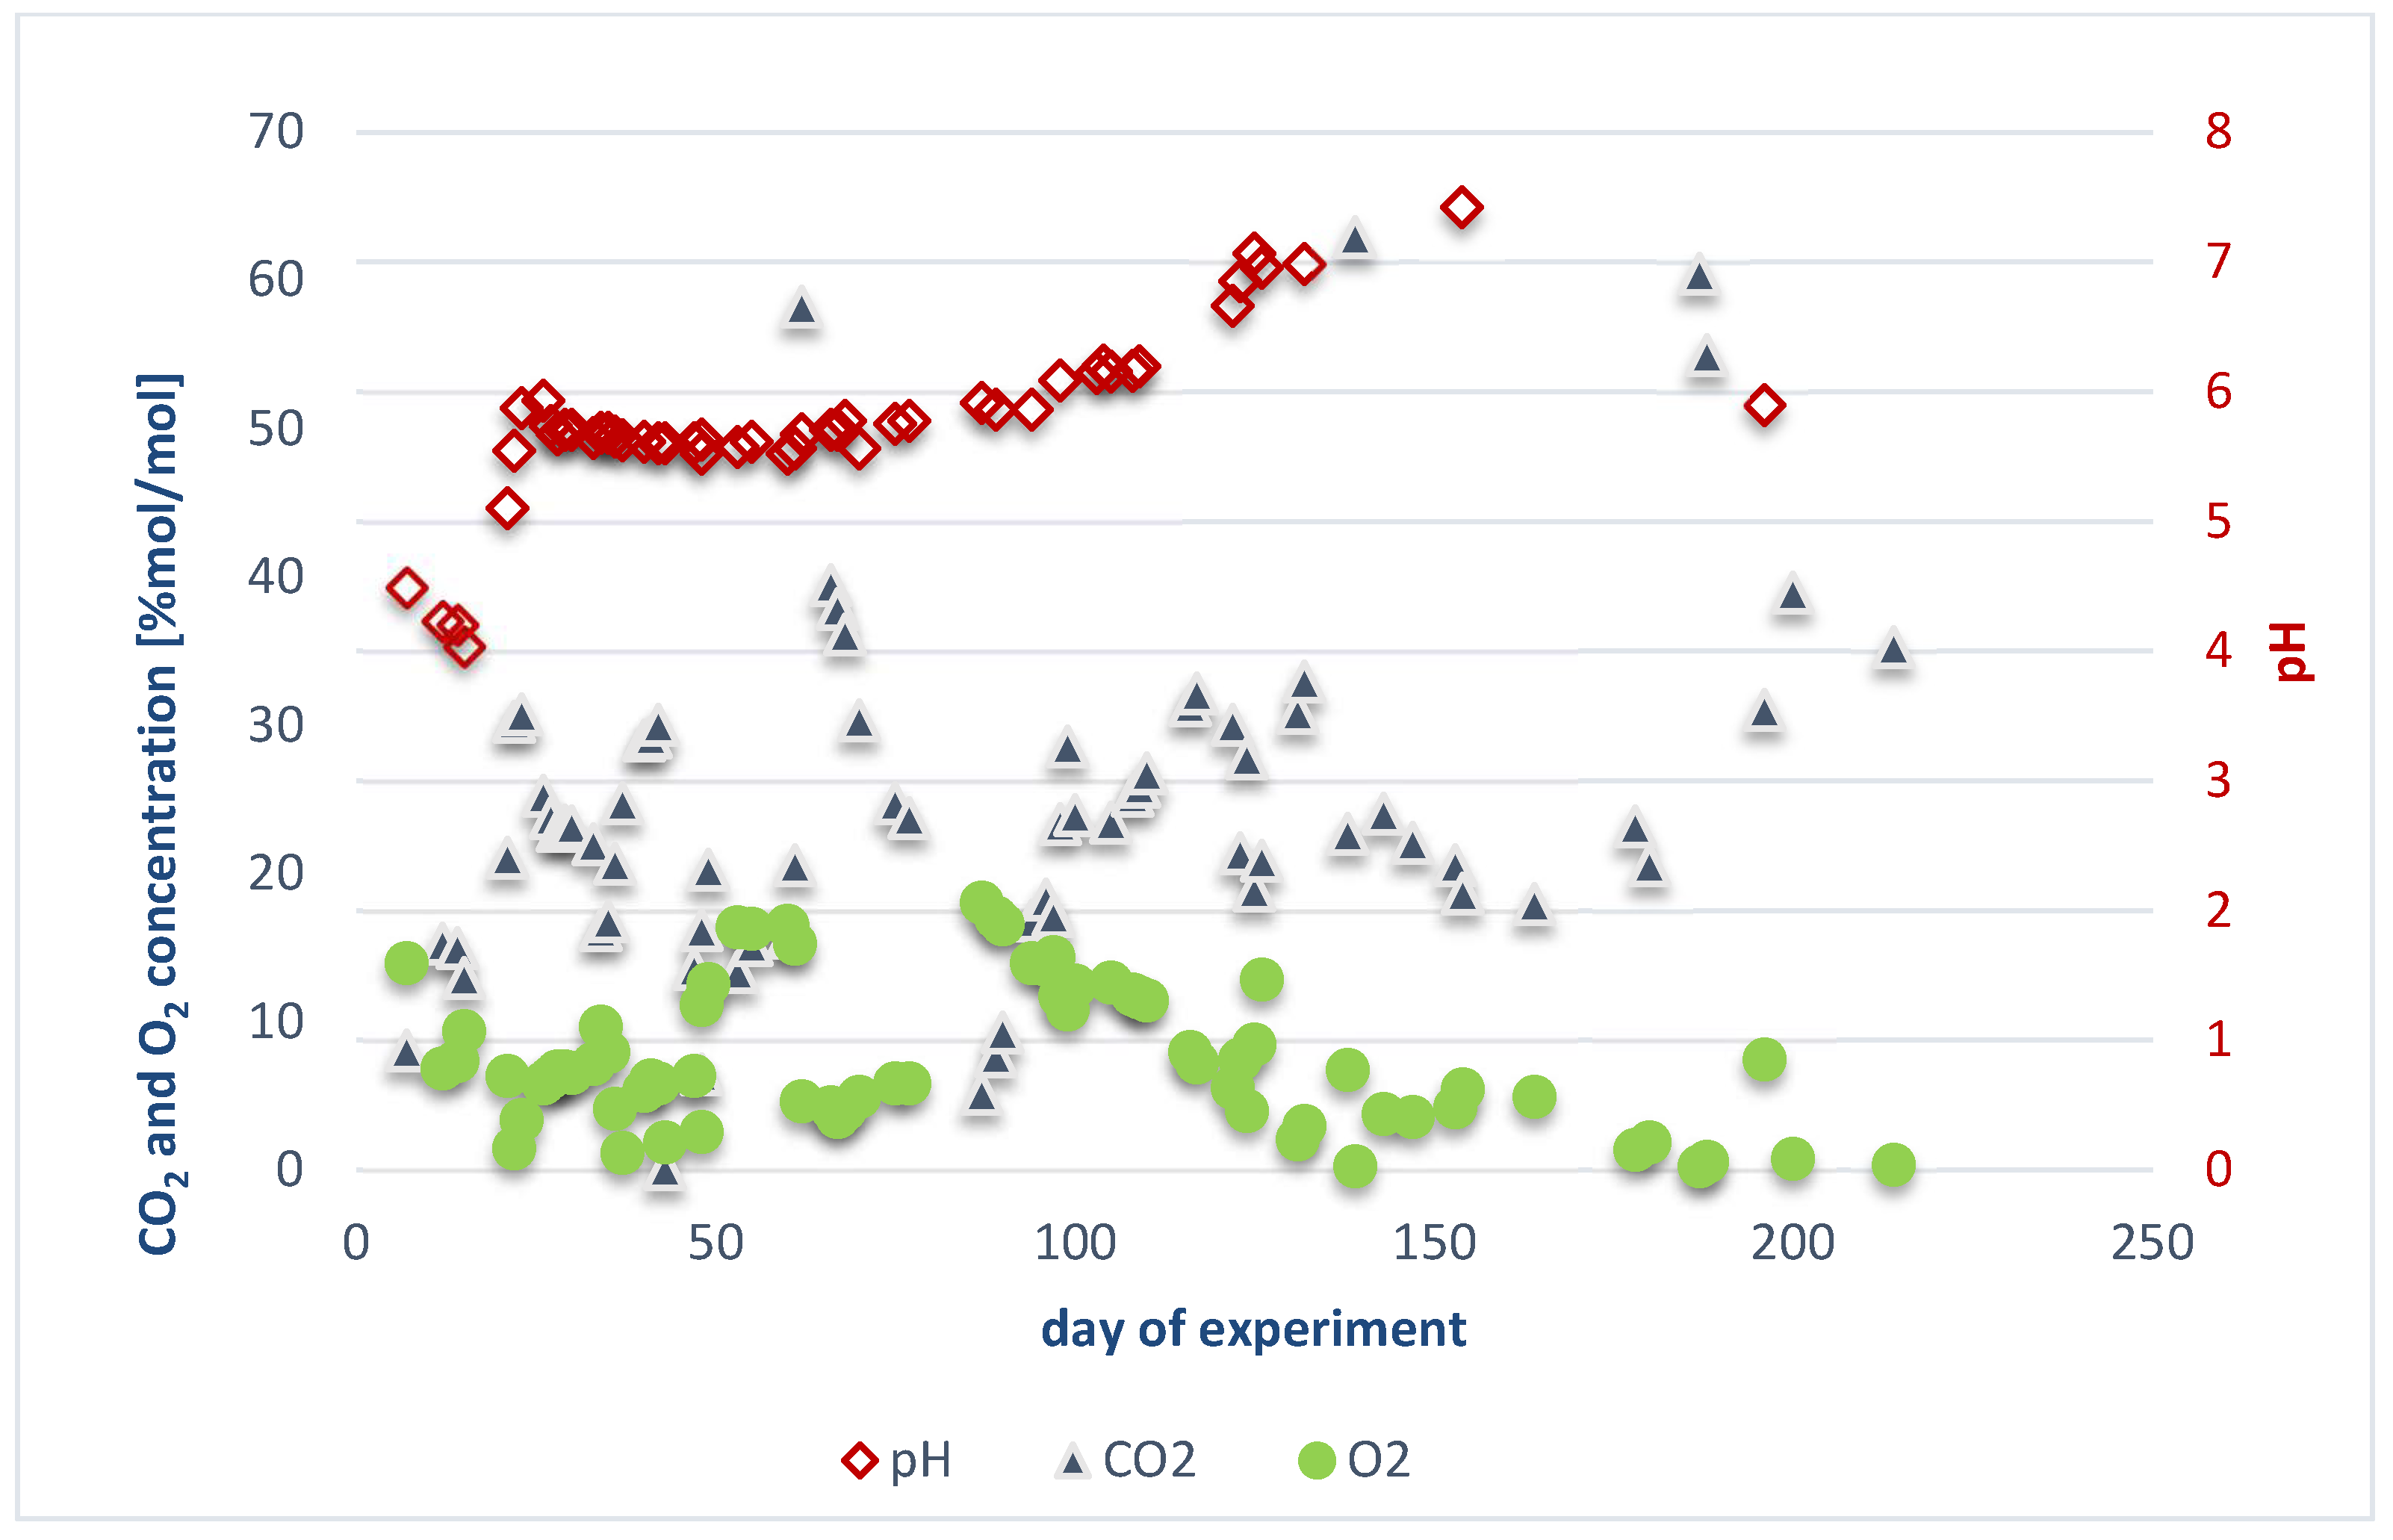
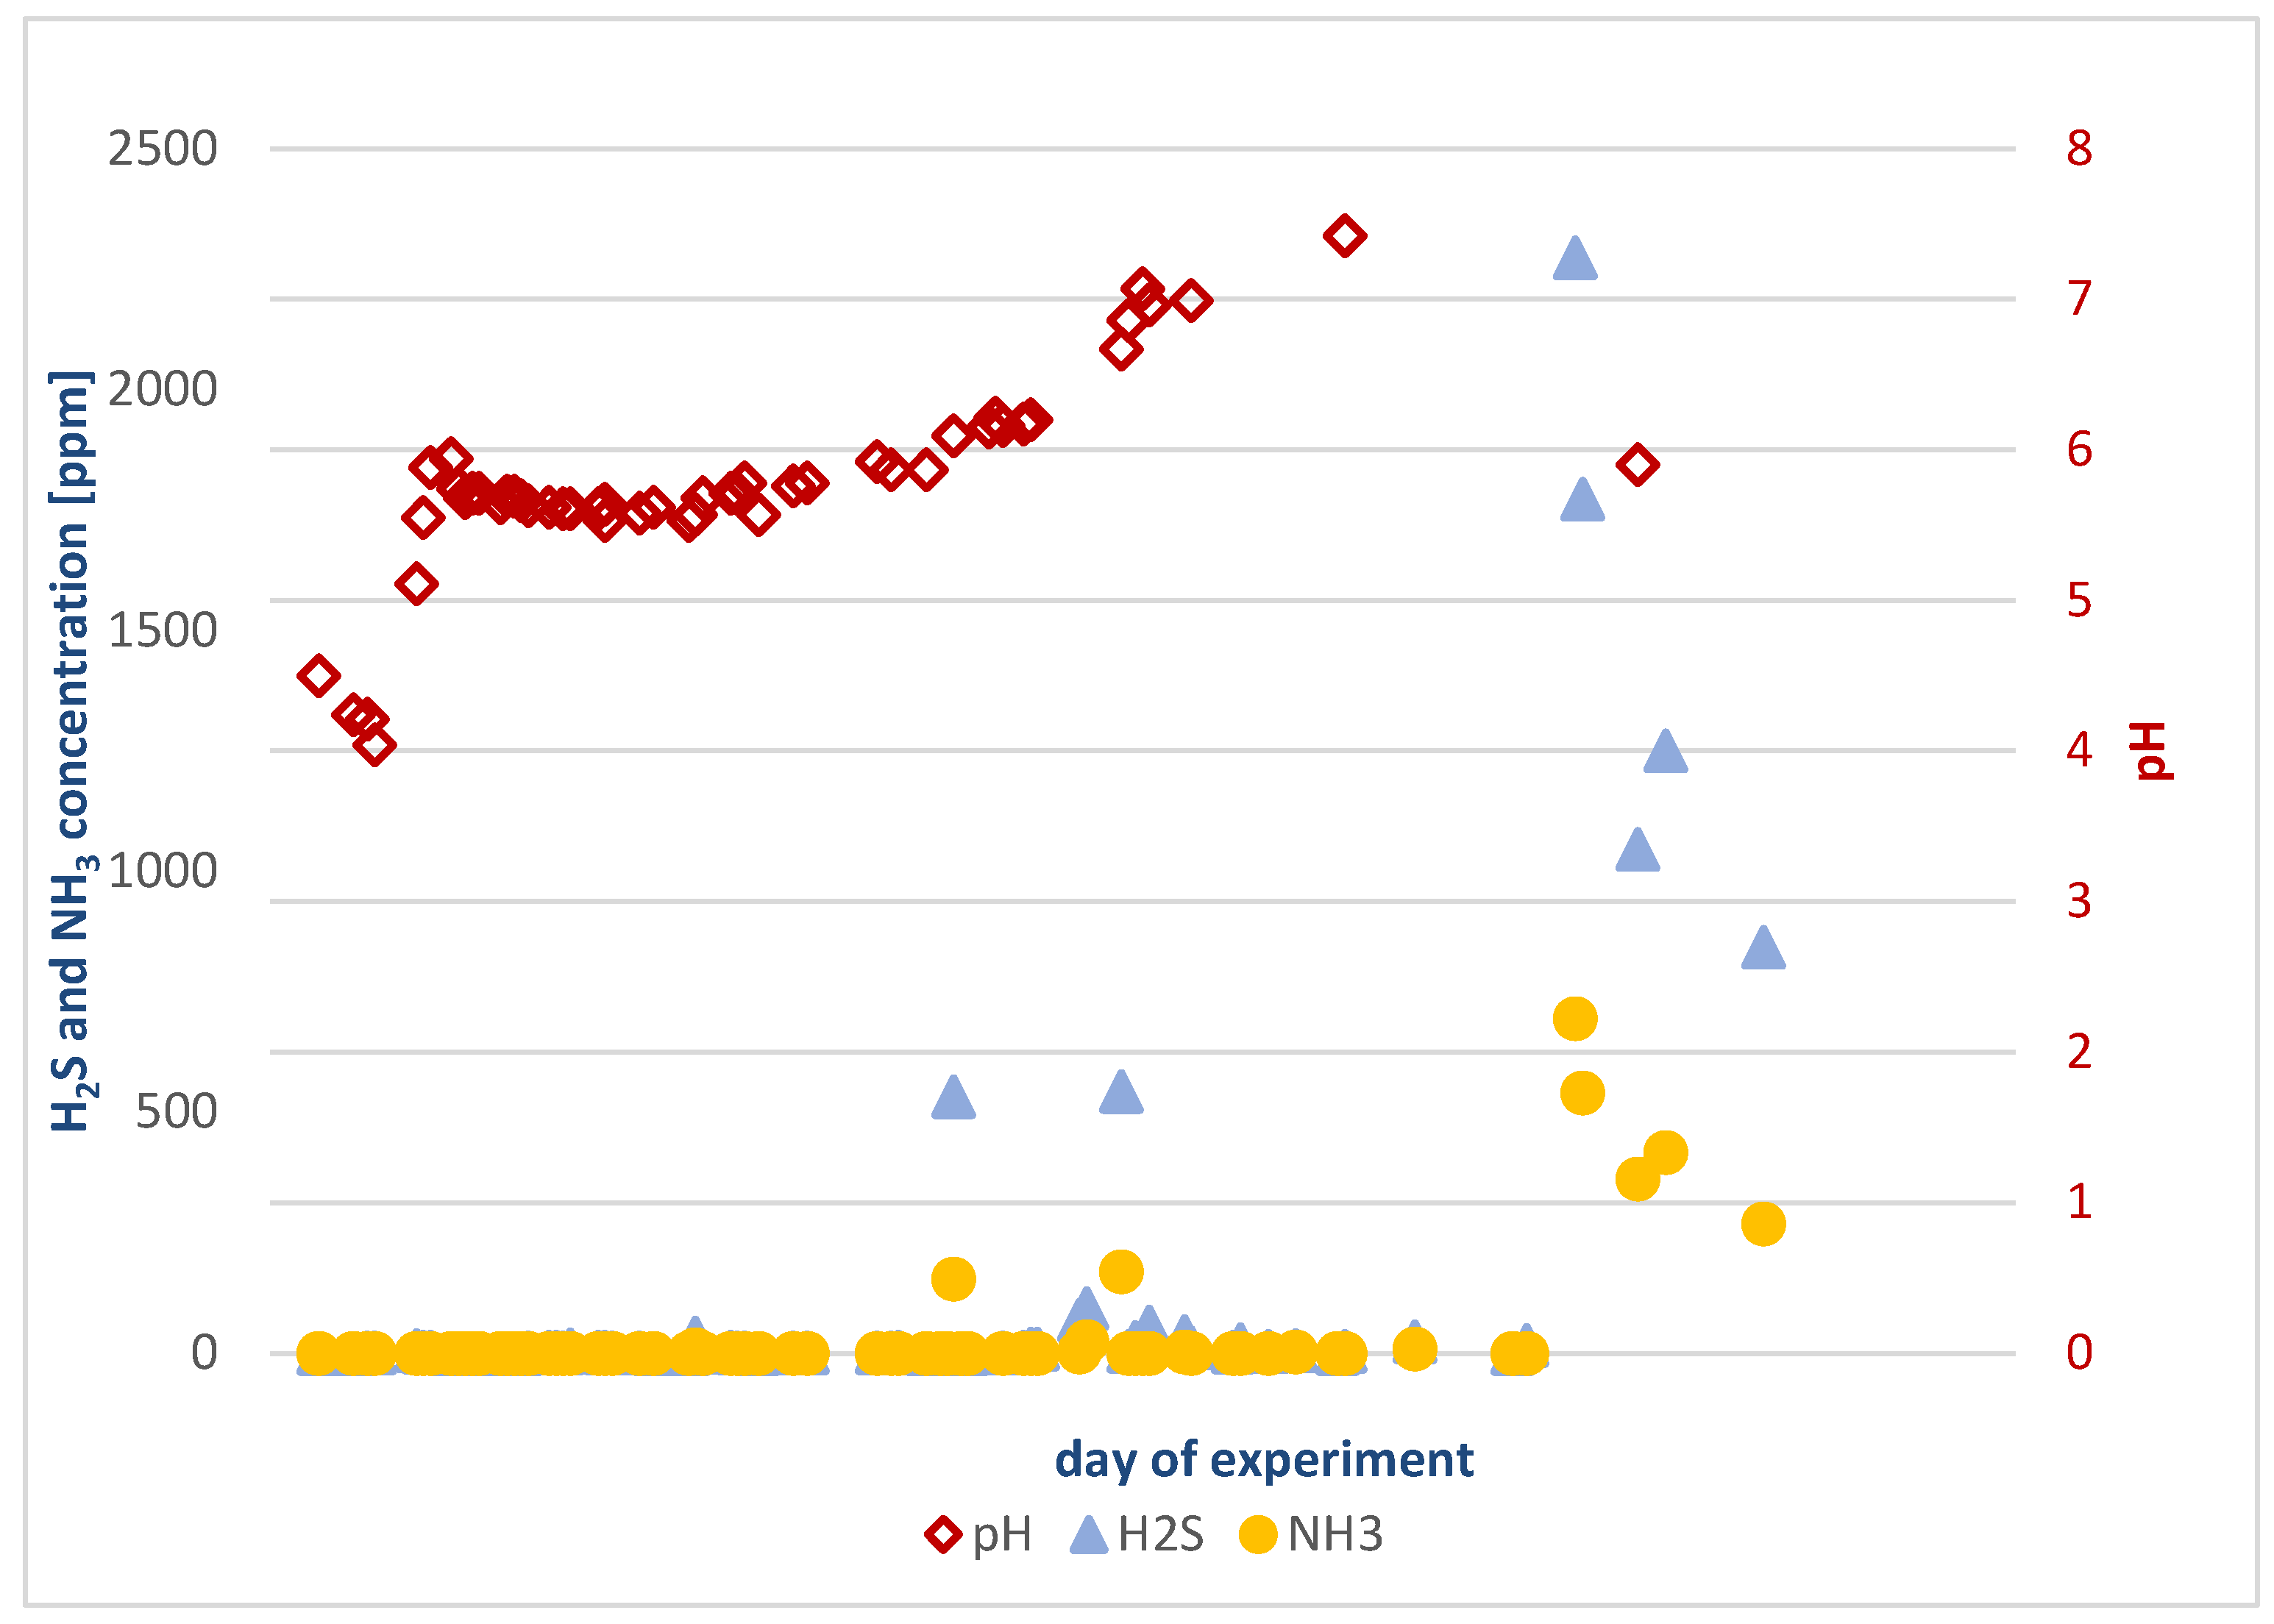
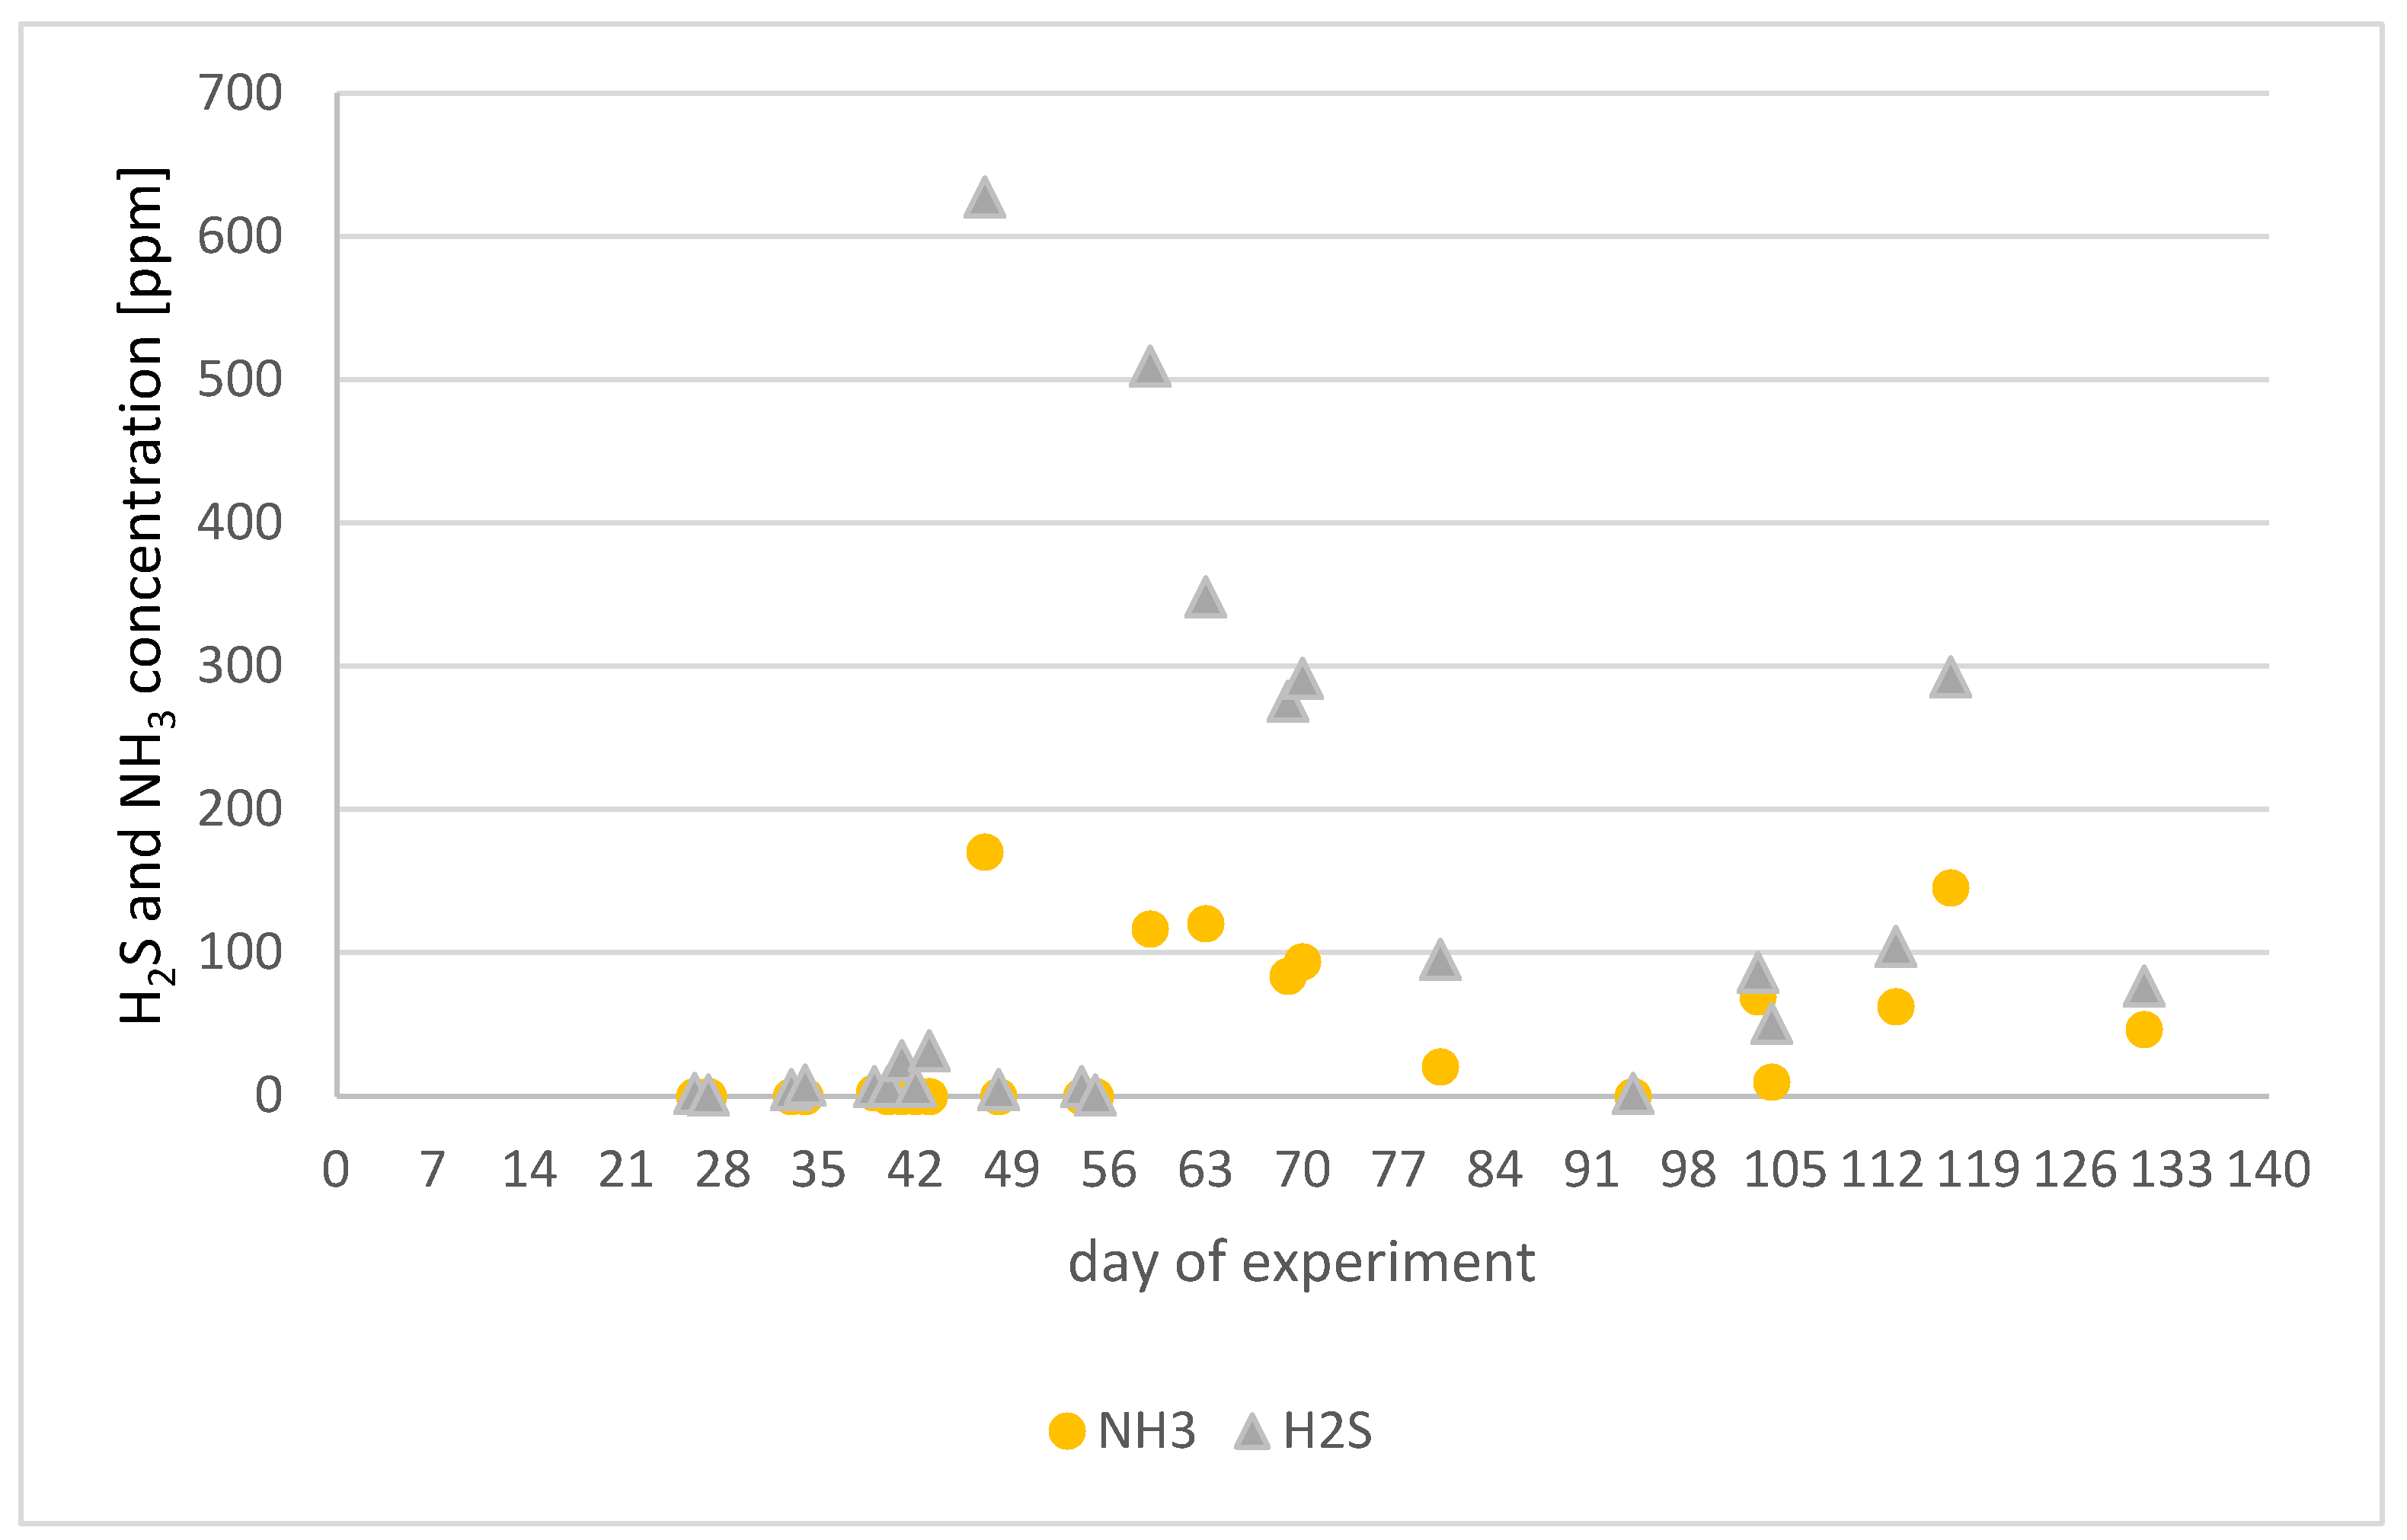
Results Obtained for the Experiment in Reactor 1

Over the 7-month operation period of the biogas plant demonstrator using mixed waste, the following changes were observed:
  • Leachate pH ranged from 4.0 to 7.4;
  • Biogas composition varied as follows:
    Methane: 0 to 63.6%;
    Carbon dioxide: 0.1 to 63.0%;
    Oxygen: 0.3 to 18.1%;
    Ammonia: 0 to 694 ppm;
    Hydrogen sulfide: 0 to 2274 ppm.
The changes in the concentrations of the primary biogas components over time, correlated with the leachate pH, are presented in Figure 10 and Figure 11.
Data presented in Figure 10 and Figure 11 indicate that the methane content in the produced gas began to increase after 90 days of the process, with small initial amounts of methane (0.1%) appearing as early as 45 days into the experiment. The first significant methane production peak occurred on day 125 (40.2% methane), but methane levels began to decline sharply approximately four days later. After feeding the biogas plant with a batch of waste of similar composition, the methane concentration rose again, but only to slightly above 20%.
Adding just 5.8 kg of waste caused the methane concentration to drop below 10% within another 10 days. However, introducing another 5 kg of substrate on day 190 led to a rapid increase in methane levels, reaching a maximum of 63.6% on the final day of the experiment (day 214).
After the first week of the experiment, the measured oxygen concentration in the gas inside the reactor was 14%, likely caused by air entering the reactor during biomass loading. Similar oxygen concentrations were observed between days 50 and 64, during which issues with the reactor’s sealing were noted. It should be emphasized that oxygen levels exceeding 10% can negatively impact the methanogenic fermentation process. Therefore, in the case of Reactor 2, the process was initiated by first introducing 20 kg of sand into the reactor.
The biogas produced in Reactor 1 contained typical biogas impurities, such as hydrogen sulfide and ammonia (Figure 12).
The data presented in Figure 12 show that the peaks of maximum concentrations of hydrogen sulfide and ammonia coincide with the peaks of maximum methane concentrations, with an accuracy of 1–2 days. It can also be observed that hydrogen sulfide concentrations above 100 ppm occurred only on 7 out of the 214 days of the experiment. For most of the experiment, both hydrogen sulfide (17 days) and ammonia (9 days) concentrations did not exceed 10 ppm.
From day 101 of the experiment, biogas production was sufficient to create overpressure in the reactor, allowing the gas storage tank to be filled. For the remaining 116 days of the experiment, the average daily biogas production ranged between 25 and 35 dm3. In total, 3.400 dm3 of biogas was produced during this period, with an average (arithmetic) methane content of 20.9%. This corresponds to 711 dm3 (0.711 m3) of pure methane obtained from a total substrate quantity of 30.8 kg.
Comparing the obtained methane volume with the theoretical calculations in Section 3.3.1, it can be concluded that, theoretically, approximately 2.886 dm3 of methane could be obtained from the given amount of waste. Thus, the measured result is four times lower than the theoretical value. However, it should be assumed that the measured result may be underestimated for two reasons.
Firstly, as shown in Figure 10, the experiment was terminated during a subsequent methane production peak, meaning that the biogas production process from the introduced substrate had not yet been completed. The decision to end the experiment was due to external factors unrelated to this study. Evidence that methanogenesis in Reactor 1 continued for an additional three months is provided by the fact that on day 123 of the experiment, the measured methane content in the gas inside Reactor 1 was 23%.
Secondly, the average methane content in the gas was calculated as an arithmetic mean of the measurements, rather than a weighted average relative to the amount of biogas produced. The inability to calculate a weighted average resulted from the fact that methane content measurements were conducted offline and irregularly (2–5 measurements per week) rather than continuously.
Additionally, it was observed that changes in methane concentration in the biogas corresponded to variations in the amount of biogas produced.

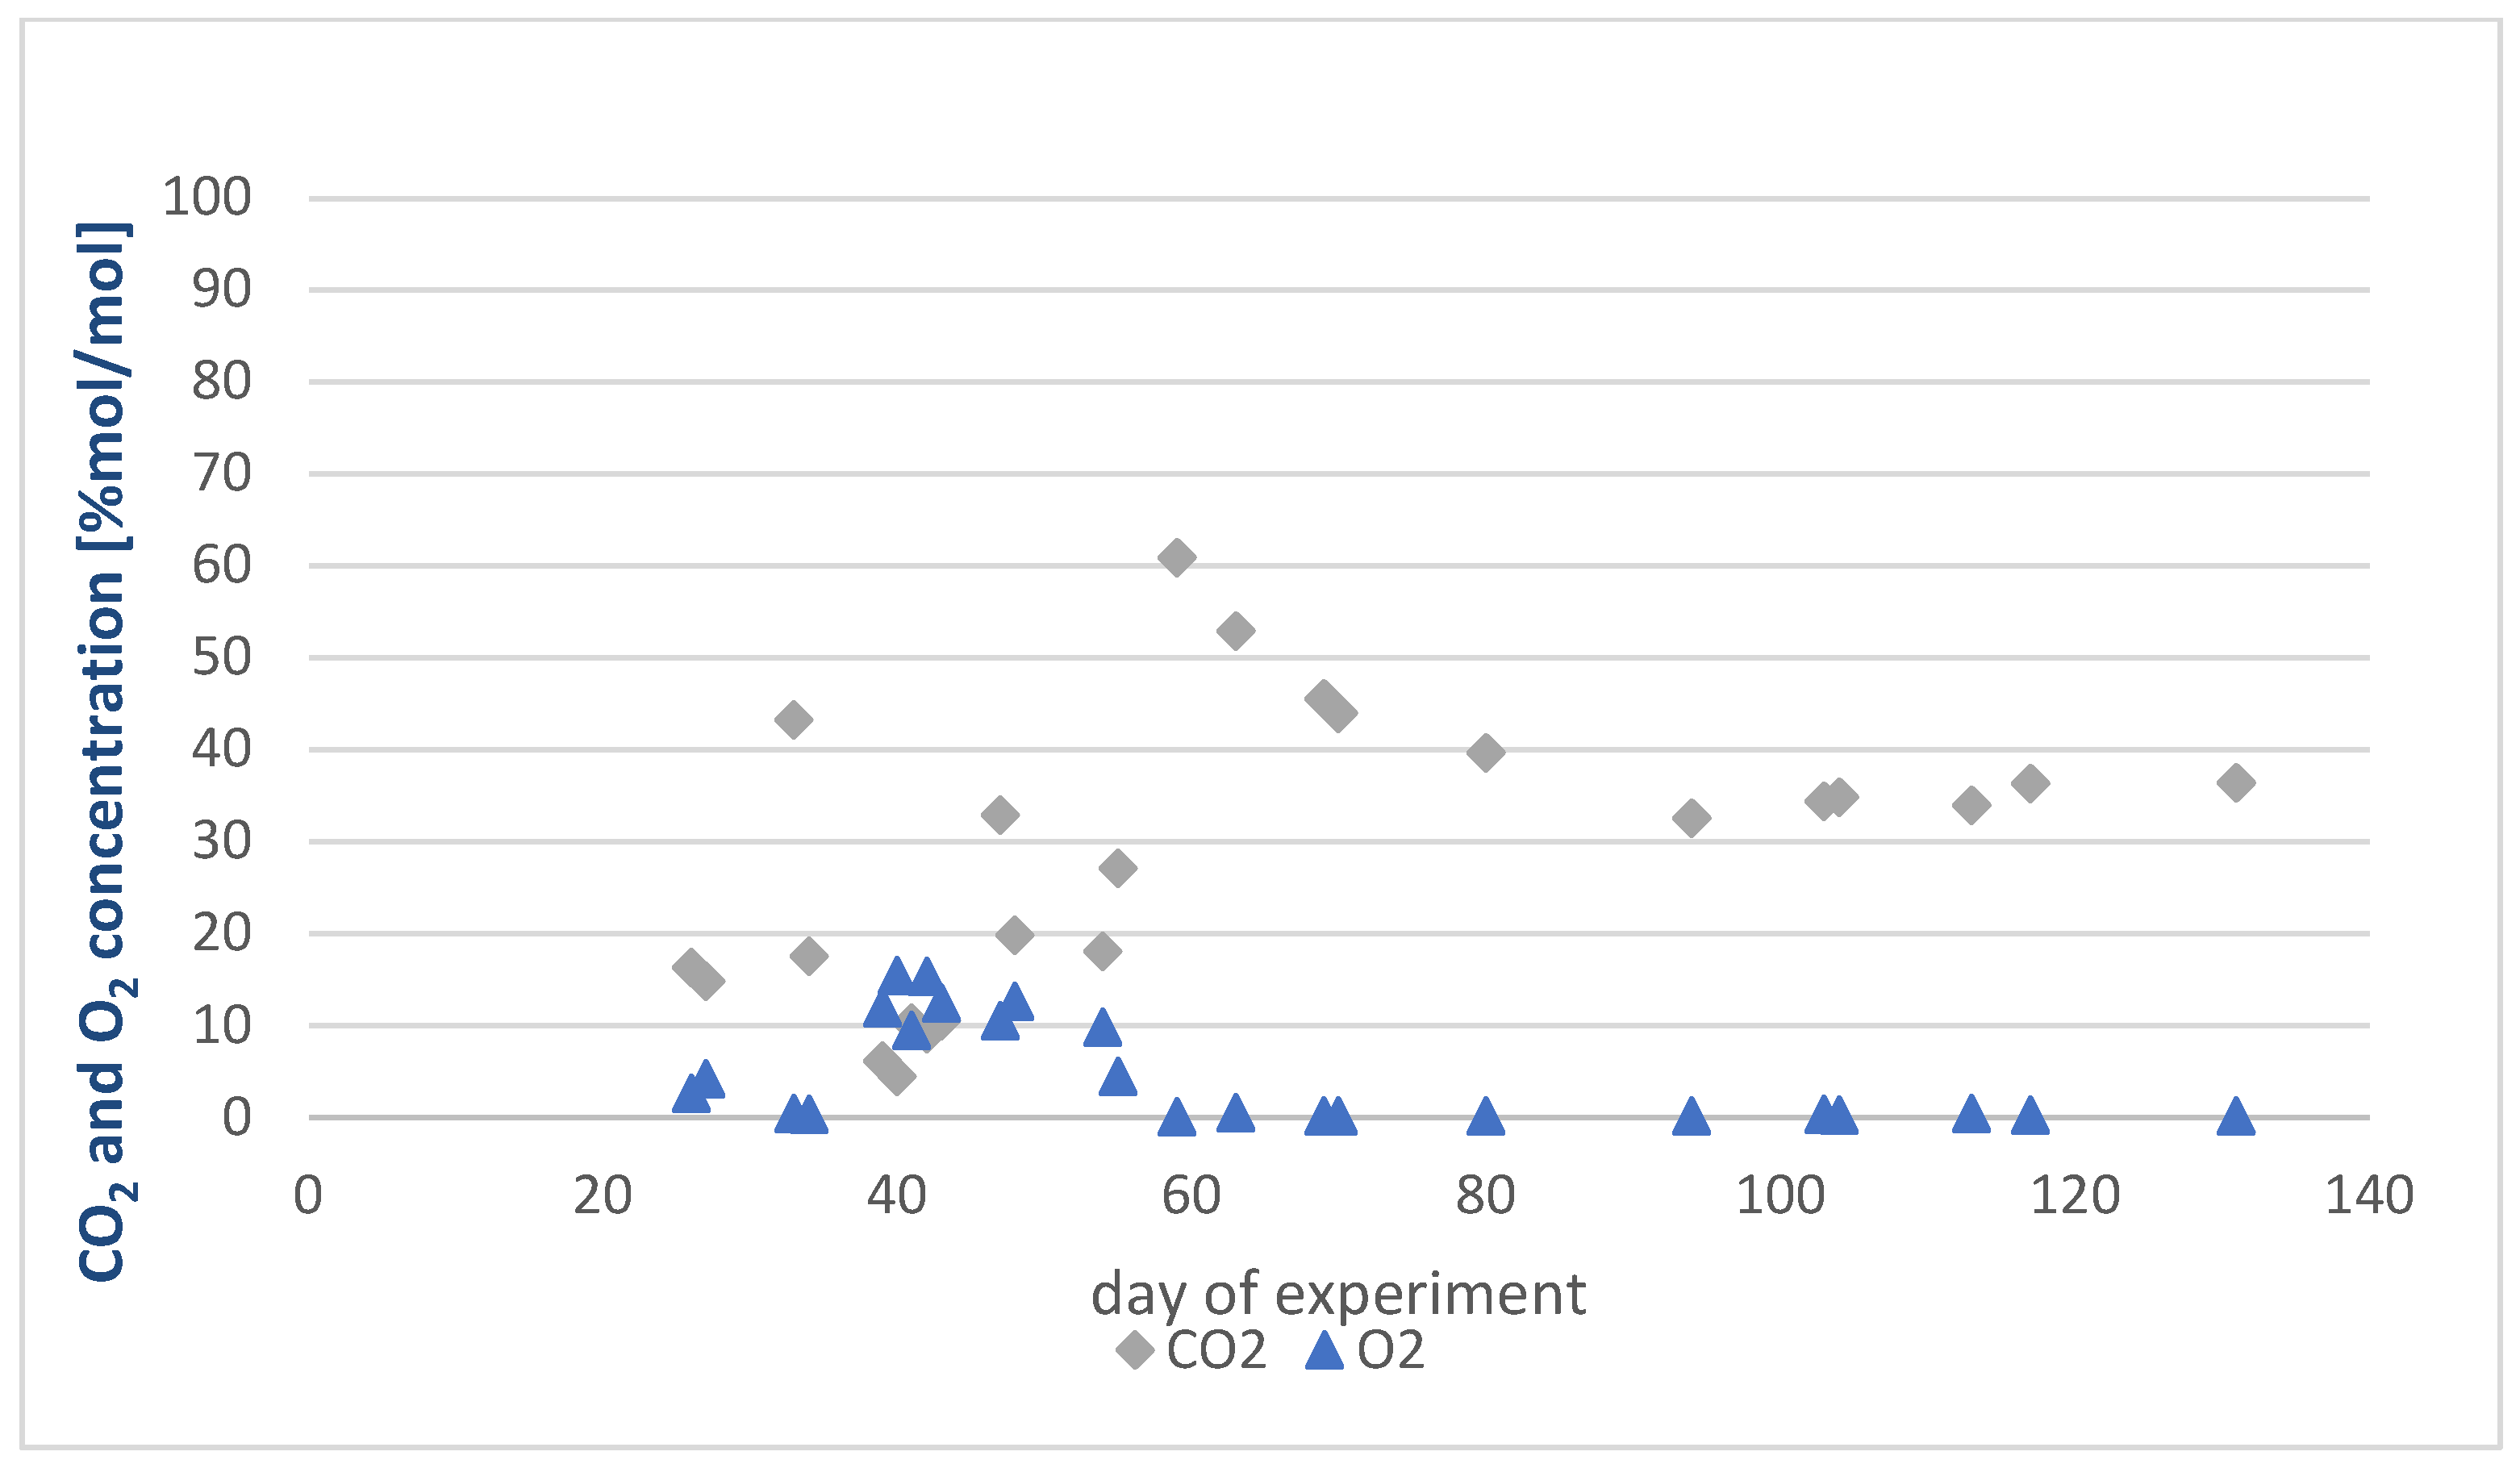
Results Obtained for the Experiment in Reactor 2

Figure 13, Figure 14 and Figure 15 show the changes in the concentrations of the components of the produced biogas over the course of the experiment in Reactor 2.
After stabilizing the leachate pH above 6.1, a nearly constant increase in methane concentration was observed. The methane concentration in the biogas exceeded 50% on day 44 of the experiment and stabilized at around 60% on day 65 of the experiment.
In the initial phase of the experiment, similar to Reactor 1, a significant oxygen content in the gas inside the reactor was observed. However, the much faster increase in methane concentration in Reactor 2 (Figure 13) suggests that the anaerobic zone created by the sand yielded the expected results, providing a zone that supported the survival of anaerobic organisms in Reactor 2.
During the experiment, the ammonia content varied from 0 to 171 ppm, while the hydrogen sulfide content ranged from 1 to 628 ppm. Both contaminants exhibited significant fluctuations over time, but it was also noticeable that increases in the concentration of one contaminant were time-correlated with increases in the concentration of the other.
To estimate the biogas productivity for Reactor 2, the average gas production from day 47 to the end of the experiment was calculated as 35 dm3/day, with an average methane content of 44.9% in the gas during this period.
This means that during the 101-day period, a total gas volume of 3535 dm3 was produced, with methane accounting for 1587 dm3 (approximately 1.6 m3). This amount of methane was obtained from 58 kg of grass substrate.
Comparing the experimentally determined methane yield to theoretical calculations, it can be concluded that the actual yield is approximately five times lower than the theoretical value, which for this mass of substrate is 8149 dm3. Similarly to Reactor 1, the measured methane yield in the study may be underestimated due to the termination of the experiment when biogas production was at its peak and due to the method used to average the methane concentration in the gas. Evidence that the methanogenesis process in Reactor 2 continued for another three months is provided by the fact that on day 229 of the experiment, the measured methane content in the gas inside Reactor 2 was 51.8%.

3.3.4. Possible Use of Waste from the Biogas Production Process in the Zero-Waste Biogas Plant for Domestic Use

Studies have also been conducted to determine how the composition of the methanogenic consortium changes when exposed to a non-sterile substrate for biogas production. It was found that using Consortium-1 in the biogas production process from green waste does not pose a risk of exposure to pathogenic or potentially pathogenic bacteria. However, it should be noted that the results might be different if a different feedstock, such as one containing animal manure, were used. The research also showed that the presence of a non-sterile substrate subjects the microorganisms within the consortium to interspecies competition. In extreme cases, they may completely disappear, but this applies equally to the organisms that were part of Consortium-1 and those introduced with the substrate (e.g., Hydrogenispora). The decomposition of plant biomass is carried out by various microorganisms specialized in breaking down specific chemical compounds. It is therefore evident that as simpler substances are depleted, the population of some microorganisms will decrease, while others capable of decomposing more complex compounds will increase. A very optimistic finding is that although the presence of microorganisms introduced with the substrate caused changes in the composition of Consortium-1, it did not affect the methanogenesis process itself or its efficiency. The effluent from biogas production can be directly used as fertilizer in agriculture, as anaerobic fermentation of organic matter results in a nutrient-rich liquid containing readily available nitrogen, phosphorus, and potassium for plants [13]. The solid fraction of the digestate can also serve as fertilizer, as it contains significant amounts of organic matter and phosphorus, influencing soil composition [41,42]. Additionally, digestate can be converted into compost and subsequently used as a growing medium for plants or for land reclamation [43]. The use of digestate as fertilizer or as a substrate for composting is feasible on both industrial and household scales. Such solutions enable on-site management of digestate from biogas systems. However, it is essential to follow best practices when applying digestate as fertilizer. The amount used should match the nutrient requirements of cultivated plants to ensure nutrient uptake and minimize the risk of runoff into nearby water sources. For the same reason, digestate application should be carefully planned to avoid use during heavy rainfall or when the soil is water-saturated [44]. Microbiological studies confirm that byproducts resulting from the fermentation of green waste can be used as biofertilizers or plant-growing substrates. An optimal approach may involve partial separation of solid (for plant cultivation) and liquid (for fertilization) fractions. Studies have confirmed that pathogenic microorganisms are not present in either the produced biogas or the digestate, including both its solid and liquid phases. This ensures the safe use of digestate as a biofertilizer. The solid phase of the digestate can also be converted into compost and subsequently used as a growing medium for plants or for land reclamation. The use of digestate as fertilizer or as a composting substrate is feasible even on a household scale, allowing for on-site management of digestate from biogas systems. However, it is crucial to follow best practices when applying digestate as fertilizer. The amount used should align with the nutrient requirements of cultivated plants to ensure proper nutrient absorption and minimize the risk of runoff into nearby water sources.

4. Discussion

Despite significant differences in the conditions and methods of conducting the experiments in Reactor 1 and Reactor 2, in both experiments, flammable gas with a methane content above 45% was obtained (Figure 16). A key element in the optimization of the processes was the use of wood ash to stabilize the pH at a level close to the optimal range determined during laboratory research (a pH between 6.0 and 7.5). In the case of Experiment 1, the pH remained below the optimal value for the first 97 days, which could have affected the rate of methanogenesis compared to Reactor 2, where the pH was below 6.0 for only 33 days of the experiment. The use of wood ash is an environmentally friendly and readily available product for stabilizing pH, and its preventive application (without pH measurements) could be recommended to users of home biogas plants.
The noticeable differences in the rate of methanogenesis are also due to the fact that in the first phase of Experiment 1, the process was conducted at a temperature that was lower than optimal. The leachate temperature from Reactor 1 remained below 20 °C, while in the case of Reactor 2, a temperature below 20 °C was recorded only once.
It should be noted that the reactor used serves as an isolation from external conditions for the processes occurring inside. Additionally, solid substrates are introduced into the reactor at room temperature, and the chemical processes occurring inside can also generate heat. An important improvement for the methanogenesis process will therefore be to insulate the biogas plant as described in Section 3.2.2 (even without an external heating system) and recommend that users introduce lukewarm water (temperature 20–25 °C) into the reactor, which should help maintain the effluent temperature at around 20 °C. The experiment also showed that using sand as a reactor filler to maintain an anaerobic zone at the bottom of the biogas plant, allowing the survival of anaerobic organisms in the first days of the biogas plant’s operation, is a cheap and simple way to optimize process conditions.
The conducted studies demonstrated that the obtained bacterial consortium not only has the ability to produce biogas from untreated green waste but also operates across a wide range of temperatures at which the methanogenesis process occurs with its participation. Additionally, this consortium is resistant to pH changes down to 4.0. While in these conditions the methanogenesis process significantly slows down, it is reversible, and restoring the pH to a range of 5.6–7.4 leads to an acceleration of the methanogenesis process.
The results presented in this publication allow for the conclusion that for the applied bacterial consortium, the optimal ranges are as follows:
  • The pH for methanogenesis is between 6.0 and 7.5. However, even a temporary decrease in pH to a value of 4.0 only temporarily inhibits the methanogenesis process, and this inhibition is reversible once the pH is raised to a minimum of 5.6.
  • The temperature for methanogenesis is between 20 °C and 30 °C. A temperature drop to 4 °C, as well as a rise in temperature to 40 °C, causes inhibition of the methanogenesis process and changes in the composition of the bacterial consortium. However, at both of these temperatures, the methanogenesis process is still maintained, albeit at a reduced efficiency.
Considering the wide range of temperatures in which the bacterial consortium can survive and produce methane, even at minimal efficiency, adapting the zero-waste biogas plant to Polish climatic conditions requires isolating the fermenter and enabling its heating using an 8 W electric heating cable. Adapting the electrical energy required to stabilize the temperature from renewable energy sources necessitates the use of two photovoltaic panels, each with a maximum power of 360 W, and two batteries, each with a capacity of 22 Ah.
The research on the substrates used for biogas production tests, both kitchen waste and grass, showed that they are predominantly composed of water, accounting for nearly 70% in the case of grass and 80% in the case of mixed kitchen waste. In both cases, the dry matter consisted mainly of starch, which made up between 39.8% and 56.5% of the dry matter. The theoretical biogas productivity from 10 kg of substrate, calculated based on the composition, was 937 dm3 of gas converted to pure methane for mixed waste and 1405 dm3 for grass. The actual biogas productivity obtained in both laboratory- and technical-scale tests, when converted to pure methane, was several times lower. The differences in the obtained results may be due to both the simplifications used in the theoretical calculations and the method of averaging the results of technical-scale tests.
The effluent from biogas production can be directly used as a fertilizer in agriculture, as the anaerobic fermentation of organic matter results in easily absorbable nutrients such as nitrogen, phosphorus, and potassium, which are beneficial to plants [45]. The solid fraction of digestate can also serve as a fertilizer, containing significant amounts of organic matter and phosphorus, which can improve soil composition [41,42]. Furthermore, digestate can be converted into compost and then used as a growing medium for plants or for land regeneration [43].
The use of digestate as fertilizer or a substrate for composting is feasible both on an industrial scale and in small-scale household biogas systems. These solutions allow for the local management of digestate from HBS. However, it is important to ensure that the use of digestate as fertilizer complies with local regulations and best practices. The amount of digestate applied should be appropriate for the crops being grown, ensuring that nutrients are effectively absorbed by plants while minimizing the risk of runoff into nearby water sources. Additionally, the application of digestate should be carefully planned to avoid usage during heavy rainfall or when the soil is saturated with water [44]. Paradoxically, the most challenging product to utilize in a household biogas plant is biogas itself, due solely to legal restrictions, which apply only within the European Economic Area. At the EU level, a key limitation arises from Regulation (EU) 2016/426 of the European Parliament and the Council of 9 March 2016 on appliances burning gaseous fuels, which repealed Directive 2009/142/EC. This regulation applies to gas appliances intended for domestic use that are either manufactured within the EU or imported from third countries and covers all forms of supply, including distance sales. According to Article 4 of the regulation, member states must notify the European Commission and other member states of the types of gases and their corresponding supply pressures used within their territory. This means that for an appliance designed to burn a specific type of fuel to be placed on the market, the fuel itself must be officially registered. However, biogas as a fuel has not been registered by any EU member state. The exclusion of biogas from the European market for household users appears entirely unjustified, especially given that such options exist in other parts of the world, including highly developed countries such as the United States. Moreover, this restriction contradicts climate protection efforts and initiatives by national authorities, such as the Polish Ministry of Climate and Environment, which has introduced legal regulations for constructing direct biogas pipelines and local biogas networks. However, creating a legal framework for local biogas networks will not yield positive outcomes for the sector if individual consumers cannot connect to these networks due to a lack of access to appliances capable of utilizing biogas as a fuel.

5. Conclusions

The real-world tests of the zero-waste biogas plant demonstrator confirmed the feasibility of producing biogas from both kitchen waste and green waste (grass). The tests showed minor challenges in maintaining the effluent pH at an optimal level, which did not significantly hinder the process of methanogenesis. However, it was confirmed that temporary pH drops, even down to 4.0, do not permanently halt the methanogenesis process.
The real-world tests provided a basis for identifying optimization actions, including the use of wood ash as a pH stabilizer, utilizing substrates, including water at room temperature, and employing a sand layer in the fermenter to generate an anaerobic zone.
The proposed solution on an industrial scale has the potential to become economically viable by utilizing green waste, which eliminates the need to use agricultural land for biogas substrate production and reduces costs associated with green waste transportation.
It is also worth noting that in the near future, aiming for climate neutrality, the EU may introduce or increase fees related to nitrogen oxide emissions, which will make the incineration of green waste economically unfeasible. This will necessitate finding alternative ways to dispose of such waste.
The most advantageous solution for utilizing biogas produced in household biogas plants is its combustion, e.g., in a gas barbecue, as introducing biogas into a building already supplied with another gaseous fuel and burning it in an appliance connected to a shared gas installation may be prohibited due to local regulations. However, it should be remembered that, currently, the introduction of any devices powered by biogas or its derivatives (other than biomethane) into the European market is not possible due to the absence of appropriate provisions in the standard PN-EN 437:2021-09 [46].
The solution proposed in this work (the use of a consortium dedicated to producing biogas from green waste sourced from households and grass) could be a good solution in the future for biogas plants dedicated to multi-family buildings.
The technologies developed as part of this project and the experience gained will form the basis for developing industrial-scale green waste management technologies.
Currently, biogas production from green waste, especially grass, is considered unprofitable. This conclusion is primarily based on the fact that the yields (i.e., the amount of biomass) obtained from one hectare of land are several times lower compared to crops like corn, which are widely used for biogas production. Additionally, the need to first produce silage from grass makes the construction of an industrial biogas plant based on grass as a substrate unprofitable. However, the concept proposed in this work is entirely different, as the planned future solution on an industrial scale is dedicated to consumers for whom green waste management poses a significant problem. Such installations could be easily converted into systems used in office buildings, becoming an attractive solution for large institutions and enterprises that want to reduce their carbon or environmental footprint while using low-cost and nearly maintenance-free technologies. However, for such solutions to be feasible, a legal system reorganization will also be necessary regarding the use of biogas as fuel.

Author Contributions

Conceptualization, J.H.-R., P.K., M.R., and A.K.; methodology, J.H.-R., M.R., A.K., P.K., J.B., and M.J.; validation, J.H.-R., P.K., M.R., J.B., and M.J.; formal analysis, J.H.-R. and P.K.; investigation, J.H.-R., P.K., M.R., A.K., J.B., M.J., and A.K.; resources, J.H.-R., P.K., M.R., and A.K.; data curation, J.H.-R., J.B., and P.K.; writing—original draft preparation, J.H.-R., P.K., M.R., and A.K.; writing—review and editing, J.H.-R., P.K., M.R., and A.K.; visualization, J.H.-R., P.K., M.R., and A.K.; supervision, J.H.-R. and P.K.; project administration, J.H.-R. All authors have read and agreed to the published version of the manuscript.

Funding

This research received funding as part of the statutory work commissioned by the Ministry of Education and Science; order no. 0077/GE/23, archival number: DK-4100-60/23.

Data Availability Statement

The original contributions presented in this study are included in the article. Further inquiries can be directed to the corresponding authors.

Conflicts of Interest

The authors declare no conflict of interest.

References

  1. Paviĉcić, J.; Novak Mavar, K.; Brkić, V.; Simon, K. Biogas and Biomethane Production and Usage: Technology Development, Advantages and Challenges in Europe. Energies 2022, 15, 2940. [Google Scholar] [CrossRef]
  2. Piersa, P.; Unyay, H.; Szufa, S.; Lewandowska, W.; Modrzewski, R.; Ślężak, R.; Ledakowicz, S. An Extensive Review and Comparison of Modern Biomass Torrefaction Reactors vs. Biomass Pyrolysis—Part 1. Energies 2022, 15, 2227. [Google Scholar] [CrossRef]
  3. Ellacuriaga, M.; Gil, M.V.; Gómez, X. Syngas Fermentation: Cleaning of Syngas as a Critical Stage in Fermentation Performance. Fermentation 2023, 9, 898. [Google Scholar] [CrossRef]
  4. Xiong, Z.; Hussain, A.; Lee, J.; Lee, H.-S. Food waste fermentation in a leach bed reactor: Reactor performance, and microbial ecology and dynamics. Bioresour. Technol. 2019, 274, 153–161. [Google Scholar] [CrossRef]
  5. Mirmohamadsadeghi, S.; Karimi, K.; Tabatabaei, M.; Aghbashlo, M. Biogas production from food wastes: A review on recent developments and future perspectives. Bioresour. Technol. Rep. 2019, 7, 100202. [Google Scholar] [CrossRef]
  6. McCabe, B.K.; Schmidt, T. Integrated Biogas Systems Local Applications of Anaerobic Digestion Towards Integrated Sustainable Solutions; IEA Bioenergy Task 37; IEA: Paris, France, 2018; ISBN 978-1-910154-40-3. Available online: https://www.ieabioenergy.com/wp-content/uploads/2018/06/Integrated-biogas-systems_WEB.pdf (accessed on 7 November 2024).
  7. Baker, L. Types of Biogas Fermenters. J. Pet. Environ. Biotechnol. 2022, 13, 1000443. Available online: https://www.walshmedicalmedia.com/open-access/types-of-biogas-fermenters-109540.html (accessed on 7 November 2024).
  8. Singh, A.K.; Pal, P.; Rathore, S.S.; Sahoo, U.K.; Sarangi, P.K.; Prus, P.; Dziekański, P. Sustainable Utilization of Biowaste Resources for Biogas Production to Meet Rural Bioenergy Requirements. Energies 2023, 16, 5409. [Google Scholar] [CrossRef]
  9. Gallipoli, A.; Braguglia, C.M.; Gianico, A.; Montecchio, D.; Pagliaccia, P. Kitchen waste valorization through a mild-temperature pretreatment to enhance biogas production and fermentability: Kinetics study in mesophilic and thermophilic regimen. J. Environ. Sci. 2020, 89, 167–179. [Google Scholar] [CrossRef]
  10. International Energy Agency (IEA). Outlook for Biogas and Biomethane: Prospects for Organic Growth; IEA: Paris, France, 2022; Available online: https://iea.blob.core.windows.net/assets/03aeb10c-c38c-4d10-bcec-de92e9ab815f/Outlook_for_biogas_and_biomethane.pdf (accessed on 7 November 2024).
  11. Benyahya, Y.; Fail, A.; Alali, A.; Sadik, M. Recovery of Household Waste by Generation of Biogas as Energy and Compost as BioFertilizer—A Review. Processes 2022, 10, 81. [Google Scholar] [CrossRef]
  12. Brémond, U.; Bertrandias, A.; Steyer, J.-P.; Bernet, N.; Carrere, H. A vision of European biogas sector development towards 2030: Trends and challenges. J. Clean. Prod. 2021, 287, 125065. [Google Scholar] [CrossRef]
  13. Rajendran, K.; Aslanzadeh, S.; Taherzadeh, M.J. Household Biogas Digesters—A Review. Energies 2012, 5, 2911–2942. [Google Scholar] [CrossRef]
  14. Bhatia, L.; Jha, H.; Sarkar, T.; Sarangi, P.K. Food Waste Utilization for Reducing Carbon Footprints towards Sustainable and Cleaner Environment: A Review. Int. J. Environ. Res. Public Health 2023, 20, 2318. [Google Scholar] [CrossRef]
  15. Zupancic, M.; Možic, V.; Može, M.; Cimerman, F.; Golobič, I. Current Status and Review of Waste-to-Biogas Conversion for Selected European Countries and Worldwide. Sustainability 2022, 14, 1823. [Google Scholar] [CrossRef]
  16. GUS. GUS—Bank Danych Lokalnych. 2023. Available online: https://bdl.stat.gov.pl/bdl/dane/podgrup/temat (accessed on 14 November 2024).
  17. Emmanuel, J.K.; Juma, M.J.; Mlozi, S.H. Biogas generation from food waste through anaerobic digestion technology with emphasis on enhancing circular economy in Sub-Saharan Africa—A review. Energy Rep. 2024, 12, 3207–3217. [Google Scholar] [CrossRef]
  18. Xu, F.; Li, Y.; Ge, X.; Yang, L.; Li, Y. Anaerobic digestion of food waste—Challenges and opportunities. Bioresour. Technol. 2018, 247, 1047–1058. [Google Scholar] [CrossRef]
  19. Bedoić, R.; Čuček, L.; Ćosić, B.; Krajnc, D.; Smoljanić, G.; Kravanja, Z.; Ljubas, D.; Pukšec, T.; Duić, N. Green biomass to biogas—A study on anaerobic digestion of residue grass. J. Clean. Prod. 2019, 213, 700–709. [Google Scholar] [CrossRef]
  20. Ram, N.R.; Nikhil, G.N. Assessment of microbial consortiums and their metabolic patterns during the bioconversion of food waste. Biomass Convers. Biorefin. 2023. [Google Scholar] [CrossRef]
  21. Gilmore, S.P.; Lankiewicz, T.S.; Wilken, S.T.; Brown, J.L.; Sexton, J.A.; Henske, J.K.; Theodorou, M.K.; Valentine, D.L.; O’Malley, M.A. Top-down enrichment guides in formation of synthetic microbial consortia for biomass degradation. ACS Synth. Biol. 2019, 8, 2174–2185. [Google Scholar] [CrossRef] [PubMed]
  22. Ragsdale, S.W.; Pierce, E. Acetogenesis and the Wood–Ljungdahl pathway of CO2 fixation. Biochim. Biophys. Acta Proteins Proteom. 2008, 1784, 1873–1898. [Google Scholar] [CrossRef]
  23. Janiga, M.; Kapusta, P.; Kania, M.; Szubert, A. Microbiological coal biogasification under laboratory conditions—Biogas quantity and quality. Nafta-Gaz 2018, 74, 648–654. [Google Scholar] [CrossRef]
  24. Szubert, A.; Kapusta, P.; Matyasik, I. Parameters and methods for evaluation of lignite processing method into biogas. Physicochem. Probl. Miner. Process. 2020, 56, 396–405. [Google Scholar] [CrossRef]
  25. Atlas, R.M. Handbook of Microbiological Media, 3rd ed.; CRC Press: Boca Raton, FL, USA, 2004. [Google Scholar] [CrossRef]
  26. Brzeszcz, J.; Skalski, T.; Jankowski, L.; Kapusta, P. How do microbial communities deal with chronic hydrocarbon presence in oil seep soils? Data from historical hand-dug oil wells. Land Degrad. Dev. 2023, 34, 1283–1296. [Google Scholar] [CrossRef]
  27. Stahl, D.A.; Amann, R. Development and application of nucleic acid probes. In Nucleic Acid Techniques in Bacterial Systematics; Stackebrandt, E., Goodfellow, M., Eds.; John Wiley & Sons: London, UK, 1991; Volume 8, pp. 207–248. [Google Scholar]
  28. Boetius, A.; Ravenschlag, K.; Schubert, C.; Rickert, D.; Widdel, F.; Gieseke, A.; Amann, R.; Jørgensen, B.; Witte, U.; Pfannkuche, O. A marine microbial consortium apparently mediating anaerobic oxidation of methane. Nature 2000, 407, 623–626. [Google Scholar] [CrossRef]
  29. Díaz, E.; Amils, R.; Sanz, J.L. Molecular ecology of anaerobic granular sludge grown at different conditions. Water Sci. Technol. 2003, 48, 57–64. [Google Scholar] [CrossRef] [PubMed]
  30. Brzeszcz, J.; Steliga, T.; Kapusta, P.; Turkiewicz, A.; Kaszycki, P. r-strategist versus K-strategist for the application in bioremediation of hydrocarbon-contaminated soils. Int. Biodeter. Biodegr. 2016, 106, 41–52. [Google Scholar] [CrossRef]
  31. Kania, M.; Janiga, M. Elements of analytical method validation for determination of hydrocarbon compounds, N2, O2, CO and CO2 in the gas mixture by dual-channel, valve gas chromatograph AGILENT 7890A. Nafta-Gaz 2011, 67, 812–824. Available online: https://www.inig.pl/magazyn/nafta-gaz/NAFTA-GAZ-2011-11-05.pdf (accessed on 1 September 2024).
  32. PN-EN ISO 23590:2022-05; Wymagania dla Domowego Systemu Biogazowego: Projektowanie, Instalowanie, Eksploatacja, Konserwacja i Bezpieczeństwo. ISO: Geneva, Switzerland, 2022.
  33. ISO 23590:2020; Household Biogas System Requirements: Design, Installation, Operation, Maintenance and Safety. ISO: Geneva, Switzerland, 2020.
  34. IMGiW. Available online: https://www.imgw.pl/badania-nauka/klimat (accessed on 27 September 2023).
  35. Megastyro. 2020. Available online: https://megastyro.pl/pl/wspolczynnik-przewodzenia-ciepla-czyli-jaki-styropian-kupic/ (accessed on 7 November 2024).
  36. Flexipower Group. 2023. Available online: https://flexipowergroup.pl/sprawnosc-ogniw-fotowoltaicznych-zima-jaka-jest/ (accessed on 7 November 2024).
  37. Weatheronline 2023. Available online: https://www.weatheronline.pl/weather/maps/city?FMM=1&FYY=2020&LMM=12&LYY=2023&WMO=12375&CONT=plpl&REGION=0001&LAND=PL&ART=SOS&R=0&NOREGION=0&LEVEL=162&LANG=pl&MOD=tab (accessed on 31 December 2023).
  38. Batstone, D.J.; Keller, J.; Angelidaki, I.; Kalyuzhnyi, S.V.; Pavlostathis, S.G.; Rozzi, A.; Vavilin, V.A. The IWA Anaerobic Digestion Model No 1 (ADM1). Water Sci. Technol. A J. Int. Assoc. Water Pollut. Res. 2002, 45, 65–73. [Google Scholar] [CrossRef]
  39. Jabłoński, S.; Vogt, A.; Kułażyński, M.; Łukaszewicz, M. Monitoring i Sterowanie Procesem Technologicznym Biogazowni; Politechnika Wrocławska: Wrocław, Poland, 2014; ISBN 978-83-63503-29-1. [Google Scholar]
  40. Sadecka, Z.; Myszograj, S.; Suchowska-Kisielewicz, M.; Sieciechowicz, A. Zeszyty Naukowe; Inżynieria Środowiska/Uniwersytet Zielonogórski: Zielona Góra, Poland, 2013; nr 150 (30) str. 3—33. [Google Scholar]
  41. Horta, C.; Carneiro, J.P. Use of Digestate as Organic Amendment and Source of Nitrogen to Vegetable Crops. Appl. Sci. 2022, 12, 248. [Google Scholar] [CrossRef]
  42. Mucha, A.P.; Dragisa, S.; Dror, I.; Garuti, M.; van Hullebusch, E.D.; Repinc, S.K.; Muňoz, J.; Rodriguez-Perez, S.; Stres, B.; Usťak, S.C.; et al. Re-use of digestate and recovery techniques. In Trace Elements in Anaerobic Biotechnologies; IWA Publishing: London, UK, 2019. [Google Scholar] [CrossRef]
  43. Plana, P.V.; Noche, B. A review of the current digestate distribution models: Storage and transport. WIT Trans. Ecol. Environ. 2016, 202, 345–357. [Google Scholar] [CrossRef]
  44. Witorożec-Piechnik, A.; Kopiński, J.; Markowska-Strzemska, E.; Woźniak, M. Environmental safety aspects of using the digestate from an agricultural biogas plant. Pol. J. Agron. 2023, 52, 54–61. [Google Scholar] [CrossRef]
  45. Abanades, S.; Abbaspour, H.; Ahmadi, A. A critical review of biogas production and usage with legislations framework across the globe. Int. J. Environ. Sci. Technol. 2022, 19, 3377–3400. [Google Scholar] [CrossRef] [PubMed]
  46. PN-EN 437:2021-09; Test Gases—Test Pressures—Appliance Categories. Comite Europeen de Normalisation: Brussels, Belgium, 2021.
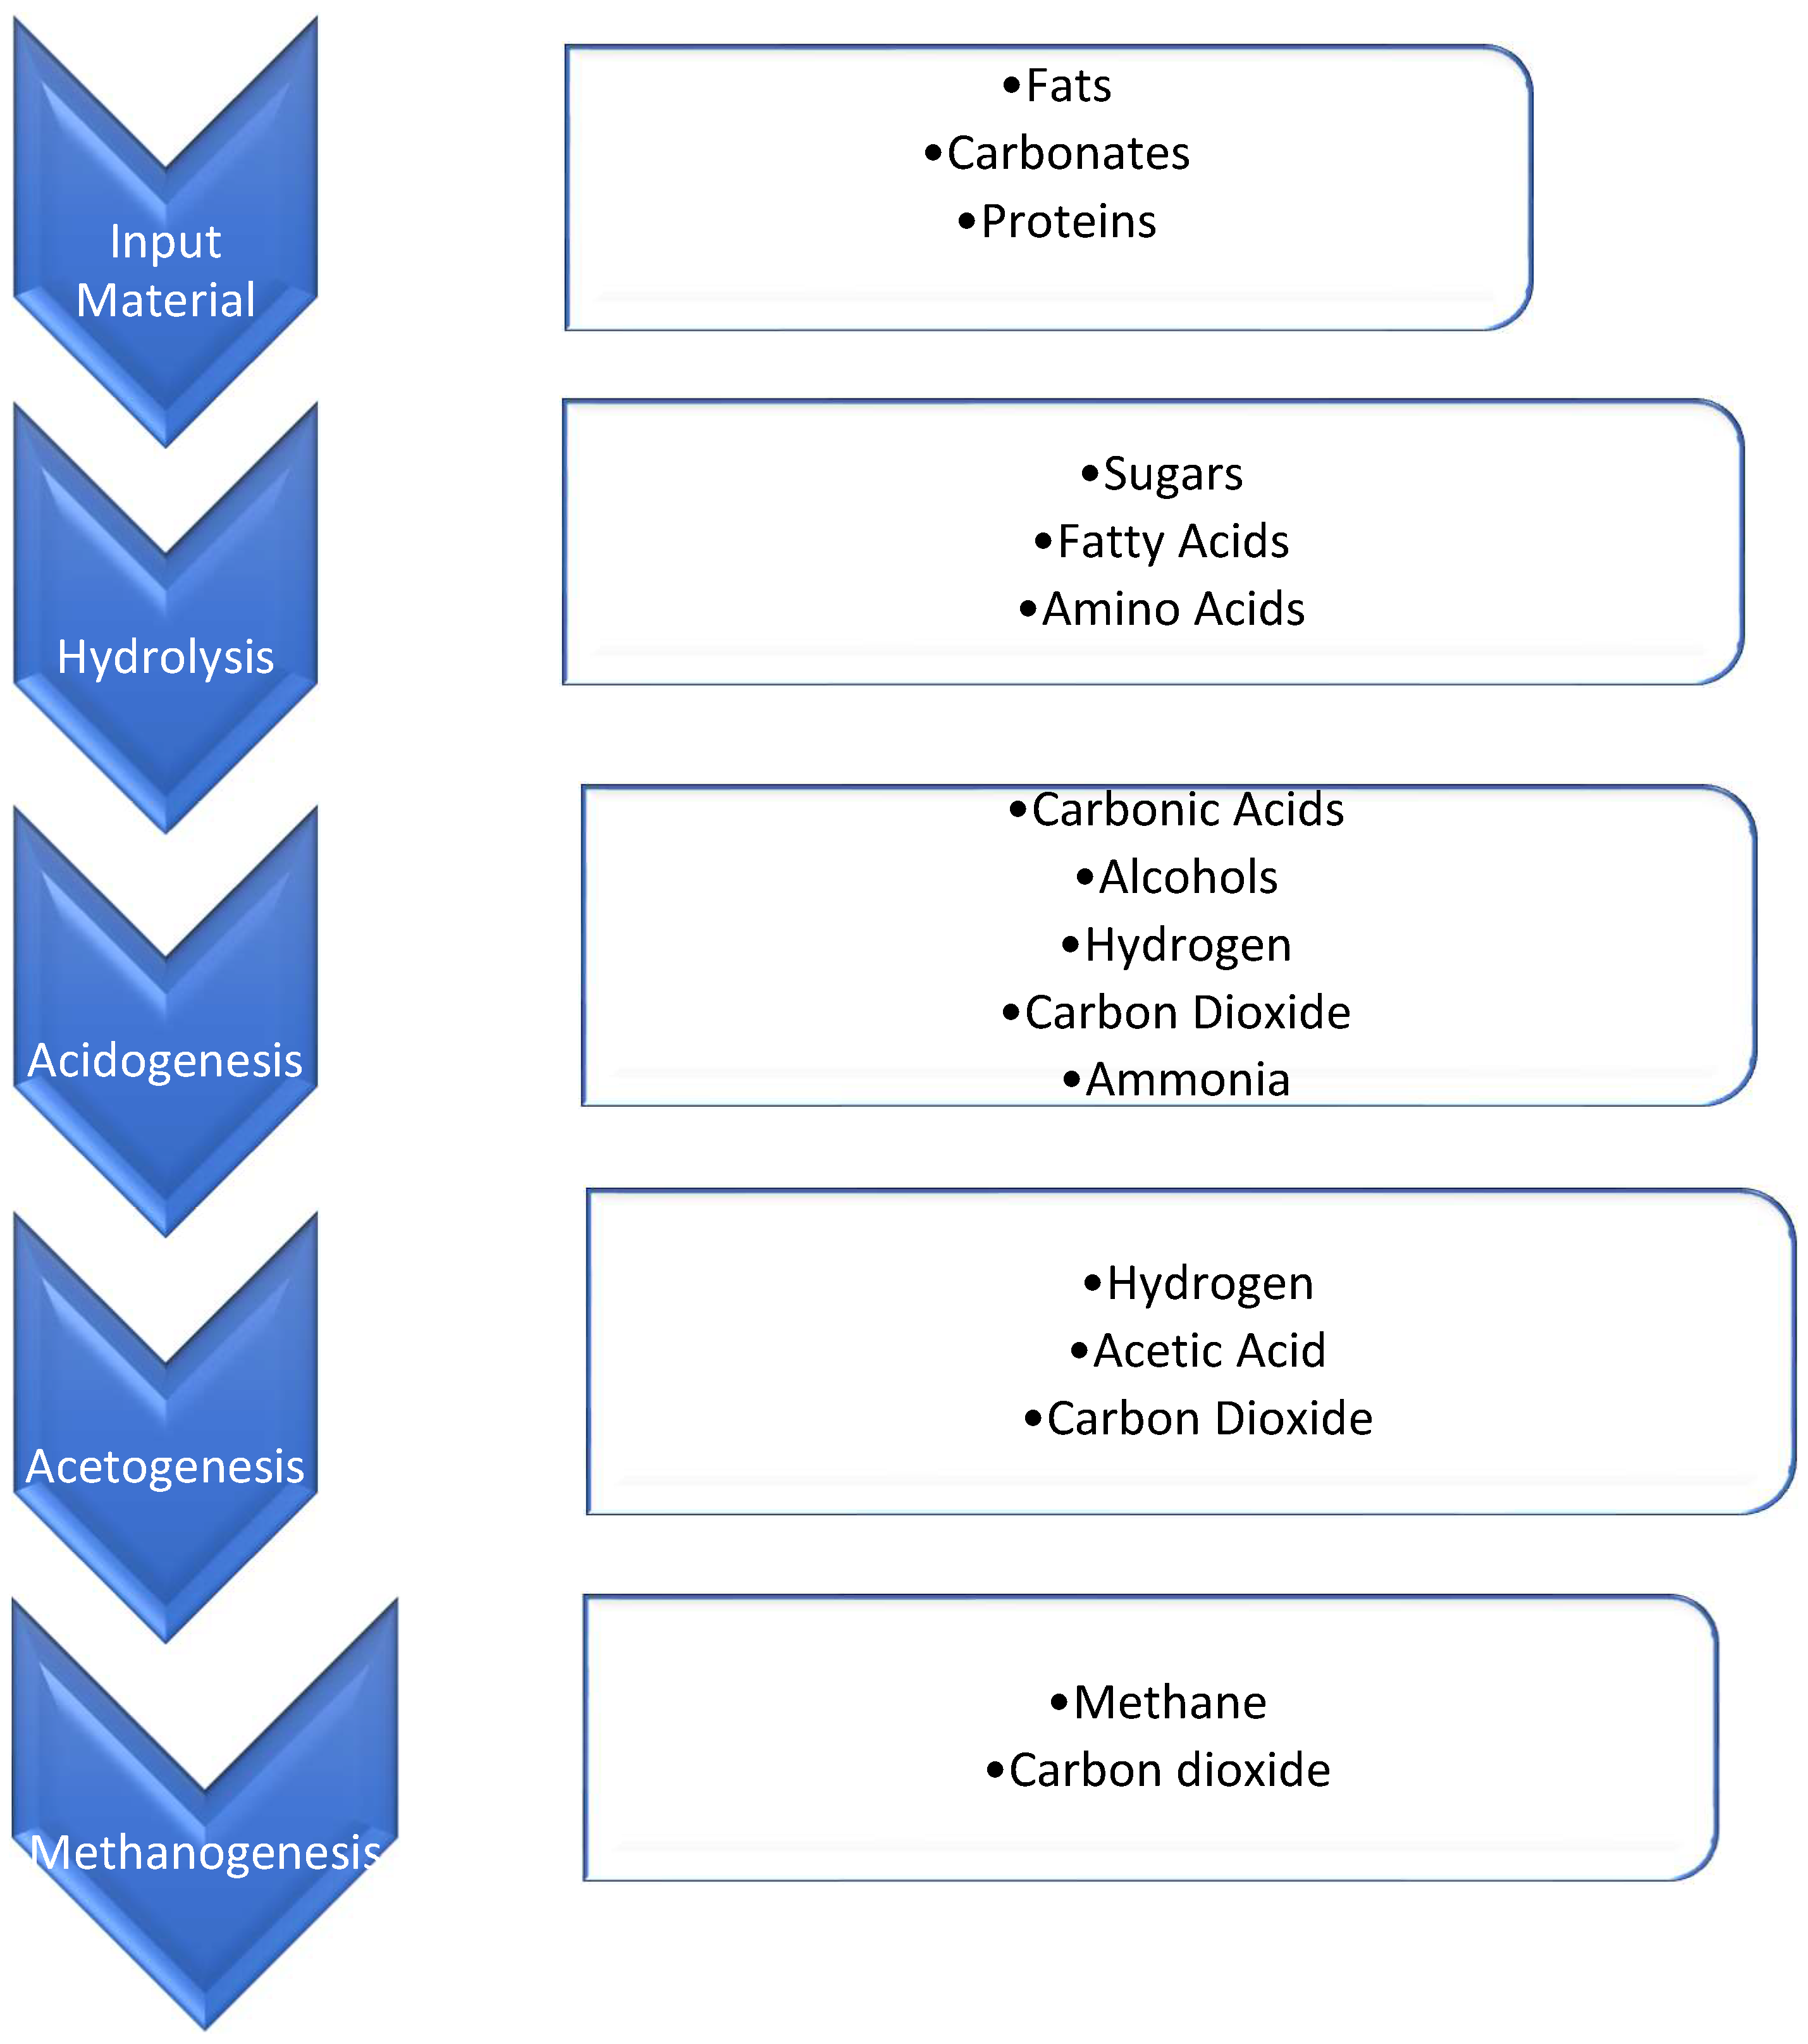
Figure 1. Anaerobic digestion process phases [1,8].
Energies 18 01745 g001
Figure 2. Mixed household waste (a) and grass waste (b) used as a substrate for biogas production in a reactor.
Energies 18 01745 g002
Figure 3. The operating biogas plant (Reactor 1 and Reactor 2).
Energies 18 01745 g003
Figure 4. Distribution of average temperatures in individual months of 2022 [34].
Energies 18 01745 g004
Figure 5. Diagram of the system that stabilizes the temperature inside the fermenter.
Energies 18 01745 g005
Figure 6. Average monthly number of sunshine hours in Poland between 2020 and 2023 [37].
Energies 18 01745 g006
Figure 7. Comparison of the content of individual groups of substances included in waste used as the reactor substrate (mixed waste and grass).
Energies 18 01745 g007
Figure 8. Comparison of the content of the different substance groups contained in the waste used as reactor substrate (mixed waste and grass) in relation to the % dry matter content of the waste.
Energies 18 01745 g008
Figure 9. Share of individual components of the substrate for biogas production in the total methane production.
Energies 18 01745 g009
Figure 10. Changes in leachate pH and methane content in biogas during Experiment 1.
Energies 18 01745 g010
Figure 11. Changes in leachate pH and the content of carbon dioxide and oxygen in biogas during Experiment 1.
Energies 18 01745 g011
Figure 12. Changes in leachate pH and the content of hydrogen sulfide and ammonia in biogas during Experiment 1.
Energies 18 01745 g012
Figure 13. Changes in leachate pH and methane content in biogas during Experiment 2.
Energies 18 01745 g013
Figure 14. Changes in carbon dioxide and oxygen content in biogas during Experiment 2.
Energies 18 01745 g014
Figure 15. Changes in hydrogen sulfide and ammonia content in biogas during Experiment 2.
Energies 18 01745 g015
Figure 16. Rate of methane concentration increase in gas over the course of the experiments.
Energies 18 01745 g016
Table 1. The main reactions occurring in the various phases of the anaerobic digestion process [22].
Process StageChemical Reactions
Hydrolysis(C6H10O5)n + nH2O → nC6H12O6 + nH2(1)
AcidogenesisC6H12O6 ↔ 2CH3CH2OH + 2CO2(2)
C6H12O6 + 2H2 → 2CH3CH2COOH + 2H2O(3)
C6H12O6 → 3CH3COOH (4)
AcetogenesisCH3CH2COO + 3H2O ↔ CH3COO + H+HCO3 + 3H2(5)
C6H12O6 + 2H2O → 2CH3COOH + 2CO2 + H2(6)
CH3CH2OH + 2H2O → CH3COO + 3H2 + H+
2CO2 + 4H2 → CH3COOH + 2H2O
(7)
MethanogenesisCH3COOH → CH4 + CO2(8)
CO2 + 4H2 → CH4 + 2H2O(9)
2CH3CH2OH + CO2 → CH4 + 2CH3COOH(10)
Table 2. Summary of research methods applied for the analysis of substrate samples used for biogas production.
Studied ParameterResearch Method
Crude fiberPN ISO 5498:1996
AOAC Official method 962.09
Neutral detergent fiber (NDF fraction)ISO 16472:2006
Application note C.Gerhardt
Acid detergent fiber (ADF fraction)PN ISO 13906:2009
AOAC Official method 973.18,
Application note C.Gerhardt
Acid detergent lignin (ADL fraction)PN ISO 13906:2009
AOAC Official method 973.18,
Application note C.Gerhardt
FatPN-EN ISO 11085:2015-10
Commission Regulation (EC) No. 152/2009 of 27 January 2009, Annex III, point H (Official Journal L 54 of 26 February 2009) excluding sampling
Saturated fatty acids (SFAs)
Monounsaturated fatty acids (MUFAs)
Polyunsaturated fatty acids (PUFAs)
Trans fatty acids (TFAs)
Omega-3 fatty acids
Omega-6 fatty acids
Gas chromatography with flame ionization detector (GC/FID),
according to PN-EN ISO 12966-1:2015 + AC:2015-06,
PN-EN ISO 12966-2:2017-05, point 5.2
PN-EN ISO 12966-4:2015-07
IB-17 Edition 4 of 10.03.2021
IB-05 Edition 6 of 12.05.2021
Sum/contents of individual acids from calculations
NitrogenTitration according to Kjeldahl, in accordance with Commission Regulation (EC) No. 152/2009 of 27 January 2009, Annex III, point C (Official Journal L 54 of 26 February 2009) excluding sampling
Crude protein content from calculations.
(conversion factor 6.25)
Protein
WaterCommission Regulation (EC) No. 152/2009 of 27 January 2009, Annex III, point A (Official Journal L 54 of 26 February 2009) excluding sampling
Dry matter
Total ashCommission Regulation (EC) No. 152/2009 of 27 January 2009, Annex III, point M (Official Journal L 54 of 26 February 2009) excluding sampling
Total carbohydratesFrom calculations, based on test results presented in this report, in accordance with IB-08, edition 3 (6 February 2014)
Total sugarsTitration according to Luff-Schoorl, in accordance with PN-R-64784:1994
Sodium chlorideTitration method according to Mohra, in accordance with PN-A-82100:1985
All analyses were conducted at the Nuscana Laboratory.
Table 3. Conditions for the biogas production process in both constructed biogas plants.
Key Parameters Reactor 1 Reactor 2
Experiment duration (days)214131
Volume of reactor (dm3)200200
Type of substrateMixed wasteGrass
Amount of substrate (kg)20 + 10.858
(dm3)70 + 10095
Consortium volume (dm3)2 Leachate from Reactor 1: 16; fresh consortium: 2
pH of the effluentBetween 4 and 7.4Between 5.3 and 7.5
Effluent temperature (°C)Between 15.8 and 27.4Between 19.5 and 27.4
Use of sand during process startNoYes, 20 kg
Table 4. Chemical composition of biogas obtained at various temperatures (% v).
Chemical CompositionGrass, 4 °C
(150 Days)
Grass, 30 °C
(40 Days)
Grass, 40 °C
(150 Days)
C149.129752.27529.15597
C20.000150.000370.00078
CO24.2888038.78108.43944
N239.58898.7120272.4916
O26.992170.231279.91216
H2<LQ<LQ<LQ
H2S<LQ<LQ<LQ
Methanethiol<LQ<LQ<LQ
Ethanethiol<LQ<LQ<LQ
Dimethyl sulfite<LQ0.000010.00077
Propane-2-thiol<LQ<LQ<LQ
Propane-1-thiol<LQ<LQ<LQ
Butane-2-thiol<LQ<LQ<LQ
Butane-1-thiol<LQ<LQ<LQ
Table 5. List of formulas used to calculate the content of individual fractions in the substrate [38,39].
Compound% Dry Matter
  ProteinRP/DW·100%
  LipidsRL/DW·100%
  Cellulose(ADF-ADL)/DW·100%
  LigninADL/DW·100%
  Hemicellulose(NDF-ADF)/DW·100%
  Starch(RF + NfE-NDF)/DW·100%
  DW—dry matter
  RP—crude protein
  RL—crude lipids
  RF—crude fiber
  NDF—neutral detergent fiber
  ADF—acid detergent fiber
  ADL—acid detergent lignin
  NfE—nitrogen-free extract (NfE = DW – RL – RP − RF)
Table 6. Amount and composition of biogas produced during the decomposition of various substrates [40].
CompoundBiogas Yield Per kg of Dry Matter (dm3) Methane Content in the Biogas (%) Biogas Yield Converted to 100% Methane (dm3)
Carbohydrates83050415
Proteins101852529
Fats142570998
Table 7. Chemical composition of biogas obtained in laboratory conditions (% v).
Chemical CompositionBiogas, Grass, V Analysis, 290 cm3 (47 Days
or the 30th Day)
Biogas, Grass, VI Analysis, 430 cm3 60 DaysBiogas, Grass, VII Analysis, 265 cm3 77 DaysBiogas, Grass, VIII Analysis, 330 cm3 90 DaysBiogas, Grass, IX Analysis, 170 cm3 107 Days
C140.579656.335857.311967.150368.8743
C20.001050.000670.000470.00023<LQ
CO239.190137.775735.916830.652429.4282
N216.51145.574026.653722.031751.49825
O23.557560.160300.098210.162410.19894
H20.024050.019730.00411<LQ<LQ
H2S0.135250.133690.014630.002840.00022
Methanethiol0.000500.00002<LQ<LQ<LQ
Ethanethiol<LQ<LQ<LQ<LQ<LQ
Dimethyl sulfite0.00042<LQ<LQ<LQ<LQ
Propane-2-thiol<LQ<LQ<LQ<LQ<LQ
Propane-1-thiol<LQ<LQ<LQ<LQ<LQ
Butane-2-thiol<LQ<LQ<LQ<LQ<LQ
Butane-1-thiol<LQ<LQ<LQ<LQ<LQ
Disclaimer/Publisher’s Note: The statements, opinions and data contained in all publications are solely those of the individual author(s) and contributor(s) and not of MDPI and/or the editor(s). MDPI and/or the editor(s) disclaim responsibility for any injury to people or property resulting from any ideas, methods, instructions or products referred to in the content.

