Article

Heat Convection in a Channel-Opened Cavity with Two Heated Sources and Baffle

by
Farhan Lafta Rashid
1,
Asseel M. Rasheed Al-Gaheeshi
2,
Hayder I. Mohammed
3 and
Arman Ameen
4,*
1
Petroleum Engineering Department, College of Engineering, University of Kerbala, Karbala 56001, Iraq
2
Electrical and Electronic Engineering Department, College of Engineering, University of Kerbala, Karbala 56001, Iraq
3
Department of Cooling and Air Conditioning Engineering, Imam Ja’afar Al-Sadiq University, Baghdad 10053, Iraq
4
Department of Building Engineering, Energy Systems and Sustainability Science, University of Gävle, 801 76 Gävle, Sweden
*
Author to whom correspondence should be addressed.
Energies 2024, 17(5), 1209; https://doi.org/10.3390/en17051209
Submission received: 27 January 2024 / Revised: 16 February 2024 / Accepted: 28 February 2024 / Published: 3 March 2024
(This article belongs to the Special Issue New Challenges in Heat Transfer Enhancement)

Abstract

:
This study employs COMSOL software v 5.6 to investigate a novel approach to heat transfer via mixed convection in an open hollow structure with an unheated 90° baffle elbow. Two 20 W heat sources are strategically positioned on the cavity’s bottom and right-angled wall for this research. Notably, the orientation of the baffle perpendicular to the airflow is used to direct external, unrestricted flow into the square cavity. The research investigates a range of air velocities (0.1, 0.5, 1.0, and 1.5 m/s) and the intricate interaction between input air velocity, dual heated sources, and the presence of a right-angle baffle on critical thermodynamic variables, such as temperature distribution, isotherms, pressure variation, velocity profile, air density, and both local and mean Nusselt numbers. Validation of the applicable computational method is achieved by comparing it to two previous studies. Significant findings from numerical simulations indicate that the highest velocity profile is in the centre of the channel (2.3–2.68 m/s at an inflow velocity of 1.5 m/s), while the lowest profile is observed along the channel wall, with a notable disruption near the inlet caused by increased shear forces. The cavity neck temperature ranges from 380 to 640 K, with inflow air velocities varying from 0.1 to 1.5 m/s (Re is 812 to 12,182), respectively. In addition, the pressure fluctuates at the channel-cavity junction, decreasing steadily along the channel length and reaching a maximum at the intake, where the cavity neck pressure varies from 0.01 to 2.5 Pa with inflow air velocities changing from 0.1 to 1.5 m/s, respectively. The mean Nusselt number exhibits an upward trend as air velocity upon entry increases. The mean Nusselt number reaches up to 1500 when the entry air velocity reaches 1.5 m/s. Due to recirculation patterns, the presence of the 90° unheated baffle produces a remarkable cooling effect. The study establishes a direct correlation between input air velocity and internal temperature distribution, indicating that as air velocity increases, heat dissipation improves. This research advances our understanding of convective heat transfer phenomena in complex geometries and provides insights for optimising thermal management strategies for a variety of engineering applications.

1. Introduction

Numerous research investigations have shown interest in heat transfer by mixed convection over backward-facing steps [1,2,3]. Because heat transfer has so many industrial applications, scientists have always been fascinated by it. Therefore, researchers are constantly incentivized to develop novel techniques for improving heat transmission [4,5,6]. The backward-facing step was first presented in the late 1950s as a suitable shape to speed up heat transfer owing to flow separation and recombination processes brought on by rapid growth [7,8,9,10]. To better understand and expose more benefits of the backward-forward step using diverse limits, ribs, grooves, and baffles while employing design in upward, slope, and parallel scenarios [11,12], numerous numerical and experimental works on internal detached flow have been shown over the past decades.
Traditional cooling techniques like natural convection have been restricted by the demand for efficient cooling in the electronics sector [13,14]. One of the key reasons is that the size of electronic devices is steadily decreasing daily. Mixed convection, which combines forced and natural convection, has become more common and will continue to do so. Mixed convection is used in various industries, including nuclear, solar, and bio-medical ones, and in the electronics sector [15]. As a result, research into mixed convective flow is crucial, and modern efforts have shifted away from relying only on this kind of flow and towards exploring other methods for improving heat transmission within it. In electrical devices, heaters are often laid flat or protrude from channels. The available research on flush-mounted heating units in ducts with free and forced thermal convection has been analysed by [16]. A fixed thermal flux heating unit was enclosed in a cube-shaped container on the left straight wall [17], with an exit on the opposite wall and an entrance on the upper side. A separating conducting baffle was constructed into either the top or bottom wall. Ref. [18] studied the free and forced thermal convection issue using a square heat-conducting body within the enclosure rather than a barrier on the wall, using the same geometry and wall temperature circumstances as [17].
To improve the mixing efficiency of a micro-mixer, ref. [19] designed three baffles. The impacts of the baffle elevation and Reynolds numbers (Re) on mixing efficiency were investigated. Using a middle heater at the intake on the bottom left side and an exterior section on the top right side, ref. [20] conducted numerical experiments on a vented cavity. In this example, we analysed how installing a baffle modified the rate at which heat spread. The thermal exchange was increased by 50% compared to the case of a baffleless system, and the best location for the baffle was either the bottom, left, right, or top. However, ref. [21] performed a similar quantitative investigation of a vented cavity in which three isothermally warmed baffles were positioned consecutively on the left and right sides. Ref. [22] examined a horizontal channel design in which diamond-shaped baffles were staggered along the bottom and top surfaces. Computational and experimental research on Z-formed baffles in a turbulent environment was achieved by [23].
To simulate the naturally occurring thermal exchange in a U-shaped cavity containing a nanofluid of water-Fe3O4 in the presence of a magnetic field and two baffles, [24] used the computational software Comsol Multiphysics. The Galerkin finite element technique is employed to explain the dimensionless governing equations, which include the formulation for velocity, pressure, and temperature. The findings are reviewed based on the governing variables, including the nanoparticle volume percentage, Rayleigh and Hartmann numbers, magnetic field angle, and nanoparticle morphologies. Consequently, although raising the Hartmann number (Ha) caused the Nu to decline, raising the Rayleigh numbers and Aspect Ratio (AR) improved the heat transmission process and the average Nusselt numbers. It was also concluded that AR = 0.4 had the highest Nusselt values among the investigated aspect ratios.
Ref. [25] investigated the phenomenon of unstable mixed convection brought about by the interaction of fluid flow with elastic (deformable) walls in a cavity-channel configuration. Even though the assembly’s other walls provide thermal insulation, a steady, independent heat source is at the hollow’s base. The top of the hollow is permeable, allowing channel flow to enter. The governing equations for the fluid-elastic wall interaction are solved utilizing Finite Element and the Arbitrary Lagrangian-Eulerian method (ALE). In this study, we examine the influence of the inertia of the elasticity modulus and the buoyancy-to-viscosity ratio across a broad range of the Cauchy, Richardson, and Reynolds numbers. It has been shown that the thermal exchange rate in a hollow increases by 17% when elastic walls are present instead of stiff ones.
Ref. [26] used nanofluids to quantitatively study free and forced thermal convection through a sloped slotted baffle on a 2-dimensional backward-facing step. The continuity, momentum, and energy equations may be solved utilizing the FVM by establishing a connection between the pressure and velocity fields. From 50 to 400, different Reynolds numbers were used. Additionally, a consistent heat flux of 10,000 W/m2 was applied to the downstream wall of the step from 10 ≤ X ≤ 15, while the top wall and baffle were preserved in insulation. Al2O3, ZnO, CuO, and SiO2 nanoparticles, as well as nanoparticle sizes ranging from 20 to 50 nm, were investigated to find the optimal nanofluid for maximizing heat transfer. The first fluid was water. Increasing the Reynolds number showed little to no effect on the skin friction or pressure variation for the sloped baffle at D = 0.5, demonstrating its suitability.
A numerical examination is performed to examine the thermal convection in a channel cavity that contains an adiabatic baffle, according to [27]. Two distinct forms of heating are imposed at the bottom of the channel cavity. The tube-remaining cavity’s sections are adiabatic. The finite difference technique is utilized to solve the governing formulas for various groupings of pertinent constraints. The averaged Nusselt number, drag force, and bulk temperature are also computed. It has been revealed that raising the baffle’s length causes the average energy conveyance to increase. Additionally, it has been shown that sinusoidal heating offers greater thermal efficiency than regular heating.
Ref. [28] studied fluid-construction relations and convection thermal exchange in an open trapezoidal hollow tube. Laminar flow testing is performed on a non-Newtonian (power law) liquid. All other walls provide insulation, but the isothermal hot hollow bottom wall is a temporary heat source. A flexible baffle extends into the channel from the top wall. The adaptable baffle at the highest part of the wall is shifted. With the baffle in place, we can analyse the Richardson number (Ri, which equals 0.01 to 100) and the power law index (n, from 0.5 to 1.5). An arbitrary Lagrangian-Eulerian (ALE) finite element technique was used to find a solution to the issue.
A square section hollowed out from the sides and the lower part of the walls and a vertically unheated baffle were the subject of computational and experimental research by [29]. The 2-D model was analysed utilizing the in-house CFD commercial package, ANSYS FLUENT. Wall temperature profiles and heated wall Nusselt values are shown. The baffle improved heat transmission by 35%, with the correct heater and baffle angle of 90° yielding the best results. Numerical flow visualization shows temperature boundary layers and vortices.
Da Silva et al. [30] used the Finite Volume Method to study the free convection in trapezoidal chambers with a couple of interior baffles, an insulated floor, a sloped top surface, and a heated isothermal side and the opposite side cooled vertical walls. A broad variety of Ra values (103–106), Hb heights (Hb = H/3, 2H/3, and H*), Pr (0.7, 10, and 130), and top angles (θ) from 10 to 20 were studied using parametric methods. Numerical findings indicated that increasing baffle height reduces heat transmission while Ra is fixed. The average Nusselt increased slightly with a tilt angle, while the whole thermal exchange surged dramatically with rising Ra values for a given baffle height. Also, fluid flow and heat transfer in complex geometries, exploring various parameters’ effects, and Nu evaluation for practical applications have been numerically studied by Mohammed with different groups [31,32,33].
A literature review on the effect of different air velocities on heat convection in a channel-opened cavity can provide valuable insights into the behaviour of heat transfer in different practical scenarios. The search results provide several studies that investigate the effect of air velocity on heat transfer in different contexts, such as natural convection in an air channel with a cavity [34], heat transfer in a rectangular tube [35], and plate-fin heat sinks under forced air convection [36]. Other studies explore the effect of air velocity on heat transfer in cyclone heat exchangers [37], the throughflow effect on local and large-scale penetrative convection [38], and convection air currents around a hot cylinder inside a triangular cavity [39].
The chosen range of velocities allows for a comprehensive analysis of the system’s response to airflow. Lower velocities (0.1 m/s) represent typical airflow rates under natural convection conditions, while higher velocities (1.0 and 1.5 m/s) simulate scenarios with forced convection, such as when the cavity is subjected to forced air cooling or ventilation [40,41,42].
This paper introduces a novelty investigation utilizing COMSOL software v 5.6 to simulate convective thermal transport within a 90° tube featuring dual heat sources. The primary aim is to elucidate the complex dynamics of heat transfer within this configuration. By exploring a wide array of variables such as isotherms, temperatures, velocities, pressures, local and mean Nusselt numbers (Nu), and densities, while considering the influence of two heat sources and a right-angle baffle, this study breaks new ground in our understanding of convective heat transfer phenomena in intricate geometries. Through meticulous analysis of the interactions between these factors, the research significantly advances our knowledge in this field. Consequently, the findings contribute to the development of optimized design strategies and enhance our overall understanding of convective heat transfer mechanisms. Such insights have far-reaching implications for engineering and thermal applications, offering opportunities to improve efficiency and performance across various domains. Following the introduction of the relevant literature, the mathematical and numerical procedures are elucidated, followed by the validation of the computational code. Subsequently, the obtained results are presented and discussed, ensuring a logical and systematic progression from theoretical foundations to empirical insights.

2. Motivation and Applications

The major problem that this manuscript solves is elucidating the intricate dynamics of convective thermal transport within a complex geometry, specifically a 90° tube with dual heat sources and a right-angle baffle. The study comprehensively examines heat transport phenomena in these configurations by utilising advanced modelling tools and doing rigorous analysis of numerous variables, including isotherms, temperatures, velocities, pressures, and Nusselt numbers. This contributes to optimising design techniques and boosting the efficiency and performance of engineering and thermal systems.
The motivation behind this work is to explore convective thermal transport in complex systems with multiple heat sources and intricate flow dynamics. The study seeks to reveal the interaction between several characteristics, such as temperatures, velocities, and pressures, by employing advanced modelling tools. Comprehending this knowledge is crucial for enhancing the design and efficiency of thermal systems in various engineering fields, including industrial processes, renewable energy, and aerospace engineering. The ultimate goal is to enhance effectiveness and sustainability.
The major area of application for this work encompasses thermal engineering and heat transfer applications, where insights into convective thermal transport within complex geometry hold significant relevance. The study’s findings can provide valuable insights for the design and optimisation of heat exchangers in industrial processes and HVAC systems. Additionally, they can contribute to the improvement of cooling solutions for electronics, enhance energy conversion efficiency in renewable energy systems such as solar thermal, assist in thermal management for aerospace and automotive engineering applications, and optimise heating, ventilation, and air conditioning (HVAC) systems in buildings. This research enhances efficiency and performance in various engineering fields by gaining a more comprehensive understanding of convective heat transfer dynamics. As a result, it tackles important issues related to energy utilisation, system reliability, and environmental sustainability.

3. Mathematical Modelling

The geometry and coordinate system explored in this research are shown in Figure 1. It is a horizontally oriented, two-dimensional room with an open floor plan. The cavity is 7 cm high and 1 cm wide at the top and bottom. A 1-cm-thick, 2-cm-tall, and 4-cm-long unheated elbow baffle with a 90-degree bend is positioned at the end of the top cavity opening. The diameter of the waterway is 0.12 m. The length of the duct anticipated to continue outside the hole is 0.6 m. One thermal energy source is built into the enclosure’s base, while the other is mounted on the slanted right wall. Both have a radius of 2 cm. The output power is fixed at 20 W per unit. The horizontal channel receives airflow at the ambient temperature (20 °C). Table 1 contains the essential case study variables. The remaining solid walls provide thermal insulation. The flow is laminar; the fluid is incompressible and non-Newtonian. According to Boussinesq’s theory, only fluid density was supposed to fluctuate with fluid temperature; all other parameters were considered constant.

3.1. Governing Equations

In this study, the ALE method is utilized to define the dimensionless stable two-dimensional governing formulas of continuity, momentum, and temperature for the power-law fluid [43,44,45,46]:
U X + V Y = 0
The following equations explain the momentum conservation concept in the horizontal direction:
U U X + V U Y = P X + 1 R e i n 2 U X 2 + 2 U Y 2
Therefore, for the Y-direction:
U V X + V V Y = P Y + 1 R e i n 2 V X 2 + 2 V Y 2 + R i θ
The expression for energy conservation is:
U θ X + V θ Y = 1 R e i n P r 2 θ X 2 + 2 θ Y 2 + Q
where Q represents the constant heat source term. The Reynolds number can be calculated from:
R e i n = ρ u i n H μ
and H (m) is the length of the container.
The Richardson Number can be calculated with:
R i = G r R e i n 2 = g H β ( T h T c ) u i n 2
and the Prandtl number:
P r = v α
One possible way to represent the factors of the dimensionless shape is as follows:
θ = T T c T h T c ,   U = u u i n ,   V = v u i n ,   X = x H ,   Y = y H ,   P = P ρ u i n 2 ,
where H is the cavity length.
ε = L H H
where LH represents the length of the thermal energy source.
Calculations of the stream function are done such that there is a no-slip boundary condition across the baffle surface, as u = φ y and v = φ x .
The beginning and boundary conditions, both of which are dimensionless, are as follows:
  • At channel inlet, u = 1, v = 0, θ = 0.
  • At the bottom and inclined wall of the cavity (hot wall), θ = 1.
  • At adiabatic walls, ∂θ/∂n = 0; where n refer to normal direction
At channel outlet, p = 0, v = 0, ∂u/∂x = 0.
For the fluid-solid interface,
u = 0 , θ f n = k r θ s n
where k r = k s k f is the thermal conductivity ratio, and ks and kf are the solid and fluid thermal conductivity. In this study ks = 10 kf.
The Nusselt number assesses the heat transfer between the fluid and the bottom groove walls. This dimensionless number may be expressed as considering the thermal exchange’s continuity.
N u = θ f n
N u a v = 1 2 H / H 0 2 H / H θ f n   d x
The skin friction coefficient and the Nu, which have the following definitions [47,48,49], are important in this issue.
C f = τ w ρ u i n 2
where the shear tension is represented by τ w .

3.2. Numerical Investigation

3.2.1. The Procedure

Heat transport and thermal stress are both improved by the introduction of FSI. The Navier–Stokes formula was used to depict how fluid and a deformable baffle exchange momentum. To cope with FSI modelling, the ALE approach built on the method of finite element has been employed to achieve an approximate numerical solution of the governing Equations (1)–(9). These equations have been discretized and translated into their weak form by employing the Galerkin finite element method. The convergence criteria for the Galerkin finite element method involve monitoring changes in the solution at each iteration, ensuring that the solution stabilises or reaches a steady state, and meeting specified error tolerance levels. Fin oscillation is considered robustly using this approach, which results in mesh movement. Using the following criteria, the applicable time step is concluded [50,51]:
t * 1 2 x 2 α
where α represents the fluid thermal diffusivity and x speaks for the dimensional- space between the computational grid and nodes. The t selected should connect to the mesh used in the numerical solution. Due to the dimensionless of the current investigation, Equation (11) is adjusted to be such that:
t = t * u i n H
The mesh for the current computational field is created using a finer grid. The calculations are terminated at a criteria error of 10−4. The following relative error formula [49] serves as the basis for the numerical solution’s convergence criterion:
Γ i + 1 Γ i Γ i + 1 10 4
where i is the number of iterations, and Γ denotes the temperature, pressure, or velocity.

3.2.2. Grid Independence Test

The strongest flow situations, projected to occur in shear-thinning liquid (power index n is smaller than one) and higher Ri conditions, have been tested for mesh dependency. We chose the mesh grid 18,196 because of its acceptable accuracy and cost-effectiveness, as shown in Table 2. Figure 2 shows an overview of the mesh as well as a closeup of the region of interest. Following Equation (11), the time step reduces as the grid size increases; hence, the appropriate time step for 18,196 elements was determined to be 0.09.

3.2.3. Validation of the Results

Table 3 demonstrates that the model of the present study has been comprehensively validated by comparing its predictions to the experimental results of ref. [52], who examined the averaged Nusselt number (Nu) trends in corrugated channels with horizontal phase changes. By including their experimental geometry in the current model, their results have been effectively recreated and replicated, resulting in a significant correlation between the model’s predictions and the empirical data. This congruence supports the veracity and plausibility of the current applied model by demonstrating that it accurately depicts the complex fluid dynamics and heat transfer events within the investigated channels. This validation therefore supports the validity of the results reported in our work and highlights the efficacy of the applied methodology.
To improve the reliability of the model, it is compared to the findings of ref. [10] study, which provided the first instance of the phenomenon they were investigating. But the current model, depicted in Figure 3, provides an appropriate solution to surmount the shortcomings of the previous strategy and validate the model’s results. A comprehensive evaluation and comparison reveal that the outcomes of the current model and the study by Salhi et al. [10] are strikingly similar. This concordance between the two sets of results bolsters the validity and accuracy of the current computational study’s representation of the system’s fundamental physics. Incorporating the present model therefore provides a solid framework for future analyses and discussions and fills a significant knowledge gap.

4. Results and Discussion

Figure 4 illustrates a hollow structure with open ducts, including two thermal energy sources with a power output of 20 W each. Additionally, there is an unheated baffle in the shape of an elbow. The figure also includes four isotherm contours, which represent different temperature levels for the entering air, ranging from velocities of 10 to 150 cm/s. It is common for systems like this to include three separate channels for heat transfer. Convection begins in the duct at low flow velocities, dispersal happens at the base of the cavity, and convection occurs at the contact zone. The main method of cooling the cavity is through heat diffusion, which is facilitated by the cavity’s low velocity and the tiny size of the thermal energy source. On the other hand, the channel region heavily depends on forced convection to remove heat because of its comparatively high velocities. Nevertheless, the forms witnessed while the cavity is at rest and the channel suggest that convection mostly enables the transfer of heat. This observation aligns with the boundary condition, elucidating the gradual decrease in temperature as one advances farther from the thermal energy source towards the horizontal duct. The lower speed and smaller dimensions of the cavity and thermal energy source require predominantly diffusive cooling, but the higher speeds in the channel promote forced convection, in accordance with well-established principles of heat transfer.
In addition, Figure 4 allows visualisation of how temperature distributes within the cavity. At lower inlet velocities, the temperature gradients are more gradual, with smoother transitions between hot and cold regions. As inlet velocities increase, the flow dynamics become more turbulent, leading to sharper gradients and more complex temperature distributions. Also, higher inlet velocities typically result in increased convective heat transfer rates due to enhanced fluid movement. Isotherm contours show how temperature gradients adjust in response to changes in inlet velocities. Higher velocities lead to more rapid mixing of fluid and more efficient heat transfer from the heated sources to the surrounding fluid. The presence of the elbow baffle can significantly impact temperature distribution within the cavity. Isotherm contours reveal how the baffle alters flow patterns and redirects fluid flow, leading to variations in temperature gradients and heat transfer rates. It can be seen that isotherm contours identify regions of localised heating or cooling within the cavity. Hotspots occur near heated sources and in areas where fluid flow becomes stagnant or recirculates.
Figure 5 depicts the temperature distribution for different input air velocities, ranging from 10 to 150 cm/s. The figure includes two thermal energy sources with a power output of 20 W each, as well as a 90° unheated baffle positioned at the elbow. The observed results indicate that increasing the input air velocity causes alterations in the temperature distribution and flow patterns within the cavity. When there is a difference in temperature between the thermal energy source and the channel passage, both forced and spontaneous convection can take place. In contrast to natural convection, which is driven by temperature differences, forced convection in this scenario occurs when air within the cavity rises as a result of increased airflow. The increased airflow intake promotes improved natural convection from the heat sources, enabling better heat transfer between the hot and cold air inside the hollow space, ultimately leading to a more even distribution of temperature. In addition, the existence of a 90° unheated baffle at the elbow facilitates enhanced heat transfer from the cavity to the channel stream.
Contours of passage temperature illustrate how heat is distributed within the cavity as influenced by the air flow and heat transfer mechanisms. Higher inlet velocities promote more efficient heat transfer, resulting in lower passage temperatures near the heated sources and more uniform temperature distributions throughout the cavity. Temperature contours also provide insights into how the baffle influences heat transfer mechanisms, fluid mixing, and thermal stratification within the system. The contours reveal regions of temperature gradients, thermal boundary layers, and recirculation zones induced by the presence of the baffle. Hotspots occur near heated sources and in areas where air flow becomes stagnant or recirculates. Conversely, cold regions arise due to inadequate heat transfer or thermal insulation. This analysis allows us to identify areas of thermal inefficiency and optimise system design to mitigate temperature gradients and enhance thermal performance.
Figure 6 displays the velocity profiles of two uninterrupted 20 W heat sources, accompanied by a 90° unheated baffle with an elbow shape, at various input air velocities. The presence of heat sources is the main reason for the existence of a recirculating air zone in the space. The air within the hollow is propelled towards the left side of the insulated wall due to buoyancy forces. In contrast, when slip is not present, a typical laminar velocity profile is observed in the channel region, with the highest velocity occurring at the centre of the duct and no movement near the walls. The area where the hollow roof and the channel walls meet is a distinct zone where the restricted movement of air within the enclosure affects the slow-speed pattern of the channel. Figure 7 depicts the pressure streamline forms, showing the areas of recirculation within the channel-cavity system. Integrating a 90° unheated elbow baffle improves the recirculation of cold and hot fluids, hence enhancing heat transfer within the system.
Furthermore, Figure 6 describes the distribution of air velocities at the inlet boundary of the cavity. By examining these contours, it can identify regions of high and low velocity and visualise the overall flow patterns within the cavity. Areas of high velocity of 150 cm/s correspond to regions of accelerated flow, areas where the air undergoes significant acceleration and deceleration due to changes in geometry. Variations in inlet velocity have a significant impact on air flow patterns and velocity distributions within the cavity. Higher inlet velocities lead to increased turbulence and mixing within the flow, resulting in more complex velocity contours characterised by irregularities and fluctuations. It can show that the key flow structures and features identified within the cavity, such as boundary layers, shear zones, and separation regions. Also, by examining the spatial distribution of velocity gradients, it can gain insights into the behaviour of the air and the mechanisms driving flow dynamics within the system. The presence of the elbow baffle introduces changes in flow direction and velocity profiles within the cavity. By analysing inlet velocity contours, it can be assessed how the baffle influences fluid flow patterns and velocity gradients near the inlet boundary. The contours reveal regions of flow separation, recirculation, or vorticity induced by the presence of the baffle.
The simulations seek to understand how fluid flows and pressure evolve within the system under different inlet velocities. Mixed convection, driven by both buoyancy forces and forced convection due to fluid flow, creates complex interactions between temperature and pressure fields. The simulations solve the Navier–Stokes equations coupled with energy equations to capture fluid flow and heat transfer. These equations consider the effects of buoyancy, viscosity, and thermal gradients on the flow patterns and pressure distribution within the cavity. Figure 7 reveals the formation of recirculation zones behind the elbow baffle or in regions of flow separation. These zones impact pressure distributions, affecting the overall flow dynamics.
The presence of the elbow baffle significantly influences pressure contours. The contours in Figure 7 indicate changes in flow direction, pressure differentials across the baffle, and regions of pressure drop or rise. Pressure contours highlight areas of high velocity gradients and air acceleration, especially near the inlet. Steeper contours indicate regions where the air experiences significant acceleration or deceleration, offering insights into the efficiency of forced convection. Moreover, higher inlet velocities lead to more pronounced streamline patterns. Varying inlet velocities affect pressure distributions along the streamline contours. Higher velocities typically result in lower pressures, while lower velocities may lead to pressure build-ups. Analysing these pressure variations guides the optimisation of the system to achieve more uniform pressure distributions. This is crucial for minimising fluid resistance, avoiding pressure losses, and ensuring efficient flow control.
Figure 8 depicts the velocity distribution in the upward vertical direction of the duct flow. The air velocity at the inlet ranged from 10 to 150 cm/s, while the thermal energy source powers remained constant at 20 W each. The elbow 90° unheated baffle remained cold. The observed acceleration in speed can be attributed to the less resistance encountered by the air at larger distances from the surface of the lower wall. More precisely, when the air speed at the entrance increases, the smooth flow pattern within the channel changes, mostly due to the proximity of the slow-moving section of the cavity to the boundary region. It is important to mention that forced convection, which dominates over the shear wall effect and free convection, causes an increase in the velocity profile as the air input velocity increases.
Figure 9 illustrates the pressure distribution along the vertical axis for the flow of air in a duct. The system includes two constant thermal energy sources with a power output of 20 W each, a 90° elbow without any heating, and air velocities ranging from 10 to 150 cm/s. The noticeable rise in pressure at the entrance of the channel, accompanied by a steady decrease as the fluid moves along the channel and subsequent variation at the point where the channel meets the hollow, can be explained. While there is limited impact on the pressure supply of the channel when the positive y-axis is increased, elevating the input air flow rate leads to turbulence in the airflow, hence expanding the pressure distribution. Furthermore, the incorporation of a 90° unheated elbow baffle results in heightened recirculation, leading to a significant decrease in pressure inside systems that exhibit dynamic behaviour.
Figure 10 illustrates the temperature distribution along the vertical position of the duct-cavity assembly. The input velocities range from 0.1 to 1.5 m/s. The assembly includes two constant thermal energy sources with powers of 20 W each and a 90° unheated baffle. The temperature distribution observed exhibits a gradient, with the lowest temperatures recorded adjacent to the duct and the highest temperatures occurring at the junction where the duct and cavity intersect. The temperature fluctuation is mostly determined by the existence of the two unchanged thermal energy sources. Furthermore, implementing strategies such as optimising the air mixing between high and low temperatures or increasing the rate at which air enters the system can successfully reduce temperature differences at the interface between the channel and cavity. This, in turn, enhances the overall temperature distribution within the cavity. Furthermore, the sudden decrease in temperature at the site of the 90° unheated elbow baffle can be attributed to its capacity to cool the airflow, leading to a localised reduction in temperature.
Figure 11 depicts the velocity distribution within the cavity at the bottom section of the vertical position. This is achieved by employing two continuous 20 W heat sources, each accompanied by a 90° unheated baffle. The input speeds considered range from 10 to 150 cm/s. At lower air velocities, specifically at 10 cm/s, the velocity distribution remains reasonably consistent, exhibiting minor fluctuation along the lower vertical position and gradually decreasing towards the end of the hollow. Nevertheless, a higher influx of air into the cavity results in a more distinct velocity distribution, especially noticeable in the bottom region when the airflow speed is at its minimum. The inclusion of the 90° unheated baffle helps reduce the variation in velocity at some spots along the vertical position (y = −2.5 cm and y = −5 cm), but it also leads to sudden increases in velocity at the connecting area (y = 0) between the duct and the cavity. This phenomenon highlights the influence of the baffle on the movement of air within the enclosed space, leading to specific changes in the way air velocity is distributed.
Figure 12 depicts the pressure distribution over the bottom section of the vertical position within the cavity. The analysis takes into account two fixed thermal energy source powers of 20 W each, two inlet movements ranging from 10 to 150 cm/s, and varied input velocities. Additionally, a 90° unheated baffle is present at the elbow. Under conditions of low air velocities (ranging from 0.1 to 0.5 m/s), the pressure distribution within the cavity primarily shows low values along the negative y-axis. Nevertheless, by augmenting the rate at which the fluid enters, it is possible to enhance the distribution of pressure, resulting in a more homogeneous distribution of pressure levels throughout the enclosed space. Notably, alterations in the absolute value of y have minimal impact on the pressure distribution, suggesting that the pressure profile is resistant to vertical position modifications.
The temperature distribution within the cavity is seen in Figure 13. This is achieved by employing two constant thermal energy sources with a power output of 20 W each, together with a 90° unheated baffle positioned at the elbow. The inlet air velocities vary between 10 and 150 cm/s. The temperature distribution increases significantly as the vertical position increases, due to the combined influence of the two heat sources, which is greater than the impact of each source separately. Furthermore, modifications in the velocity of airflow at the entrance of the air system, combined with the existence of thermal energy sources, aid in decreasing temperatures along the negative y-axis and diminishing the temperature difference within the enclosed space. The impact of the 90° unheated baffle is clearly seen in improving the recirculation and mixing of cold and hot fluids, thus reducing the spread of temperature within the cavity.
Figure 14 depicts the local Nu profile within the cavity, demonstrating the impact of several inlet air velocities ranging from 10 to 150 cm/s, along with two heat sources and a 90° unheated barrier. At lower air velocities within this range, the transfer of heat from the cavity to the horizontal channel is less effective, leading to lower Nusselt numbers. The Nu value, which quantifies the efficiency of heat transmission, rises as airflow rates increase. Significantly, the highest Nu (Nusselt number) and thermal performance are observed at y = 0, which is the point where the cavity and channel intersect. However, the maximum Nu drops as the absolute value of y grows. The inclusion of a 90° unheated elbow baffle improves heat transfer, as evidenced by the Nusselt number.
Figure 15 illustrates the correlation between the velocity of the incoming air and the velocity distribution within the channel-cavity assembly. This is achieved by employing two thermal energy sources and a 90° elbow with a baffle that is not heated. At the entrance of the channel, the strong force exerted by the wall disturbs the distribution of velocity in the surrounding area, resulting in fluctuations in speed. The velocity reaches its highest point and varies around the middle of the cavity, where the recirculation of air has a substantial influence, before decreasing towards the end of the cavity. The elbow 90° unheated baffle enhances the local velocity by creating a recirculation effect, which in turn contributes to the measured velocity profile.
Figure 16 illustrates the pressure distribution in the duct-cavity configuration, which includes two thermal energy sources and a 90° unheated barrier. The inflow air velocities vary from 10 to 150 cm/s. The pressure distribution reaches its maximum near the opening of the canal and gradually lowers as it moves downstream. Significantly, the local pressure experiences a steep decrease as it approaches the right-angle baffle, suggesting a substantial reduction in pressure in its immediate area.
Figure 17 displays the temperature distribution in the channel-cavity system with two constant thermal sources, taking into account different inlet air velocities and a 90° unheated baffle. In the absence of any heat sources, the temperature between the channel and the cavity remains consistently low. Nevertheless, when two heat sources are present, notable temperature fluctuations arise within the contact area. As the velocity of the incoming air increases, the temperature decreases because more heat is transferred away by the airflow, resulting in a more effective cooling process. The cooling effect is intensified by the presence of a 90° unheated elbow baffle, leading to a significant drop in temperature in its immediate vicinity as a result of increased recirculation.
Figure 18 depicts the average change in Nusselt number for various input conditions, such as variable intake air velocities, dual thermal sources, a 90° unheated baffle, and a given value of ε = 0.4. Higher airflow velocities lead to an increase in the mean Nusselt number, which suggests enhanced heat transfer efficiency. The Nusselt number, which represents the convective heat transfer, increases at the 90° unheated baffle site of the elbow as the airflow velocity entering the system increases.
Figure 19 illustrates the velocity profile of the air stream across the output channel. The analysis takes into account a constant thermal source and a 90° unheated baffle. The input air velocities considered are 10 and 150 cm/s. The velocity distribution exhibits its minimum value adjacent to the channel wall and its maximum value at the centre, owing to the influence of shear stress exerted at the wall. The distribution has a parabolic shape at low input air velocities, whereas a more flattened profile becomes apparent at higher velocities. The inclusion of a 90° unheated elbow baffle causes wave-like variations in the distribution curves as a result of recirculation effects.
Figure 20 illustrates the temperature distribution produced by changing the incoming air velocity from 10 to 150 cm/s. This experiment includes constant heat sources and a 90° unheated barrier. As the y-axis declines, the temperature gradient intensifies, reaching its peak near the intersection of the two heat sources in the y-direction. Augmenting the velocity of the incoming air amplifies the process of heat transfer via natural convection from the heat sources to the airflow, leading to a decrease in temperature variation across the air stream.
Figure 21 depicts the distribution of air density in the outer segment of the channel flow. The illustration showcases various input air velocities (10 and 150 cm/s) and dual stable thermal sources, all while a 90° unheated baffle is present. The air density rises as y increases, indicating a greater distance from the thermal source. Greater intake air velocities result in enhanced natural convection into the airflow from the hollow, leading to a reduction in air temperature and, ultimately, an increase in air density.
Table 4 provides a concise overview of the results derived from numerical modelling simulations showcased in Figure 4, Figure 5, Figure 6, Figure 7, Figure 8, Figure 9, Figure 10, Figure 11, Figure 12, Figure 13, Figure 14, Figure 15, Figure 16, Figure 17, Figure 18, Figure 19, Figure 20 and Figure 21. These simulations offer comprehensive insights into many features of the hollow structure, including open ducts, thermal energy sources, and an unheated baffle. Figure 4 and Figure 5 provide insight into the substantial influence of convection on heat transfer mechanisms occurring inside the cavity and channel. The illustrations demonstrate the evolution of temperature gradients as inlet air velocities vary. Higher velocities result in more turbulent flow patterns and increased rates of convective heat transfer. Moreover, the existence of the unheated baffle impacts the flow patterns and temperature distributions, leading to fluctuations in heat transfer efficiency throughout the system.
Figure 6 and Figure 7 provide detailed analysis of the velocity profiles and pressure streamlines within the cavity-channel assembly. These figures offer valuable information regarding the impact of heat sources and the unheated baffle on fluid dynamics and pressure distributions. The existence of recirculation zones, caused by the baffle, has a substantial effect on the flow dynamics and heat transfer mechanisms. Moreover, alterations in the speeds at which air enters the system result in modifications to the distribution of pressure and the patterns of fluid movement, emphasising the intricate relationship between fluid flow and pressure distribution within the system.
Figure 8, Figure 9, Figure 10, Figure 11, Figure 12 and Figure 13 provide additional analysis of temperature and pressure patterns along the vertical axis of the hollow. These graphs illustrate the changes in temperature gradients and pressure fluctuations as inlet air velocities and the presence of the unheated baffle are altered. The findings provide a significant understanding of the processes involved in heat transport, fluid mixing, and thermal stratification within the cavity-channel system. Furthermore, they emphasise the significance of fine-tuning system parameters to improve the efficiency of heat transport and thermal performance.
Figure 14, Figure 15, Figure 16, Figure 17, Figure 18, Figure 19, Figure 20 and Figure 21 examine the heat transfer efficiency, velocity distributions, and pressure fluctuations for various input conditions. These figures offer a thorough comprehension of how several characteristics, such as inflow velocities, heat sources, and the unheated baffle, impact the flow dynamics and temperature distributions inside the system. The findings provide useful insights for enhancing system design and optimising thermal performance in comparable setups, with possible applications in diverse engineering and environmental contexts.

5. Conclusions

An analysis using numerical methods of thermal exchange with free and forced convection in an opened cavity with a couple of thermal energy sources of 20 W each, one at the bottom and the other at the inclined wall of the hollow, and the existence of an elbow-shaped, unheated baffle at 90 degrees. COMSOL Multiphysics software v. 5.6 was used to model the issue stated in this paper. The results that are seen are as follows:
(1)
Analysis reveals dominant heat transfer mechanisms: convection within the duct, dispersion at the cavity’s base, and convection in the contact zone. Temperature gradients and flow velocities (e.g., 10–150 cm/s) illustrate the complex interplay of these mechanisms.
(2)
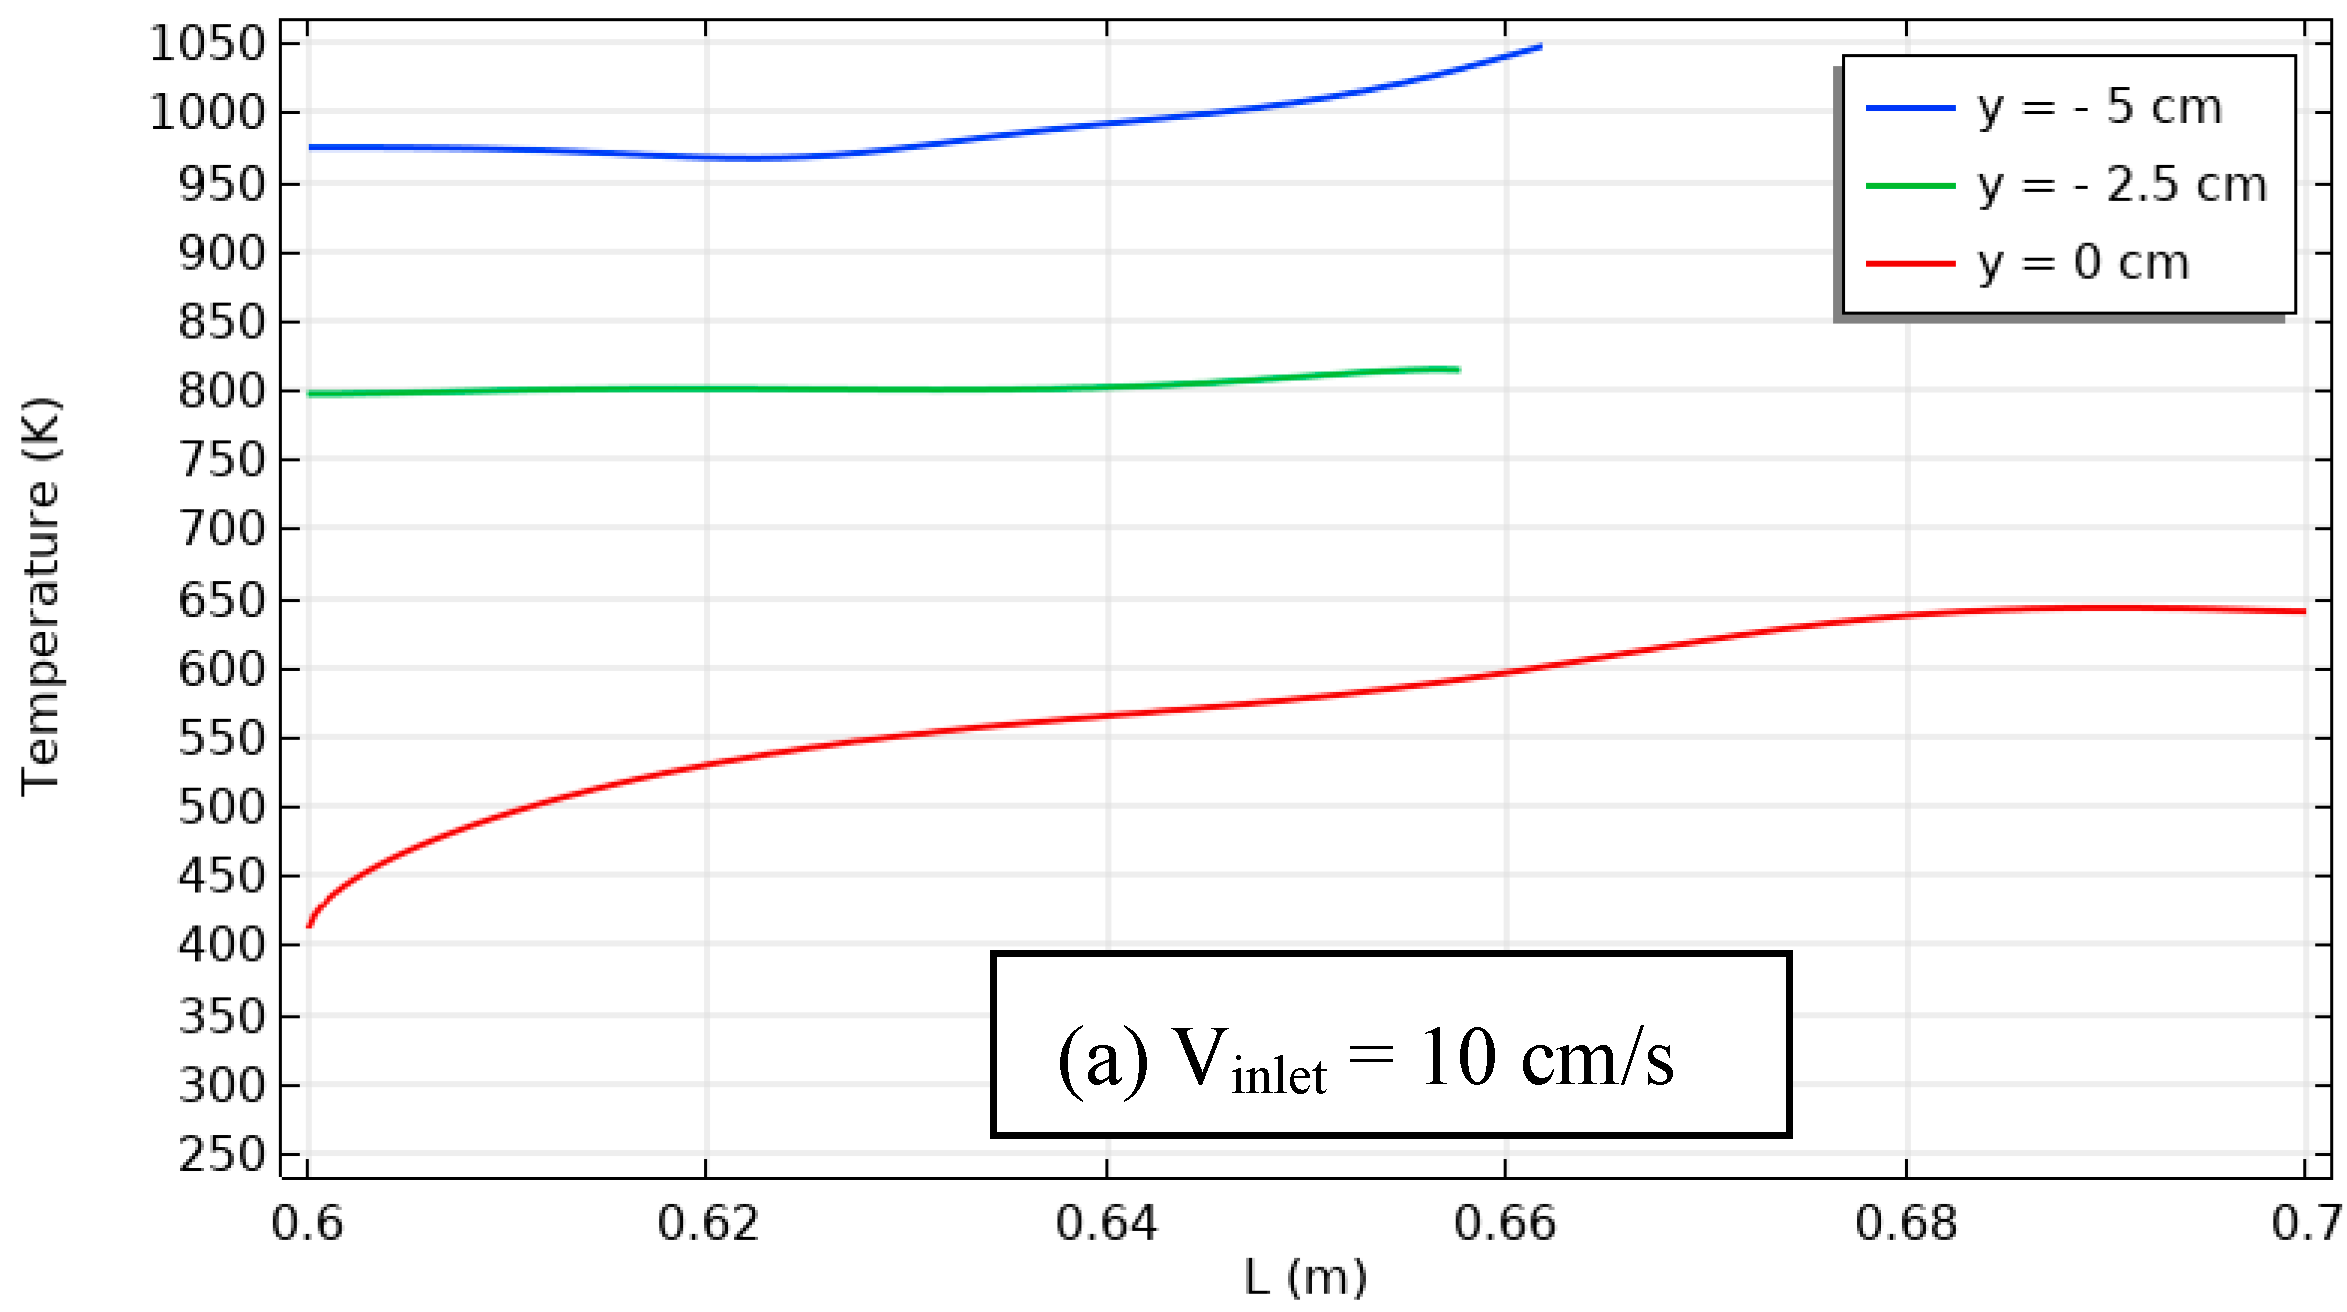
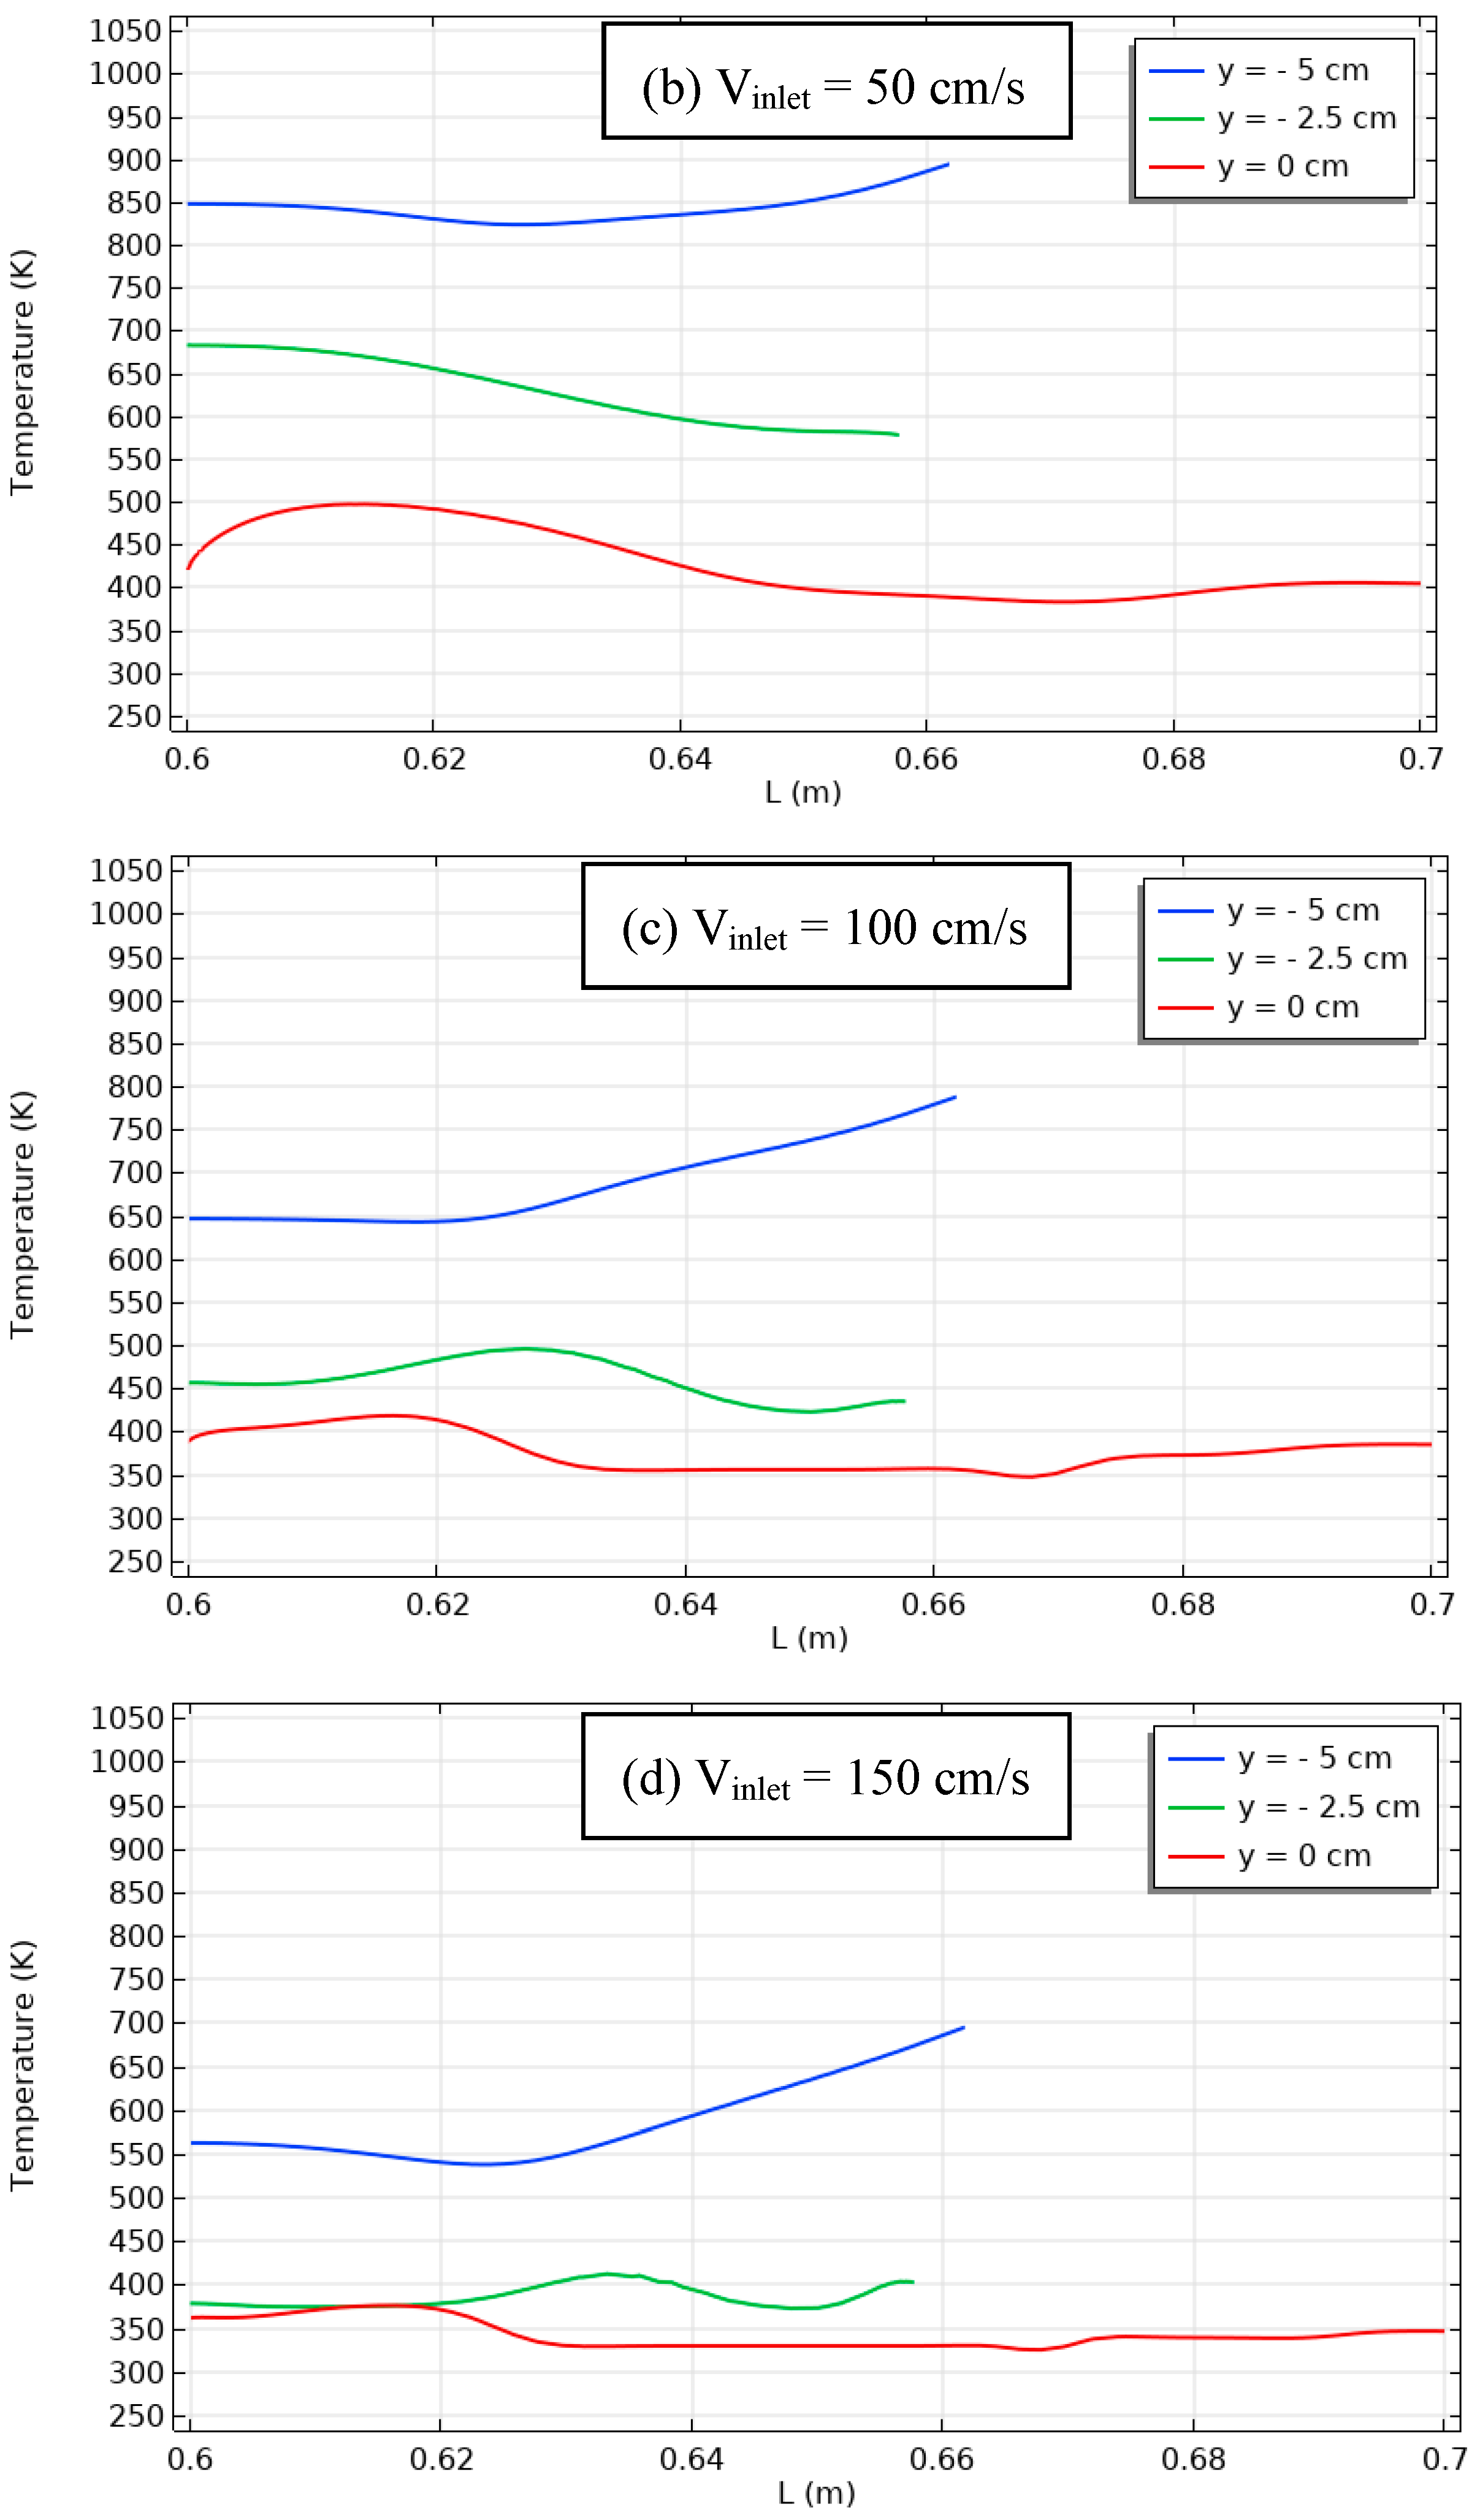
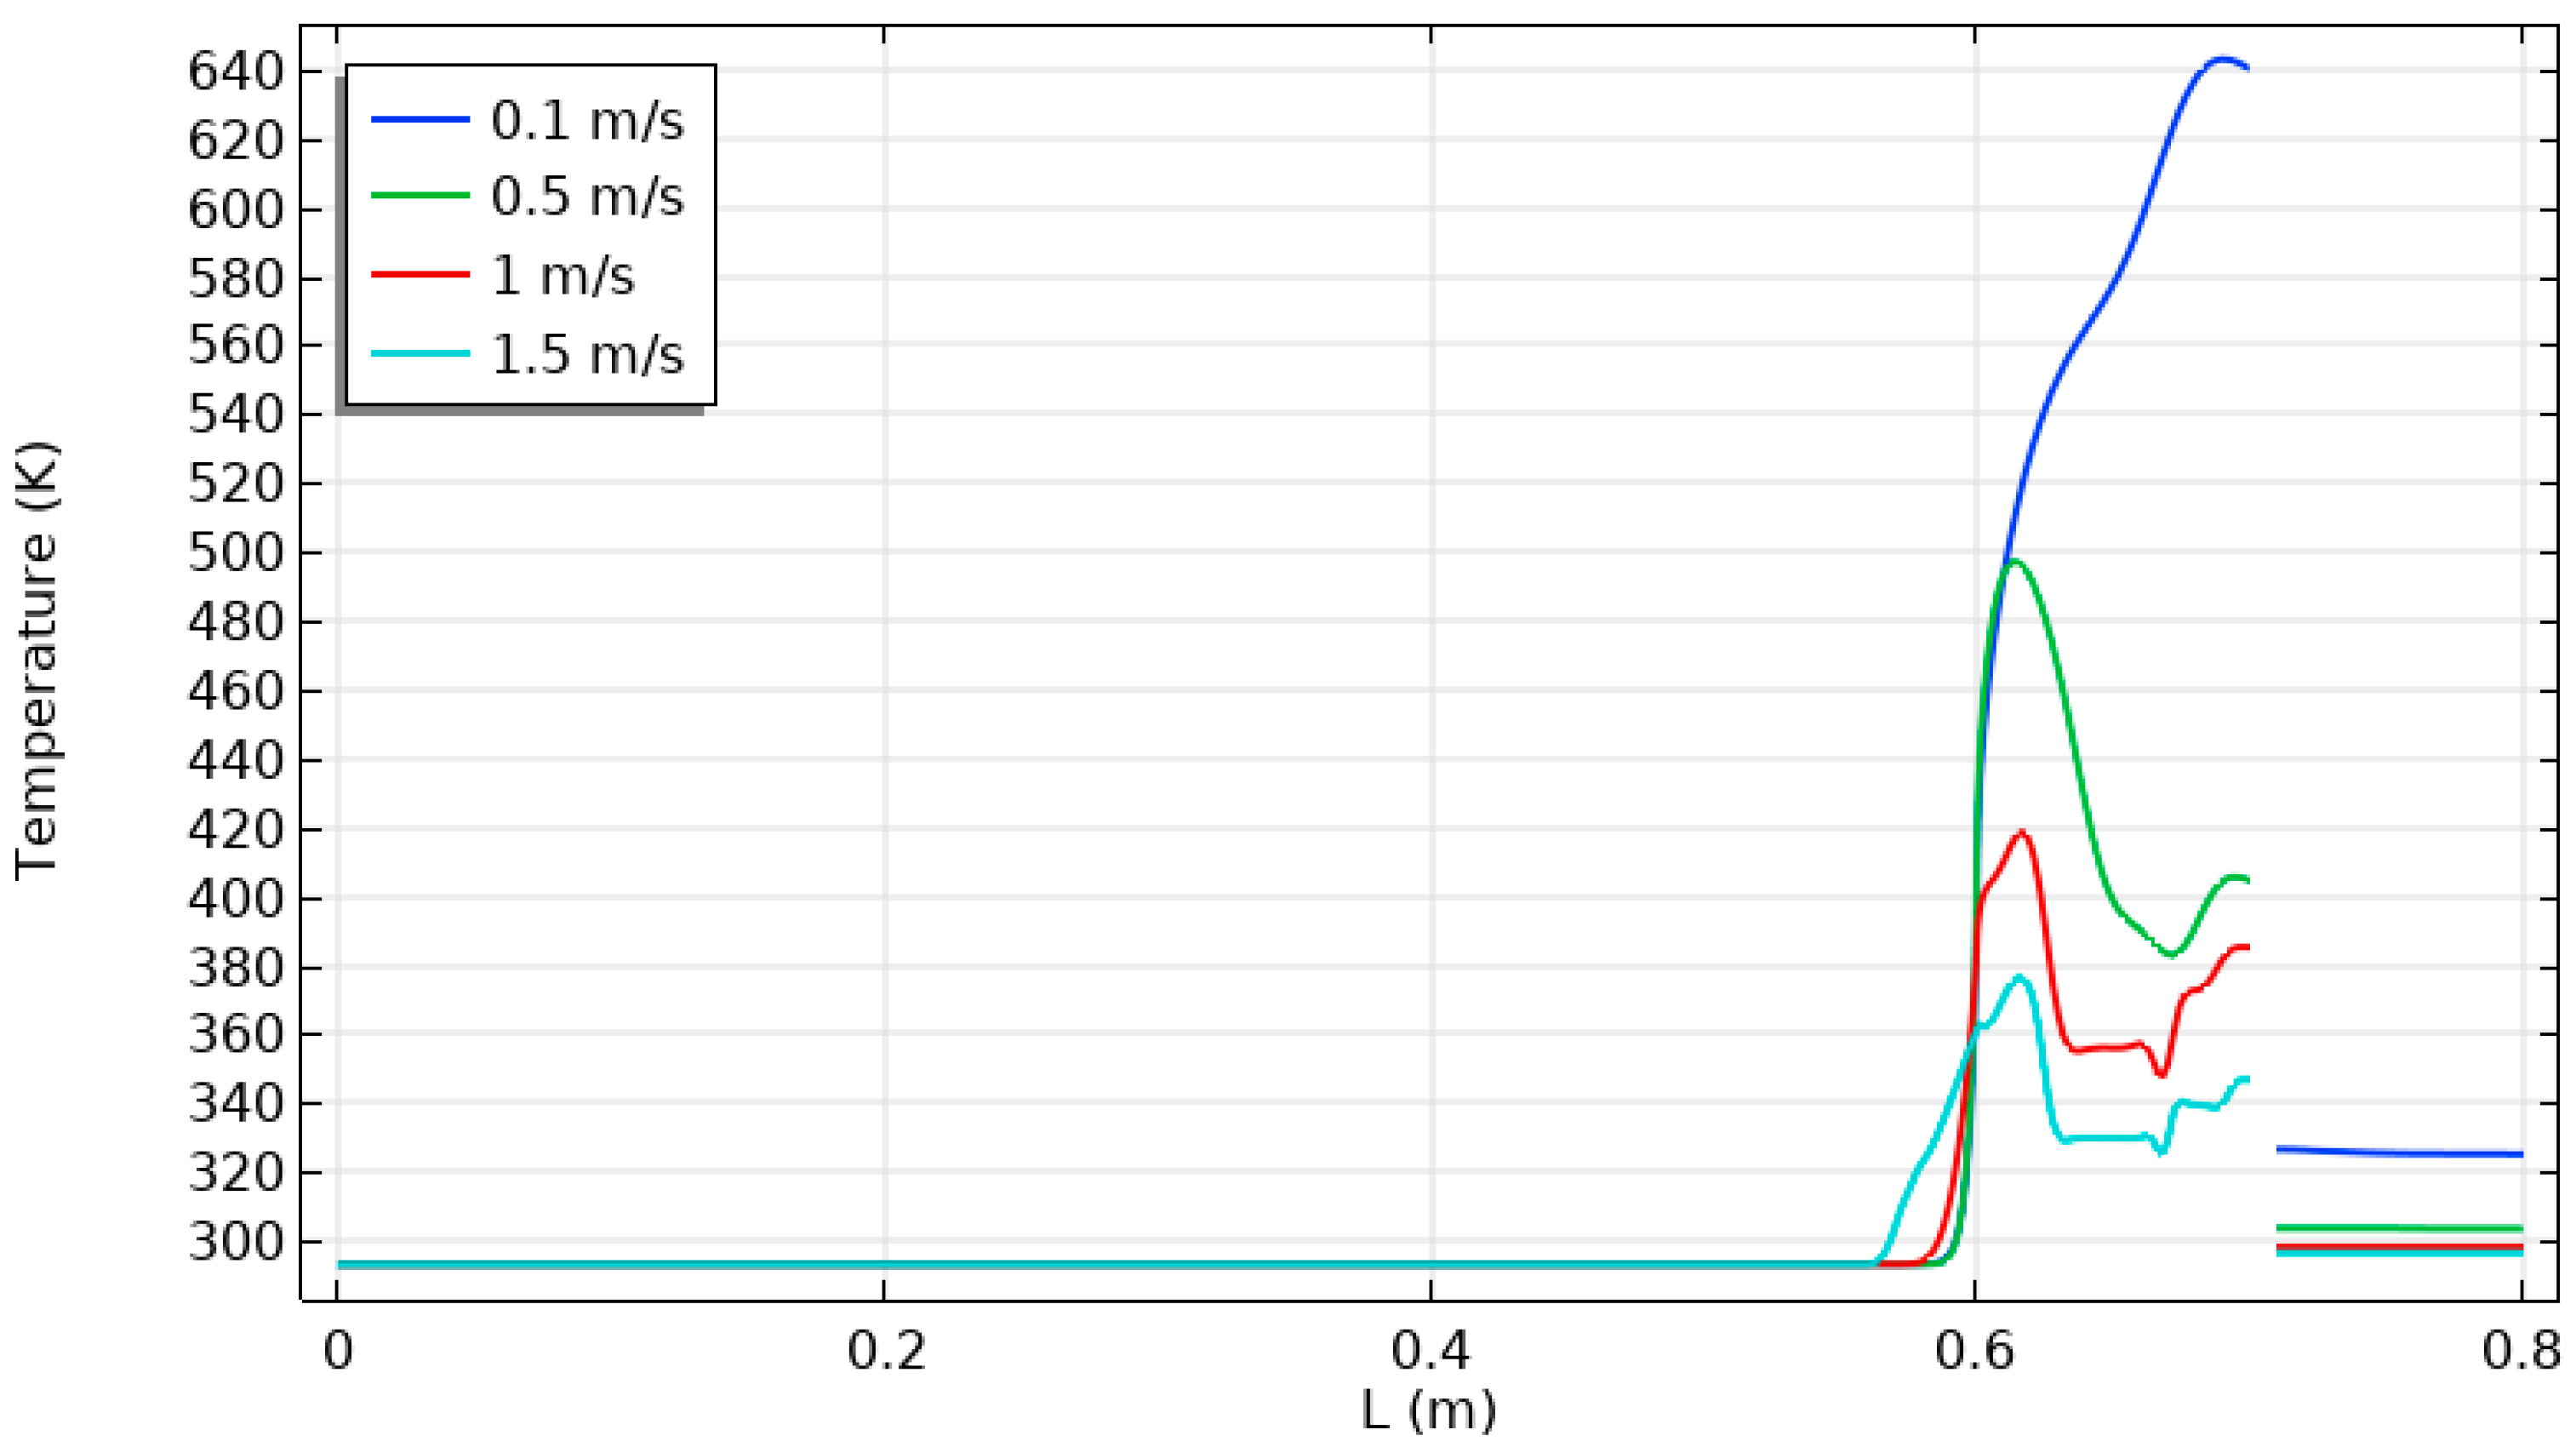
Varying inlet air velocity (10–150 cm/s) significantly alters temperature fields and flow dynamics. Temperature profiles show shifts with increased velocity, impacting both forced and natural convection processes. Thus, the cavity neck temperature ranges from 380 to 640 K, with inflow air velocities varying from 0.1 to 1.5 m/s, respectively.
(3)
The presence of a 90° unheated baffle enhances recirculation and modifies velocity profiles. Pressure and velocity distributions demonstrate how the baffle alters flow characteristics, improving heat transfer efficiency.
(4)
Thermal sources induce recirculating air zones and buoyancy effects, influencing flow directionality. Temperature gradients and heat transfer rates highlight the spatial distribution of thermal energy (e.g., 20 W sources).
(5)
The cavity neck pressure varies from 0.01 to 2.5 Pa, with inflow air velocities changing from 0.1 to 1.5 m/s, respectively.
(6)
Incorporating a 90° unheated baffle optimises heat transfer by promoting recirculation. Pressure profiles and Nusselt numbers validate design interventions, ensuring efficient heat transfer and temperature uniformity. As the input air velocity increases, more heat is transported from the thermal source into the airflow, lowering the temperature.
(7)
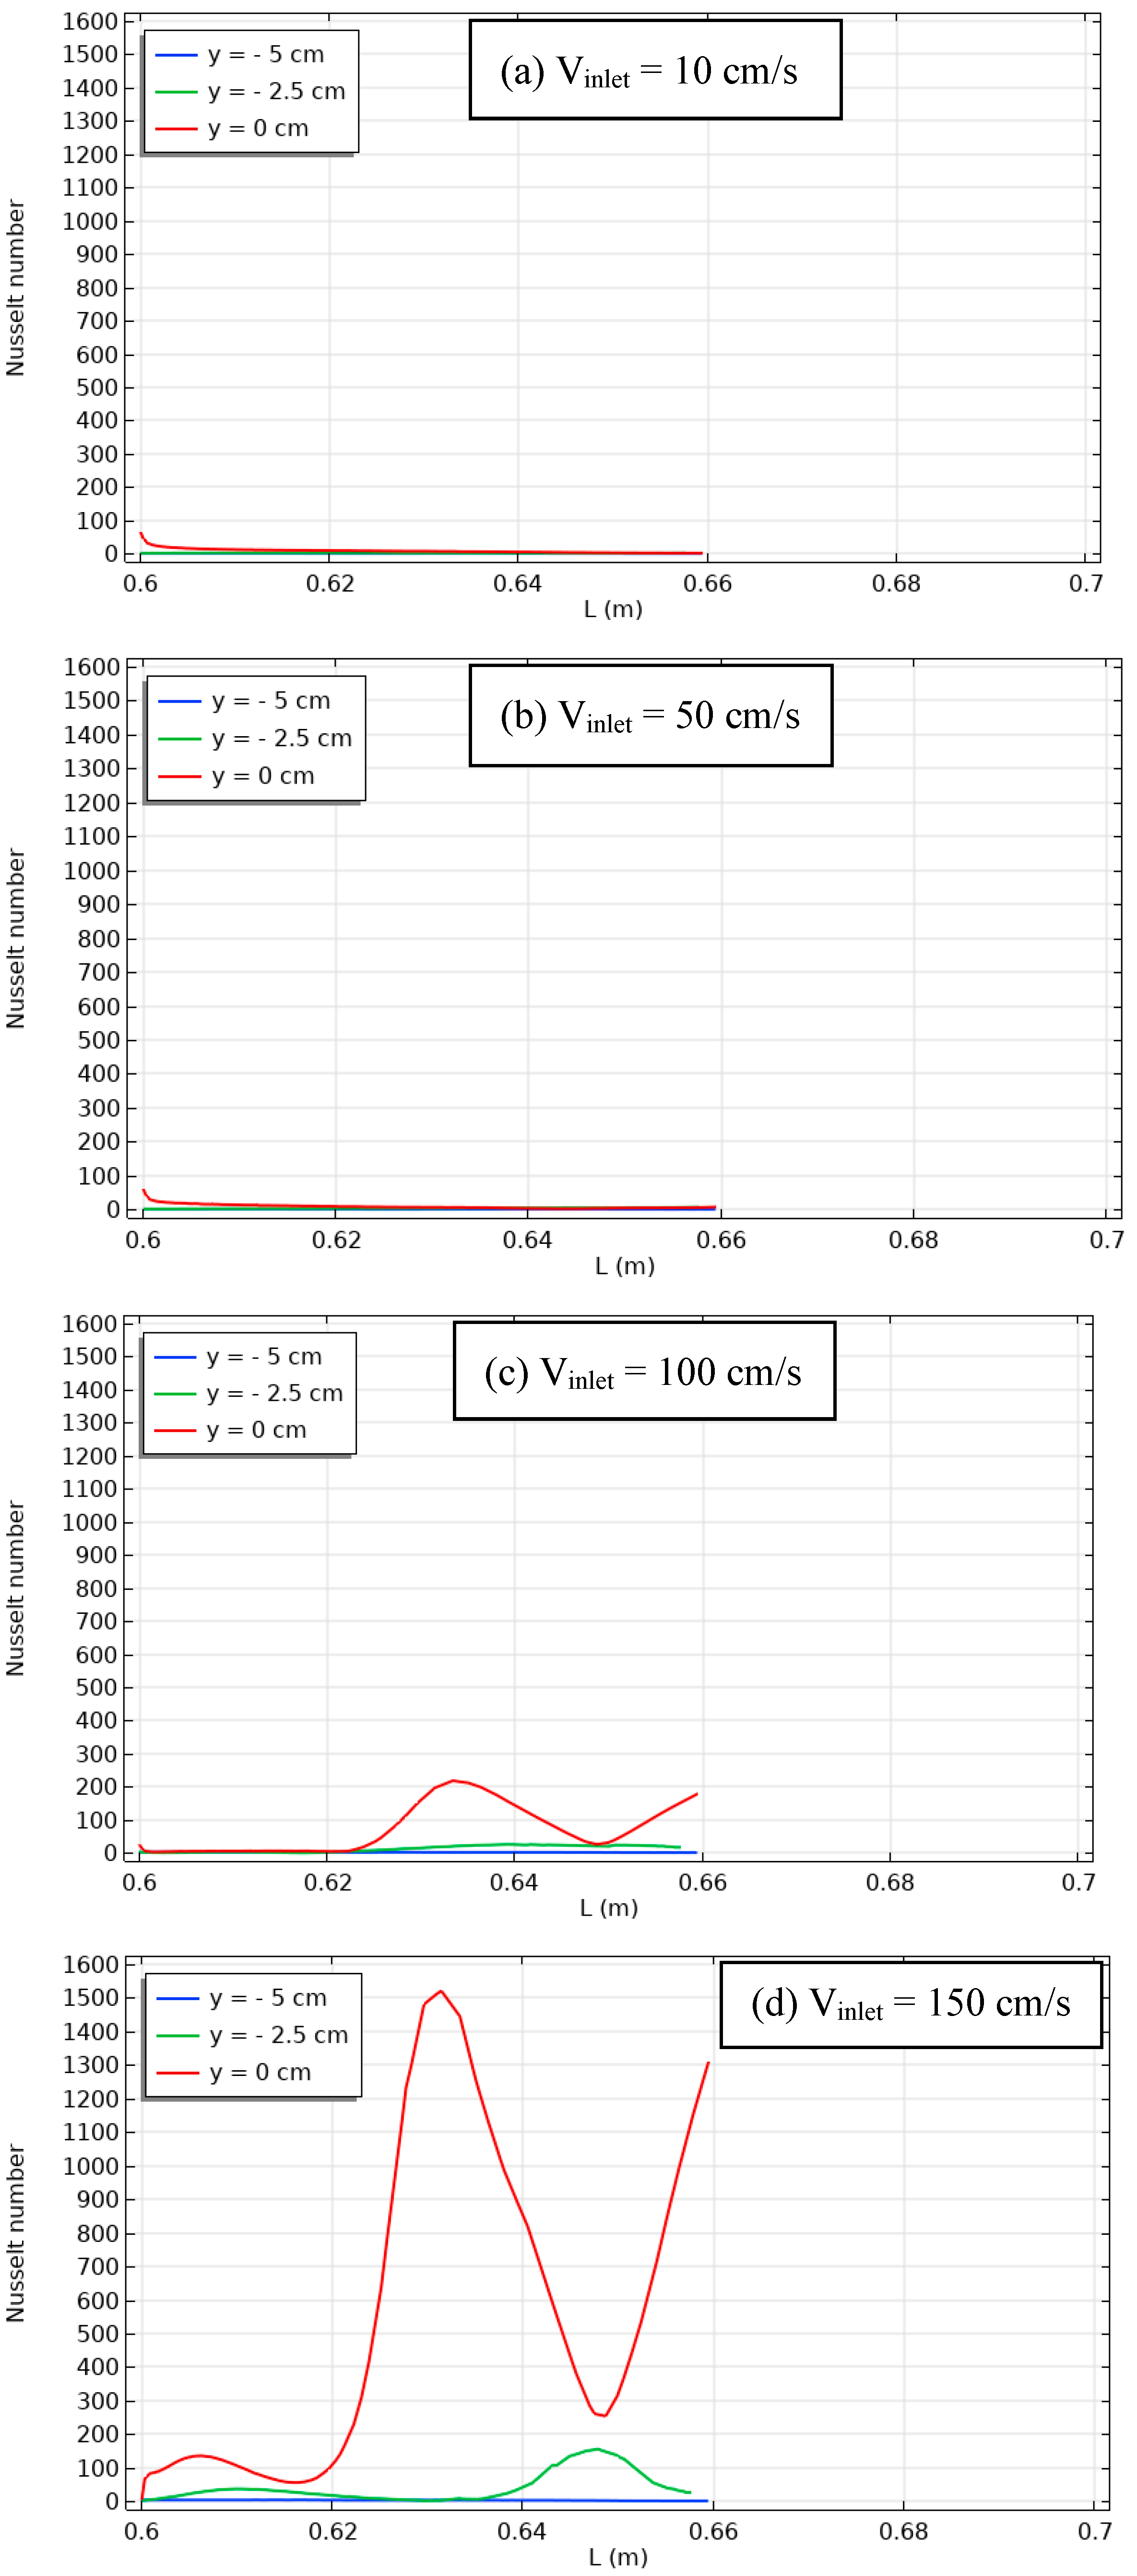
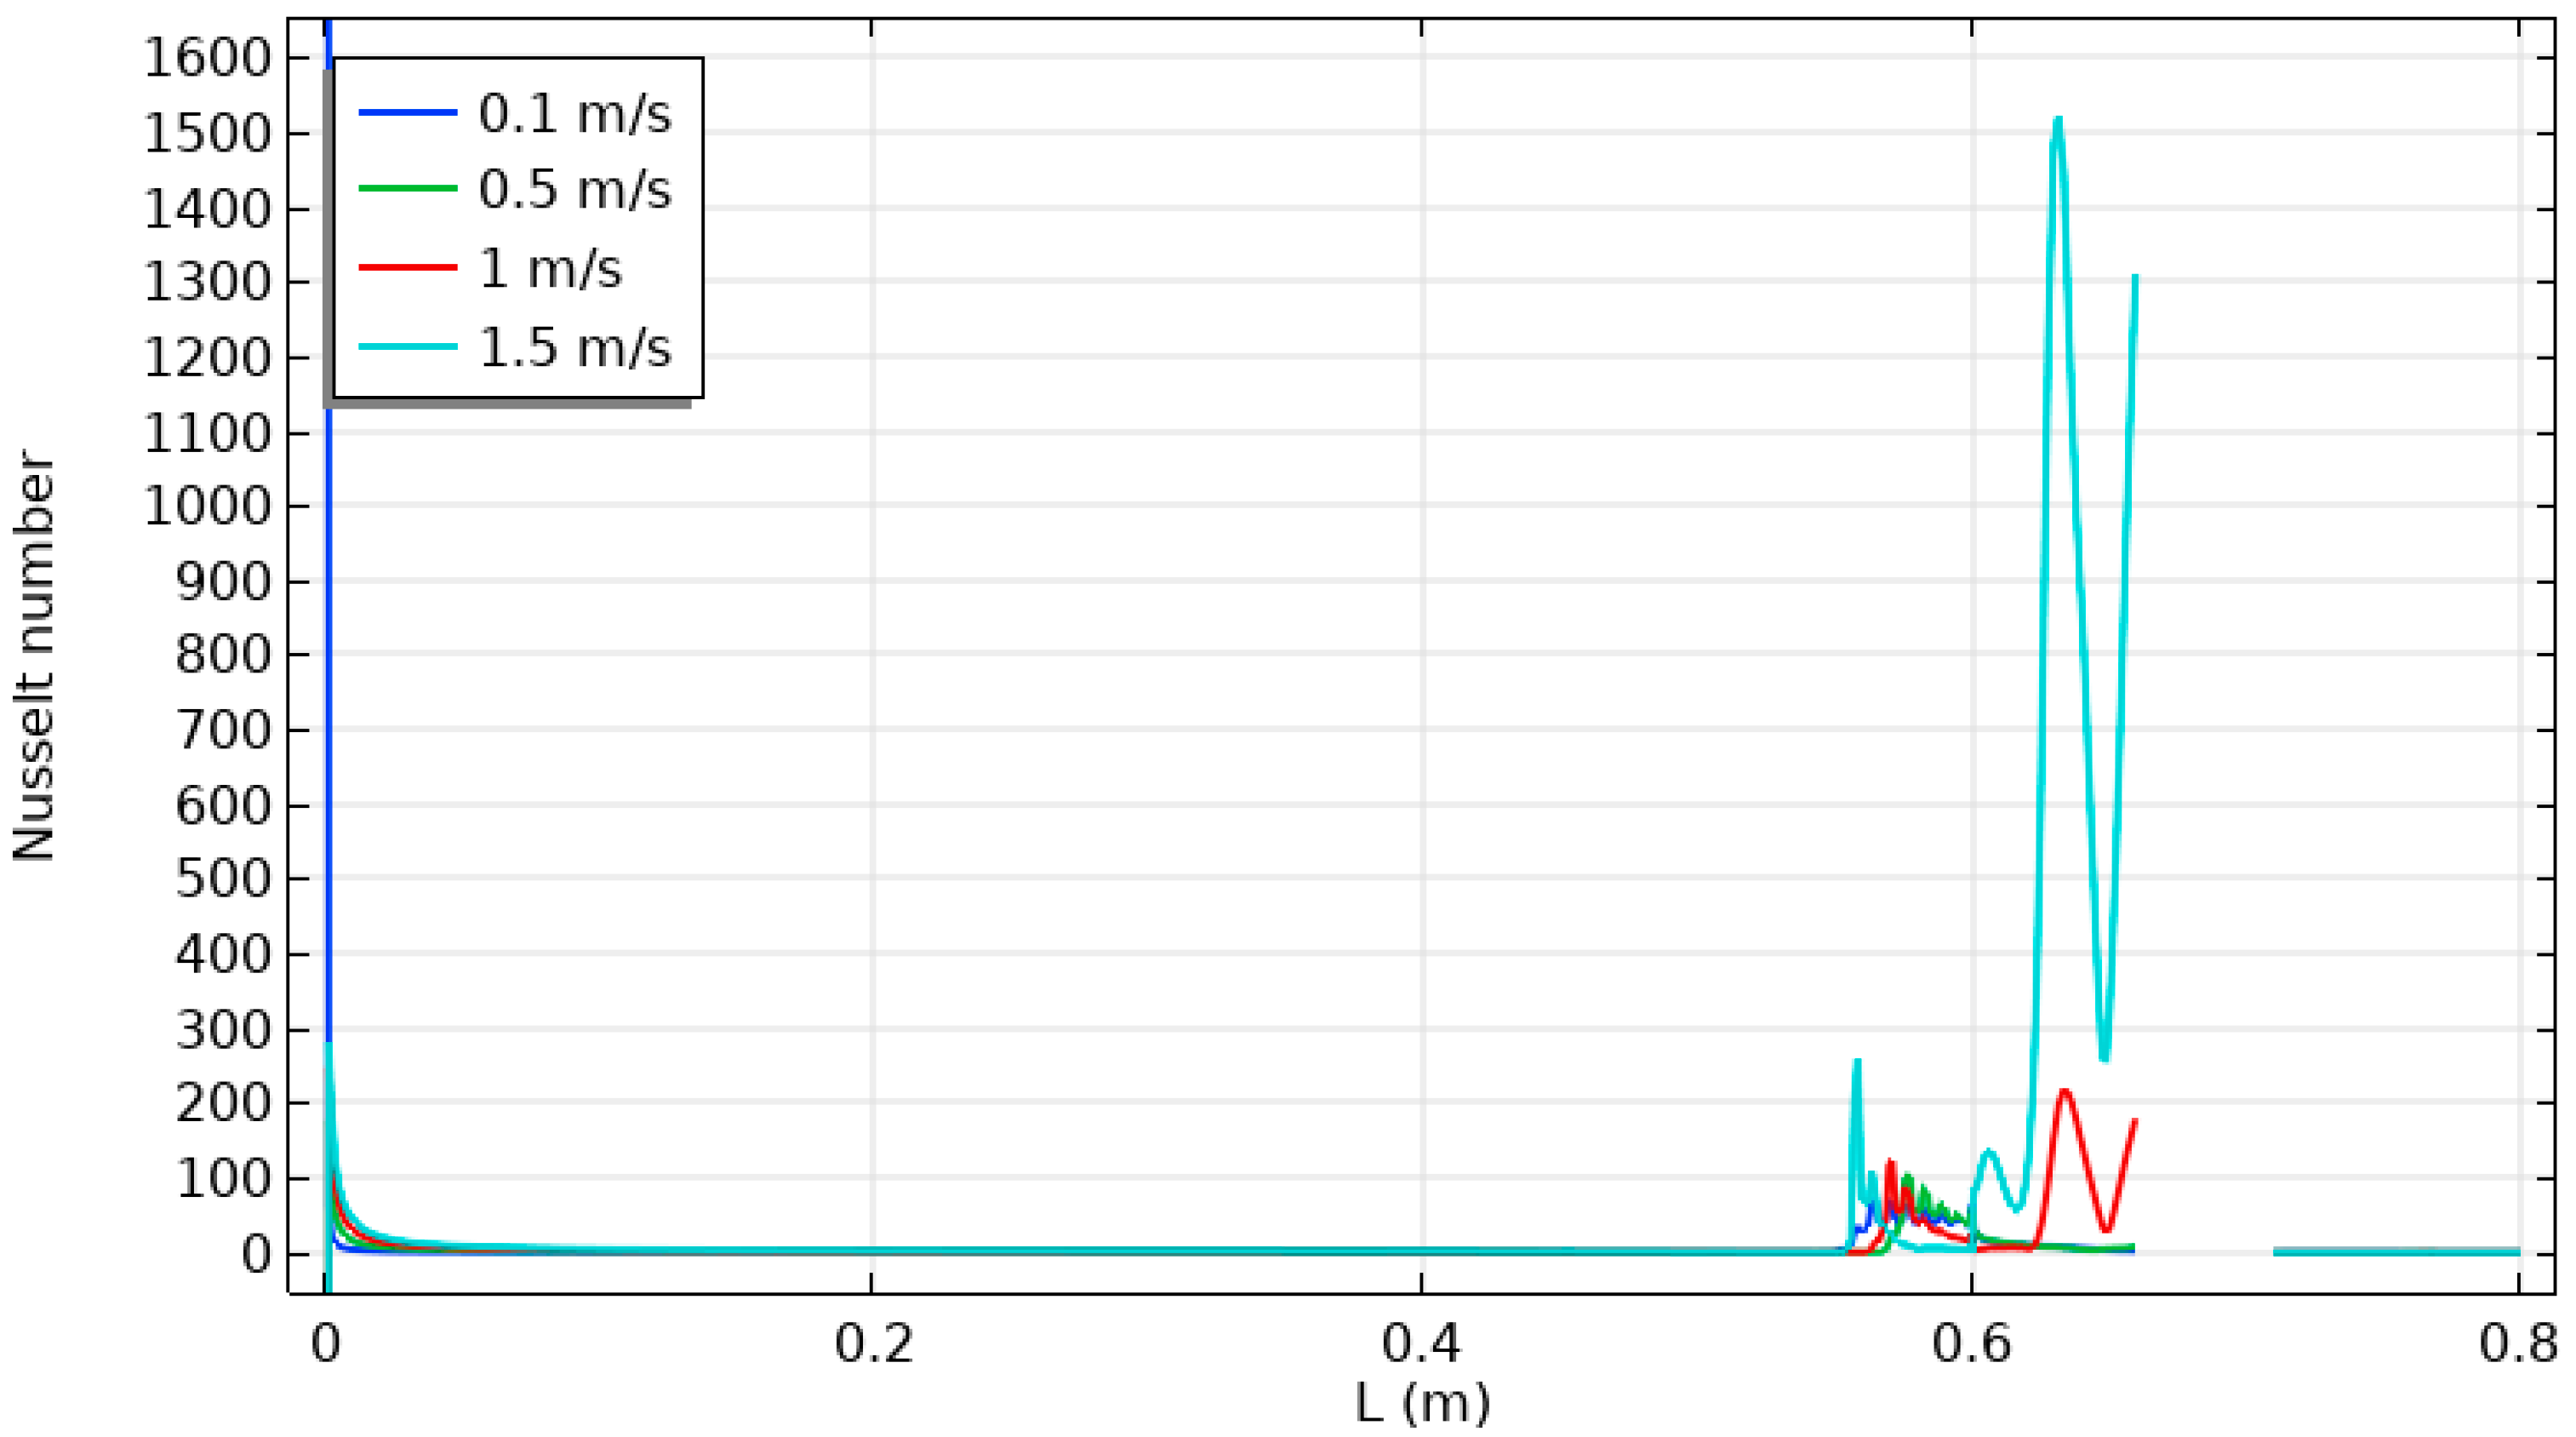
The mean Nusselt number is obtained at about 1500 when the inflow velocity reaches 1.5 m/s.
(8)
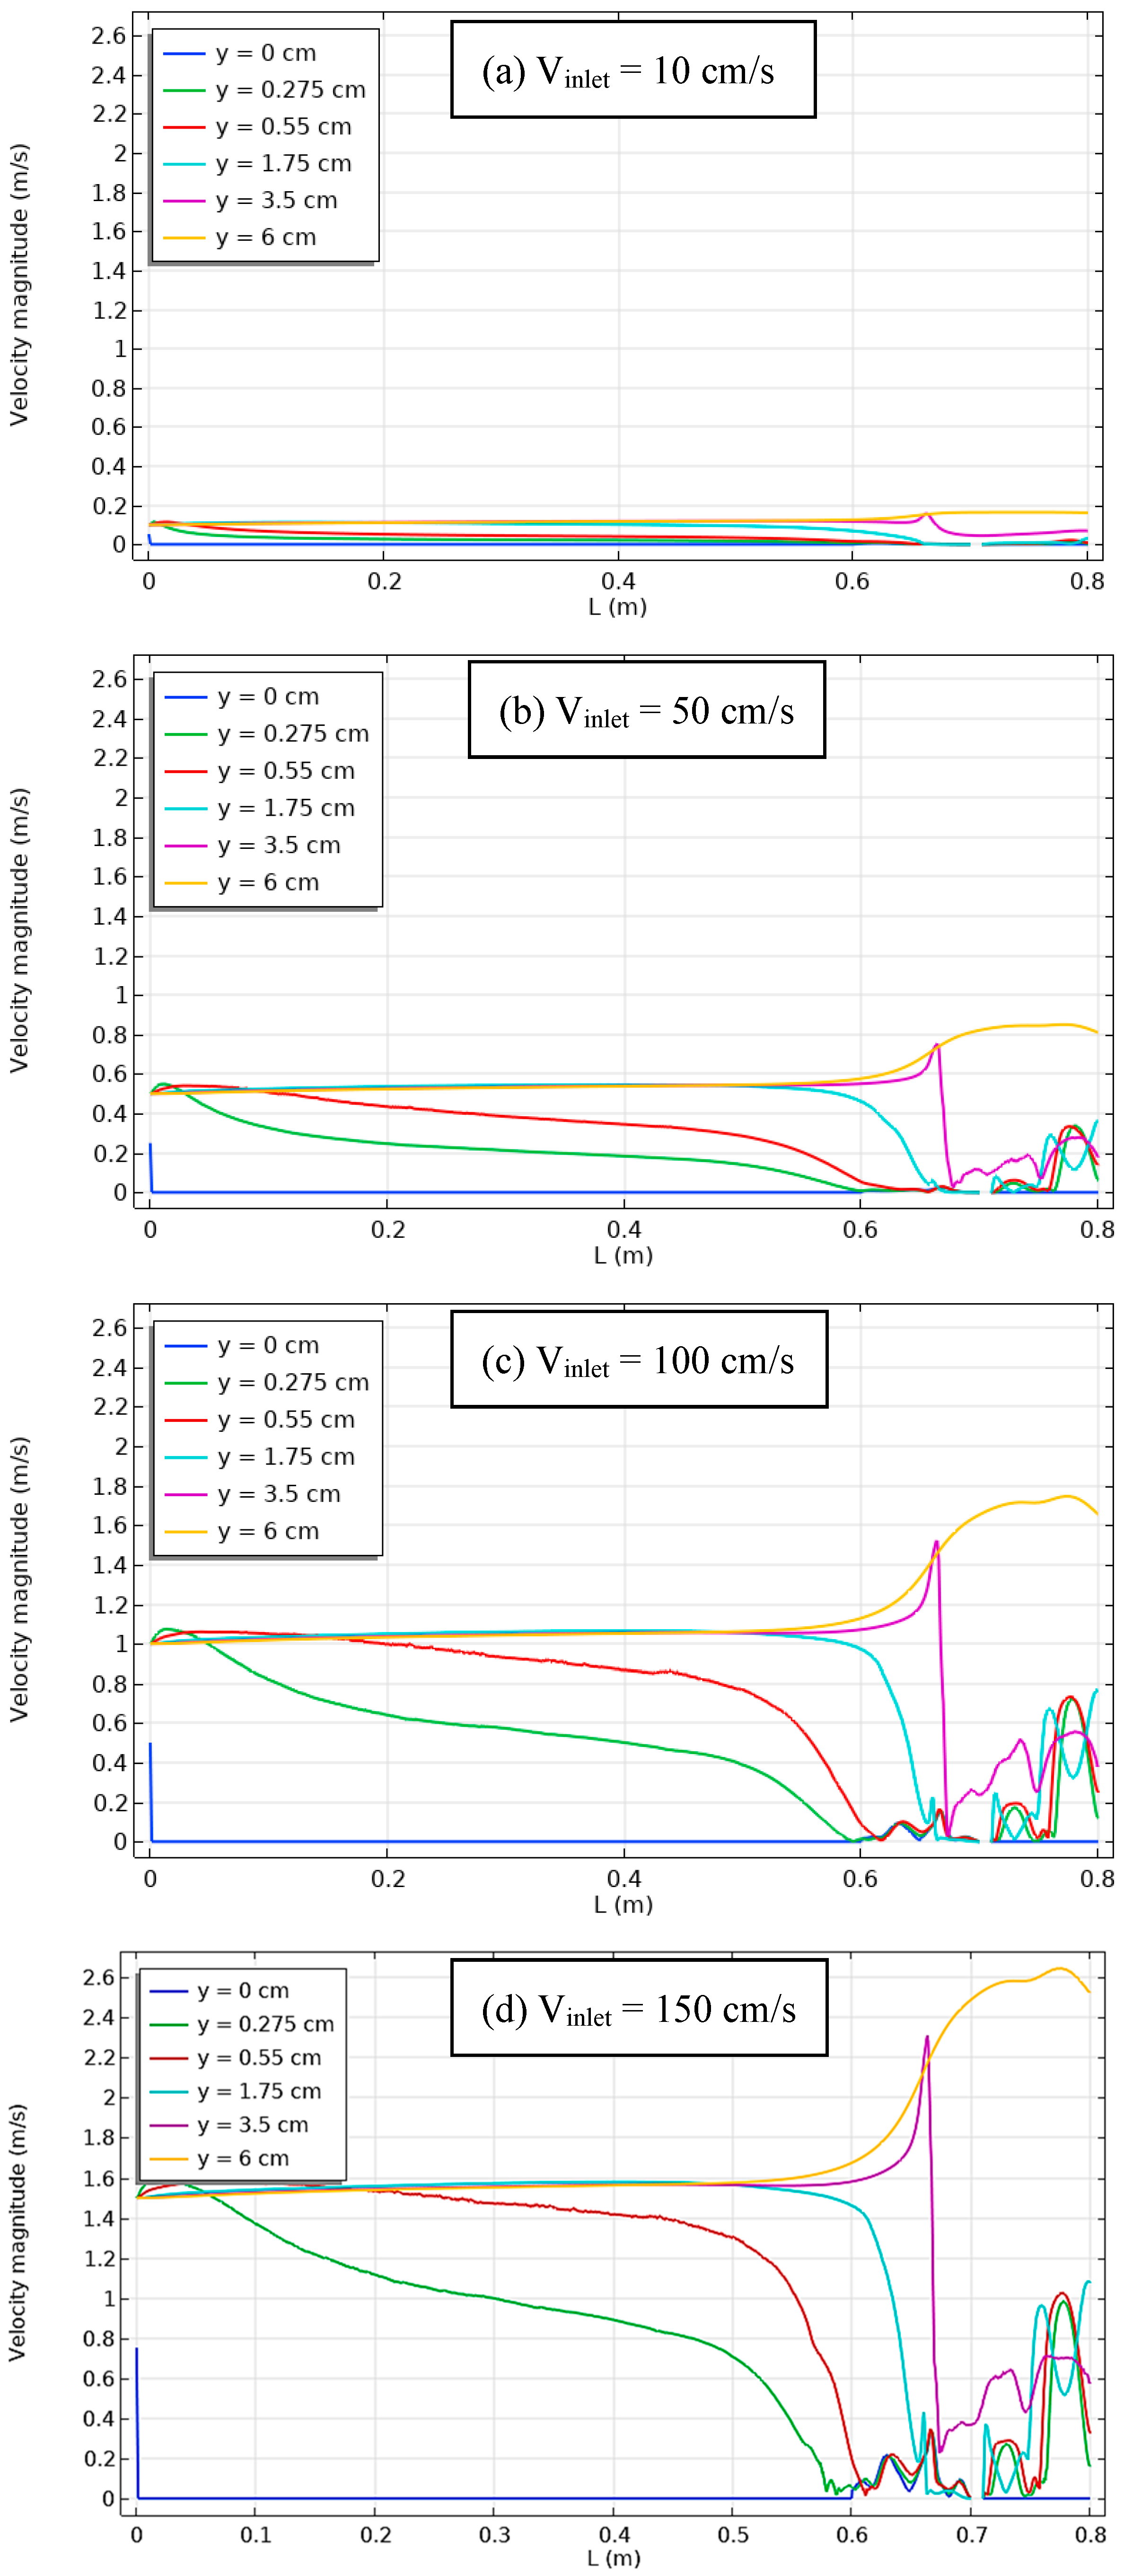
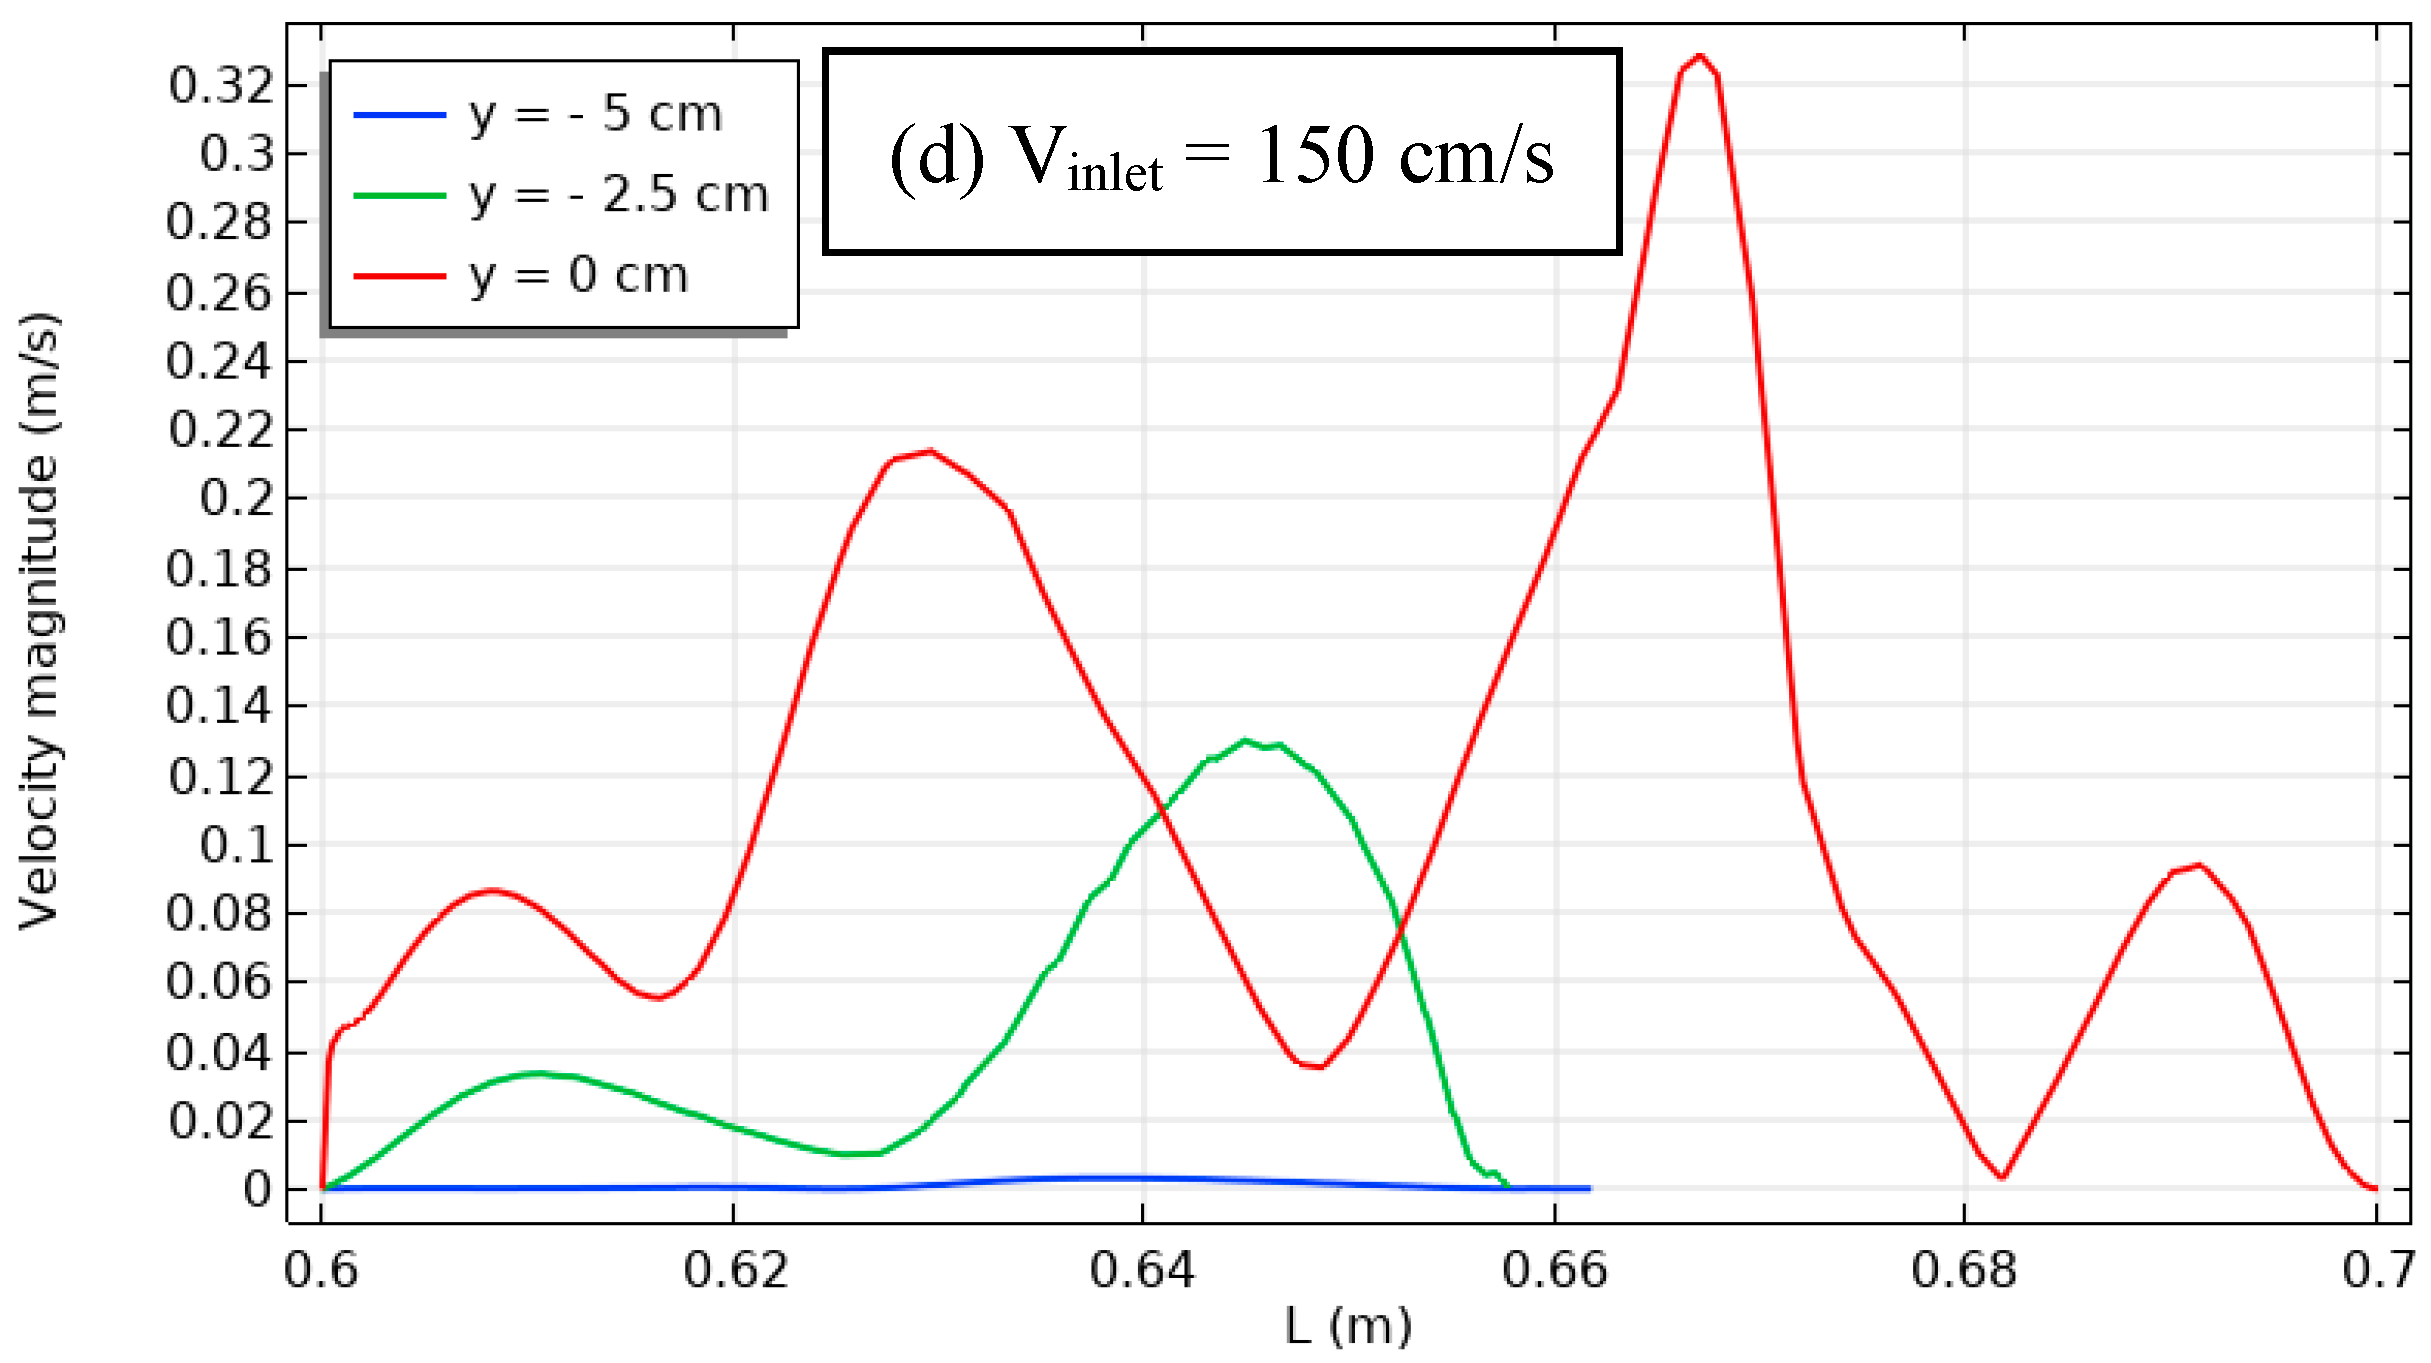
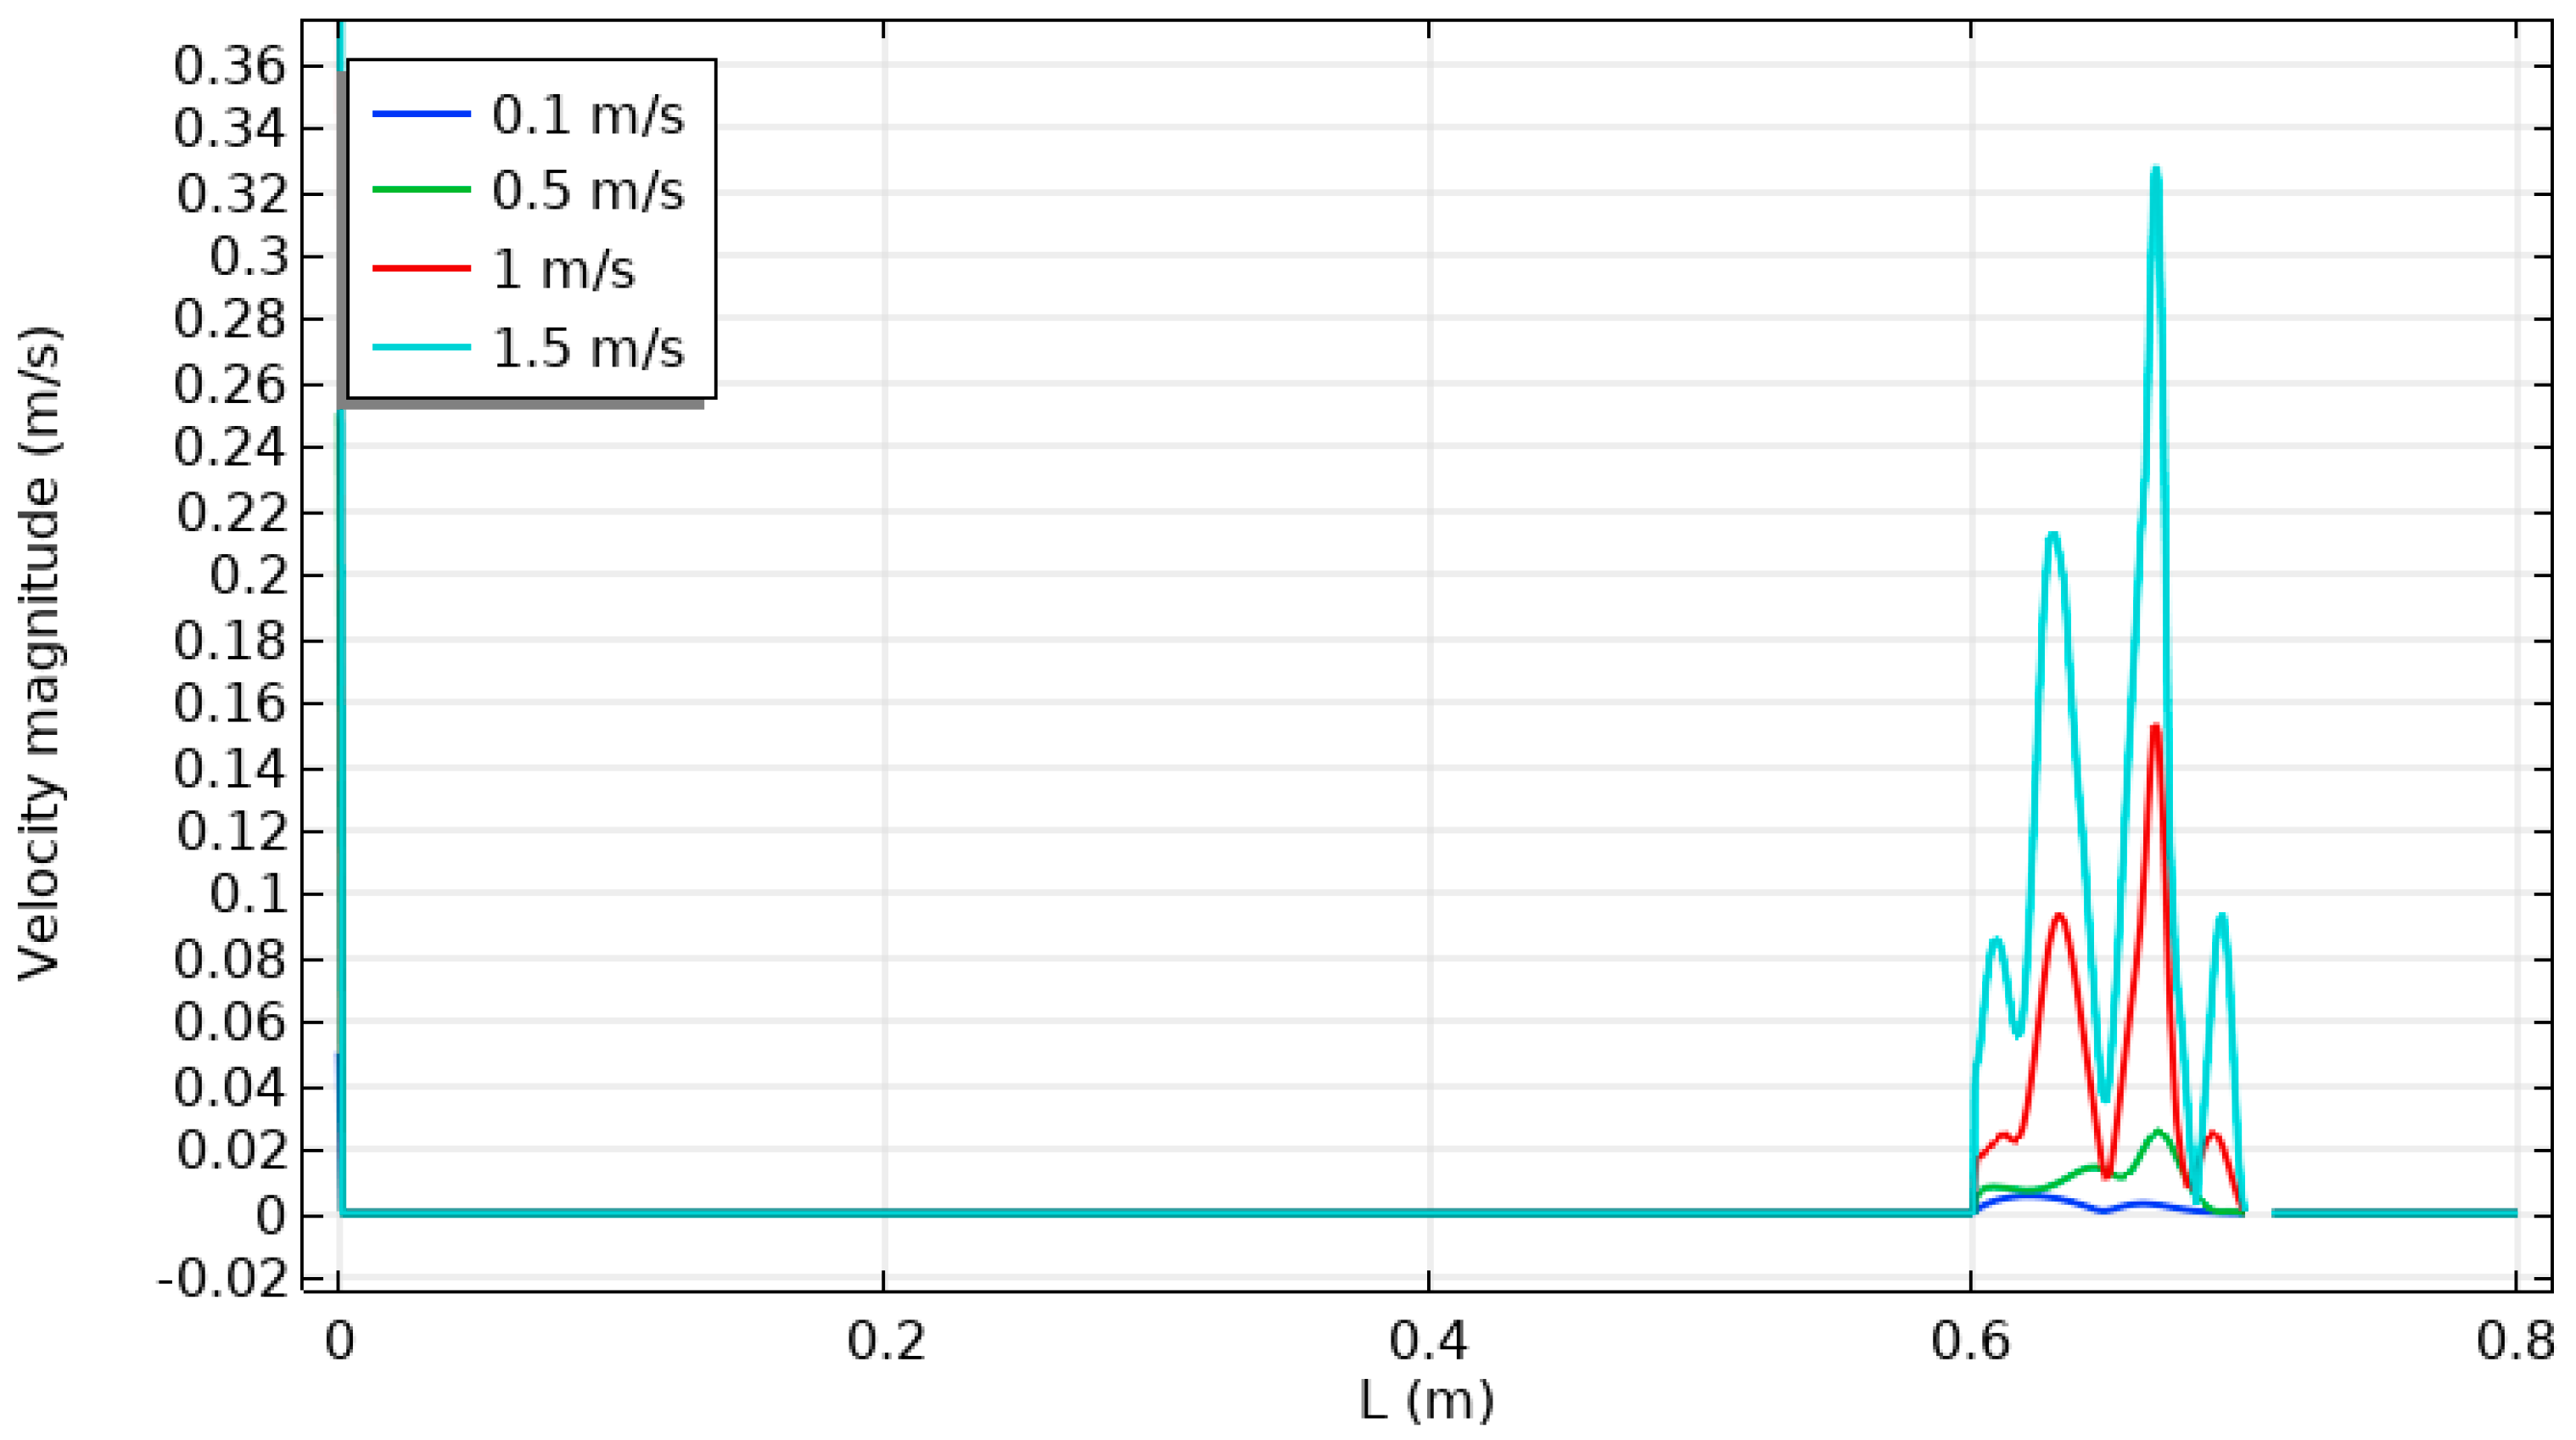
Shear force from the channel wall had the largest impact on the local velocity distribution near the channel inlet, where it suddenly broke down. In the middle of the interface, it peaked, varied, and finally dropped to its lowest position towards the end of the cavity, where air recirculation was at work.
(9)
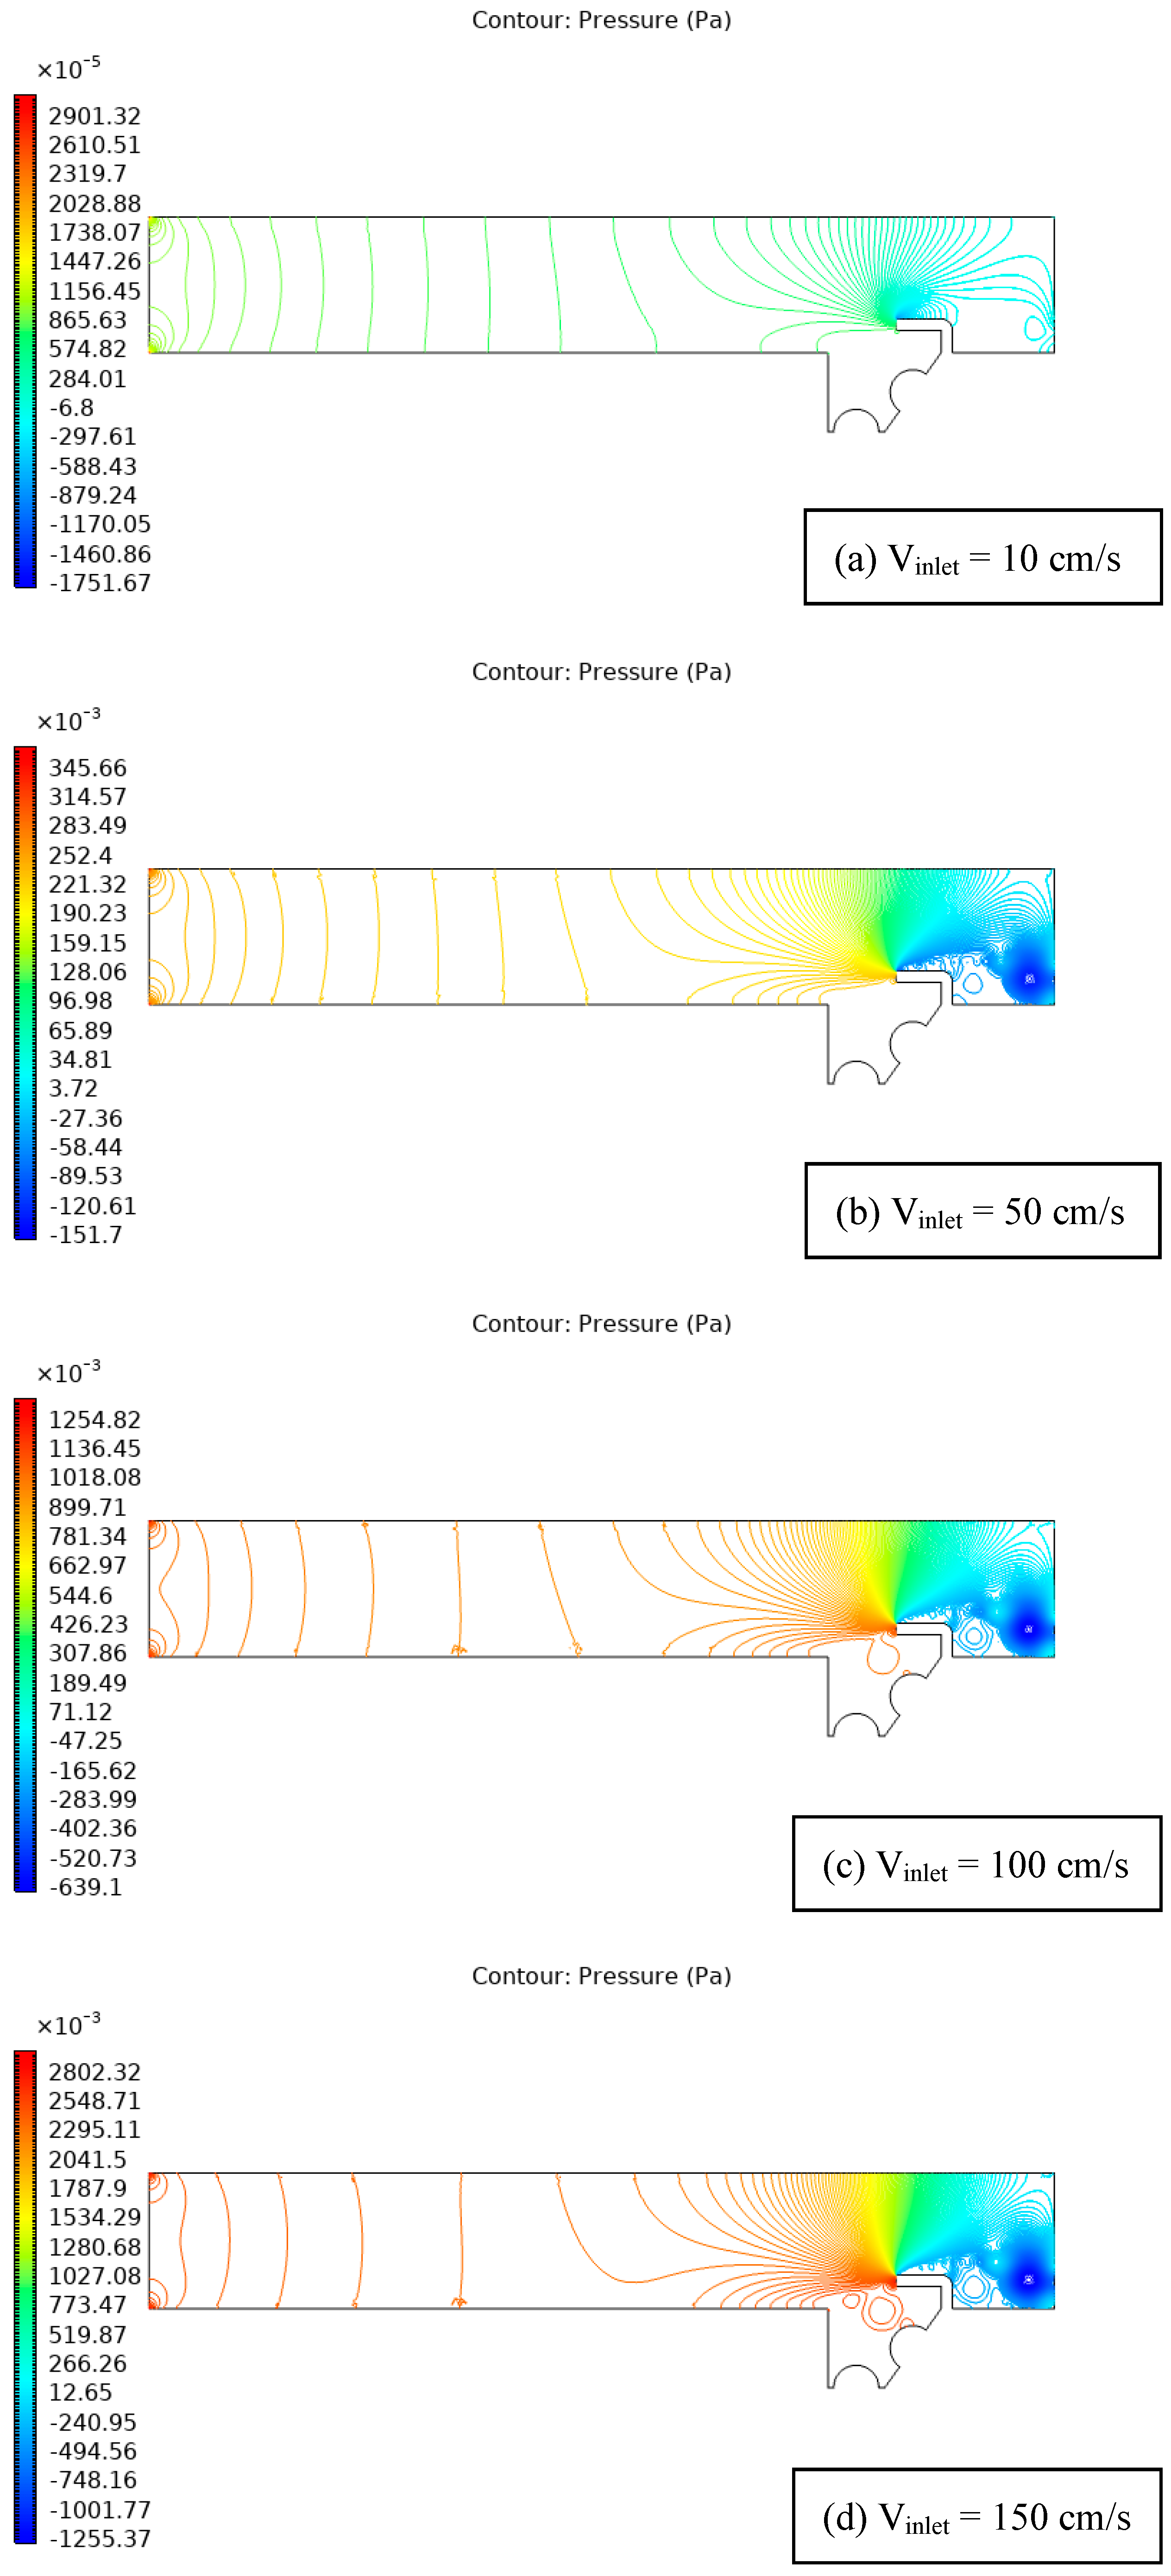
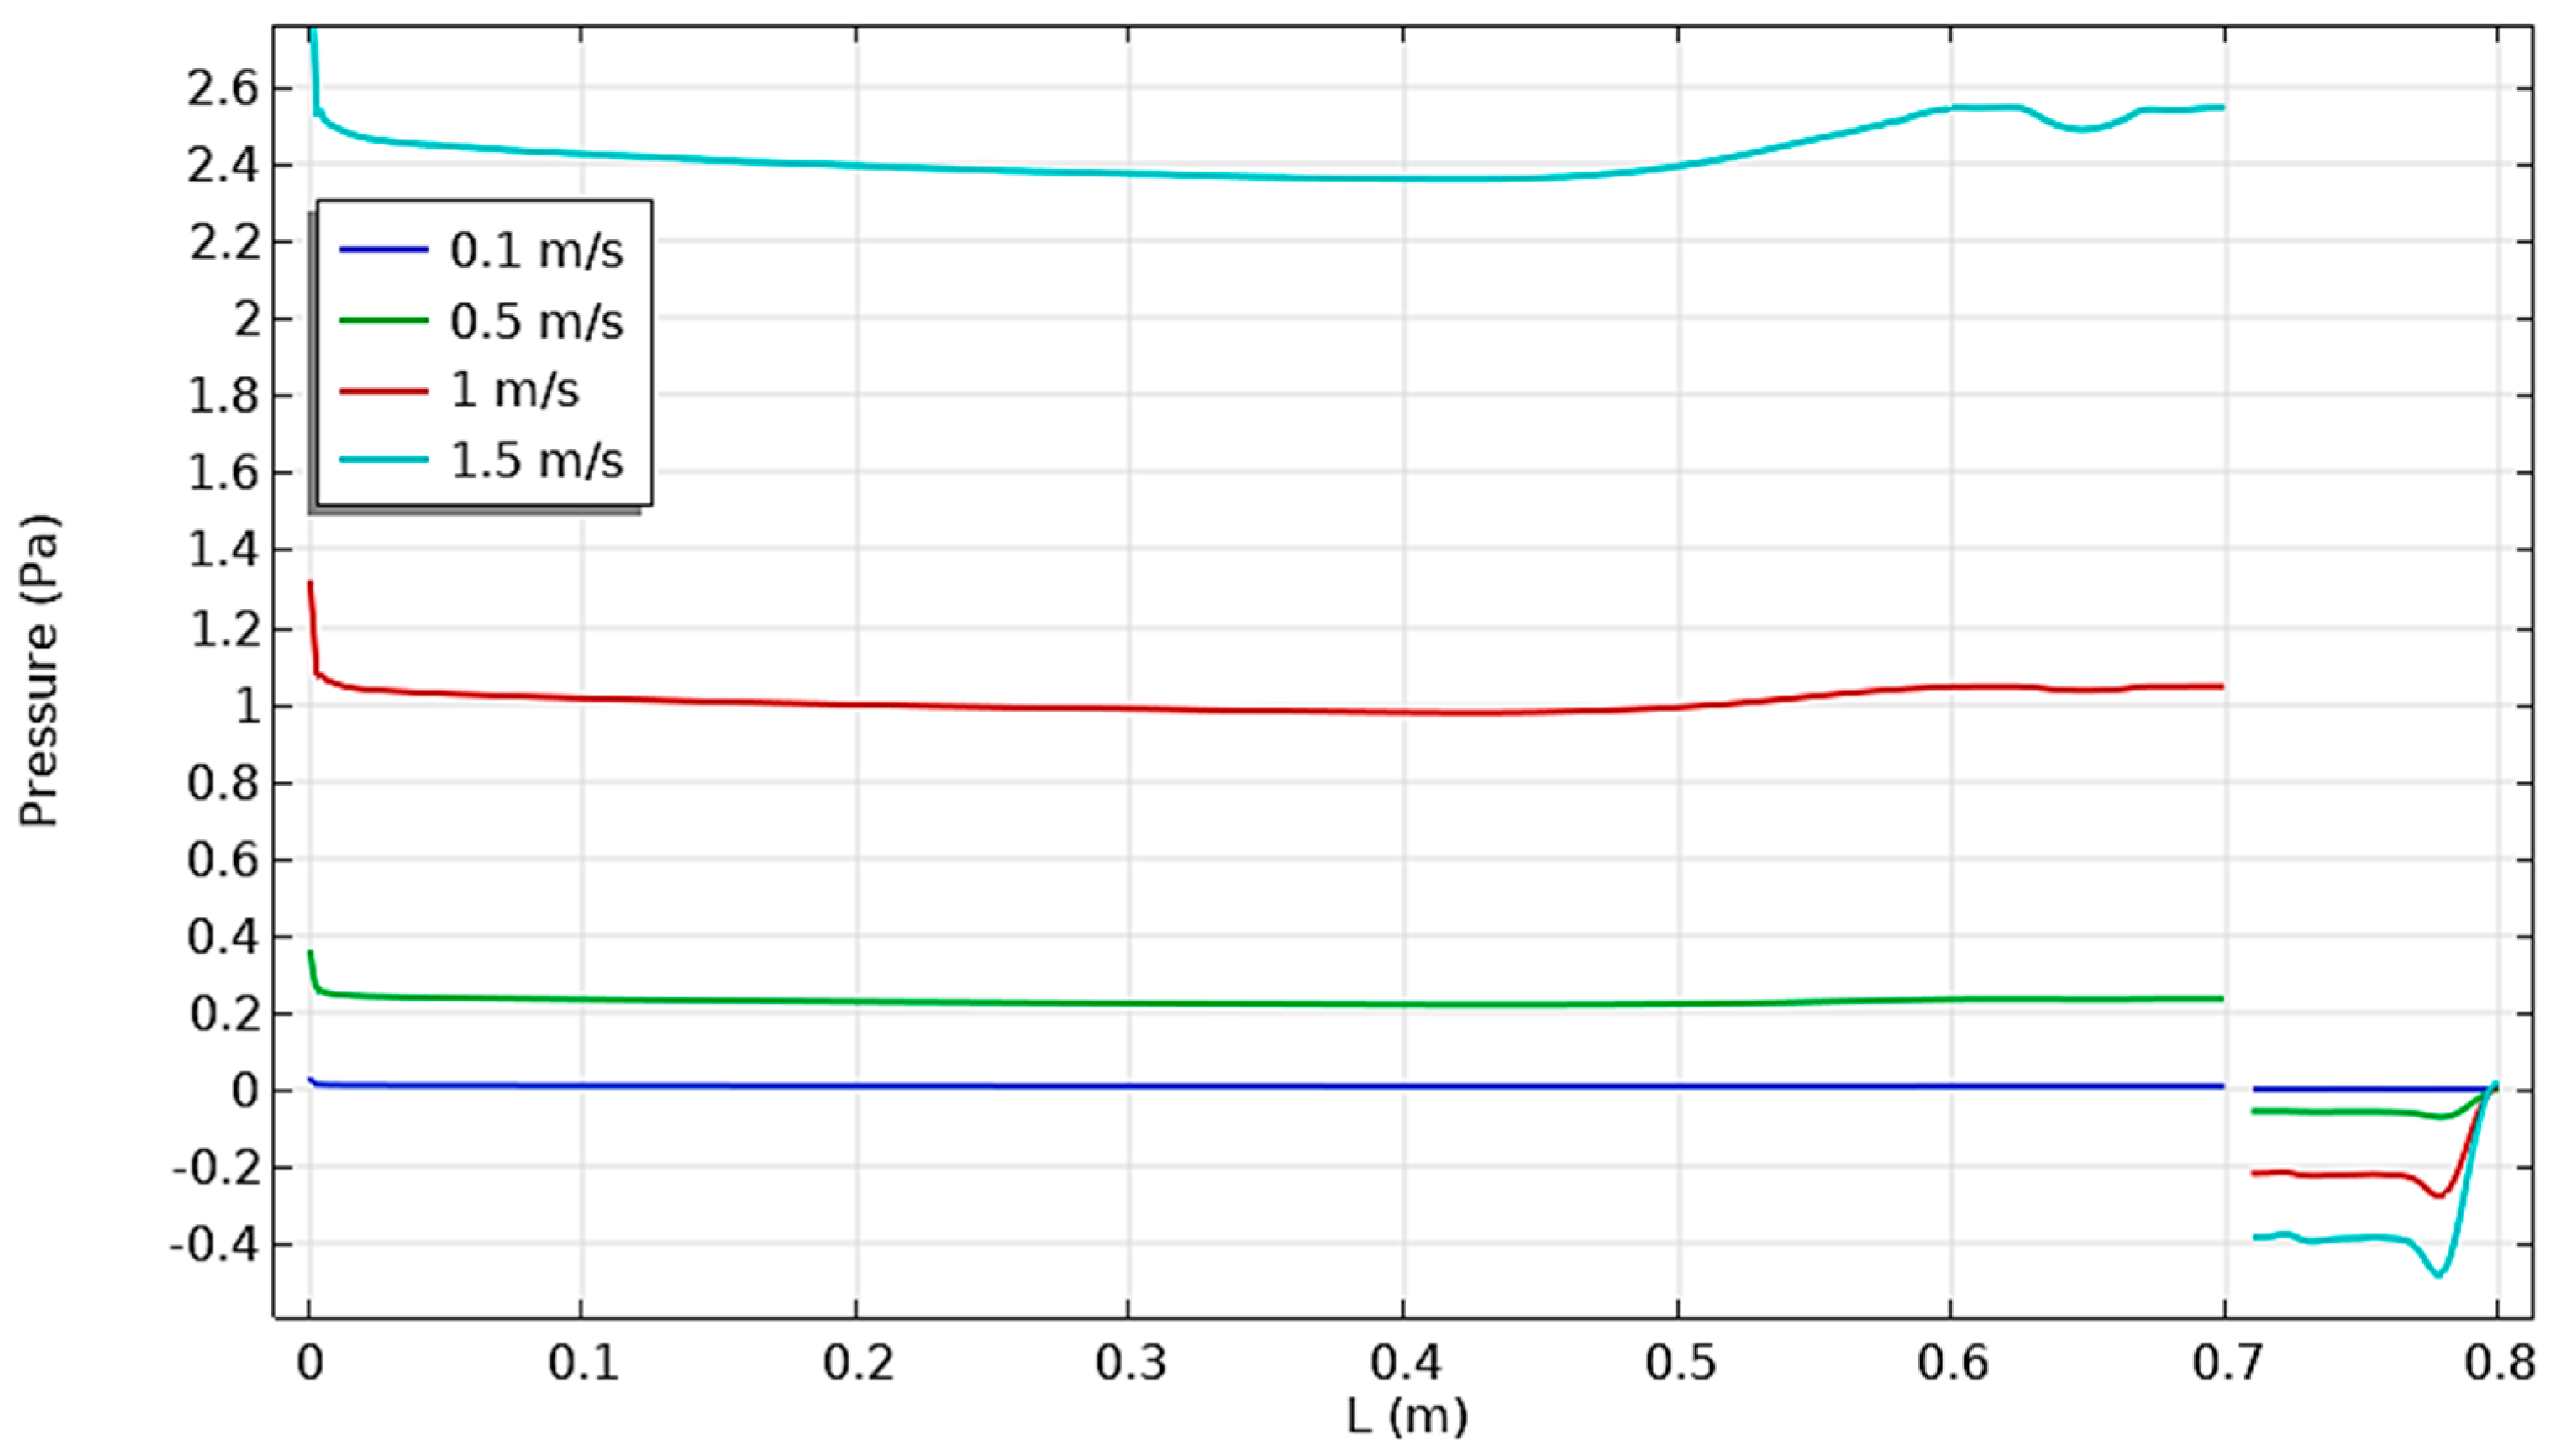
There is a pressure difference when the channel meets the hollow, higher than anywhere else along the channel’s path.
Generally, the findings illustrate the effect of unheated baffles on temperature and recirculation by revealing considerable flow and temperature differences with changes in air velocity. The knowledge gathered can guide the development and improvement of various thermal systems. Future work can concentrate on improving the accuracy of the numerical model and investigating more intricate geometries and boundary conditions. A deeper insight would be gained by examining the effects of various thermal source sites, baffle forms, and variable airflow velocities. The simulation results can also be validated and improved through experimental validation, allowing for valuable applications in real-world circumstances.

Author Contributions

Conceptualization, F.L.R., A.M.R.A.-G., H.I.M. and A.A.; methodology, F.L.R., A.M.R.A.-G., H.I.M. and A.A.; formal analysis, F.L.R., A.M.R.A.-G., H.I.M. and A.A.; investigation, F.L.R., A.M.R.A.-G. and H.I.M.; resources, A.A.; data curation, F.L.R., A.M.R.A.-G. and H.I.M.; writing—original draft preparation, F.L.R., A.M.R.A.-G. and H.I.M.; writing—review and editing, F.L.R. and A.A.; visualization, F.L.R., A.M.R.A.-G., H.I.M. and A.A.; project administration, F.L.R. and A.A. All authors have read and agreed to the published version of the manuscript.

Funding

This research received no external funding.

Data Availability Statement

Data are contained within the article.

Conflicts of Interest

The authors declare no conflicts of interests.

References

  1. Al-aswadi, A.A.; Mohammed, H.A.; Shuaib, N.H.; Campo, A. Laminar Forced Convection Flow over a Backward Facing Step Using Nanofluids. Int. Commun. Heat Mass Transf. 2010, 37, 950–957. [Google Scholar] [CrossRef]
  2. Mohammed, H.A.; Al-Shamani, A.N.; Sheriff, J.M. Thermal and Hydraulic Characteristics of Turbulent Nanofluids Flow in a Rib–Groove Channel. Int. Commun. Heat Mass Transf. 2012, 39, 1584–1594. [Google Scholar] [CrossRef]
  3. Goldstein, R.J.; Eriksen, V.L.; Olson, R.M.; Eckert, E.R.G. Laminar Separation, Reattachment, and Transition of the Flow over a Downstream-Facing Step. J. Fluids Eng. 1970, 92, 732–739. [Google Scholar] [CrossRef]
  4. Ilis, G.G.; Mobedi, M.; Öztop, H.F. Heat Transfer Reduction Due to a Ceiling-Mounted Barrier in an Enclosure with Natural Convection. Heat Transf. Eng. 2011, 32, 429–438. [Google Scholar] [CrossRef]
  5. Louhibi, A.M.; Salhi, N.; Bouali, H.; Amghar, K. Numerical Analysis of Heat Transfer in a Channel with Inclined Baffles. Res. Invent. Int. J. Eng. Sci 2015, 4, 12–23. [Google Scholar]
  6. Yu, L.; Xue, M.-A.; Zhu, A. Numerical Investigation of Sloshing in Rectangular Tank with Permeable Baffle. J. Mar. Sci. Eng. 2020, 8, 671. [Google Scholar] [CrossRef]
  7. Mahapatra, S.K.; Sarkar, A.; Sarkar, A. Numerical Simulation of Opposing Mixed Convection in Differentially Heated Square Enclosure with Partition. Int. J. Therm. Sci. 2007, 46, 970–979. [Google Scholar] [CrossRef]
  8. Eleiwi, M.A.; Rashid, F.L.; Khalaf, A.F.; Tuama, S.A. Numerical Investigation of Conjugate Heat Transfer Between Spherical Solid Body and Fluid. Math. Model. Eng. Probl. 2022, 9, 491–497. [Google Scholar] [CrossRef]
  9. Rahman, M.; Parvin, S.; Rahim, N.; Hasanuzzaman, M.; Saidur, R. Simulation of mixed convection heat transfer in a horizontal channel with an open cavity containing a heated hollow cylinder. Heat Transf.—Asian Res. 2012, 41, 339–353. [Google Scholar] [CrossRef]
  10. Salhi, J.E.; Amghar, K.; Bouali, H.; Salhi, N. Combined Heat and Mass Transfer of Fluid Flowing through Horizontal Channel by Turbulent Forced Convection. Model. Simul. Eng. 2020, 2020, 1453893. [Google Scholar] [CrossRef]
  11. Alazwari, M.A.; Safaei, M.R. Combination Effect of Baffle Arrangement and Hybrid Nanofluid on Thermal Performance of a Shell and Tube Heat Exchanger Using 3-D Homogeneous Mixture Model. Mathematics 2021, 9, 881. [Google Scholar] [CrossRef]
  12. Valencia, A.; Calderon, W. Convective Heat Transfer in Plane Channels with Inline Mounted Rectangular Bars. Int. J. Numer. Methods Heat Fluid Flow 2004, 14, 866–878. [Google Scholar] [CrossRef]
  13. Kumar, S.; Vengadesan, S. The Effect of Fin Oscillation in Heat Transfer Enhancement in Separated Flow over a Backward Facing Step. Int. J. Heat Mass Transf. 2019, 128, 954–963. [Google Scholar] [CrossRef]
  14. Stiriba, Y.; Grau, F.; Ferre, J.; Vernet, A. A numerical study of three-dimensional laminar mixed convection past an open cavity. Int. J. Heat Mass Transf. 2010, 53, 4797–4808. [Google Scholar] [CrossRef]
  15. Thao, P.B.; Truyen, D.C.; Phu, N.M. CFD Analysis and Taguchi-Based Optimization of the Thermohydraulic Performance of a Solar Air Heater Duct Baffled on a Back Plate. Appl. Sci. 2021, 11, 4645. [Google Scholar] [CrossRef]
  16. Du, S.-Q.; Bilgen, E.; Vasseur, P. Mixed Convection Heat Transfer in Open Ended Channels with Protruding Heaters. Heat Mass Transf. 1998, 34, 263–270. [Google Scholar] [CrossRef]
  17. How, S.P.; Hsu, T.H. Transient Mixed Convection in a Partially Divided Enclosure. Comput. Math. Appl. 1998, 36, 95–115. [Google Scholar] [CrossRef]
  18. Hsu, T.H.; How, S.P. Mixed Convection in an Enclosure with a Heat-Conducting Body. Acta Mech. 1999, 133, 87–104. [Google Scholar] [CrossRef]
  19. Chung, C.-K.; Wu, C.-Y.; Shih, T.R. Effect of Baffle Height and Reynolds Number on Fluid Mixing. Microsyst. Technol. 2008, 14, 1317–1323. [Google Scholar] [CrossRef]
  20. Radhakrishnan, T.V.; Joseph, G.; Balaji, C.; Venkateshan, S.P. Effect of Baffle on Convective Heat Transfer from a Heat Generating Element in a Ventilated Cavity. Heat Mass Transf. 2009, 45, 1069–1082. [Google Scholar] [CrossRef]
  21. Asif, M.R.; Hossain, M.S.; Hossain, K.A. Heat Transfer in a Rectangular Enclosure with Baffles. ARPN J. Eng. Appl. Sci. 2011, 6, 29–41. [Google Scholar]
  22. Sripattanapipat, S.; Promvonge, P. Numerical Analysis of Laminar Heat Transfer in a Channel with Diamond-Shaped Baffles. Int. Commun. Heat Mass Transf. 2009, 36, 32–38. [Google Scholar] [CrossRef]
  23. Sriromreun, P.; Thianpong, C.; Promvonge, P. Experimental and Numerical Study on Heat Transfer Enhancement in a Channel with Z-Shaped Baffles. Int. Commun. Heat Mass Transf. 2012, 39, 945–952. [Google Scholar] [CrossRef]
  24. Hamzah, H.K.; Ali, F.H.; Hatami, M.; Jing, D. Effect of Two Baffles on MHD Natural Convection in U-Shape Superposed by Solid Nanoparticle Having Different Shapes. J. Appl. Comput. Mech. 2020, 6, 1200–1209. [Google Scholar]
  25. Sabbar, W.A.; Ismael, M.A.; Almudhaffar, M. Fluid-Structure Interaction of Mixed Convection in a Cavity-Channel Assembly of Flexible Wall. Int. J. Mech. Sci. 2018, 149, 73–83. [Google Scholar] [CrossRef]
  26. Heshmati, A.; Mohammed, H.A.; Darus, A.N. Mixed Convection Heat Transfer of Nanofluids over Backward Facing Step Having a Slotted Baffle. Appl. Math. Comput. 2014, 240, 368–386. [Google Scholar] [CrossRef]
  27. Ashraf, M.; Ullah, Z.; Zia, S.; Alharbi, S.O.; Baleanu, D.; Khan, I. Analysis of the Physical Behavior of the Periodic Mixed-Convection Flow around a Nonconducting Horizontal Circular Cylinder Embedded in a Porous Medium. J. Math. 2021, 2021, 8839146. [Google Scholar] [CrossRef]
  28. Yaseen, D.T.; Ismael, M.A. Effect of Deformable Baffle on the Mixed Convection of Non-Newtonian Fluids in A Channel-Cavity. Basrah J. Eng. Sci. 2020, 20, 18–26. [Google Scholar] [CrossRef]
  29. Yasina, N.J.; Jehhefb, K.A.; Shakirc, A.M. Experimental and Numerical Study of Mixed Convection in a Partially Opened Cavity with Tilted Baffle. Univ. Thi-Qar J. Eng. Sci. 2019, 10, 182–193. [Google Scholar]
  30. Da Silva, A.; Fontana, É.; Mariani, V.C.; Marcondes, F. Numerical Investigation of Several Physical and Geometric Parameters in the Natural Convection into Trapezoidal Cavities. Int. J. Heat Mass Transf. 2012, 55, 6808–6818. [Google Scholar] [CrossRef]
  31. Al-Hafidh, M.H.; Mohammed, H. Natural Convection of Nanofluid in Cylindrical Enclosure Filled with Porous Media. J. Energy Power Eng. 2013, 7, 2263–2272. [Google Scholar]
  32. Kumar, A.; Kim, M.-H. Convective Heat Transfer Enhancement in Solar Air Channels. Appl. Therm. Eng. 2015, 89, 239–261. [Google Scholar] [CrossRef]
  33. Mohammed, H.I.; Giddings, D. Natural Convection Heat and Mass Transfer in the Vertical Cylindrical Porous Channel under the Effects of Time-Periodic Boundary Condition. J. Heat Transf. 2019, 141, 122503. [Google Scholar] [CrossRef]
  34. Kim, K.M.; Kim, S.H.; Lim, S.T.; Kim, T.; Jerng, D.-W.; Ahn, H.S. Geometrical effect of natural convection in an air channel with a cavity at the turning section on thermal behavior and heat removal performance. Int. J. Heat Mass Transf. 2023, 203, 123792. [Google Scholar] [CrossRef]
  35. Kato, Y.; Guo, G.; Kamigaki, M.; Fujimoto, K.; Kawaguchi, M.; Nishida, K.; Hongou, H.; Koutoku, M.; Yokohata, H.; Sumi, S.; et al. Correlation Between Wall Heat Transfer and Characteristics of Pulsating Flow in A Rectangular Tube toward an Automobile Exhaust System. In Proceedings of the 8th World Congress on Mechanical, Chemical, and Material Engineering, Prague, Czech Republic, 31 July–2 August 2022. [Google Scholar]
  36. Khattak, Z.; Muhammad, H.A. Thermal analysis and parametric optimization of plate fin heat sinks under forced air convection. Therm. Sci. 2022, 26, 629–639. [Google Scholar] [CrossRef]
  37. Mothilal, T.; Pitchandi, K. Influence of inlet velocity of air and solid particle feed rate on holdup mass and heat transfer characteristics in cyclone heat exchanger. J. Mech. Sci. Technol. 2015, 29, 4509–4518. [Google Scholar] [CrossRef]
  38. Kolchanova, E.A.; Sagitov, R. Throughflow Effect on Local and Large-scale Penetrative Convection in Superposed Air-porous Layer with Internal Heat Source Depending on Solid Fraction. Microgravity Sci. Technol. 2022, 34, 52. [Google Scholar] [CrossRef]
  39. Mohammed, A.A.; Mohammed, A.A.; Channapattana, S.V. Numerical Study of Convection Air Currents around a Hot Cylinder Inside a Triangular Cavity. Al-Nahrain J. Eng. Sci. 2023, 26, 102–115. [Google Scholar] [CrossRef]
  40. Gilago, M.C.; Mugi, V.R.; V.P., C.; S., S. Evaluating the performance of an indirect solar dryer and drying parameters of pineapple: Comparing natural and forced convection. J. Therm. Anal. Calorim. 2023, 148, 3701–3709. [Google Scholar] [CrossRef]
  41. Elangovan, E.; Natarajan, S.K. Convective and evaporative heat transfer coefficients during drying of ivy gourd under natural and forced convection solar dryer. Environ. Sci. Pollut. Res. 2023, 30, 10469–10483. [Google Scholar] [CrossRef]
  42. Osodo, B.O.; Nyaanga, D.M.; Kiplagat, J.K.; Muguthu, J. Optimum Air Velocity, Air Temperature and Maize Layer Thickness for Highest Moisture Removal Rate and Drying Efficiency in a Forced Convection Grain Dryer. Am. J. Food Sci. Technol. 2018, 6, 263–273. [Google Scholar]
  43. Patankar, S.V.; Liu, C.H.; Sparrow, E.M. Fully Developed Flow and Heat Transfer in Ducts Having Streamwise-Periodic Variations of Cross-Sectional Area. J. Heat Transf. 1977, 99, 180–186. [Google Scholar] [CrossRef]
  44. Al-Jibory, M.W.; Rashid, F.L.; Talib, S.M. Numerical Investigation of Heat Transfer Enhancement in Ribbed Elliptical Passage. J. Eng. Appl. Sci. 2018, 13, 7223–7234. [Google Scholar]
  45. Wang, H.; Chen, J.; Dai, P.; Zhang, F.; Li, Q. Simulation and Experimental Study of the Influence of the Baffles on Solar Chimney Power Plant System. Processes 2021, 9, 902. [Google Scholar] [CrossRef]
  46. Ashraf, M.; Ilyas, A.; Ullah, Z.; Abbas, A. Periodicmagnetohydrodynamic mixed convection flow along a cone embedded in a porous medium with variable surface temperature. Ann. Nucl. Energy 2022, 175, 109218. [Google Scholar] [CrossRef]
  47. Berner, C.; Durst, F.; McEligot, D.M. Flow Around Baffles. J. Heat Transf. 1984, 106, 743–749. [Google Scholar] [CrossRef]
  48. Sivakumar, V.; Sivasankaran, S. Mixed Convection in an Inclined Lid-Driven Cavity with Non-Uniform Heating on Both Sidewalls. J. Appl. Mech. Tech. Phys. 2014, 55, 634–649. [Google Scholar] [CrossRef]
  49. Stiriba, Y. Analysis of the flow and heat transfer characteristics for assisting incompressible laminar flow past an open cavity. Int. Commun. Heat Mass Transf. 2008, 35, 901–907. [Google Scholar] [CrossRef]
  50. Ashraf, M.; Ullah, Z. Effects of variable density on oscillatory flow around a non-conducting horizontal circular cylinder. AIP Adv. 2020, 10, 015020. [Google Scholar] [CrossRef]
  51. AL-Hafidh, M.H.; Mohammed, H.I. Numerical Investigation of Natural Convection Radiation and Magnetohydrodynamic in Vertical Porous Cylindrical Channel. J. Eng. 2011, 17, 1600–1613. [Google Scholar] [CrossRef]
  52. Elshafei, E.A.M.; Awad, M.M.; El-Negiry, E.; Ali, A.G. Heat Transfer and Pressure Drop in Corrugated Channels. Energy 2010, 35, 101–110. [Google Scholar] [CrossRef]
Figure 1. Geometric passage flow diagram (all dimensions are measured in units of meters (m)).
Energies 17 01209 g001
Figure 2. Mesh employed in this case study; (a) overview of the model and (b) a close up of the region of interest.
Energies 17 01209 g002
Figure 3. Velocity contours comparison with the study by Salhi et al. (2020) [10].
Energies 17 01209 g003
Figure 4. Isotherm curve at various inlet velocities.
Energies 17 01209 g004aEnergies 17 01209 g004b
Figure 5. Different inlet velocities’ contours of the 2D passage temperature.
Energies 17 01209 g005aEnergies 17 01209 g005b
Figure 6. Two-dimensional inlet velocity contours.
Energies 17 01209 g006aEnergies 17 01209 g006b
Figure 7. Contours of the passage pressure streamline at various inlet velocities.
Energies 17 01209 g007
Figure 8. Velocities distribution at various inlet velocities when the y-axis of the passage flow is positive.
Energies 17 01209 g008
Figure 9. Pressure distribution along the y-axis for a range of inflow velocities.
Energies 17 01209 g009aEnergies 17 01209 g009b
Figure 10. Upper side of the vertical position passage flow temperature distribution for different inlet flows.
Energies 17 01209 g010aEnergies 17 01209 g010b
Figure 11. Cavity velocity profile along the lower side vertical position for various inflow speeds.
Energies 17 01209 g011aEnergies 17 01209 g011b
Figure 12. Cavity pressure distribution along the lower side vertical position for a range of inflow velocities.
Energies 17 01209 g012aEnergies 17 01209 g012b
Figure 13. Cavity temperature distribution along the lower side vertical position for a range of input speeds.
Energies 17 01209 g013aEnergies 17 01209 g013b
Figure 14. The local Nusselt number in the cavity along the lower side vertical position for a range of inflow velocities.
Energies 17 01209 g014
Figure 15. The local velocity profile in the hollow neck at different intake speeds.
Energies 17 01209 g015
Figure 16. Cavity neck pressure at various inflow velocities.
Energies 17 01209 g016
Figure 17. Local temperature in cavity neck at various velocities.
Energies 17 01209 g017
Figure 18. Cavity neck Nusselt number for different inflow velocities.
Energies 17 01209 g018
Figure 19. Profile of velocity in outlet passage flow at various inlet velocities.
Energies 17 01209 g019
Figure 20. Profile of Temperature in outlet passage flow at various inlet velocities.
Energies 17 01209 g020
Figure 21. Profile of Density in outlet passage flow at various inlet velocities.
Energies 17 01209 g021
Table 1. Geometry and parameters of flow.
SymbolValueDescription
D120 mmTube diameter
L800 mmTube length
W100 mmCavity width
H70 mmHeight of cavity
wb110 mmBaffle width
Lb120 mmBaffle height
Lb240 mmBaffle length
R20 mmHeat source’s spherical radius inside cavity
Tin20 °CFlow temperature at the inlet
Vin0.1–1.5 m/sInlet velocity
Pw20 WPower of heated source
Table 2. Independent grid test for the studied domain.
Number of
Elements
Average Nusselt
Number
Γ i + 1 Γ i Γ i + 1 %
52035.65--
92665.690.708
18,1965.7721.441
66,7675.7770.086
Table 3. Comparison between the Nu values as a function of Re for the previous experimental work of Elshafei et al. [52], and the model applied in the present study.
Nusselt Number
ReExp. of Elshafei et al. [52]Present ModelDifference
34001613−18.8%
41002222.5+2.3%
50003132+3.2%
60003841+7.9%
68004145+9.8%
80005053+6.0%
95005559+7.3%
FigureDescriptionKey Findings
Figure 4Hollow structure with open ducts, thermal energy sources, and an unheated baffle. Includes isotherm contours representing different air velocities.Convection dominant in cavity; forced convection prevalent in channel; temperature decreases gradually from thermal sources to duct.
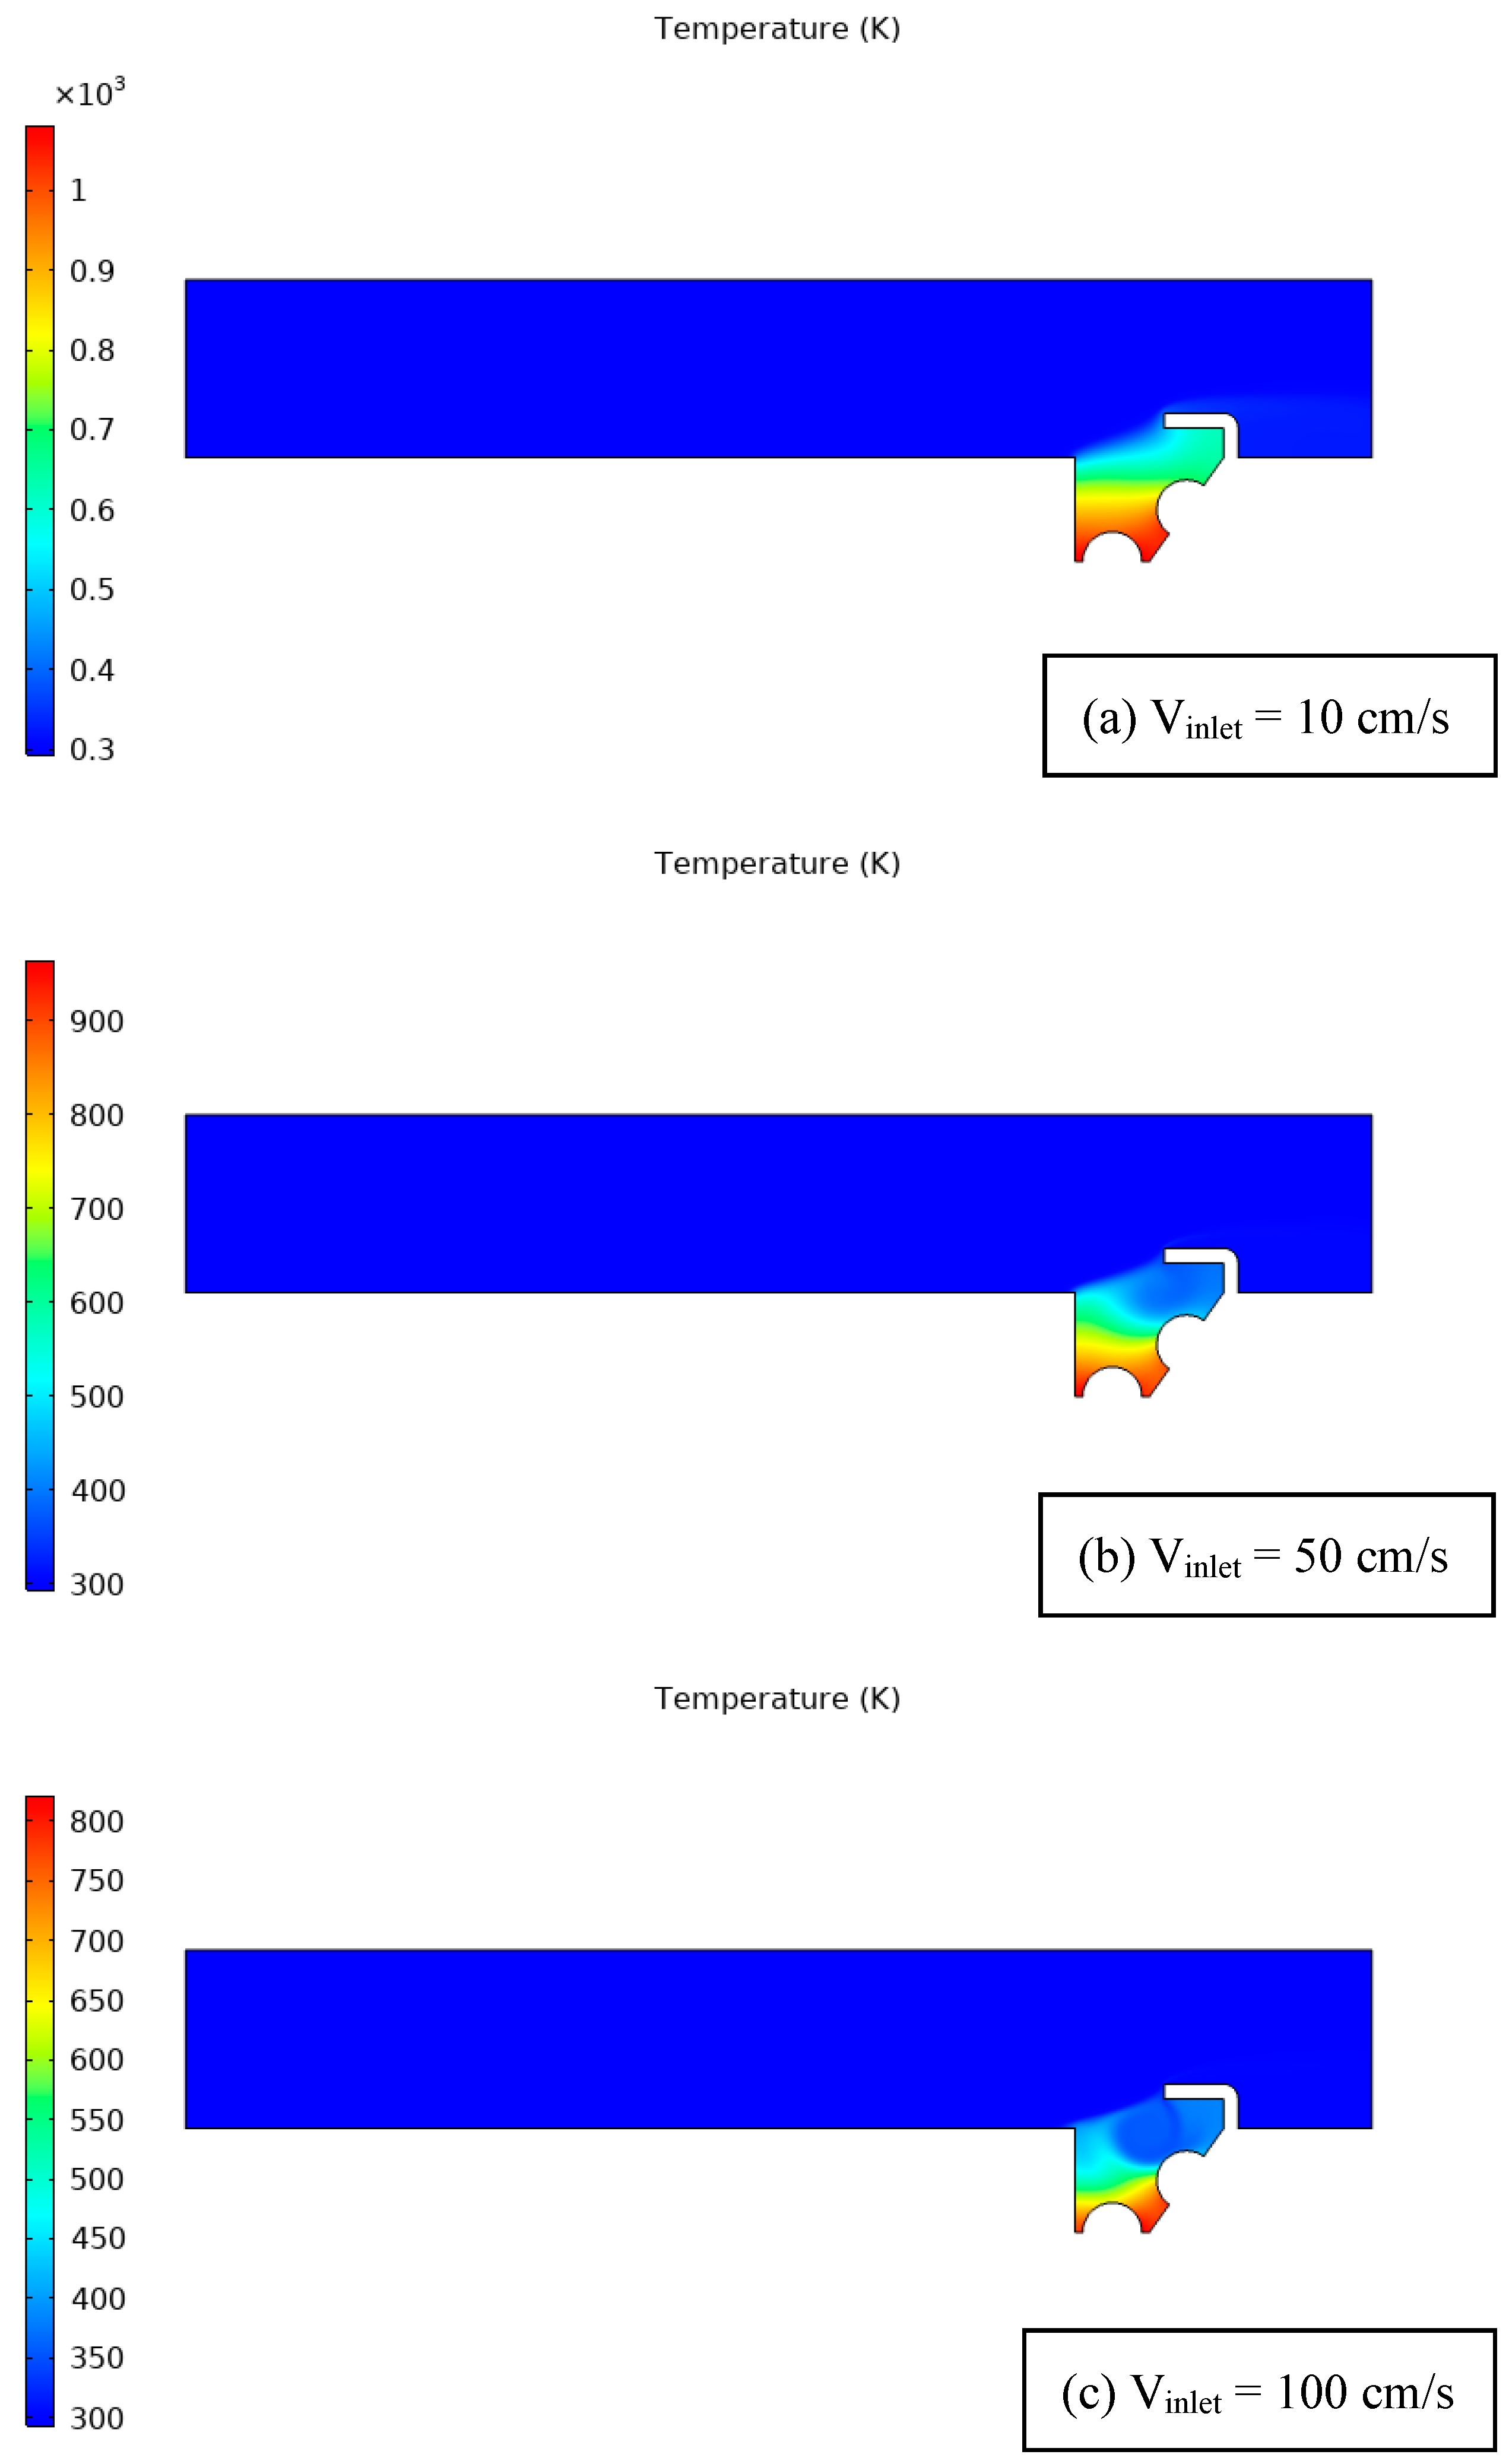
Figure 5Temperature distribution at different air velocities, two thermal sources, and a 90° unheated baffle.Higher velocities lead to more turbulent flow and improve convective heat transfer. Baffle redirects flow, affecting temperature gradients. Isotherms identify localized heating or cooling.
Figure 6Velocity profiles with two heat sources and a 90° unheated baffle at varying air velocities.Presence of heat sources creates recirculating air zones. Baffle enhances recirculation, improves heat transfer.
Figure 7Pressure streamlines in channel-cavity system with heat sources and unheated baffle.Baffle improves recirculation, impacting pressure distributions and flow dynamics.
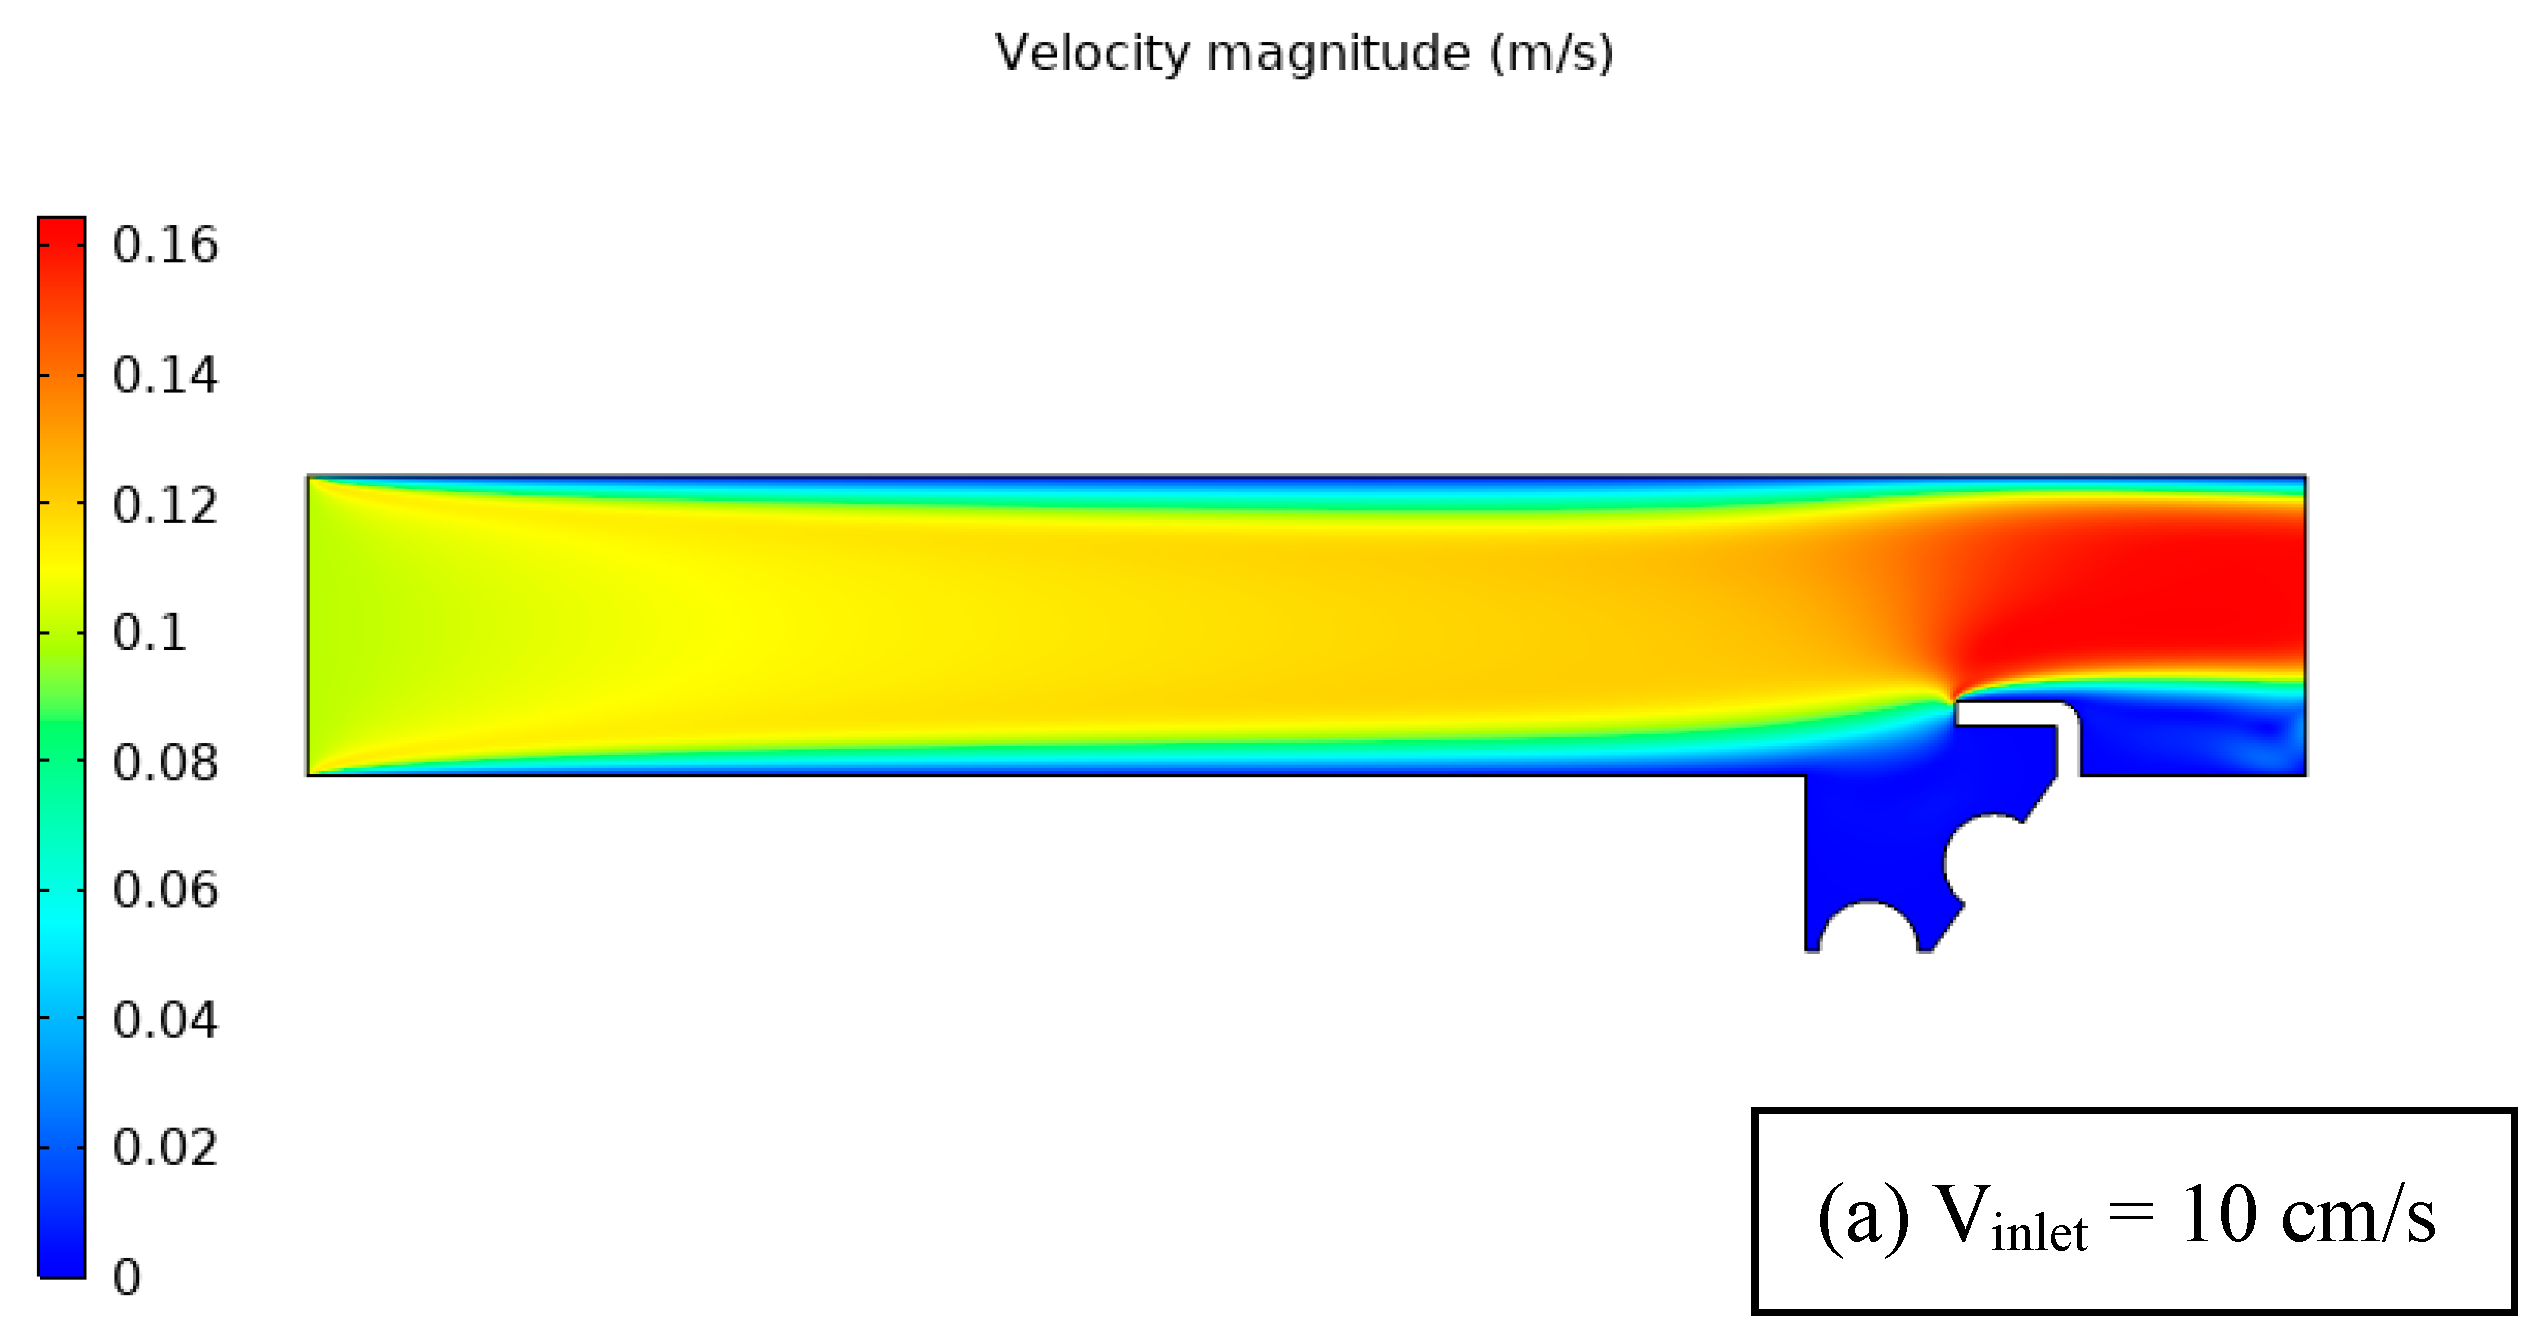
Figure 8Inlet velocity contours within cavity, considering two thermal sources and unheated baffle.Higher velocities lead to increased turbulence and more complex flow patterns. Baffle influences flow direction and velocity profiles.
Figure 9Pressure distribution along vertical axis in duct with thermal sources and unheated baffle.Higher inlet velocities result in increased turbulence and pressure fluctuations. Baffle enhances recirculation, impacts pressure distribution.
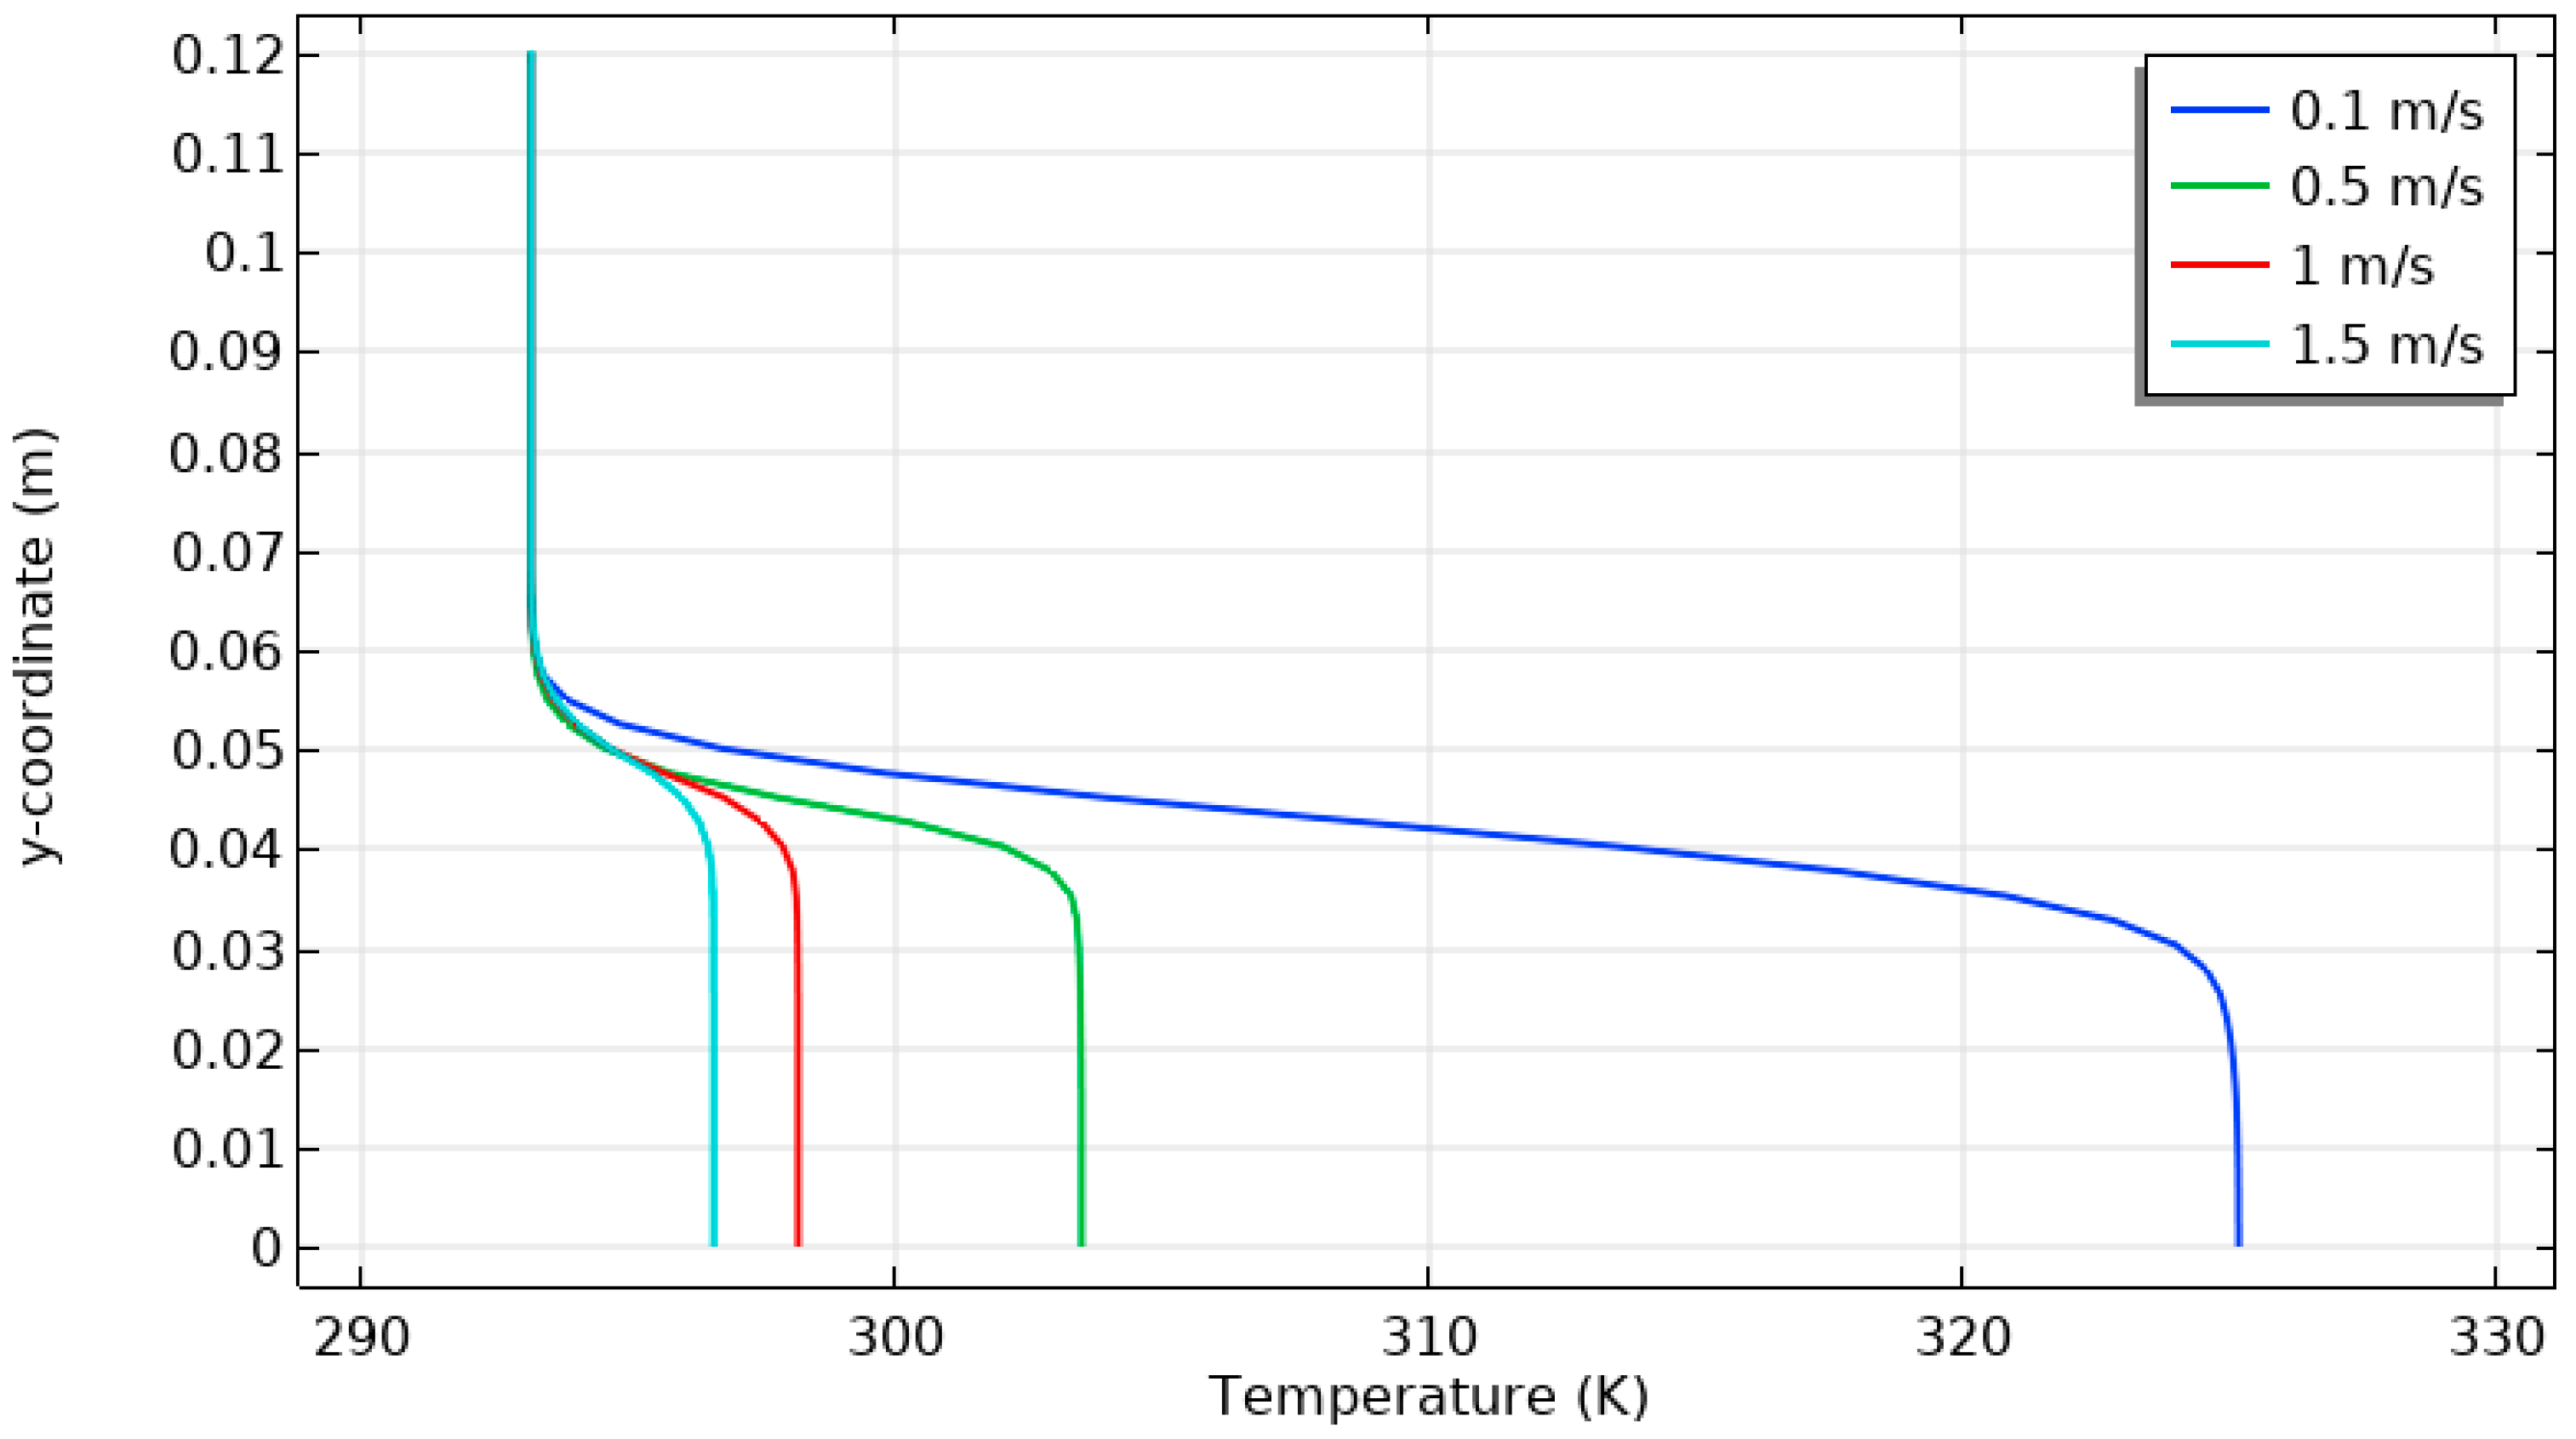
Figure 10Temperature distribution along vertical position in cavity with thermal sources and unheated baffle.Temperature rises with vertical position due to heat sources. Baffle influences recirculation, affects temperature distribution.
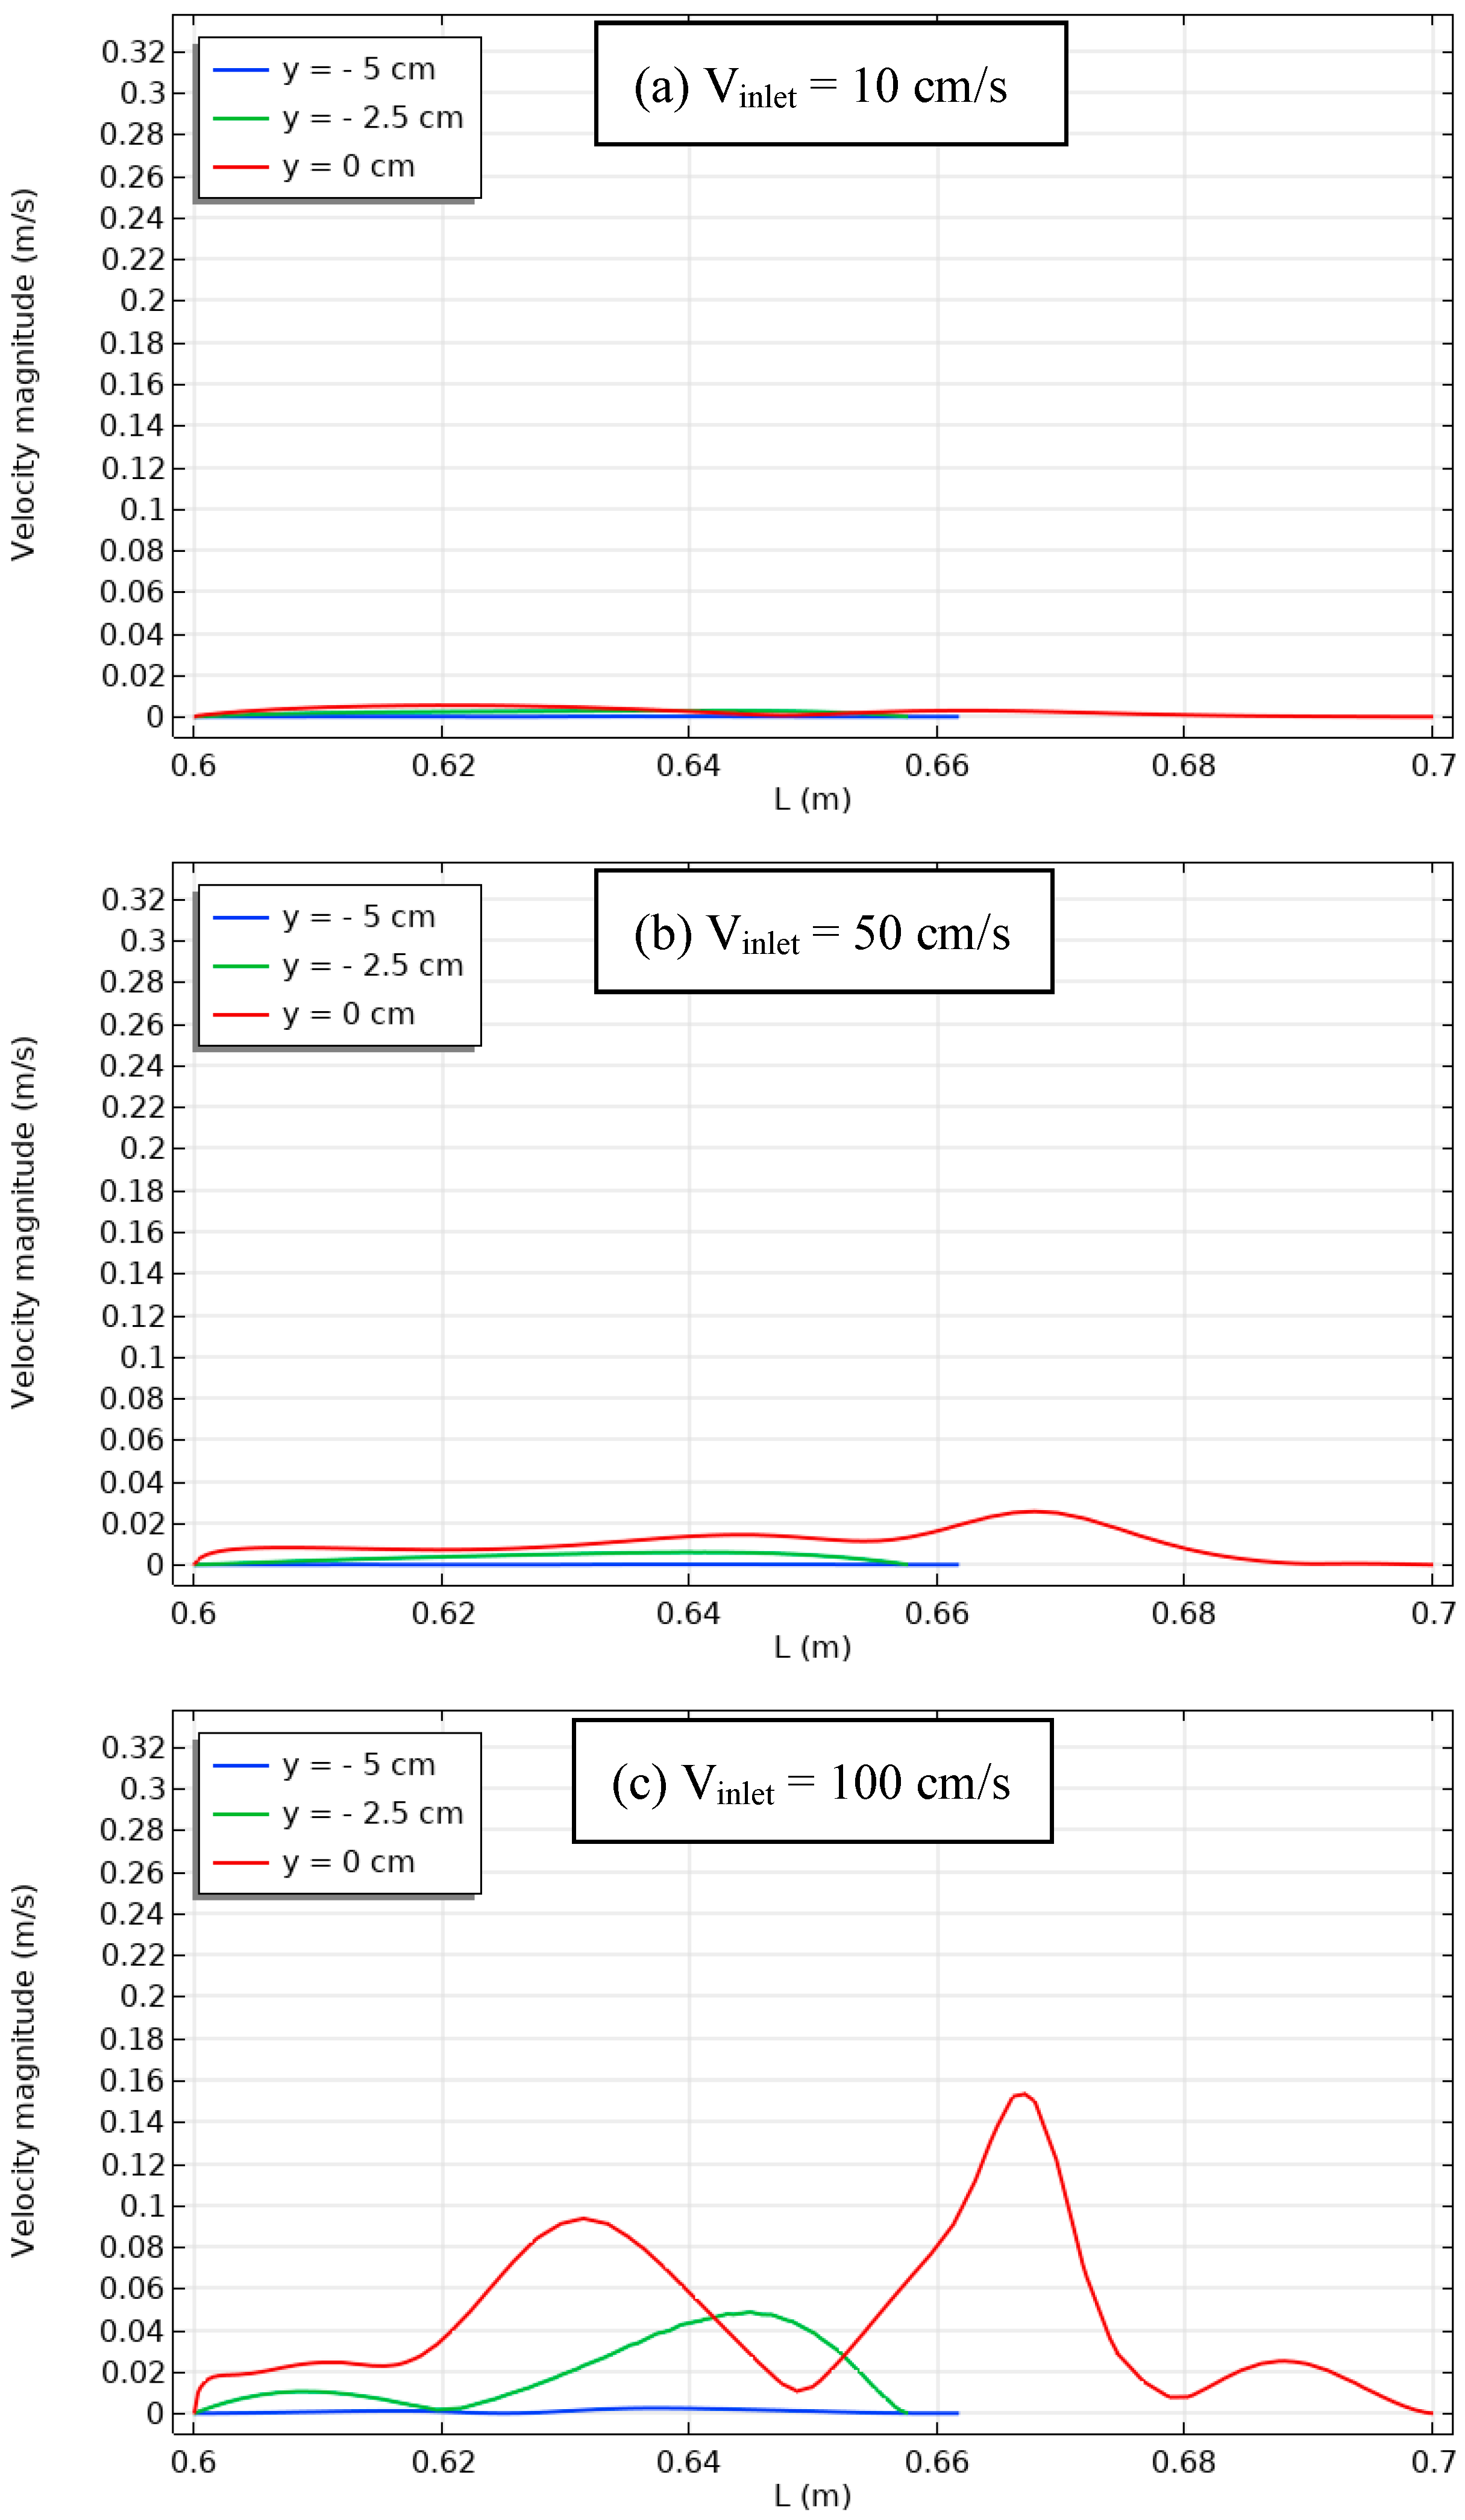
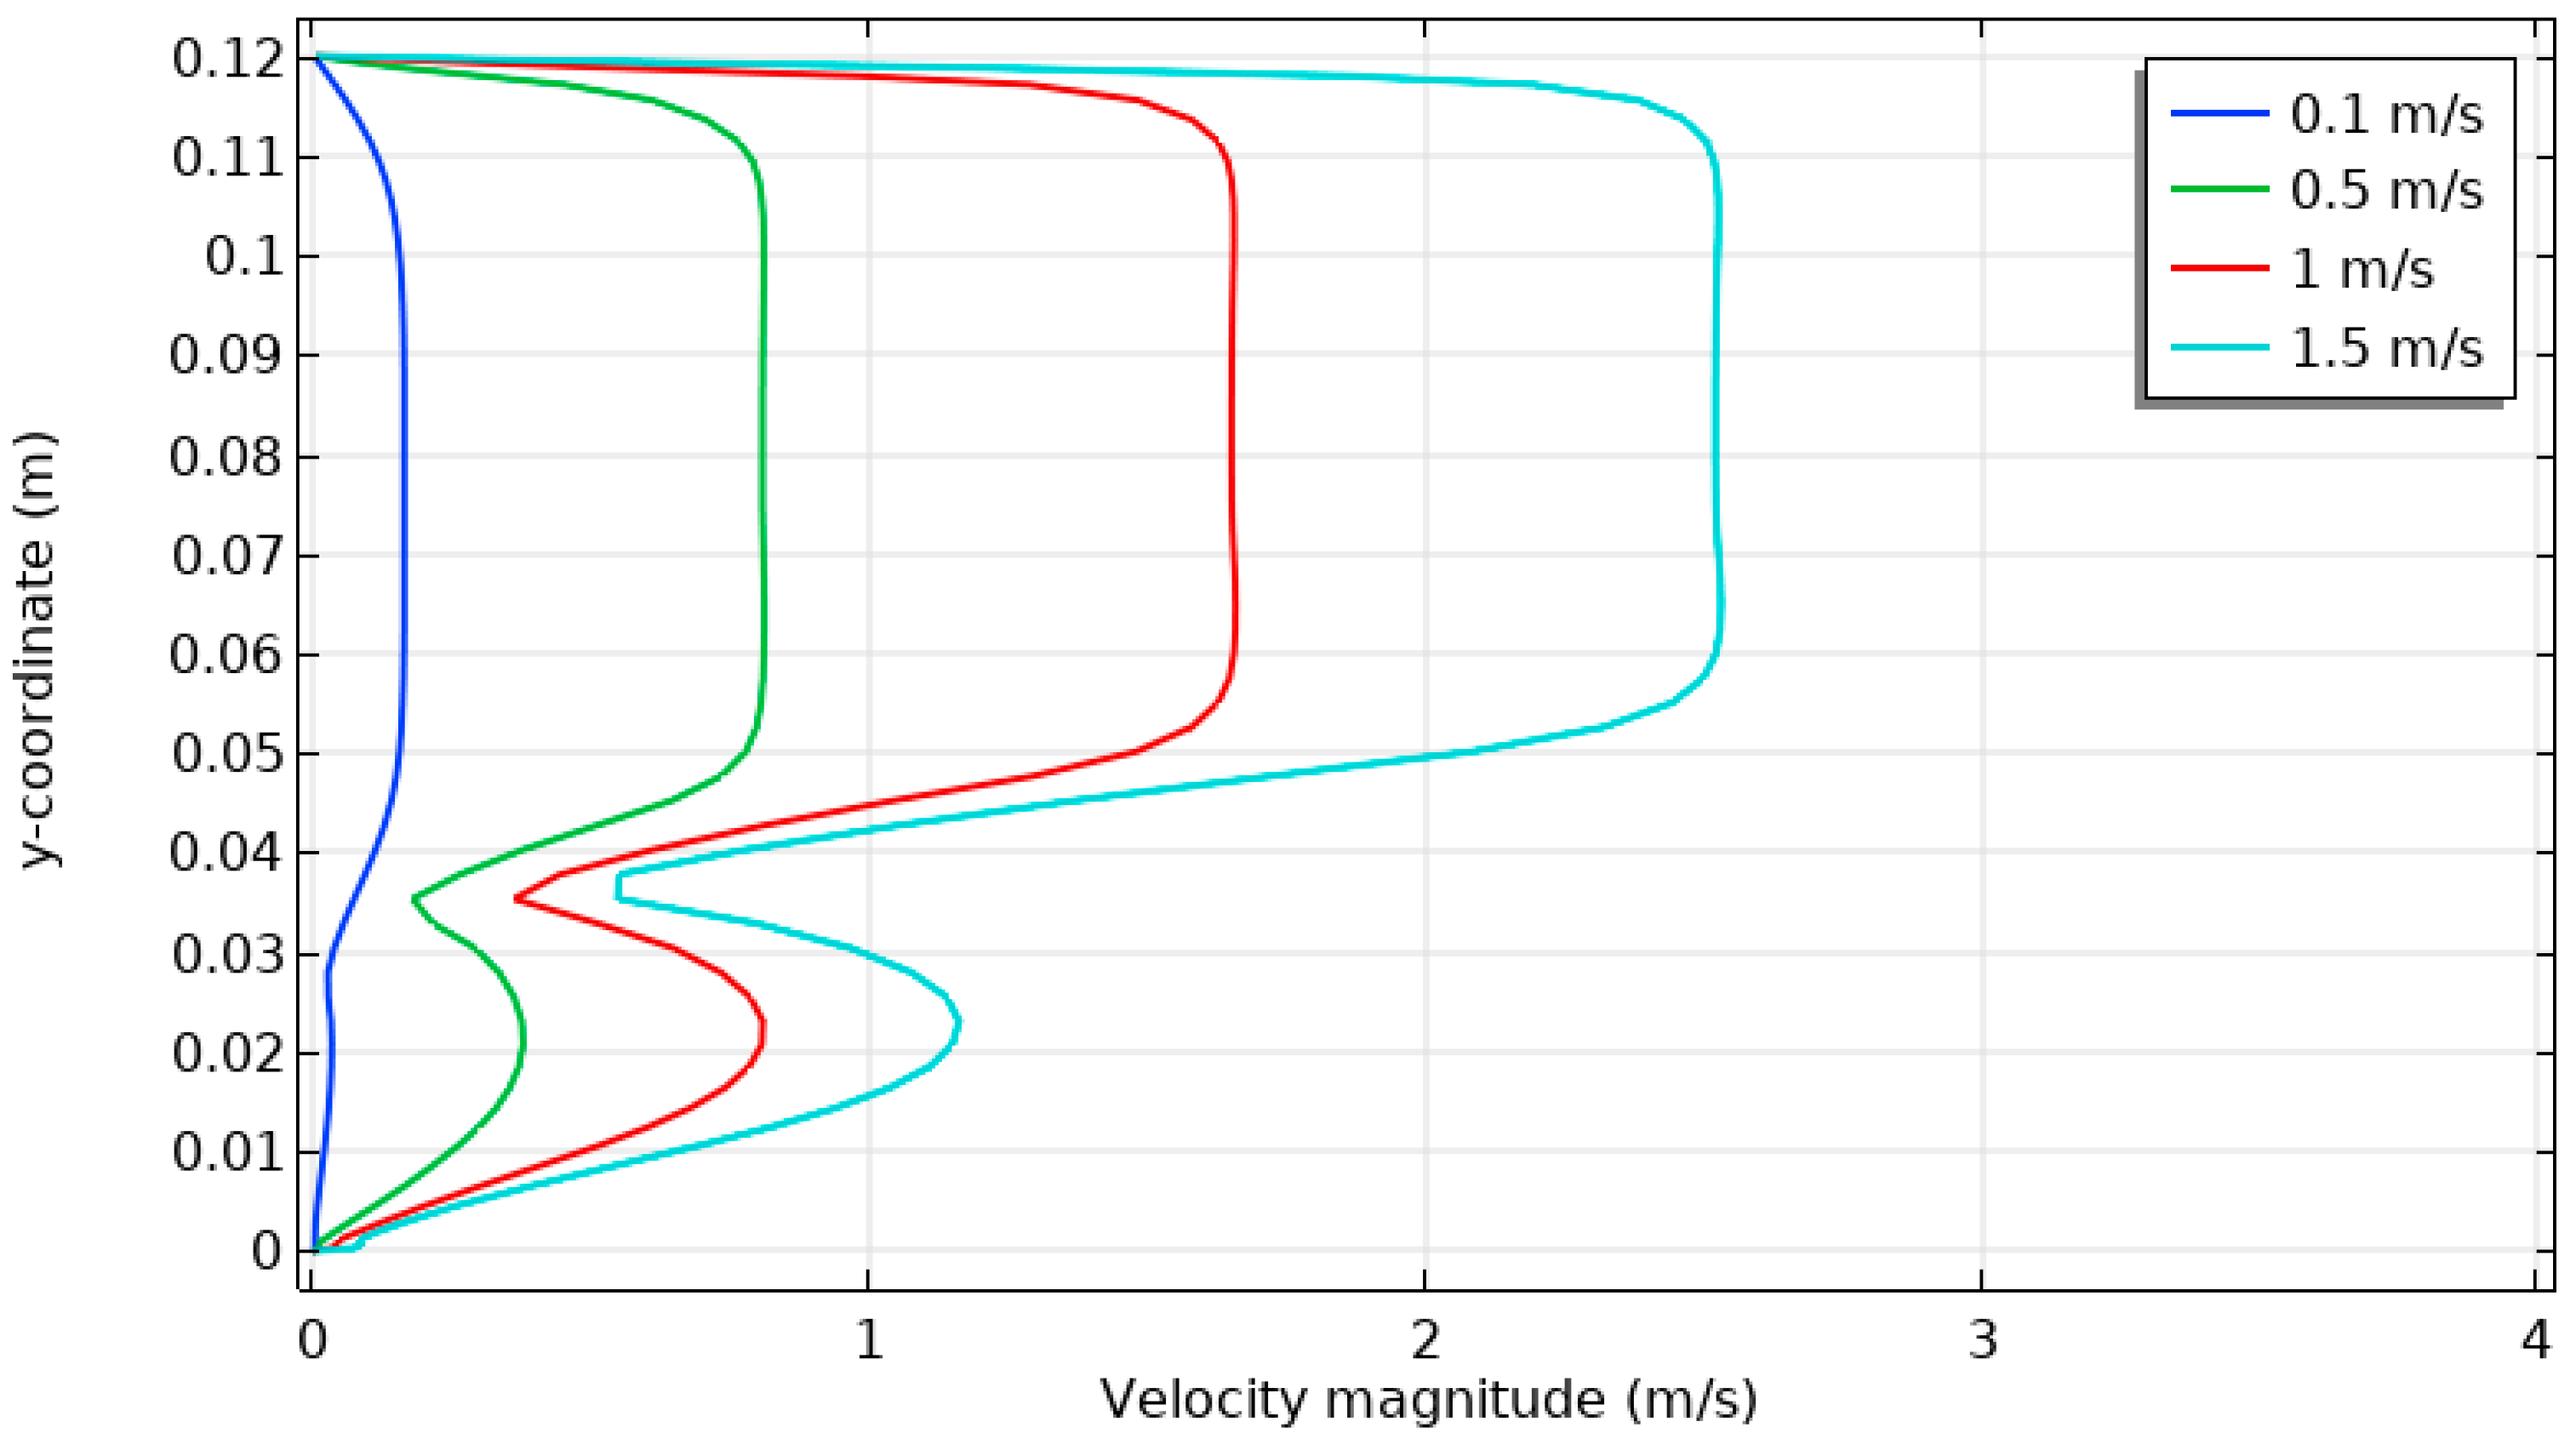
Figure 11Velocity distribution at bottom section of vertical position within cavity with thermal sources and unheated baffle.Lower velocities exhibit consistent distribution, higher velocities result in distinct velocity profiles. Baffle influences air movement.
Figure 12Pressure distribution over bottom section of vertical position within cavity with thermal sources and unheated baffle.Low velocities lead to lower pressure distribution. Increased inlet velocities improve pressure distribution. Baffle affects pressure profile.
Figure 13Temperature distribution within cavity with thermal sources and unheated baffle, varying inlet air velocities.Temperature increases with vertical position. Baffle improves recirculation, affects temperature distribution.
Figure 14The Nusselt number profile within cavity with thermal sources and unheated baffle, varying inlet air velocities.Higher velocities result in higher Nusselt numbers and improved heat transfer efficiency. Baffle enhances heat transfer.
Figure 15Velocity distribution within channel-cavity assembly with thermal sources and unheated baffle, varying inlet air velocities.Velocity fluctuates with inlet air velocity and presence of baffle. Baffle enhances local velocity, influences velocity profile.
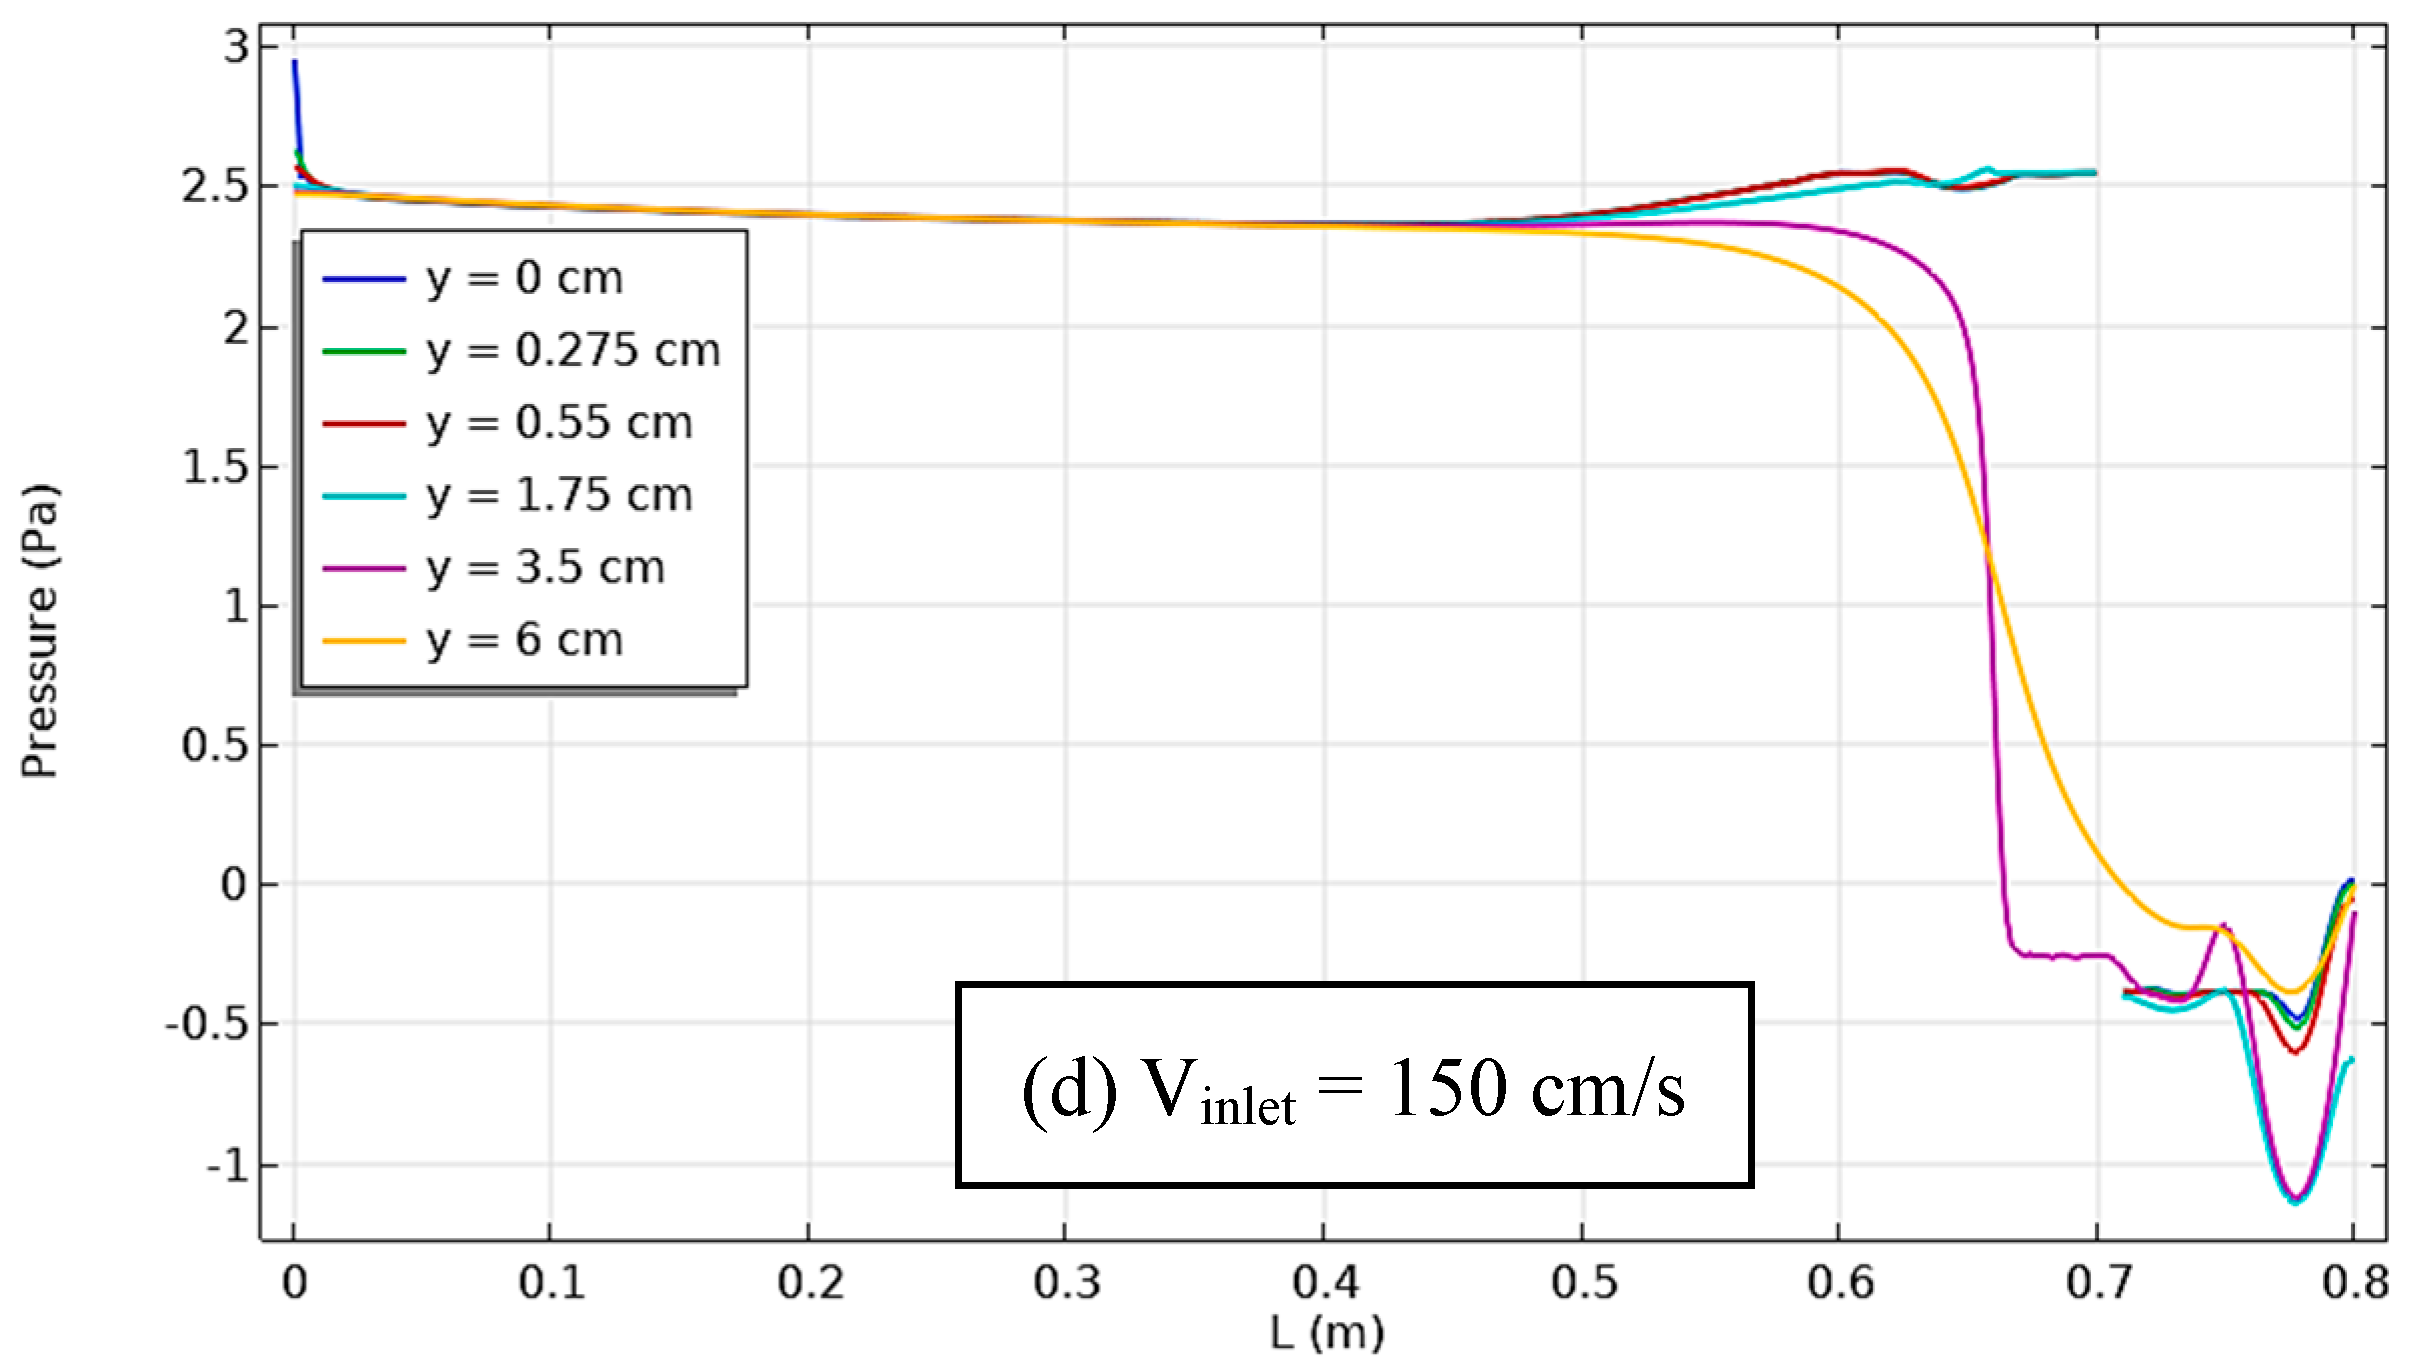
Figure 16Pressure distribution in duct-cavity configuration with thermal sources and unheated baffle, varying inlet air velocities.Pressure varies along cavity, decreases downstream. Baffle influences pressure distribution, recirculation.
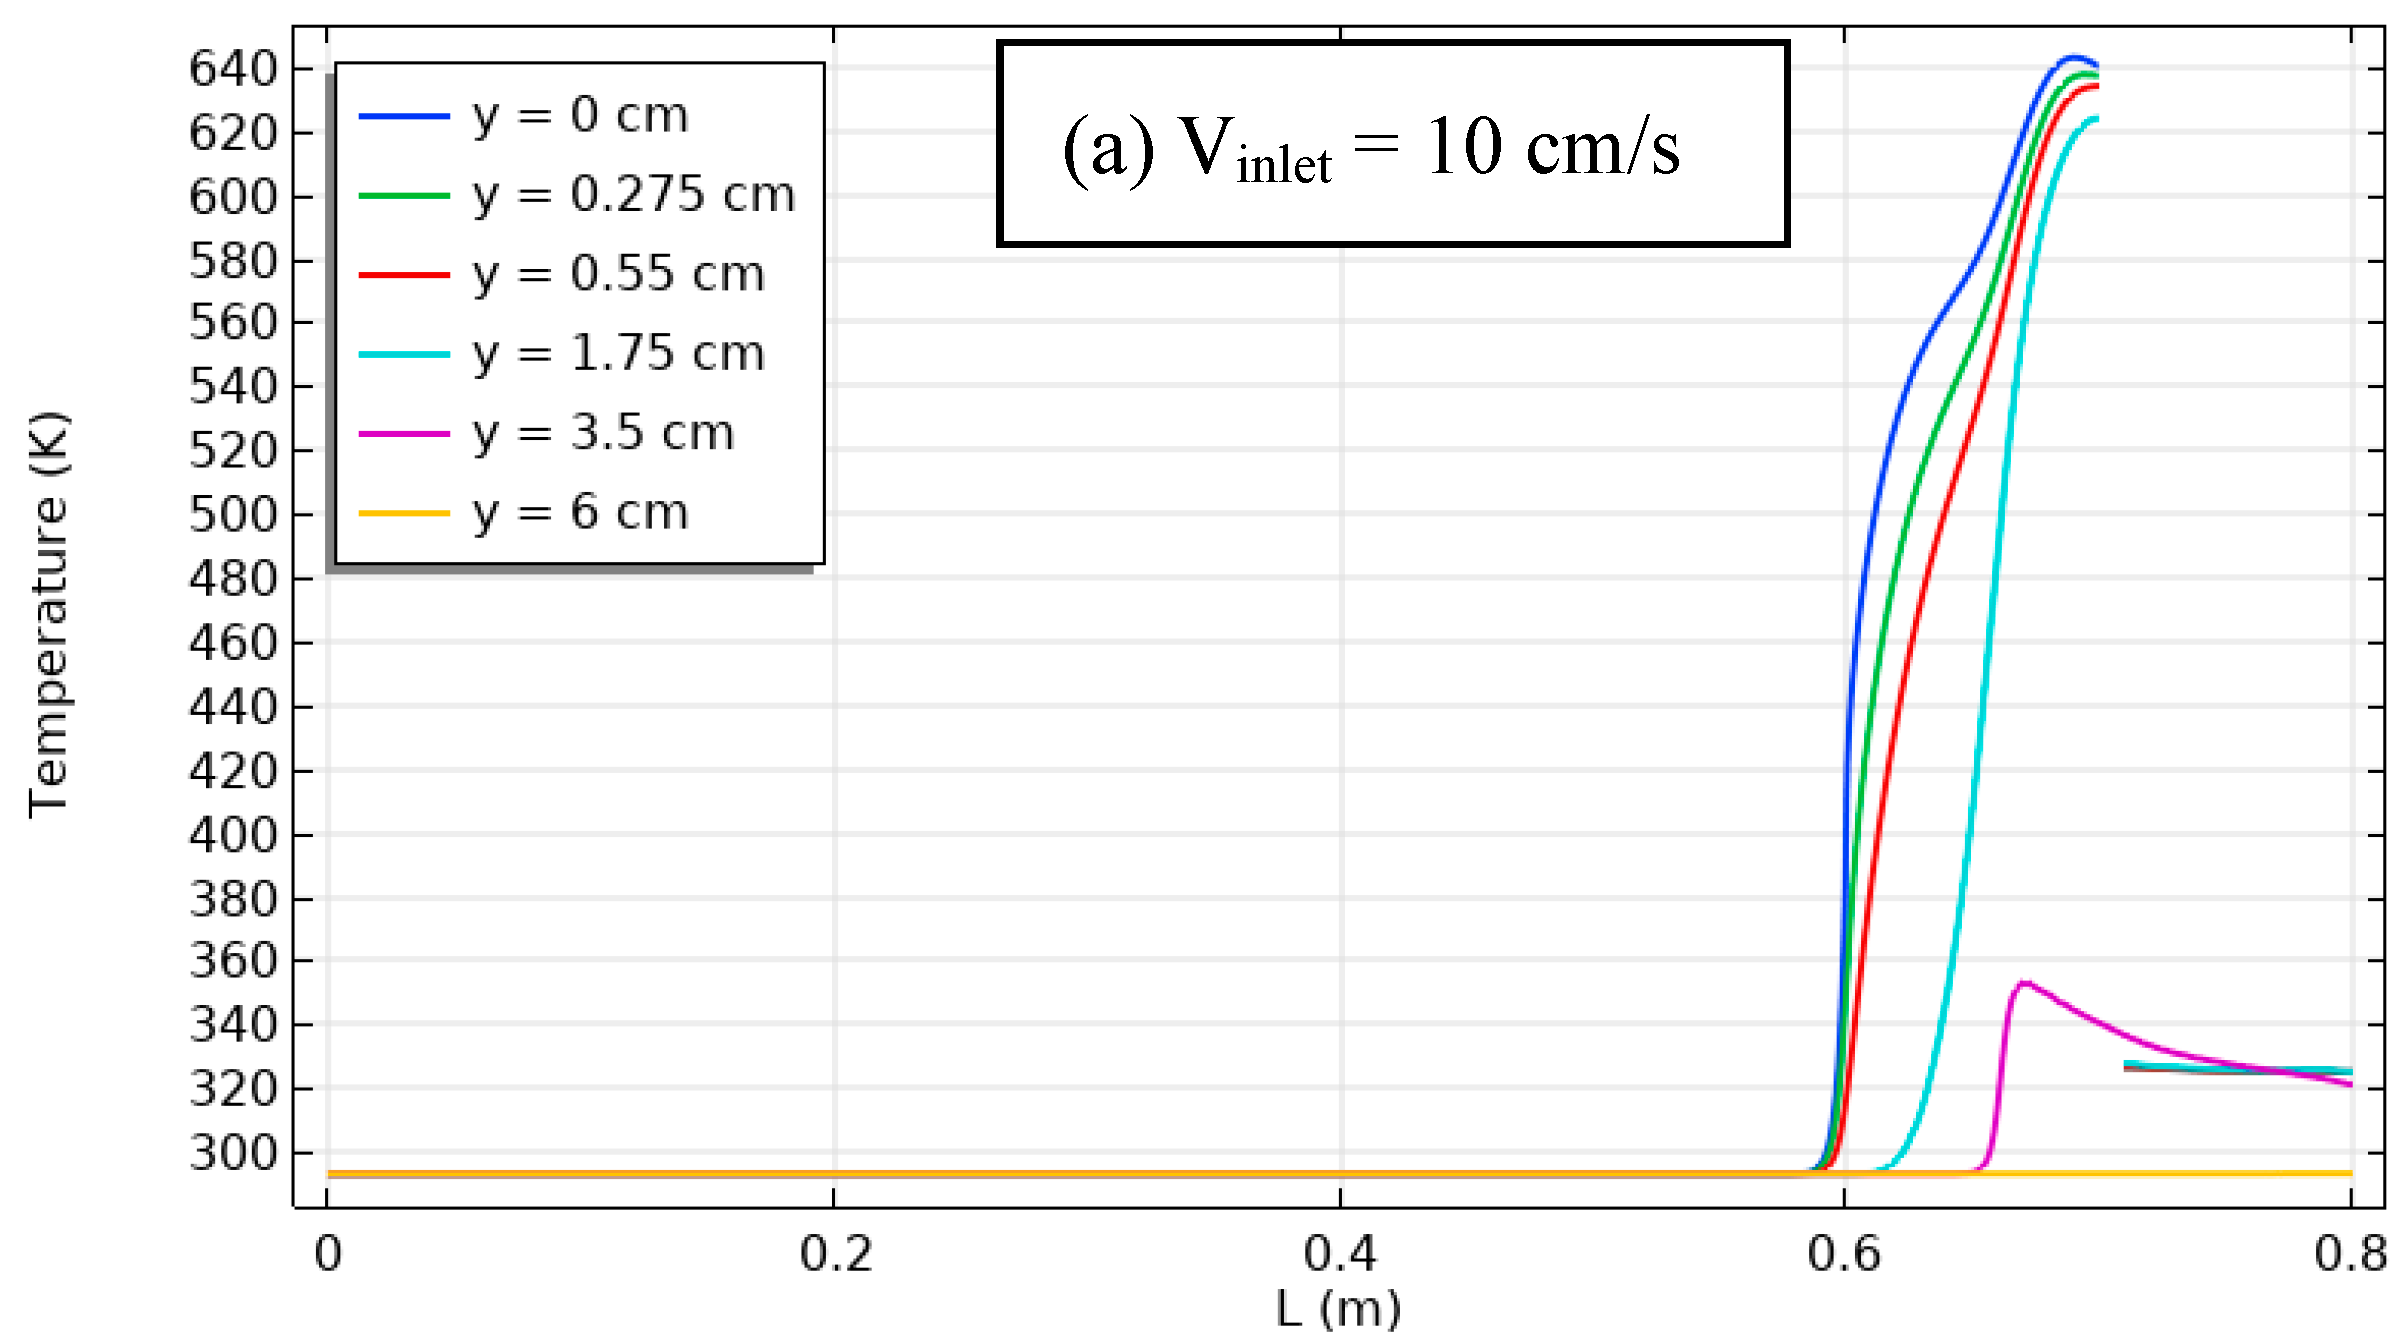
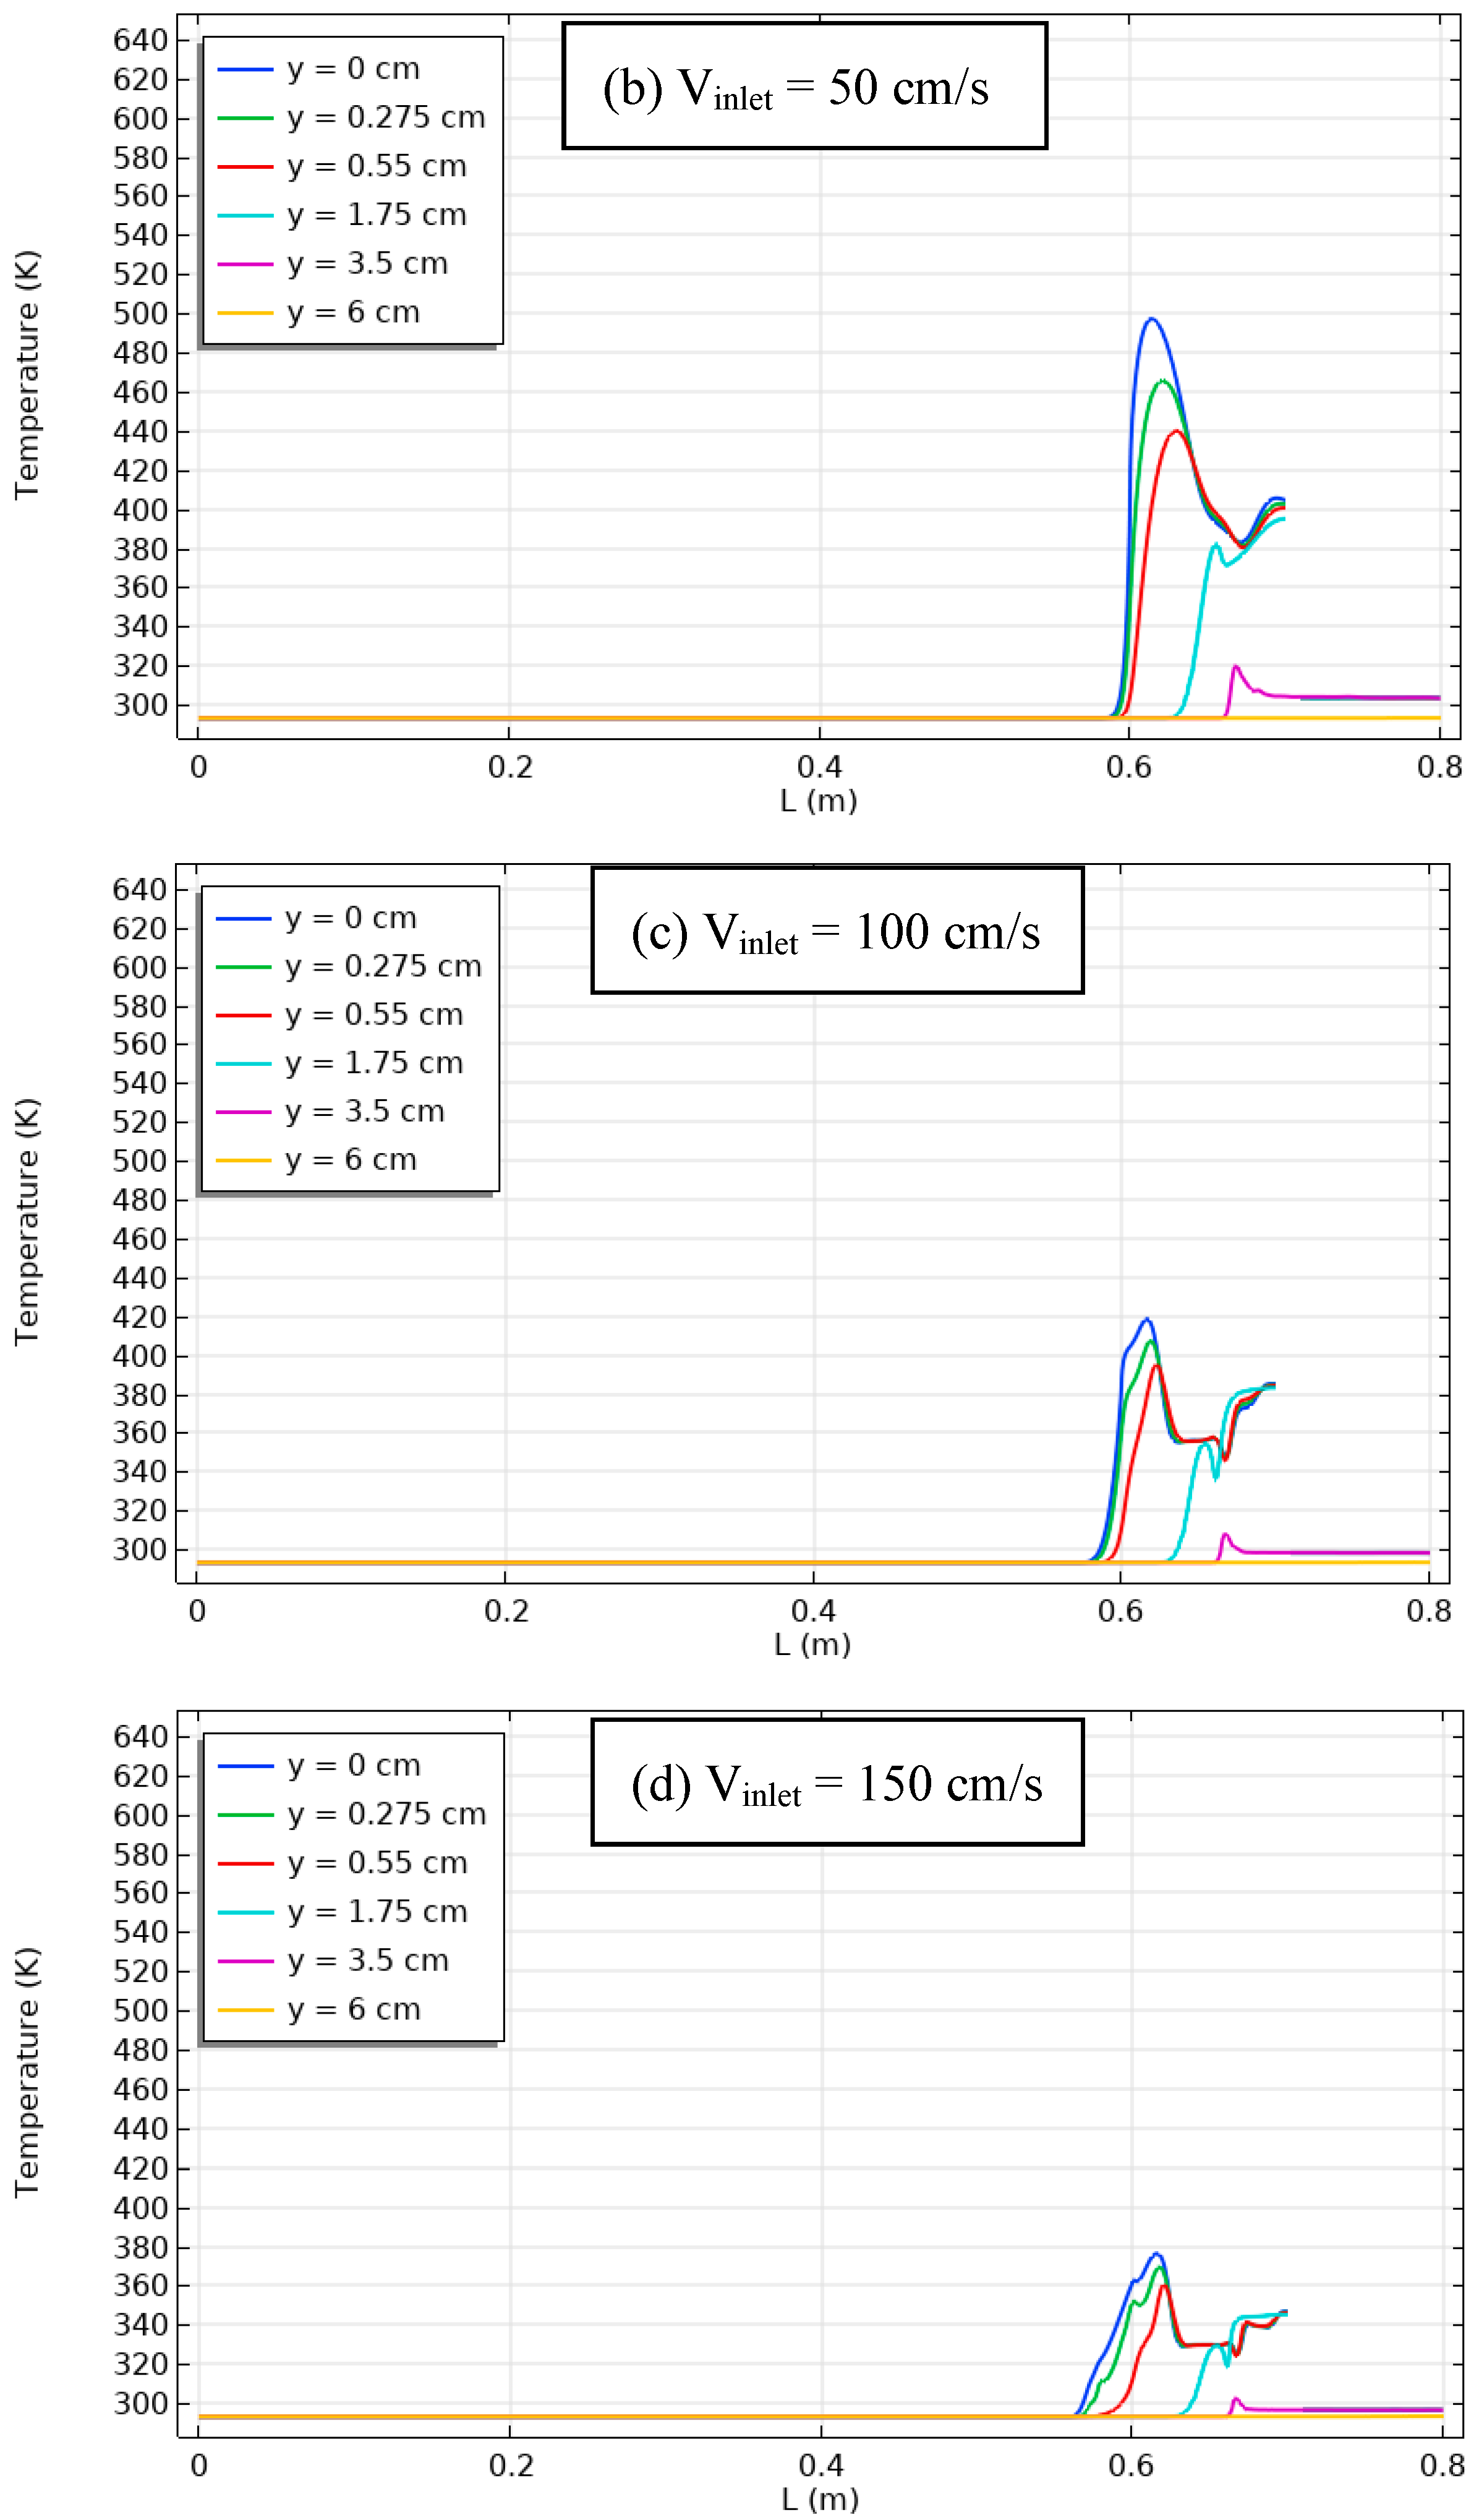
Figure 17Temperature distribution in channel-cavity system with thermal sources and unheated baffle, varying inlet air velocities.Higher velocities lead to more effective cooling. Baffle enhances recirculation, reduces temperature gradients.
Figure 18Average change in the Nusselt number for varying input conditions with thermal sources and unheated baffle.Higher velocities increase the mean Nusselt number, indicating improved heat transfer efficiency. Baffle enhances heat transfer.
Figure 19Velocity profile across output channel with thermal source and unheated baffle, varying inlet air velocities.Velocity varies along channel width, influenced by shear stress and baffle-induced recirculation.
Figure 20Temperature distribution with varying inlet air velocities, thermal sources, and unheated baffle.Higher velocities lead to more effective heat transfer, reducing temperature variation. Baffle reduces temperature locally.
Figure 21Air density distribution in channel flow with varying inlet velocities, thermal sources, and unheated baffle.Air density increases with distance from thermal sources, higher velocities enhance natural convection and air density.
Disclaimer/Publisher’s Note: The statements, opinions and data contained in all publications are solely those of the individual author(s) and contributor(s) and not of MDPI and/or the editor(s). MDPI and/or the editor(s) disclaim responsibility for any injury to people or property resulting from any ideas, methods, instructions or products referred to in the content.

