
Economic Optimization of Enhanced Oil Recovery and Carbon Storage Using Mixed Dimethyl Ether-Impure CO2 Solvent in a Heterogeneous Reservoir


Abstract
1. Introduction
2. Methodology
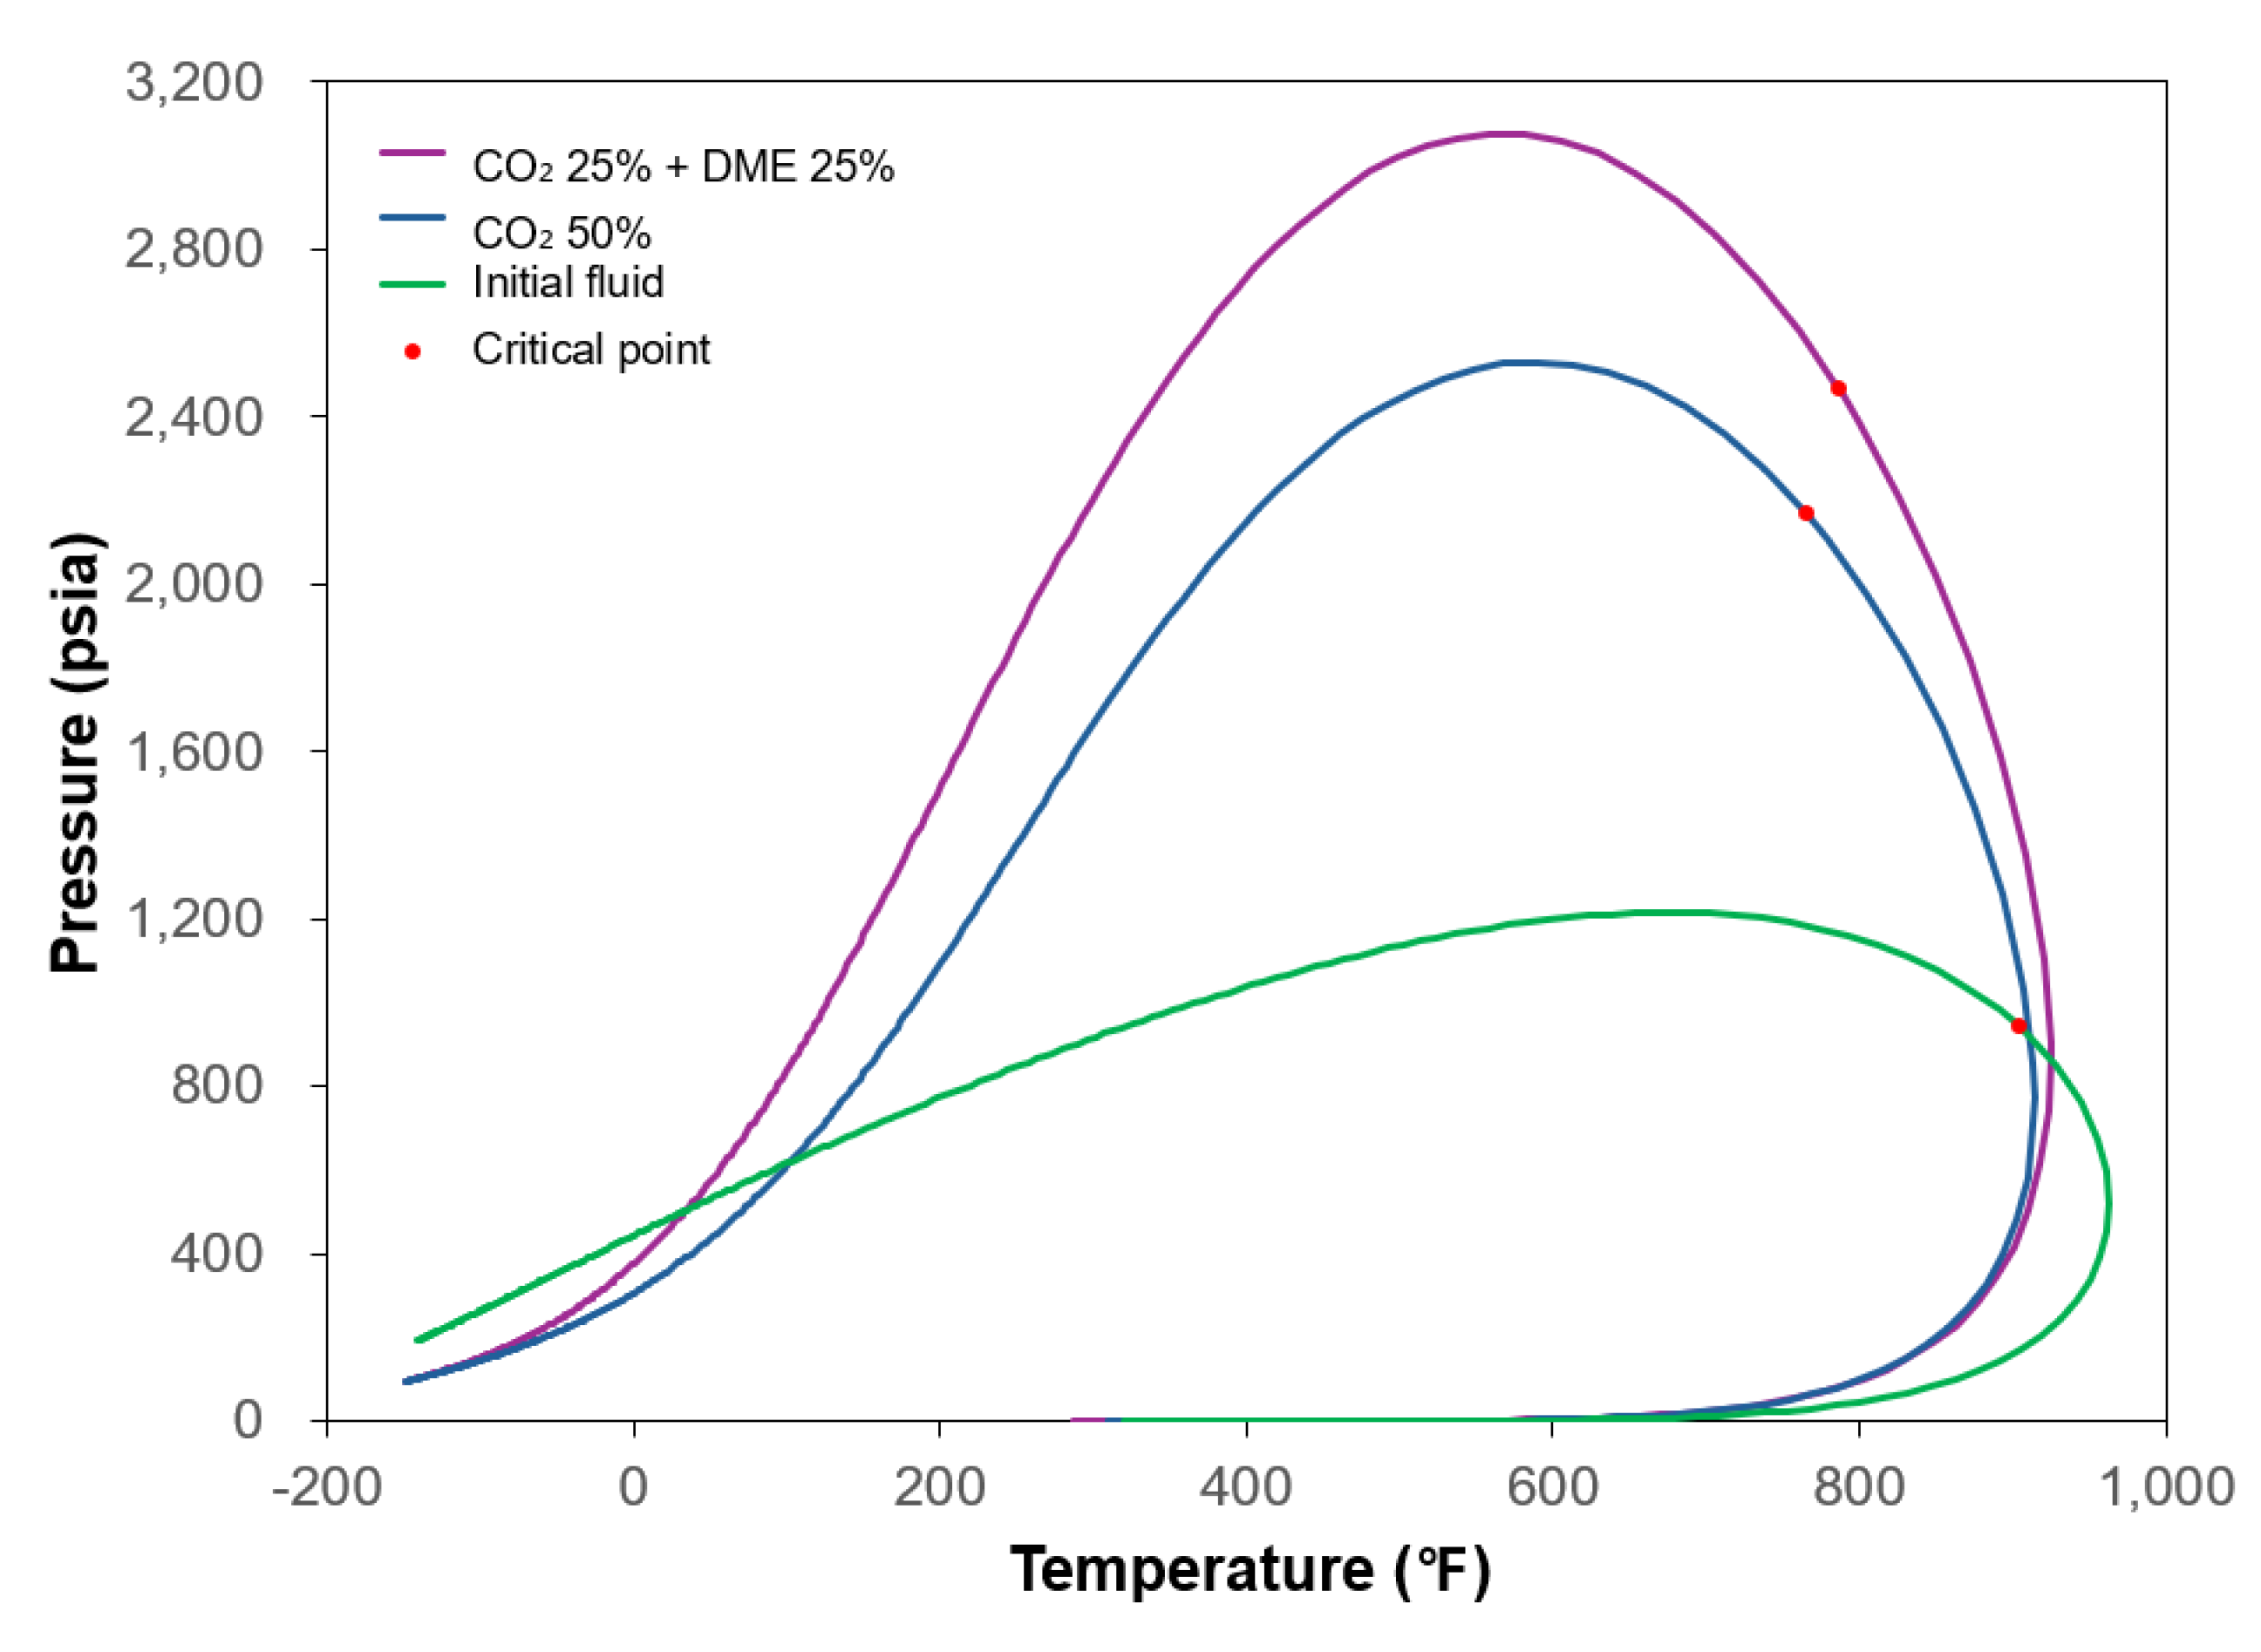
2.1. Fluid Modeling
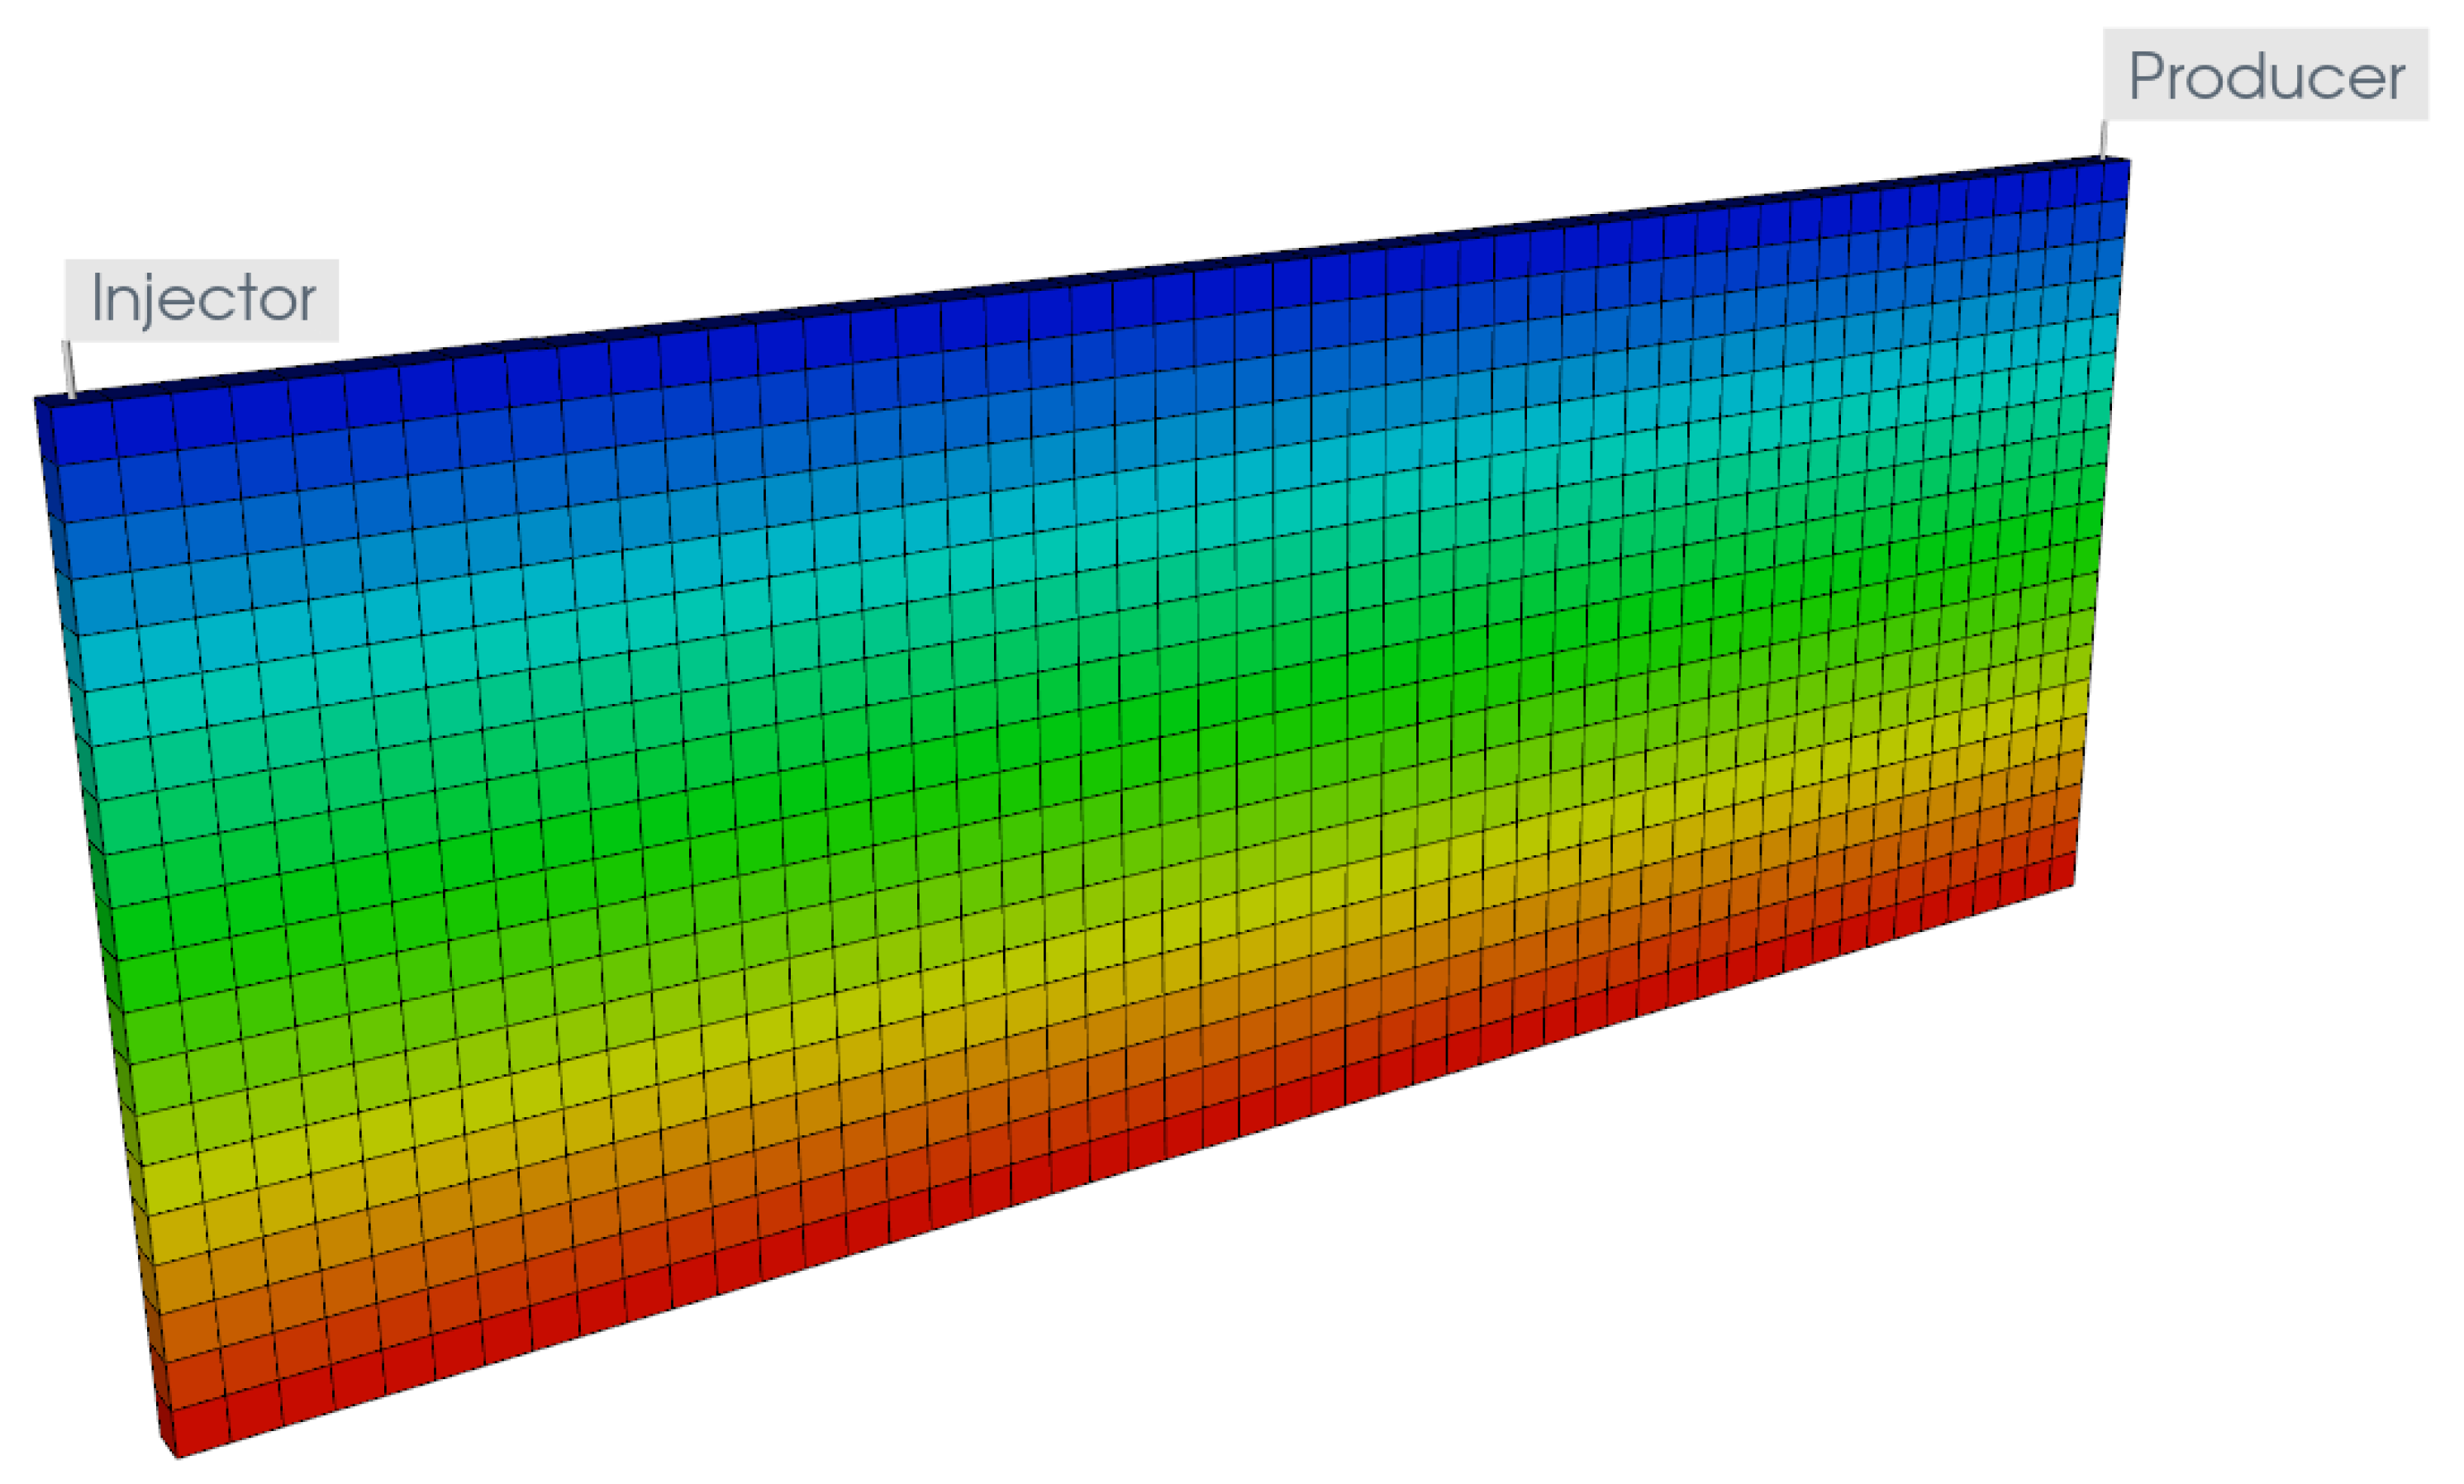
2.2. Reservoir Modeling
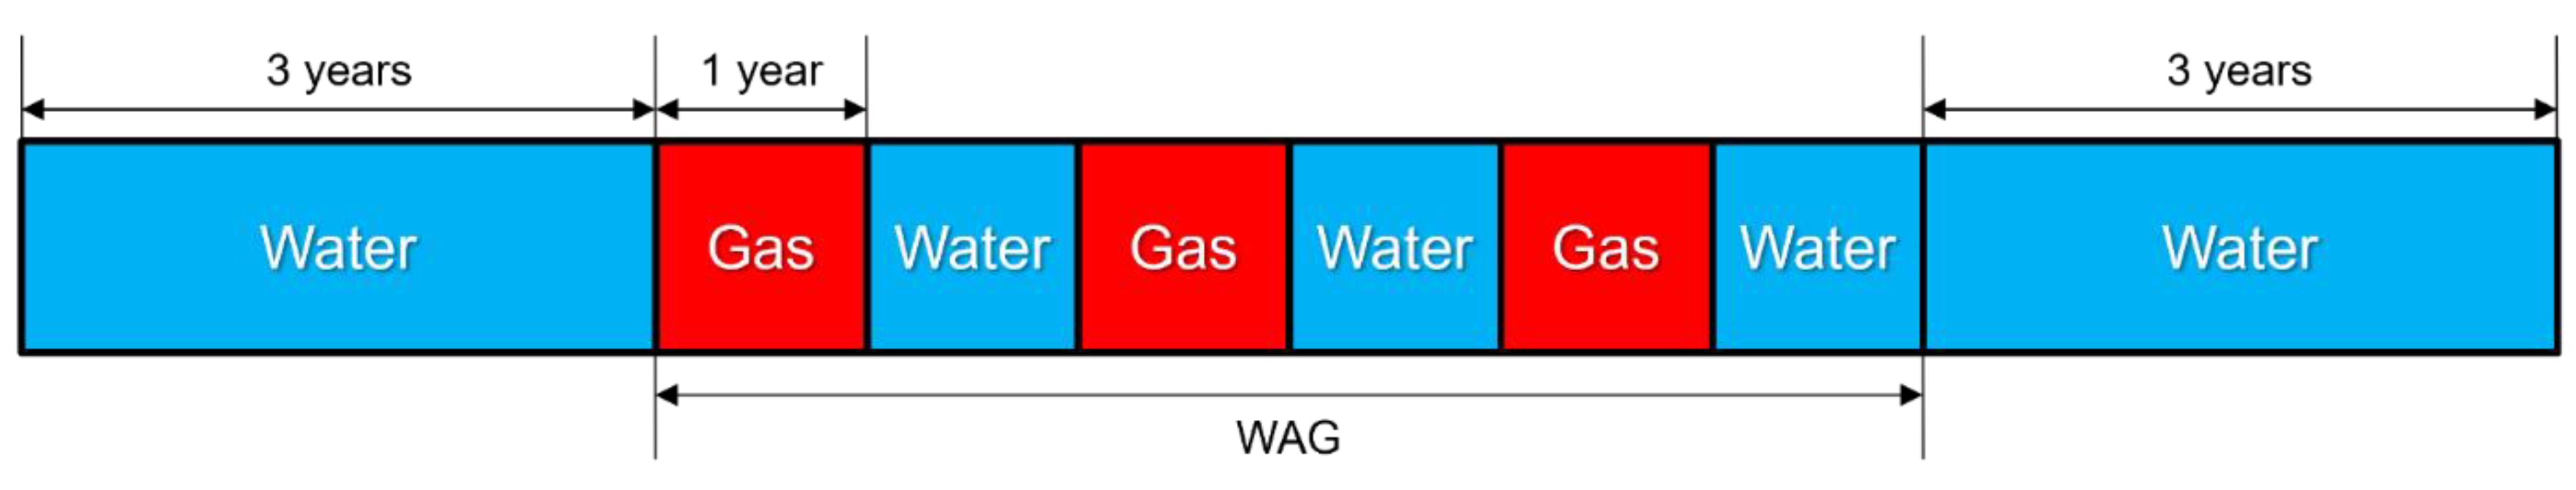
2.3. Injection Design
2.4. Economic Analysis
3. Results and Discussion
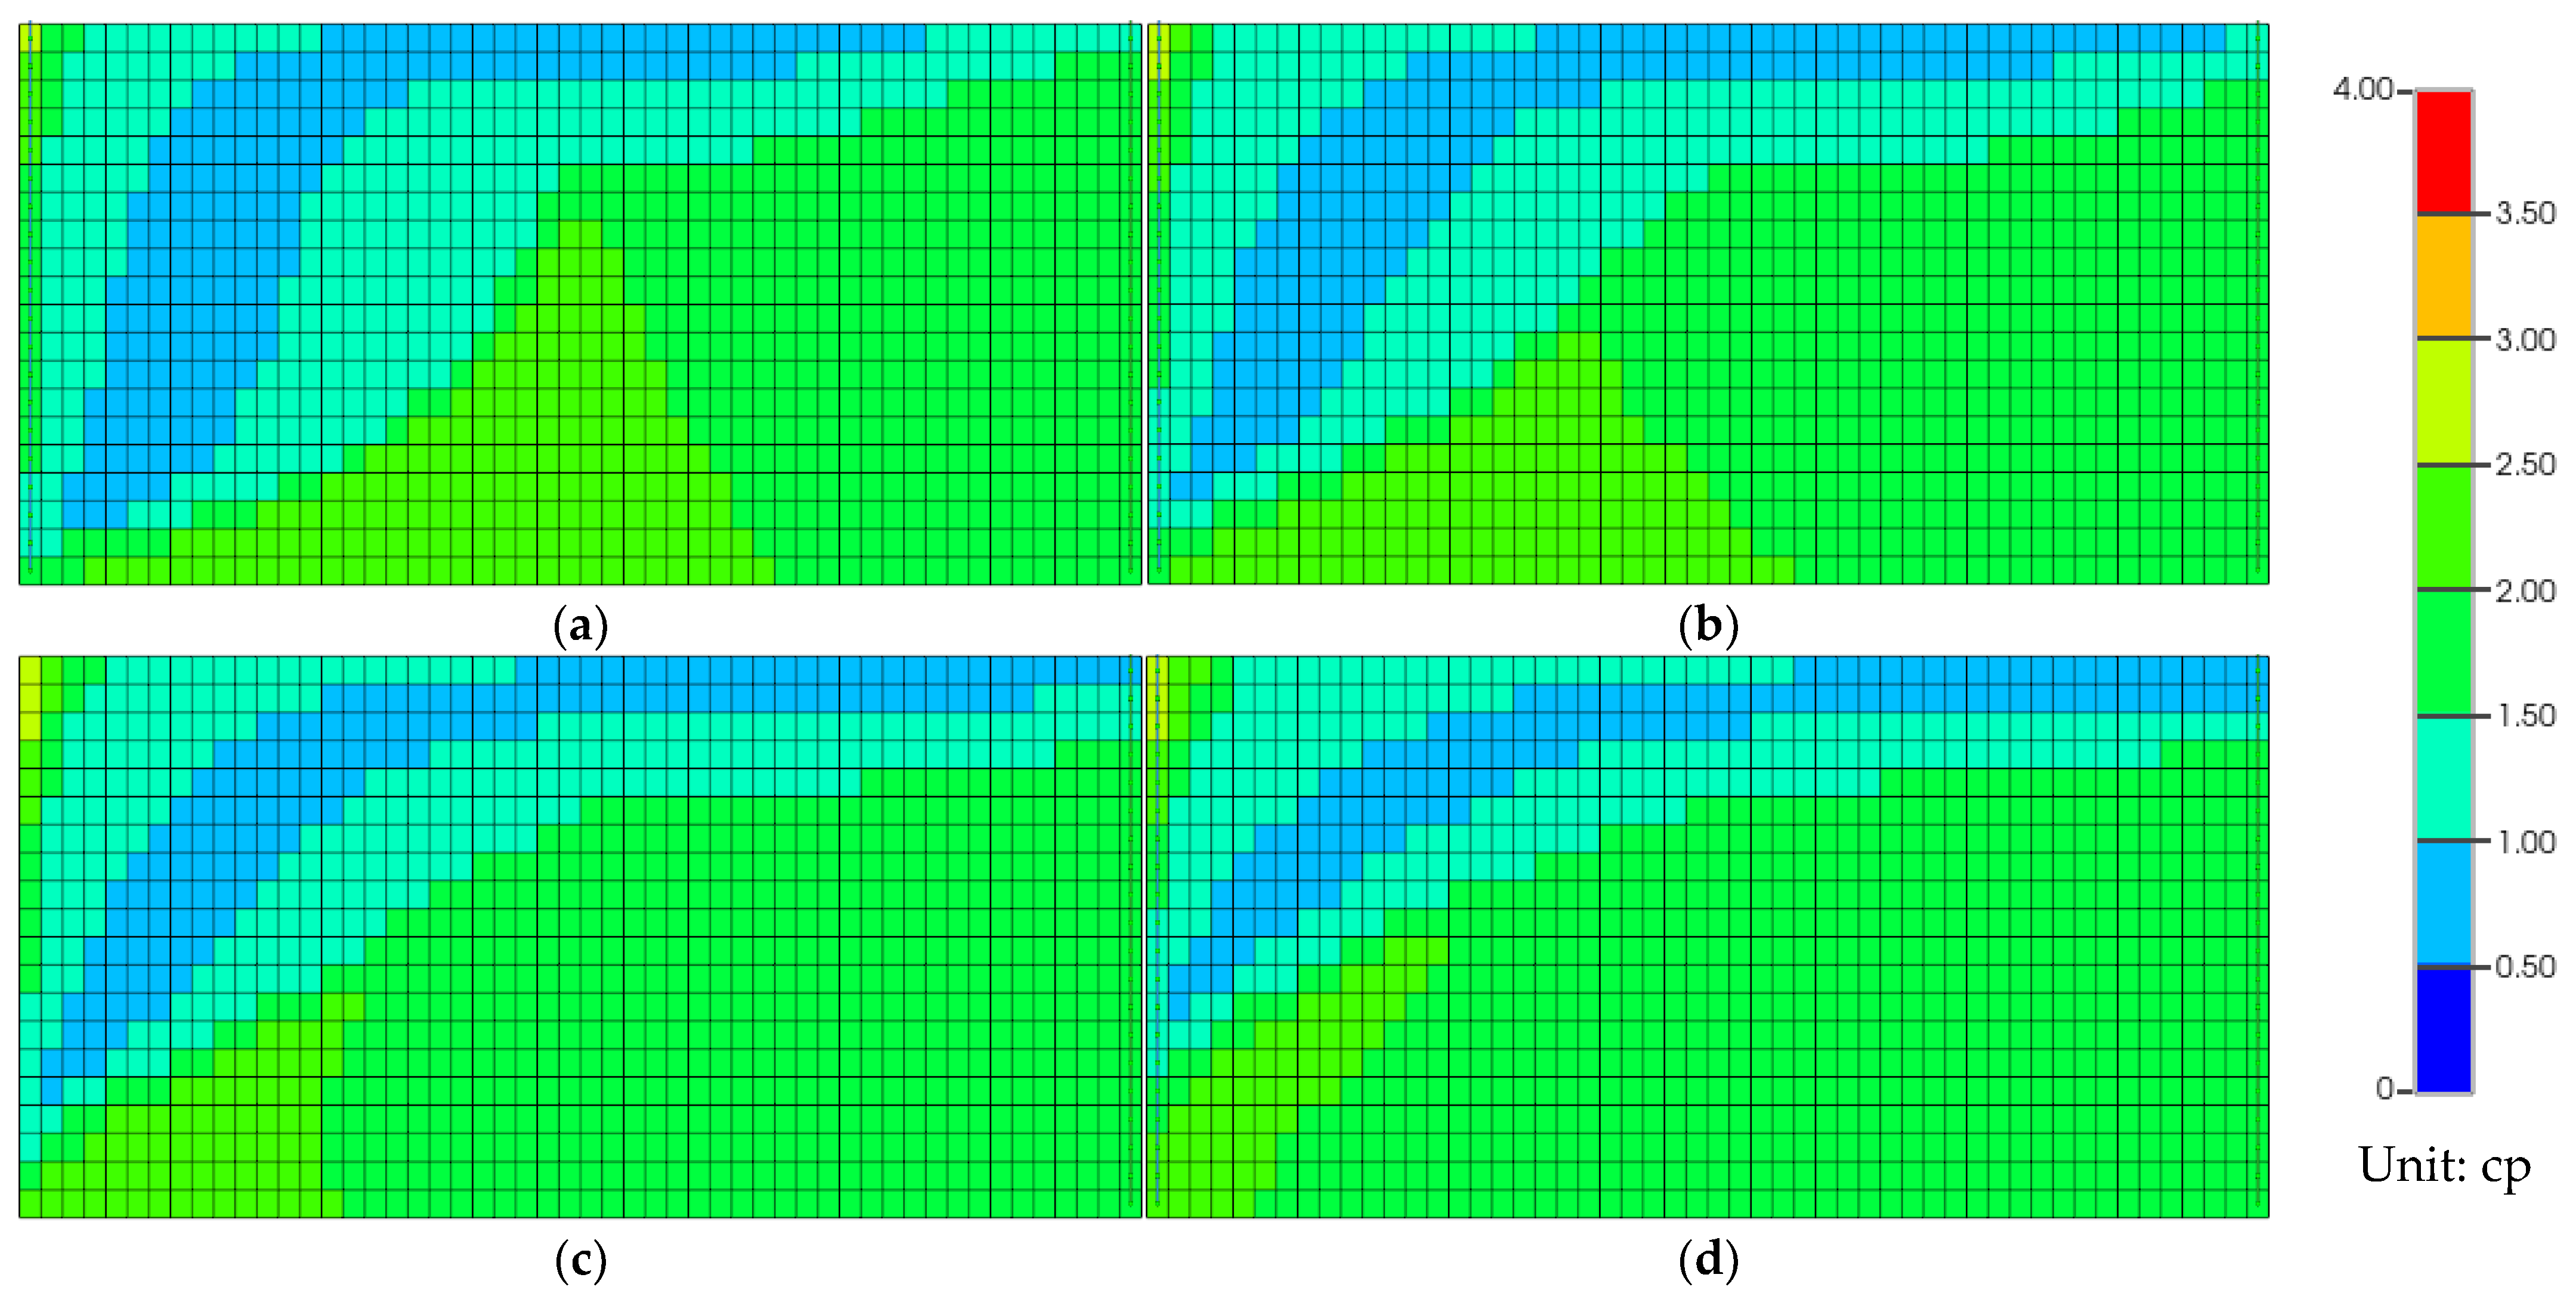
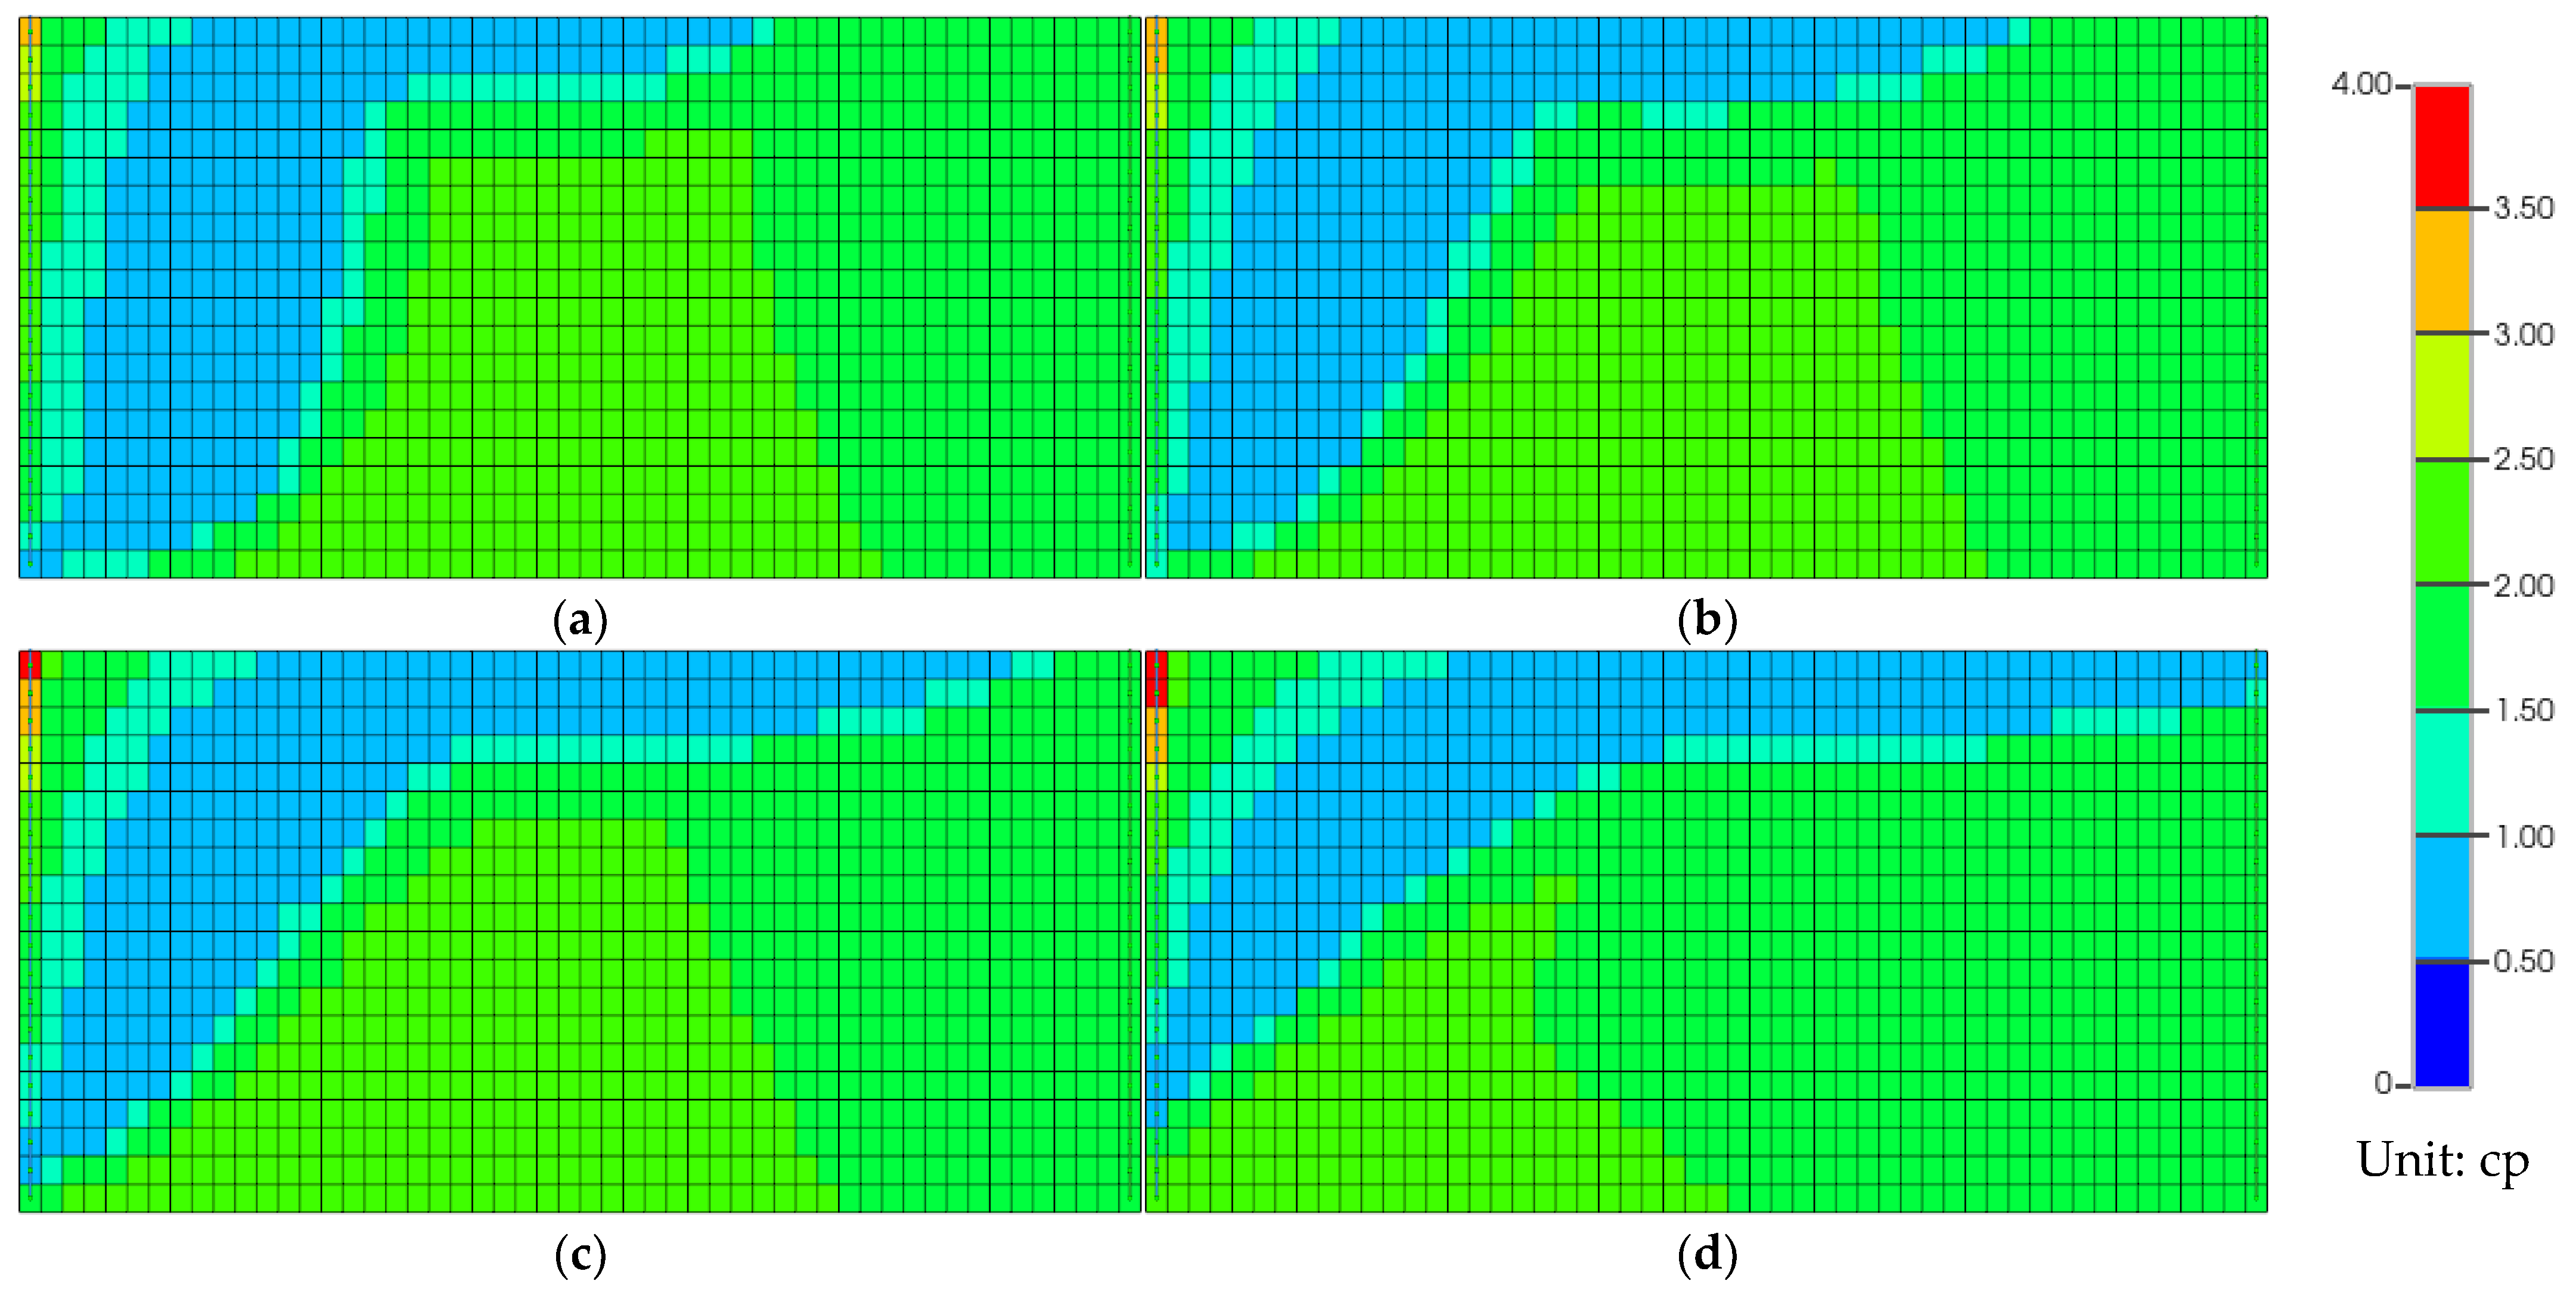
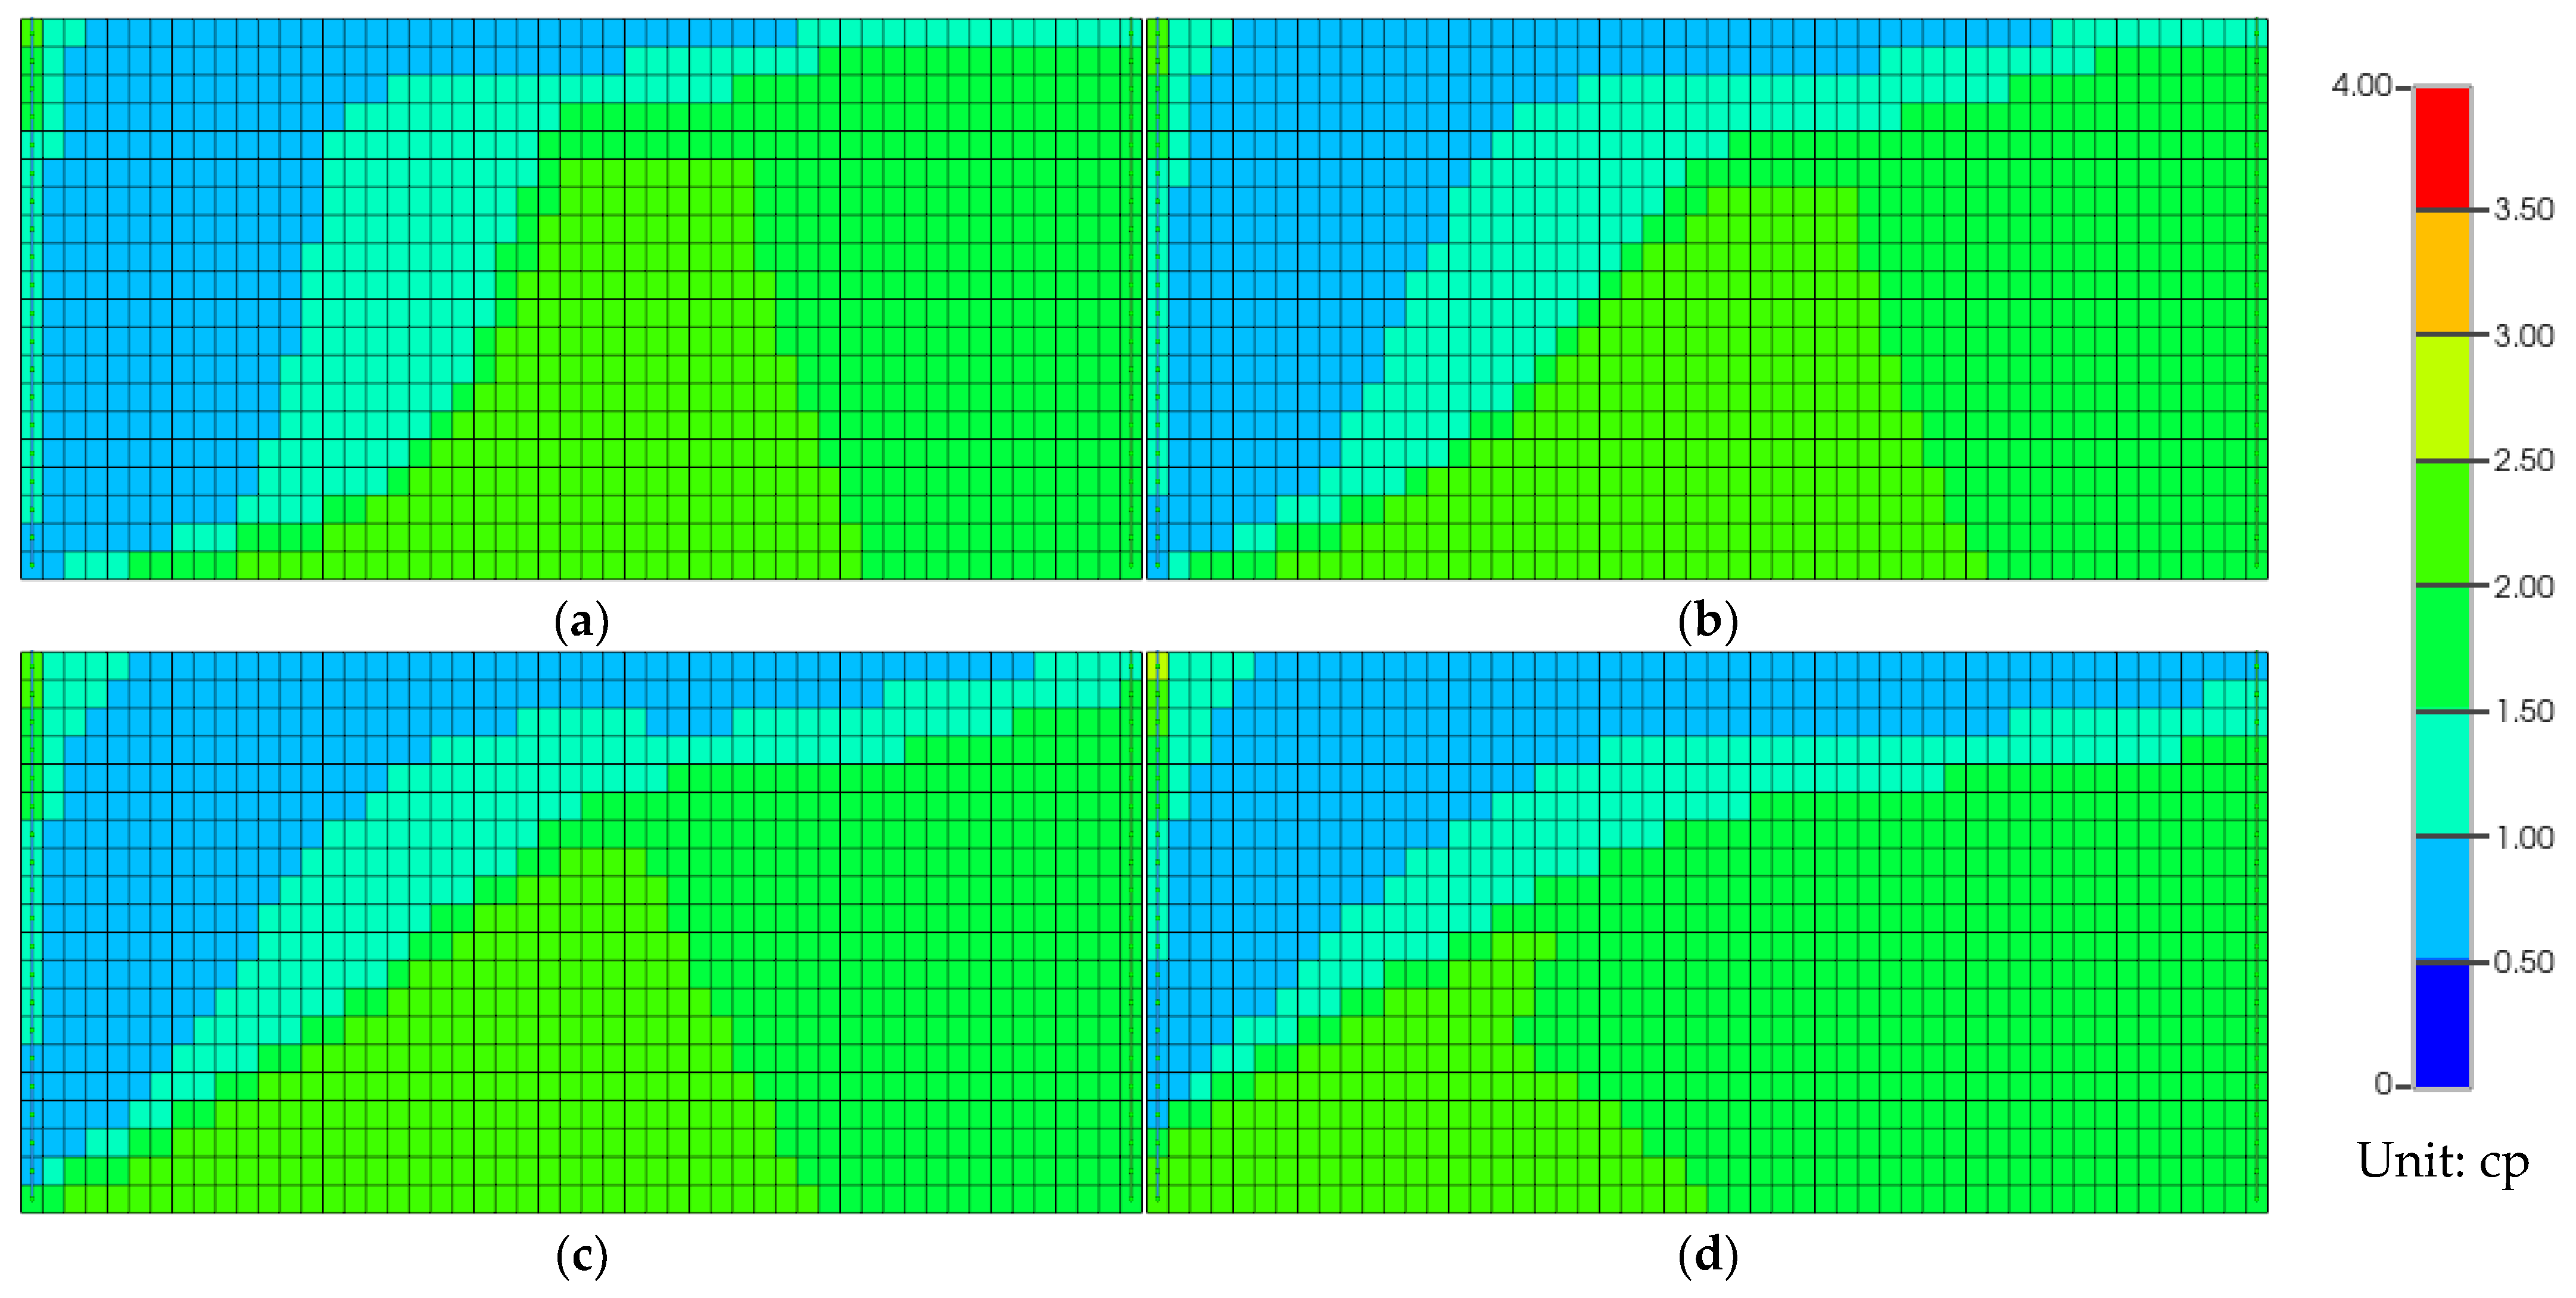
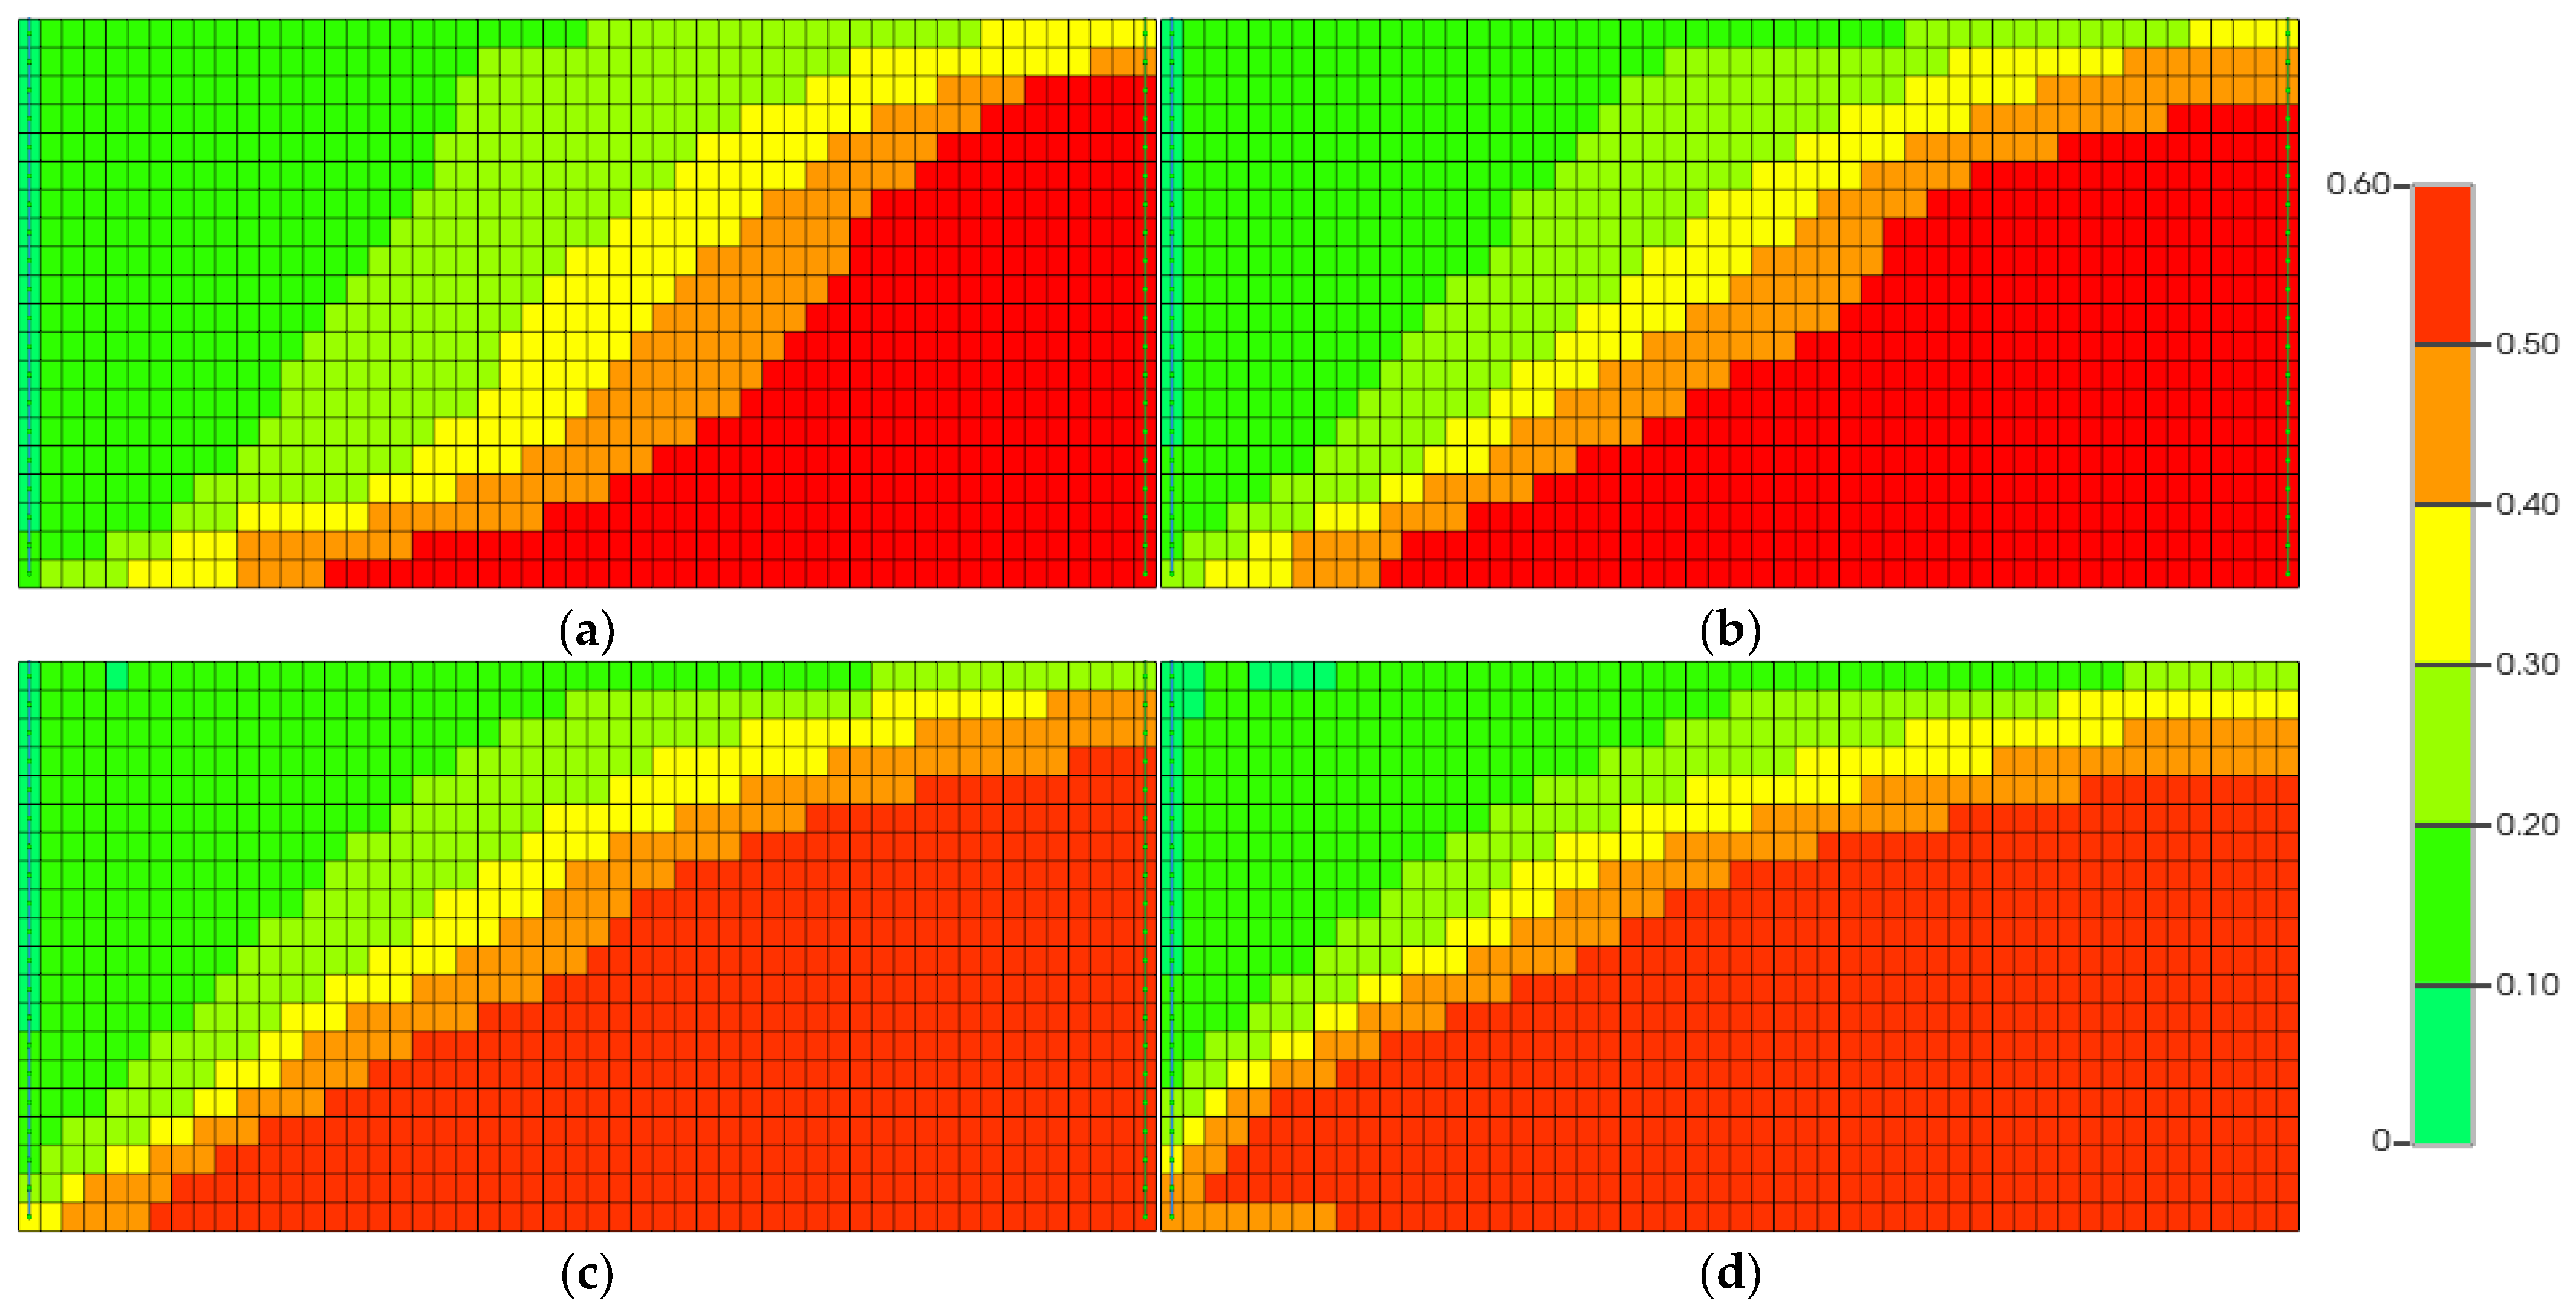
3.1. Vertical Sweep Efficiency
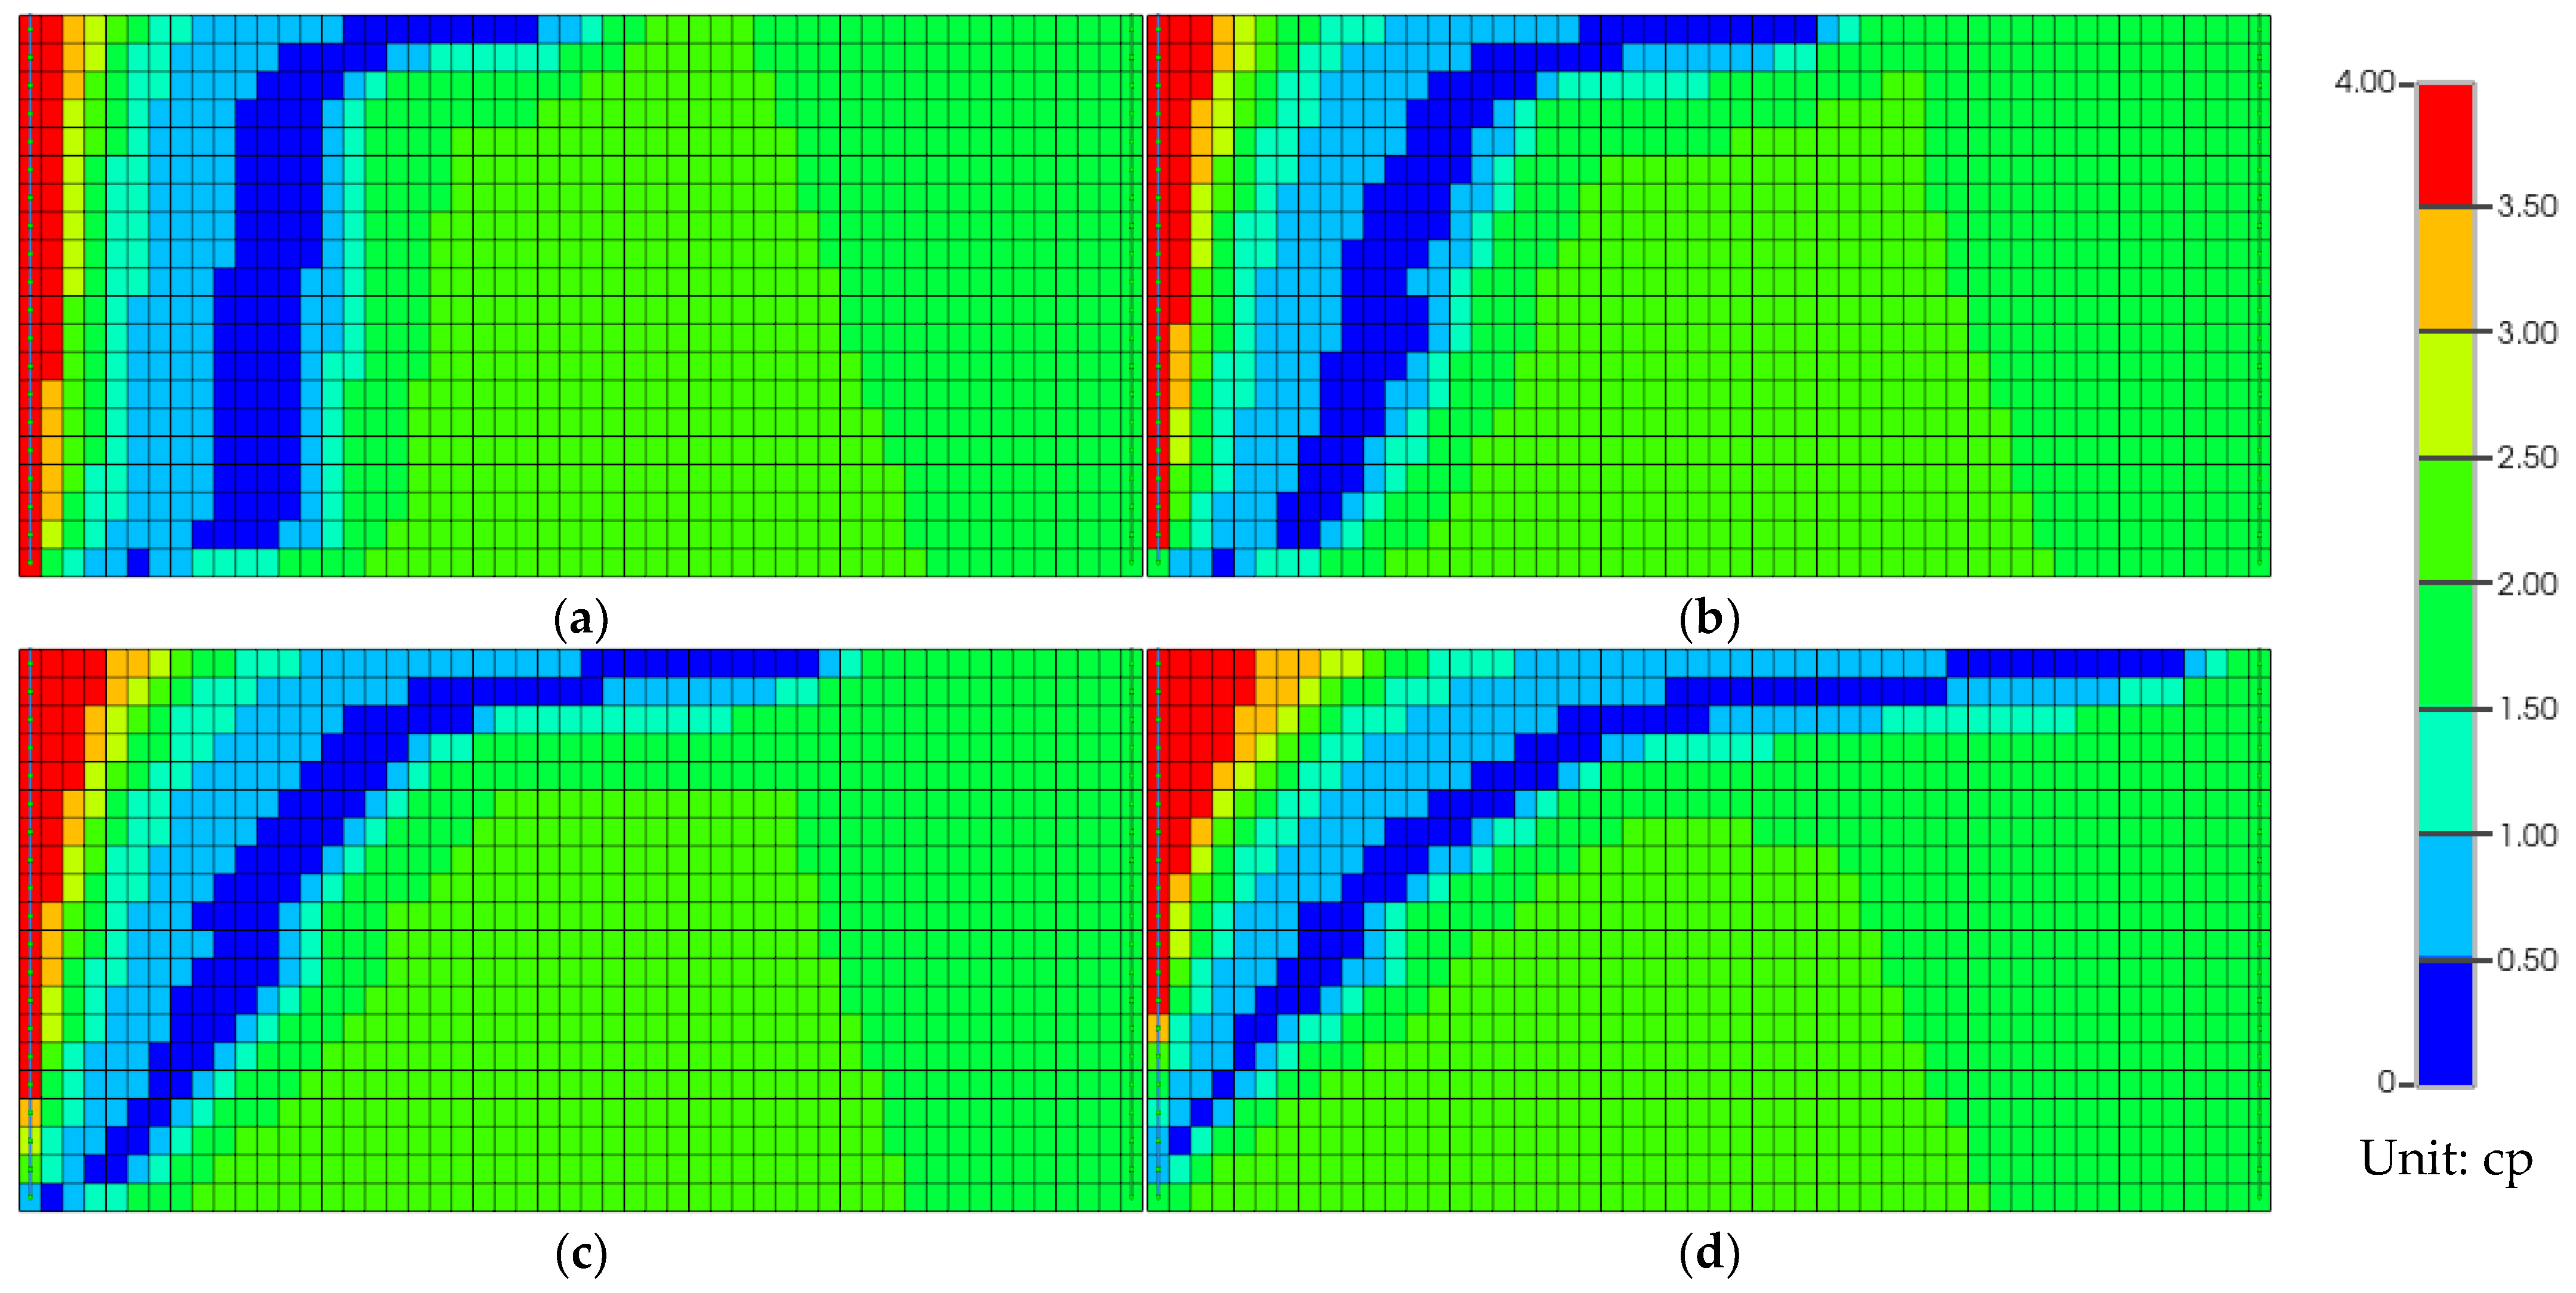
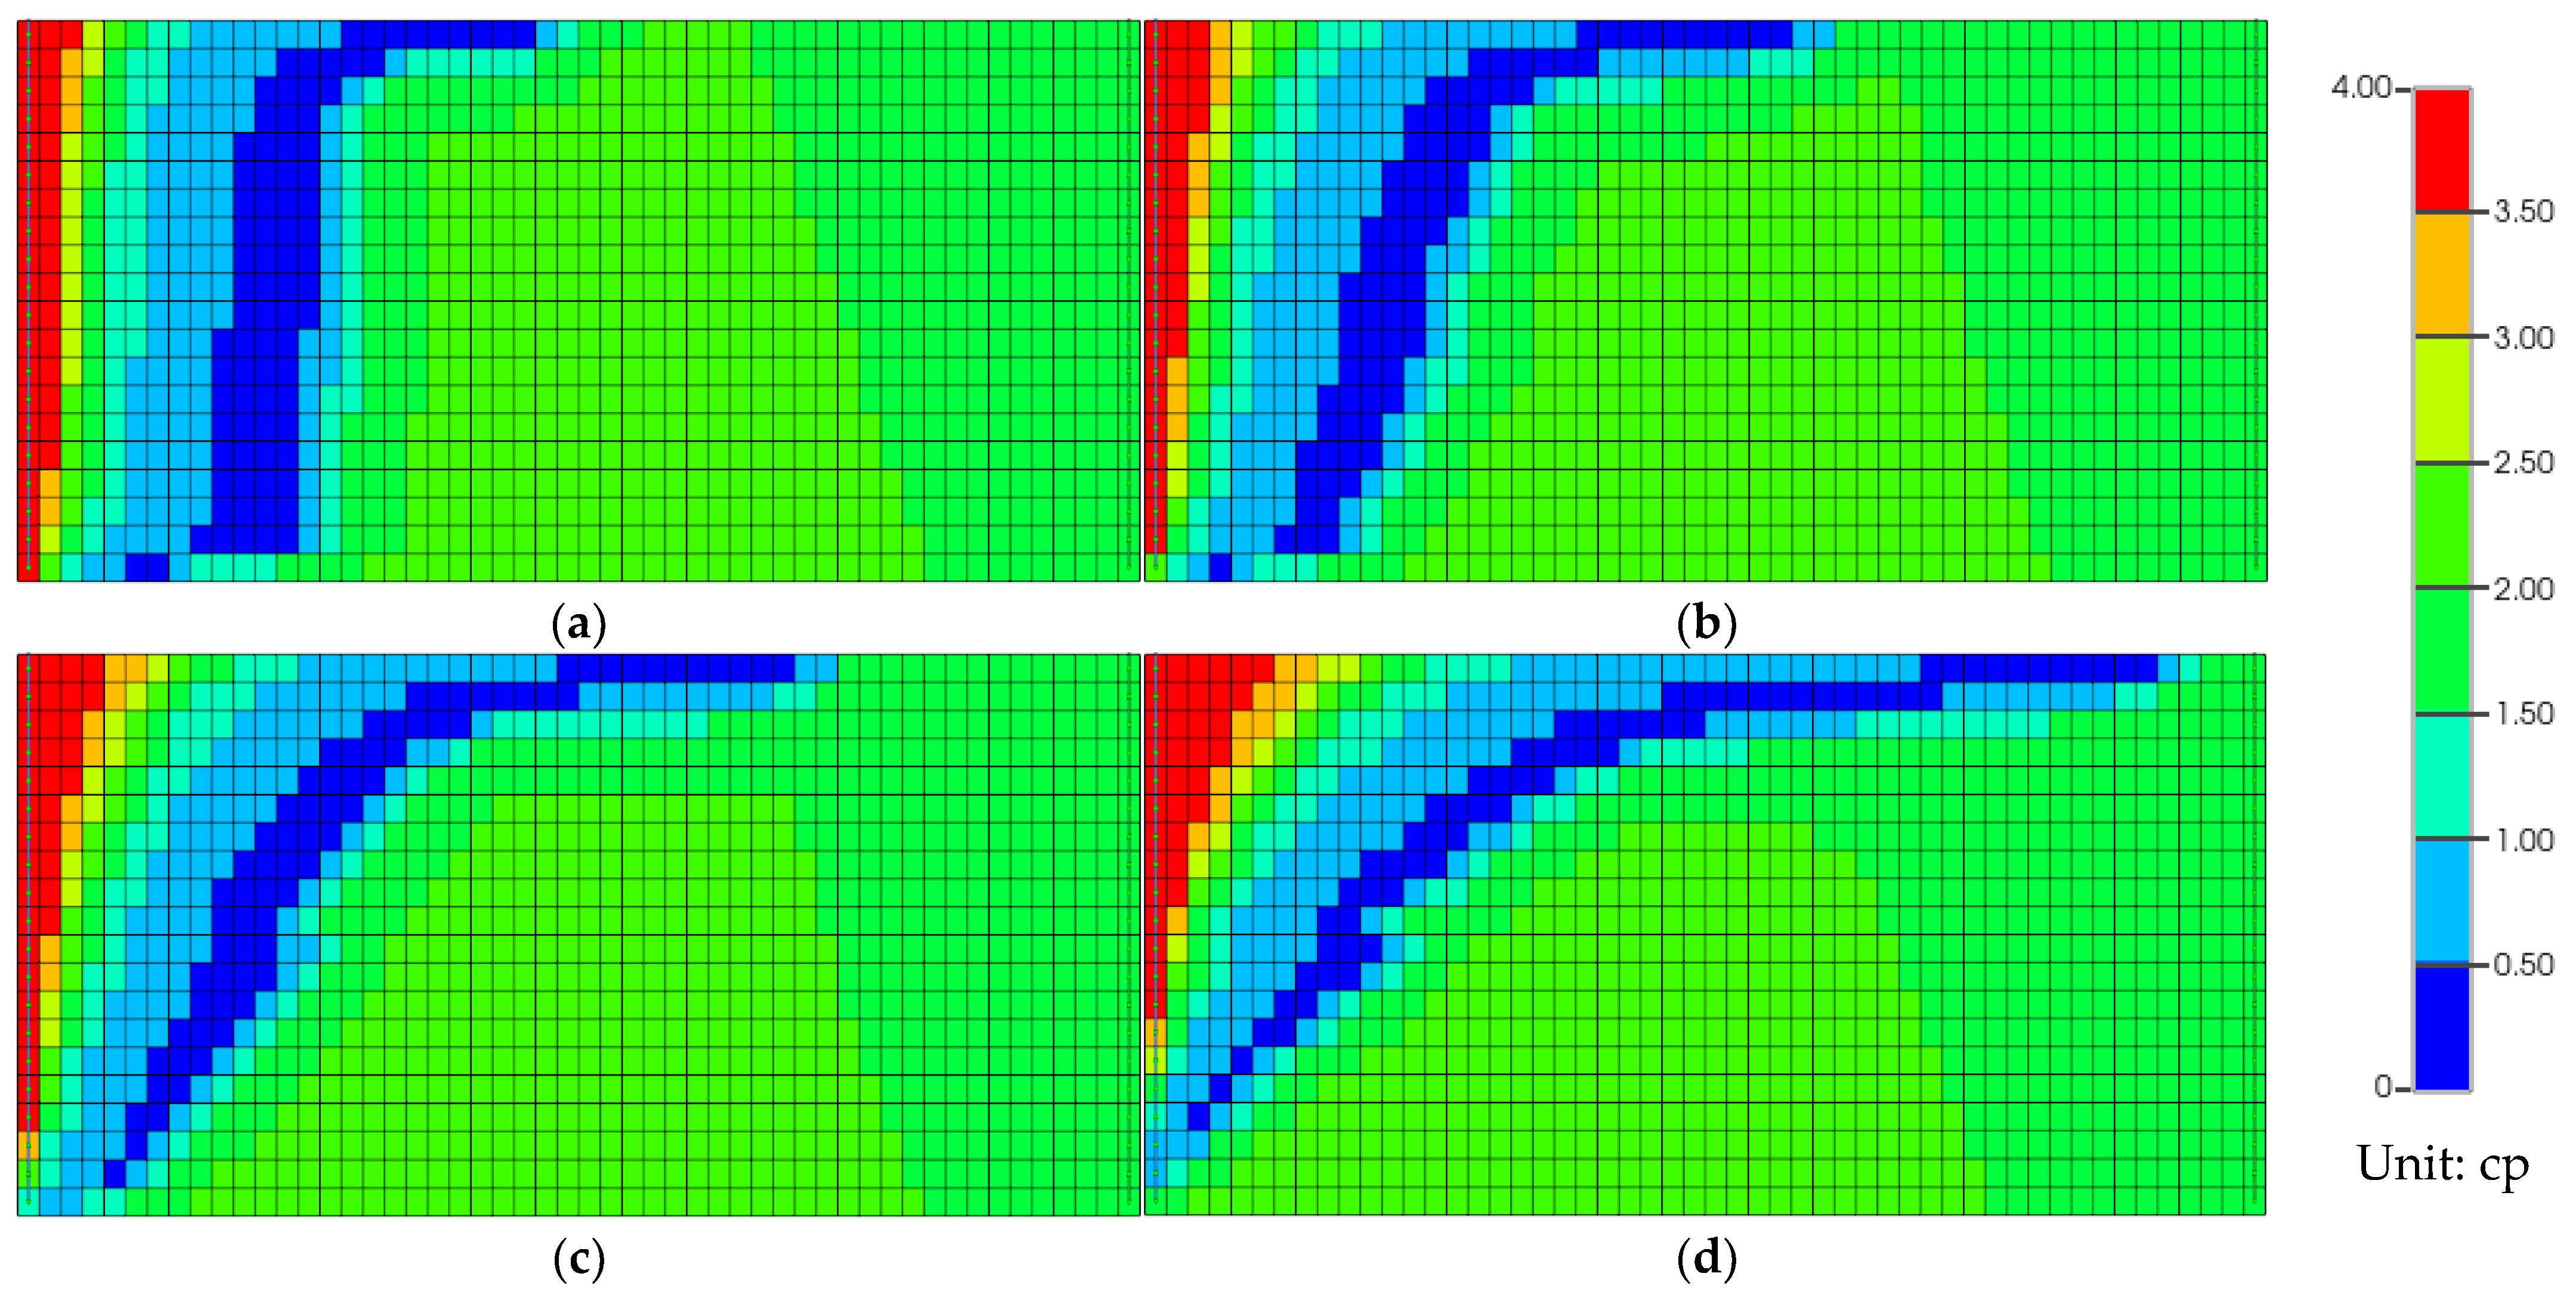
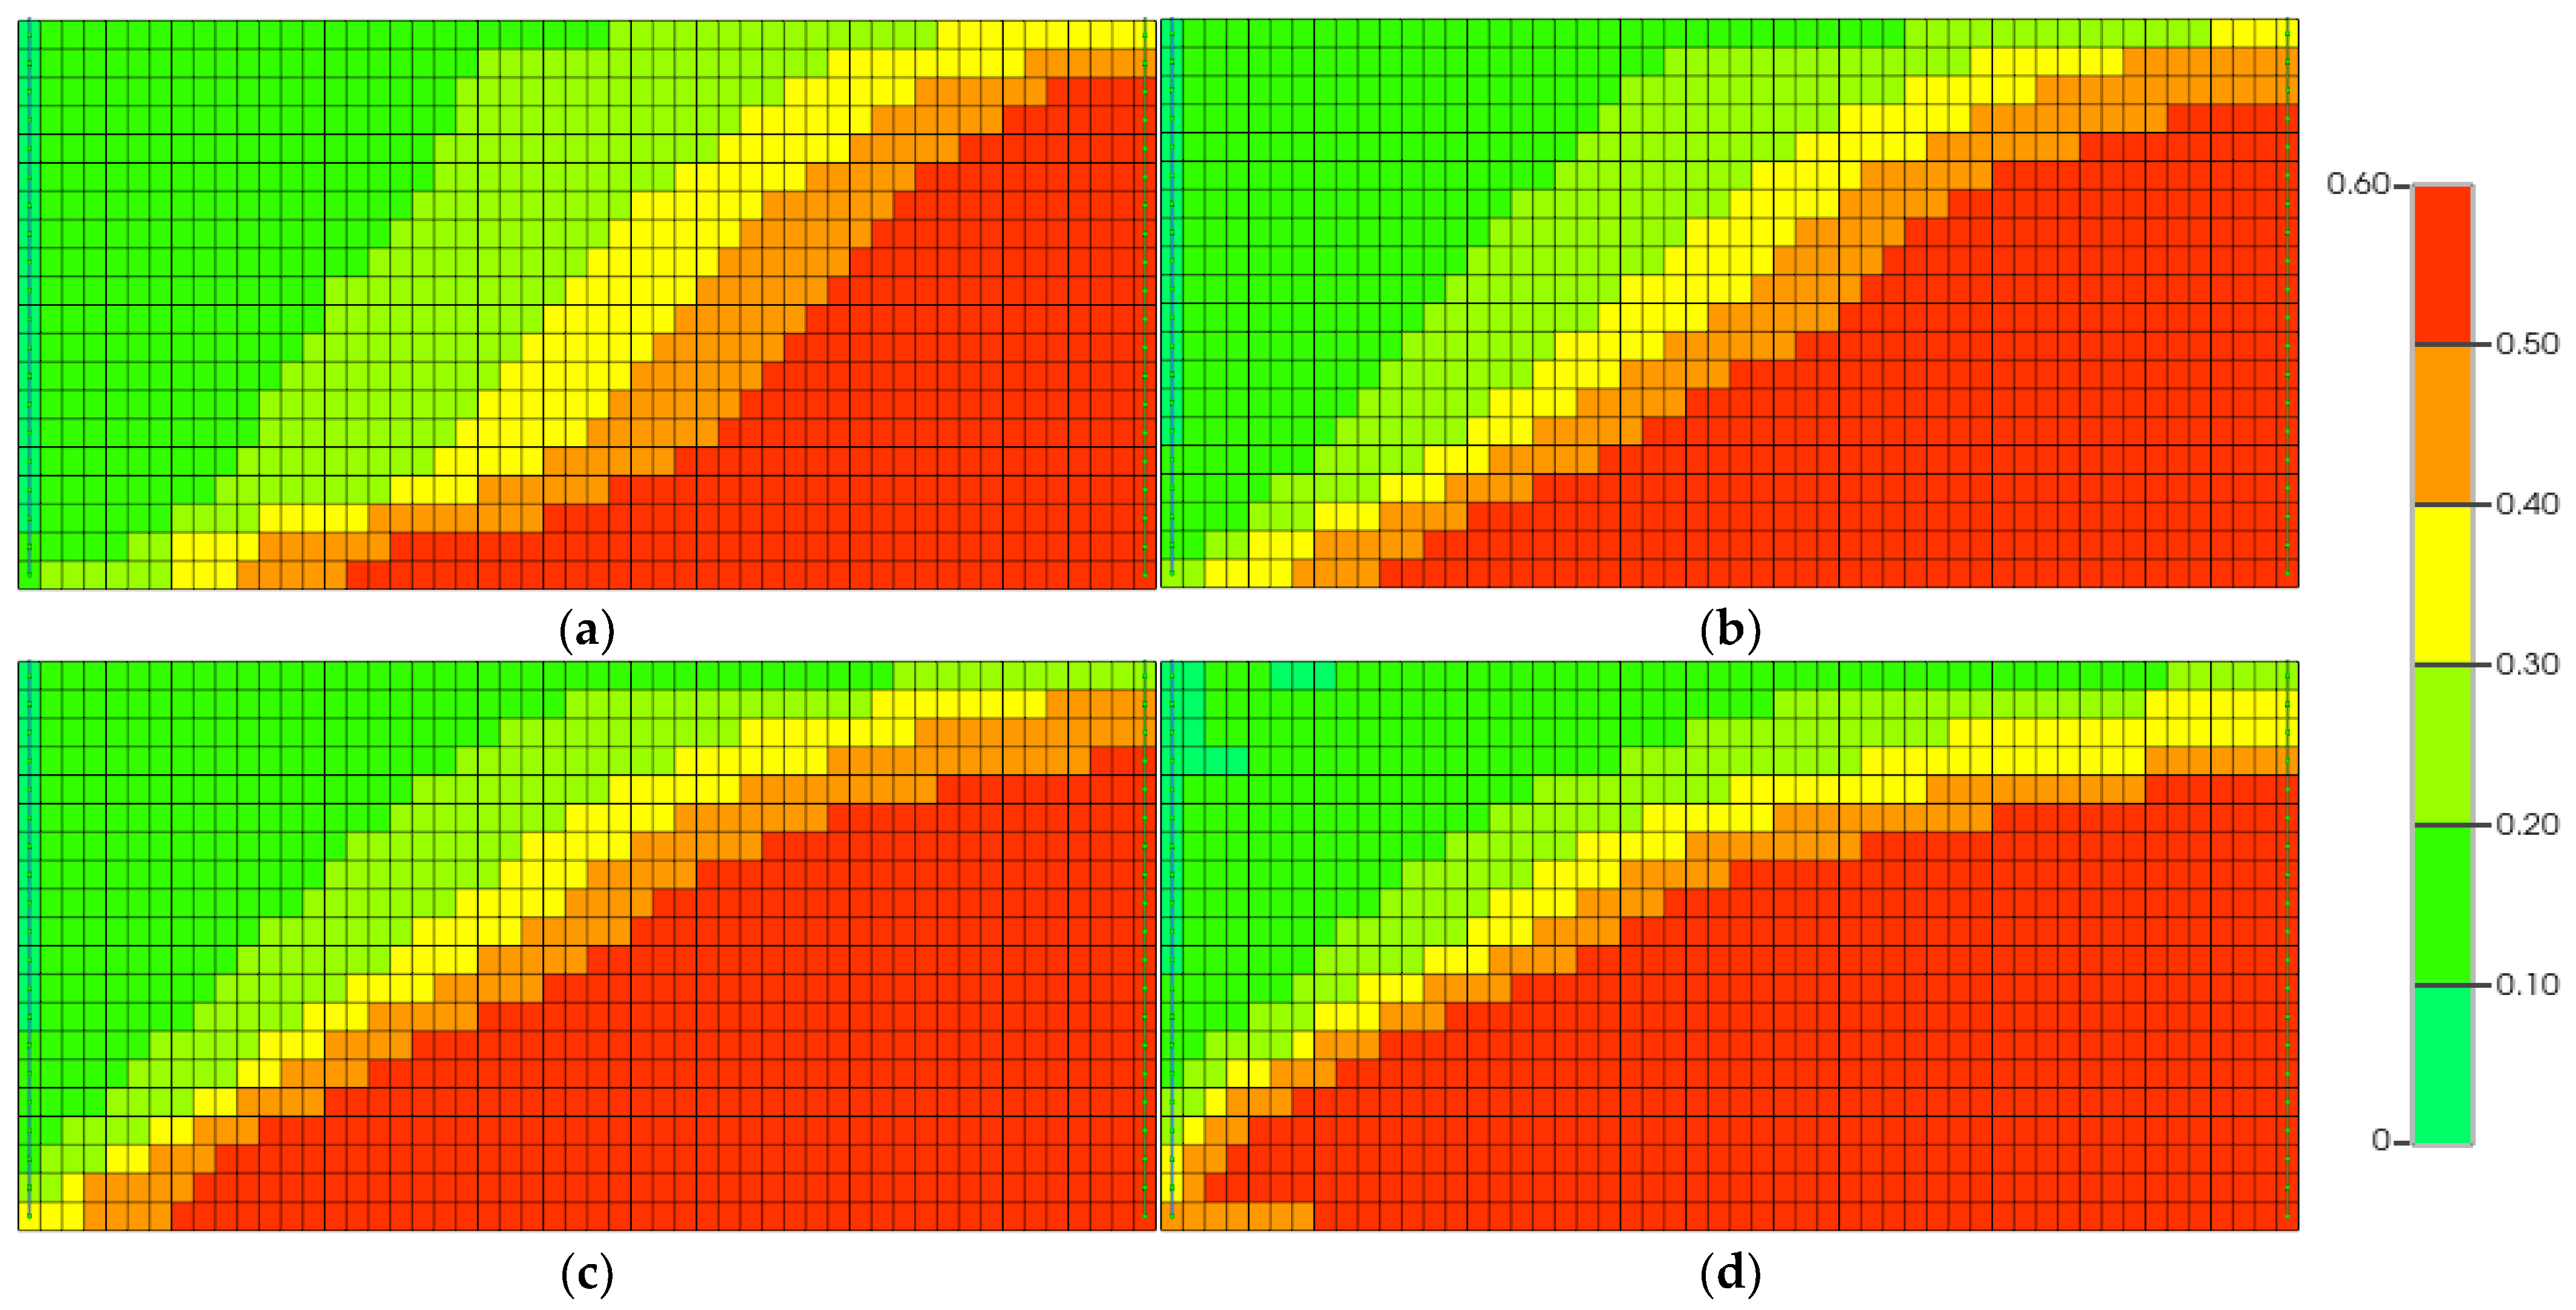
3.2. Displacement Efficiency
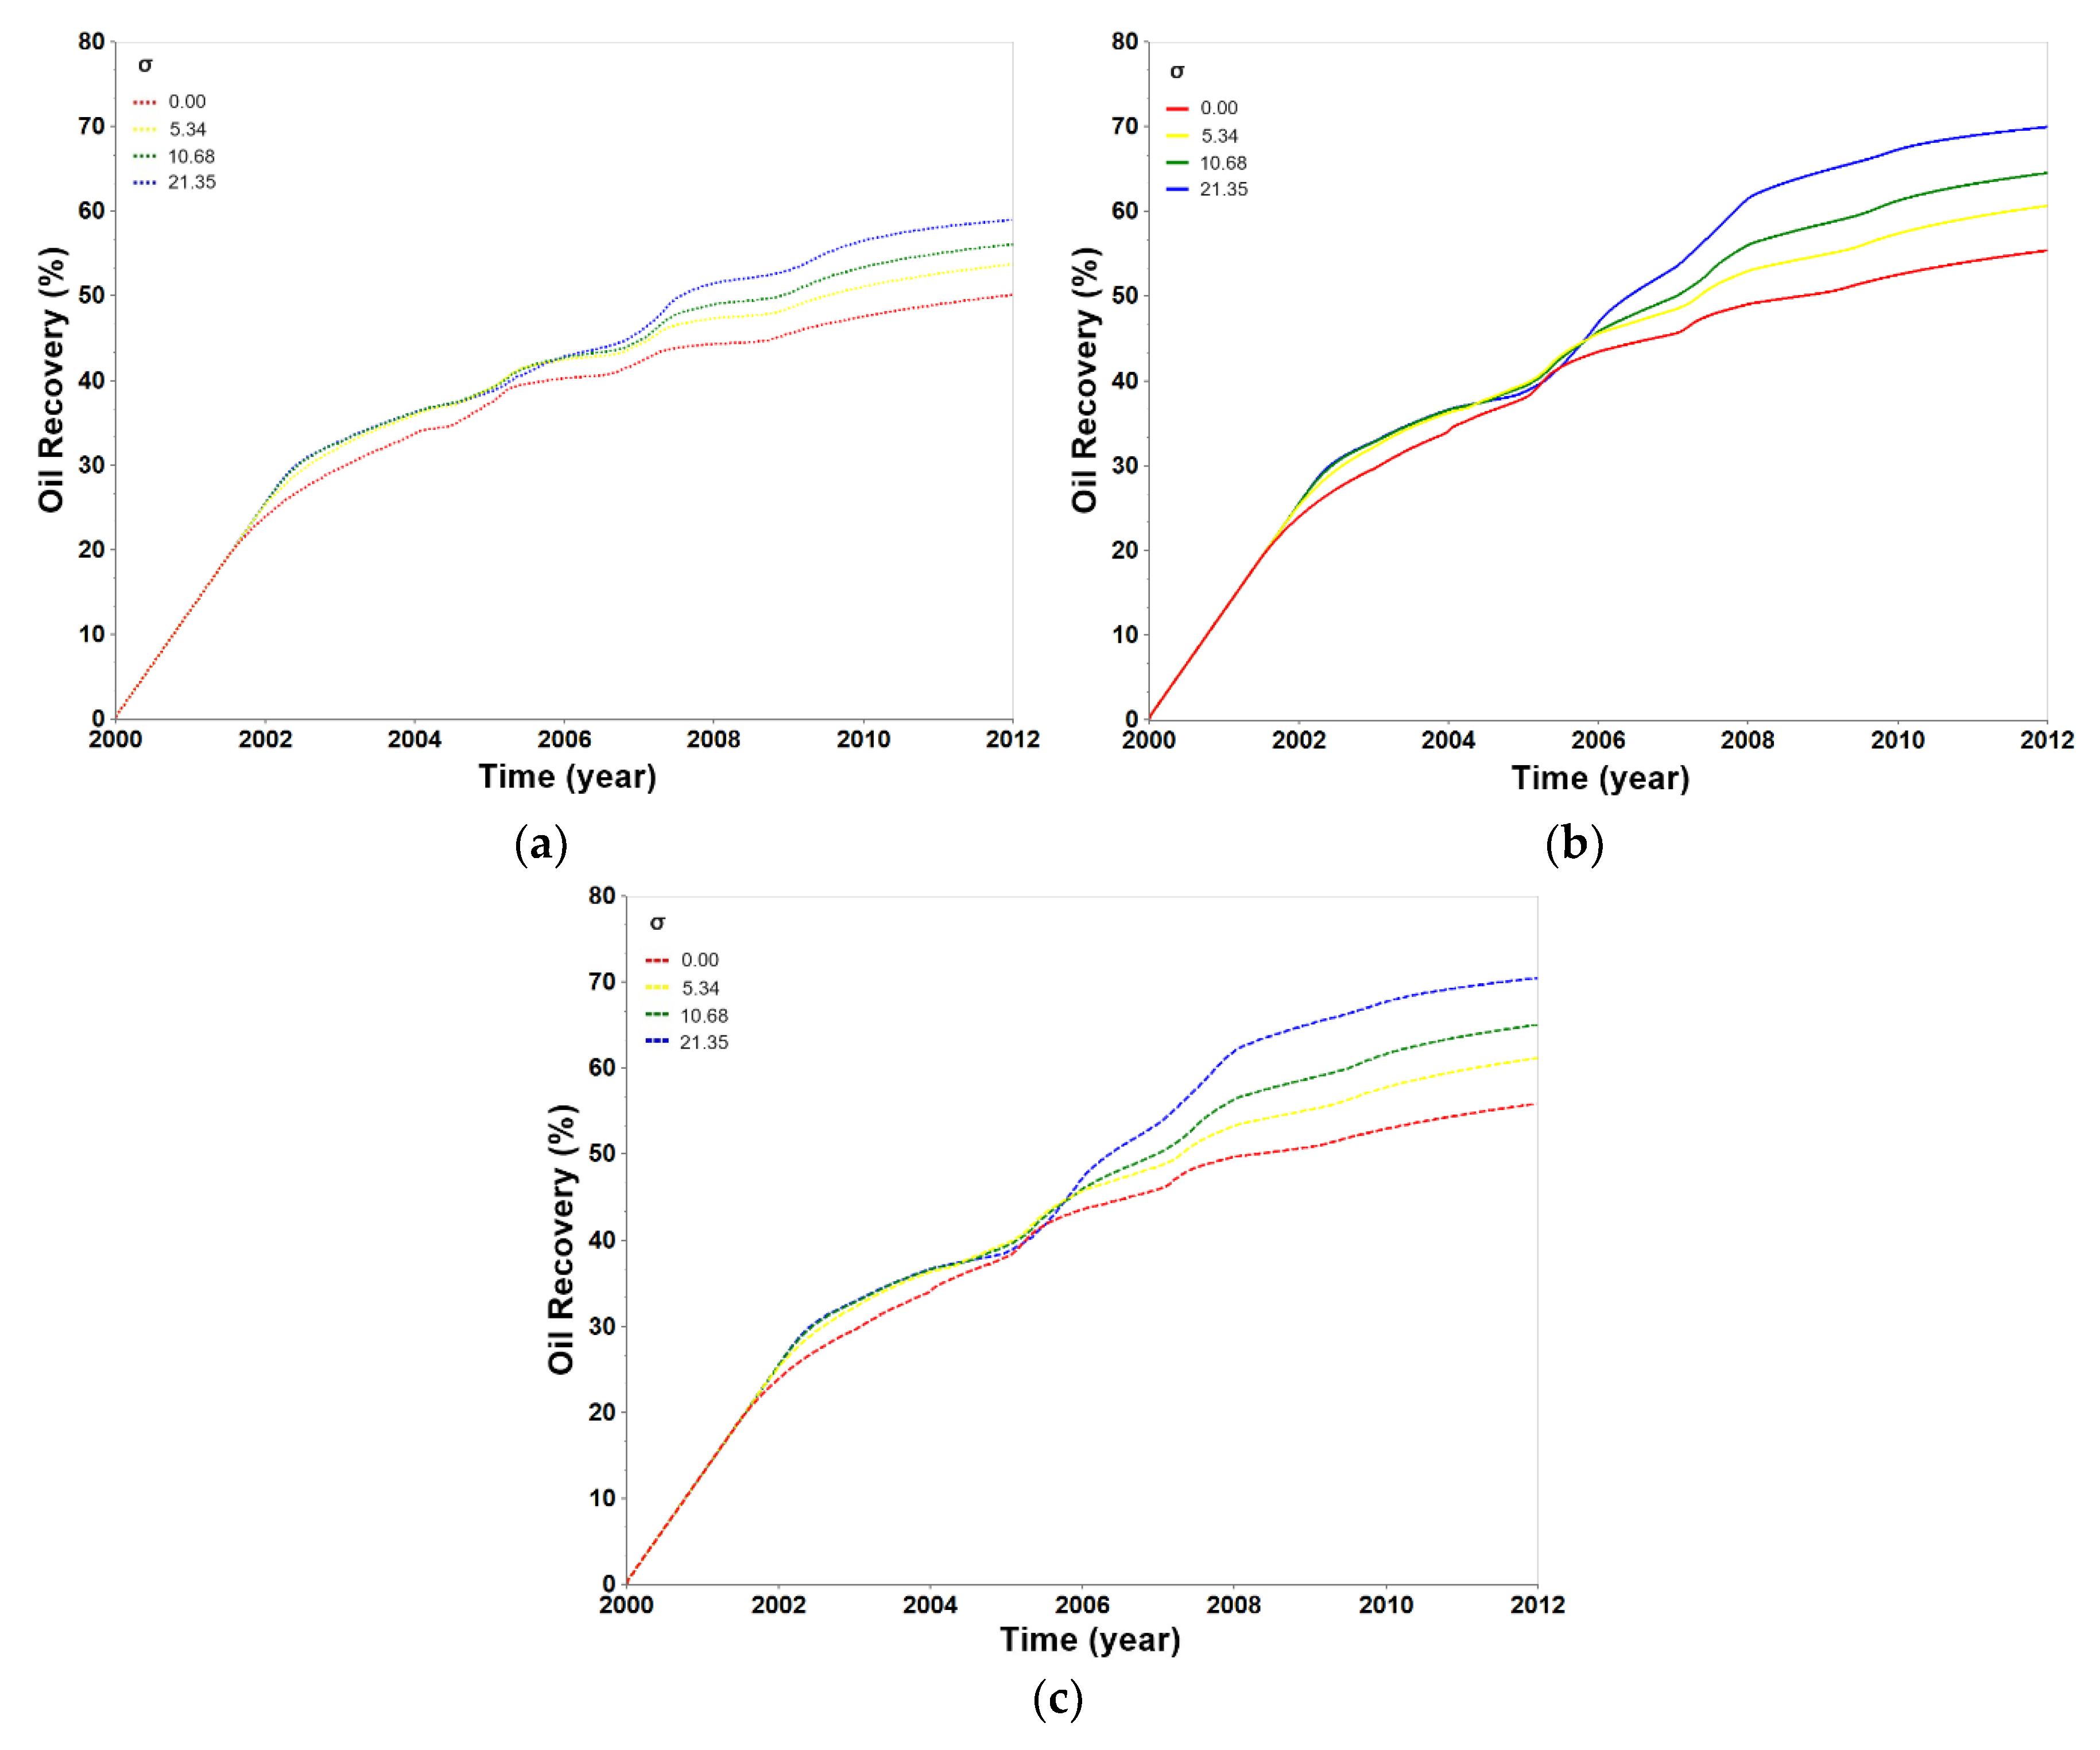
3.3. Recovery
3.4. Economic Evaluation
4. Limitations and Recommendations
- A field-scale reservoir model must be built using real reservoir data. In order to reflect real reservoir heterogeneity, which has a significant impact on oil recovery, both layered heterogeneity and random areal heterogeneity must be included. In this case, the collection of field-scale rock and fluid data is also important.
- A more sophisticated equation of state must be introduced for fluid modeling.
- By incorporating a geochemical reaction model, it is possible to reflect changes in porosity and permeability due to reactions between minerals and brine in carbonate rocks.
5. Conclusions
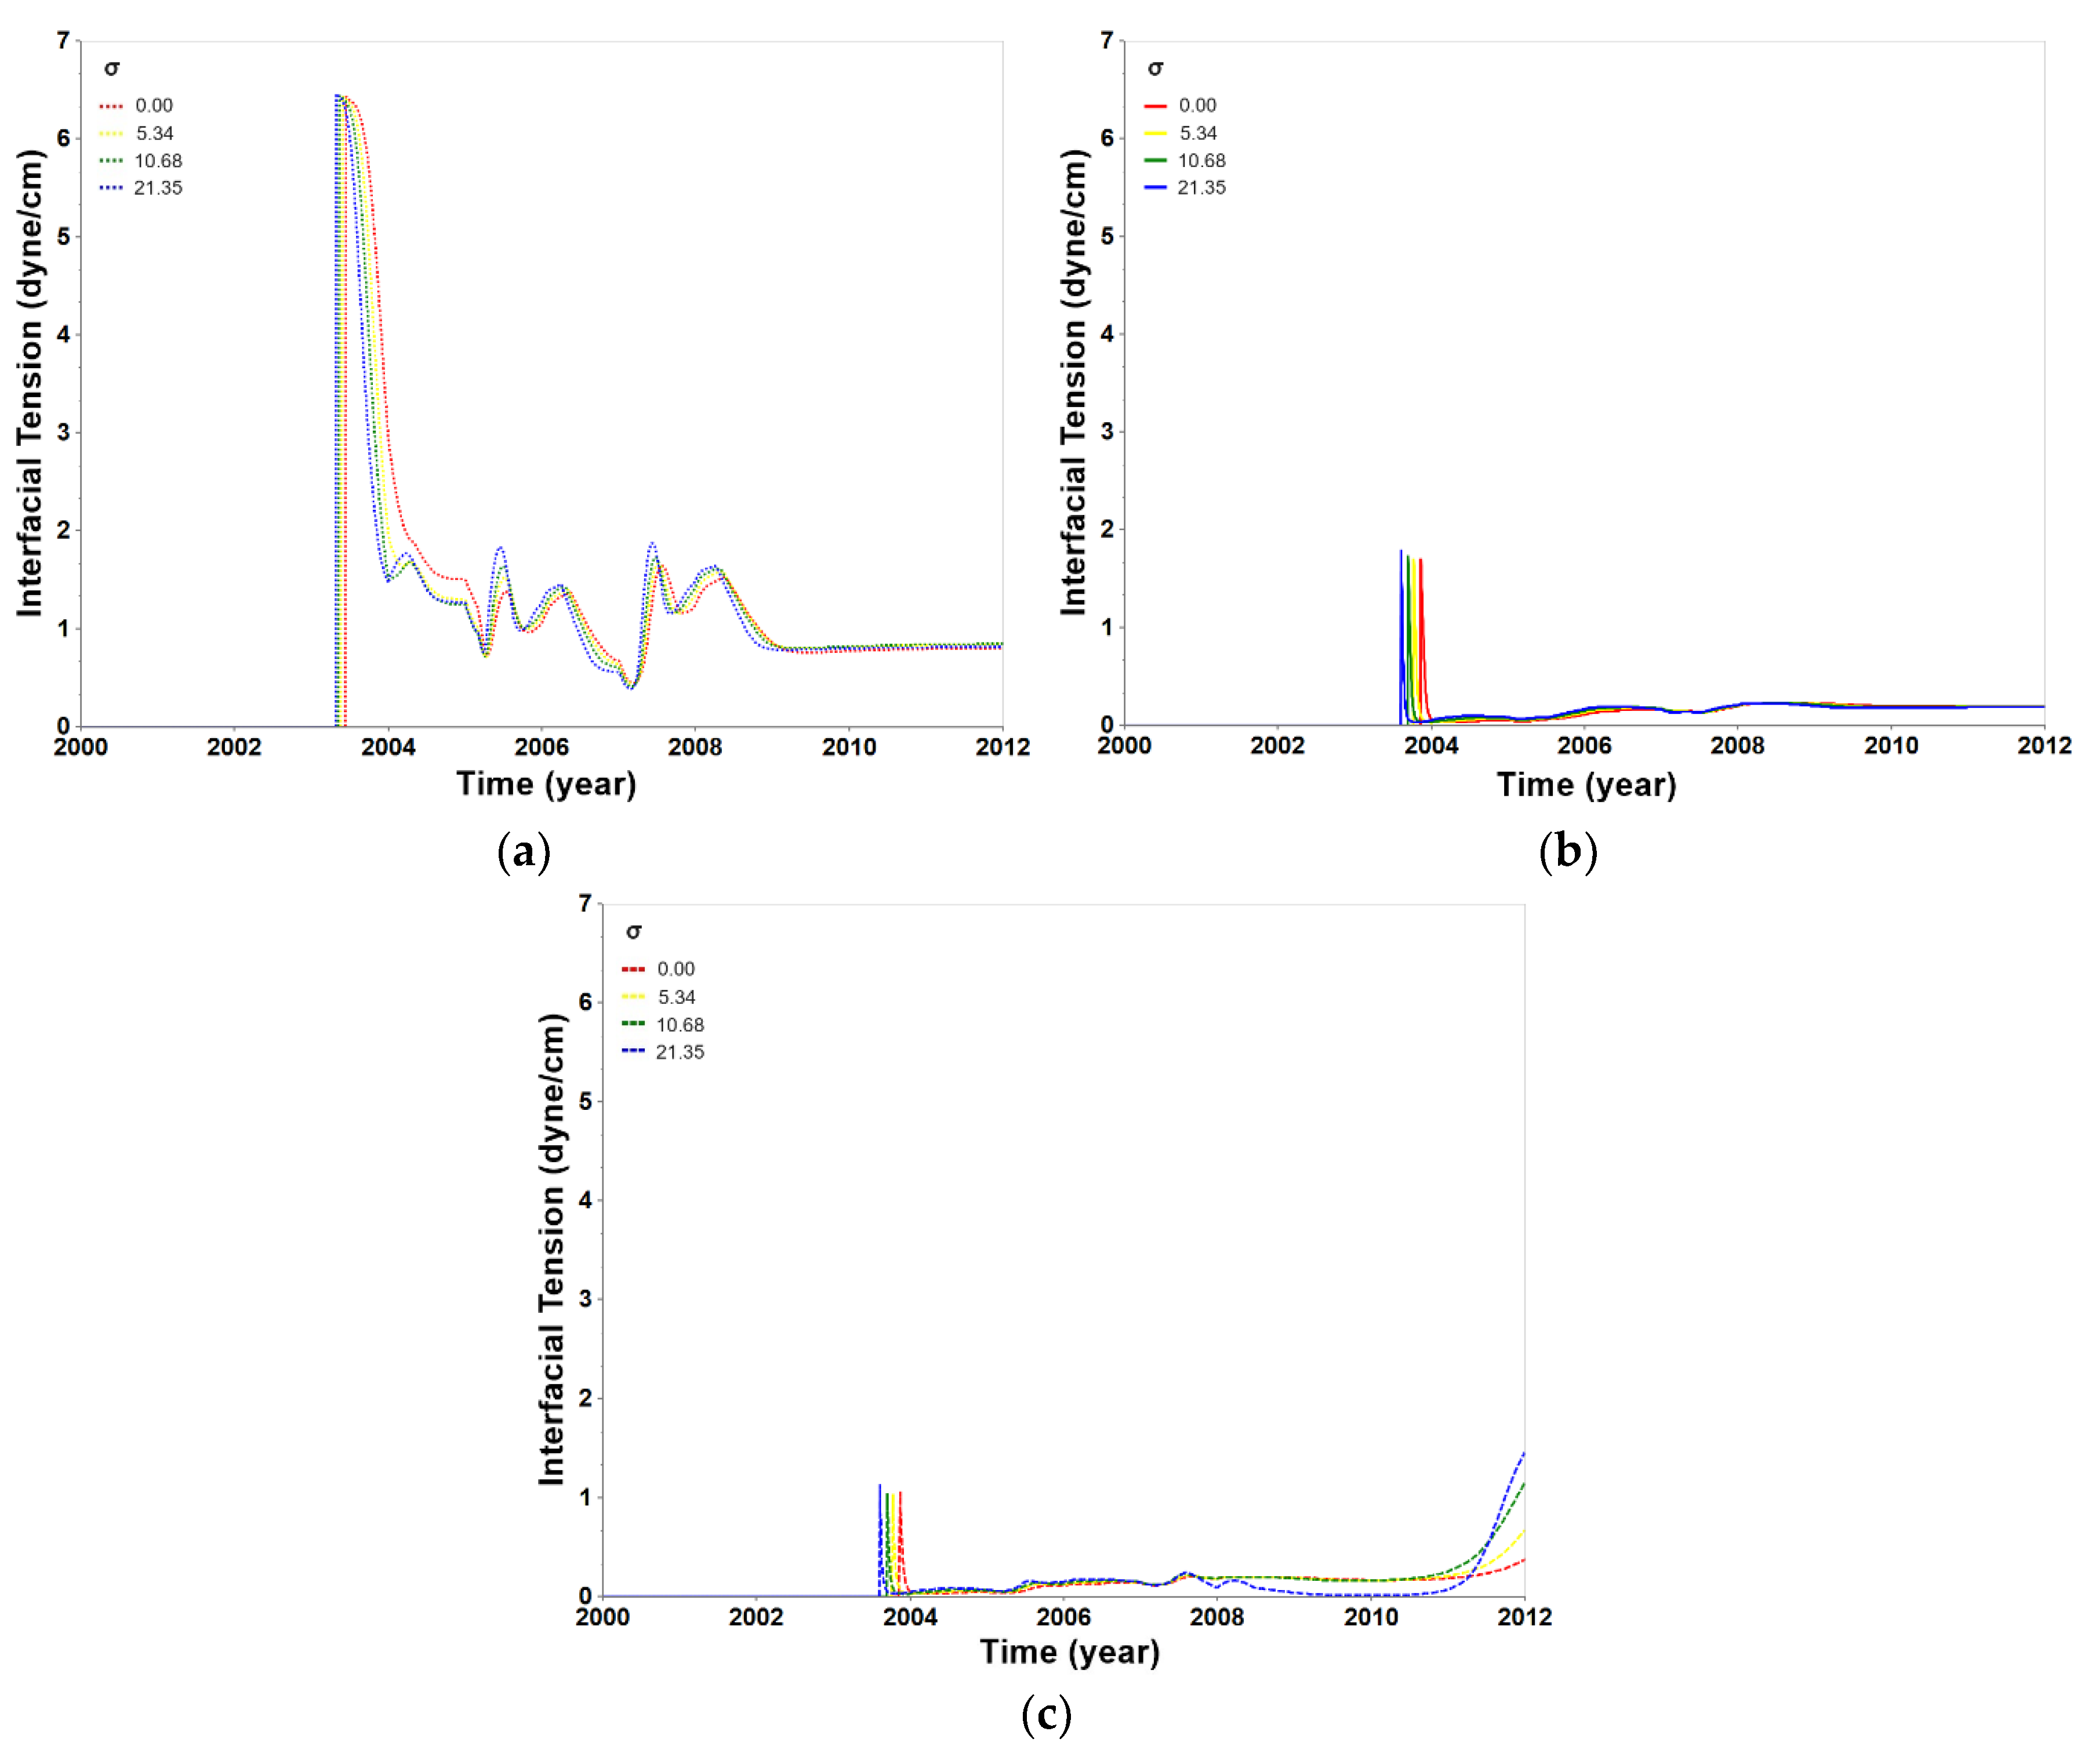
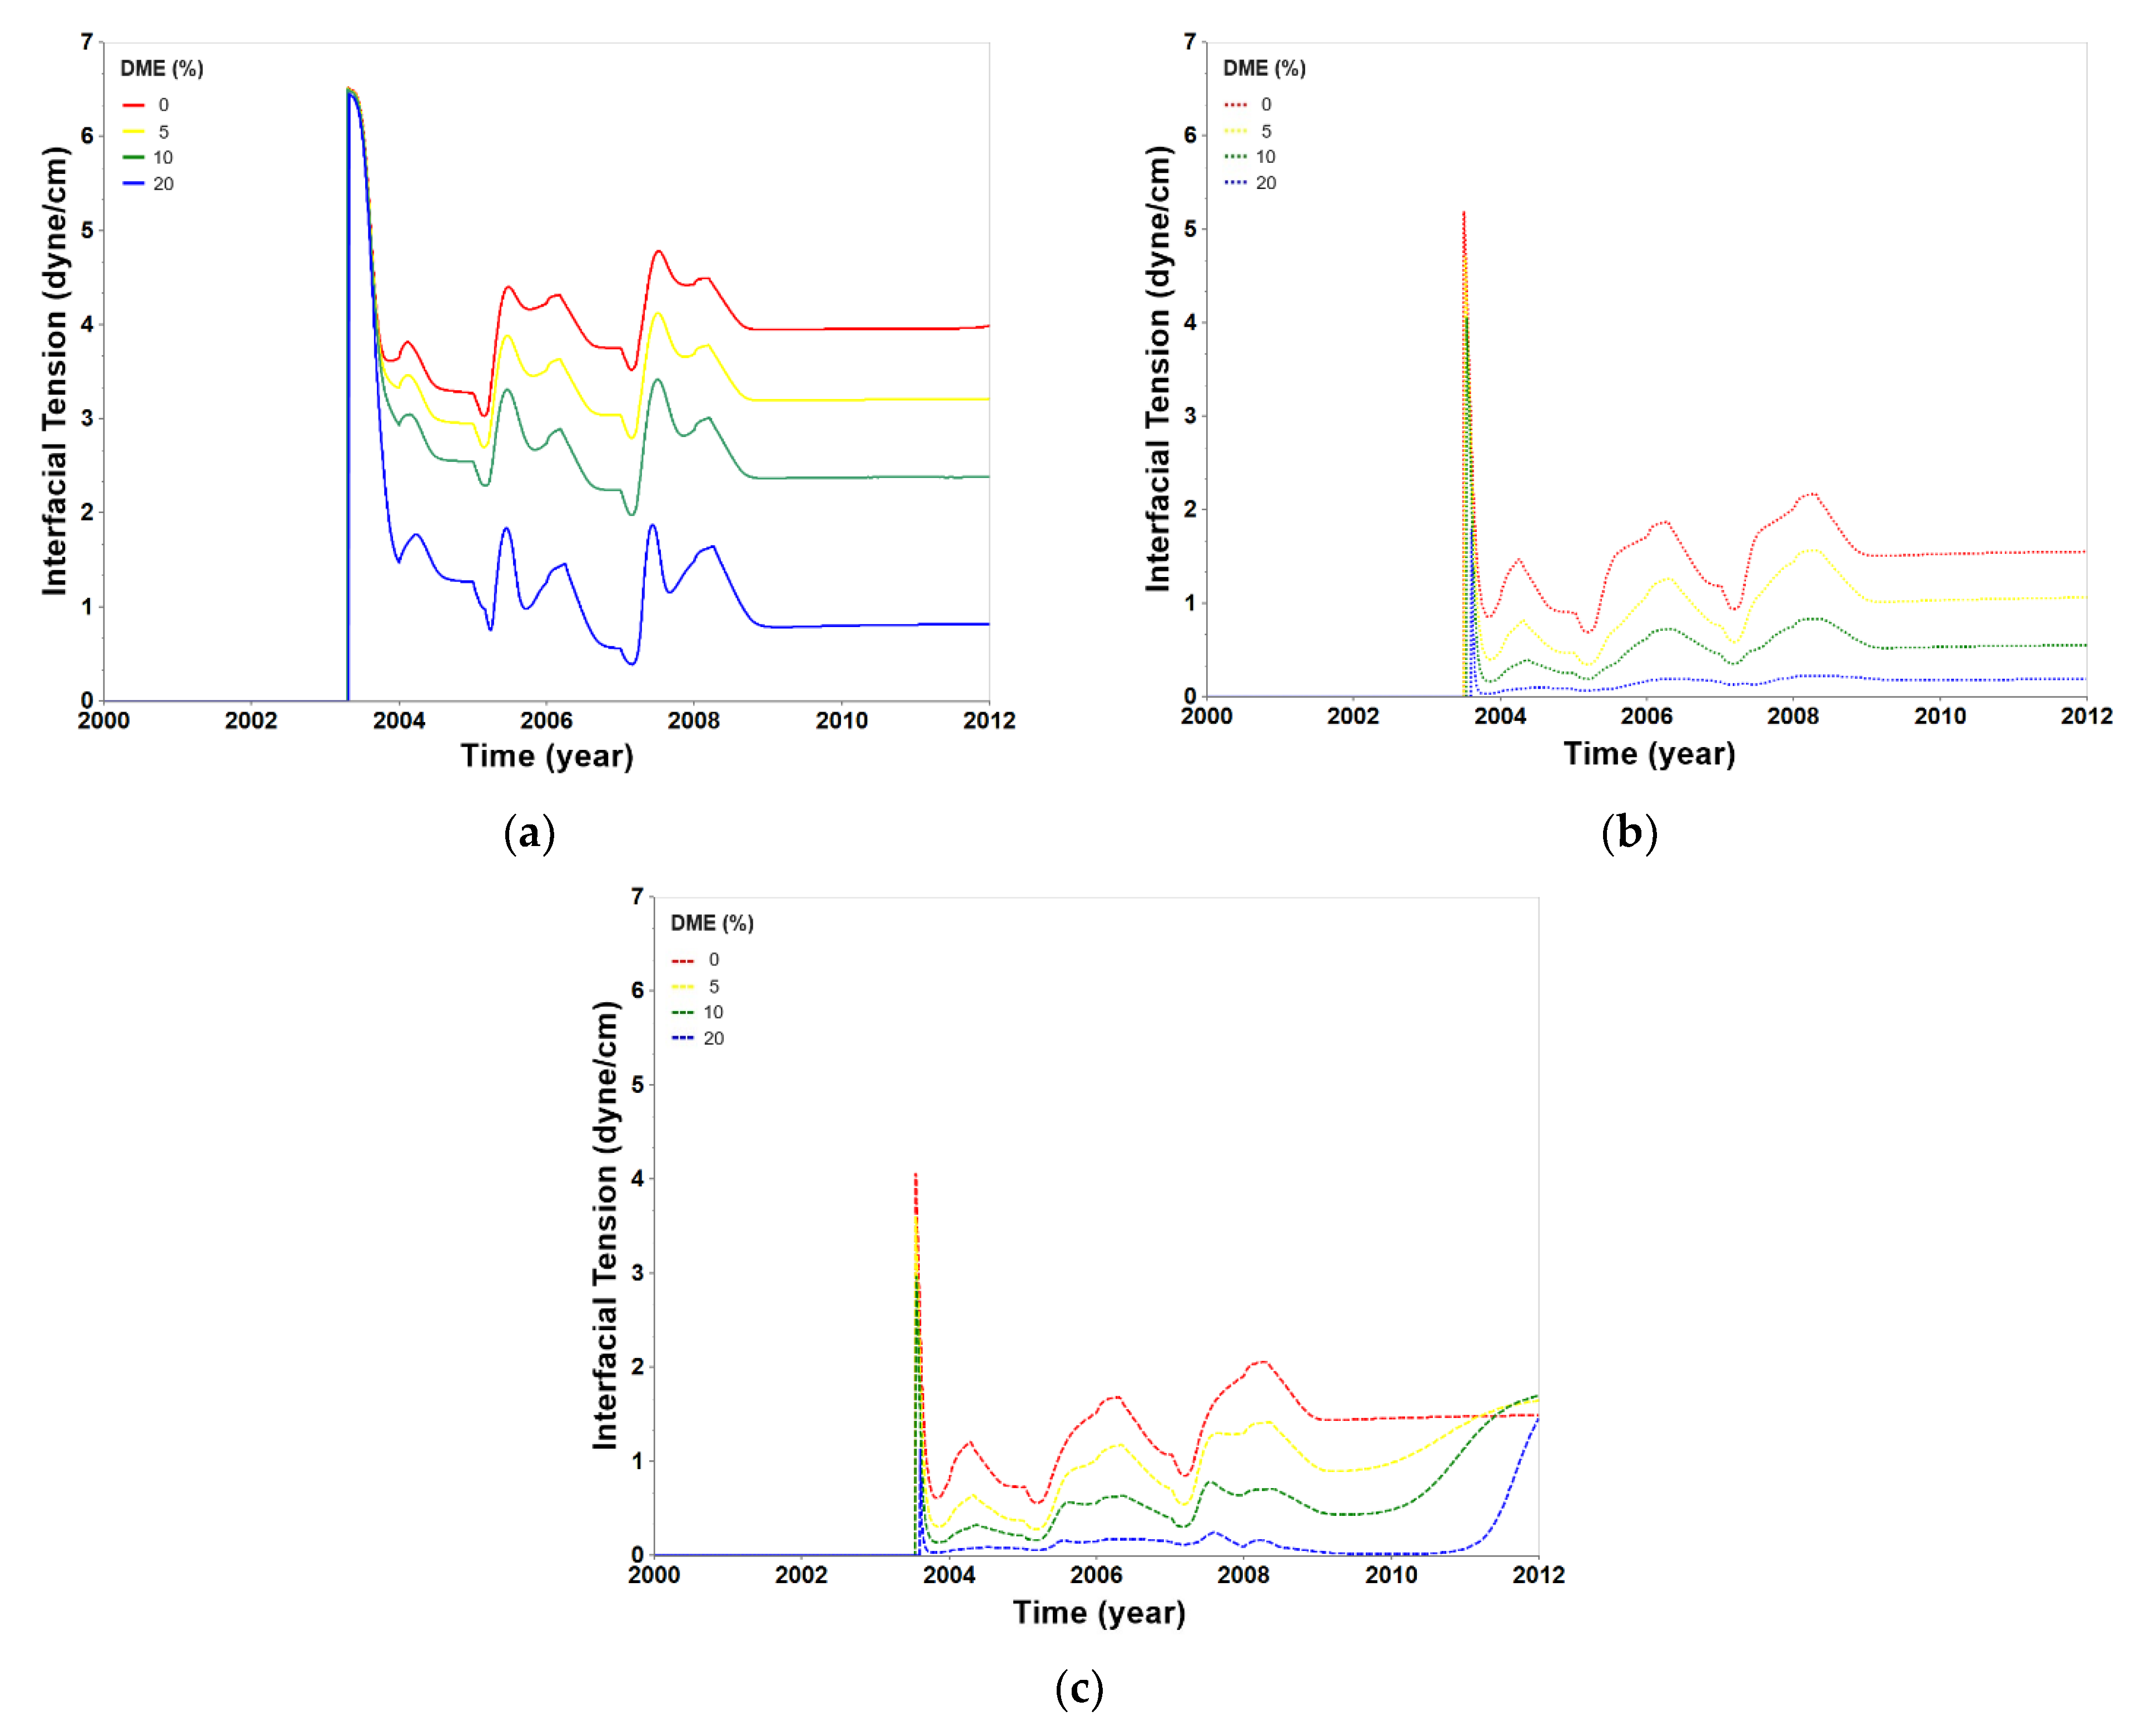
- The higher the heterogeneity of the reservoir, the lower the DME content; the lower the purity of the CO2 stream, the lower the slope in front of the swept area. The higher the CO2 purity, the greater the area with an oil viscosity of 0.5 cp or less. For the IFT, the higher the CO2 stream purity, the smaller the peak value; the higher the DME content, the greater the difference after the peak; and the higher the reservoir heterogeneity, the shorter the time to reach the peak.
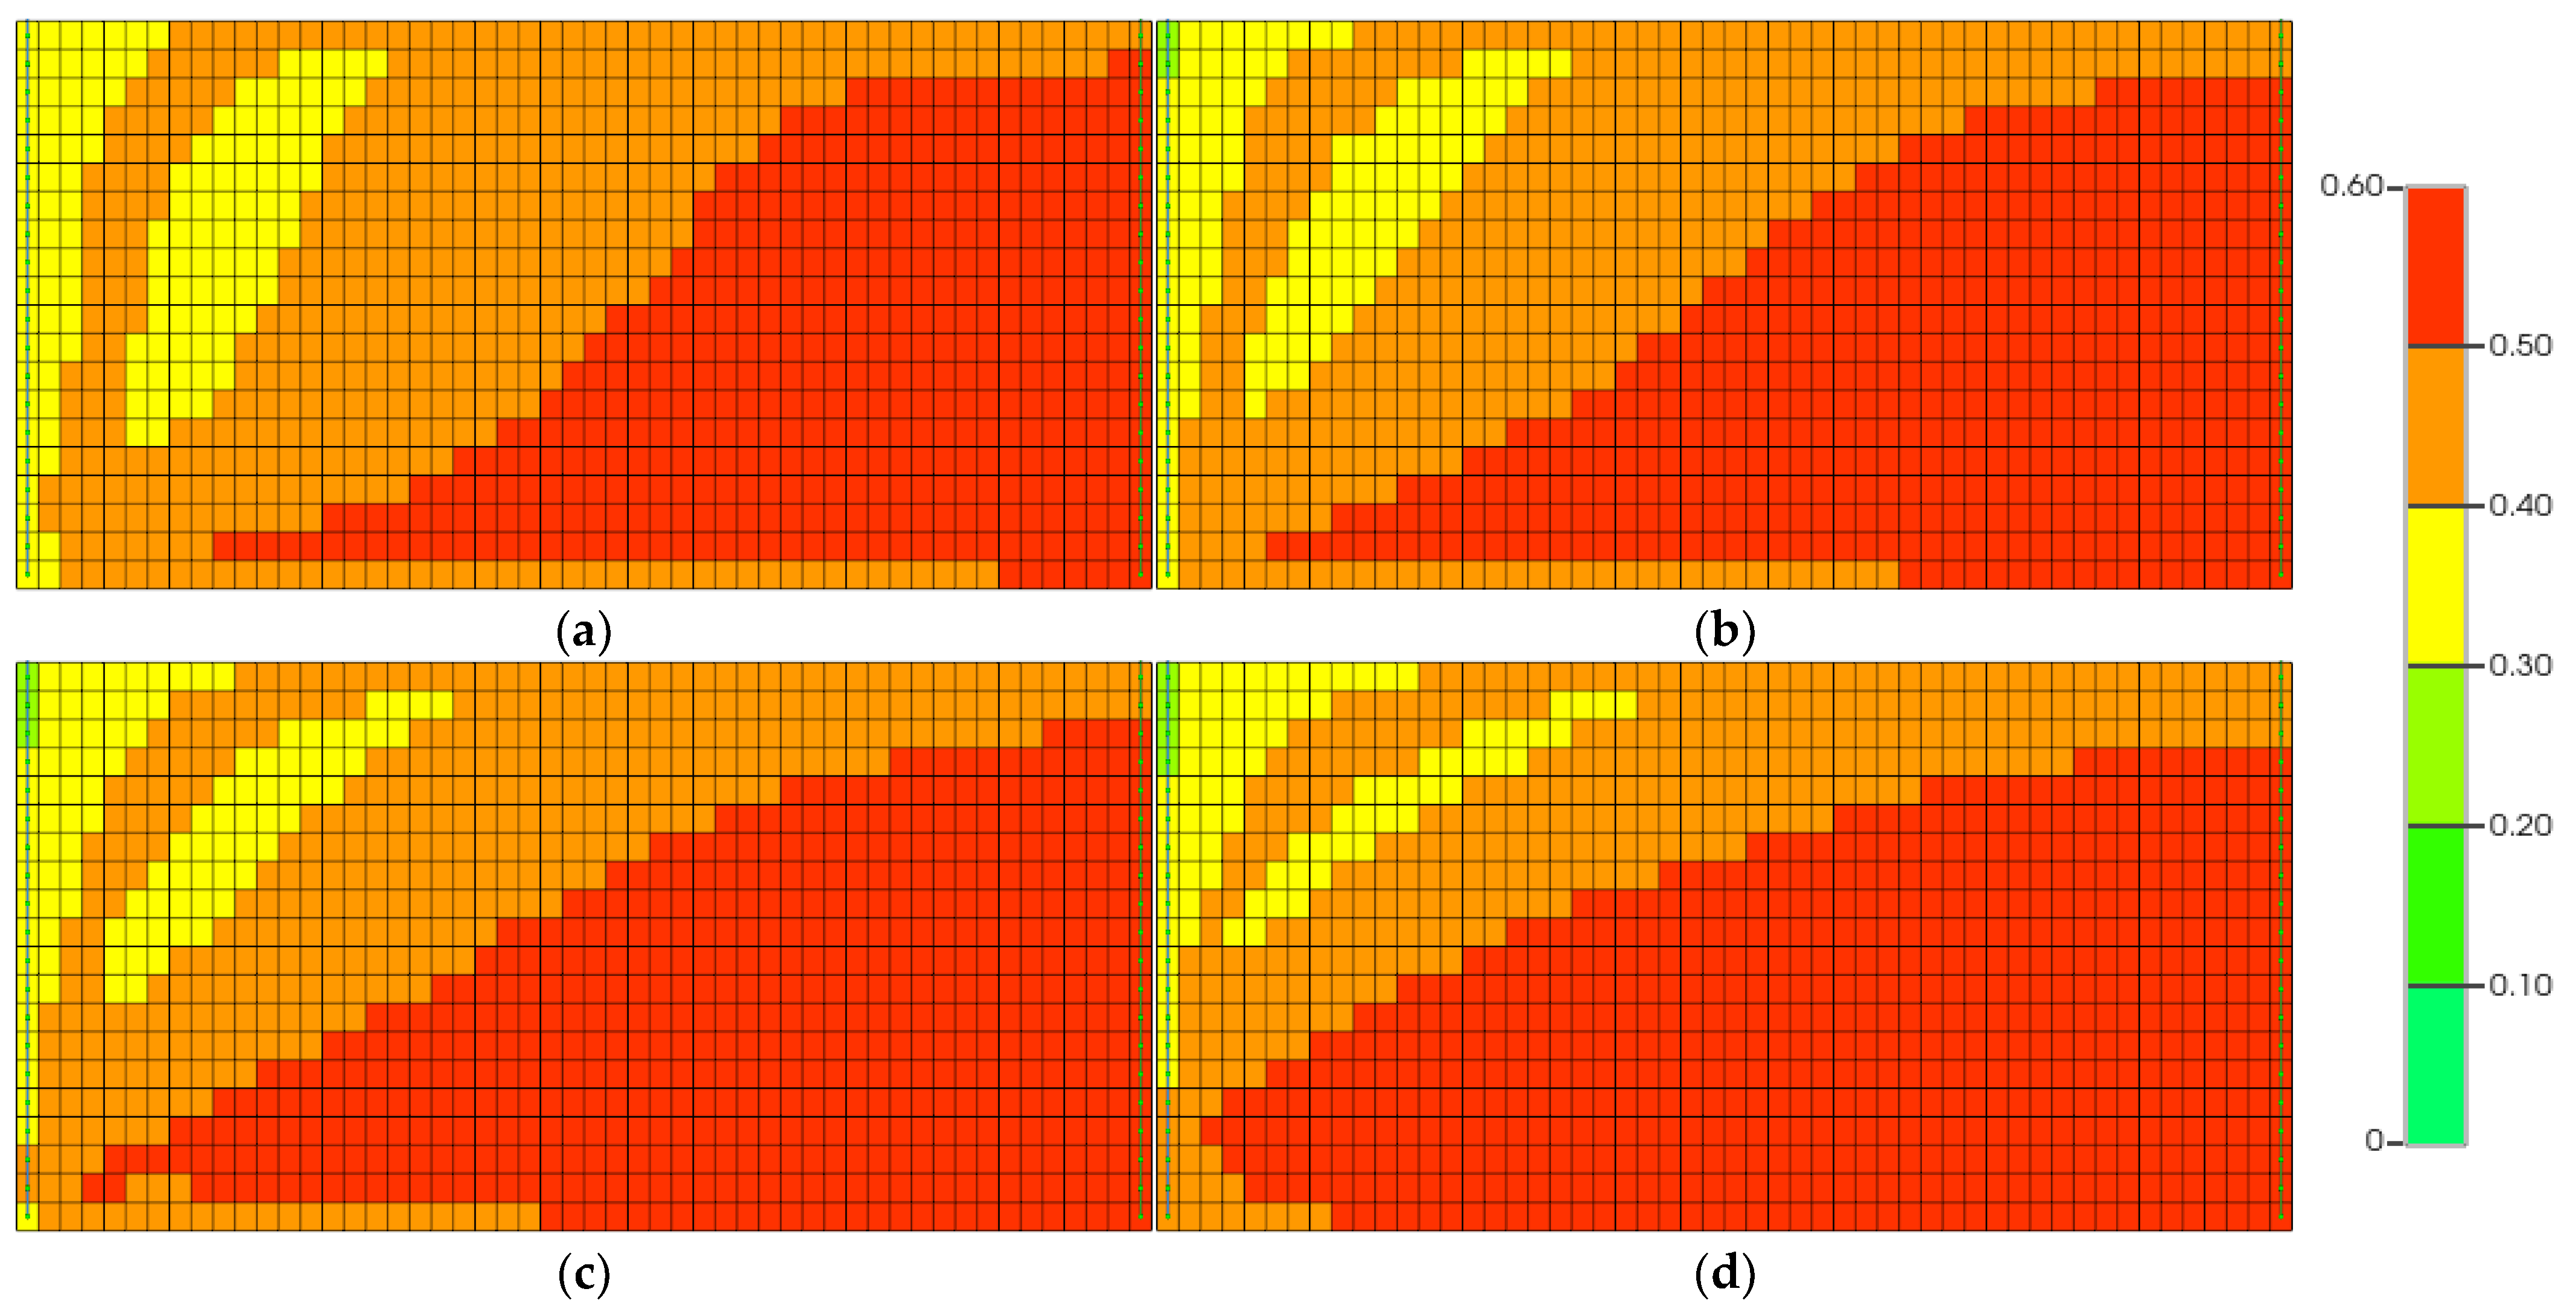
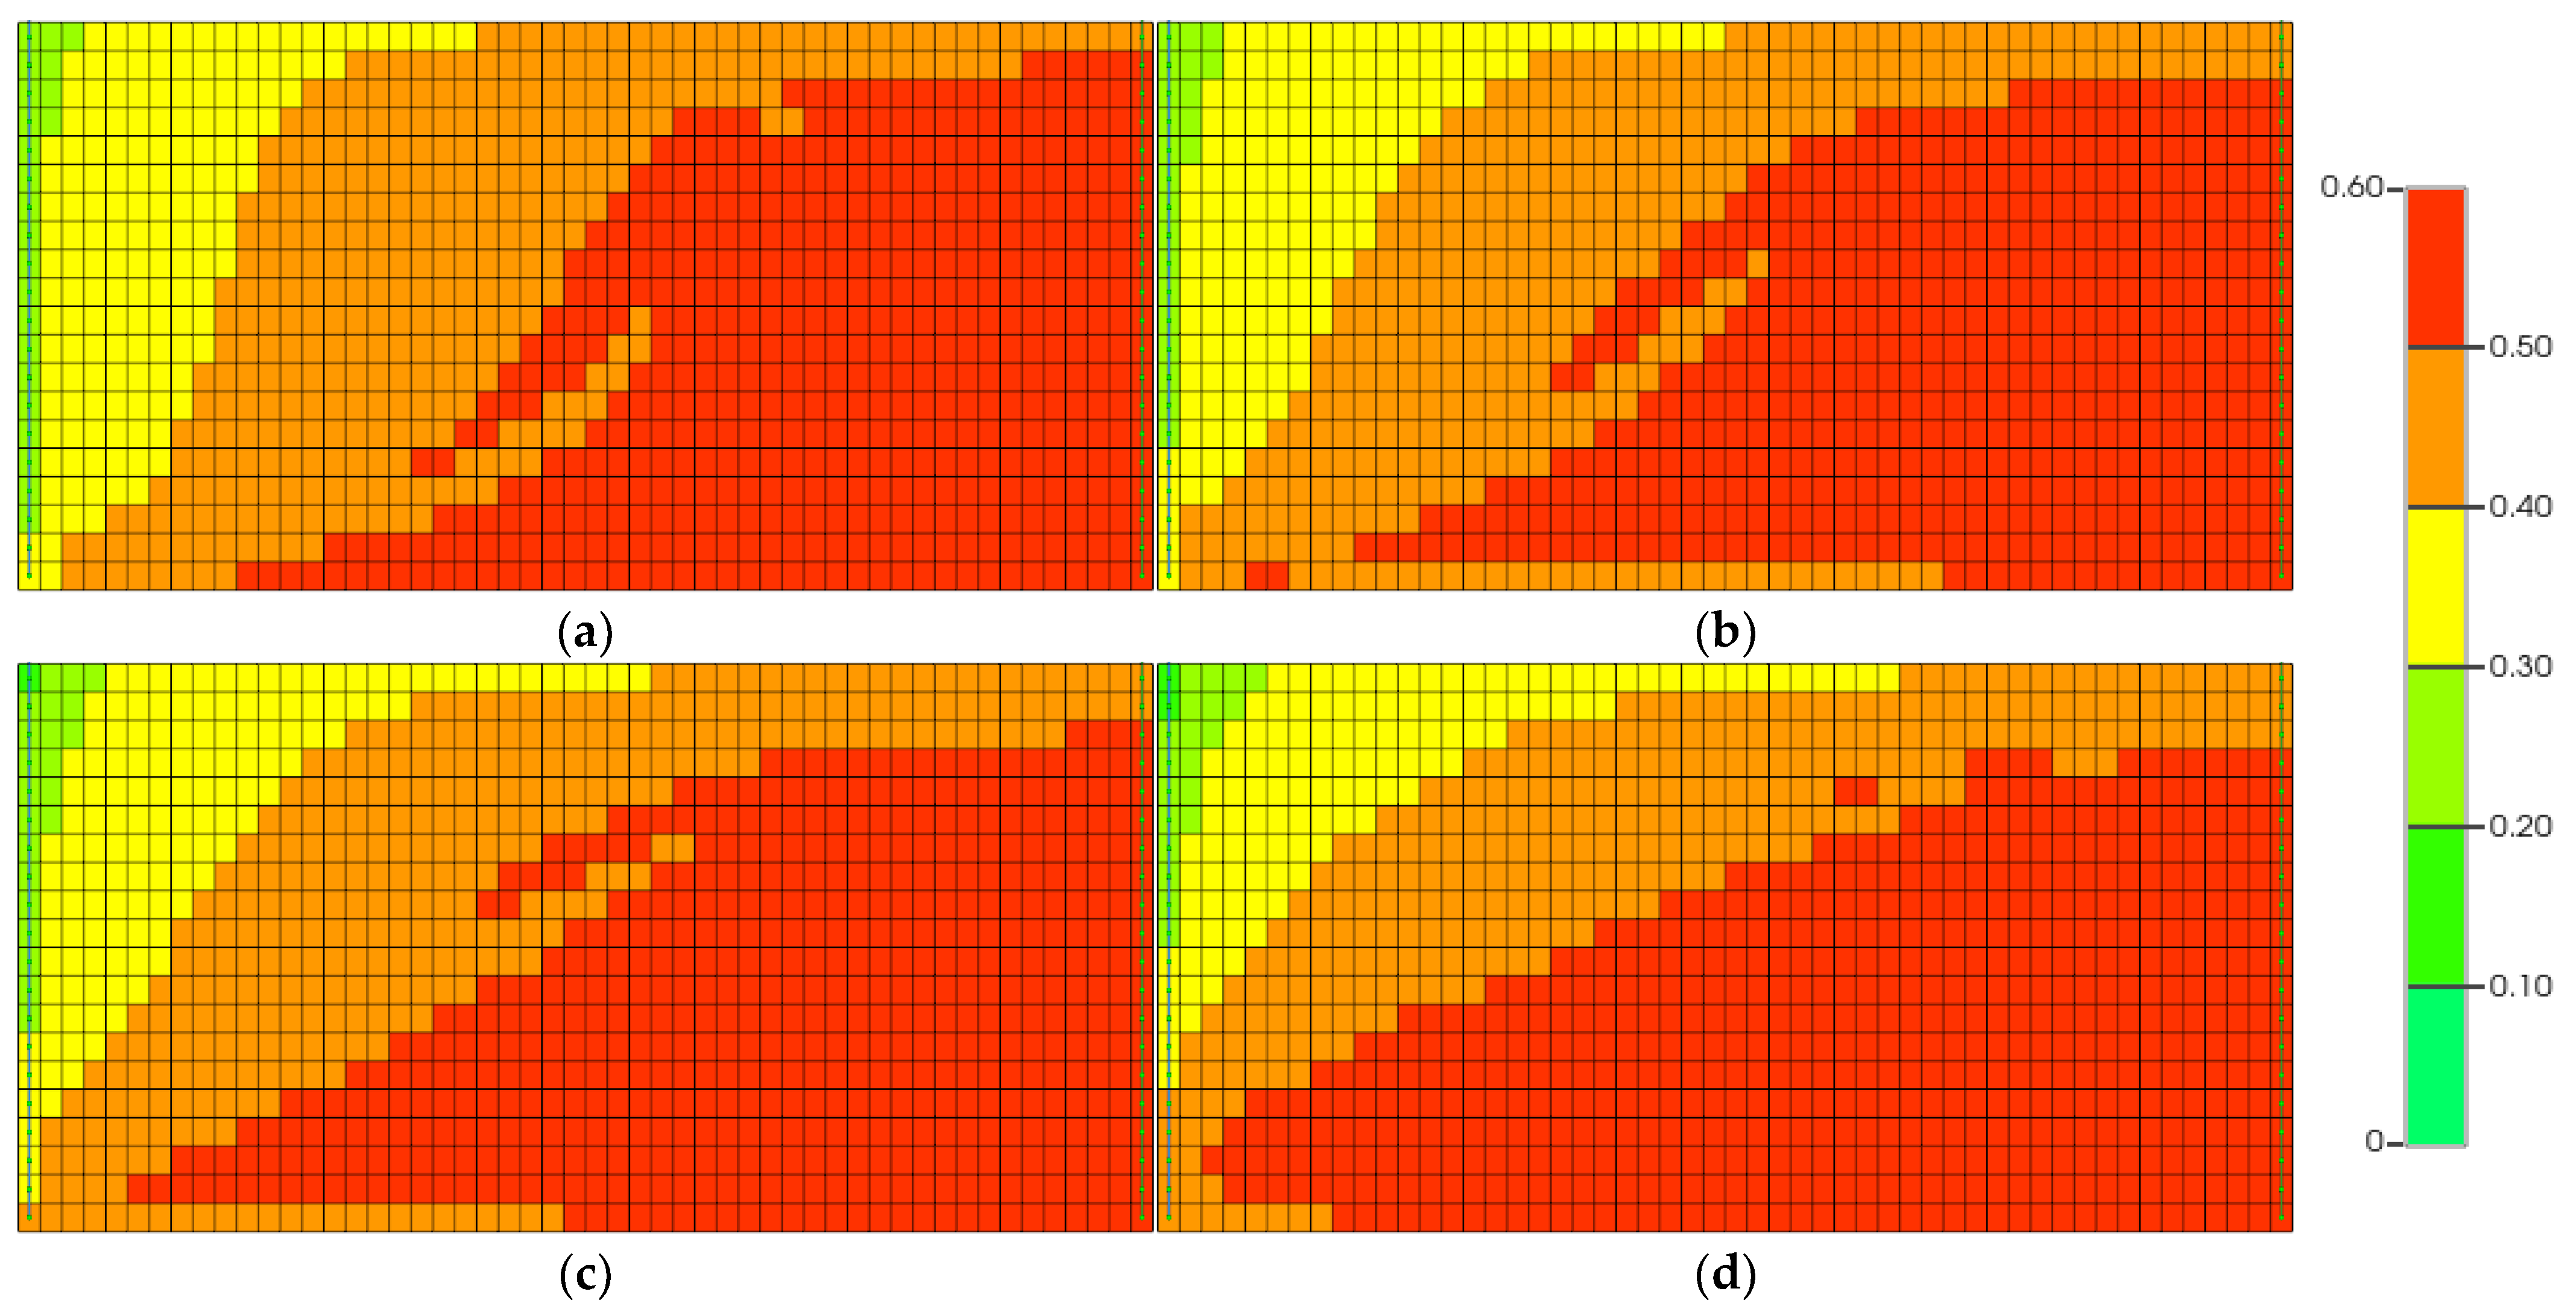
- The more heterogeneous the reservoir, the higher the remaining oil saturation (0.5 or more) in the lower part of the reservoir. In addition, the higher the DME content and the higher the CO2 purity, the greater the area with oil saturation of 0.3 or less. As CO2 purity increases, the breakthrough is delayed.
- When the dehydration and double flash CO2 streams were used, oil recovery decreased by 8.9%, from 59.0 to 50.1%, and by 14.6%, from 70.0 to 55.4%, respectively, due to increased reservoir heterogeneity when the DME content was 20%. As the DME content increased when the reservoir was heterogeneous, the oil recovery for dehydration and double flash increased by 4%, from 46.1 to 50.1%, and by 6.9%, from 48.5 to 55.4%, respectively. The oil recovery decreases as the reservoir becomes heterogeneous and the DME content decreases. In addition, the oil recovery increases as the purity of the CO2 stream increases.
- Since cost-cutting of the CO2 stream has a greater impact than reduction in oil recovery due to CO2 impurities, lower-purity CO2 leads to a higher NPV. For a given CO2 stream, the higher the DME content injected in the optimal scenario, the higher the oil price. Solvent reuse and CO2 credits are economically beneficial. With the less expensive dehydration CO2 stream, injection with some DME maximizes economic feasibility considering CO2 credits even when oil prices are low. For the dehydration CO2 stream, solvent reuse and CO2 credits with oil prices of USD 90, the DME content of 66% has a maximum NPV of USD 853,472, which is 121% of the maximum value of USD 703,712 from the DME content of 20% without solvent reuse and CO2 credits. For double flash CO2 stream is used, it is a 3.2% improvement over the NPV maximum value of USD 826,911 with 50% DME.
Author Contributions
Funding
Data Availability Statement
Conflicts of Interest
Nomenclature
| CCS | Carbon Capture and Storage |
| CMG | Computer Modeling Group |
| CPU | Compression and Purification Unit |
| DEW | DME-Enhanced Waterflooding |
| DME | Dimethyl Ether |
| EOR | Enhanced Oil Recovery |
| EOS | Equation of State |
| IFT | Interfacial Tension |
| MMP | Minimum Miscible Pressure |
| NPV | Net Present Value |
| PR | Peng–Robinson |
| WAG | Water-alternating-gas |
| Price of carbon as incentive for carbon storage at the th year [USD] | |
| CO2 purchase cost at the th year [USD] | |
| CO2 recycling cost at the th year [USD] | |
| Year numbering since the start of development | |
| Price of oil [USD/STB] | |
| Revenue from oil production at the th year [USD] | |
| Cumulative gas injection till the th year [MSCF] | |
| Cumulative gas injection till the th year [MSCF] | |
| Cumulative gas production till the th year [MSCF] | |
| Cumulative gas production till the th year [MSCF] | |
| Cumulative oil production till the th year [STB] | |
| Cumulative oil production till the th year [STB] | |
| Annual discount rate | |
| Recurrent operation cost at the th year [USD] | |
| Tax credit for carbon storage [USD/ton] | |
| Produced water management cost at the th year [USD] | |
| Standard deviation |
References
- Li, Q.; Li, Q.; Wu, J.; Li, X.; Li, H.; Cheng, Y. Wellhead stability during development process of hydrate reservoir in the Northern South China Sea: Evolution and mechanism. Processes 2025, 13, 40. [Google Scholar] [CrossRef]
- Li, Q.; Li, Q.; Cao, H.; Wu, J.; Wang, F.; Wang, Y. The crack propagation behaviour of CO2 fracturing fluid in unconventional low permeability reservoir: Factor analysis and mechanism revelation. Processes 2025, 13, 159. [Google Scholar] [CrossRef]
- Liang, S.; Luo, W.; Luo, Z.; Wang, W.; Xue, X.; Dong, B. Research of CO2-soluble surfactants for enhanced oil recovery: Review and outlook. Molecules 2023, 28, 8042. [Google Scholar] [CrossRef]
- Enick, R.M.; Ammer, J. A Literature Review of Attempts to Increase the Viscosity of Dense Carbon Dioxide. 1998. Available online: https://citeseerx.ist.psu.edu/document?repid=rep1&type=pdf&doi=899dccfc1e36981b94973f48d5bf62064ae56e14 (accessed on 10 January 2025).
- Islan, A.; Chevalier, S.; Sassi, M. Experimental and numerical studies of CO2 injection into water-saturated porous medium: Capillary to viscous to fracture fingering phenomenon. Energy Procedia 2013, 37, 5511–5519. [Google Scholar] [CrossRef]
- Massarweh, O.; Abushaikha, A.S. A review of recent developments in CO2 mobility control in enhanced oil recovery. Petroleum 2022, 8, 291–317. [Google Scholar] [CrossRef]
- Groot, J.A.; Chernetsky, A.; te Riele, P.M.; Dindoruk, B.; Cui, J.; Wilson, L.C.; Ratnakar, R. Representation of phase behavior and PVT workflow for DME enhanced water-flooding. In Proceedings of the SPE EOR Conference at Oil and Gas West Asia, Muscat, Oman, 21–23 March 2016. [Google Scholar]
- Cui, J.; Qi, Y.; Dindoruk, B. Measurement of transport properties and densities of dimethyl ether DME and water/brine mixtures. In Proceedings of the SPE Improved Oil Recovery Conference, Virtual, 31 August–4 September 2020. [Google Scholar]
- Salimi, H.; Ameri, A.; Nieuwerf, J. Dimethyl ether DME solvent based enhanced oil recovery technology—A laboratory and subsurface study. In Proceedings of the SPE Conference at Oman Petroleum & Energy Show, Muscat, Oman, 21–23 March 2022. [Google Scholar]
- Do, T.N.; Hur, Y.G.; Jeong, H.E.; Chung, J.W.; Won, W.; Kim, J. Rethinking of conventional Gas-to-Liquid via dimethyl ether intermediate incorporating renewable energy against Power-to-Liquid. Energy Convers. Manag. 2022, 261, 115643. [Google Scholar] [CrossRef]
- Chernetsky, A.; Masalmeh, S.; Eikmans, D.; Boerrigter, P.M.; Fadili, A.; Parsons, C.A.; Parker, A.; Boersma, D.M.; Cui, J.; Dindoruk, B.; et al. Novel enhanced oil recovery technique: Experimental results and modelling workflow of the DME enhanced waterflood technology. In Proceedings of the Abu Dhabi International Petroleum Exhibition and Conference, Abu Dhabi, United Arab Emirates, 9–12 November 2015. [Google Scholar]
- Noles, J.R.; Zollweg, J.A. Vapor-liquid equilibrium for chlorodifluoromethane+ dimethyl ether from 283 to 395 K at pressures to 5.0 MPa. J. Chem. Eng. Data 1992, 37, 306–310. [Google Scholar] [CrossRef]
- Chahardowli, M.; Farajzadeh, R.; Masalmeh, S.K.; Mahani, H.; Bruining, H. A novel enhanced oil recovery technology using dimethyl ether/brine: Spontaneous imbibition in sandstone and carbonate rocks. In Proceedings of the SPE Annual Technical Conference and Exhibition, Dubai, United Arab Emirates, 26–28 September 2016. [Google Scholar]
- te Riele, P.; Parsons, C.; Boerrigter, P.; Plantenberg, J.; Suijkerbuijk, B.; Burggraaf, J.; Chernetsky, A.; Boersma, D.; Broos, R. Implementing a water soluble solvent based enhanced oil recovery technology—Aspects of field development planning. In Proceedings of the SPE EOR Conference at Oil and Gas West Asia, Muscat, Oman, 21–23 March 2016. [Google Scholar]
- Javanmard, H.; Seyyedi, M.; Jones, S.A.; Nielsen, S.M. Dimethyl ether enhanced oil recovery in fractured reservoirs and aspects of phase behavior. Energy Fuel 2019, 33, 10718–10727. [Google Scholar] [CrossRef]
- Ratnakar, R.R.; Dindoruk, B.; Wilson, L.C. Experimental investigation of DME-water-crude oil phase behavior and PVT modeling for the application of DME-enhanced waterflooding. Fuel 2016, 182, 188–197. [Google Scholar] [CrossRef]
- Ratnakar, R.R.; Dindoruk, B.; Wilson, L.C. Development of empirical correlation for DME-partitioning between brine and crudes for enhanced waterflooding applications. J. Pet. Sci. Eng. 2017, 157, 264–272. [Google Scholar] [CrossRef]
- Lee, Y.W.; Lee, H.S.; Jeong, M.S.; Lee, K.S. Compositional modeling of dimethyl ether–CO2 mixed solvent for enhanced oil recovery. Appl. Sci. 2021, 11, 406. [Google Scholar] [CrossRef]
- Yang, M.; Chai, M.; Qi, R.; Chen, Z.; Zhang, L.; Yu, X. Dimethyl ether as a novel solvent for bitumen recovery: Mechanisms of improved mass transfer and energy efficiency. SPE J. 2022, 27, 1321–1340. [Google Scholar] [CrossRef]
- Huang, D.; Li, Y.; Yang, D. Phase behavior and physical properties of dimethyl ether/CO2/water/heavy oil systems under reservoir conditions. SPE J. 2023, 28, 301–318. [Google Scholar] [CrossRef]
- Li, Y.; Huang, D.; Dong, X.; Yang, D. Phase behaviour and physical properties of dimethyl ether (DME)/CO2/N2/water/heavy oil systems under reservoir conditions. In Proceedings of the ADIPEC, Abu Dhabi, United Arab Emirates, 2–5 October 2023. [Google Scholar]
- Li, Y.; Huang, D.; Dong, X.; Yang, D. Phase behaviour and physical properties of dimethyl ether (DME)/flue gas/water/heavy oil systems under reservoir conditions. Fuel 2024, 356, 129484. [Google Scholar] [CrossRef]
- Chai, M.; Chai, L.; Nourozieh, H.; Chen, Z.; Yang, M. A technical, economic, and environmental assessment on dimethyl ether (DME) as a renewable solvent from carbon dioxide utilization (CCU) for heavy oil recovery: A real field in Surmont, Canada as case study. Chem. Eng. J. 2024, 482, 148936. [Google Scholar] [CrossRef]
- Winprop module Tutorial, Computer Modeling Group. Version 2024.30. Available online: https://www.cmgl.ca/solutions/software/winprop/ (accessed on 10 January 2025).
- Peng, D.Y.; Robinson, D.B. A new two-constant equation of state. Ind. Eng. Chem. Fundam. 1976, 15, 1. [Google Scholar] [CrossRef]
- Srivastava, R.K.; Huang, S.S.; Dong, M. Laboratory investigation of Weyburn CO2 miscible flooding. J. Can. Pet. Technol. 2000, 39, 41–51. [Google Scholar] [CrossRef]
- Zheng, Q.; Watanabe, M. Advances in low-temperature extraction of natural resources using liquefied dimethyl ether. RCM 2022, 1, 16–26. [Google Scholar] [CrossRef]
- Lee, H.S.; Cho, J.; Lee, Y.W.; Lee, K.S. Compositional modeling of impure CO2 injection for enhanced oil recovery and CO2 storage. Appl. Sci. 2021, 11, 7907. [Google Scholar] [CrossRef]
- Cho, J.; Kim, T.H.; Lee, K.S. Compositional modeling and simulation of dimethyl ether (DME)-enhanced waterflood to investigate oil mobility improvement. Pet. Sci. 2018, 15, 297–304. [Google Scholar] [CrossRef]
- Bakhsh, A.; Liang, Z.; Wei, H.; Shaikh, A.; Khan, N.; Khan, S.; Shaoran, R. The approach of dimethyl ether-enhanced waterflooding (DEW) for oil recovery: A review. Arab. J. Geosci. 2022, 15, 520. [Google Scholar] [CrossRef]
- Kulynych, V. The influence of wettability on oil recovery. AGH Drill. Oil Gas 2015, 32, 493–502. [Google Scholar]
- Parsons, C.; Chernetsky, A.; Eikmans, D.; te Riele, P.; Boersma, D.; Sersic, I.; Broos, A. Introducing a novel enhanced oil recovery technology. In Proceedings of the SPE Improved Oil Recovery Conference, Tulsa, OK, USA, 11–13 April 2016. [Google Scholar]
- Wheaton, R. Basic Rock and Fluid Properties; Elsevier: Amsterdam, The Netherlands, 2016. [Google Scholar]
- Zhang, P.Y.; Huang, S.; Sayegh, S.; Zhou, X.L. Effect of CO2 impurities on gas-injection EOR processes. In Proceedings of the SPE Symposium on Improved Oil Recovery, Tulsa, OK, USA, 17–21 April 2004. [Google Scholar]
- Kolster, C.; Mechleri, E.; Krevor, S.; Mac Dowell, N. The role of CO2 purification and transport networks in carbon capture and storage cost reduction. Int. J. Greenh. Gas Control 2017, 58, 127–141. [Google Scholar] [CrossRef]
- Lee, K.S.; Cho, J.; Lee, J.H. CO2 Storage Coupled with Enhanced Oil Recovery; Springer: Cham, Switzerland, 2020. [Google Scholar]
- Núñez-López, V.; Moskal, E. Potential of CO2-EOR for near-term decarbonization. Front. Clim. 2019, 1, 5. [Google Scholar] [CrossRef]
- McCoy, S.T.; Rubin, E.S. The effect of high oil prices on EOR project economics. Energy Procedia 2009, 1, 4143–4150. [Google Scholar] [CrossRef]
- Ren, B.; Male, F.; Duncan, I.J. Economic analysis of CCUS: Accelerated development for CO2 EOR and storage in residual oil zones under the context of 45Q tax credit. Appl. Energy 2022, 321, 119393. [Google Scholar] [CrossRef]
- Leach, A.; Mason, C.F.; van’t Veld, K. Co-optimization of enhanced oil recovery and carbon sequestration. Resour. Energy Econ. 2011, 33, 893–912. [Google Scholar] [CrossRef]
- Wei, N.; Li, X.; Dahowski, R.T.; Davidson, C.L.; Liu, S.; Zha, Y. Economic evaluation on CO2-EOR of onshore oil fields in China. Int. J. Greenh. Gas Control 2015, 37, 170–181. [Google Scholar] [CrossRef]
- de França Lopes, G.; Bonfim-Rocha, L.; de Matos Jorge, L.M.; Paraíso, P.R. Dimethyl ether production from sugarcane vinasse: Modeling and simulation for a techno-economic assessment. Bioenergy Res. 2020, 13, 397–410. [Google Scholar] [CrossRef]
- Congressional Research Service. Available online: https://crsreports.congress.gov/product/pdf/IF/IF11455 (accessed on 10 January 2025).
- Cho, J.; Kim, T.H.; Lee, K.S. Compositional modeling of hybrid of CO2 EOR with intermediate hydrocarbon solvents to analyze the effect of toluene on asphaltene deposition. J. Pet. Sci. Eng. 2016, 146, 940–948. [Google Scholar] [CrossRef]
- Gomaa, S.; Emara, R.; Mahmoud, O.; El-hoshoudy, A.N. New correlations to calculate vertical sweep efficiency in oil reservoirs using nonlinear multiple regression and artificial neural network. J. King Saud Univ. Eng. Sci. 2022, 34, 368–375. [Google Scholar] [CrossRef]


| Component | Mole Fraction | Critical Pressure (MPa) | Critical Temperature (K) | Molecular Weight |
|---|---|---|---|---|
| N2 | 0.0207 | 3.394 | 126.2 | 28.01 |
| CO2 | 0.0074 | 7.376 | 304.2 | 44.01 |
| H2S | 0.0012 | 8.936 | 373.2 | 34.08 |
| C1 | 0.0749 | 4.600 | 190.6 | 16.04 |
| C2 | 0.0422 | 4.883 | 305.4 | 30.07 |
| C3 | 0.0785 | 4.245 | 369.8 | 44.09 |
| C4 | 0.0655 | 3.722 | 416.5 | 58.12 |
| C5 | 0.0459 | 3.379 | 464.9 | 72.15 |
| C6–9 | 0.2155 | 3.019 | 556.4 | 102.5 |
| C10–17 | 0.2202 | 2.017 | 692.3 | 184 |
| C18–27 | 0.1027 | 1.327 | 808.4 | 306.2 |
| C28+ | 0.1252 | 1.155 | 915.5 | 585.61 |
| DME | 0.0001 | 5.442 | 400.3 | 46.07 |
| N2 | CO2 | H2S | C1 | C2 | C3 | DME | C4 | C5 | C6–9 | C10–17 | C18–27 | C28 | |
|---|---|---|---|---|---|---|---|---|---|---|---|---|---|
| N2 | 0.00 | – | – | – | – | – | – | – | – | – | – | – | – |
| CO2 | 0.00 | 0.00 | – | – | – | – | – | – | – | – | – | – | – |
| H2S | 0.13 | 0.14 | 0.00 | – | – | – | – | – | – | – | – | – | – |
| C1 | 0.25 | 0.11 | 0.07 | 0.00 | – | – | – | – | – | – | – | – | – |
| C2 | 0.01 | 0.13 | 0.09 | 0.00 | 0.00 | – | – | – | – | – | – | – | – |
| C3 | 0.09 | 0.13 | 0.08 | 0.01 | 0.00 | 0.00 | – | – | – | – | – | – | – |
| DME | 0.10 | 0.00 | 0.00 | 0.29 | 0.25 | 0.25 | 0.00 | – | – | – | – | – | – |
| C4 | 0.10 | 0.12 | 0.08 | 0.02 | 0.01 | 0.00 | 0.25 | 0.00 | – | – | – | – | – |
| C5 | 0.10 | 0.12 | 0.07 | 0.02 | 0.01 | 0.00 | 0.25 | 0.00 | 0.00 | – | – | – | – |
| C6–9 | 0.11 | 0.12 | 0.05 | 0.03 | 0.02 | 0.01 | 0.02 | 0.00 | 0.00 | 0.00 | – | – | |
| C10–17 | 0.11 | 0.12 | 0.05 | 0.06 | 0.04 | 0.02 | 0.08 | 0.02 | 0.01 | 0.01 | 0.00 | – | – |
| C18–27 | 0.11 | 0.12 | 0.05 | 0.09 | 0.06 | 0.05 | 0.08 | 0.03 | 0.03 | 0.02 | 0.00 | 0.00 | – |
| C28 | 0.11 | 0.12 | 0.05 | 0.01 | 0.09 | 0.07 | 0.08 | 0.05 | 0.05 | 0.03 | 0.01 | 0.00 | 0.00 |
| Parameters | Fluid Model | Weyburn W3 |
|---|---|---|
| Saturation Pressure (MPa) | 4.78 | 4.92 |
| Oil Density at Saturation Pressure (kg/m3) | 805.7 | 806.4 |
| Oil Viscosity at Saturation Pressure (mPa·s) | 1.75 | 1.76 |
| Formation Volume Factor | 1.11 | 1.12 |
| Oil Gravity (°API) | 35 | 31 |
| Case | Standard Deviation |
|---|---|
| 1 | 0.00 |
| 2 | 5.34 |
| 3 | 10.68 |
| 4 | 21.35 |
| Standard Deviation | 0.00 | 5.34 | 10.68 | 21.35 | |
|---|---|---|---|---|---|
| Layer | |||||
| 1 | 50 | 59 | 68 | 86 | |
| 2 | 58 | 66 | 82 | ||
| 3 | 57 | 64 | 78 | ||
| 4 | 56 | 62 | 74 | ||
| 5 | 55 | 60 | 70 | ||
| 6 | 54 | 58 | 66 | ||
| 7 | 53 | 56 | 62 | ||
| 8 | 52 | 54 | 58 | ||
| 9 | 51 | 52 | 54 | ||
| 10 | 50 | 50 | 50 | ||
| 11 | 50 | 50 | 50 | ||
| 12 | 49 | 48 | 46 | ||
| 13 | 48 | 46 | 42 | ||
| 14 | 47 | 44 | 38 | ||
| 15 | 46 | 42 | 34 | ||
| 16 | 45 | 40 | 30 | ||
| 17 | 44 | 38 | 26 | ||
| 18 | 43 | 36 | 22 | ||
| 19 | 42 | 34 | 18 | ||
| 20 | 41 | 32 | 14 | ||
| Compression and Dehydration (Case 1) | Double Flash CPU (Case 2) | Distillation CPU (Case 3) | |
|---|---|---|---|
| CO2 (wt.%) | 77.4 | 96.5 | 100 |
| Ar (wt.%) | 3.19 | 0.545 | - |
| N2 (wt.%) | 11.4 | 1.55 | - |
| O2 (wt.%) | 7.96 | 1.36 | - |
| SO2 (ppmv) | 200 | 200 | - |
| Price (USD/ton) | 16.1 | 24.1 | 28.1 |
| Case | Injection Gas Composition |
|---|---|
| 1 | 100% CO2 Stream + 0% DME |
| 2 | 95% CO2 Stream + 5% DME |
| 3 | 90% CO2 Stream + 10% DME |
| 4 | 80% CO2 Stream + 20% DME |
| Properties | Values |
|---|---|
| Initial Pressure (MPa) | 13.8 |
| Grid Top (ft) | 4000 |
| Temperature (°F) | 145 |
| Initial Oil Saturation | 0.88 |
| Average Permeability (md) | 50 |
| Porosity | 0.3 |
| Total Injection (PV) | 1.5 |
| Variables | Values |
|---|---|
| DME Price (USD/ton) | 538 |
| CO2 Price (USD/ton) | 16.1, 24.1, 28.1 |
| Water Injection Cost (USD/bbl) | 1 |
| Oil Price (USD/bbl) | 30, 60, 90 |
| Yearly Discount Rate (%) | 10 |
| DME Recycling Cost (USD/ton) | 254 |
| CO2 Recycling Cost (USD/ton) | 12 |
| CO2 Credit Price (USD/ton) | 27.61 |
| Standard Deviation | 0.00 | 5.34 | 10.68 | 21.35 | |
| DME Content (%) | |||||
| 0 | 1046 | 1005 | 973 | 930 | |
| 5 | 1050 | 1008 | 976 | 932 | |
| 10 | 1054 | 1012 | 980 | 936 | |
| 20 | 1077 | 1039 | 1010 | 967 | |
| (a) | |||||
| Standard Deviation | 0.00 | 5.34 | 10.68 | 21.35 | |
| DME Content (%) | |||||
| 0 | 1266 | 1179 | 1119 | 1054 | |
| 5 | 1286 | 1198 | 1134 | 1064 | |
| 10 | 1325 | 1224 | 1151 | 1073 | |
| 20 | 1448 | 1221 | 1150 | 1101 | |
| (b) | |||||
| Standard Deviation | 0.00 | 5.34 | 10.68 | 21.35 | |
| DME Content (%) | |||||
| 0 | 1301 | 1206 | 1137 | 1065 | |
| 5 | 1322 | 1221 | 1149 | 1071 | |
| 10 | 1358 | 1246 | 1167 | 1079 | |
| 20 | 1472 | 1233 | 1160 | 1107 | |
| (c) | |||||
| Oil Prices | 30 USD/bbl | 60 USD/bbl | 90 USD/bbl | ||||
|---|---|---|---|---|---|---|---|
| Objective Function | NPV (USD) | Oil Recovery (%) | NPV (USD) | Oil Recovery (%) | NPV (USD) | Oil Recovery (%) | |
| Case | |||||||
| Without Solvent Reuse | CO2 100% + DME 0% (NPV Max at 30 USD/bbl) | 225,424 | 46.1 | - | - | - | - |
| CO2 89% + DME 11% (NPV Max at 60 USD/bbl) | - | - | 489,640 | 47.7 | - | - | |
| CO2 80% + DME 20% (NPV Max at 90 USD/bbl) | - | - | - | - | 703,712 | 50.1 | |
| Solvent Reuse | CO2 100% + DME 0% (NPV Max at 30 USD/bbl) | 250,150 | 46.1 | - | - | - | - |
| CO2 80% + DME 20% (NPV Max at 60 USD/bbl) | - | - | 511,307 | 50.1 | - | - | |
| CO2 62% + DME 38% (NPV Max at 90 USD/bbl) | - | - | - | - | 770,286 | 56.6 | |
| Oil Prices | 30 USD/bbl | 60 USD/bbl | 90 USD/bbl | ||||
|---|---|---|---|---|---|---|---|
| Objective Function | NPV (USD) | Oil Recovery (%) | NPV (USD) | Oil Recovery (%) | NPV (USD) | Oil Recovery (%) | |
| Case | |||||||
| Without Solvent Reuse + Credit | CO2 97% + DME 3% (NPV Max at 30 USD/bbl) | 254,615 | 46.4 | - | - | - | - |
| CO2 77% + DME 23% (NPV Max at 60 USD/bbl) | - | - | 529,805 | 50.9 | - | - | |
| CO2 51% + DME 49% (NPV Max at 90 USD/bbl) | - | - | - | - | 772,999 | 61.0 | |
| Solvent Reuse + Credit | CO2 95% + DME 5% (NPV Max at 30 USD/bbl) | 289,711 | 46.7 | - | - | - | - |
| CO2 68% + DME 32% (NPV Max at 60 USD/bbl) | - | - | 574,132 | 54.5 | - | - | |
| CO2 34% + DME 66% (NPV Max at 90 USD/bbl) | - | - | - | - | 853,472 | 68.2 | |
| Oil Prices | 30 USD/bbl | 60 USD/bbl | 90 USD/bbl | ||||
|---|---|---|---|---|---|---|---|
| Objective Function | NPV (USD) | Oil Recovery (%) | NPV (USD) | Oil Recovery (%) | NPV (USD) | Oil Recovery (%) | |
| Case | |||||||
| Without Solvent Reuse | CO2 100% + DME 0% (NPV Max at 30 USD/bbl) | 198,718 | 48.5 | - | - | - | - |
| CO2 93% + DME 7% (NPV Max at 60 USD/bbl) | - | - | 451,669 | 50.3 | - | - | |
| CO2 86% + DME 14% (NPV Max at 90 USD/bbl) | - | - | - | - | 690,238 | 52.5 | |
| Solvent Reuse | CO2 100% + DME 0% (NPV Max at 30 USD/bbl) | 221,803 | 48.5 | - | - | - | - |
| CO2 85% + DME 15% (NPV Max at 60 USD/bbl) | - | - | 500,972 | 53.0 | - | - | |
| CO2 72% + DME 28% (NPV Max at 90 USD/bbl) | - | - | - | - | 735,943 | 58.8 | |
| Oil Prices | 30 USD/bbl | 60 USD/bbl | 90 USD/bbl | ||||
|---|---|---|---|---|---|---|---|
| Objective Function | NPV (USD) | Oil Recovery (%) | NPV (USD) | Oil Recovery (%) | NPV (USD) | Oil Recovery (%) | |
| Case | |||||||
| Without Solvent Reuse + Credit | CO2 100% + DME 0% (NPV Max at 30 USD/bbl) | 242,988 | 48.5 | - | - | - | - |
| CO2 82% + DME 18% (NPV Max at 60 USD/bbl) | - | - | 517,757 | 54.7 | - | - | |
| CO2 63% + DME 37% (NPV Max at 90 USD/bbl) | - | - | - | - | 736,005 | 62.2 | |
| Solvent Reuse + Credit | CO2 100% + DME 0% (NPV Max at 30 USD/bbl) | 275,330 | 48.5 | - | - | - | - |
| CO2 74% + DME 26% (NPV Max at 60 USD/bbl) | - | - | 546,201 | 58.0 | - | - | |
| CO2 50% + DME 50% (NPV Max at 90 USD/bbl) | - | - | - | - | 826,911 | 69.1 | |
| Oil Prices | 30 USD/bbl | 60 USD/bbl | 90 USD/bbl | ||||
|---|---|---|---|---|---|---|---|
| Objective Function | NPV (USD) | Oil Recovery (%) | NPV (USD) | Oil Recovery (%) | NPV (USD) | Oil Recovery (%) | |
| Case | |||||||
| Without Solvent Reuse | CO2 100% + DME 0% (NPV Max at 30 USD/bbl) | 179,063 | 48.9 | - | - | - | - |
| CO2 96% + DME 4% (NPV Max at 60 USD/bbl) | - | - | 415,007 | 50.2 | - | - | |
| CO2 90% + DME 10% (NPV Max at 90 USD/bbl) | - | - | - | - | 686,245 | 52.1 | |
| Solvent Reuse | CO2 100% + DME 0% (NPV Max at 30 USD/bbl) | 201,896 | 48.9 | - | - | - | - |
| CO2 90% + DME 10% (NPV Max at 60 USD/bbl) | - | - | 496,372 | 52.4 | - | - | |
| CO2 81% + DME 19% (NPV Max at 90 USD/bbl) | - | - | - | - | 711,332 | 55.0 | |
| Oil Prices | 30 USD/bbl | 60 USD/bbl | 90 USD/bbl | ||||
|---|---|---|---|---|---|---|---|
| Objective Function | NPV (USD) | Oil Recovery (%) | NPV (USD) | Oil Recovery (%) | NPV (USD) | Oil Recovery (%) | |
| Case | |||||||
| Without Solvent Reuse + Credit | CO2 100% + DME 0% (NPV Max at 30 USD/bbl) | 198,334 | 48.9 | - | - | - | - |
| CO2 83% + DME 17% (NPV Max at 60 USD/bbl) | - | - | 499,021 | 54.3 | - | - | |
| CO2 67% + DME 33% (NPV Max at 90 USD/bbl) | - | - | - | - | 700,065 | 61.6 | |
| Solvent Reuse + Credit | CO2 100% + DME 0% (NPV Max at 30 USD/bbl) | 223,851 | 48.9 | - | - | - | - |
| CO2 77% + DME 23% (NPV Max at 60 USD/bbl) | - | - | 527,010 | 57.3 | - | - | |
| CO2 58% + DME 42% (NPV Max at 90 USD/bbl) | - | - | - | - | 773,804 | 65.0 | |
Disclaimer/Publisher’s Note: The statements, opinions and data contained in all publications are solely those of the individual author(s) and contributor(s) and not of MDPI and/or the editor(s). MDPI and/or the editor(s) disclaim responsibility for any injury to people or property resulting from any ideas, methods, instructions or products referred to in the content. |
© 2025 by the authors. Licensee MDPI, Basel, Switzerland. This article is an open access article distributed under the terms and conditions of the Creative Commons Attribution (CC BY) license (https://creativecommons.org/licenses/by/4.0/).
Share and Cite
Seo, K.; Kim, B.; Liu, Q.; Lee, K.S. Economic Optimization of Enhanced Oil Recovery and Carbon Storage Using Mixed Dimethyl Ether-Impure CO2 Solvent in a Heterogeneous Reservoir. Energies 2025, 18, 718. https://doi.org/10.3390/en18030718
Seo K, Kim B, Liu Q, Lee KS. Economic Optimization of Enhanced Oil Recovery and Carbon Storage Using Mixed Dimethyl Ether-Impure CO2 Solvent in a Heterogeneous Reservoir. Energies. 2025; 18(3):718. https://doi.org/10.3390/en18030718
Chicago/Turabian StyleSeo, Kwangduk, Bomi Kim, Qingquan Liu, and Kun Sang Lee. 2025. "Economic Optimization of Enhanced Oil Recovery and Carbon Storage Using Mixed Dimethyl Ether-Impure CO2 Solvent in a Heterogeneous Reservoir" Energies 18, no. 3: 718. https://doi.org/10.3390/en18030718
APA StyleSeo, K., Kim, B., Liu, Q., & Lee, K. S. (2025). Economic Optimization of Enhanced Oil Recovery and Carbon Storage Using Mixed Dimethyl Ether-Impure CO2 Solvent in a Heterogeneous Reservoir. Energies, 18(3), 718. https://doi.org/10.3390/en18030718