This section presents the results of the proposed method through a case study focusing on the management of PEVs and RESs distributed across multiple locations in Greece. The study demonstrates the effectiveness of integrating blockchain technology and network security measures within the Virtual Prosumer Network to ensure secure, transparent, and efficient energy management.
7.2. Description and Simulation Setup
The simulation setup was designed to replicate real-world scenarios, incorporating DF/As operating across multiple Greek cities and interconnected with a VP/A and CEV/As. The setup includes key elements such as renewable energy integration, PEV battery specifications, dynamic pricing profiles, and load management strategies, addressing the complexities of modern energy systems.
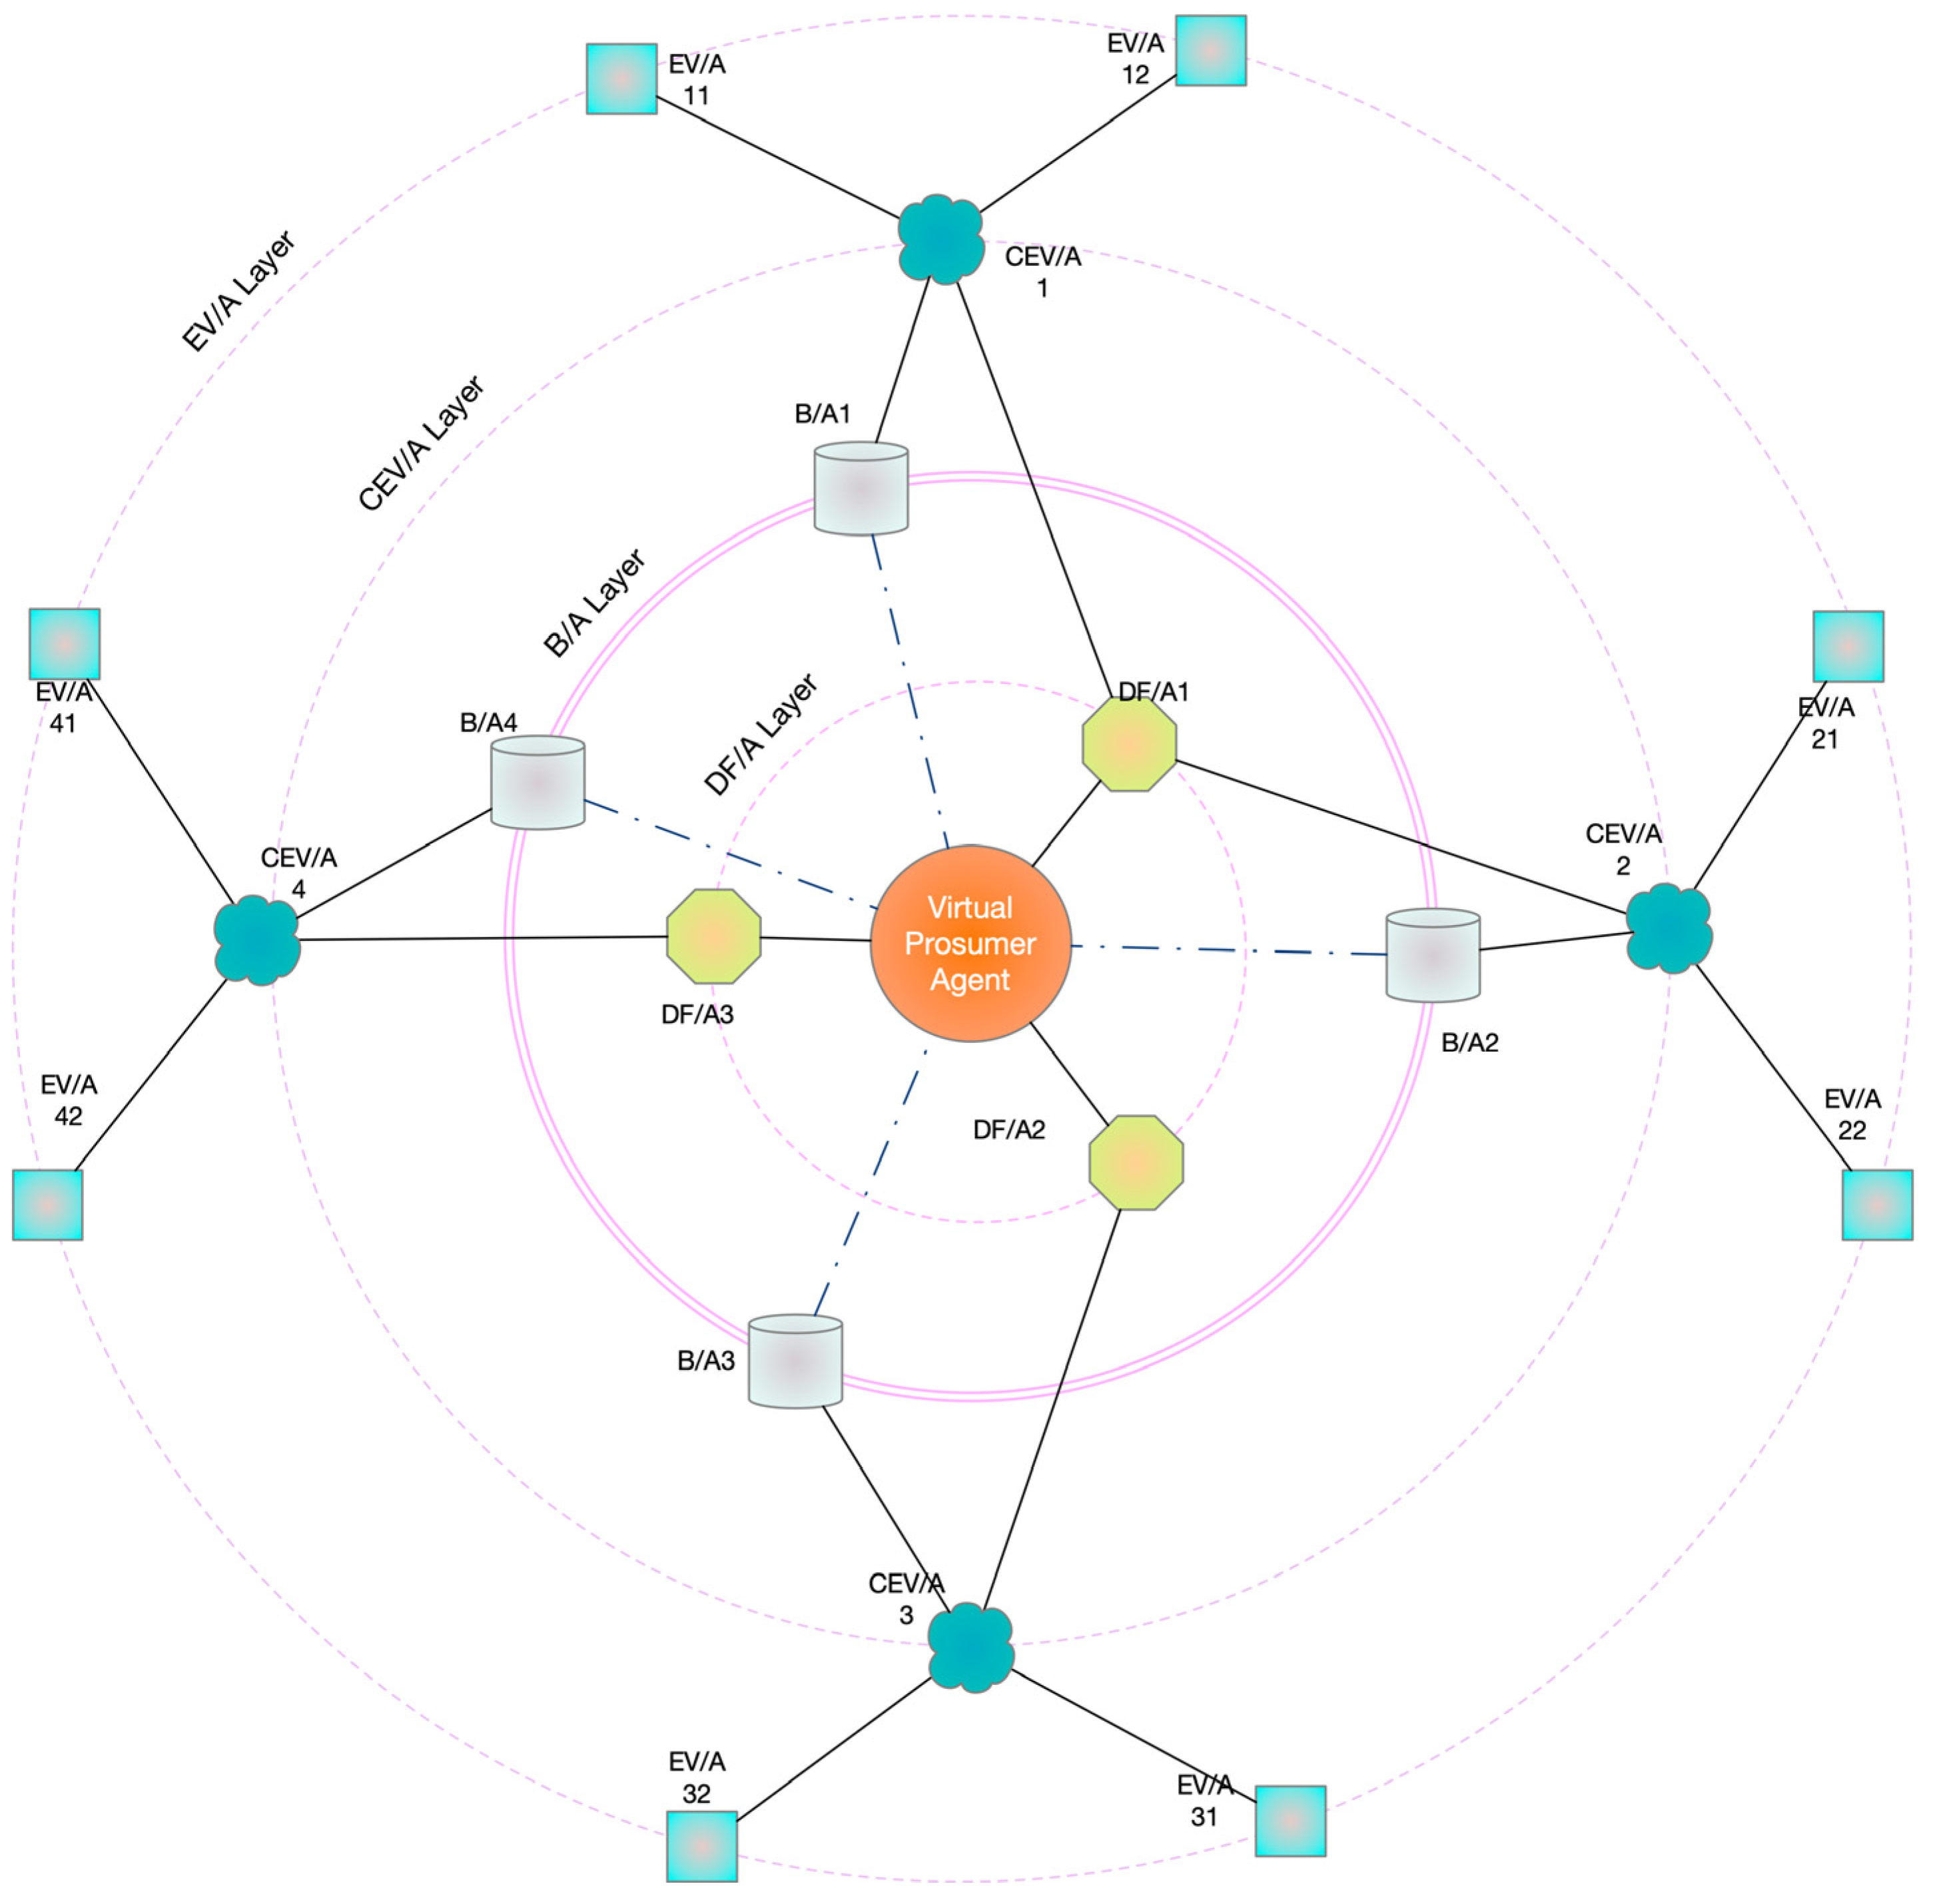
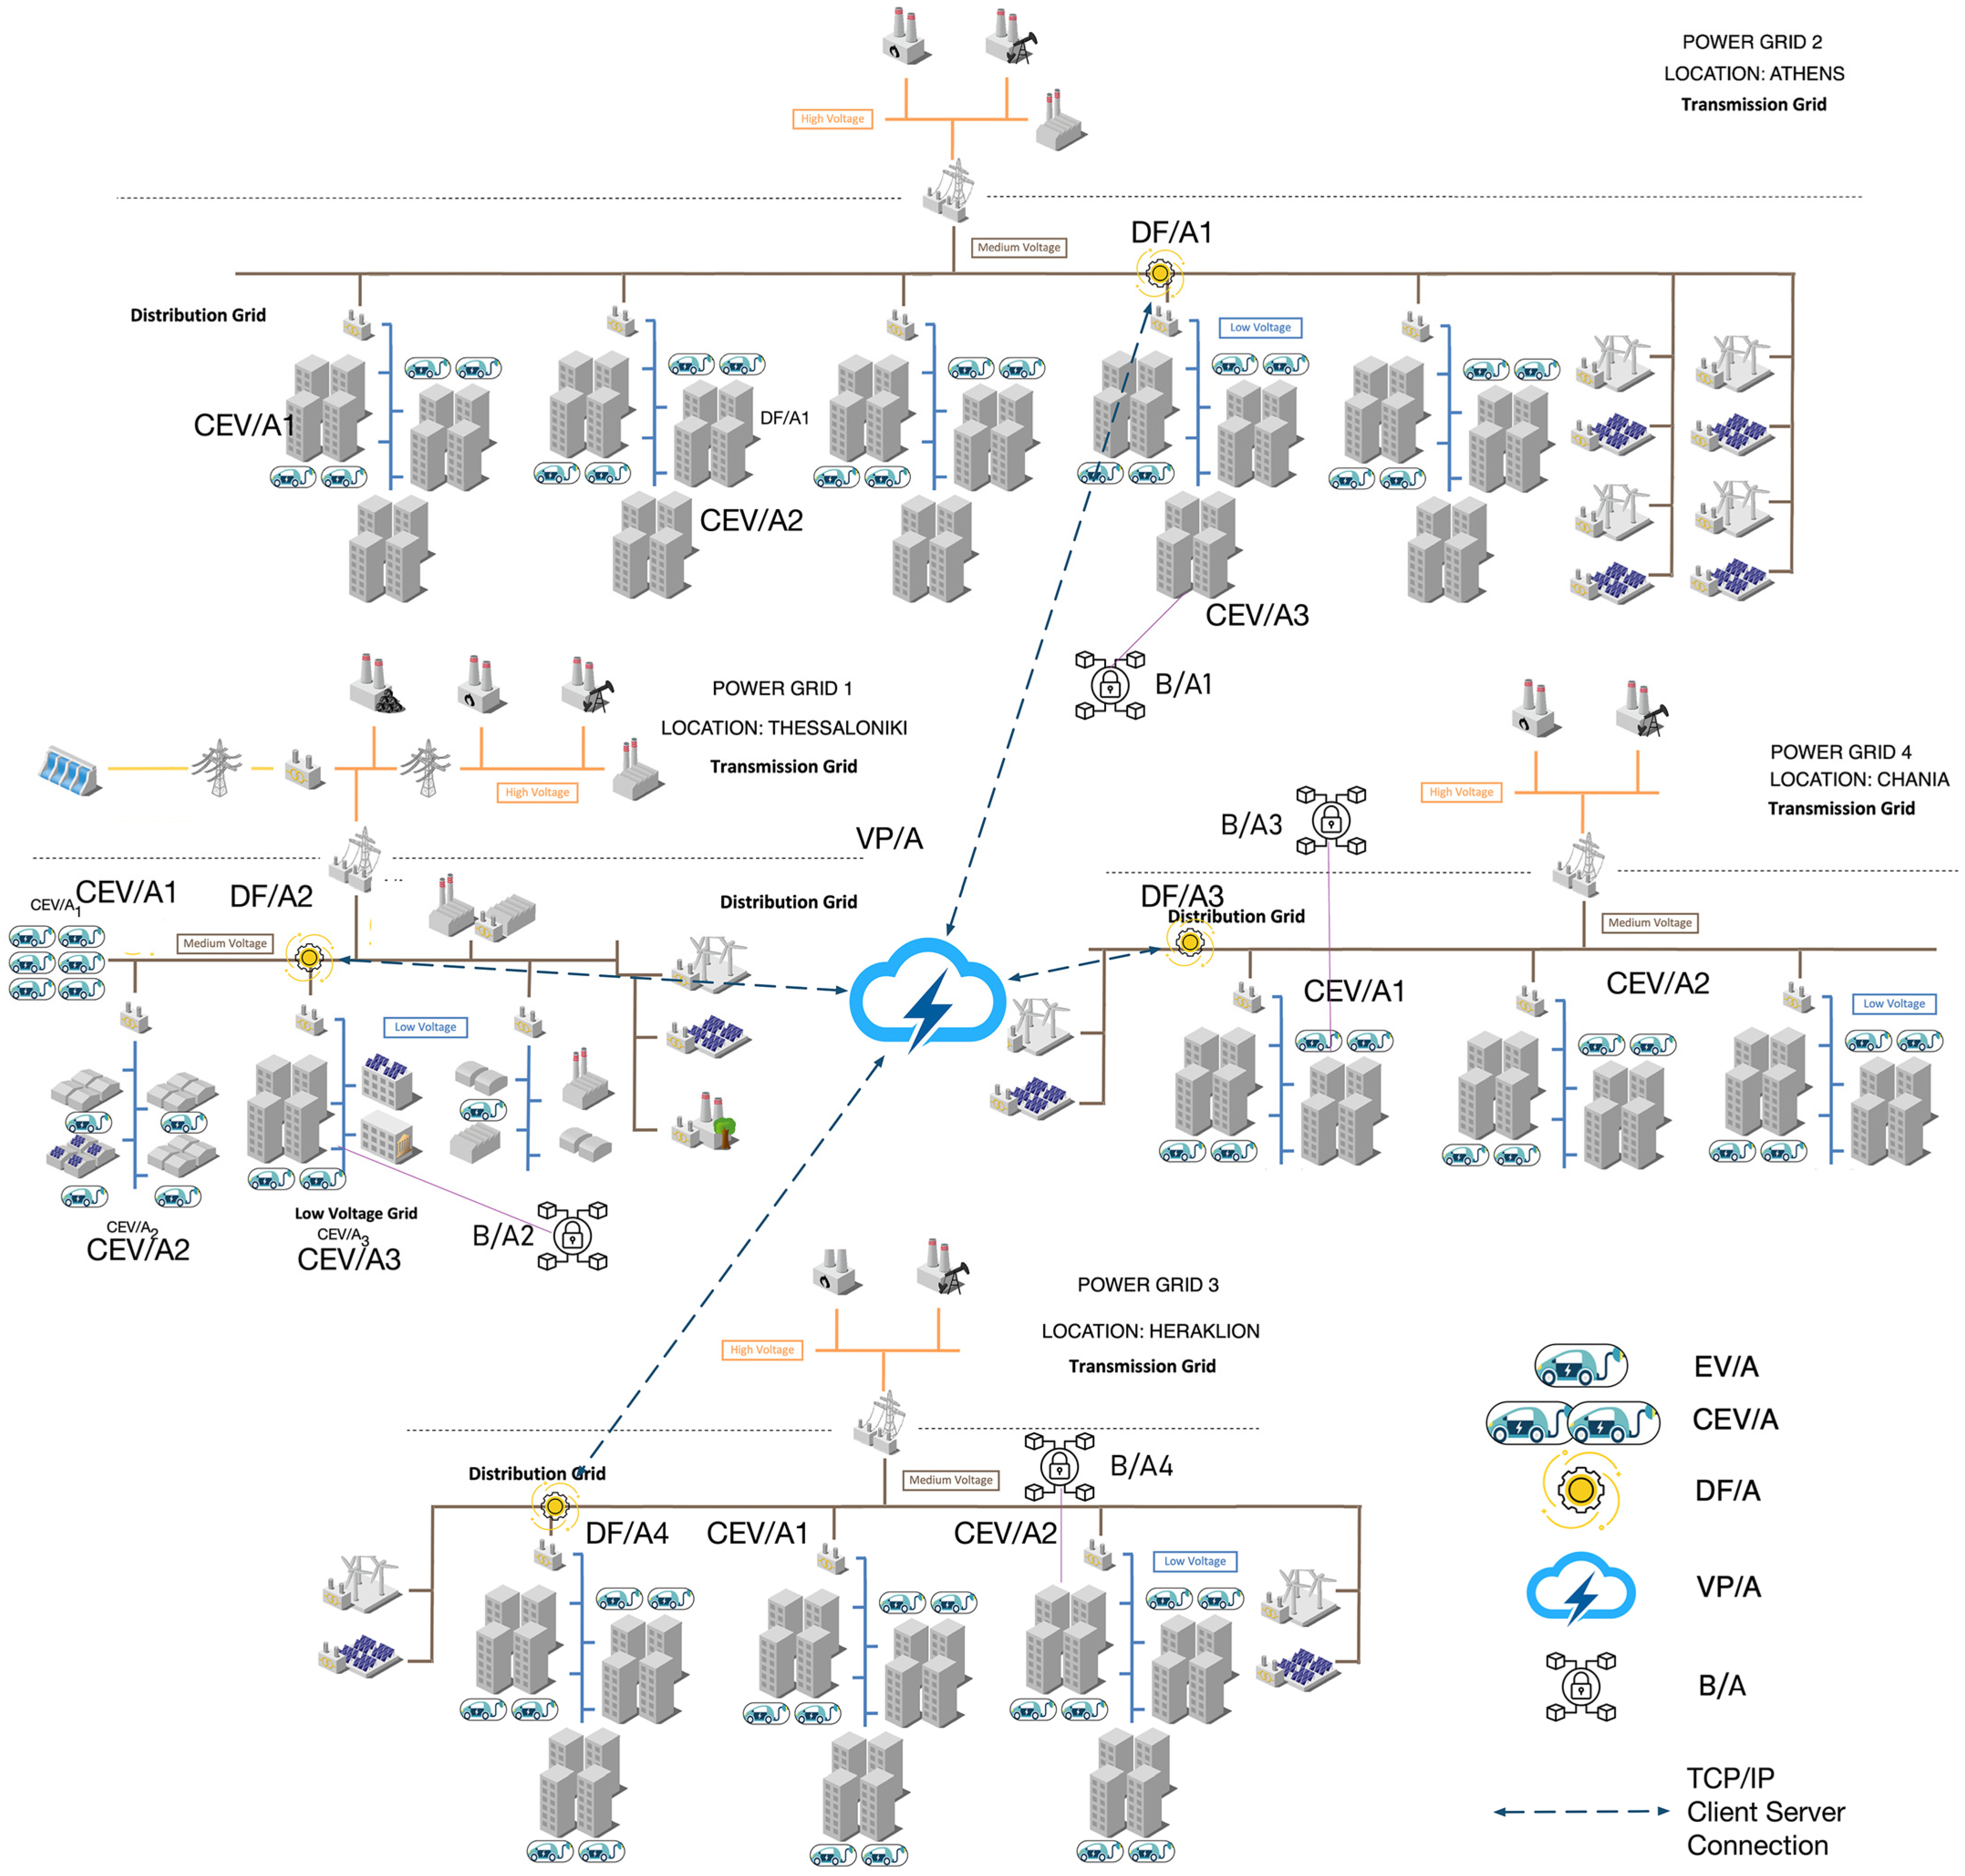
Figure 5 illustrates a case study featuring four DF/As located in Thessaloniki, Athens, Chania, and Heraklion, representing a geographically distributed energy network. The VP/A, based in Heraklion, Crete, coordinates operations and energy transactions. The CEV/As manage Electric Vehicle Agents (EV/As) across diverse locations, including public and private sector parking, commercial centers, residential areas, and urban environments. As a result, CEV/As exhibit varying peak power demands, influenced by their respective charging station characteristics. Additionally, the distribution networks overseen by DF/As possess distinct operational features. The VP/A communicates with the Electricity System Operator (ESO) to obtain electricity prices for the optimization period and establish contractual agreements for peak demand reduction and guaranteed power generation.
To ensure grid stability, CEV/As monitor PEV loads within their regions using smart metering infrastructures. When bus voltages or power losses exceed technical thresholds, they dynamically adjust power demand to maintain system reliability. MATLAB [
45] and GAMS were utilized for scheduling simulations, while the JADE platform facilitated real-time modeling. The case study considers ten CEV clusters, distributed across four power grids, each modeled using IEEE 33-bus and 40-bus medium-voltage (MV) networks [
46]. Athens and Thessaloniki utilize a 40-bus MV system, while Heraklion and Chania operate on a 33-bus MV configuration. The system integrates ten CEVs and multiple Renewable Energy Sources (RESs), including photovoltaic (PV) and wind power (WP) nodes, with their normalized power time series analyzed over a seven-day period.
The proposed framework optimizes operational scheduling and real-time control of spatially dispersed PEV clusters within realistic distribution networks. CEV1 primarily supports public sector employees, while CEV3, CEV5, and CEV8 serve private sector users. CEV6 and CEV10 accommodate PEVs used for social, recreational, and shopping activities, whereas CEV2, CEV4, CEV7, and CEV9 consist of home charging stations. PEV plug-in times fluctuate based on user activities and time of day, influencing overall energy demand patterns across the grid.
This simulation framework demonstrates the system’s capability to effectively manage distributed energy resources while ensuring grid stability, cost efficiency, and secure energy transactions. The methodologies and algorithms underlying these simulations are detailed in
Supplementary Algorithms S1 and S2.
The estimation of PEV plug-in times is based on Probability Density Functions derived from real-world data analysis, as illustrated in
Supplementary Figure S7. This study considers three types of PEV batteries, with their technical specifications summarized in
Supplementary Table S4.
7.2.1. Operational Scenarios
Two scenarios were examined to evaluate the performance of the proposed VP framework:
Scenario 1 (SC1)—optimized charging and V2G operations: the proposed method is applied to optimize both distribution networks and PEV clusters, considering electricity price fluctuations, network constraints, PEV charging preferences, renewable energy uncertainties, CEV power limits, and VP obligations;
Scenario 2 (SC2)—uncoordinated charging: in this case, PEVs charge continuously at an average power level required to reach their SoC target without considering external factors such as electricity prices or grid conditions.
7.2.2. Key Findings and Insights
- ▪
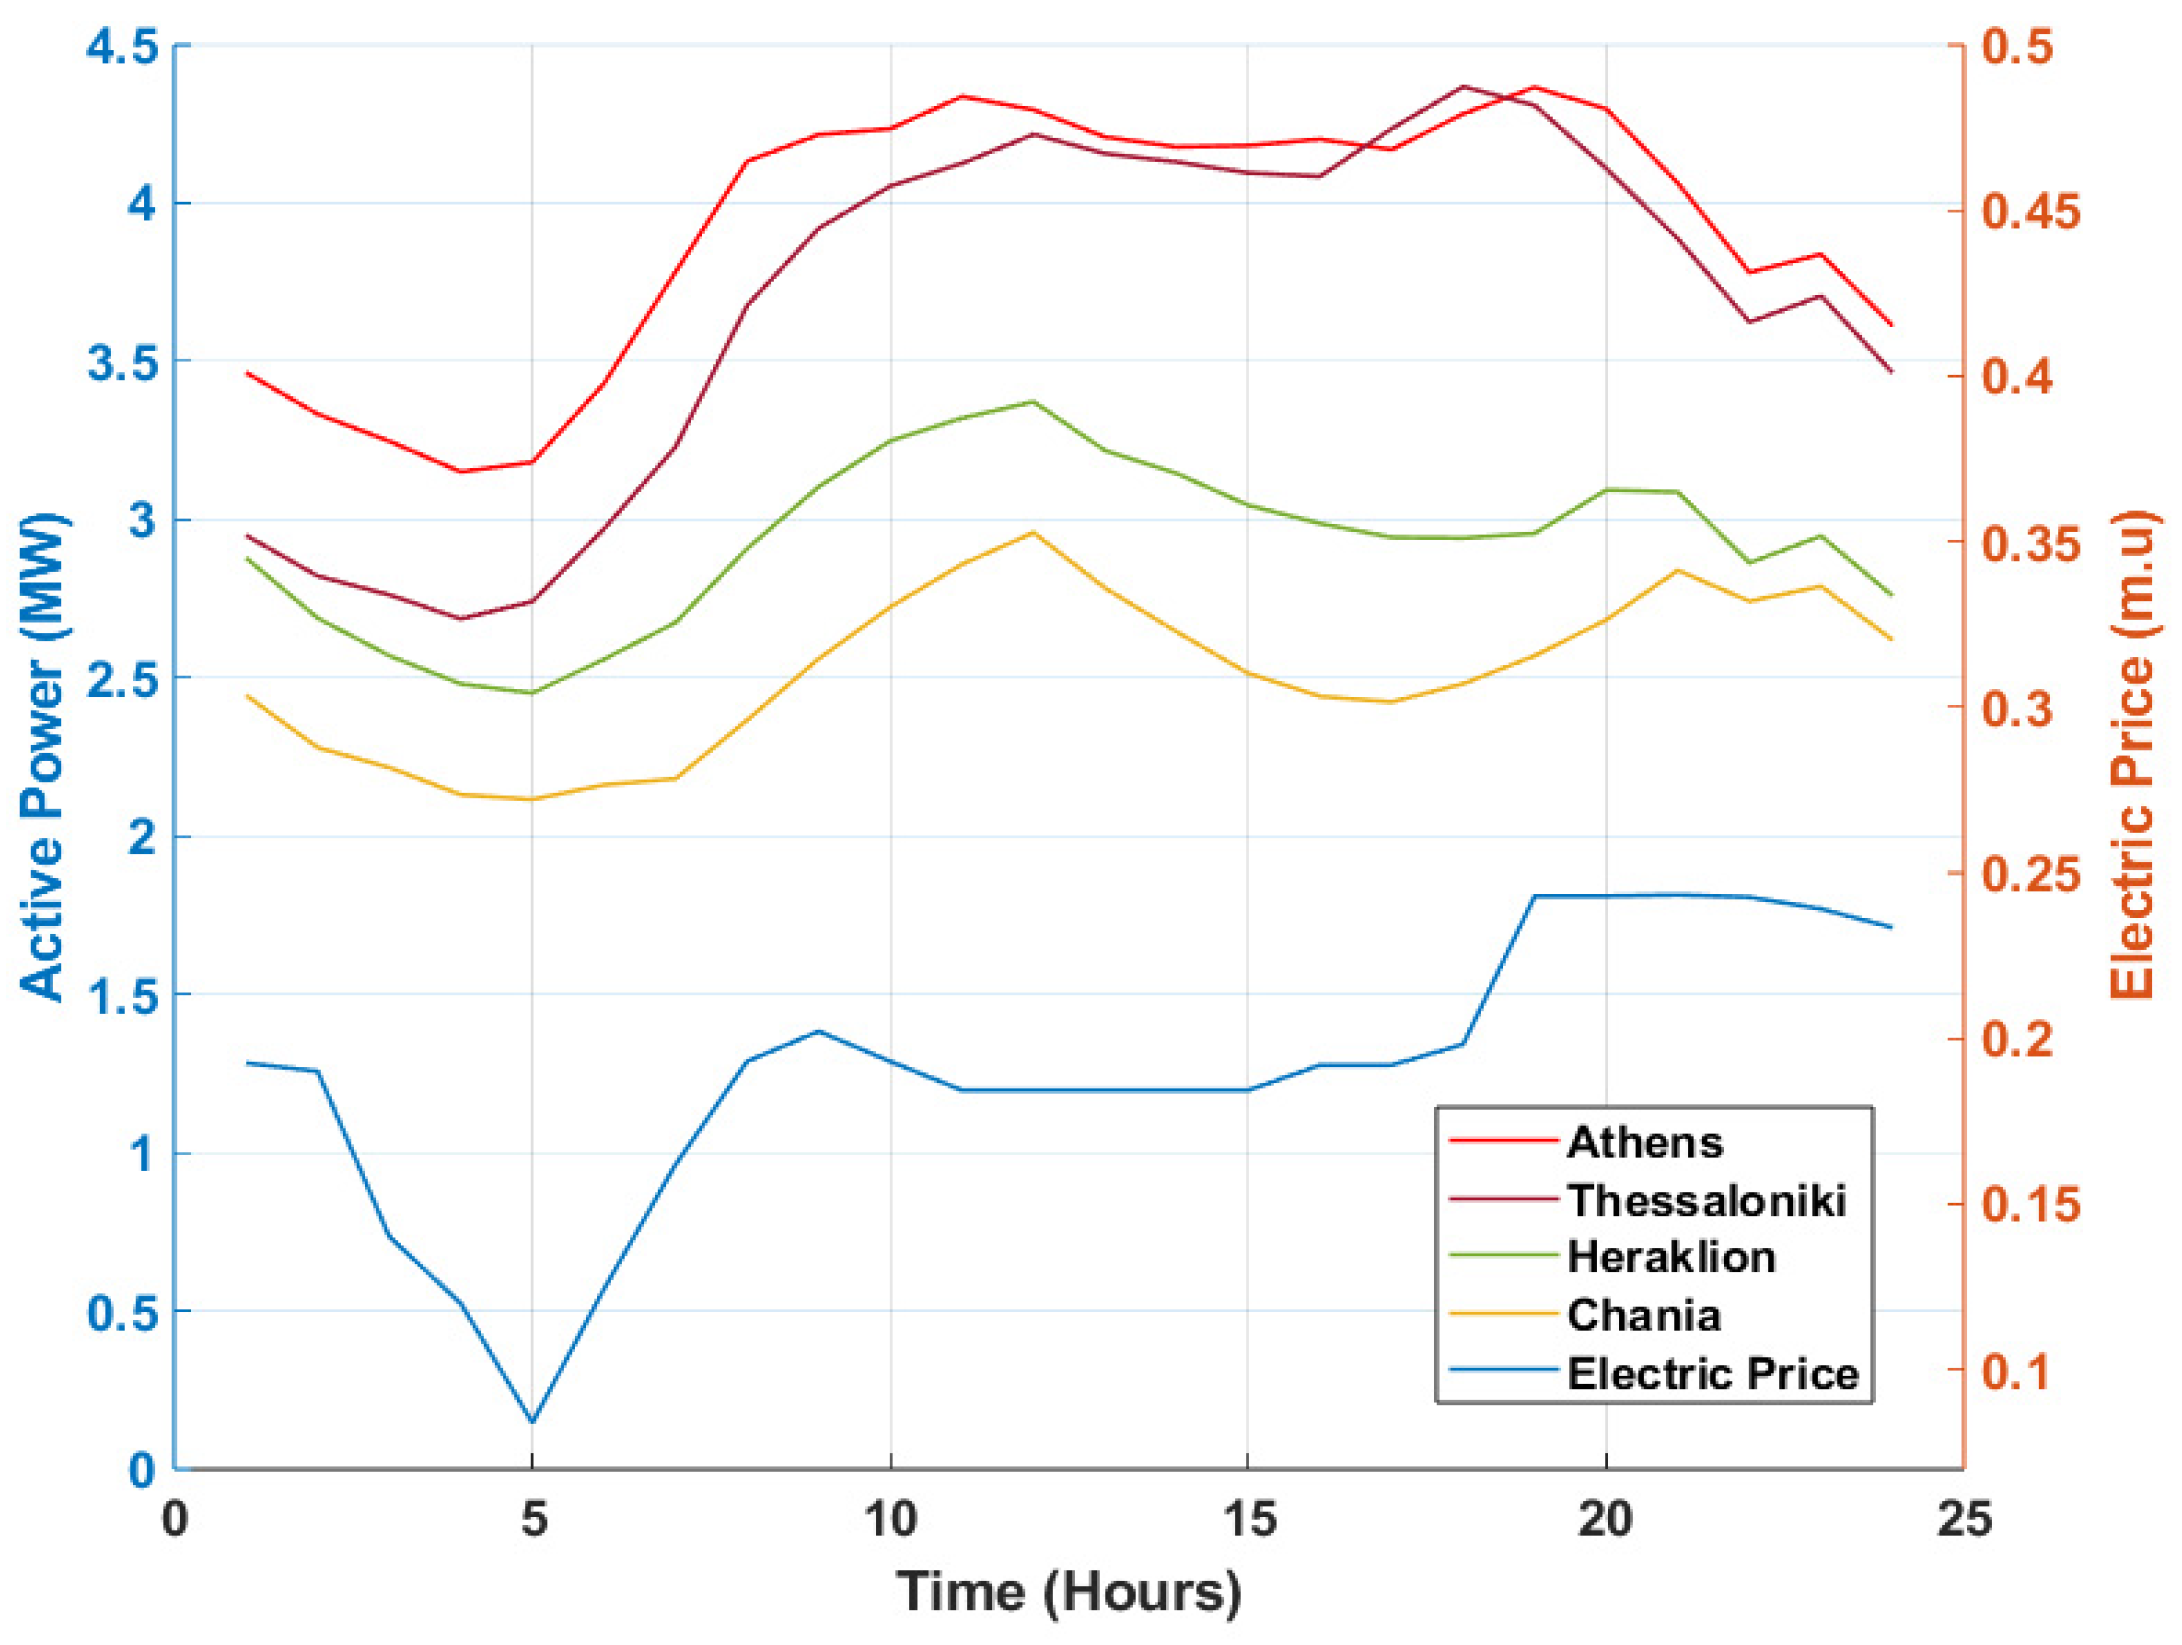
Energy consumption and pricing trends: As shown in
Figure 6, electricity consumption in Athens and Thessaloniki is significantly higher than in Chania and Heraklion. The electricity price curve exhibits a low-price period followed by two peak periods, allowing the VP algorithm to optimize charging and Vehicle-to-Grid (V2G) services;
- ▪
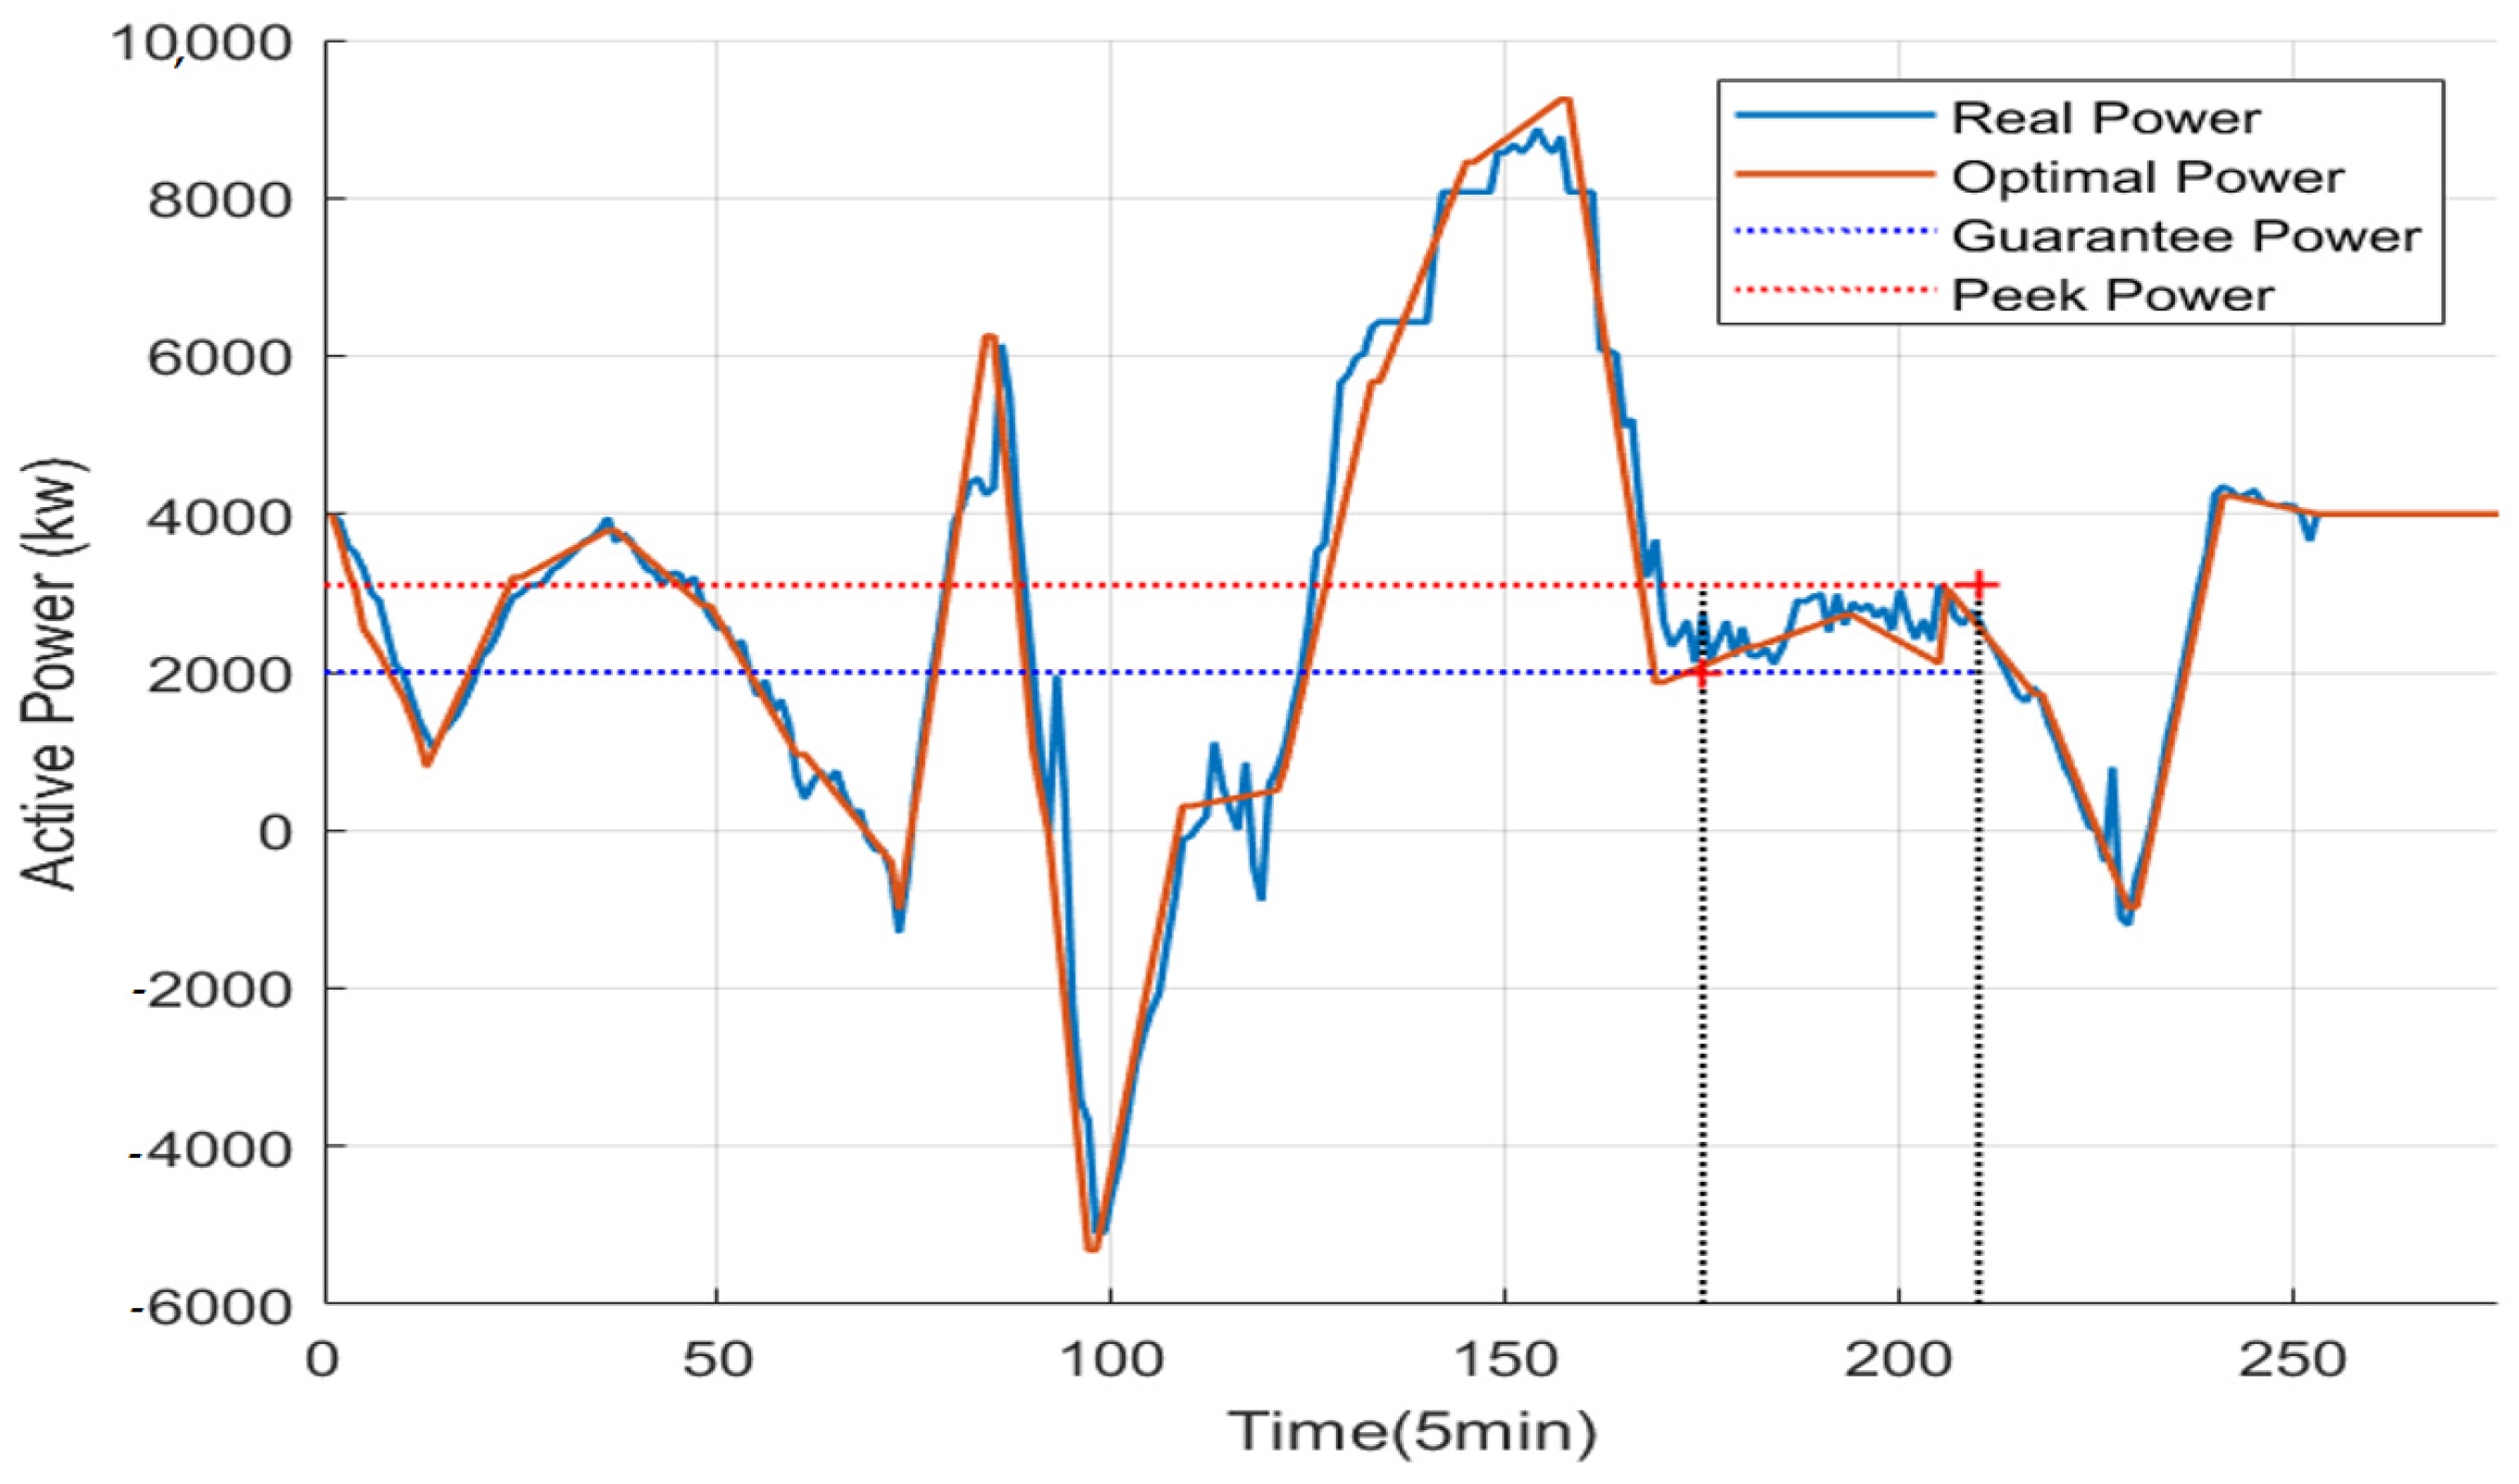
Optimal scheduling and real-time control: The VP calculates optimal set-points for CEVs every 5 min, based on electricity prices, within a 23 h simulation period (276 time intervals). As depicted in
Figure 7, the guaranteed power is maintained at 2000 kW between 15:30 and 18:30, while the peak power limit is capped at 3000 kW. The system ensures real-time active power remains within these limits;
- ▪
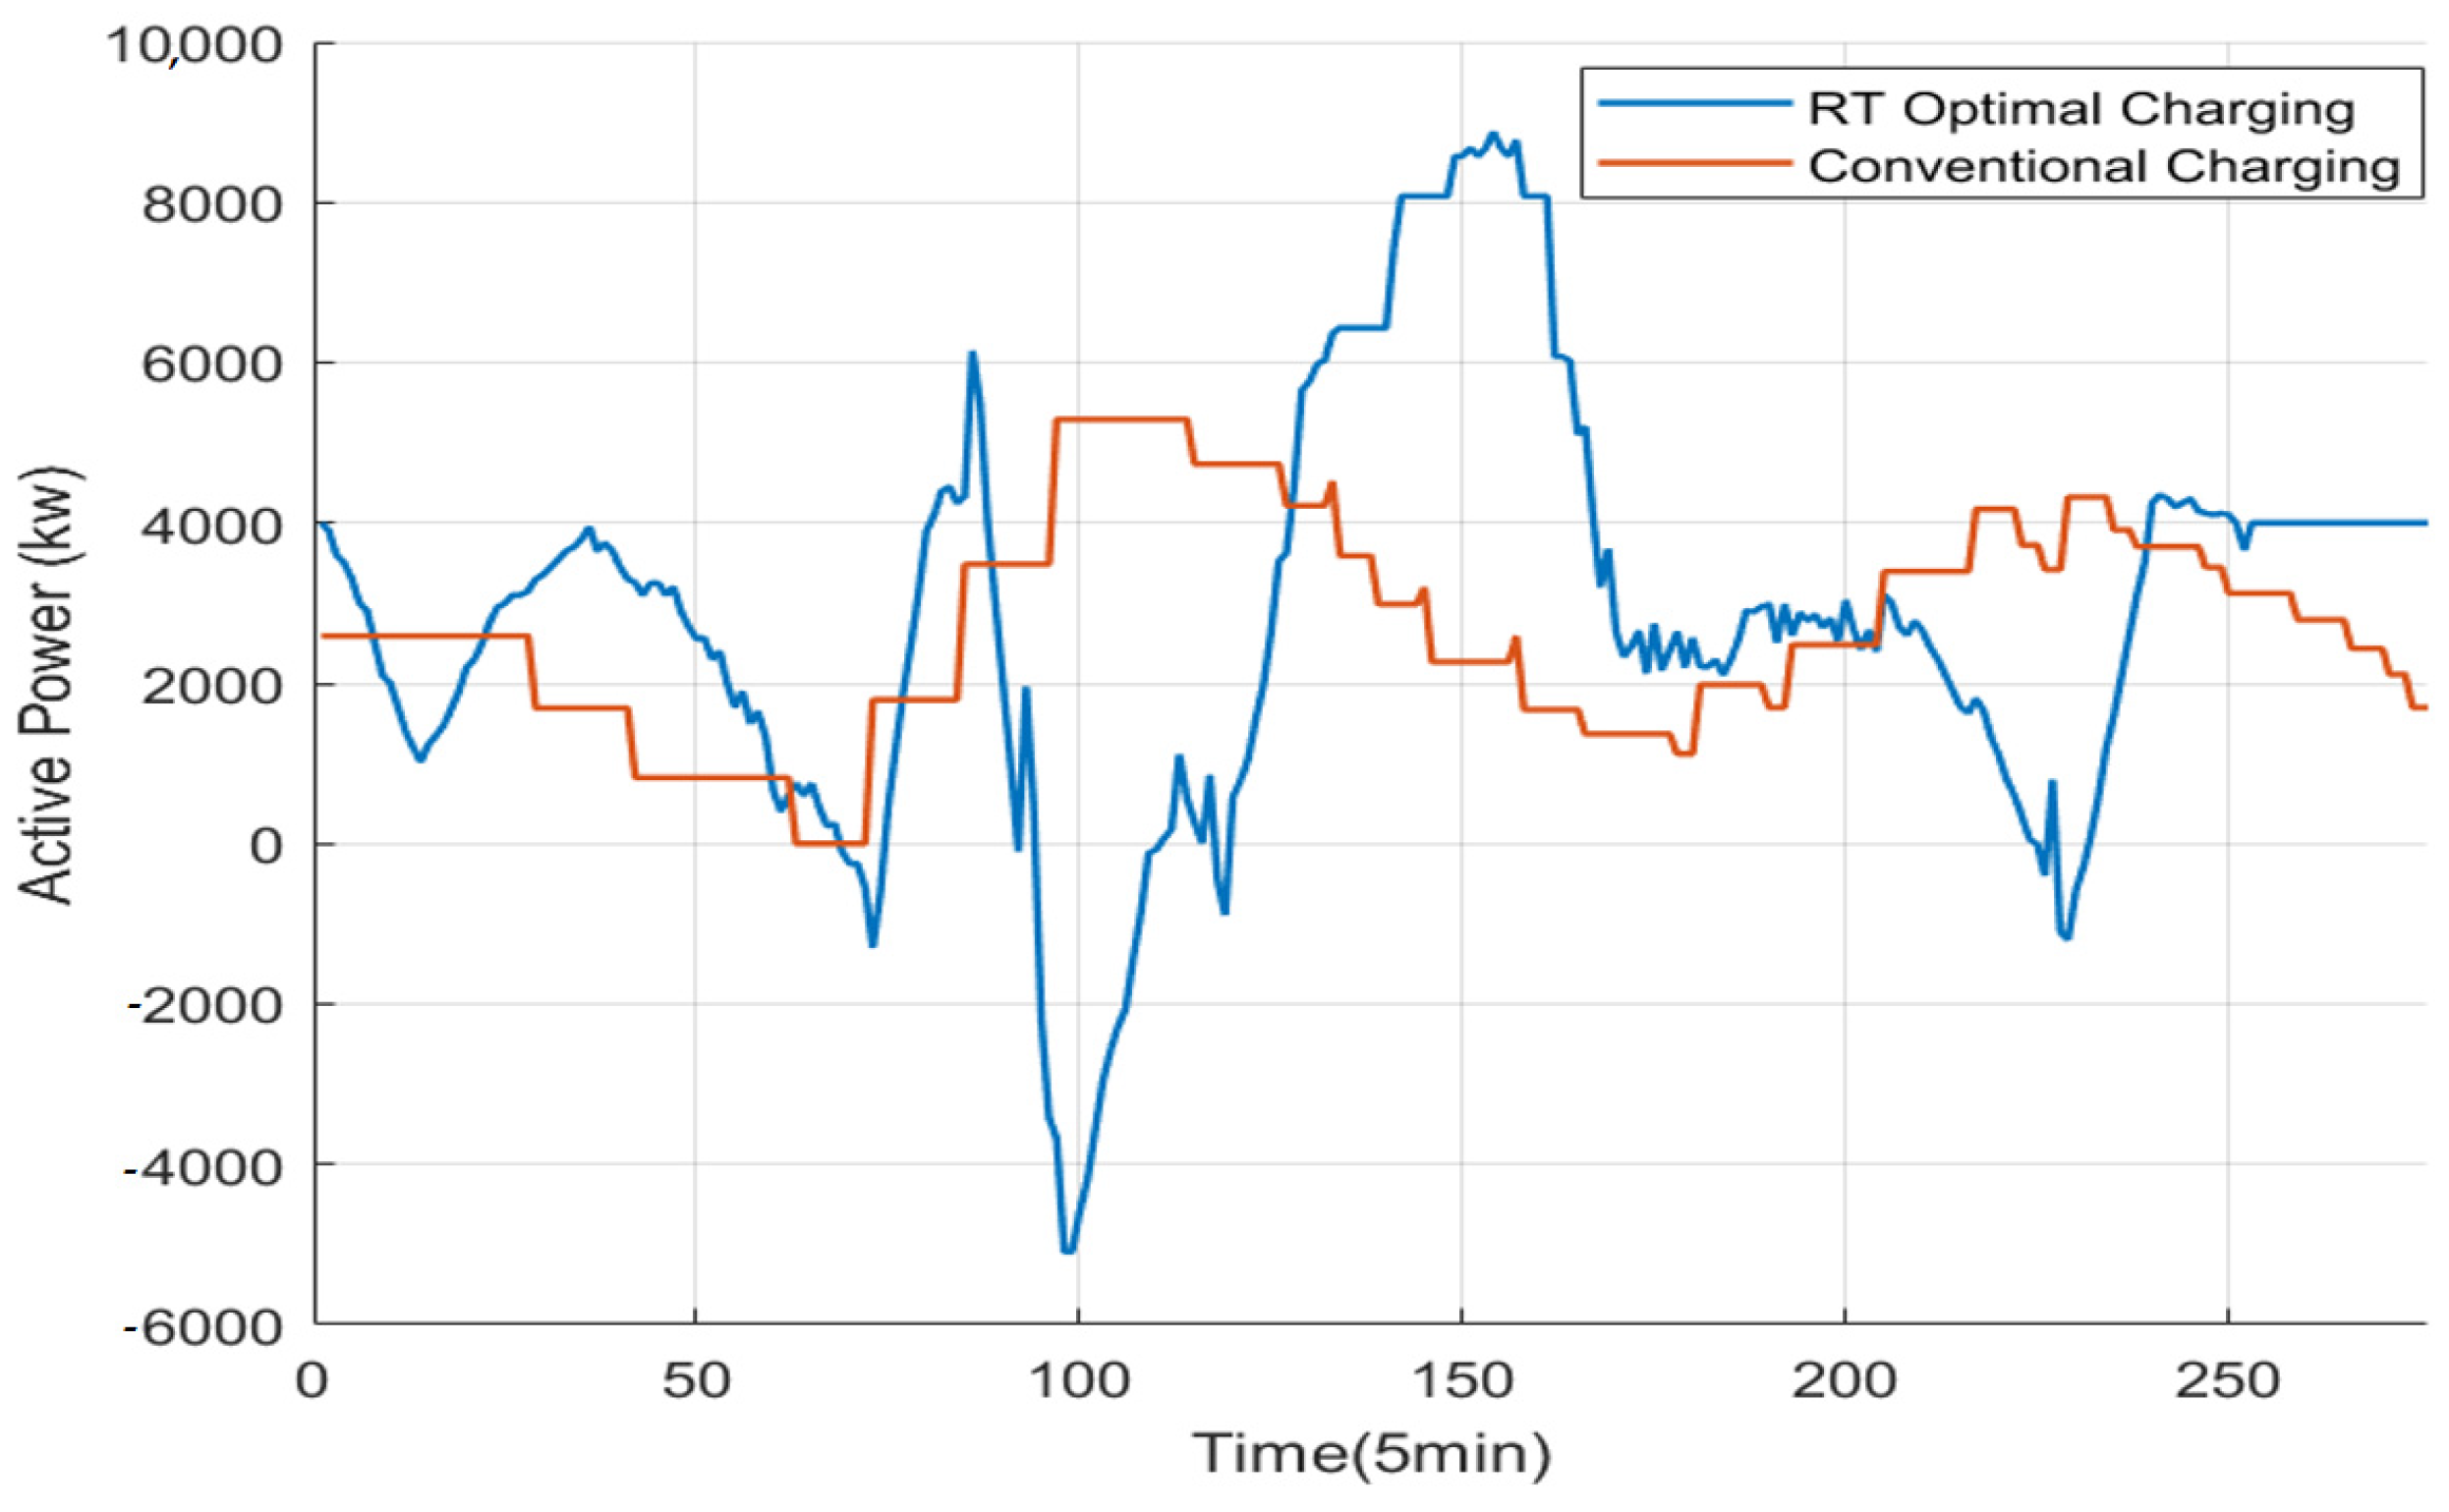
V2G services and cost optimization: V2G discharging occurs during high-price periods (7:30–9:00 AM and 18:30–19:00 PM), while charging is optimized during low-price periods. In SC2, where V2G services are absent, PEVs charge continuously, leading to higher costs due to peak demand during high-price periods.
Figure 8 compares total active power consumption across both scenarios, demonstrating how SC1 effectively reduces peak demand and cost;
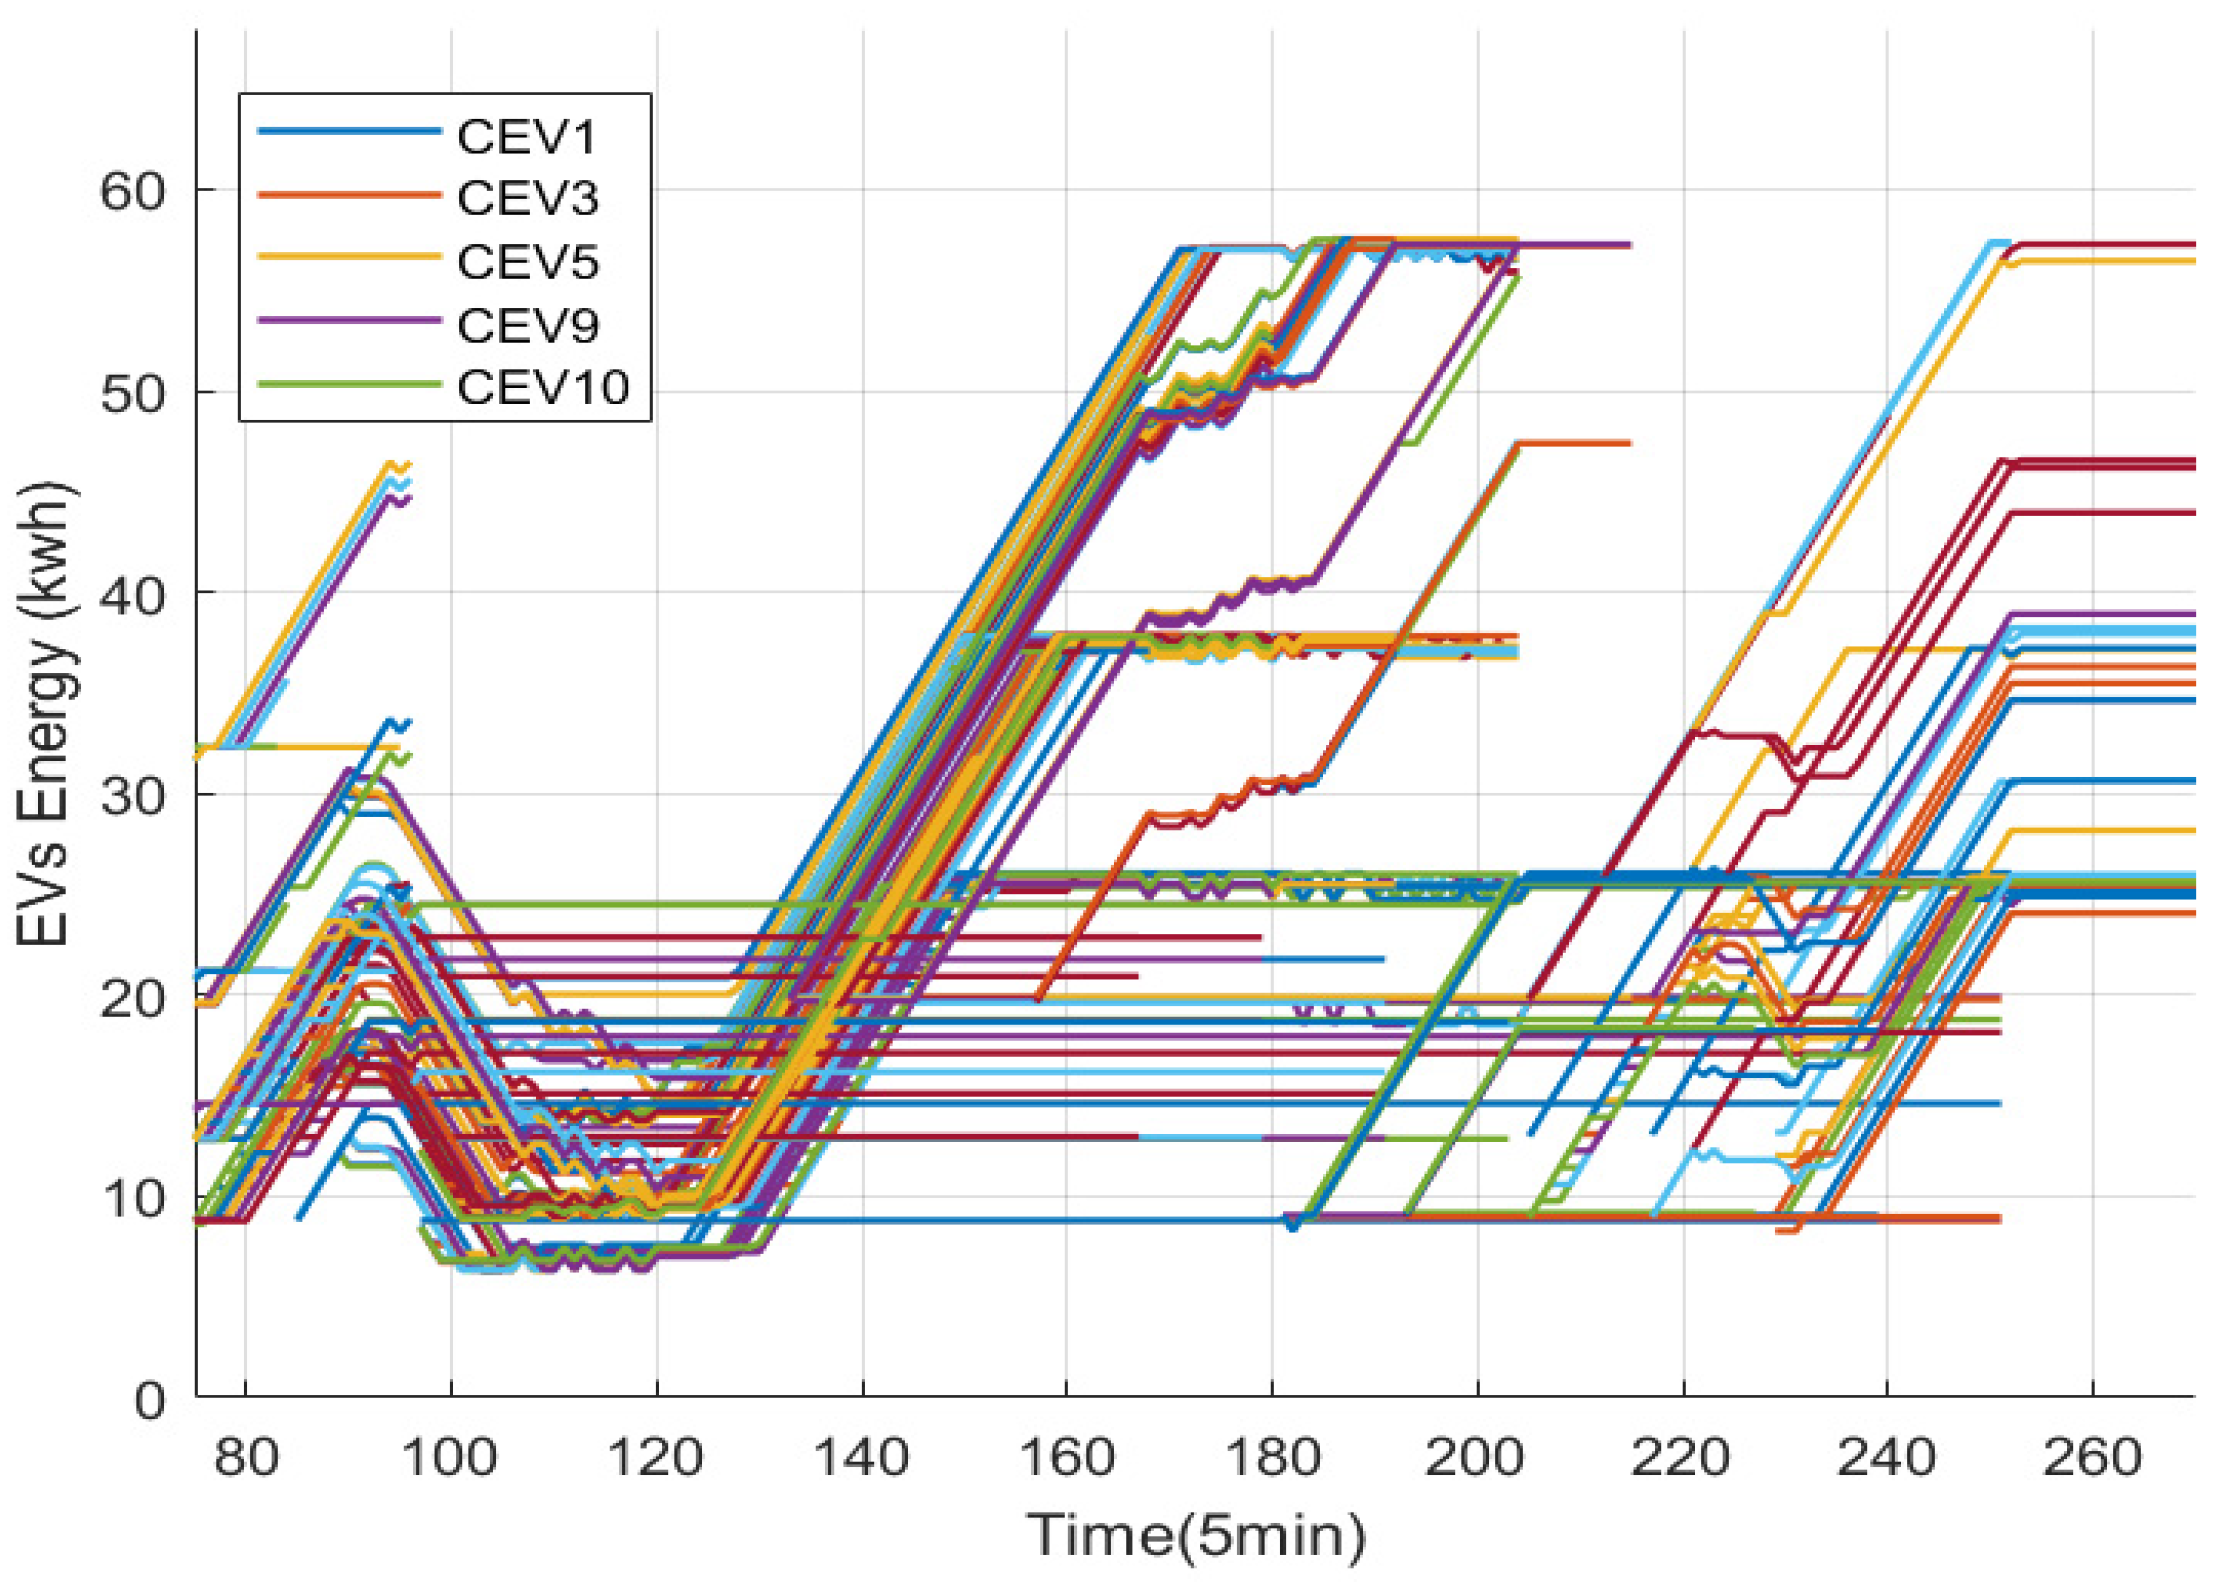
State-of-Charge (SoC) management: As shown in
Figure 9, PEVs in SC1 reach their preferred SoC (SoC_pref) more efficiently, aligning with owner preferences. Morning hours see higher vehicle density in public/private parking facilities, while residential and entertainment zones experience increased activity in the afternoon and evening. The initial SoC (
) is set at 30%, with a target SoC of ~90%, though some vehicles disconnect before reaching full charge;
- ▪
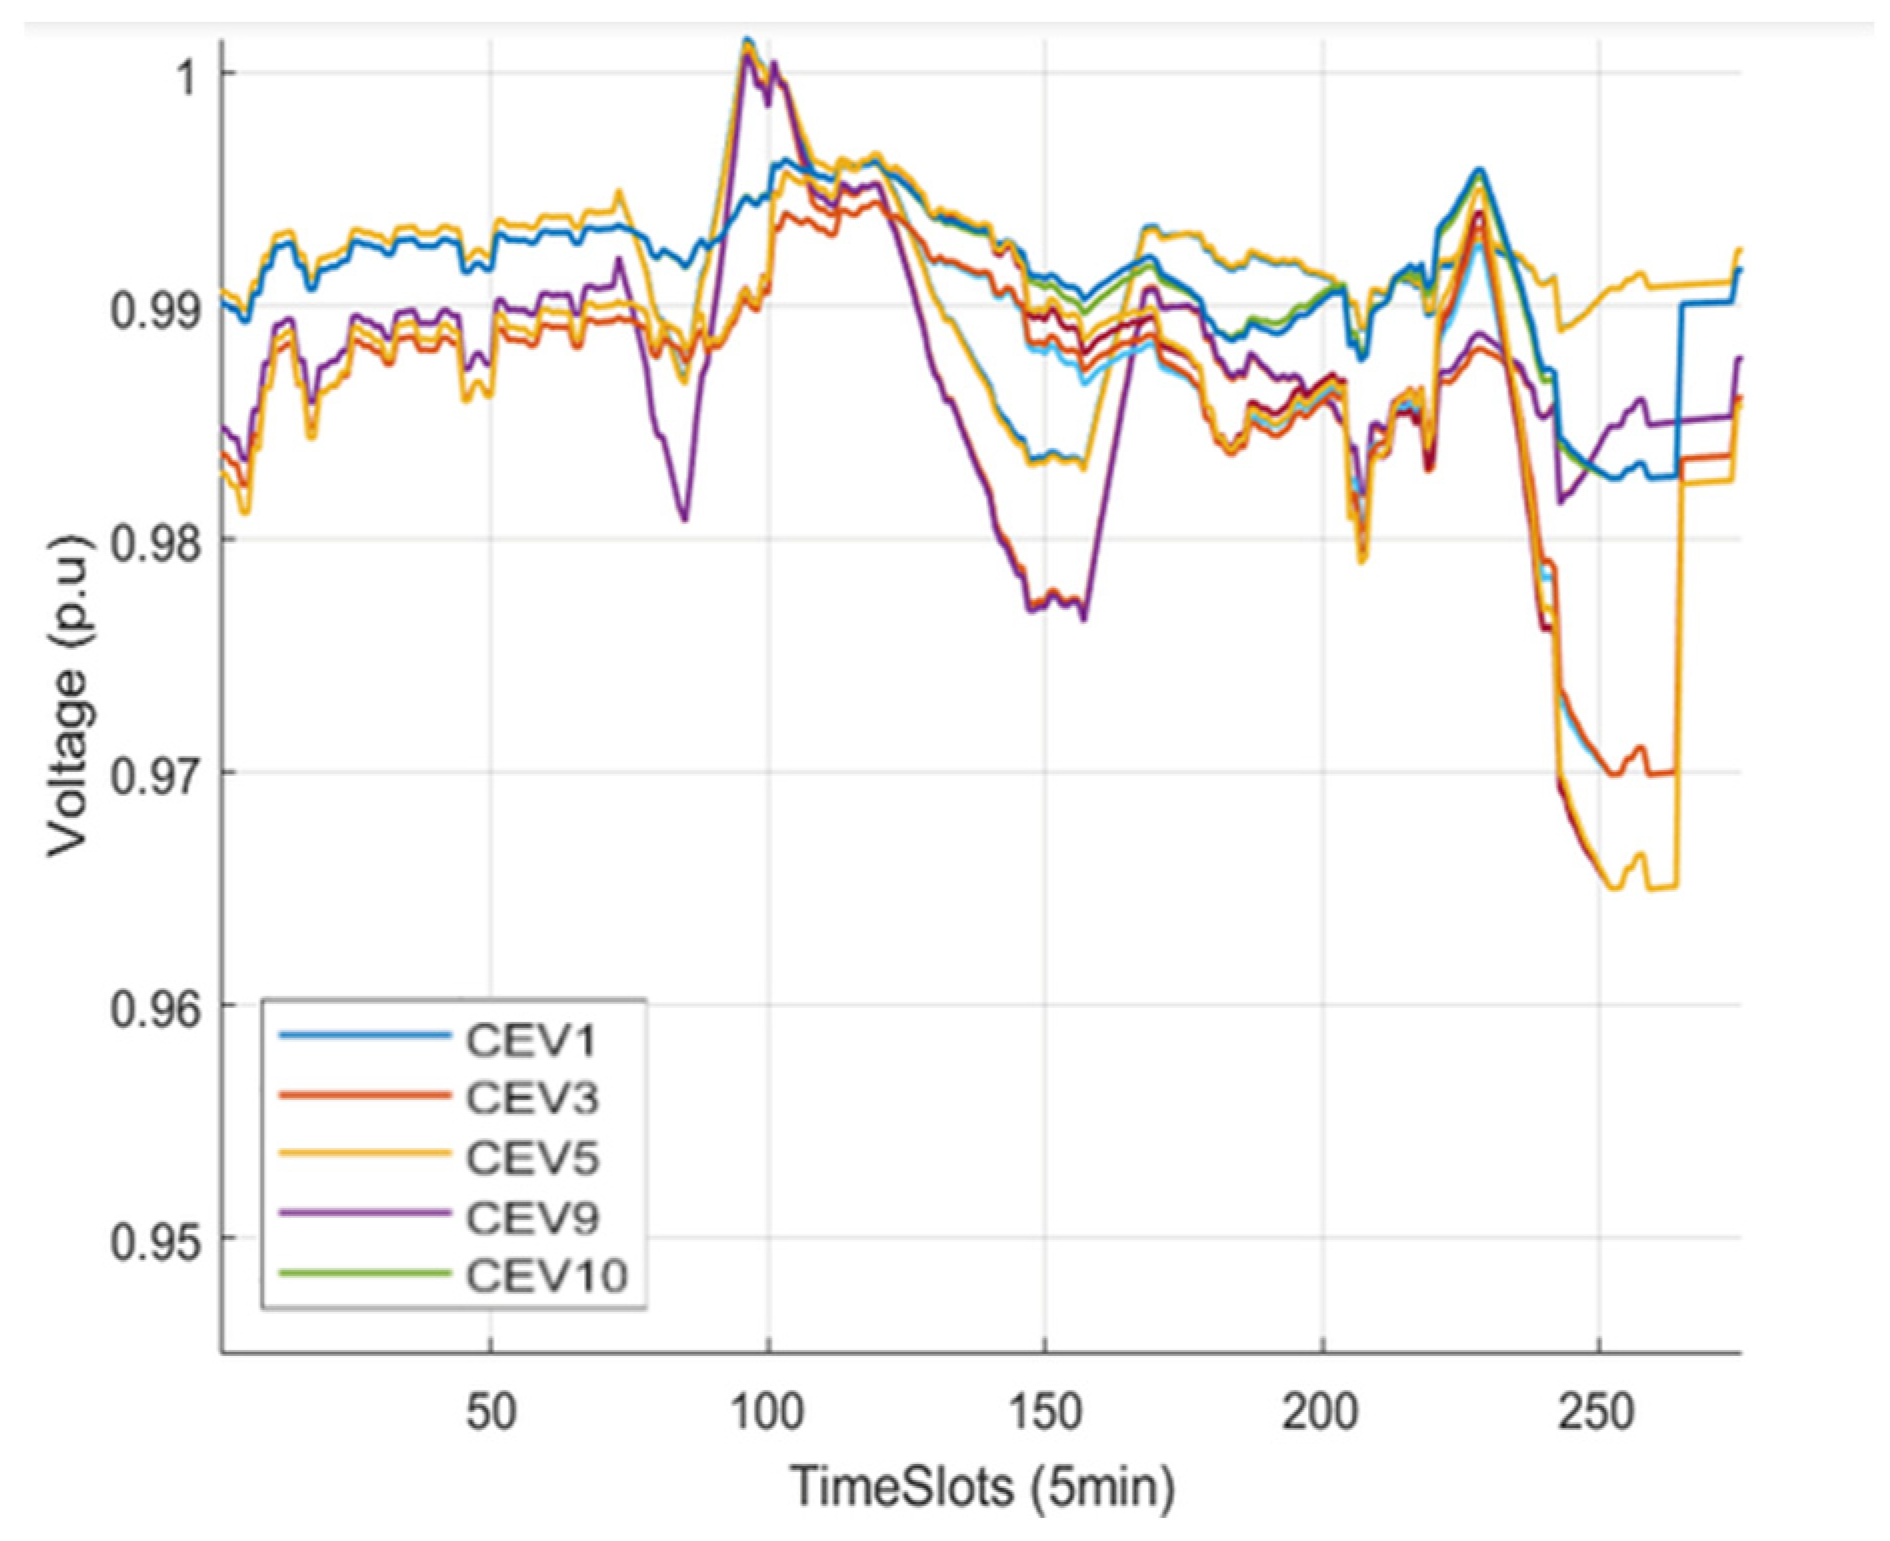
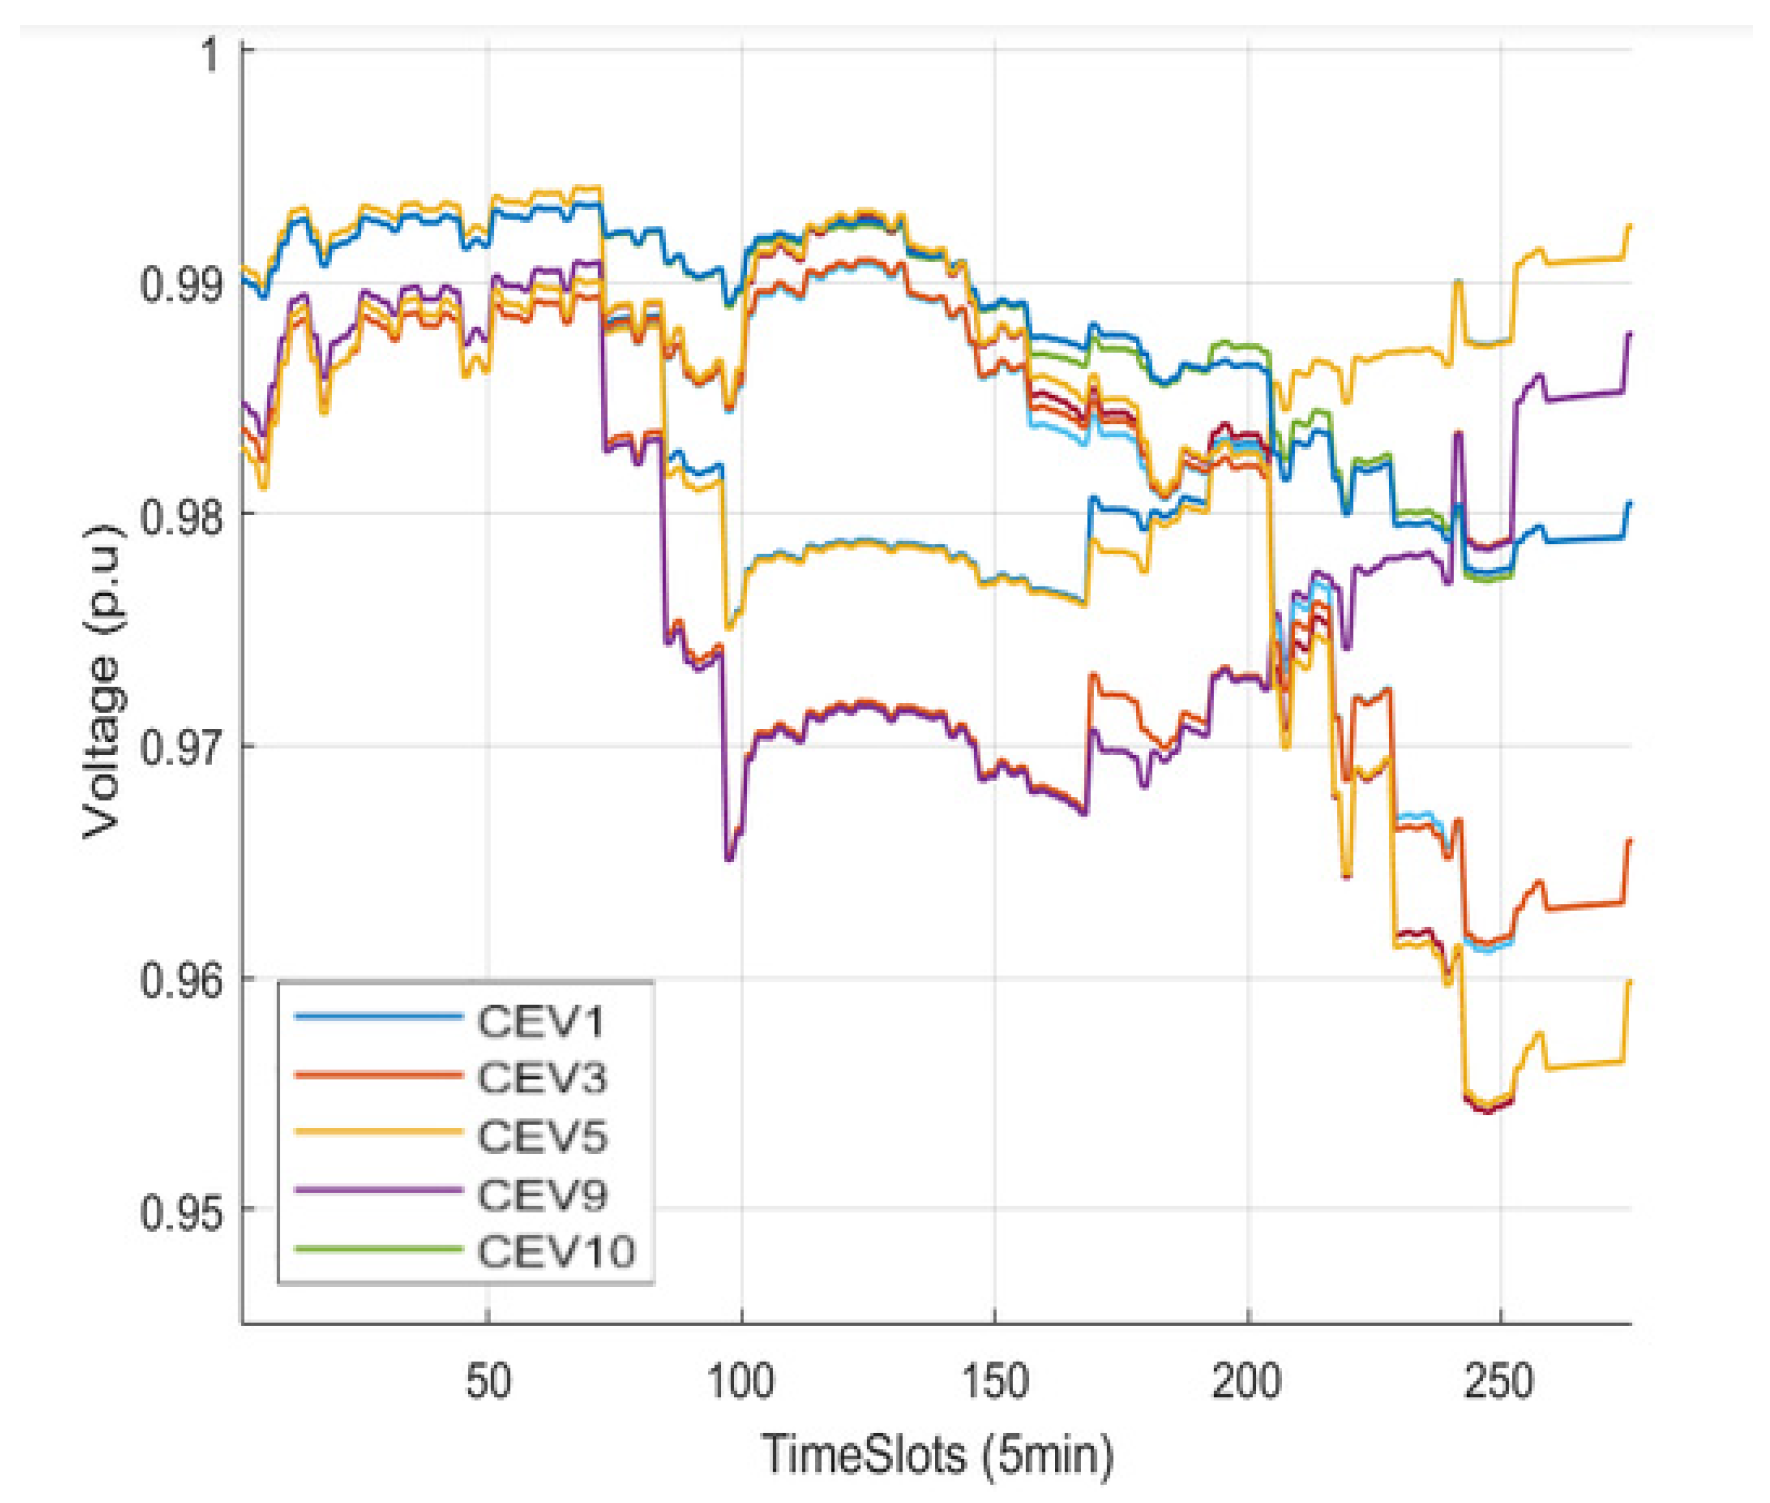
Voltage stability and grid impact:
Figure 10 and
Figure 11 present node voltage time series for SC1 and SC2, respectively, with voltage limits set at 1.05 and 0.95 p.u. While SC1 exhibits greater active power variations, voltage deviations remain within acceptable limits, ensuring grid stability;
- ▪
Charging cost savings and economic feasibility: The total charging cost in SC1 is 3,808 monetary units (m.u.), compared to 4279 m.u. in SC2, reflecting an 11% cost reduction. The savings could be higher with greater electricity price fluctuations. Additionally, the ICT infrastructure cost for smart distribution networks (e.g., PMUs priced between
$500–
$1000) [
47] is justified by the daily charging cost reduction of
$471, leading to annual savings of
$171,915 making the investment cost-effective.
7.3. Blockchain Results
7.3.1. Total Delay in Blockchain System Under Varying Parameters
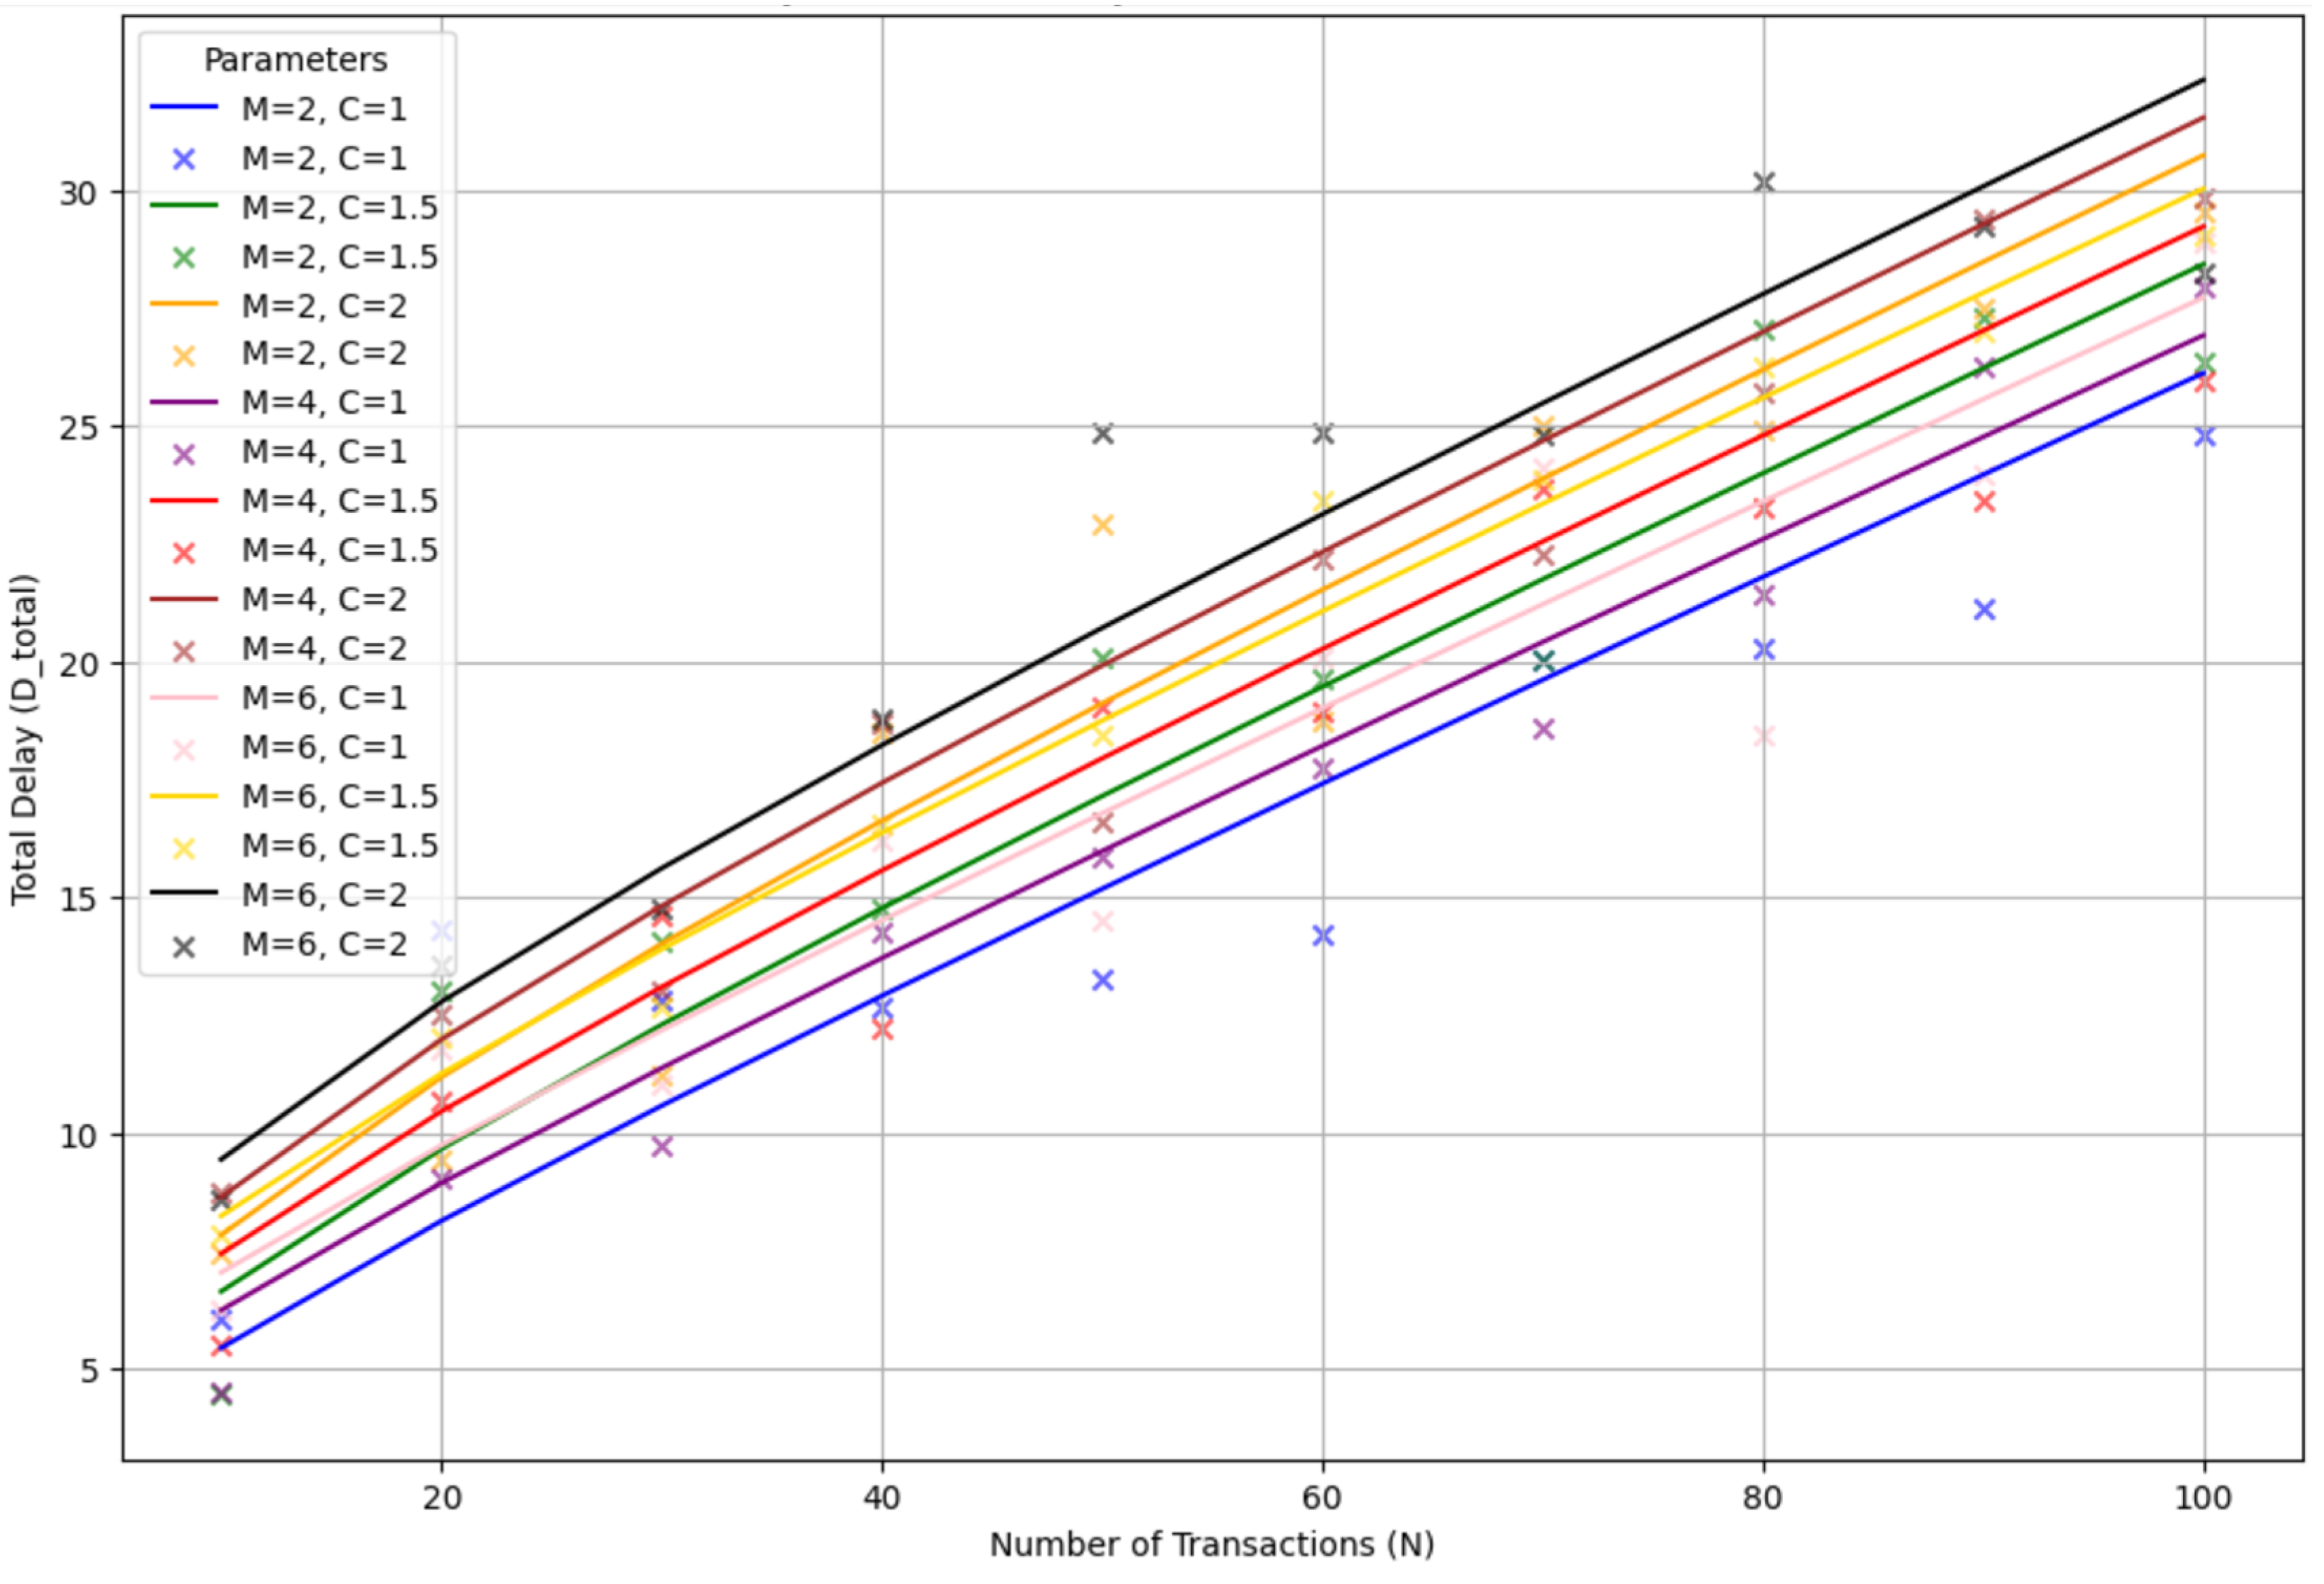
This section examines how system parameters, such as the number of transactions (N), blockchain agents (M), and transaction complexity (C), affect the total delay (D_total) in the blockchain system, as shown in
Figure 12. The total delay represents the cumulative time required to process and validate transactions before they are added to the blockchain during a single time slot.
The graph demonstrates a proportional relationship between the number of transactions (N) and the total delay (D_total). Higher transaction volumes increase the processing load, resulting in longer delays. For each value of M (2, 4, 6), three curves are plotted to represent different complexity levels (C = 1, 1.5, 2). Increased complexity leads to greater delays due to the additional computational resources required. While increasing the number of blockchain agents (M) can reduce delays by distributing workloads at lower complexity levels, it introduces coordination overhead at higher complexity levels, which may offset these benefits. This highlights the need to balance workload distribution and communication overhead for optimal system performance.
Scalability and energy efficiency: Blockchain technology ensures robust security and transparency but poses challenges in scalability and energy consumption. Traditional PoW mechanisms, known for their high computational demands, are energy-intensive. This study mitigates these issues by adopting the energy-efficient PoA consensus mechanism, which relies on pre-approved validators instead of computational power. Additionally, the hierarchical multi-agent architecture optimizes workload distribution, enhancing scalability in large-scale, geographically distributed networks.
By analyzing
Figure 12, system designers can identify the key factors influencing delays and fine-tune system parameters to achieve optimal performance. This analysis underscores the importance of balancing security, scalability, and energy efficiency for real-world energy management applications.
7.3.2. Comparison of Theoretical and Experimental Total Delay
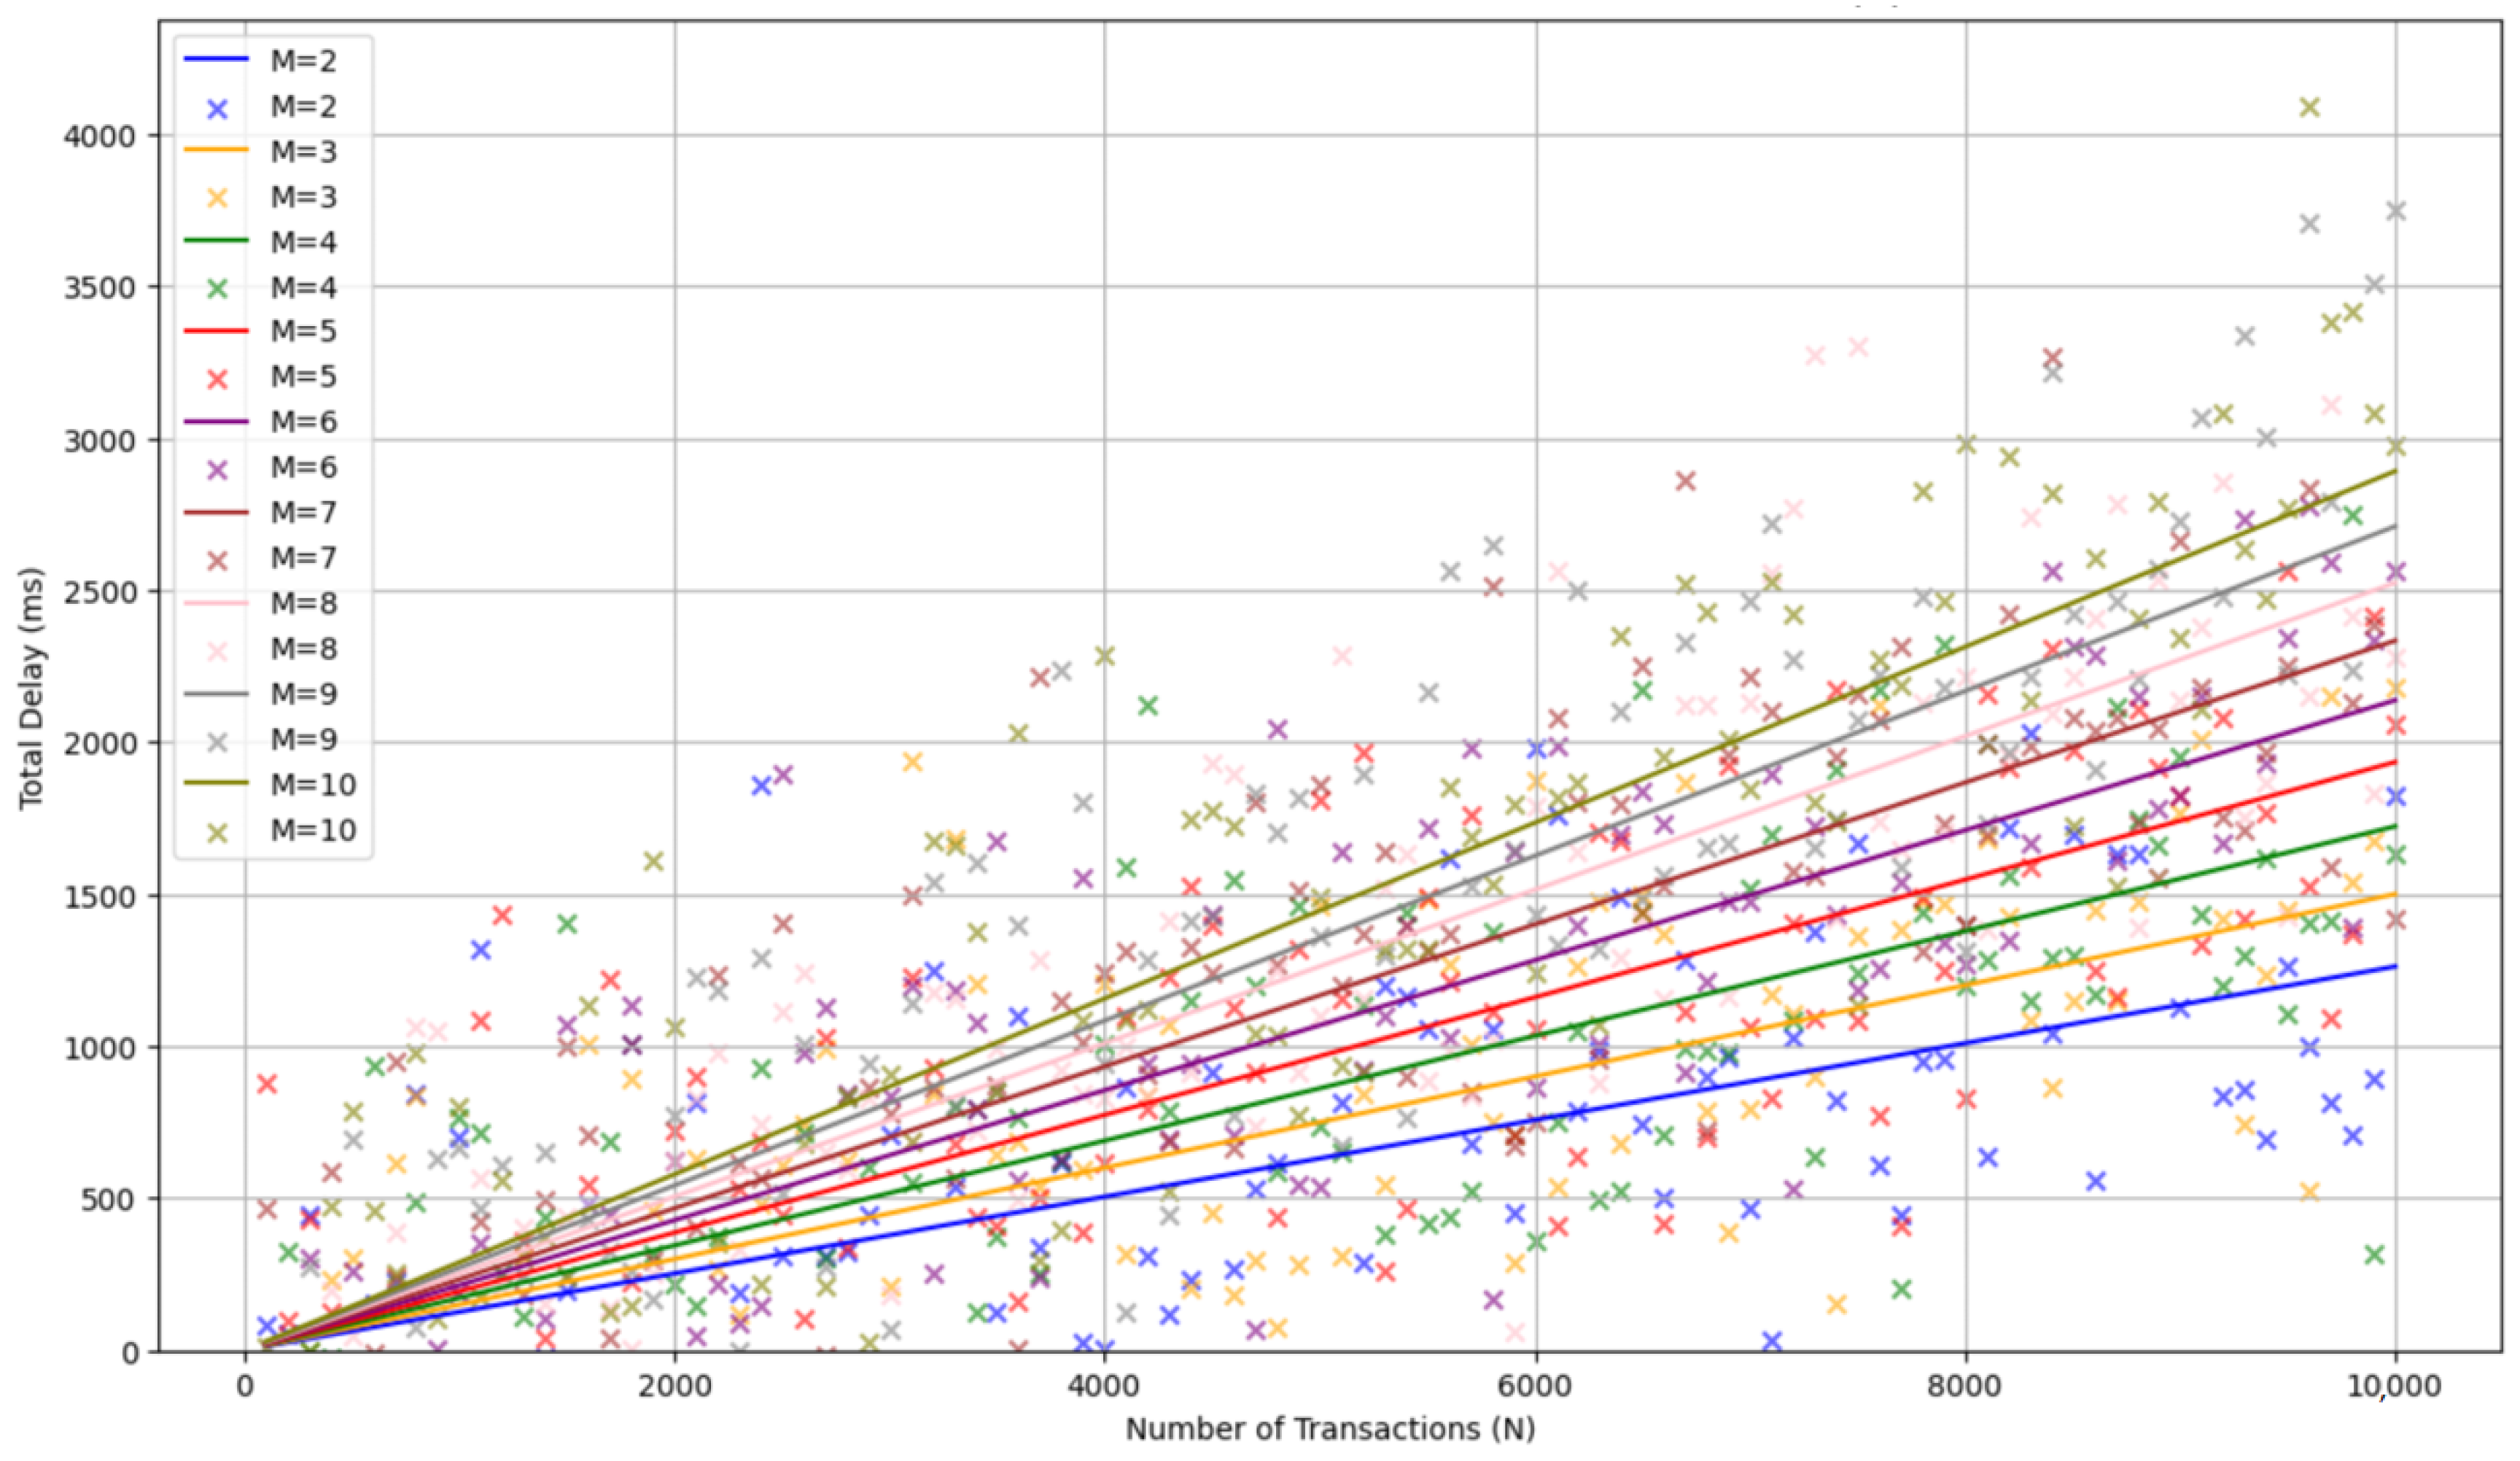
Figure 13 compares the theoretical and experimental results for total delay in the blockchain system as a function of the number of transactions (N) across varying numbers of B/As (M). The theoretical predictions, represented by solid lines, are derived from the proposed delay model, while scatter points depict experimental data obtained from real-world simulations. This comparison evaluates the model’s accuracy under diverse conditions.
Key trends observed in the analysis include the following:
- ▪
Impact of transactions (N): both theoretical and experimental results show a proportional increase in total delay as the number of transactions grows, consistent with the expected behavior of blockchain systems;
- ▪
Effect of B/As (M): while a higher number of B/As (M) theoretically improves workload distribution, the practical implications of communication overhead and synchronization in geographically distributed networks result in increased delays. This is particularly evident at higher agent counts (M = 8–10), where coordination challenges outweigh the benefits of parallelization.
Comparison Between Theoretical and Experimental Data: Theoretical predictions closely align with experimental results, confirming the validity of the delay model. However, as transaction volumes increase, minor deviations emerge due to real-world factors like network load, communication delays, and computational overhead. Notably, for lower agent counts (M = 2–3), both theoretical and experimental delays remain smaller due to reduced coordination requirements, although such configurations may struggle under heavy transaction loads. In contrast, systems with higher agent counts perform closer to the theoretical model, despite increased delays from coordination overhead. This alignment suggests that the model remains robust even in complex, geographically distributed setups.
7.3.3. Scalability Analysis of the Proposed System
The scalability of the proposed VP Blockchain framework was evaluated by analyzing its performance under increasing transaction volumes, agent participation, and network expansion. Simulation results confirm the system’s ability to process up to 10,000 transactions within a 5 min window, demonstrating its suitability for large-scale, real-time energy management applications.
The hierarchical MAS architecture plays a critical role in achieving scalability. By aggregating transactions at the CEV/A level, the system reduces computational load at higher layers, ensuring efficient resource utilization and transaction management. This design prevents computational bottlenecks at the DF/A and VP/A levels, allowing seamless scalability as more PEVs and RES units are integrated into the network.
Furthermore, the adoption of the PoA consensus mechanism ensures low-latency, high-throughput validation, even under high transaction loads. Unlike PoW, which suffers from increasing mining complexity, PoA maintains deterministic block finalization times by leveraging a pre-approved set of B/As. This structure prevents network congestion and supports high-frequency transaction processing, which is crucial for real-time decentralized PEV charging, discharging, and V2G energy transactions.
To further evaluate scalability, we simulated a geographically distributed energy network across four major cities in Greece, each with varying levels of PEV penetration and energy demand. The results confirmed that transaction delays remain stable as the network size grows, validating that the hierarchical MAS structure and PoA consensus mechanism effectively support large-scale decentralized energy networks.
While increasing the number of B/As (M) improves workload distribution, the benefits gradually diminish in geographically distributed setups due to rising communication and coordination overhead.
Figure 12 confirms that the proposed blockchain framework sustains reasonable transaction delay levels even under high transaction loads. Although adding more B/As enhances throughput, the diminishing returns beyond M > 8 indicate an optimal balance between network decentralization and processing efficiency. These findings emphasize the need to carefully balance agent participation and transaction complexity to ensure optimal system performance
Overall, these results confirm the scalability and robustness of the proposed blockchain framework, making it an ideal solution for supporting the growing demands of large-scale decentralized energy systems. Further scalability tests under higher penetration levels of PEVs and RESs will be explored in future research to validate the framework’s potential for real-world deployment.
7.3.4. Transaction Distribution Across Blockchain Agents
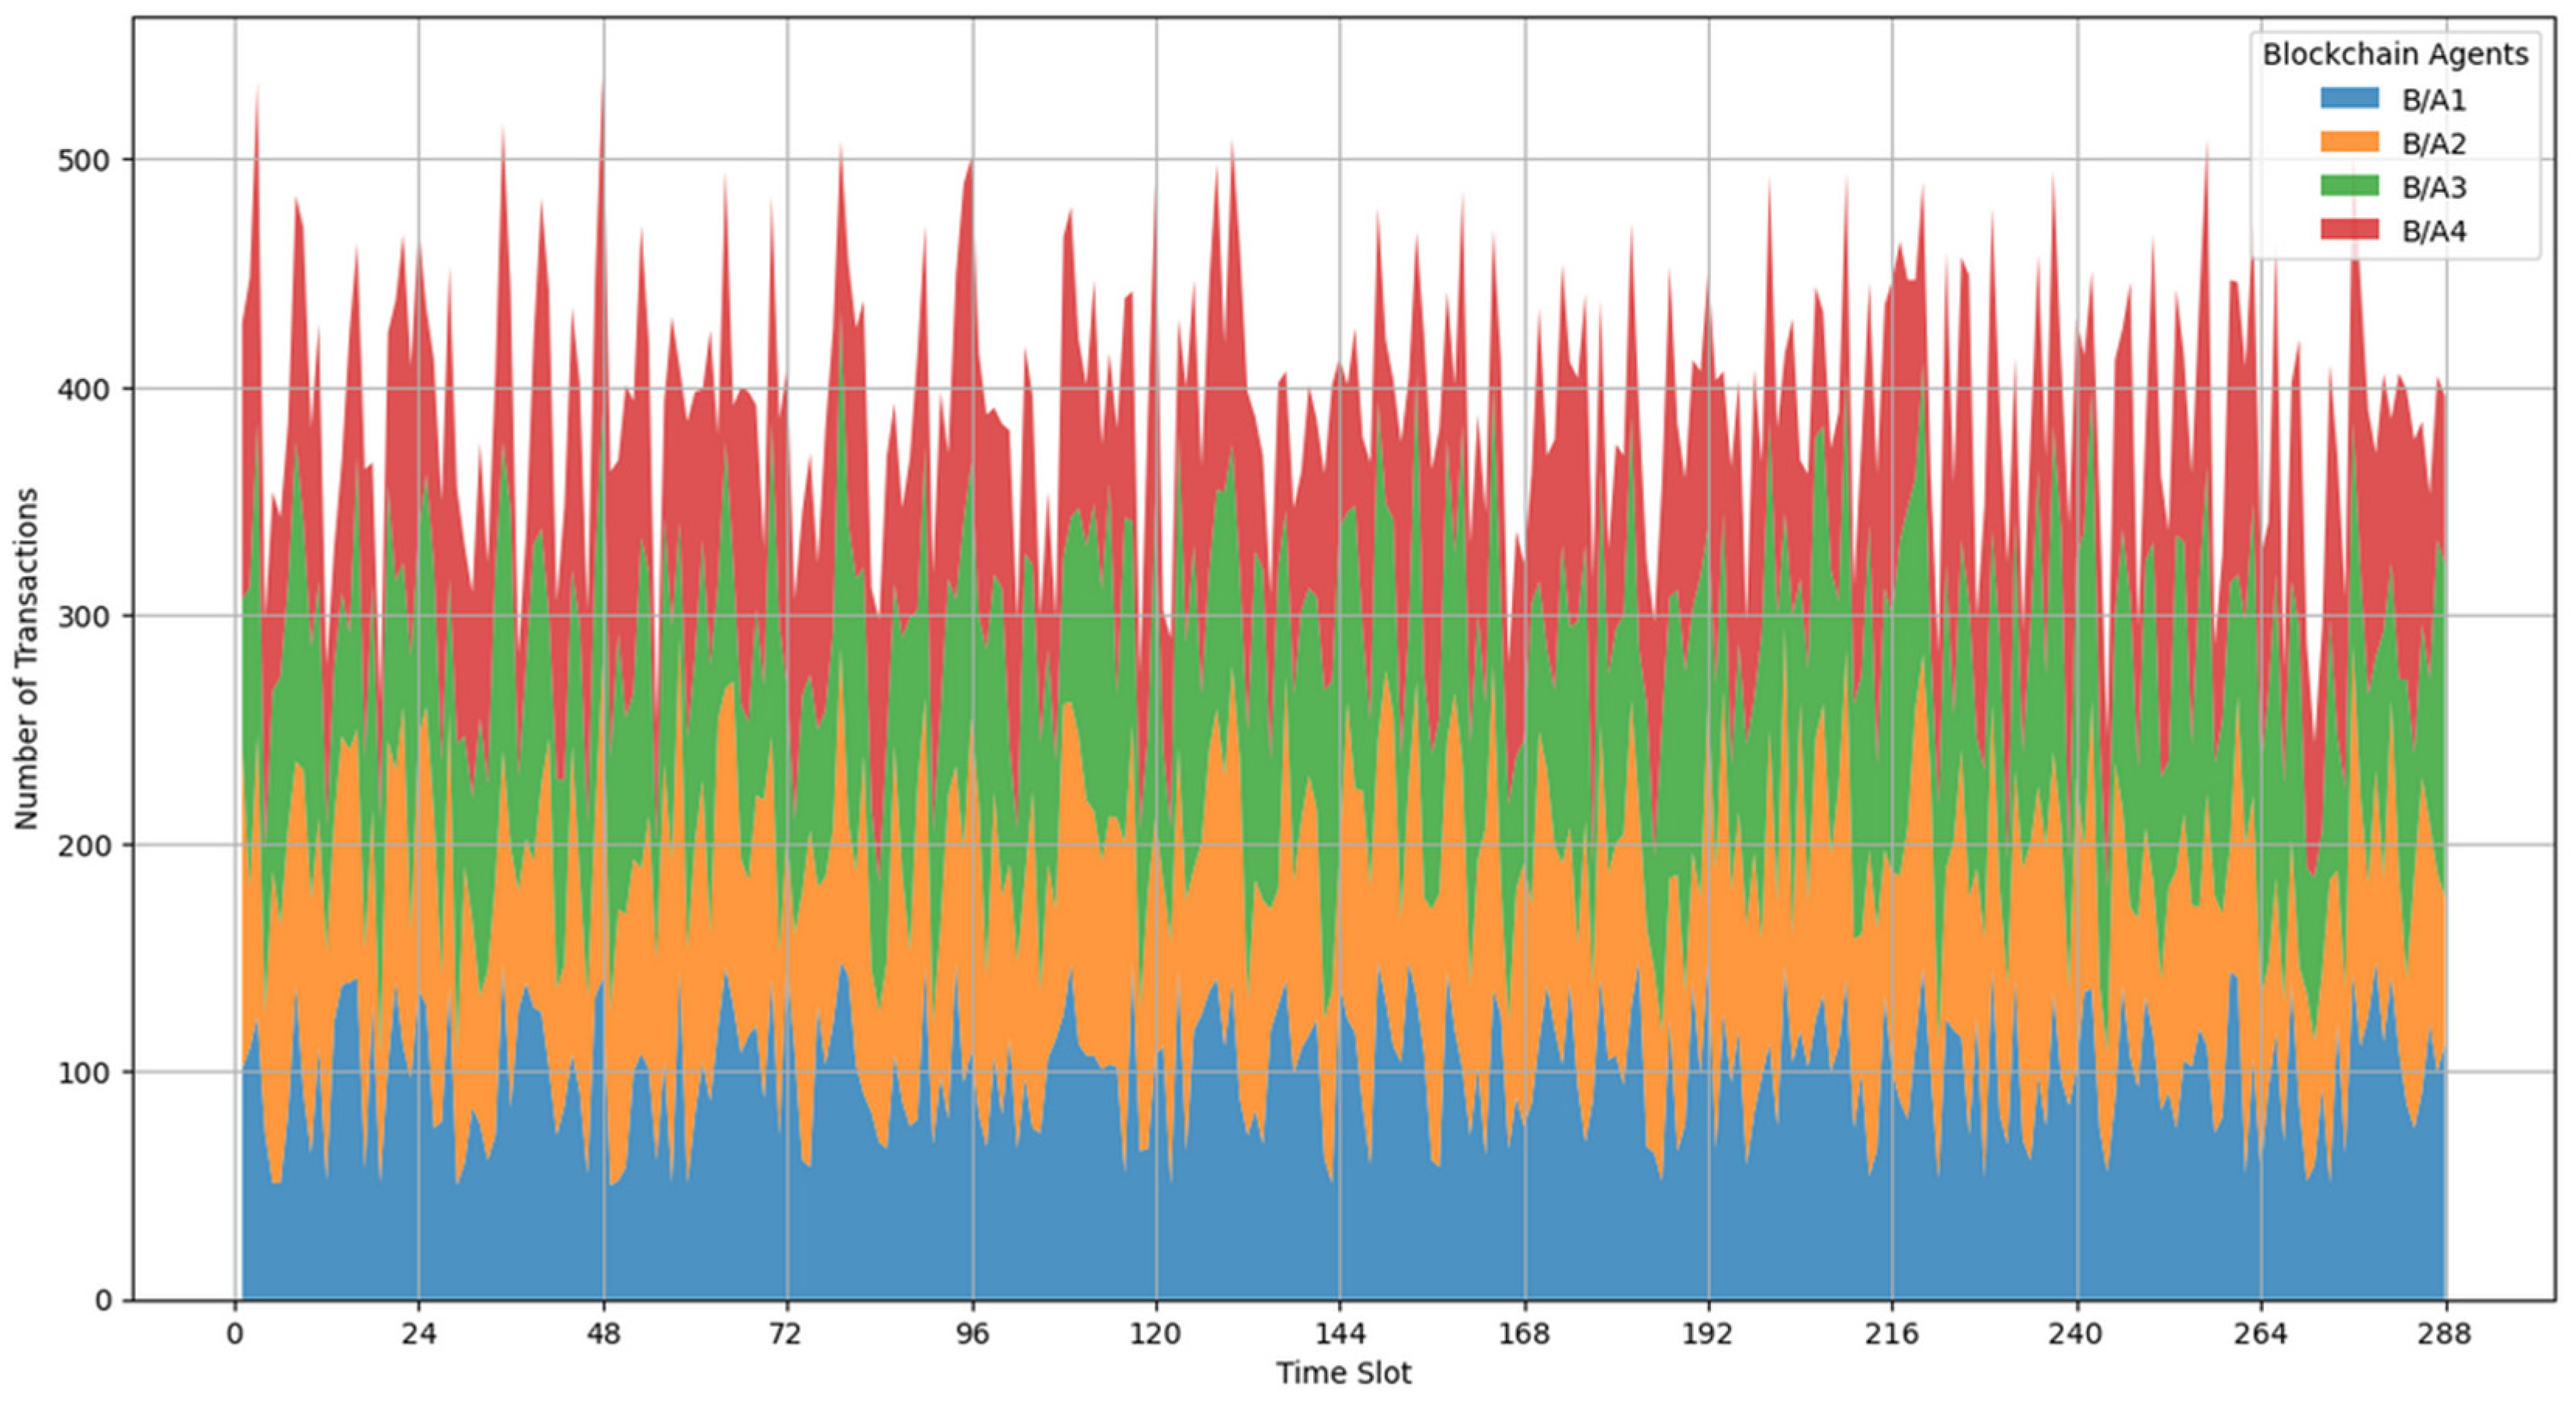
Figure 14 illustrates the distribution of transactions processed by four Blockchain Agents (B/As) over 288 time slots, visualizing how the system balances transaction loads. Each agent’s workload is represented by a distinct color, highlighting variations over time, including periodic peaks and troughs.
The graph reveals that B/A1 consistently handles a significant portion of transactions during low-transaction periods, serving a foundational role in baseline operations. During peak times, workloads are redistributed dynamically, with B/A2, B/A3, and B/A4 handling larger shares. This adaptive distribution demonstrates the system’s ability to adjust to fluctuating demands and maintain efficient operations.
Insights and Implications
- ▪
Workload distribution: imbalances, such as consistently high loads on a single B/A like B/A1, could indicate potential bottlenecks that may affect system performance;
- ▪
Load-balancing efficiency: dynamic transaction aggregation and load balancing are critical for preventing delays and ensuring smooth operations across all agents;
- ▪
Scalability and resilience: the system’s ability to redistribute workloads dynamically supports scalability and resilience, particularly in real-time energy management applications.
7.3.5. Probability Density Functions of Transaction Distributions and Consensus Performance
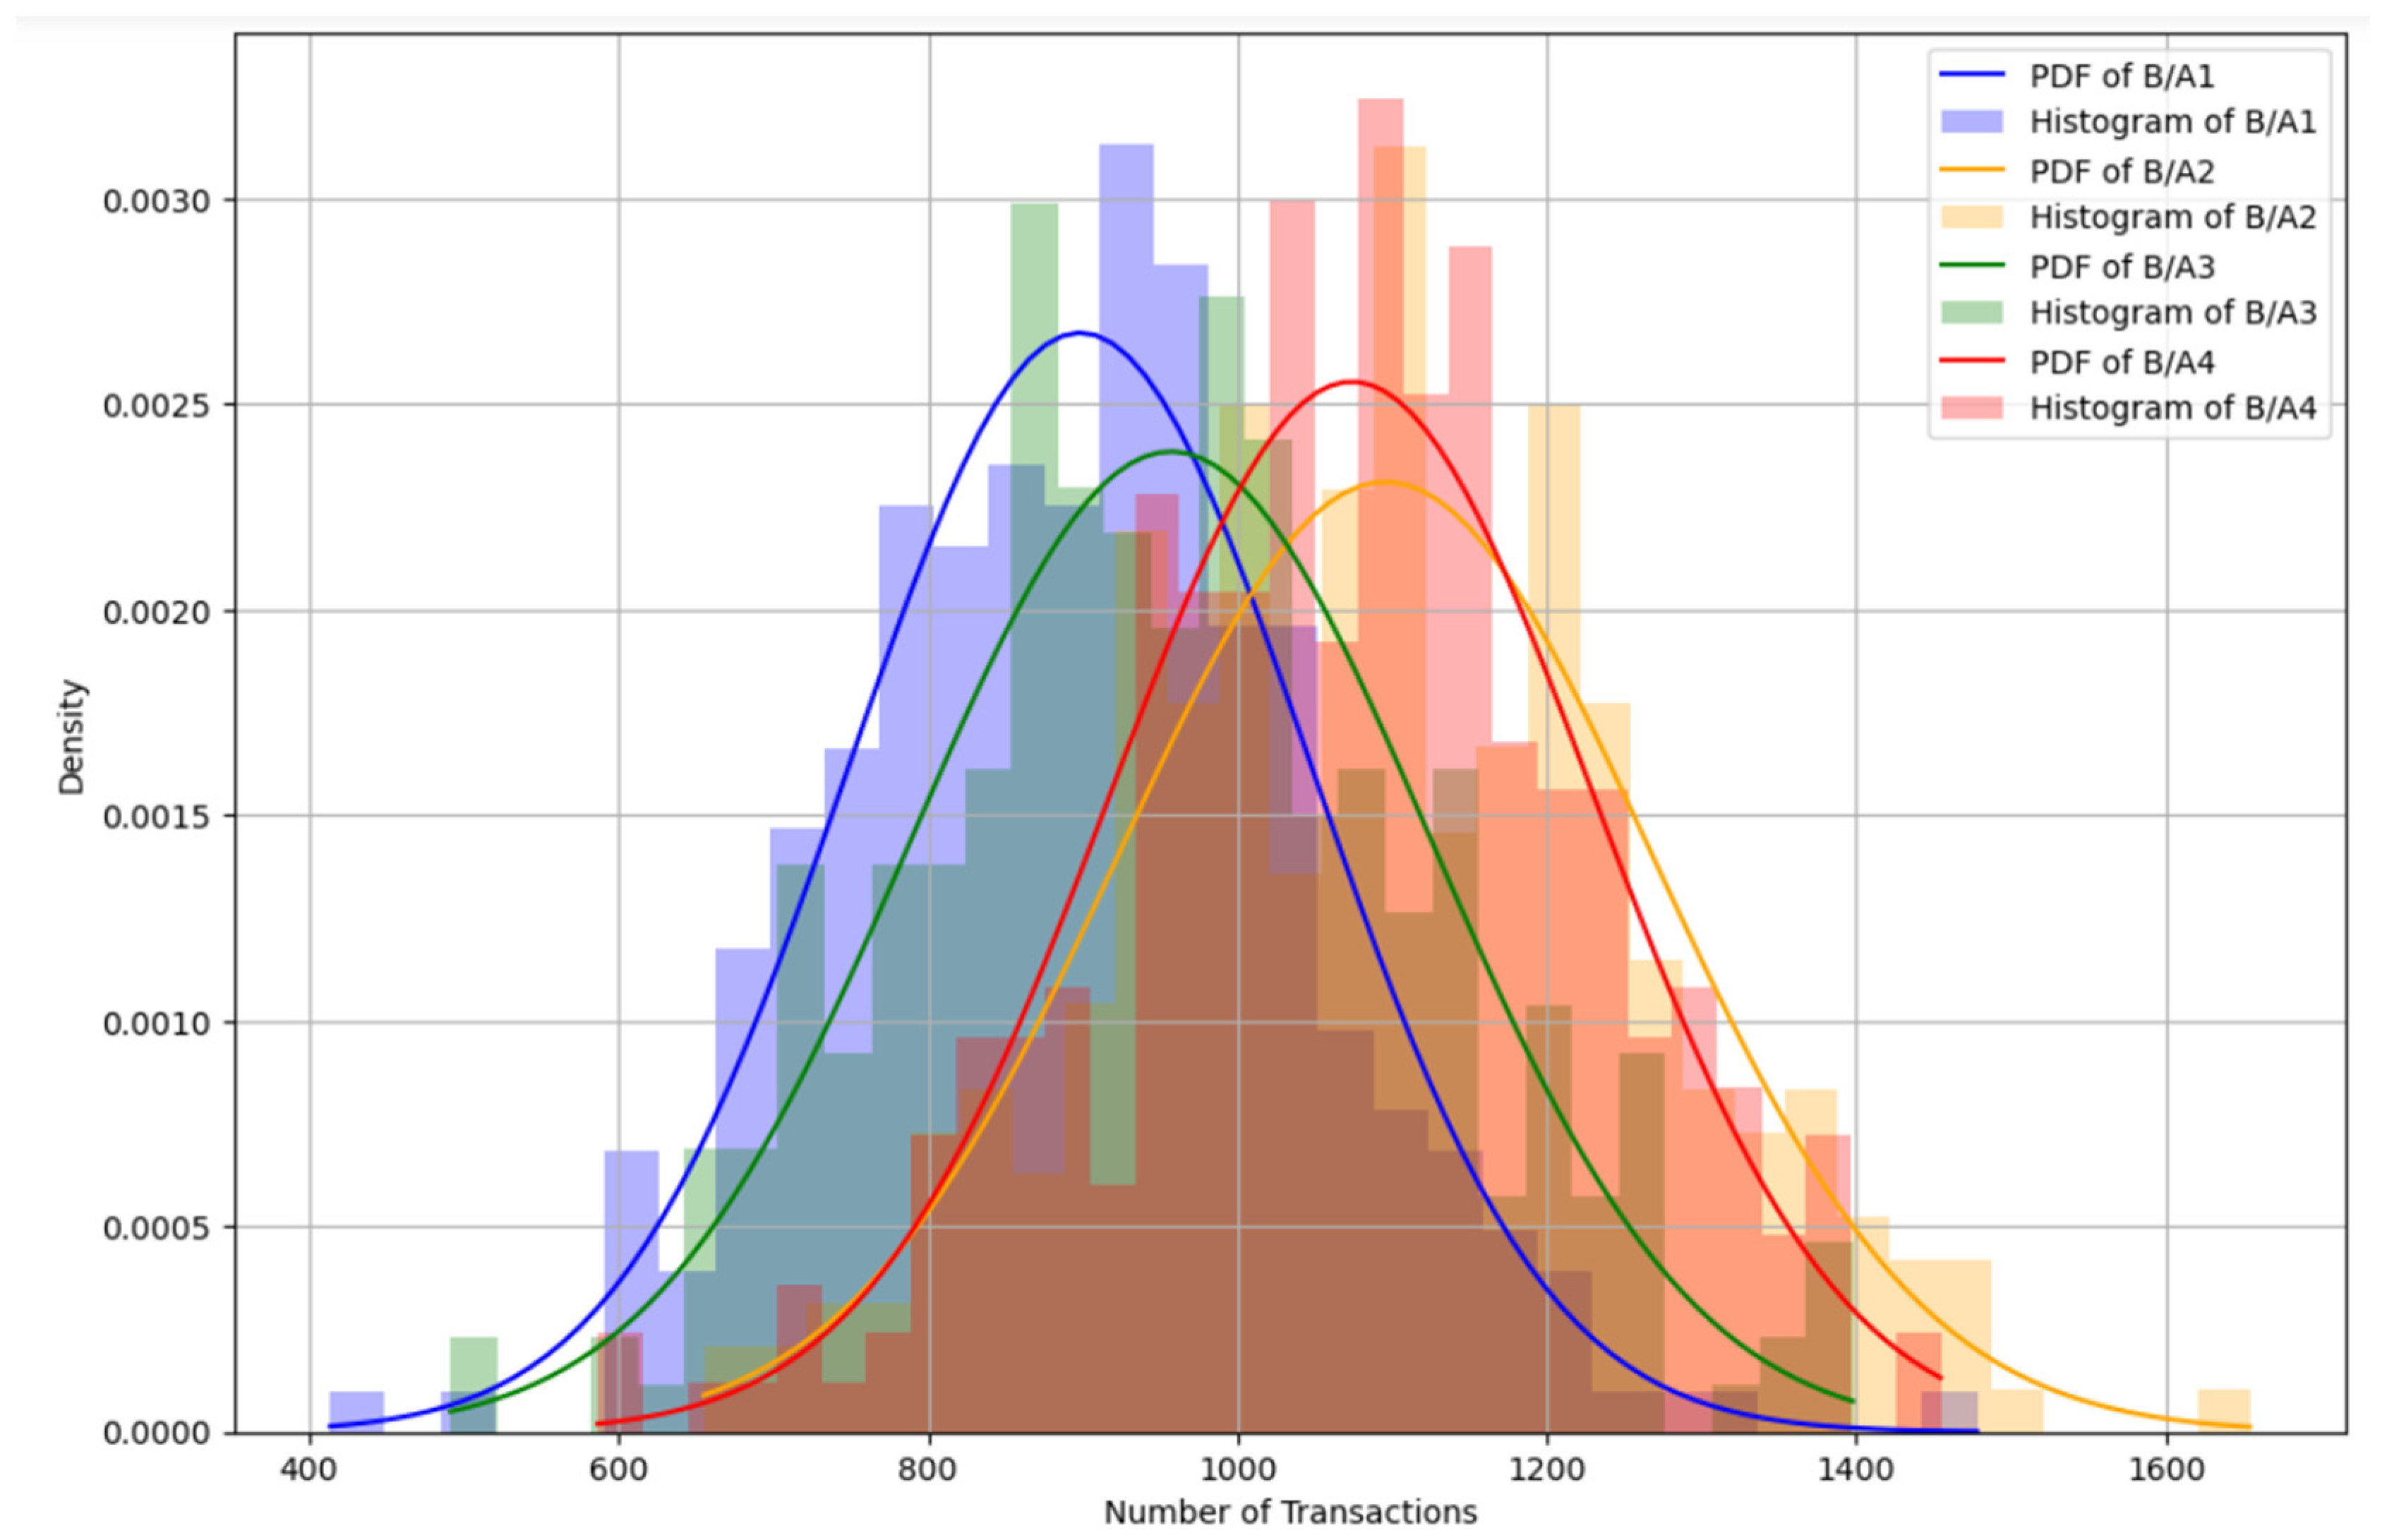
Figure 15 illustrates the Probability Density Functions (PDFs) and histograms of transaction distributions across four B/As over 288 time slots.
Table 3 summarizes the key metrics, including the mean and standard deviation of transactions handled by each agent.
The analysis reveals variability in transaction loads across agents:
- ▪
B/A2 and B/A4 handle larger transaction volumes, as reflected in their higher means;
- ▪
B/A1 exhibits the most consistent workload, while B/A2 and B/A3 show greater variability, indicated by their higher standard deviations.
This variability highlights potential inefficiencies in transaction balancing, where agents with disproportionately high loads may experience congestion or delays. These findings underscore the need for robust load-balancing mechanisms to ensure efficient and reliable blockchain performance, particularly in real-time energy management applications.
Consensus Performance Validation
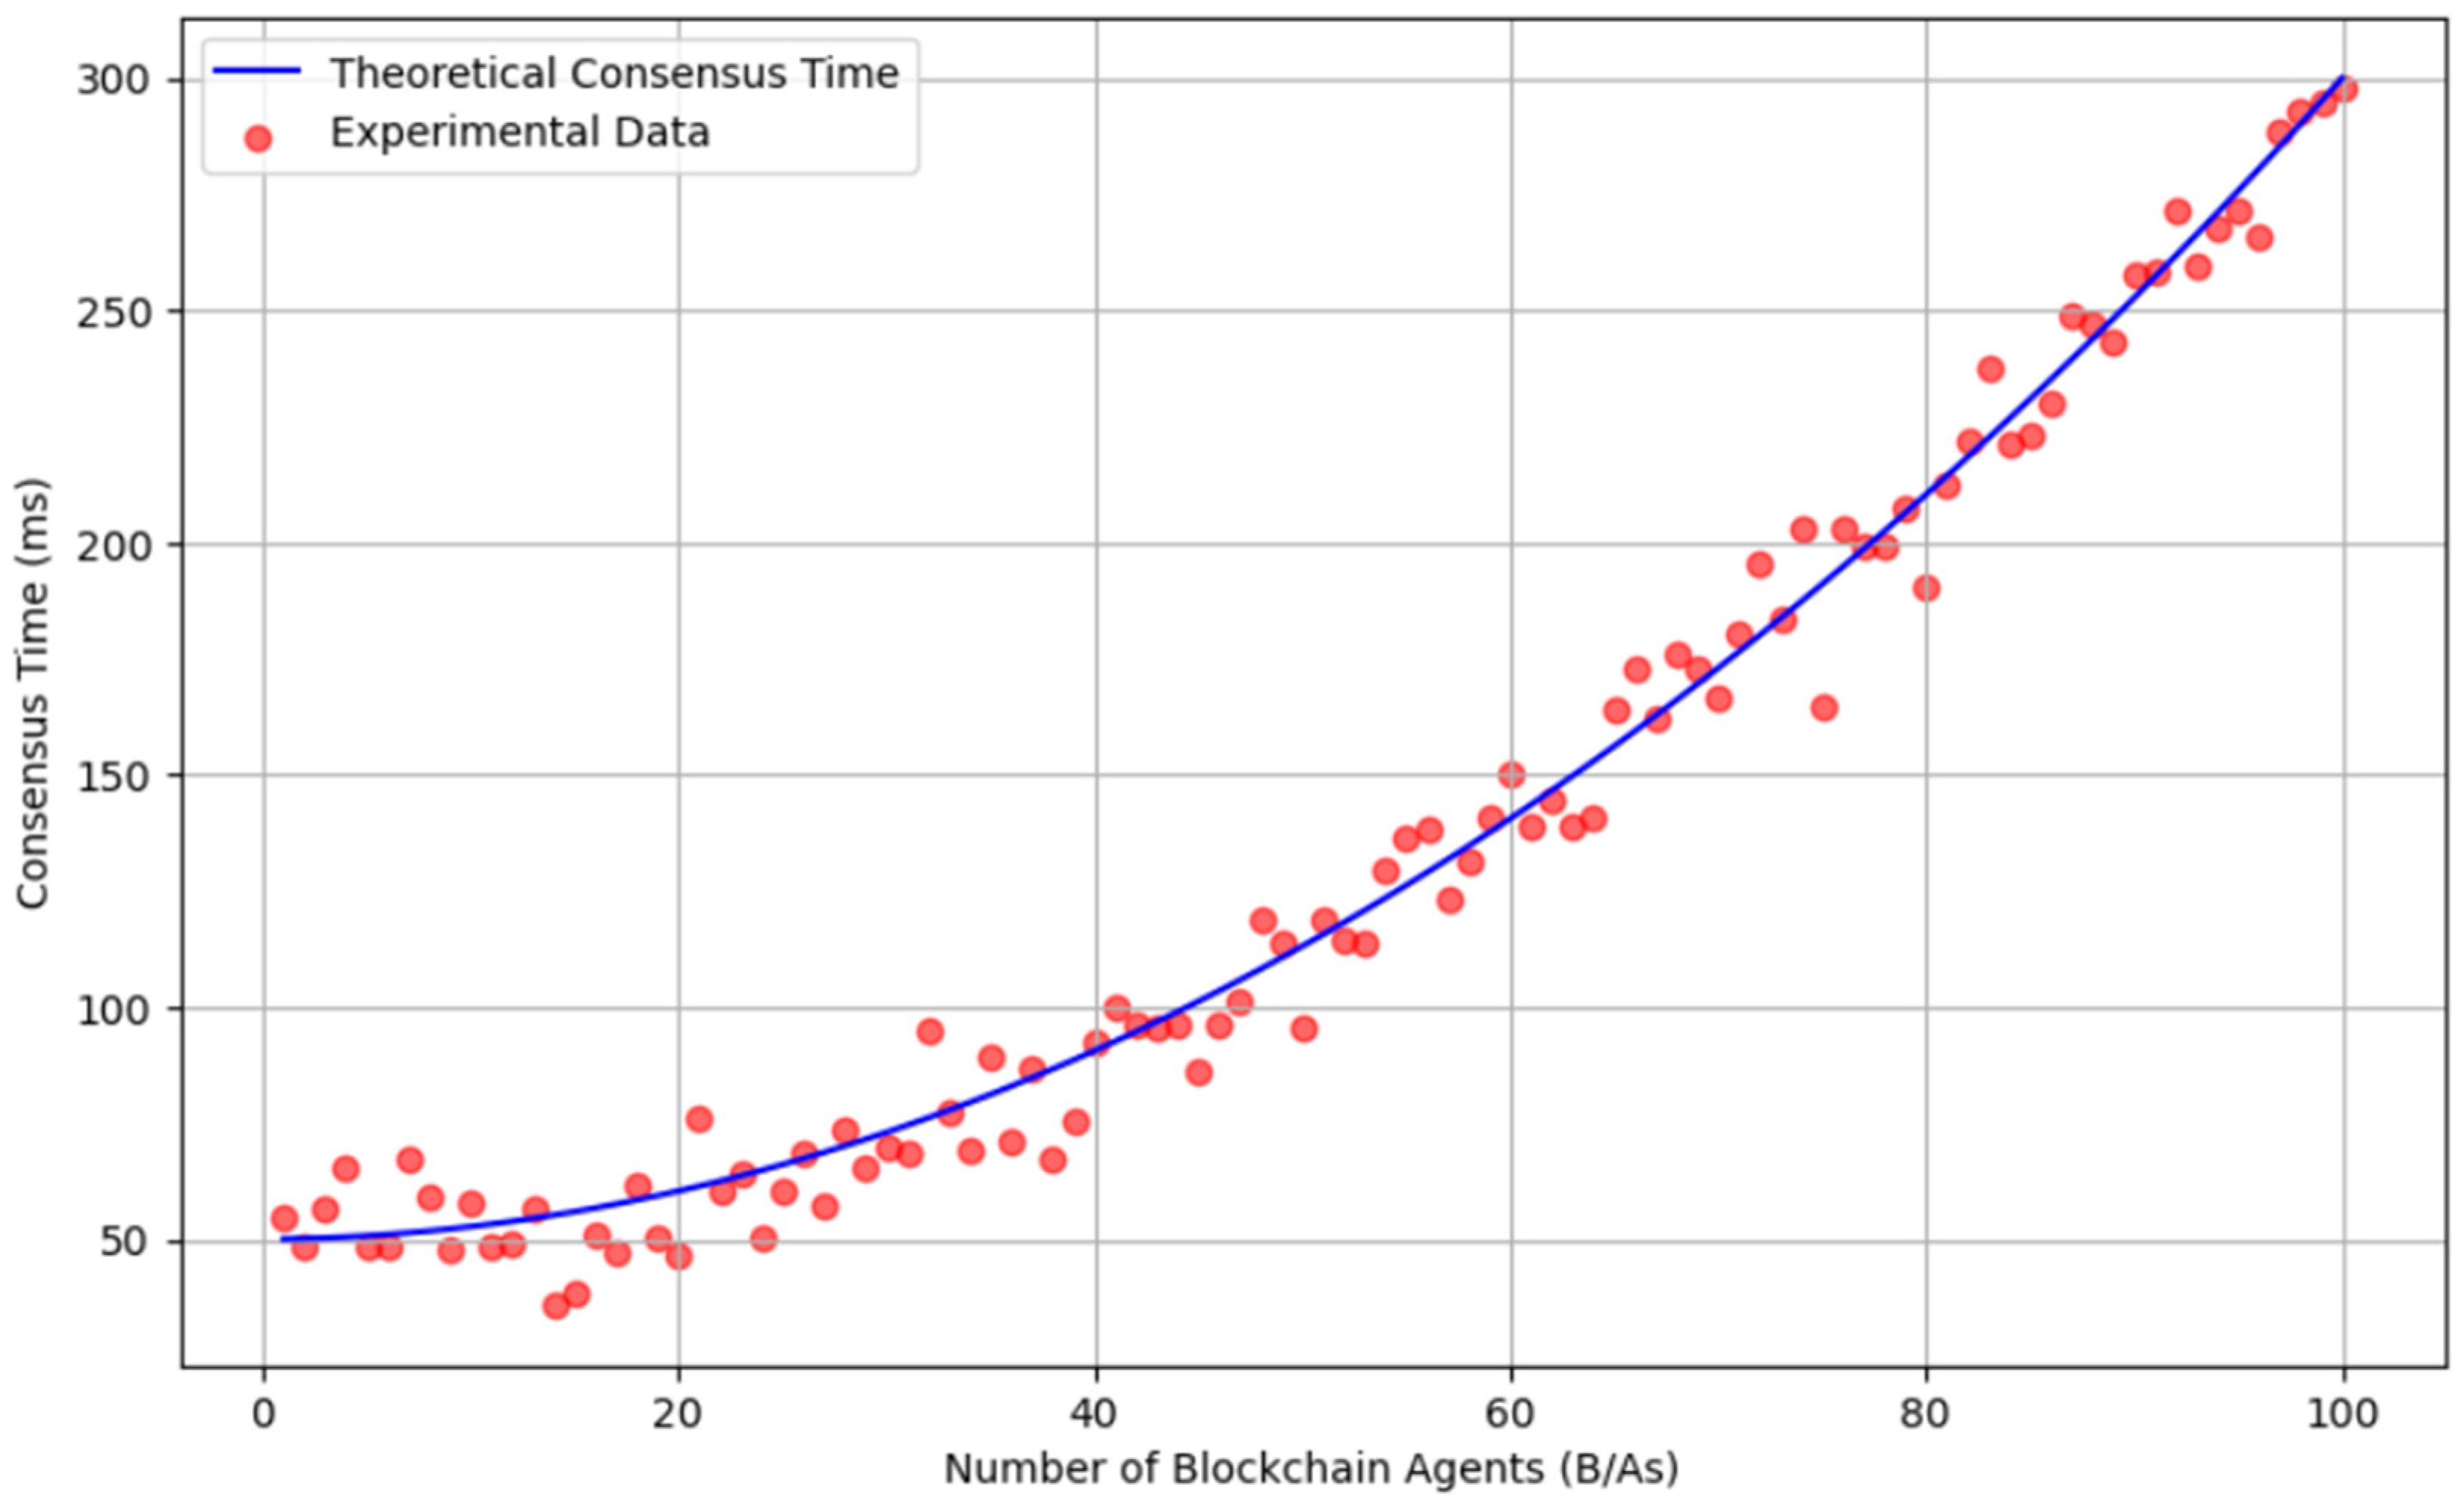
Figure 16 compares the theoretical and experimental performance of the PoA consensus mechanism. The blue line represents theoretical consensus times, while red crosses indicate experimental data points. The results demonstrate a strong alignment between theory and practice, validating the proposed consensus model.
Key observations include the following:
- ▪
Impact of agent participation: consensus time increases significantly with the number of B/As due to the added complexity of coordinating agents in a geographically distributed network;
- ▪
Model accuracy: the close agreement between theoretical and experimental results confirms the model’s applicability in real-world blockchain systems.
This validation reinforces the effectiveness of the PoA mechanism in managing scalability and efficiency, even in scenarios with high agent participation.
7.3.6. Blockchain Performance Analysis
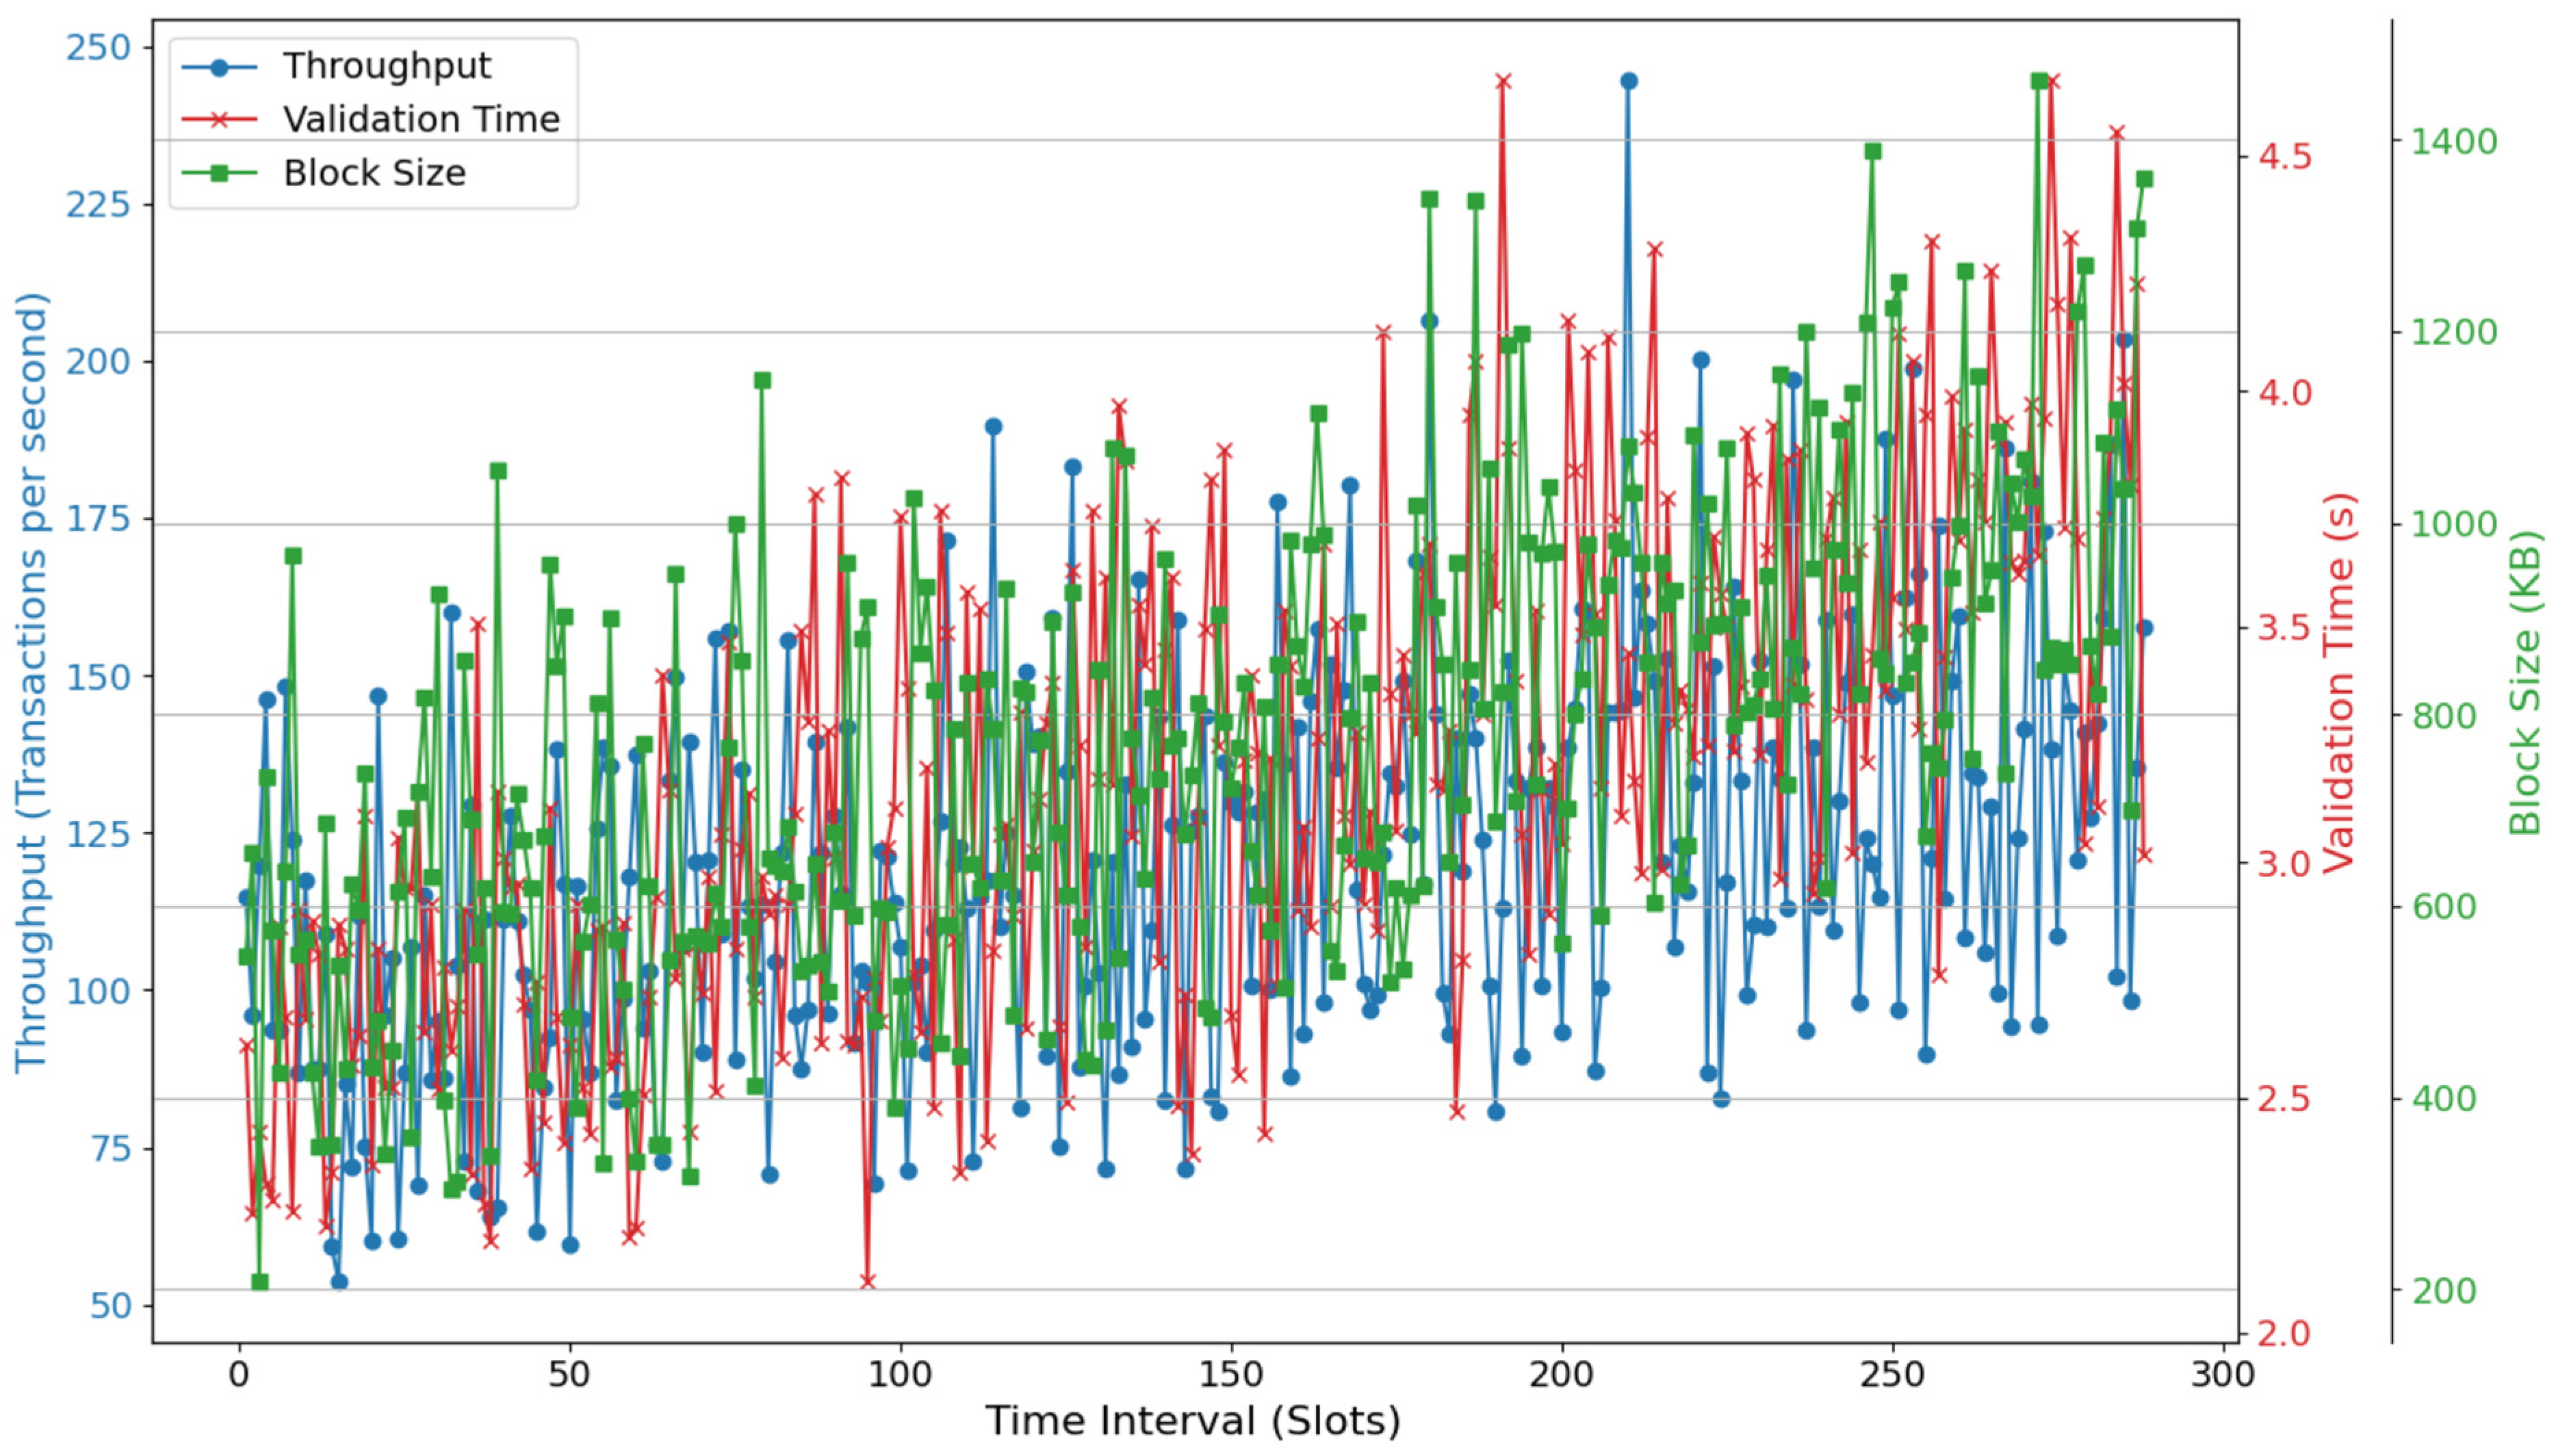
Figure 17 presents a detailed analysis of key blockchain performance metrics—throughput, validation time, and block size—over time, offering critical insights into the scalability and efficiency of blockchain systems in energy-related applications.
- ▪
Throughput: Represented by the blue line, throughput reflects the number of transactions processed per second. The graph shows a steady increase, rising from approximately 75 transactions per second in the initial time slots to 225 transactions per second. This trend demonstrates the system’s ability to scale and process higher transaction volumes, essential for real-time applications like power trading and grid balancing;
- ▪
Validation time: The red line indicates validation time, starting at 2.5 s and gradually increasing to over 4.5 s. This rise corresponds to the growing transaction volume and larger block sizes, which require more computational resources for validation. While the system maintains efficiency at higher transaction rates, the increasing validation time highlights a scalability challenge that must be addressed for real-time operations;
- ▪
Block size: The green line represents block size, which grows from 200 KB to 1,400 KB over time. Larger block sizes accommodate more transactions but contribute to longer validation times, as more data must be processed and stored. This trade-off underscores the need to optimize data storage solutions to maintain efficiency.
- ▪
Interconnected performance dynamics: The interplay between throughput, validation time, and block size illustrates the scalability challenges inherent in blockchain systems. As throughput increases, larger blocks are required, leading to greater computational loads and longer validation times. These dynamics highlight the importance of balancing system parameters to ensure efficient operation as transaction volumes grow.
Implications for Blockchain in Energy Applications
This analysis underscores the need for optimization strategies to address the rising computational demands of blockchain systems. For energy-sector applications, where real-time processing of transactions is critical, potential solutions include the following:
- ▪
Consensus mechanism enhancements: exploring lightweight or adaptive consensus mechanisms to reduce validation times;
- ▪
Efficient data storage: implementing advanced data storage techniques to manage larger block sizes without compromising performance;
- ▪
Load-balancing strategies: distributing transaction processing across agents to mitigate bottlenecks and maintain high throughput.
These insights provide a foundation for developing scalable blockchain systems capable of supporting the growing demands of decentralized energy networks while ensuring efficient and reliable operations.
7.3.7. Reliability Analysis
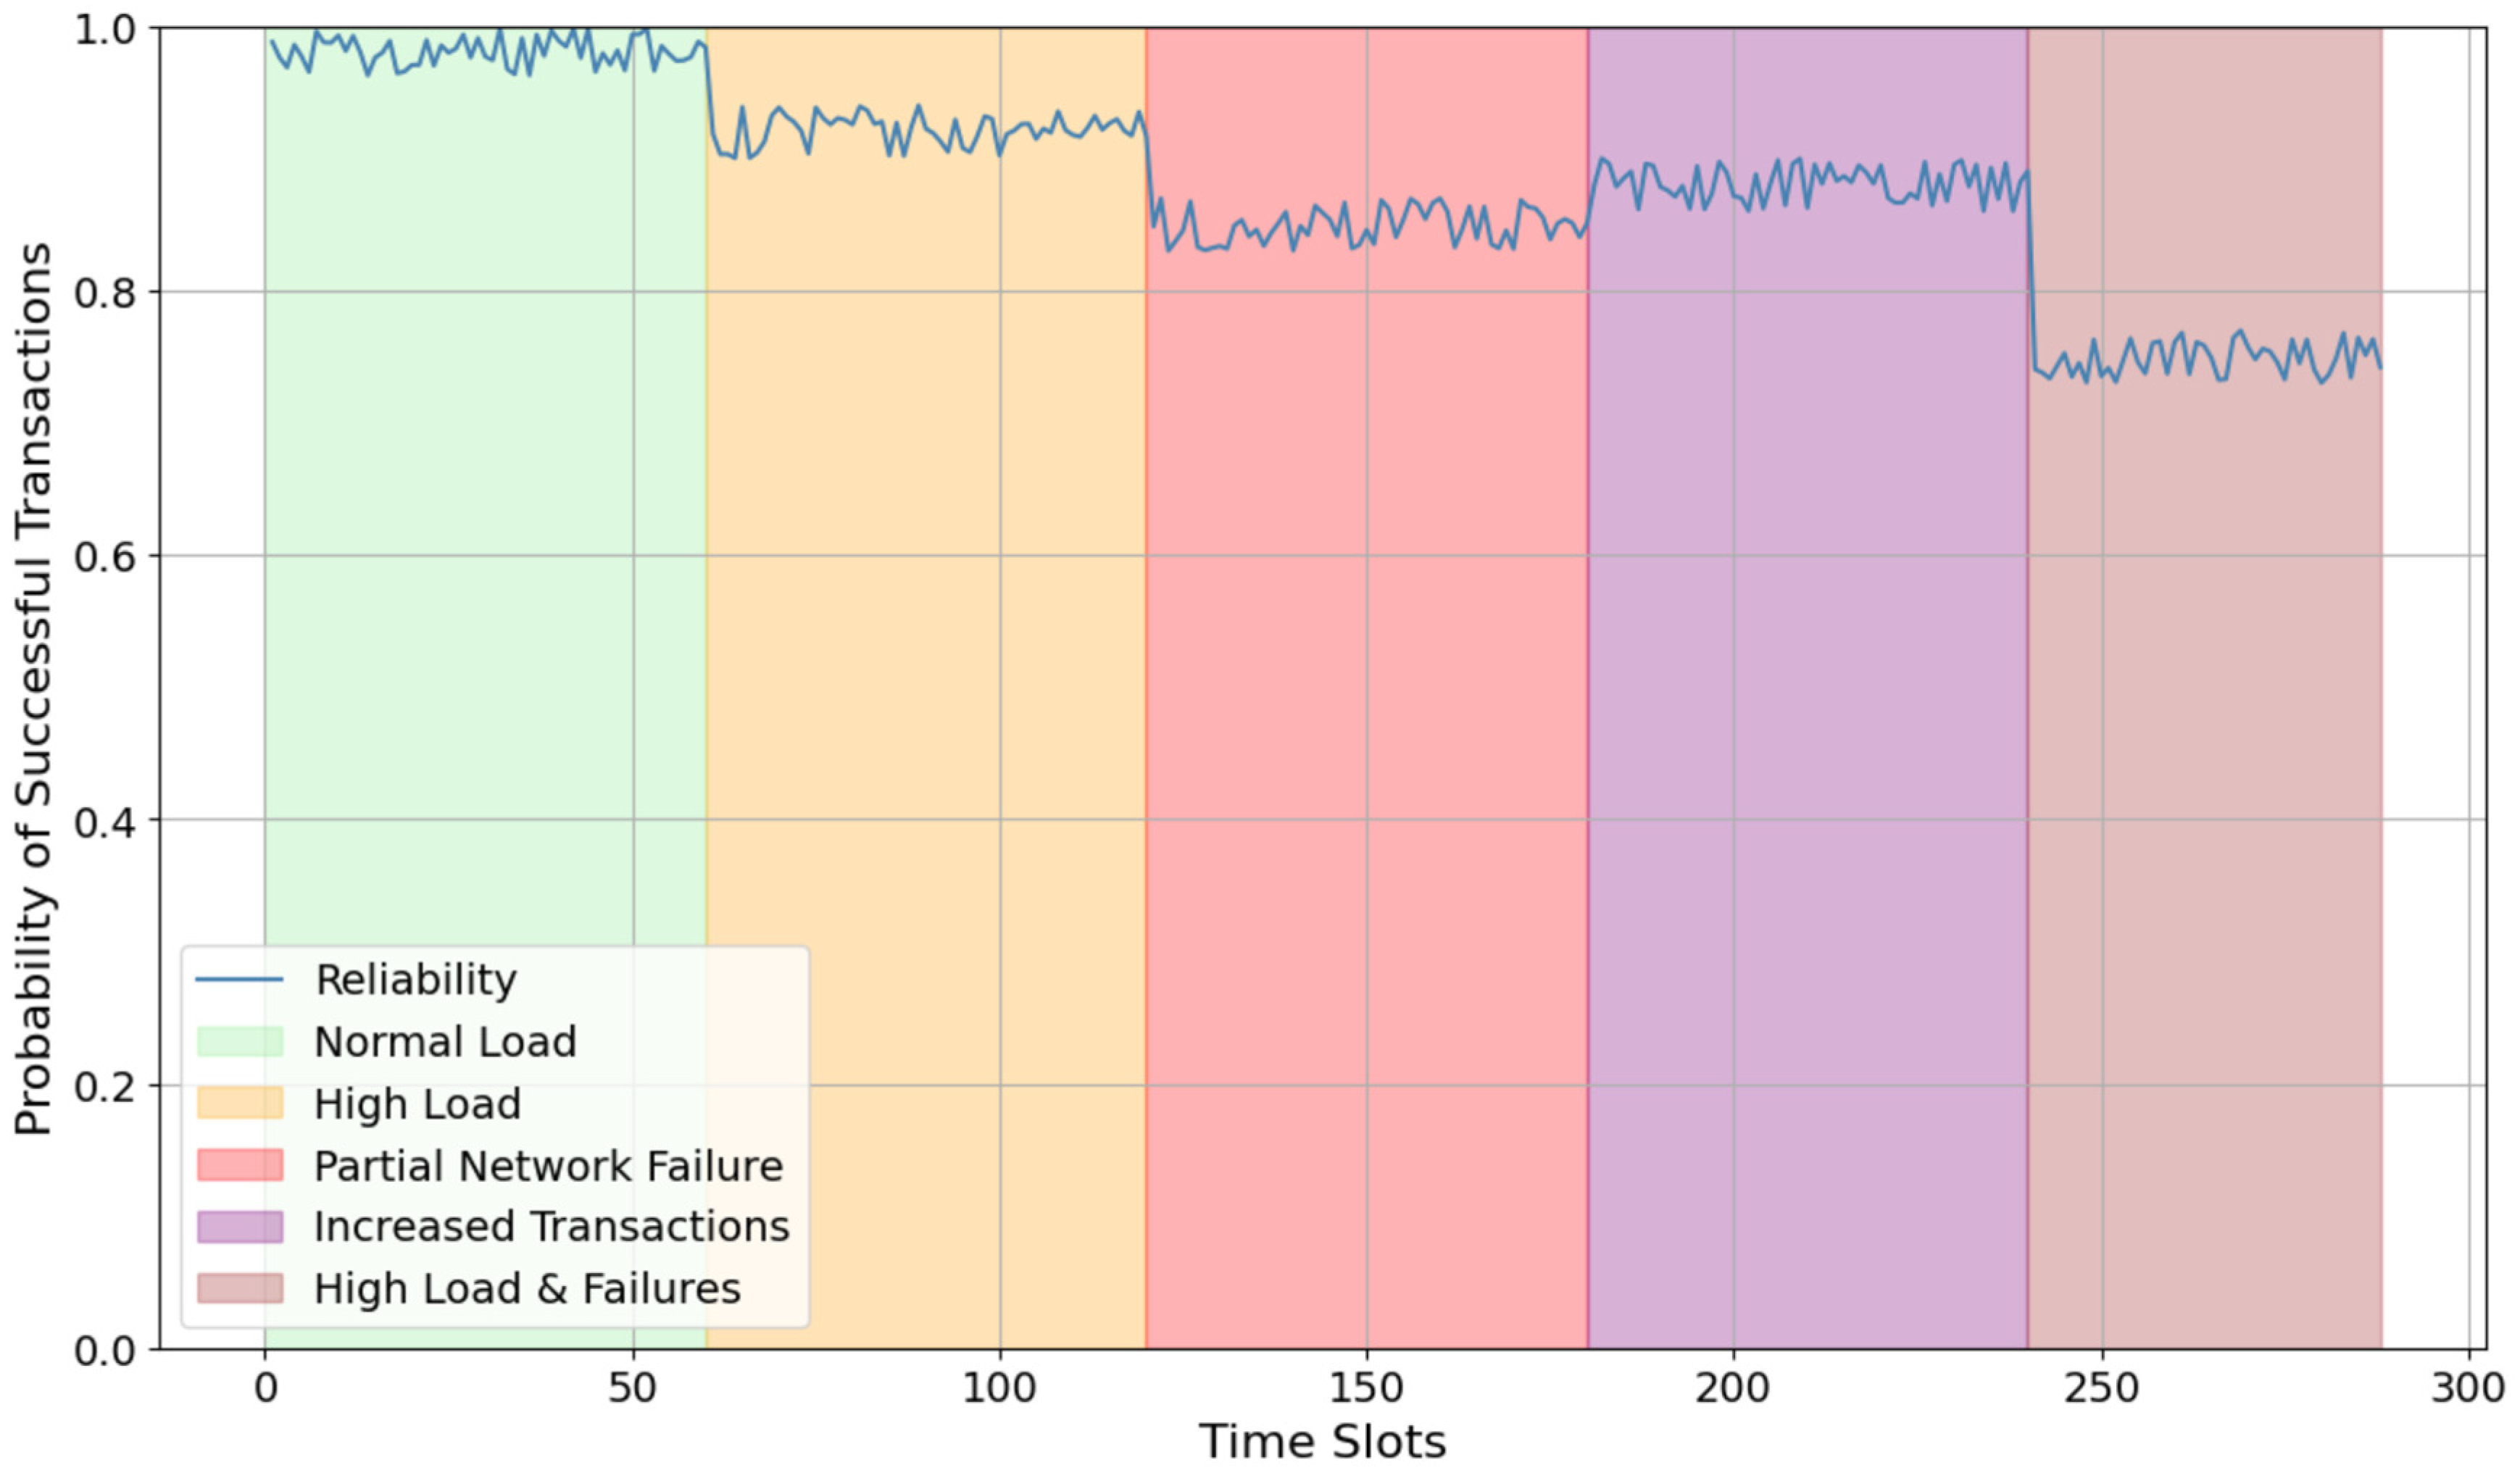
Figure 18 illustrates the reliability of successful transactions in the VP MAS Blockchain-based under various operational scenarios, highlighting the system’s performance under changing loads and network conditions.
- ▪
Normal load (green region): During normal load conditions, the system achieves near-perfect reliability, with transaction success rates fluctuating between 98% and 100%. This indicates optimal system performance due to low transaction volumes, stable network conditions, and minimal resource stress;
- ▪
High load (orange region): In high-load scenarios, reliability decreases slightly to around 90%, reflecting the system’s increased workload as more transactions are processed. While performance remains relatively high, this decline signals the need for better resource allocation to handle peak demand periods efficiently;
- ▪
Partial network failure (red region): Reliability drops further to 85% during partial network failures, as disruptions in connectivity hinder transaction validation and increase delays. This highlights the vulnerability of the system to network reliability issues;
- ▪
Increased transactions (purple region): When handling a high transaction volume, the reliability stabilizes at approximately 85%, even in the absence of network issues. This suggests bottlenecks in transaction processing and validation as the system’s workload grows;
- ▪
High load and failures (brown region): In the most challenging conditions, combining high transaction volumes with network failures, reliability declines significantly to below 75%. The compounding effect of these stressors results in a sharp rise in transaction failures, indicating the system’s limited capacity to maintain performance under extreme conditions.
Overall Analysis
The reliability analysis demonstrates that the system performs robustly under normal conditions but experiences significant performance degradation during high load and network disruption scenarios. These findings emphasize the need for improvements in blockchain infrastructure, such as the following:
- ▪
Network redundancy: to reduce the impact of partial failures;
- ▪
Transaction batching: to streamline validation and reduce processing overhead;
- ▪
Consensus optimization: to improve validation efficiency under high loads.
By addressing these challenges, the blockchain system can better support the dynamic demands of energy management in Virtual Prosumer Networks, ensuring efficient and reliable operations even under stress.
7.3.8. Interoperability and System Integration
The proposed VP Blockchain-Based MAS framework demonstrates a high degree of interoperability with existing energy management systems and blockchain platforms. This is achieved through the following:
- ▪
Standardized communication protocols: The system utilizes TCP/IP and HTTPS for secure data transmission, ensuring compatibility with modern network infrastructures. The integration with JADE-based MAS facilitates seamless agent communication within the network;
- ▪
Blockchain and energy platform integration: By adopting a modular design, the framework enables interaction with established blockchain networks like Ethereum and Hyperledger. The hierarchical MAS structure allows the VP/A to interface with energy management systems, such as Distributed Energy Resource Management Systems (DERMSs) and Energy Management Systems (EMSs);
- ▪
Cross-platform compatibility: Blockchain Agents (B/As) have been designed to operate across diverse operating systems (Windows, Linux, macOS), ensuring that the system can be implemented in heterogeneous environments;
- ▪
Interoperability in smart contracts: the proposed framework incorporates extensible smart contracts that can be tailored to various market conditions, such as dynamic pricing and P2P trading.
This interoperability ensures the system can be deployed alongside existing energy and blockchain infrastructures, facilitating scalability and adaptability in diverse operational contexts.
7.3.9. Computational Complexity Analysis
This section evaluates the computational overhead of the PoA consensus mechanism, as well as the optimization and storage components of the proposed system, to highlight their scalability and feasibility for real-time applications
The PoA consensus mechanism features linear time complexity with respect to the number of validators N and transactions T. Each transaction undergoes communication between validators followed by a consensus step. The overall complexity is , making the system highly scalable. Since the number of validators is relatively small and fixed compared to the volume of transactions, PoA ensures efficiency and low latency even for large-scale implementations. This linear relationship ensures predictable growth in computational demand, aligning well with the needs of decentralized energy systems that require fast and reliable transaction processing.
The PSO algorithm, employed for scheduling and optimization, exhibits a time complexity of where P is the number of particles in the swarm, I is the number of iterations required for convergence, and D is the dimensionality of the solution space. Increasing P or I improves convergence accuracy but increases computational demand. In real-time energy optimization, trade-offs between convergence reliability and computational overhead must be carefully managed. Techniques such as adaptive particle populations or dynamic stopping criteria are recommended to maintain efficiency while ensuring high-quality optimization for large-scale systems.
For space complexity, the Blockchain Model’s data storage requirements grow with the number of transactions T and blocks B. The cumulative storage requirement, represented as , includes transaction data and metadata such as block headers and cryptographic proofs. To mitigate memory overhead, the framework incorporates transaction aggregation, which reduces the number of individual entries stored on the blockchain by grouping multiple transactions into a single block. This approach enhances both computational and storage efficiency during block validation and retrieval. Furthermore, lightweight storage solutions, such as off-chain data management and state compression techniques, can further alleviate space demands, ensuring scalability for large-scale, real-time systems.
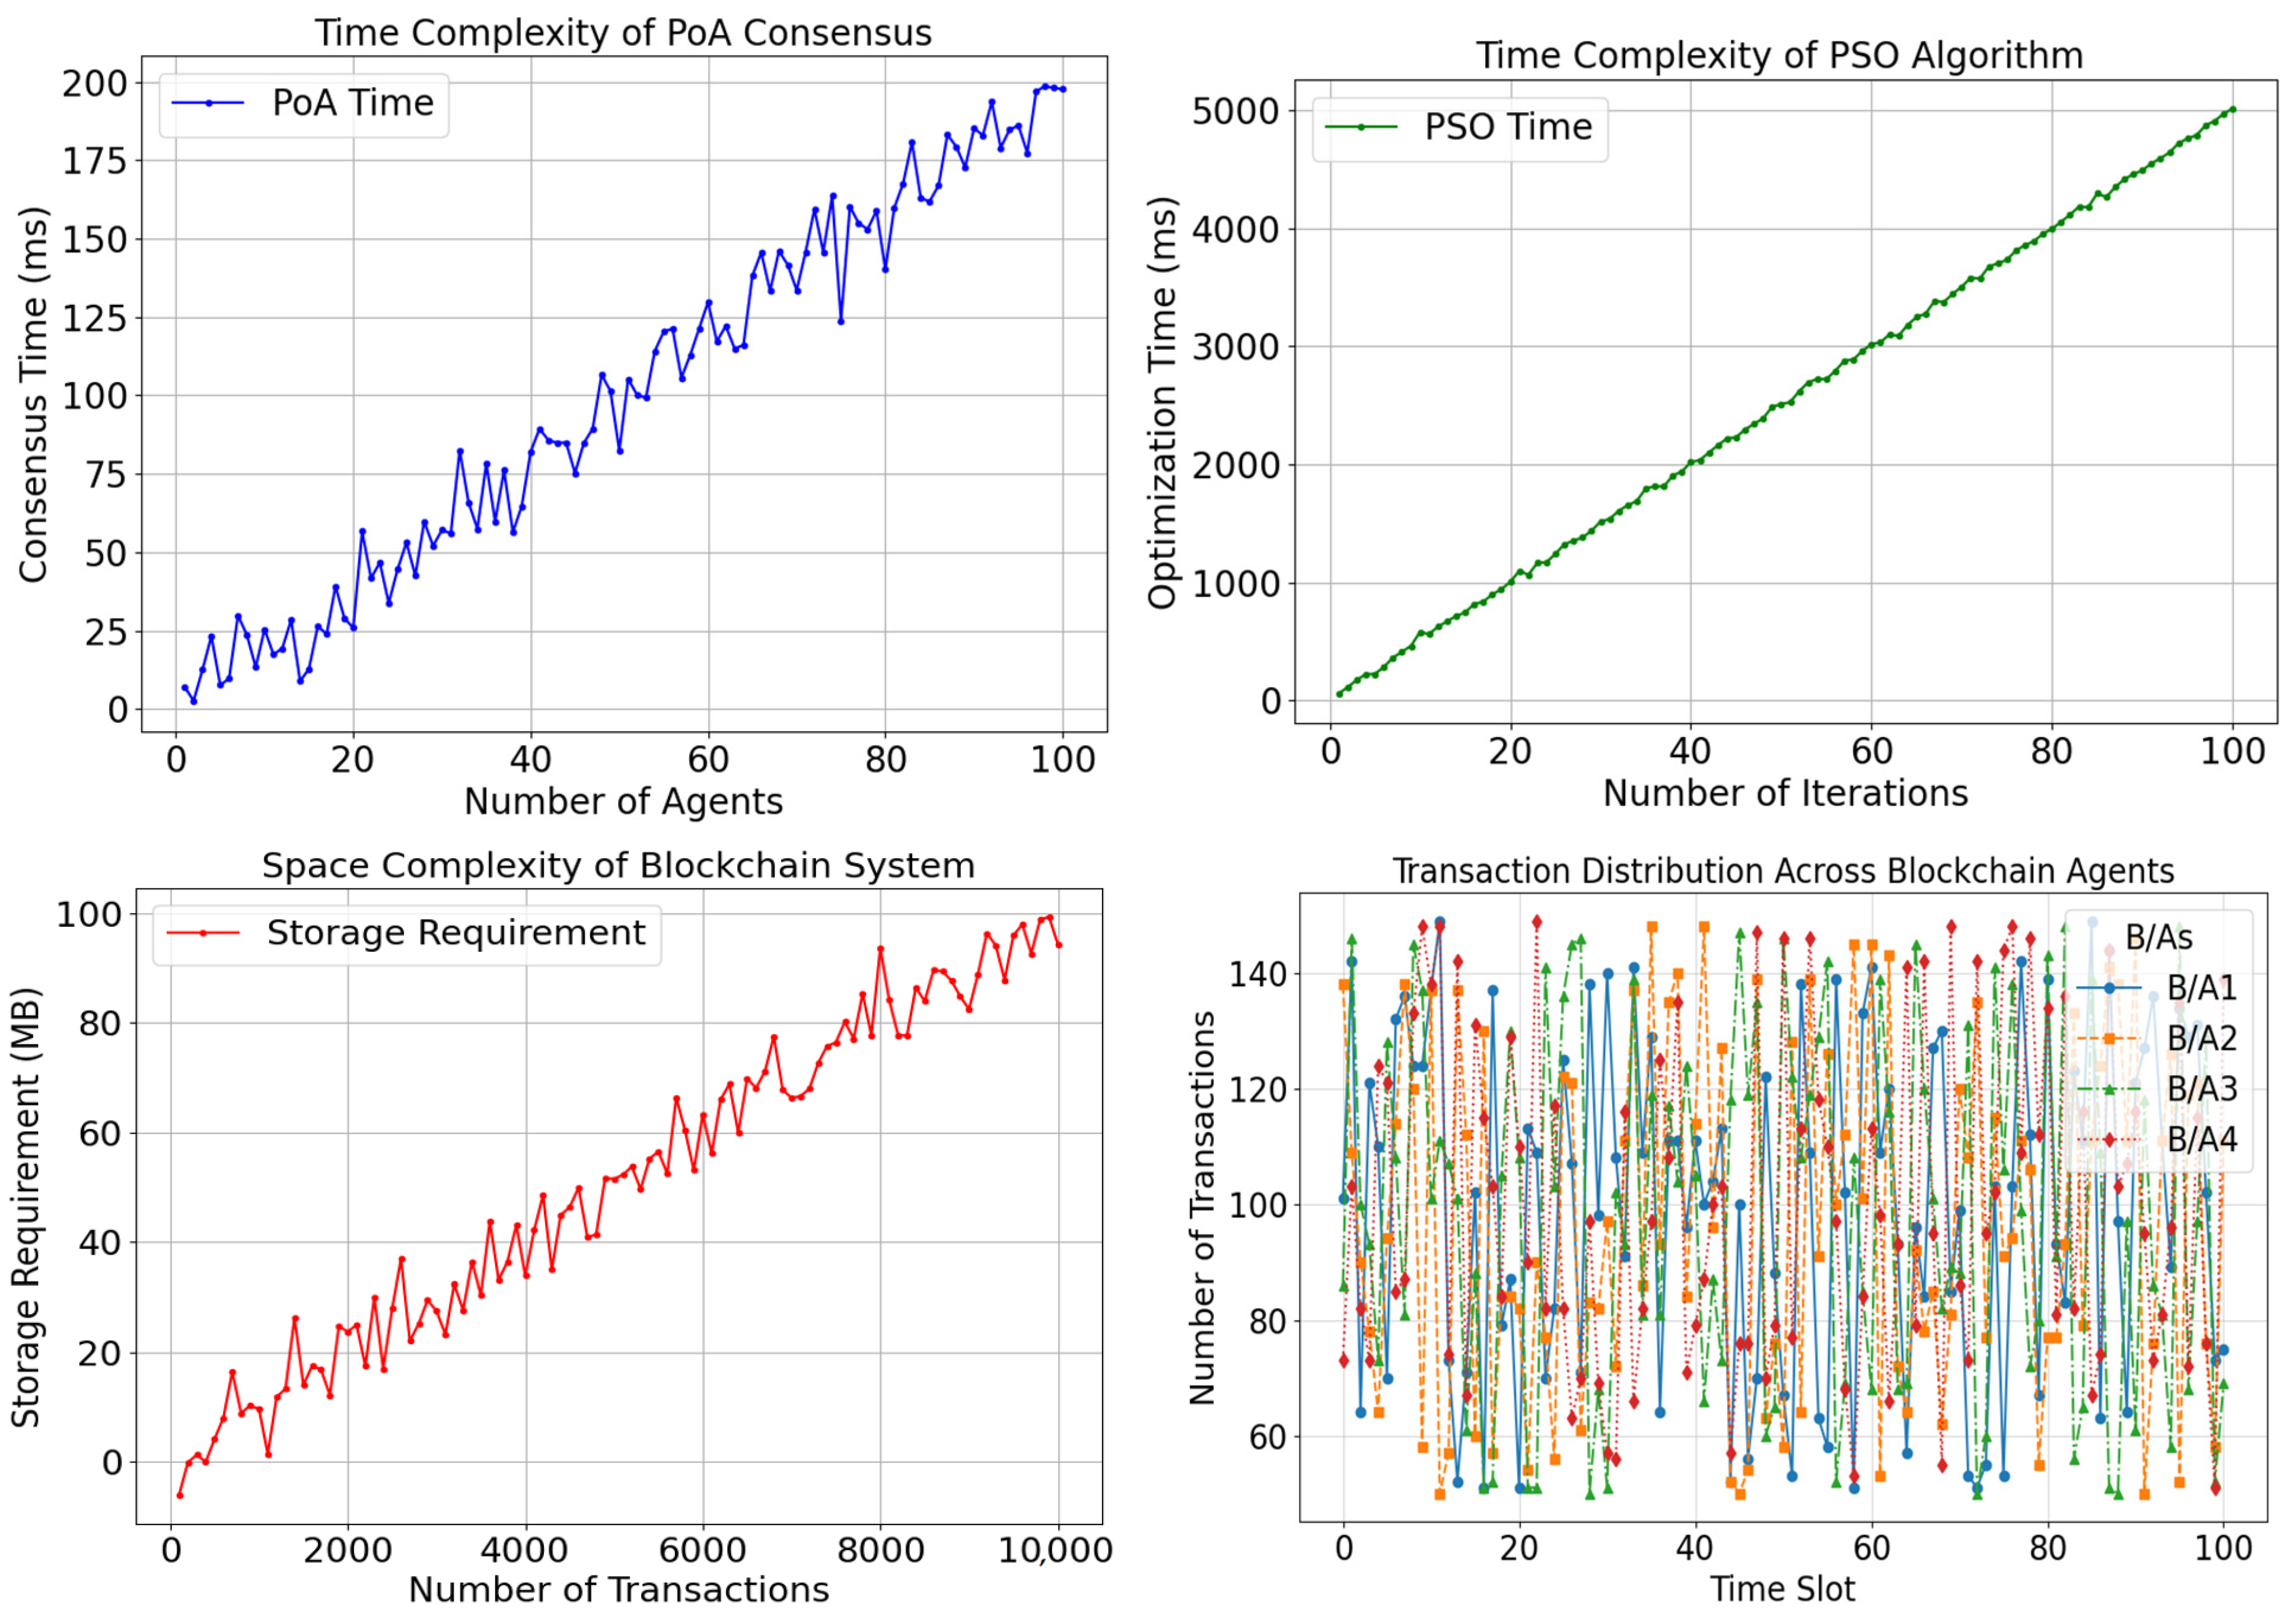
Figure 19 provides a detailed visual analysis of the computational complexity and transaction distribution in the proposed blockchain-enabled system:
Time complexity of PoA consensus: The graph illustrates the consensus time as a function of the number of B/As in the system. The results indicate a linear relationship with minor stochastic. This analysis demonstrates the scalability of the PoA consensus mechanism for large-scale systems;
Time complexity of PSO algorithm: The time required for the PSO algorithm to converge is plotted against the number of iterations. The linear growth highlights the algorithm’s predictable scaling behavior, making it suitable for real-time applications in dynamic energy systems;
Space complexity of blockchain system: The storage requirement (in MB) increases with the number of transactions processed, emphasizing the system’s scalability. Transaction aggregation techniques are suggested to mitigate excessive memory overhead.
Transaction distribution across agents: This graph demonstrates the distribution of transactions handled by four B/As over multiple time slots. The near-uniform distribution of workload across agents ensures balanced performance and prevents bottlenecks in the system.
7.3.10. PoA Scalability and Performance Analysis in the VP Blockchain-Based MAS
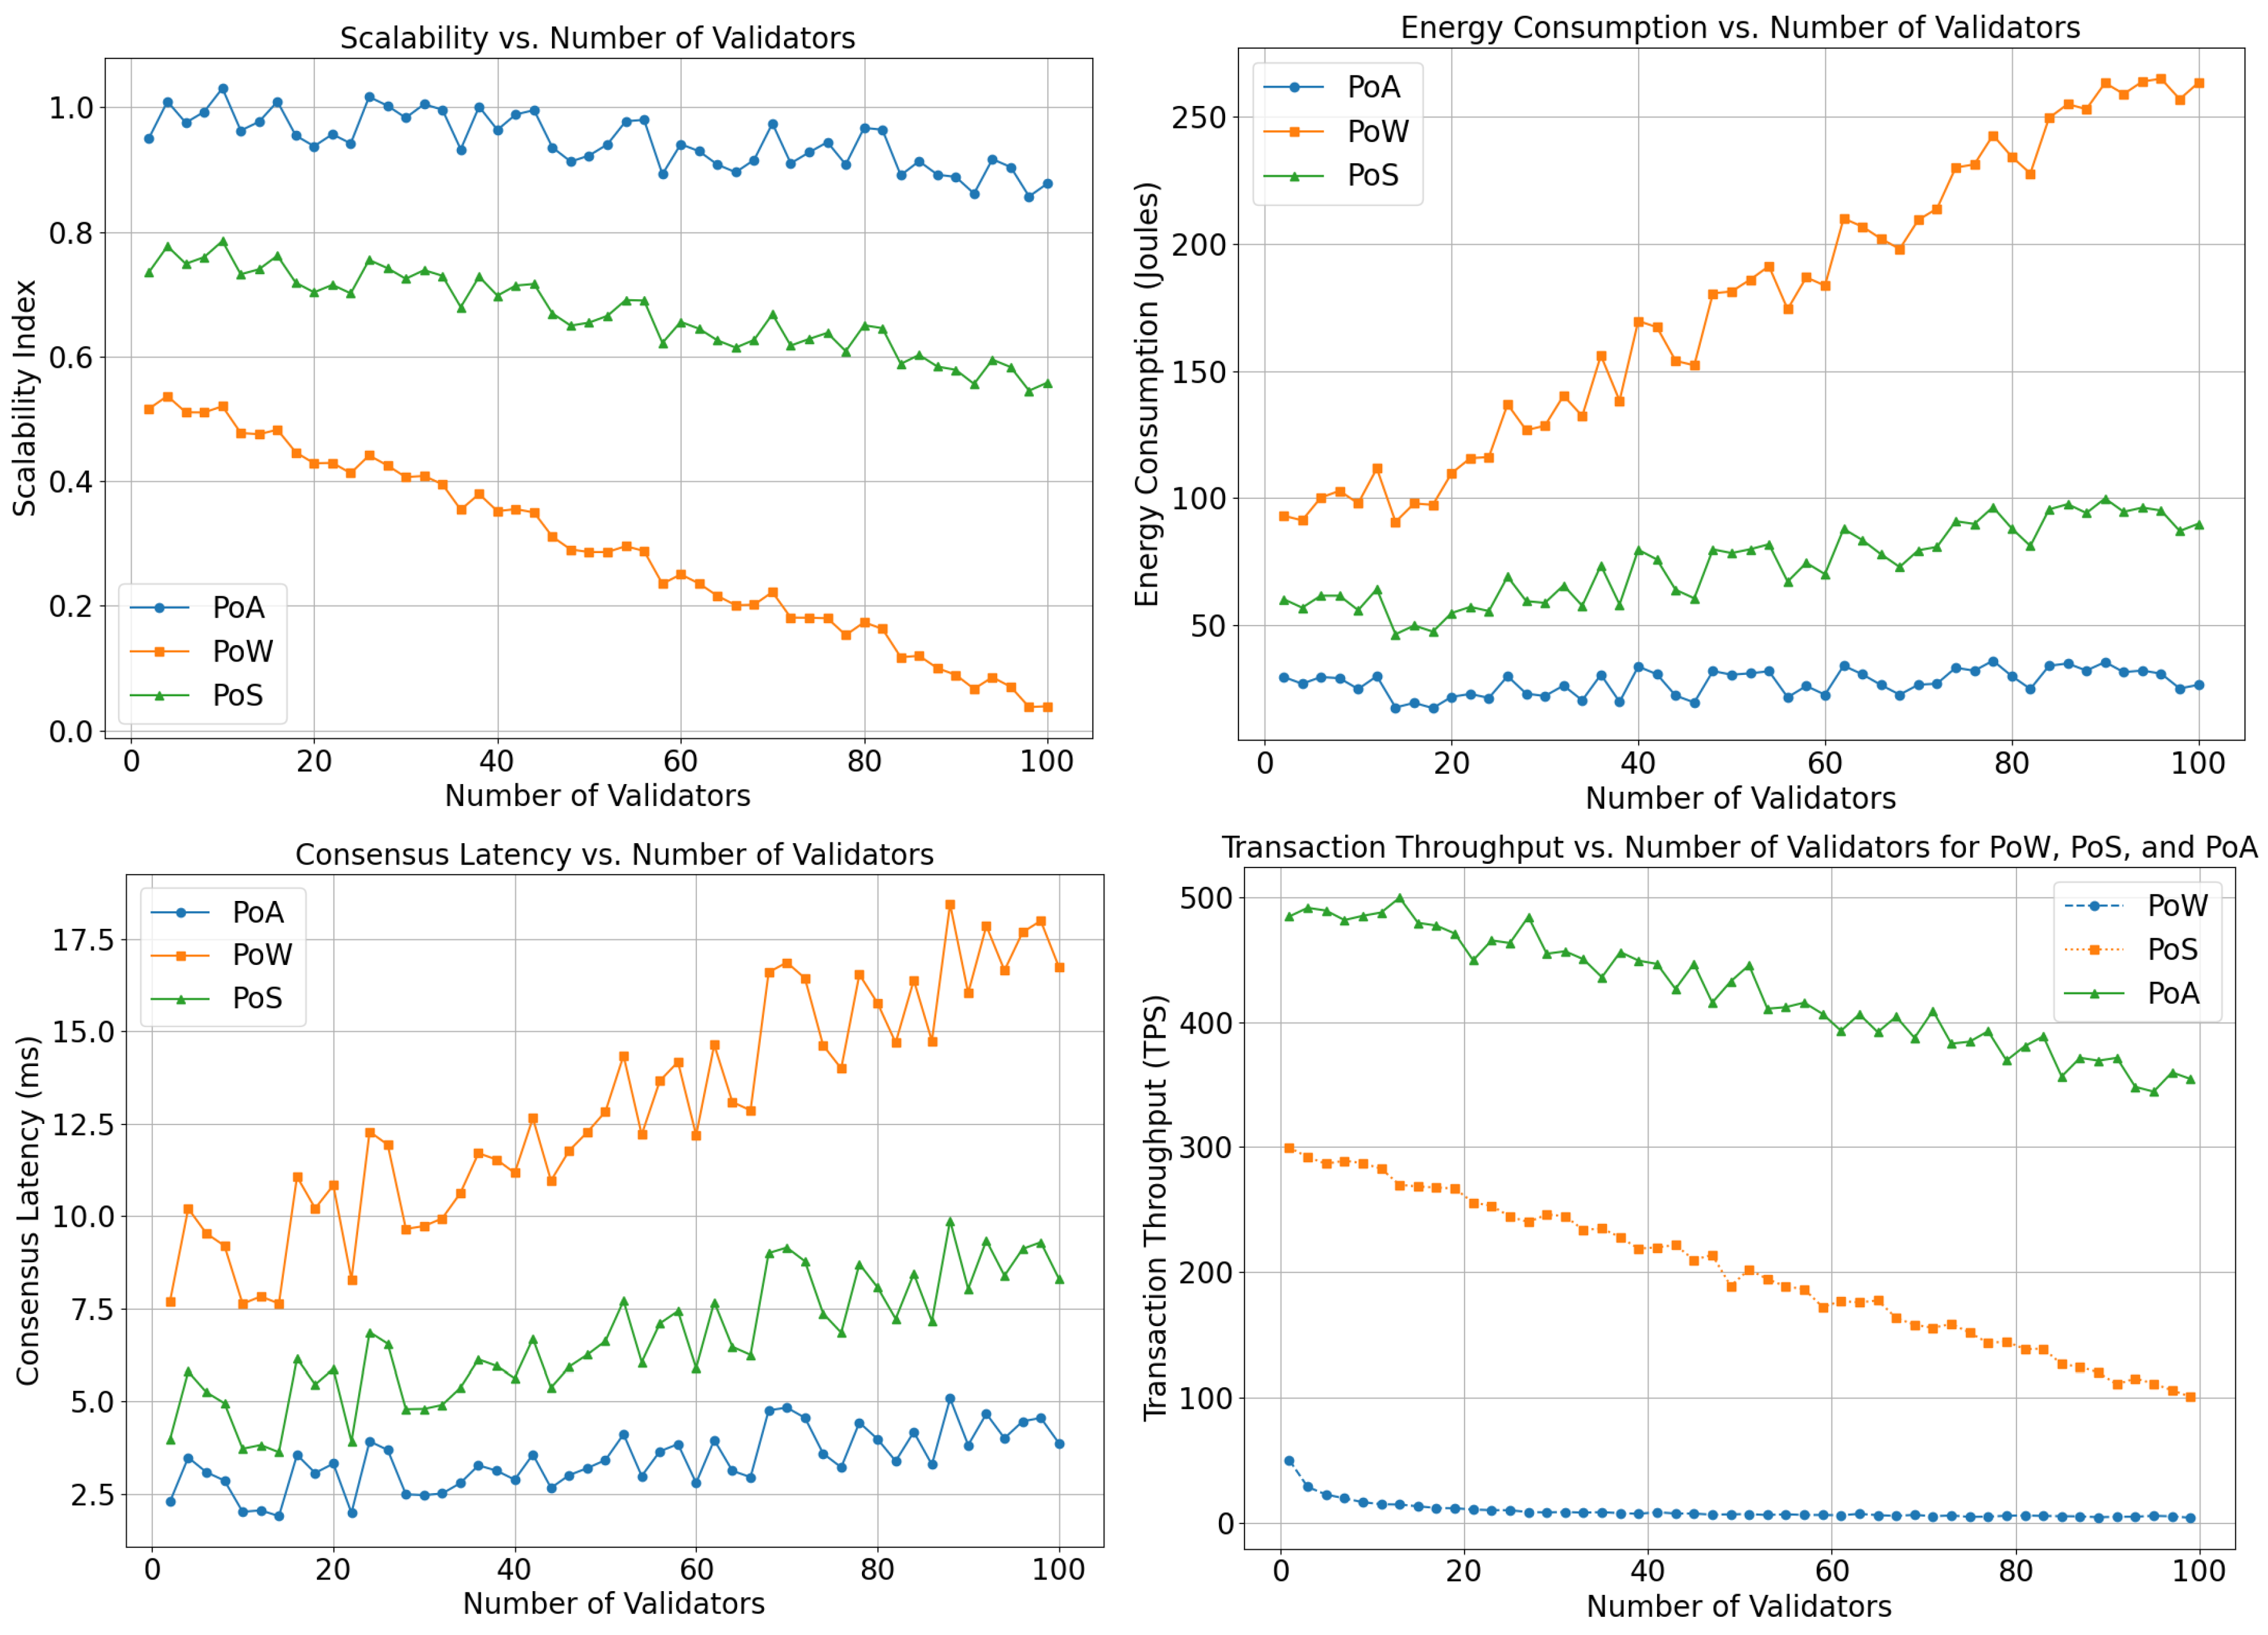
Figure 20 provides a comparative analysis of PoA, PoW, and PoS in the context of the VVP MAS. This evaluation focuses on key performance metrics: scalability, energy consumption, consensus latency, and transaction throughput, which are critical for real-time energy management in decentralized PEV networks and RES coordination.
Scalability vs. number of validators: The top-left graph demonstrates how the system scales with an increasing number of B/As acting as validators. PoA maintains a consistently high scalability index, as transactions are validated deterministically without requiring computationally intensive mining. This enables seamless transaction validation across geographically distributed PEV clusters. In contrast, PoW exhibits severe scalability degradation, as mining competition introduces bottlenecks, while PoS shows moderate scalability but suffers from increased synchronization overhead across multiple VP agents. For the VP MAS, maintaining a high scalability index is crucial, as the system must process thousands of PEV charging, discharging, and energy trading transactions per second without compromising response time.
Energy consumption vs. number of validators: The top-right graph highlights the energy consumption trends of each consensus mechanism. PoW experiences exponential growth in energy consumption due to intensive mining operations, making it impractical for large-scale PEV and RES coordination. PoS shows moderate energy efficiency but still requires computational resources for stake validation. Conversely, PoA remains highly energy-efficient, with minimal power consumption as it eliminates cryptographic mining. This characteristic ensures sustainable blockchain operations for real-time PEV scheduling, load balancing, and V2G transactions, where energy efficiency is paramount.
Consensus latency vs. number of validators: The bottom-left graph illustrates the consensus latency, which directly impacts real-time energy transactions in the VP MAS. PoA maintains a stable and low latency, as its deterministic validator selection prevents bottlenecks. This is critical for fast verification of energy trades and ensuring seamless charging coordination in large-scale PEV networks. In contrast, PoS experiences fluctuating delays, as stake-weighted validator selection adds unpredictability. PoW performs the worst, with increasing latency as validators grow, making it unsuitable for real-time decentralized energy trading. For the VP MAS, the low-latency consensus is essential to prevent transaction backlogs, minimize grid imbalances, and optimize dynamic energy distribution in prosumer networks.
Transaction throughput vs. number of validators: The bottom-right graph compares the number of transactions processed per second (TPS) across consensus mechanisms. PoA achieves the highest throughput, maintaining a stable rate above 400 TPS, which is essential for handling the high volume of PEV energy trades, real-time charging requests, and grid-balancing transactions. PoS throughput declines gradually as more validators participate in consensus, while PoW throughput drops significantly due to increased block validation times. This confirms that PoW is unsuitable for large-scale Virtual Prosumer energy markets, where high-speed transactions are required to match real-time energy supply and demand.
The analysis demonstrates that PoA effectively supports the scalability, energy efficiency, and performance requirements of the VP Blockchain-Based MAS. As the number of B/As increases, PoA ensures that energy transactions across geographically distributed PEV clusters remain efficient without introducing computational overhead. Unlike PoW, which demands high energy consumption, PoA significantly reduces blockchain energy overhead, making it a viable solution for decentralized energy networks driven by PEVs and RESs. Its deterministic consensus mechanism guarantees low-latency validation, enabling real-time synchronization between VP agents, EV agents, and the grid. Furthermore, PoA achieves high transaction throughput, preventing network congestion and ensuring seamless PEV energy exchanges and V2G interactions. These results confirm that PoA is the optimal consensus mechanism for the VP MAS, providing the necessary scalability, low latency, and high performance for real-time decentralized energy management.
7.3.11. Transaction Latency and Performance
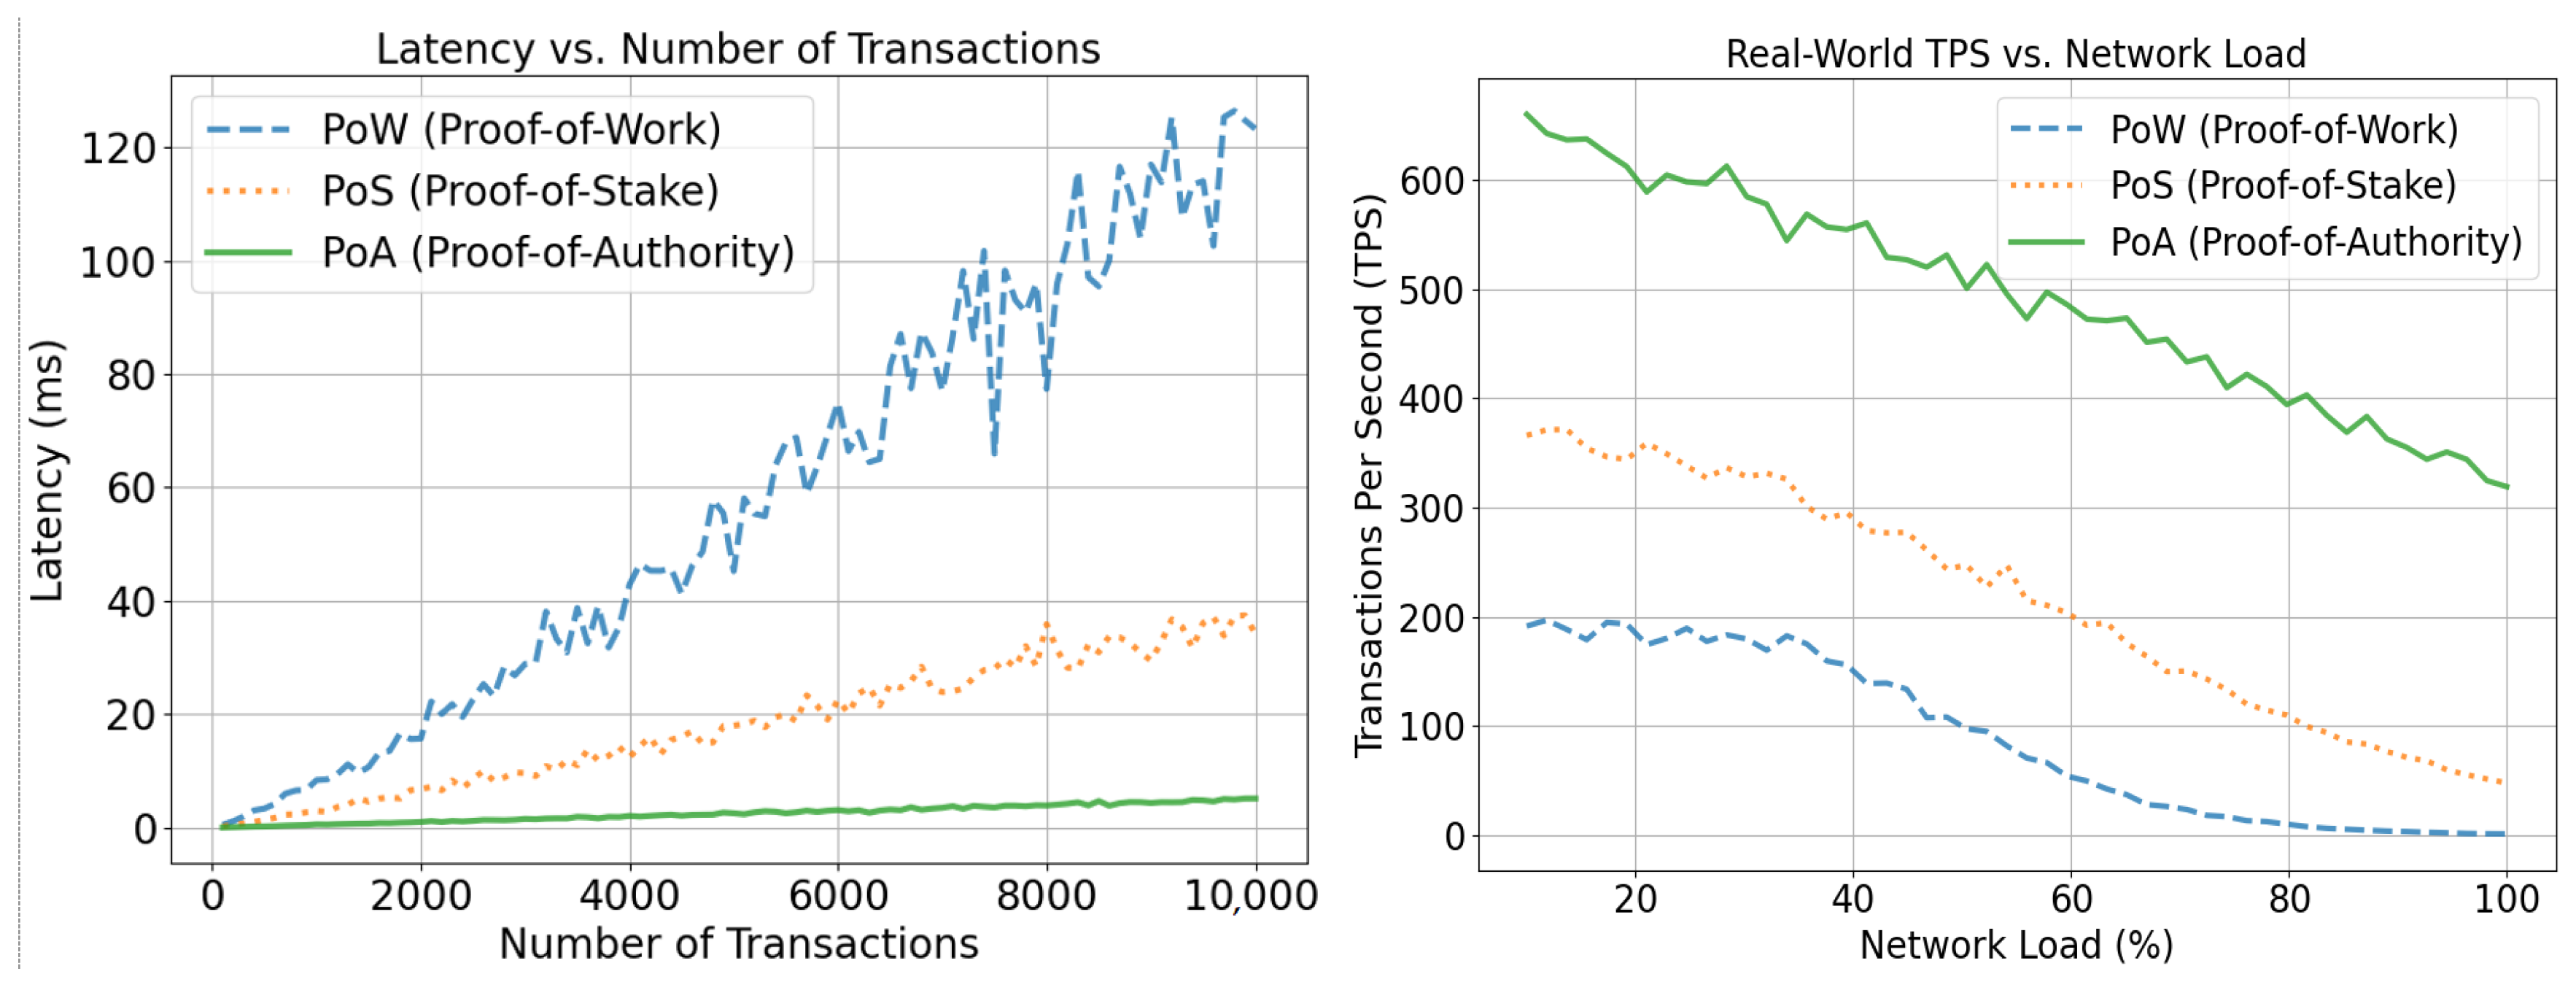
Figure 21 analyzes the impact of transaction load and network congestion on the performance of different blockchain consensus mechanisms (PoW, PoS, and PoA) in the proposed system.
The left graph (latency vs. number of transactions) illustrates how transaction latency scales as the number of transactions increases. The following points are evident:
- ▪
PoW (dashed blue line) exhibits the highest latency, increasing steeply as the transaction load rises. This is attributed to its computationally intensive mining process, which delays transaction validation;
- ▪
PoS (dotted orange line) reduces latency by eliminating the need for mining, but validator selection randomness still introduces some delay;
- ▪
PoA (solid green line) maintains consistently low latency across all transaction volumes, as validation is handled deterministically by a predefined set of trusted validators.
The right graph (Real-World TPS vs. Network Load) shows how transaction throughput (measured in Transactions Per Second, TPS) responds to increasing network congestion:
- ▪
PoW (dashed blue line) experiences a sharp decline in TPS as network load increases, highlighting its inefficiency under high transaction demands;
- ▪
PoS (dotted orange line) performs better than PoW but still degrades under network congestion;
- ▪
PoA (solid green line) demonstrates superior scalability, sustaining a significantly higher TPS even as the network load approaches 100%. This is due to its deterministic block validation, which eliminates mining overhead and reduces network congestion.
These results confirm that PoA is the most suitable consensus mechanism for real-time decentralized energy management in the Virtual Prosumer MAS, as it provides low-latency transaction validation, high throughput, and resilience to network congestion.
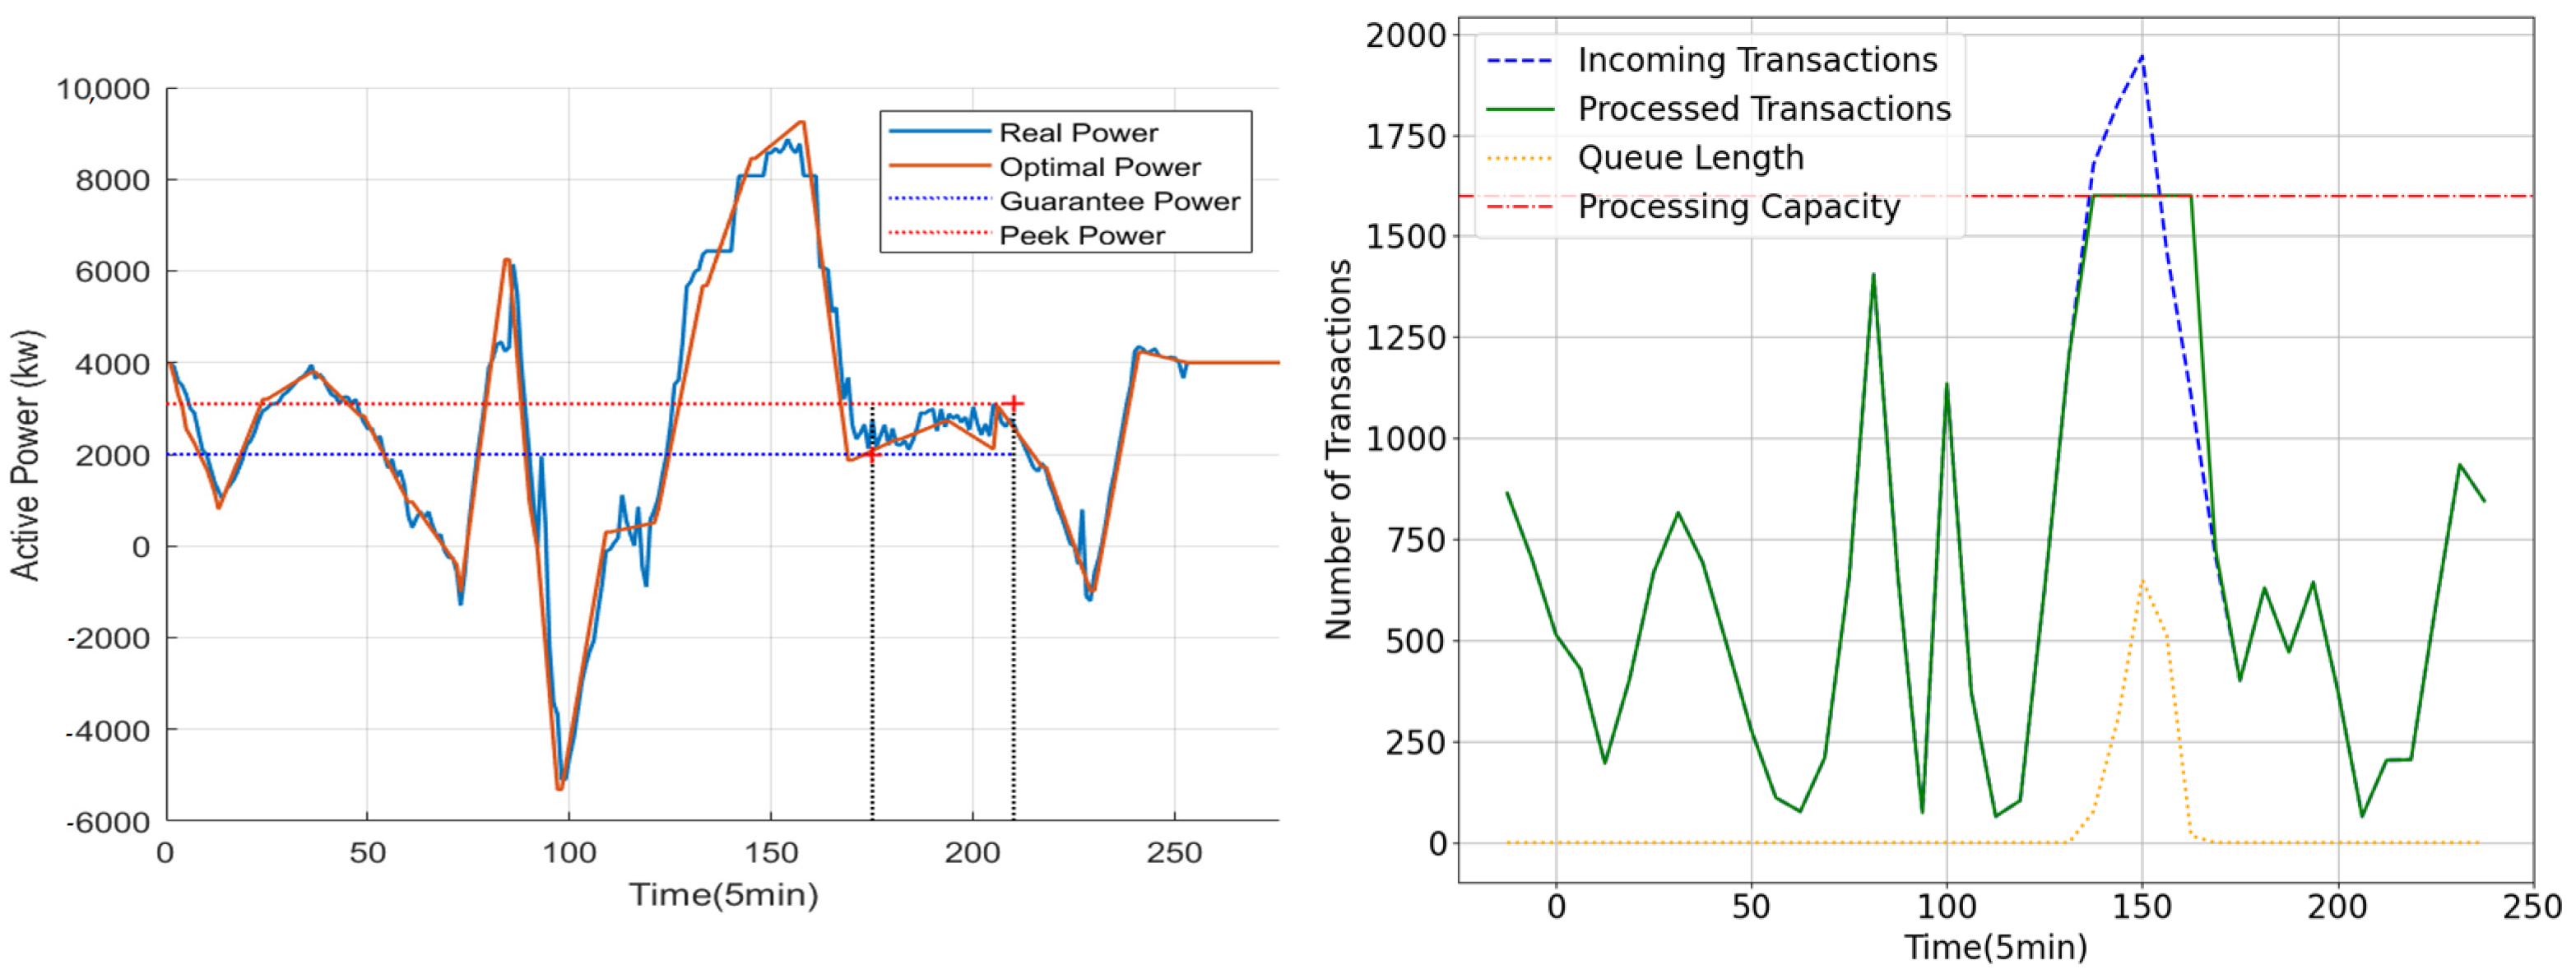
7.3.12. Active Power Management and Transaction Processing in the VP MAS Blockchain-Based System
Active power scheduling and real-time power management: The left side of
Figure 22 presents the scheduling and real-time management of active power within the Virtual Prosumer (VP) system. The scheduling process is divided into 276 time intervals, each lasting 5 min, covering 23 examined periods. The VP system considers Plug-in Electric Vehicles (PEVs), obligations, and operational constraints, ensuring optimal power scheduling, as detailed in the
Supplementary Materials—Supplementary Algorithms S1 and S2.
Key observations include the following:
- ▪
Guaranteed power (2000 kW) and peak power (3000 kW) constraints are enforced between 15:30 and 18:30 (time intervals 175–210);
- ▪
Real-time active power closely follows the optimal scheduling, demonstrating the VP system’s efficiency in maintaining grid stability;
- ▪
Active power injection (V2G) occurs during high electricity price periods, such as 7:30–9:00 A.M. and 18:30–19:00 P.M., while active power absorption takes place during lower price periods to optimize operational objectives.
Transaction processing and queue dynamics in the VP system: the right side of
Figure 16 illustrates the transaction processing behavior within the VP system, capturing the interplay between incoming transactions, processing capacity, queue length, and processed transactions from EV charging and discharging activities (negative active power).
Key observations include the following:
- ▪
Incoming transactions fluctuate significantly, influenced by EV activity, power scheduling, and network conditions;
- ▪
The system’s total processing capacity remains constant, as indicated by the horizontal reference line;
- ▪
Transaction queue length varies, highlighting periods of congestion where incoming transactions exceed processing capacity;
- ▪
Peak incoming transactions coincide with the peak power period (15:30–18:30), demonstrating the correlation between transaction surges and high energy demand.
This analysis highlights the effectiveness of the VP system in managing active power and transaction processing under high-load conditions, ensuring secure and efficient grid operations while maintaining real-time scheduling reliability.
7.3.13. Comparative Analysis of the Proposed VP MAS Blockchain-Based System
Evaluation Metrics
To assess the effectiveness of the proposed Blockchain-Integrated VP MAS Framework, the following key performance metrics were used:
- ▪
Charging cost reduction: evaluating economic benefits compared to conventional charging strategies;
- ▪
Real-time optimization efficiency: ensuring that the system meets strict real-time constraints;
- ▪
Scalability and adaptability: assessing performance under increasing transaction loads and diverse network topologies;
- ▪
Voltage deviations: measuring the impact of energy transactions on grid stability;
- ▪
Computational time: analyzing execution times for optimization, blockchain processing, and system coordination;
- ▪
Blockchain overhead: assessing additional delays introduced by PoA-based validation and transaction propagation.
Charging Cost Reduction
The proposed method achieves an 11% reduction in charging costs compared to non-blockchain-based scheduling. The integration of blockchain ensures secure and tamper-resistant energy transactions, which is particularly beneficial in decentralized energy trading environments.
Figure 7 illustrates the optimal scheduling of active power and real-time energy transactions under blockchain governance. The system dynamically adjusts power consumption based on contractual agreements, maintaining guaranteed power at 2000 kW and peak power at 3000 kW.
Real-Time Optimization Efficiency
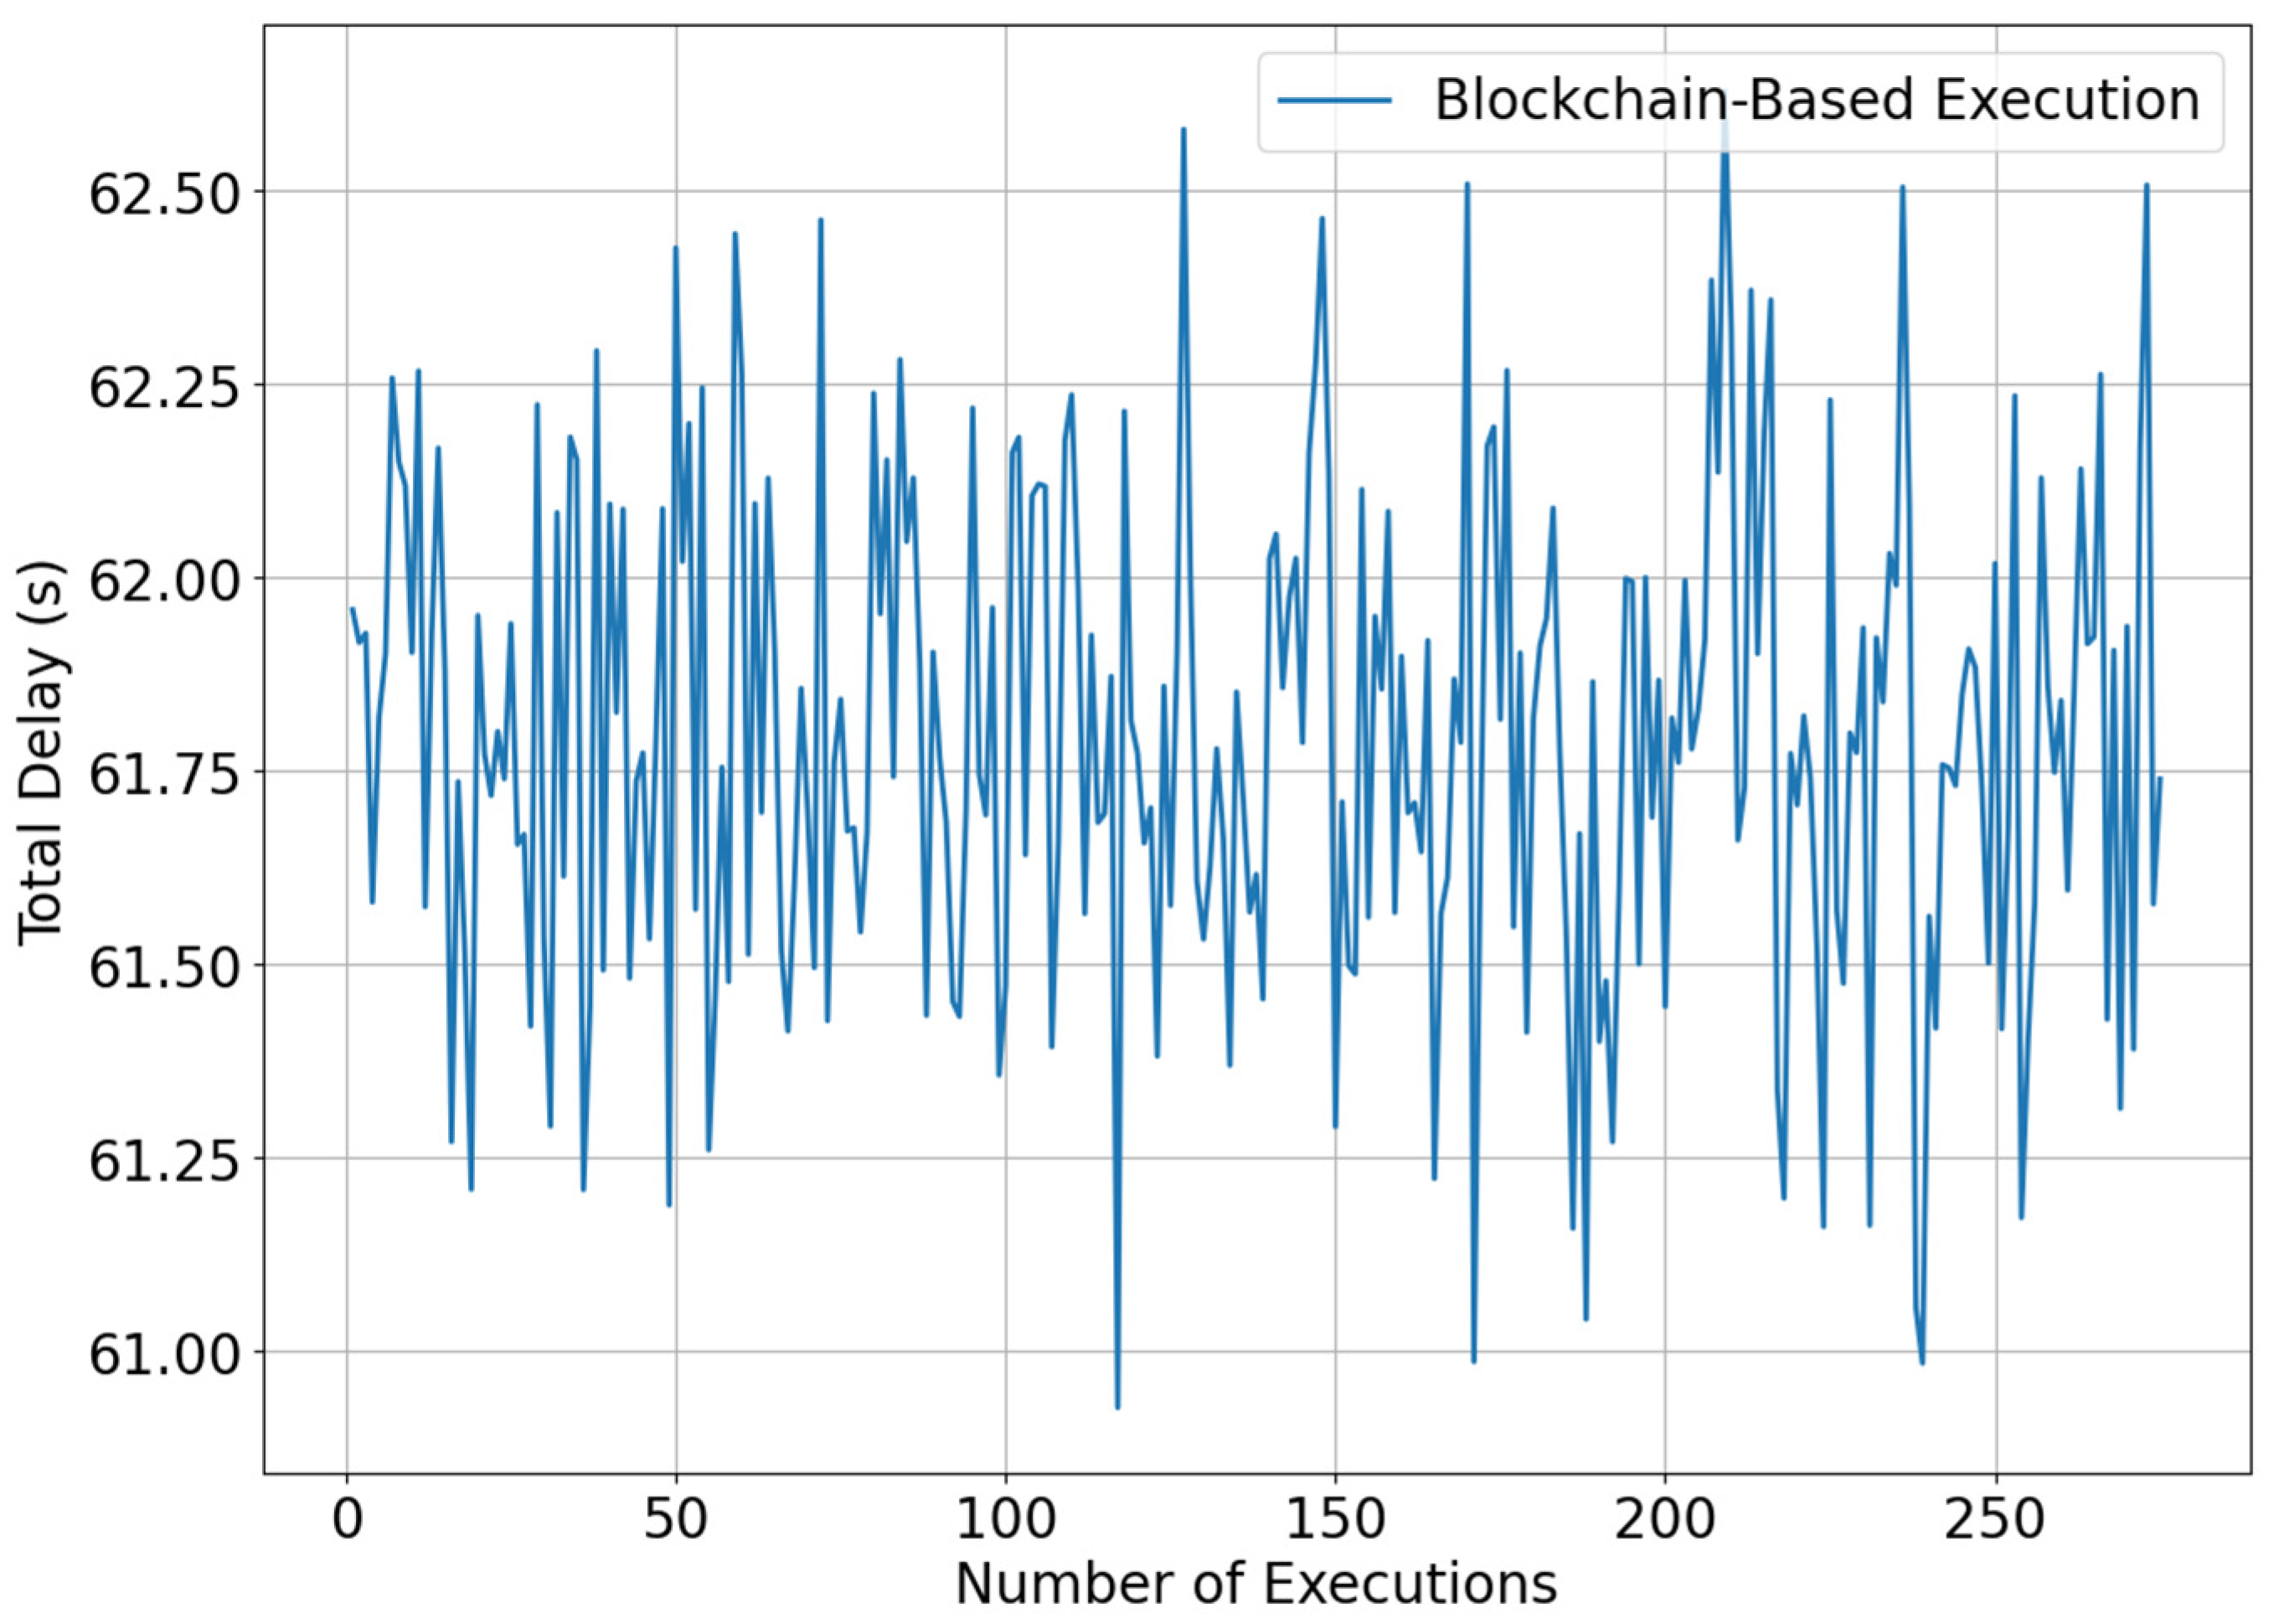
The total execution time, including optimization, blockchain validation, and consensus, remains well within the required 5 min update window for real-time decision-making.
Blockchain-based execution:
- ▪
Total delay: in total, 61.4–63.1 s, including transaction validation, PoA consensus, and agent communications.
- ▪
Optimization time: in total, 51s for PSO, while GAMS finds the solution in a range of 3.1–6.1s.
Non-blockchain execution:
- ▪
Total delay: 59.8–60.7 s, lacking blockchain validation but without security guarantees.
Scalability and Adaptability
The PoA Consensus Mechanism ensures high transaction throughput even under large-scale energy trading conditions.
- ▪
Up to 10,000 transactions processed per 5 min interval with low-latency validation;
- ▪
Hierarchical MAS structure offloads transaction processing to local CEV/As, reducing congestion at the VP/A level;
- ▪
PoA-based validation ensures deterministic execution times, maintaining stable operation as the network scales.
Voltage Deviations and Grid Stability
The proposed system minimizes voltage deviations across geographically distributed power grids by optimizing transaction-based energy flows.
- ▪
Smart Contracts enable automated energy reallocation to prevent grid overload;
- ▪
Real-Time Blockchain Coordination allows CEV/As to dynamically adjust charging based on local voltage conditions;
- ▪
Figure 10 and
Figure 11 confirm that the blockchain-based framework maintains voltage levels within 0.95–1.05 p.u., even during peak demand periods.
Comparative Analysis of Blockchain-Based VP MAS Vs. Existing Methods
To quantify the benefits of the proposed system,
Table 4 compares its performance against existing decentralized energy management solutions.
The blockchain-integrated solution outperforms existing methods in real-time scalability, security, and economic optimization, making it a superior alternative for decentralized energy management.
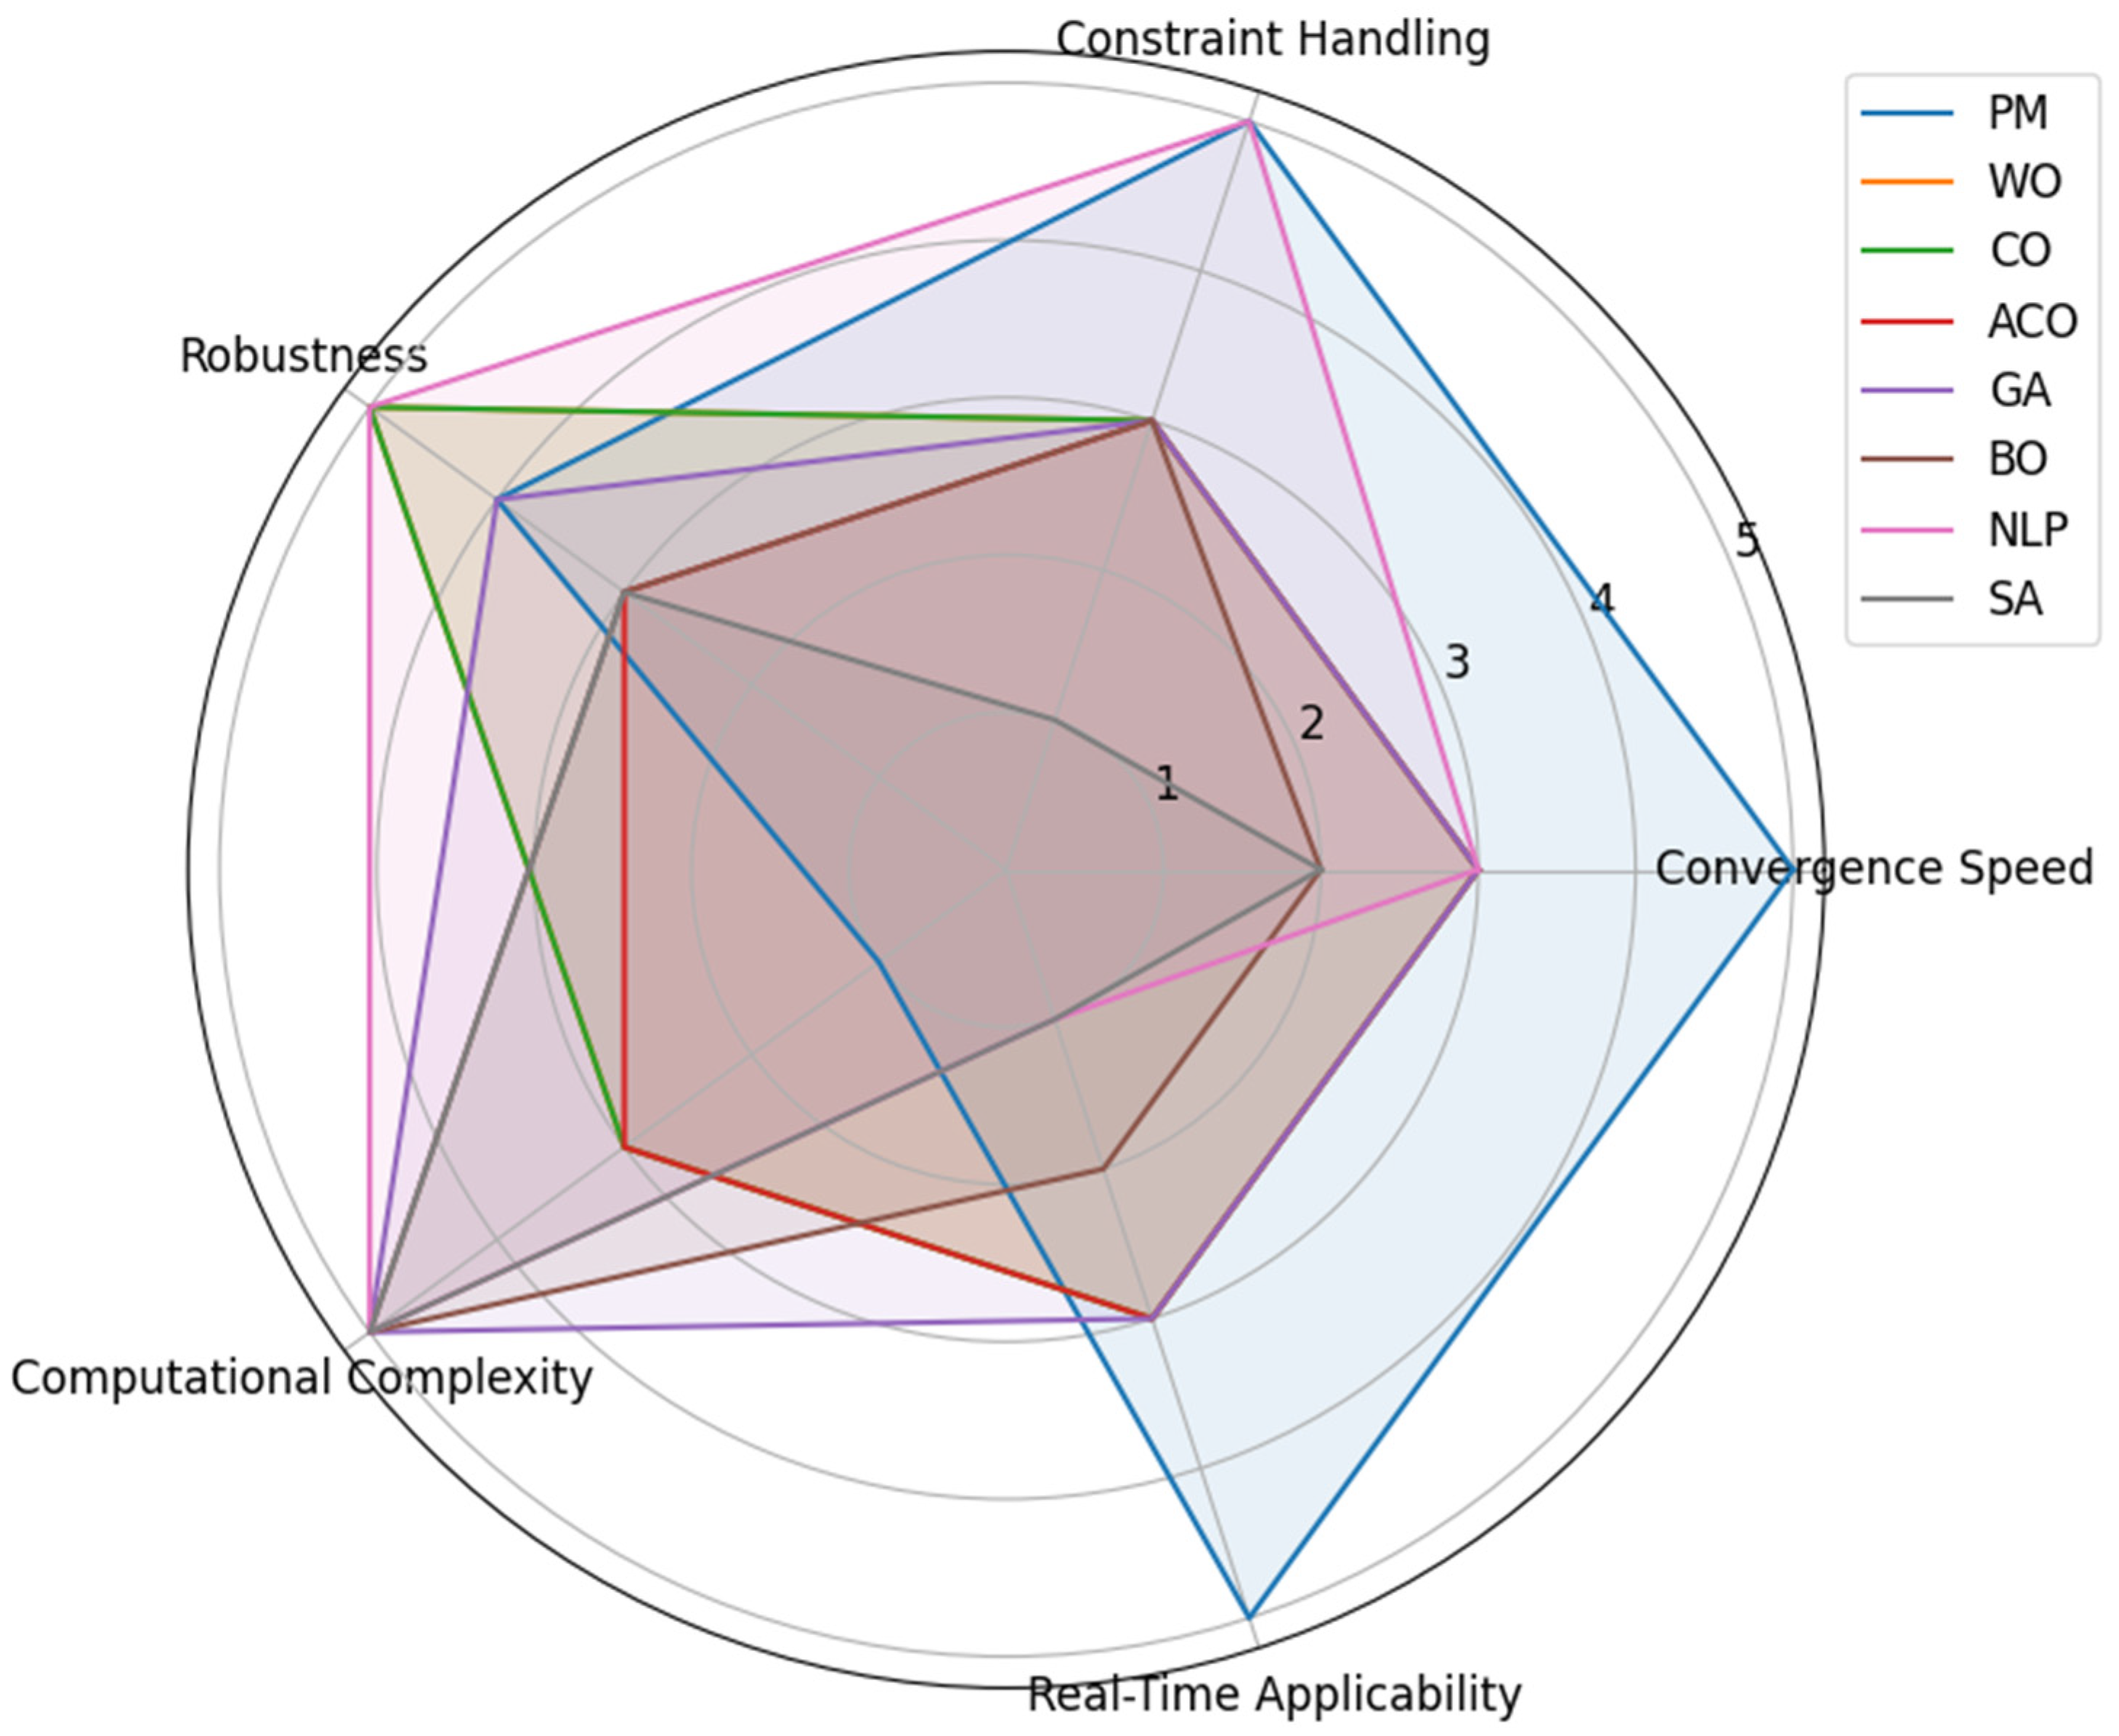
Comparative Analysis of Optimization Methods
A comparison of various optimization techniques is presented in
Table 5, highlighting their effectiveness in decentralized power systems.
Figure 23 and
Table 5, provide a comprehensive evaluation of various optimization algorithms, including PM (proposed method), Whale Optimization (WO), Cuckoo Optimization (CO), Ant Colony Optimization (ACO), Genetic Algorithm (GA), Bayesian Optimization (BO), nonlinear programming (NLP), and Simulated Annealing (SA). The chart compares these algorithms based on multiple performance metrics:
- ▪
Convergence speed: how quickly the algorithm converges to a solution;
- ▪
Constraint handling: The algorithm’s ability to handle and satisfy constraints during optimization;
- ▪
Robustness: The consistency of the algorithm’s performance under varying conditions;
- ▪
Computational complexity: The amount of computational resources required by the algorithm;
- ▪
Real-time applicability: The suitability of the algorithm for real-time applications.
In the radar chart, the numbers 1 to 5 represent a relative performance scale for each metric, where 1 indicates the lowest performance and 5 represents the highest. A higher score means better performance in that specific criterion, while a lower score indicates a weakness. From the chart, PM performs excellently in terms of real-time applicability, making it a preferred choice in time-critical applications, despite its lower robustness compared to some other methods. NLP and SA are computationally expensive but excel in handling constraints and robustness, making them suitable for complex problems with strict constraints. On the other hand, WO, CO, and ACO offer balanced performance across all metrics but fall behind in convergence speed and computational complexity compared to PM.


