Article

Cold-Start Energy Consumption and CO2 Emissions—A Comparative Assessment of Various Powertrains in the Context of Short-Distance Trips

Faculty of Mechanical Engineering and Aeronautics, Rzeszow University of Technology, 12 Powstancow Warszawy Str., 35-959 Rzeszow, Poland
*
Author to whom correspondence should be addressed.
Energies 2025, 18(23), 6114; https://doi.org/10.3390/en18236114 (registering DOI)
Submission received: 10 October 2025 / Revised: 6 November 2025 / Accepted: 19 November 2025 / Published: 22 November 2025
(This article belongs to the Special Issue Performance and Emissions of Vehicles and Internal Combustion Engines)

Abstract

The issue of CO2 emissions and energy use is particularly important during short trips, where cold starts cause higher fuel consumption and increased emissions. These conditions, common in daily commuting, make vehicle efficiency a key concern. To reduce their impact, hybrid and electric powertrains have been introduced, allowing electric-only operation that eliminates direct tailpipe emissions, although indirect emissions from electricity generation remain. Real-world data show that hybrid vehicles often consume more fuel and emit more CO2 than type-approval results indicate, mainly due to the medium battery state of charge (SOC), which forces the combustion engine to operate even over short distances. Additionally, engine thermal state and ambient temperature strongly influence energy use and emissions. This study fills a research gap by comparing vehicles with different powertrains under controlled chassis dynamometer conditions, analyzing fuel (energy) consumption and CO2 emissions over the same driving cycle at various temperatures. The results show how temperature and thermal conditions affect total energy use and emissions over time and distance. The highest consumption and emissions during short trips were recorded for the plug-in hybrid vehicle in charge-sustaining mode at −6 ± 1 °C, while the electric vehicle showed the most favorable performance.

1. Introduction

Climate neutrality has become one of the key objectives of global efforts toward sustainable development, particularly in high greenhouse gas (GHG) emission sectors such as transportation [1,2,3]. Hybrid vehicles (HVs) and electric vehicles (EVs) are often regarded as effective solutions for reducing emissions in transportation; however, their actual environmental impact requires comprehensive analysis. One of the most effective tools for evaluating this impact is Life Cycle Assessment (LCA), which considers all stages—from raw material extraction and battery production to use and recycling [4,5]. An important aspect of this assessment involves indirect GHG emissions associated with electricity generation for battery charging.
The diversity of the energy mix across different regions of the world makes it essential to account for local conditions when evaluating the environmental impact of electric vehicles (EVs) [6,7]. In European countries, the average CO2-equivalent (CO2eq) emissions vary significantly (Figure 1). Exceptionally low CO2eq values are observed in Iceland (0.14 g CO2eq/kWh) [8], whereas the highest emissions from electricity generation in 2021 were recorded in Poland (0.776 g CO2eq/kWh), Cyprus (0.66 g CO2eq/kWh), and the Czech Republic (0.544 g CO2eq/kWh). Although EVs do not emit greenhouse gases during operation, the emission intensity associated with electricity production is crucial to their overall environmental balance. Consequently, transforming the energy mix—particularly by increasing the share of renewable energy sources—is a key step toward achieving climate neutrality in the electric vehicle sector.
The European Union (EU) has implemented regulations on CO2 emissions from passenger cars and light commercial vehicles to reduce the transport sector’s contribution to climate change. According to [8], passenger cars account for approximately 16% of total CO2 emissions in the EU. Under these regulations, vehicle manufacturers must comply with average CO2 emission targets for new passenger cars sold within the EU (Figure 2), with specific allowances depending on vehicle category [9,10]. The reduction targets aim to achieve zero CO2 emissions by 2035. Consequently, manufacturers are required to adapt their fleets to meet these goals, driving investment in electric vehicles (EVs) and emission-reducing technologies. For EVs, emission levels are determined based on electricity consumption, including indirect emissions associated with energy production. Therefore, EVs cannot be considered truly zero-emission unless the electricity used for charging originates entirely from renewable energy sources.
Currently, numerous research studies and analyses are being conducted on issues related to indirect GHG emissions in the context of electric vehicle (EV) operation, including Life Cycle Assessment (LCA) studies [11,12,13]. These findings aim, among other goals, to support policymakers and stakeholders in developing strategies to minimize indirect emissions and promote sustainable mobility. Research on the indirect emissions of EVs has also produced detailed measurement reports [14,15,16], highlighting the importance of an integrated approach to emission reduction that combines technological advancements with energy transition efforts.
Although the environmental impact of EVs has been extensively studied, many of these studies primarily focus on outlining general strategies for mitigating the negative environmental effects of EVs, as highlighted in [11,17,18,19,20].
For instance, in [11], an analysis of the carbon footprint associated with electromobility in selected countries was conducted using real data on national energy mixes. The study directly addressed the issue of indirect GHG emissions and demonstrated how differences in energy sources influence CO2 emissions generated during EV charging. Overall, the authors showed that countries with a higher share of renewable energy sources achieve lower indirect emissions, underscoring the importance of energy transition for the sustainable development of electromobility.
In [17], the authors analyzed the impact of EVs on CO2 emissions in European energy systems, considering emission factors associated with electricity generation. The study aimed to assess how regional variations in energy mixes influence the potential of EVs to contribute to climate neutrality. The authors concluded that transitioning to renewable energy sources within energy systems is a crucial prerequisite for maximizing the environmental benefits of electromobility.
Some studies on this topic include extended analyses based on LCA. An example of such research is presented in [20], where the authors developed a new LCA framework to evaluate the environmental impact of EVs and internal combustion engine vehicles (ICEVs). The framework was applied to four scenarios reflecting different countries in which various stages of the vehicles’ life cycle occur. The results showed that EVs generate lower CO2 emissions over their entire life cycle compared to ICEVs in all analyzed cases. The analysis also emphasized the crucial influence of the energy mix, as well as the location of production and use, on overall CO2 emissions.
Some studies focus on more specific aspects related to adapting research methods to improve the accuracy of environmental impact assessments for electric vehicles (EVs) [18,21,22]. In many studies, CO2 emissions and energy consumption are compared across different driving cycles [23,24].
In Poland, similar issues were discussed in [24], where CO2 emissions during the operational phase of electric vehicles were investigated. The study showed that an increase in the efficiency of electricity generation in combined heat and power plants—the main source of electricity in Poland—from 38% to 46% leads to a reduction in electric vehicle emissions by more than 17%.
Guo et al. [25] observed that existing driving cycles often lack representativeness and exhibit excessive randomness due to inadequate consideration of individual driving styles. To address this issue, they proposed methods for evaluating driving cycles for EVs based on energy consumption and emission analyses, with the goal of improving the representativeness of the generated cycles. The approach incorporated techniques such as a double Markov chain and a suitably configured neural network, developed using real-world road data. Overall, the study emphasized the importance of introducing rational constraints in the design process of driving cycles.
In [23], the authors compared the emissions of an EV and a diesel-powered vehicle equipped with a diesel engine. The simulation studies were carried out using a modified Indian driving cycle. This approach enabled the estimation of energy consumption for both vehicle types, demonstrating a clear advantage of the battery-electric vehicle (BEV) in terms of energy efficiency. However, the authors also noted the considerably shorter driving range of the electric vehicle compared to the conventionally powered one.
Similar results were obtained in the studies presented in [26], which aimed to assess the CO2 emissions of vehicles equipped with conventional, hybrid, and electric powertrains. Emission modeling was carried out based on measurements of diesel engine operating parameters on an engine dynamometer, while for vehicles with electric and hybrid powertrains, manufacturer data were used. The studies demonstrated that electric vehicles are the most efficient in urban operating conditions and confirmed that new-generation diesel engines emit significantly less CO2 than older-generation engines.
It is also noteworthy that many recent studies focus on well-to-wheel and tank-to-wheel analyses, emphasizing the importance of adopting a more comprehensive approach to evaluating the environmental impacts of EVs [27,28,29]. Such analyses are particularly important when comparing the emissions of internal combustion engine vehicles with those of alternative powertrains [30,31].
Most of the existing studies addressing the emissions of electric vehicles focus on comparative analyses of emission levels from vehicles equipped with different powertrains, conducted using estimative approaches [32]. These analyses are generally based on average fuel and electricity consumption indicators provided by vehicle manufacturers [33]. In some studies, estimations are supported by on-road test results, which make it possible to determine average emission values—typically CO2 emissions—per kilometer traveled [34]. It should be noted that the energy consumption of electric and hybrid vehicles also depends on the driving cycle and driving resistance [35].
The authors of the present study propose to complement the existing research by conducting analyses based on instantaneous measurements of vehicle energy consumption during short-distance operation, including cold-start conditions. Studies presented in [36] showed that, for example, the average trip distance by car in Germany on weekdays (Monday through Friday) is approximately 14 km, while the average daily distance is about 50 km. In the United Kingdom, the average daily distance is around 40 km [36]. Numerous studies have analyzed the influence of temperature on emissions and fuel consumption, focusing primarily on vehicles with internal combustion engines during laboratory tests [37,38], as well as under real driving conditions [39,40]. The results of these studies confirm an increase in fuel consumption and exhaust pollutant emissions, particularly under cold-start conditions, even at temperatures around 25 °C [39]. During cold starts and the engine warm-up phase, vehicles powered by internal combustion engines emit the dominant share of toxic compounds. This typically occurs during urban driving, where emissions during the first five minutes after a cold start can account for more than 10% of the total carbon monoxide, carbon dioxide, and nitrogen oxide emissions over the RDE cycle for Euro 6 spark-ignition vehicles [39]. Under lower ambient temperatures of around 8 °C, the shares of some pollutants may exceed 20% [40]. In contrast, research on electric and hybrid vehicles has mainly addressed energy consumption and driving range under specific driving cycles [41,42,43,44] and varying temperature conditions [45,46,47]. For electric vehicles, low ambient temperature causes a significant increase in energy consumption and a reduction in driving range [48,49]. This is due, among other factors, to the influence of temperature on the amount of usable battery energy [50], as well as the energy consumed by the vehicle’s heating and cooling systems [51,52,53].
The authors’ investigations revealed that the comparison of energy consumption and CO2 emissions among vehicles with different powertrains—considering short-distance trips and cold-start conditions—represents a research gap. Therefore, the novelty of this article lies in the comparative assessment of energy consumption and CO2 emissions from vehicles with various powertrains, taking into account the engine’s thermal state and travel distance.

2. Materials and Methods

The analysis was based on the test results of passenger cars with similar technical specifications (C-class cars of comparable mass). From the results available in the Agronne National Laboratory database, car models from the 2013 model year were selected, with their basic specifications presented in Table 1 [54]. Laboratory tests of these vehicles were conducted in 2014–2015. The table also includes the test conditions, the coefficients of the road load functions simulated on the chassis dynamometer, and the test masses of the examined vehicles. This data is from the Downloadable Dynamometer Database and was generated at the Advanced Mobility Technology Laboratory (AMTL) at Argonne National Laboratory, under the funding and guidance of the U.S. Department of Energy (DOE) [54]. The tests were performed on a chassis dynamometer using the Urban Dynamometer Driving Schedule (UDDS), which is part of the U.S. Federal Test Procedure (FTP-75) [55].
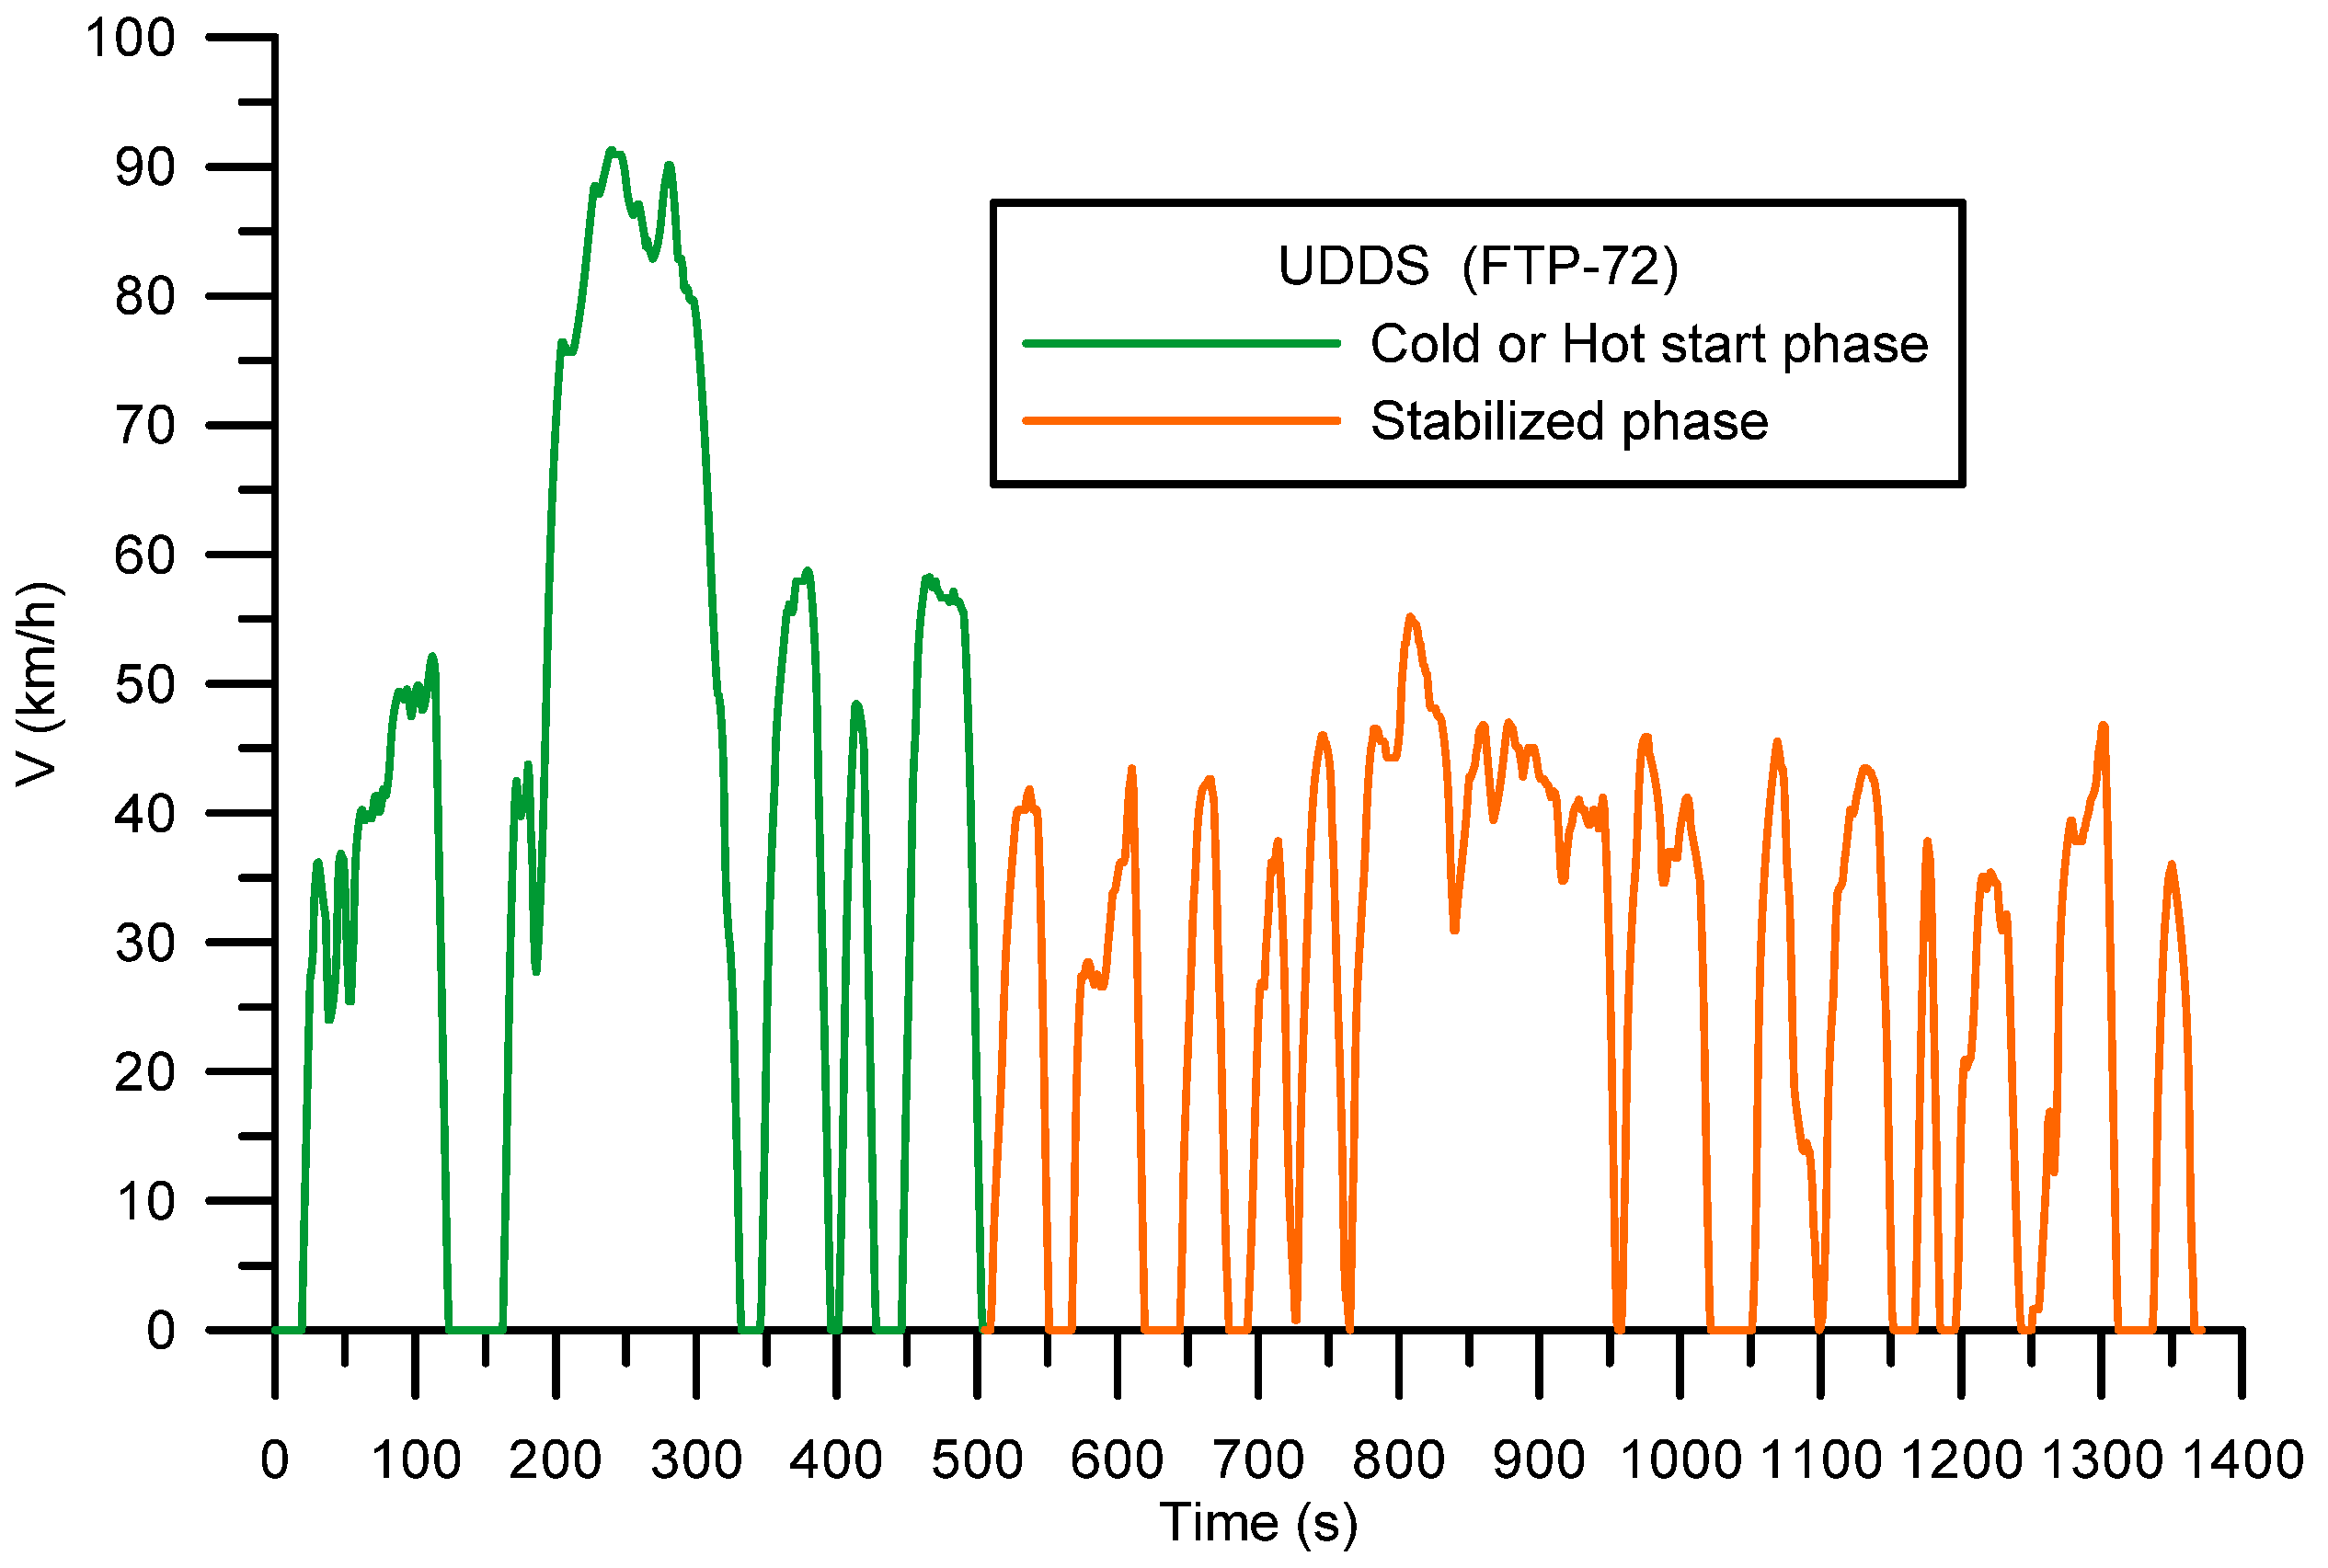
The choice of the test cycle was based on the available cycles defined by the EPA standard. Among the commonly used U.S. driving cycles, only the UDDS cycle accounts for a “cold start.” Additionally, the UDDS cycle was selected due to its representation of urban driving conditions, which involve shorter distances, aligning with the main focus of the study. The speed profile of this cycle is shown in Figure 3. The UDDS represents city-driving conditions and consists of two phases. The first phase starts with a cold start, lasting 505 s, covering a distance of 5.78 km with an average speed of 41.2 km/h. The second phase, referred to as the stabilized phase, lasts 867 s, with a distance of 6.29 km and an average speed of 25.8 km/h. For the hot-start tests, the vehicles followed the same driving cycle, with the only difference being that the engine coolant temperature was elevated (approximately above 50 °C). The experiments were conducted for both cold- and hot-start conditions at ambient temperatures of −6 ± 1 °C, 23 ± 1 °C, and 36 ± 1 °C.
According to the methodology of Argonne National Laboratory [56], the preparation for the cold start test consists of performing a UDDS cycle, followed by leaving the vehicle for more than 12 h to allow it to thermally stabilize in the specified environment. The hot start tests were conducted with the engine in a thermal state, where the oil temperature was above 50 degrees Celsius (Table 2). During tests at ambient temperatures of −6 °C and 36 °C, the vehicle’s air conditioning was set to approximately 22 °C (72 °F). For tests at 23 ± 1 °C, the air conditioning was turned off, and the windows were lowered to keep the interior temperature close to the ambient level. For the plug-in hybrid vehicle, the analysis was conducted based on test results performed under „Charge Sustaining Operation”. This approach is related to the assessment of energy consumption and CO2 emissions under conditions that closely resemble real-world vehicle operation, where the internal combustion engine maintains the state of charge of the battery. Tests performed under the „Charge Depleting Operation” method yield significantly lower results due to the vehicle operating primarily in EV mode. This leads to discrepancies in energy consumption and emissions between type-approval values and real-world operation, as demonstrated in field studies using data recorded by OBD2 systems [57].
The report [57] showed that for plug-in hybrid vehicles (PHEVs) with gasoline (petrol/electric) engines, the relative difference (“real-word gap”) between the average on-road CO2 emissions and the values obtained during type-approval WLTP (Worldwide Harmonized Light Vehicle Test Procedure) tests recorded in 2021 was approximately 238% (an average difference of about 95.7 g CO2/km). For plug-in hybrid vehicles with diesel engines (diesel/electric), these differences were even higher—about 312%, corresponding to approximately 116 g CO2/100 km. Fuel consumption for gasoline-powered hybrid vehicles during real-world driving was about 4.2 L/100 km higher than the average values measured in laboratory type-approval tests. In the case of diesel-powered hybrids, fuel consumption was about 4.4 L/100 km higher.
For PHEVs registered in 2021, the average on-road CO2 emissions were approximately 3.5 times higher (about 4 L/100 km or 100 g CO2/km) than the values obtained under WLTP laboratory conditions [57].
During the tests, several parameters were measured as functions of time over the driving cycle, including ambient temperature, vehicle speed, dynamometer load, engine oil temperature, engine coolant temperature, and fuel flow rate. In addition, for hybrid and electric powertrains, the following parameters were recorded: current flow to the high-voltage (HV) battery, voltage across the HV battery, and the state of function of the HV battery.
The measurement equipment used in the Argonne National Laboratory (ANL) [56], where the tested vehicles were analyzed, is characterized by a fuel consumption measurement uncertainty of less than 2%. As indicated in publication [58], the fuel consumption measurement uncertainty using the gravimetric method in the ANL for the UDDS cycle is approximately 0.75%, while for the volumetric method it is about 1.72%. For each ambient temperature condition, one measurement was taken for both the cold-start and hot-start tests. It should be noted that the tests were conducted under repeatable and controlled environmental conditions. The differences in fuel consumption measurements for internal combustion engine vehicles in the UDDS cycle under repeatability conditions at the Argonne laboratory fall within approximately 2%. The study by the authors [37] on the repeatability of CO2 emission results showed a coefficient of variation of approximately 0.48% for cold-start tests and about 0.41% for hot-start tests. The authors of [59] also achieved very high repeatability of results in chassis dynamometer tests according to the WLTC 3b cycle.
Based on the raw measurement data [54], the following quantities were calculated. For vehicles equipped with internal combustion engines, fuel consumption was determined using the following equation:
F C n = i = 0 n q f u e l , i 1000
where
FCn—fuel consumption (L) during the driving cycle, calculated from the start of the test up to the n-th second of the cycle.
qfuel,i—instantaneous fuel consumption of the engine at the i-th second of the cycle [cm3/s].
The distance traveled during the time interval from (i − 1) to i is expressed by the following equation [60]:
d i = v i + v i 1 2 × 3.6 · ( t i t i 1 )
where
di—distance traveled during the time interval from (i − 1) to i [m].
ti—time at the i-th measurement point [s].
vi—target speed at time ti [km/h].
For a given test cycle duration, the distance was calculated according to the following equation:
s n = i = 0 n d i 1000
where
sn—distance (km).
Based on the calculated fuel consumption and distance, the on-road fuel consumption during the cycle was determined as follows:
Q n = F C n · 100 s n
where
Qn—average on-road fuel consumption [L/100 km].
To compare energy consumption across different powertrain types, the fuel consumption values expressed in [L/100 km] were converted to [kWh/100 km], taking into account the lower heating value and fuel density, as specified in Table 1.
The CO2 emissions in the exhaust gases of vehicles equipped with internal combustion engines were calculated using CO2 emission factors of 3183 g CO2/kg of fuel burned for gasoline and 3165 g CO2/kg of fuel burned for diesel [61], according to Equation (5):
e C O 2 = Q n · E F f u e l · ρ p a l 100
where
eCO2—CO2 emission [g CO2/km].
EFfuel—CO2 emission factor of fuel burned; EFgas = 3183 [g CO2/kg] for gasoline and EFdies = 3165 [g CO2/kg] for diesel fuel.
ρpal—fuel density [kg/dm3] (according to Table 1).
For vehicles powered by electricity drawn from the grid (BEVs), the energy consumption was calculated based on the change in the electrical energy stored in the Rechargeable Energy Storage System (REESS), expressed in [Wh]. The change in energy, ΔEREESS, over a given time interval was determined using the following equation [60]:
Δ E R E E S S , j = 1 3600 t 0 t e n d U ( t ) R E E S S , j × I ( t ) R E E S S , j d t
where
ΔEREESS,j—change in the electrical energy of the Rechargeable Energy Storage System (REESS) during the considered time interval j [Wh].
U(t)REESS,j—REESS voltage during the considered time interval j [V].
t0—start time of the considered time interval j [s].
tend—end time of the considered time interval j [s].
I(t)REESSj—REESS current during the considered time interval j [A].
j—index of the considered time interval.
The direct current electricity consumption during the time interval j was calculated based on the change in electrical energy of the REESS over the considered time interval j, according to the following equation [61]:
E D C , j = Δ E R E E S S , j s j
where
sj—distance traveled during the time interval j of the test cycle [km].
Energy consumption from the power EAC grid is expressed by the equation:
E A C = K A C D C · E D C
where
KAC–DC—AC energy consumption coefficient [-].
EDC—DC energy consumption from battery [Wh/km].
The energy consumption coefficient (KAC–DC) represents the ratio of the energy drawn from the power grid to the energy drawn from the vehicle’s battery. It accounts for the battery charging efficiency of the vehicle. Its value typically ranges from approximately 1.15 to 1.3, depending on the charging method, the technical condition of the batteries, and environmental factors—particularly temperature. The average values of this coefficient used in the calculations for the electric vehicle were determined based on the measured energy drawn from the grid and the energy drawn from the battery. Depending on the ambient temperature, the corresponding values of this coefficient for the tested vehicle were as follows: 1.167 at −6 ± 1 °C, 1.163 at 23 ± 1 °C, and 1.306 at 36 ± 1 °C.
The estimated emissions e [g/km] are expressed by the following equation:
e j = E F k · E A C
where
EFk—emission factor of pollutant k [kg of pollutant/MWh].
EAC—AC energy consumption [kWh/km].
For the calculation of indirect CO2 emissions, the value for Poland was adopted based on available data [62]: EFCO2 = 685 kg CO2/MWh.

3. Results

3.1. Energy Consumption

3.1.1. Impact of Cold Start on Energy Consumption

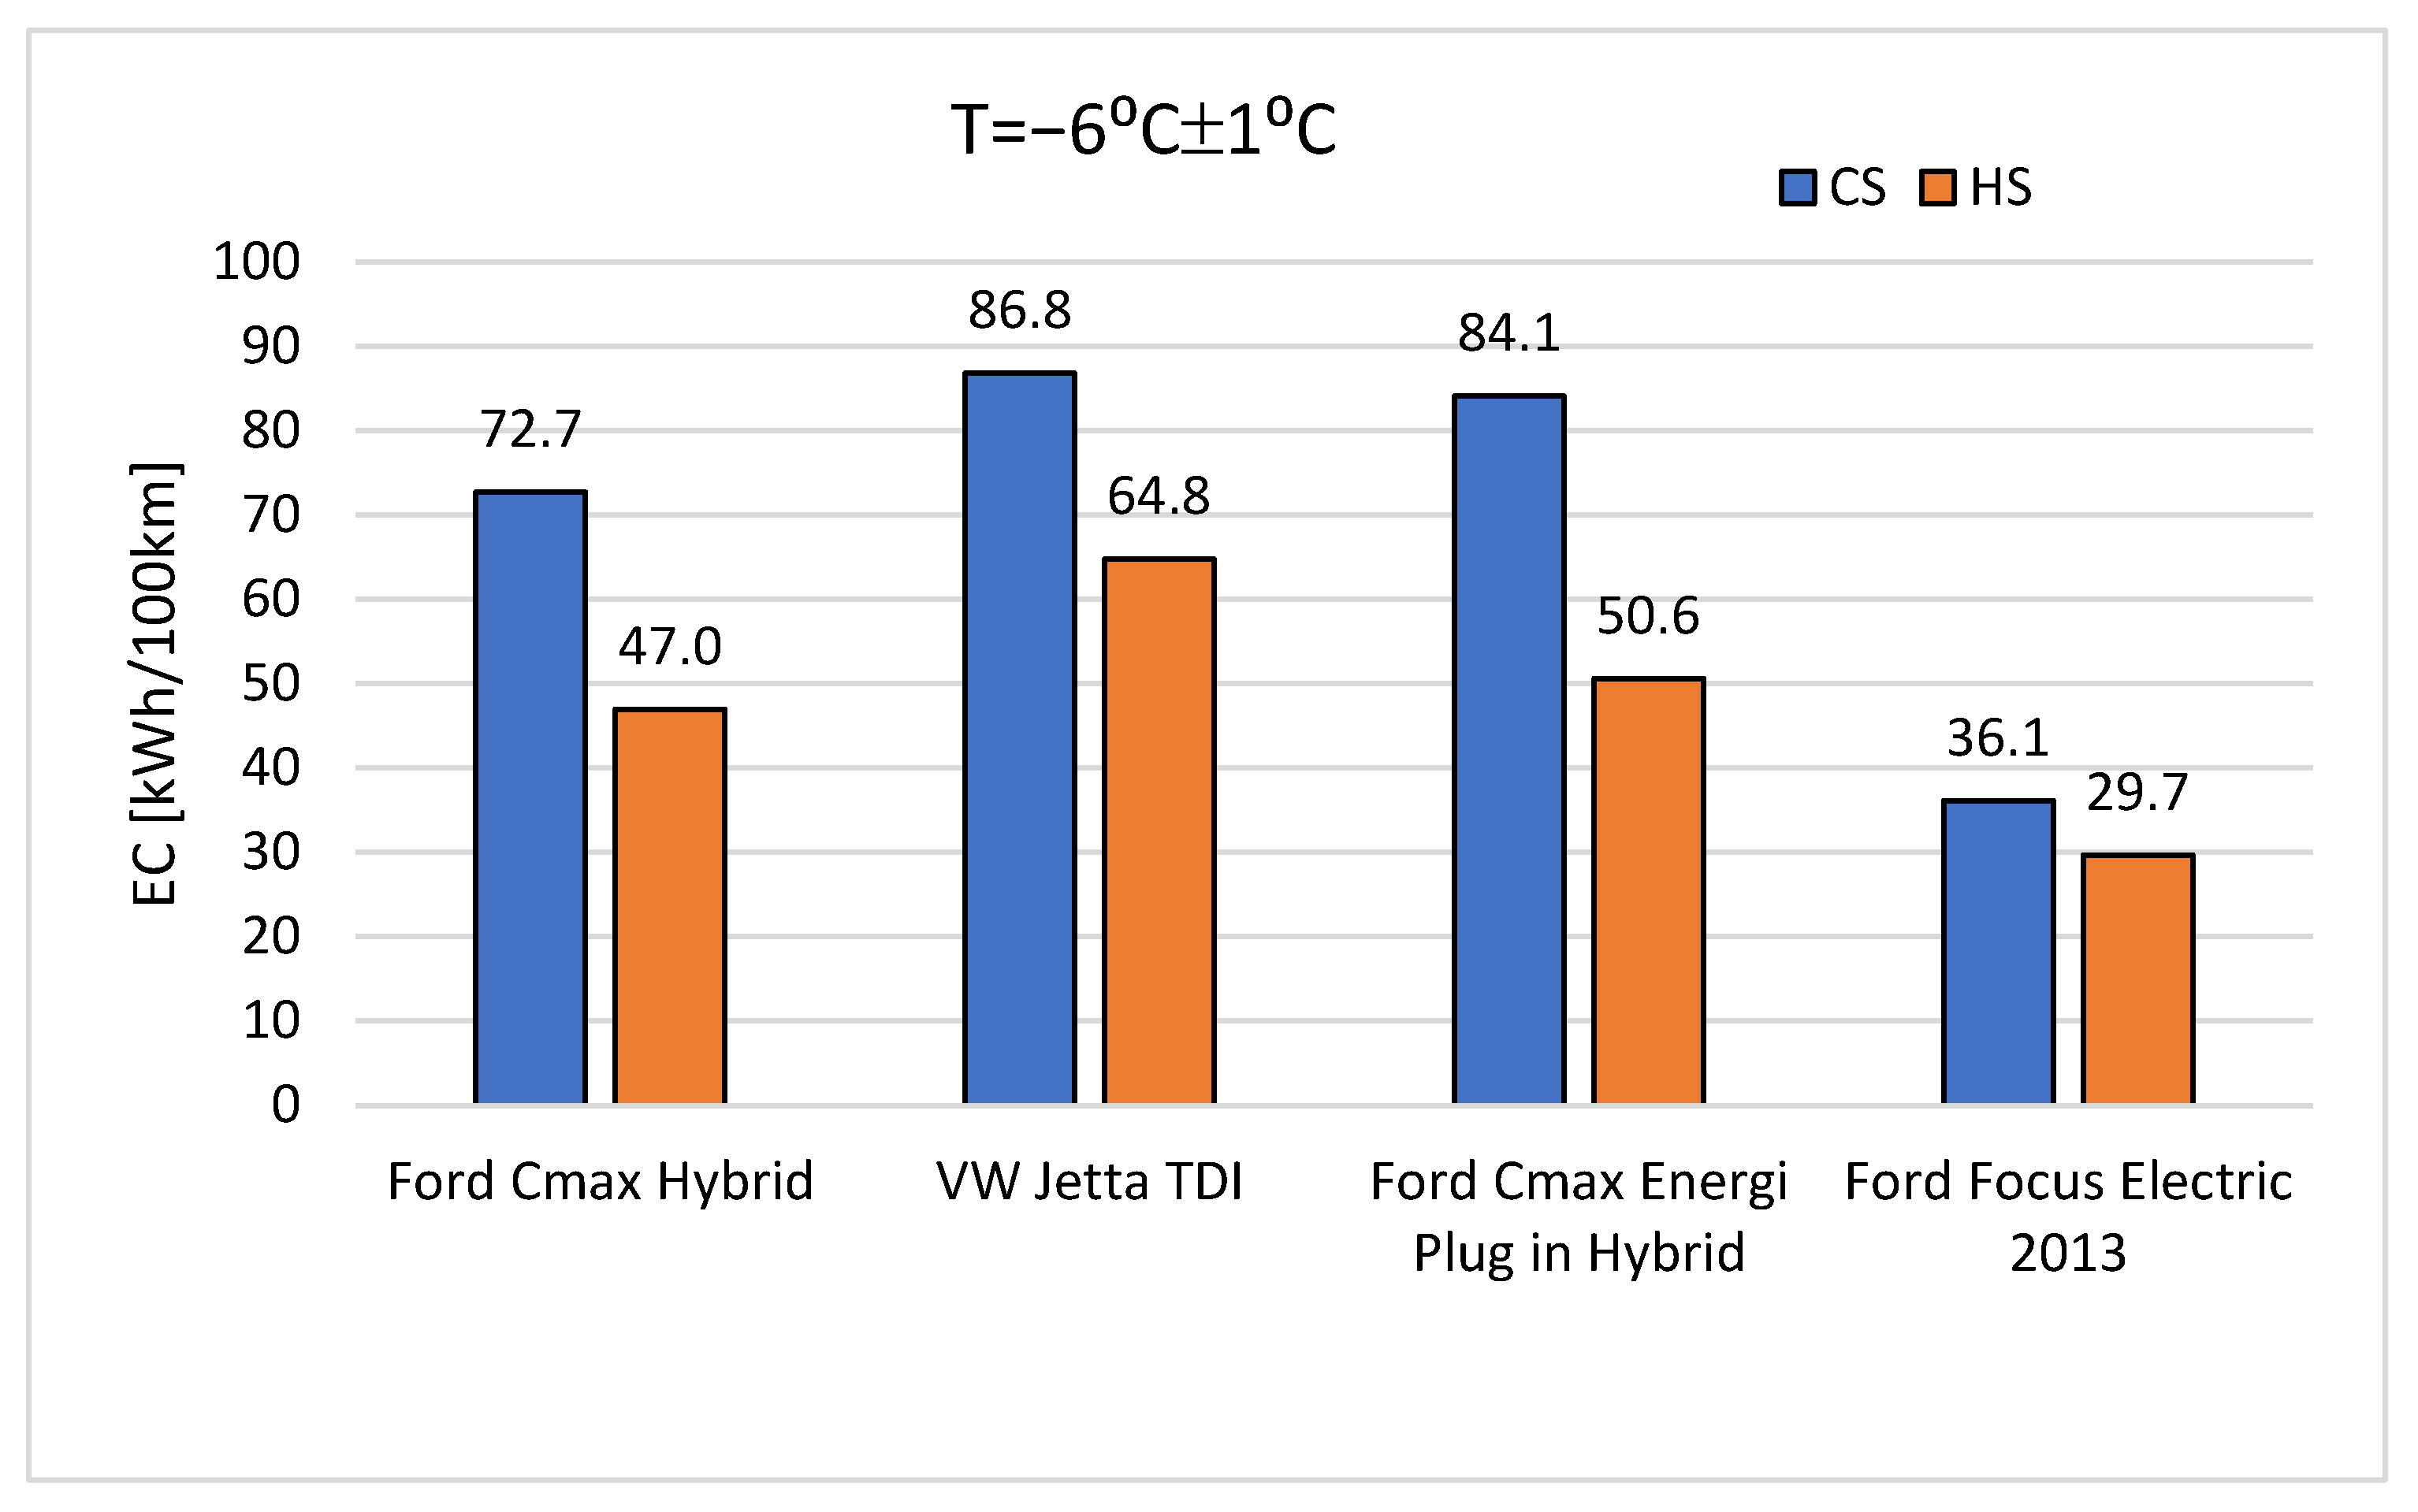
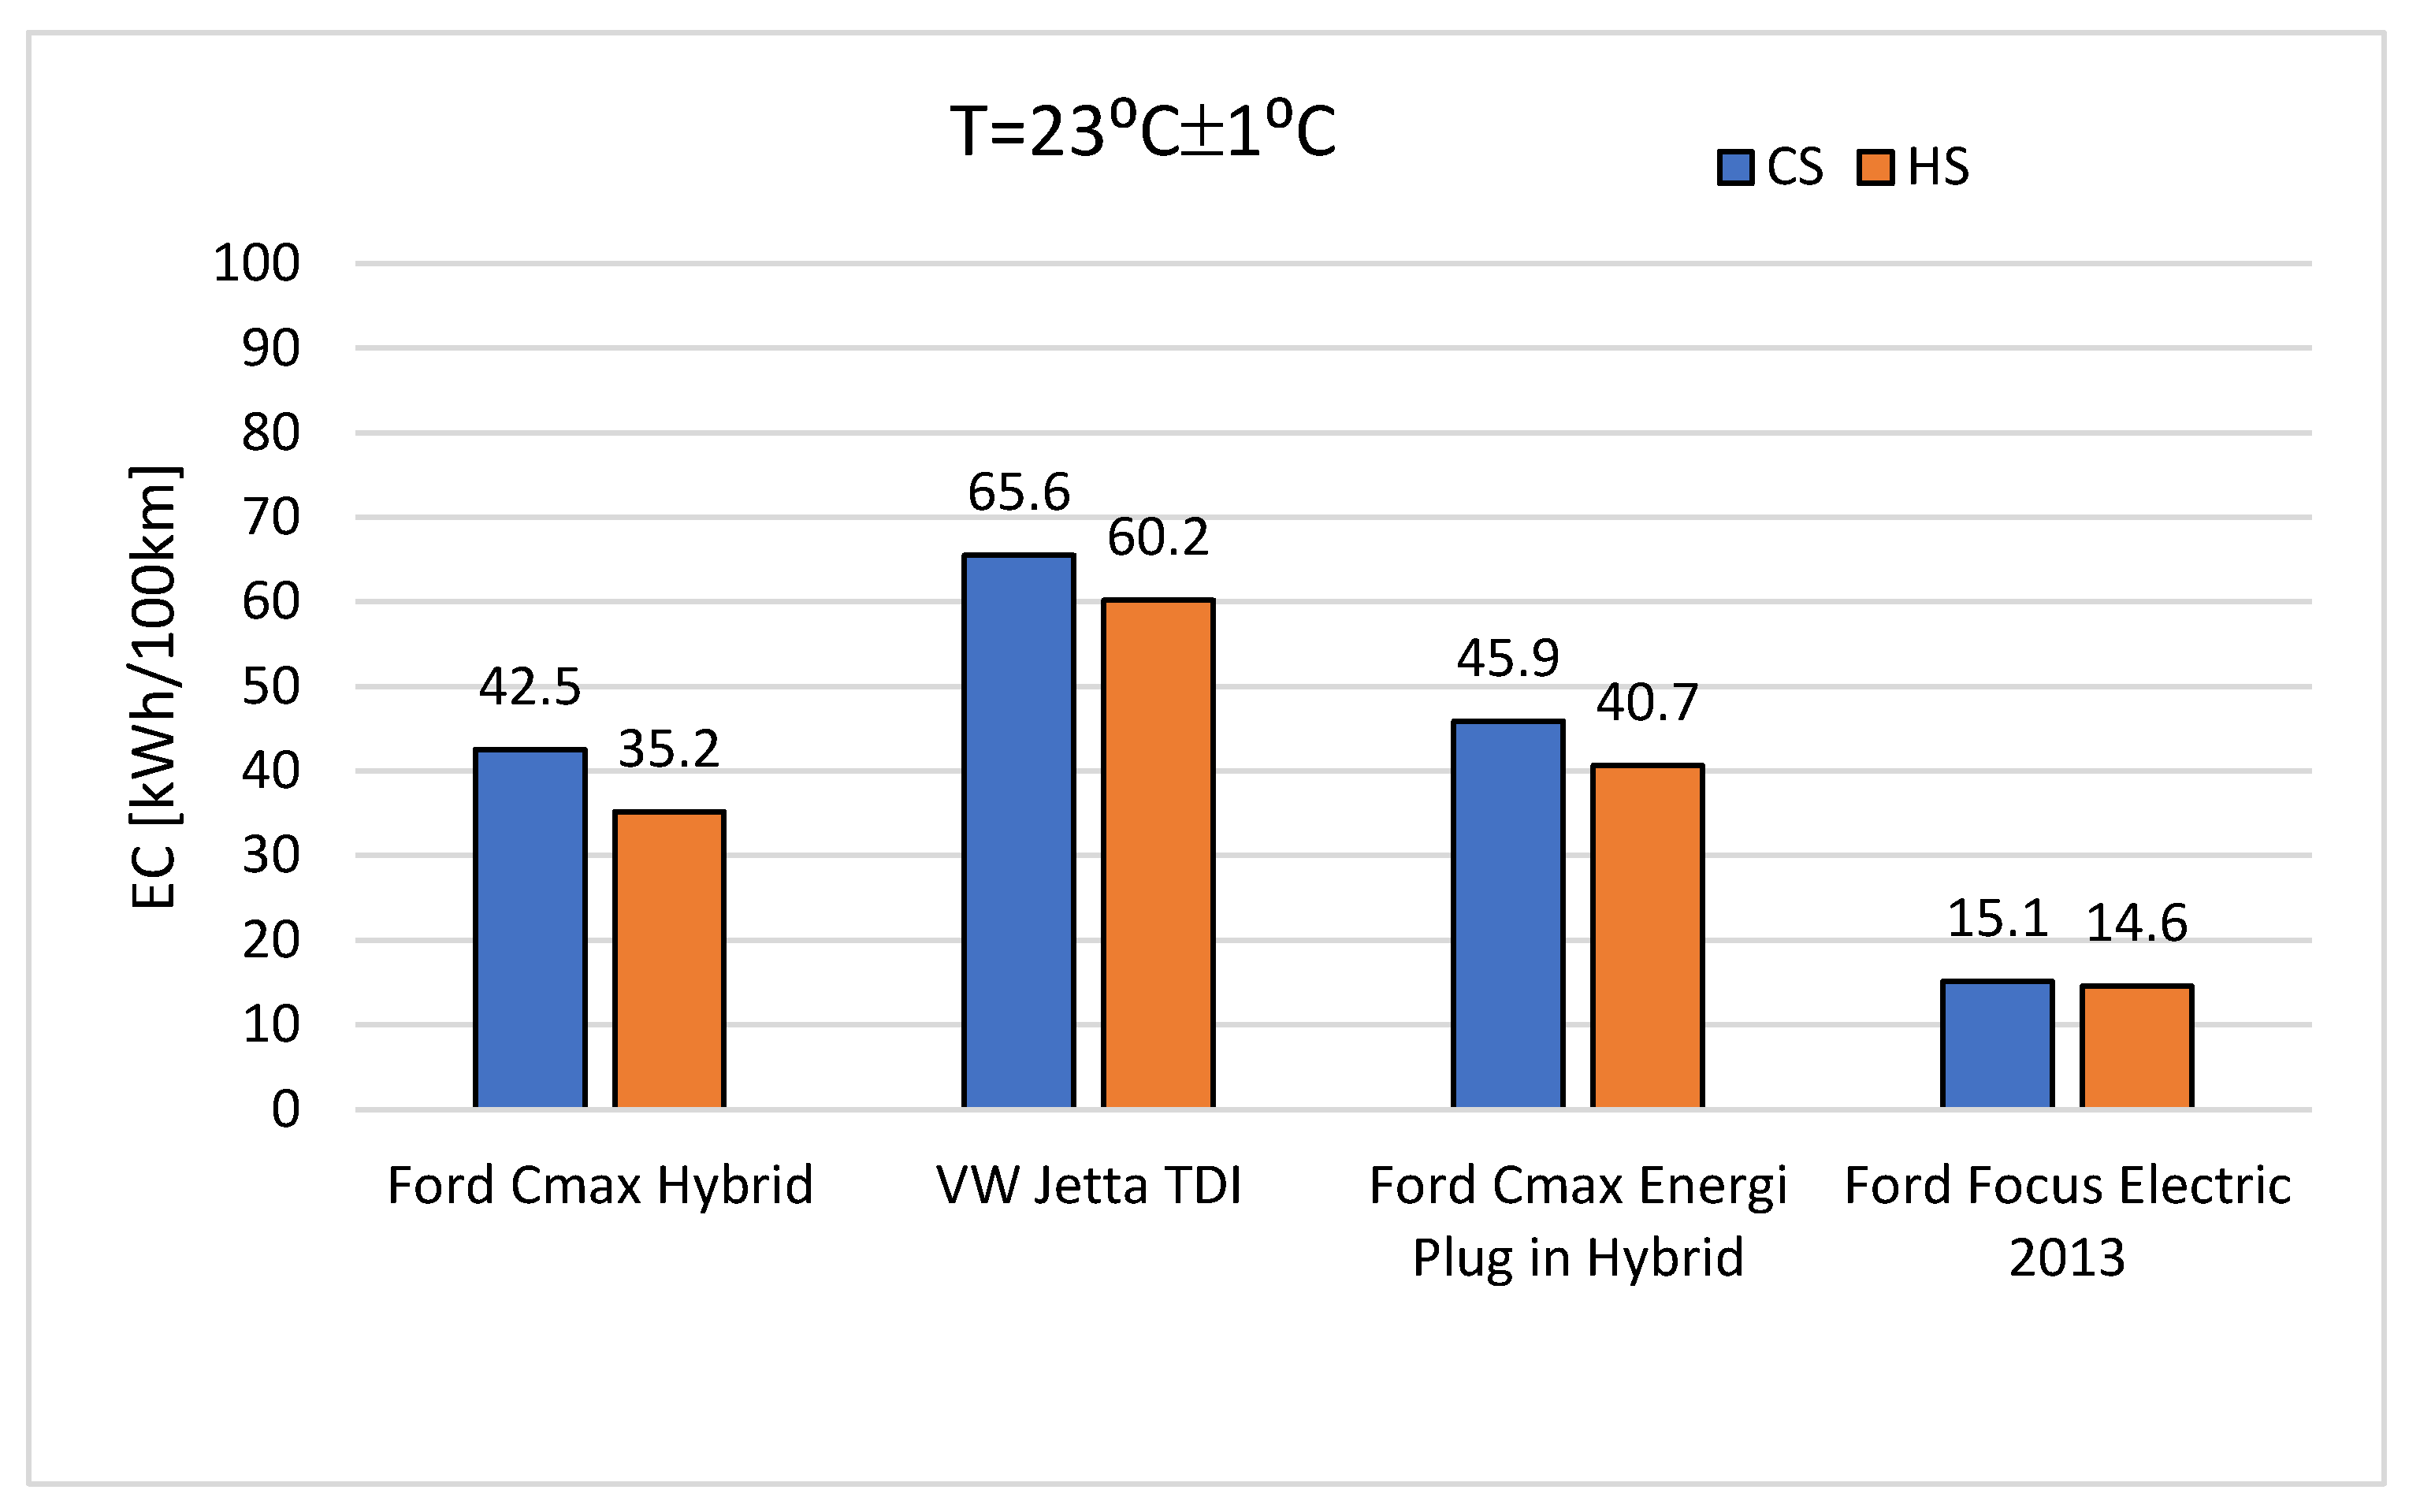
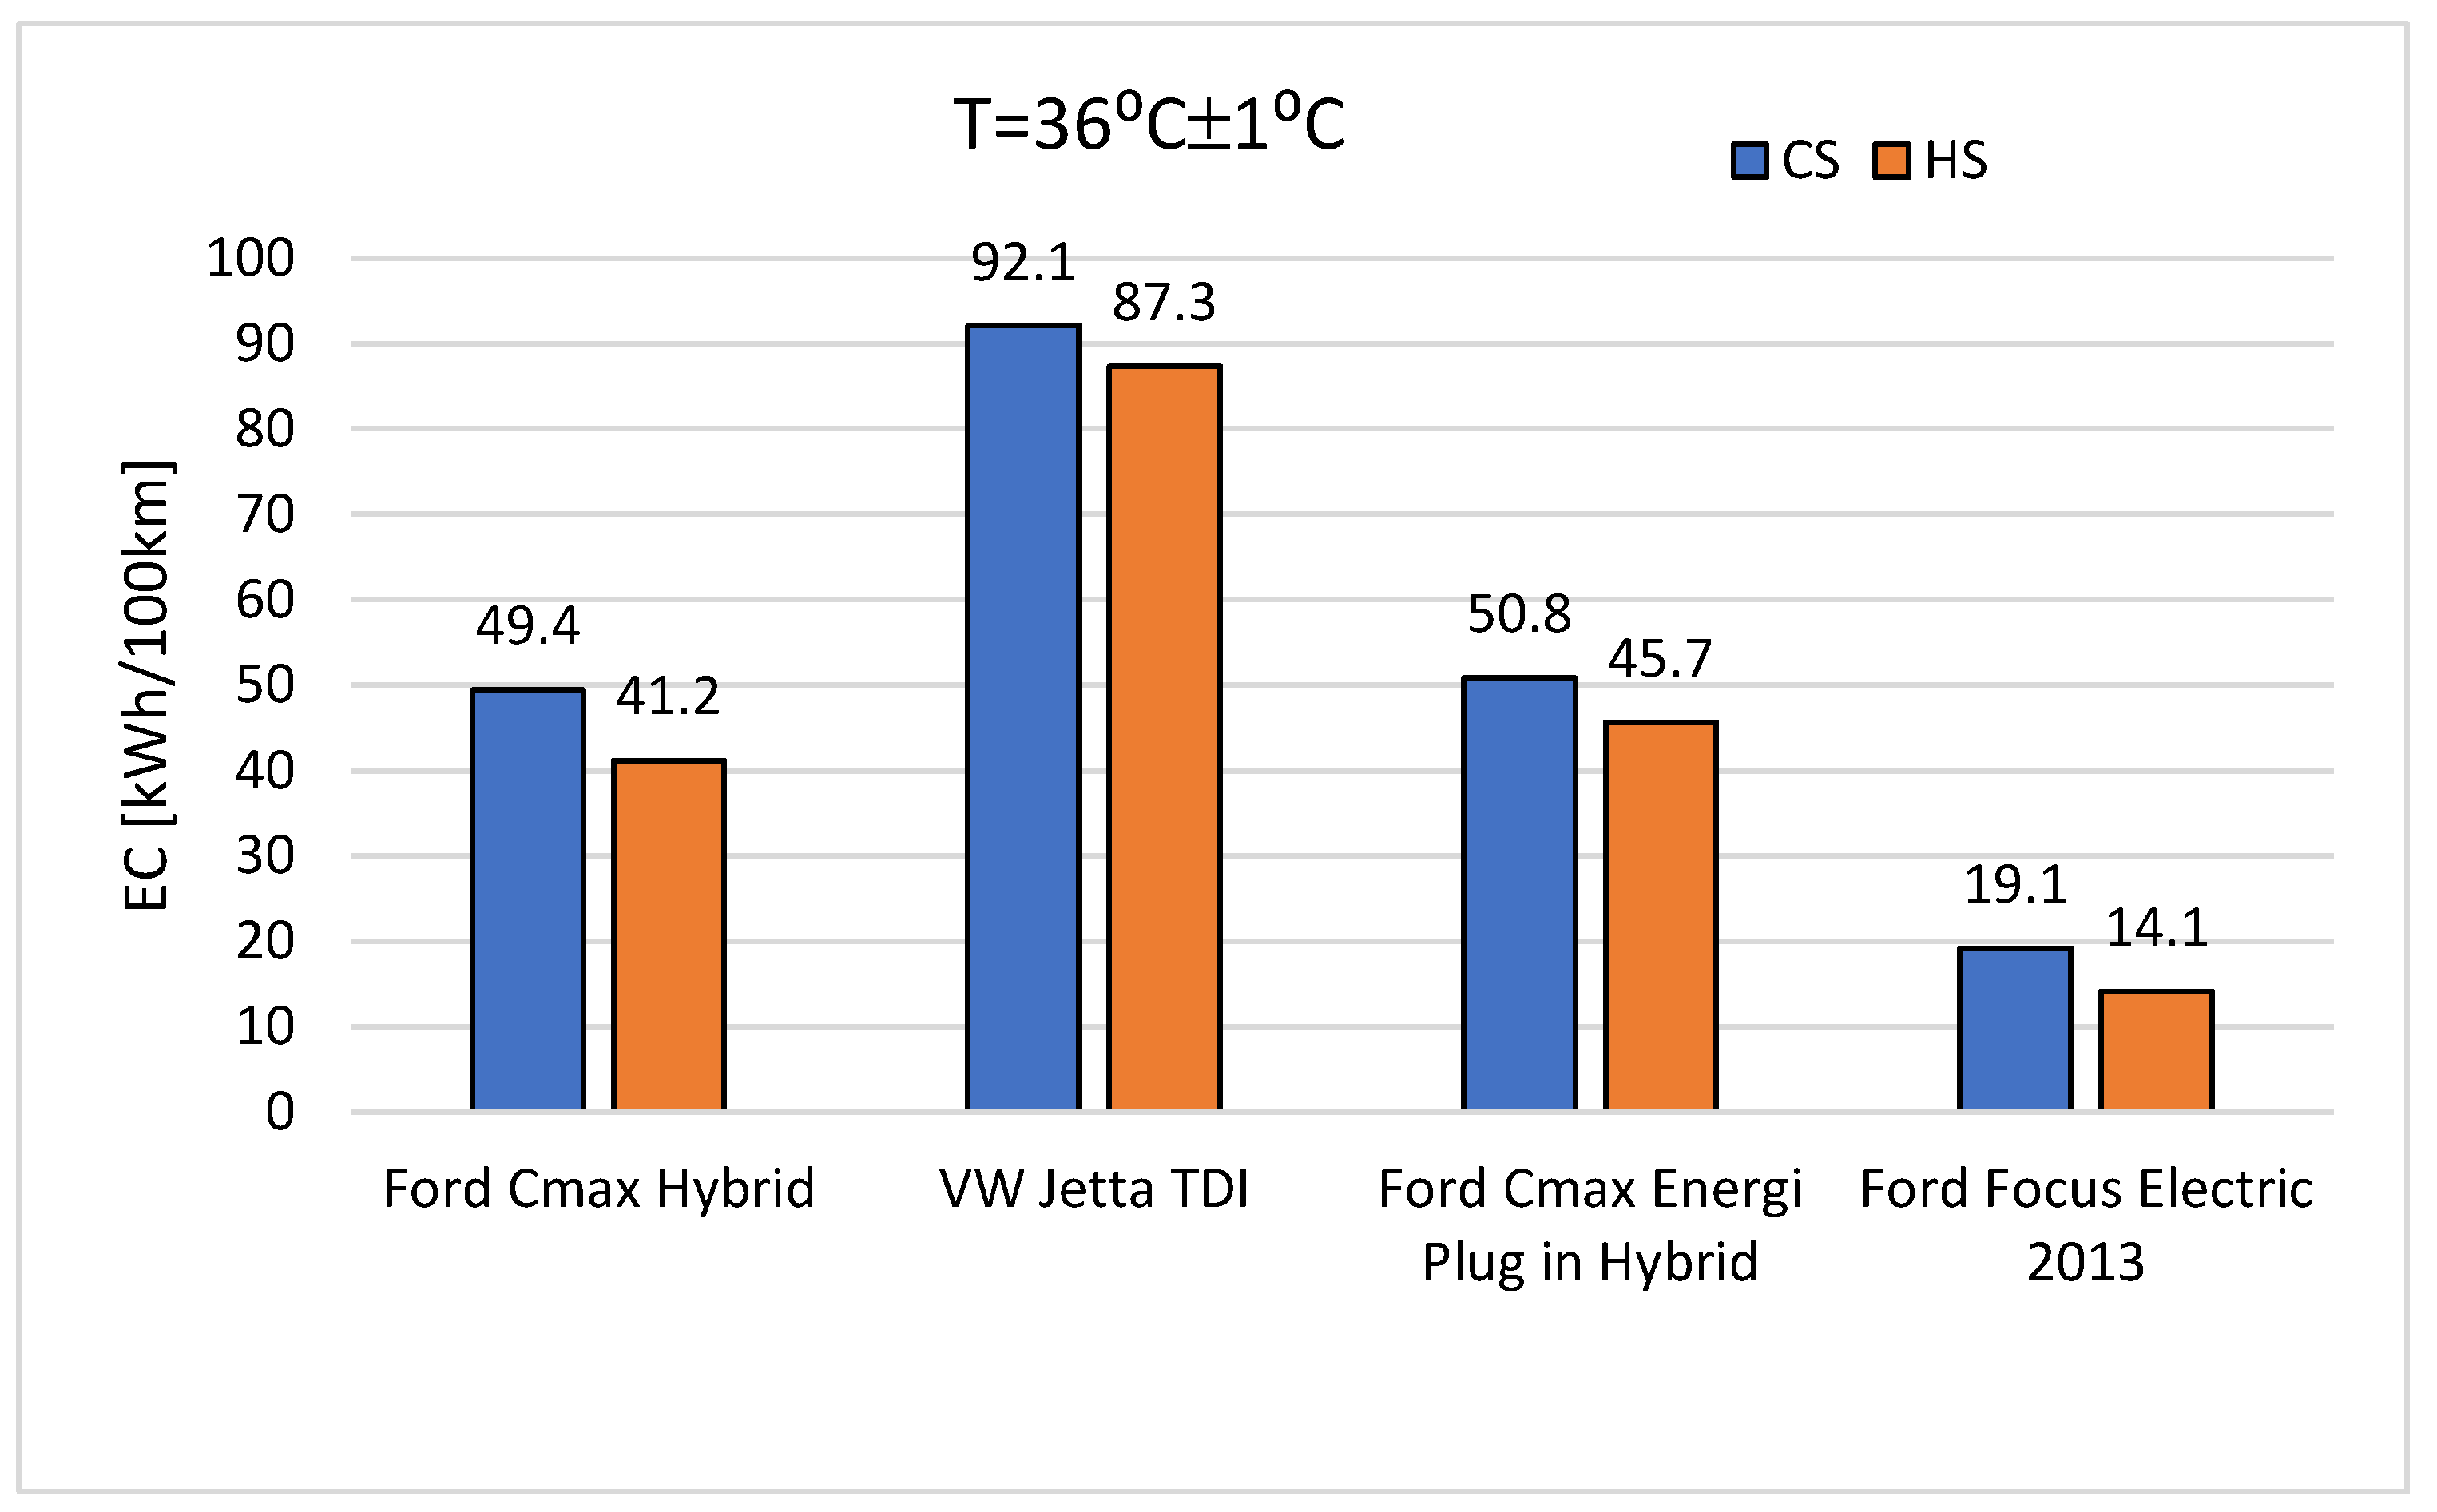
The results of the energy consumption analysis in the UDDS cycle for the tested vehicles, depending on the engine thermal state (cold start—CS; hot start—HS) and for three ambient temperatures (−6 ± 1 °C, 23 ± 1 °C, and 36 ± 1 °C), are presented in Figure 4, Figure 5 and Figure 6. For hybrid vehicles, the energy consumption was referenced to the energy content of the fuel burned, while for the electric vehicle, the energy consumption was referenced to the energy drawn from the power grid.
The highest energy consumption in the UDDS cycle, approximately 92 kWh/100 km (Figure 6), was recorded for the VW Jetta TDI (internal combustion engine vehicle) during the cold-start (CS) test at an ambient temperature of 36 ± 1 °C. In the hot-start (HS) test under the same conditions, the average energy consumption was slightly lower, at around 87 kWh/100 km. These values were still lower than those obtained in the test conducted at −6 ± 1 °C (Figure 4), where the average energy consumption under CS conditions reached approximately 87 kWh/100 km, while under HS conditions it was about 65 kWh/100 km. This indicates that at sub-zero ambient temperatures, the engine thermal state has a greater impact on energy consumption. Under CS conditions, the relative difference in average on-road energy consumption between 36 ± 1 °C and −6 ± 1 °C was about 6%, whereas under HS conditions, the difference was approximately 25%. It is also evident that at high ambient temperatures, energy consumption is not significantly influenced by the engine’s thermal state (the difference was about 5%). In contrast, at sub-zero temperatures, energy consumption in the CS test was about 34% higher than in the HS test. The operation of the air conditioning system at the same set interior temperature differs between ambient temperatures of −6 °C and +36 °C. Heating the cabin consumes less energy because it uses waste heat from the engine’s cooling circuit, accelerating cabin warming and reducing energy demand. In contrast, cooling the cabin at high ambient temperatures requires more energy, and additional energy is consumed for cooling the traction batteries, as managed by the Battery Management System (BMS). Traction batteries in vehicles require an appropriate thermal state. The optimal operating temperature of the cells is typically 20–40 °C [53]. At lower temperatures, Battery Thermal Management Systems (BTMS) heat the batteries, which, unfortunately, requires energy and therefore reduces vehicle range. Similarly, at higher temperatures, the batteries require cooling, which also consumes energy [54]. These factors contribute to the observed differences in overall energy consumption. At an ambient temperature of 23 ± 1 °C (Figure 5), the average energy consumption in the CS test was approximately 66 kWh/100 km, about 2 kWh/100 km higher than in the HS test at −6 ± 1 °C. The relative difference in average energy consumption between CS and HS conditions at 23 ± 1 °C was about 9%.

3.1.2. Impact of Distance on Energy Consumption

The results of energy consumption in the UDDS cycle for the analyzed vehicles, as a function of distance traveled from the start of the test, are presented in Figure 7, Figure 8, Figure 9 and Figure 10 for three ambient temperatures (−6 ± 1 °C, 23 ± 1 °C, and 36 ± 1 °C). The average on-road energy consumption values (kWh/100 km) were determined for distances of 2, 3, 4, 5, 10, and 12 km.
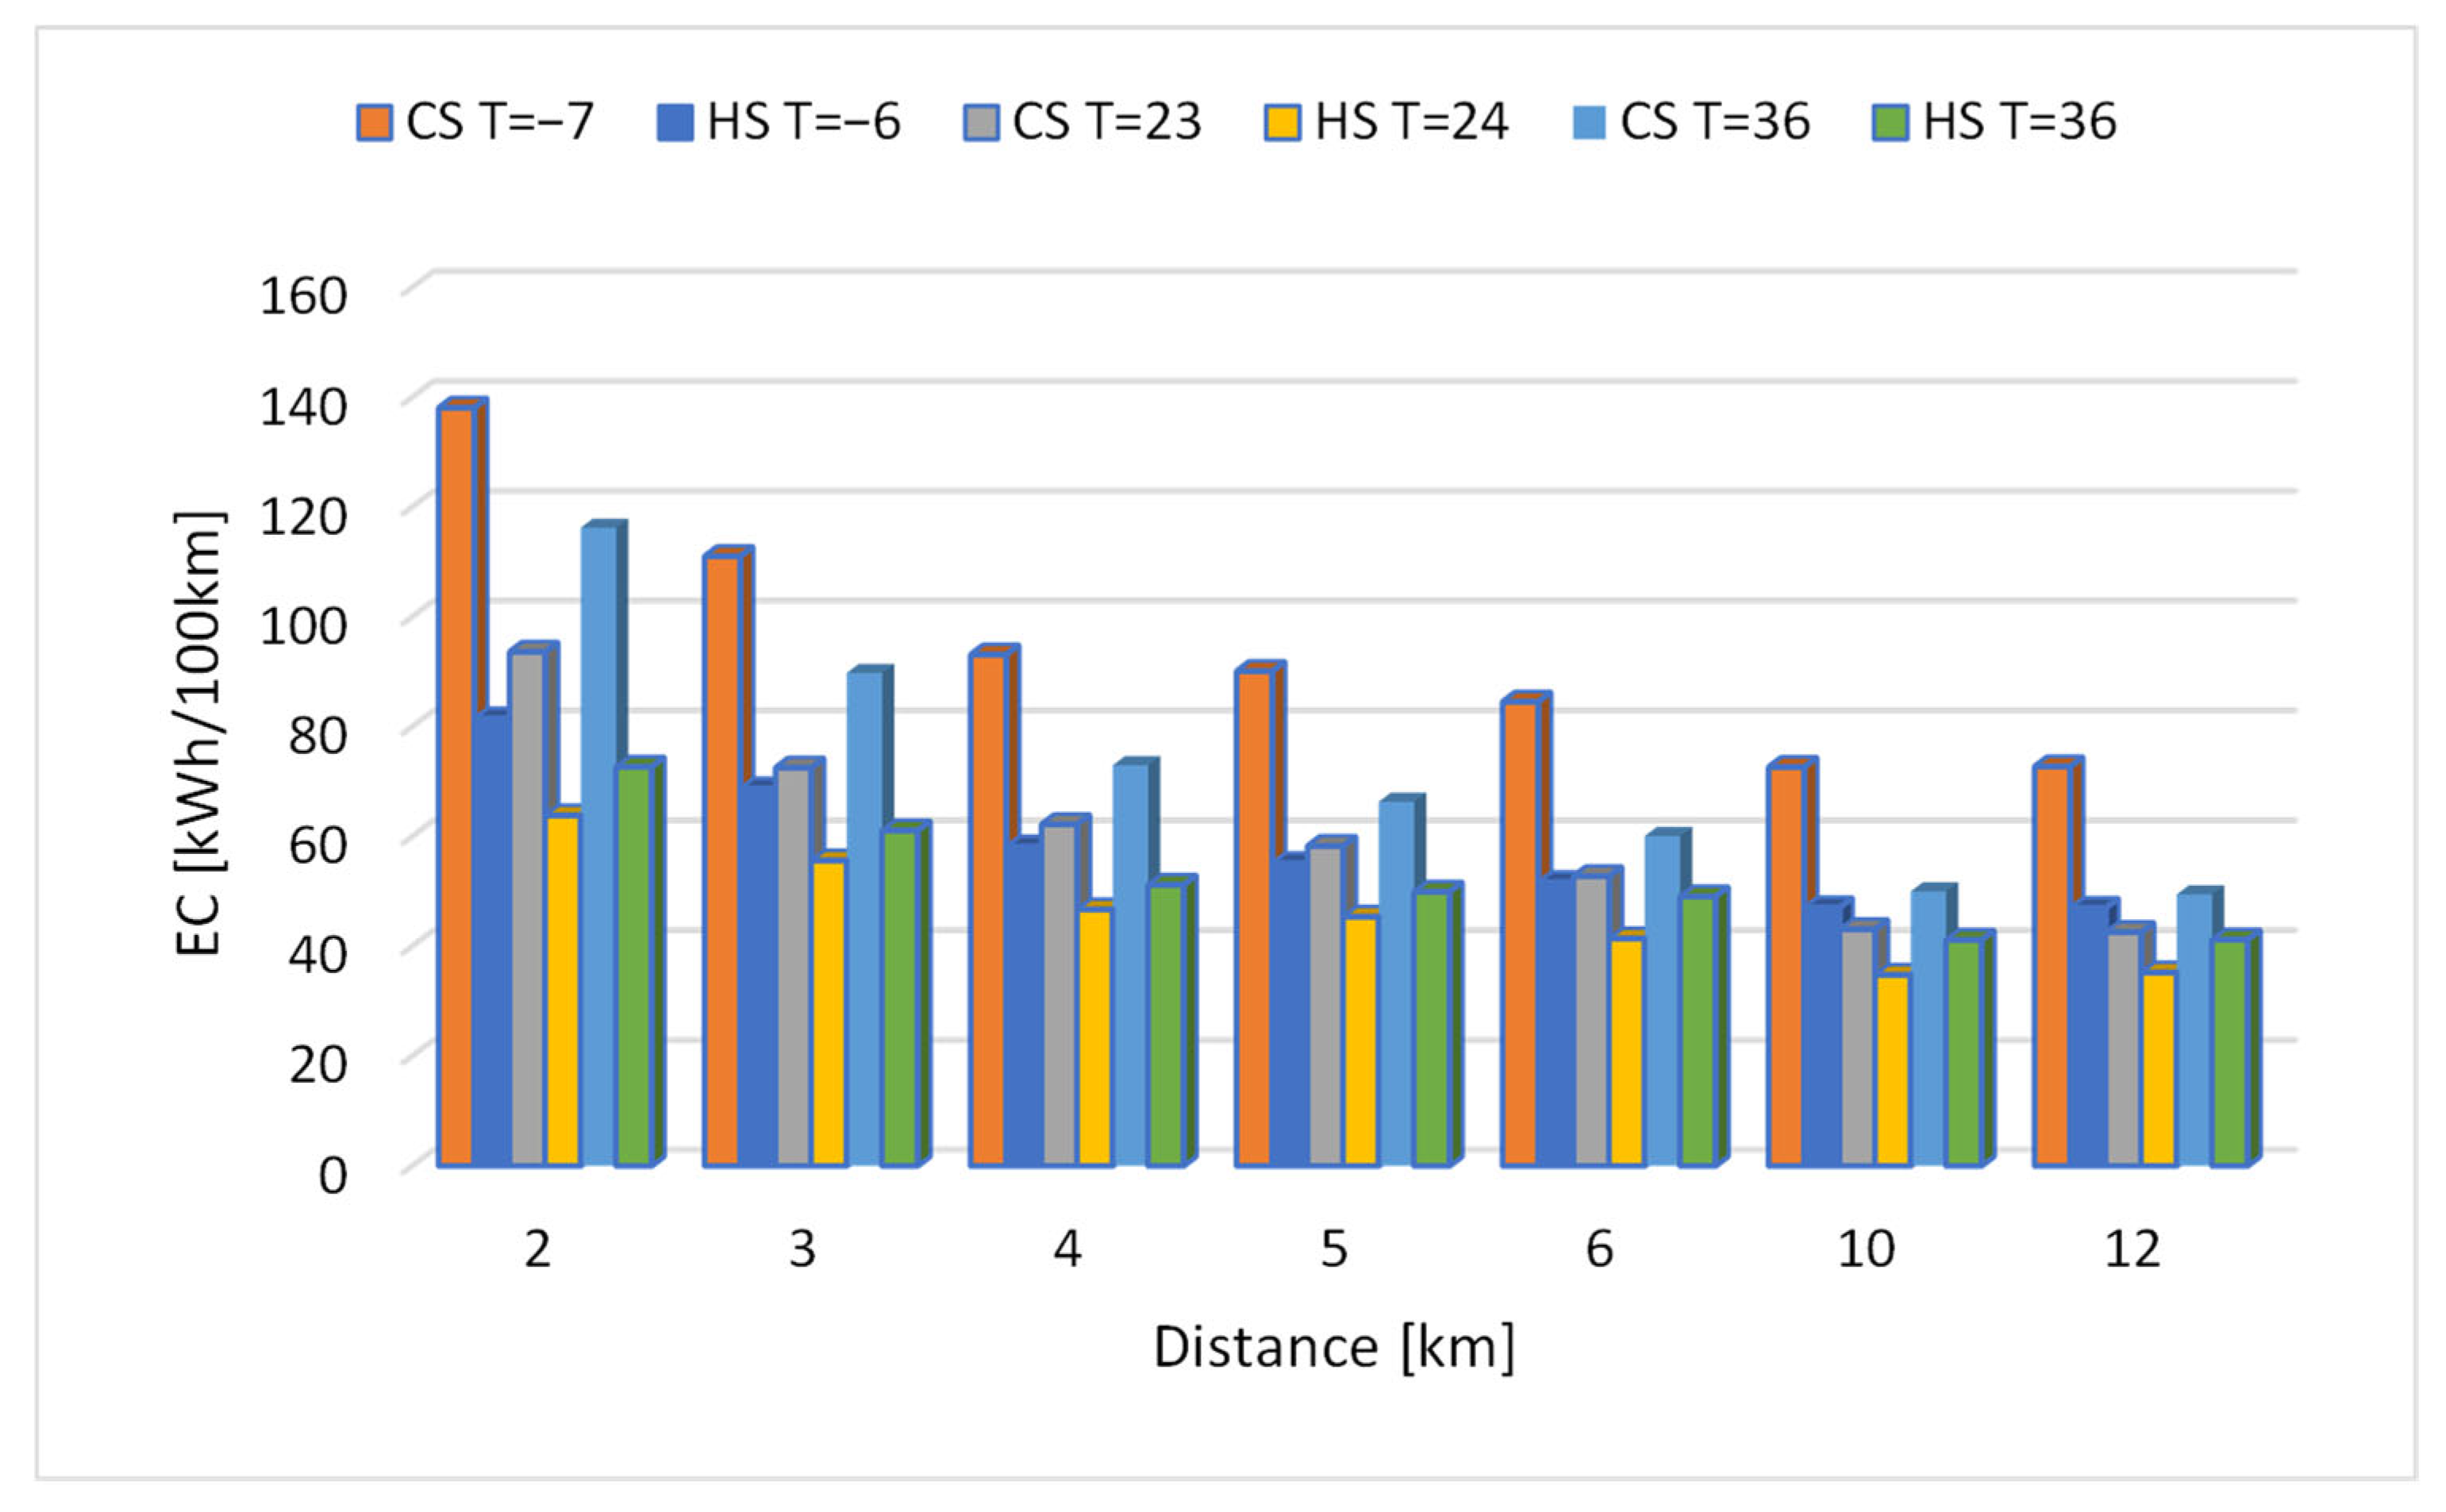
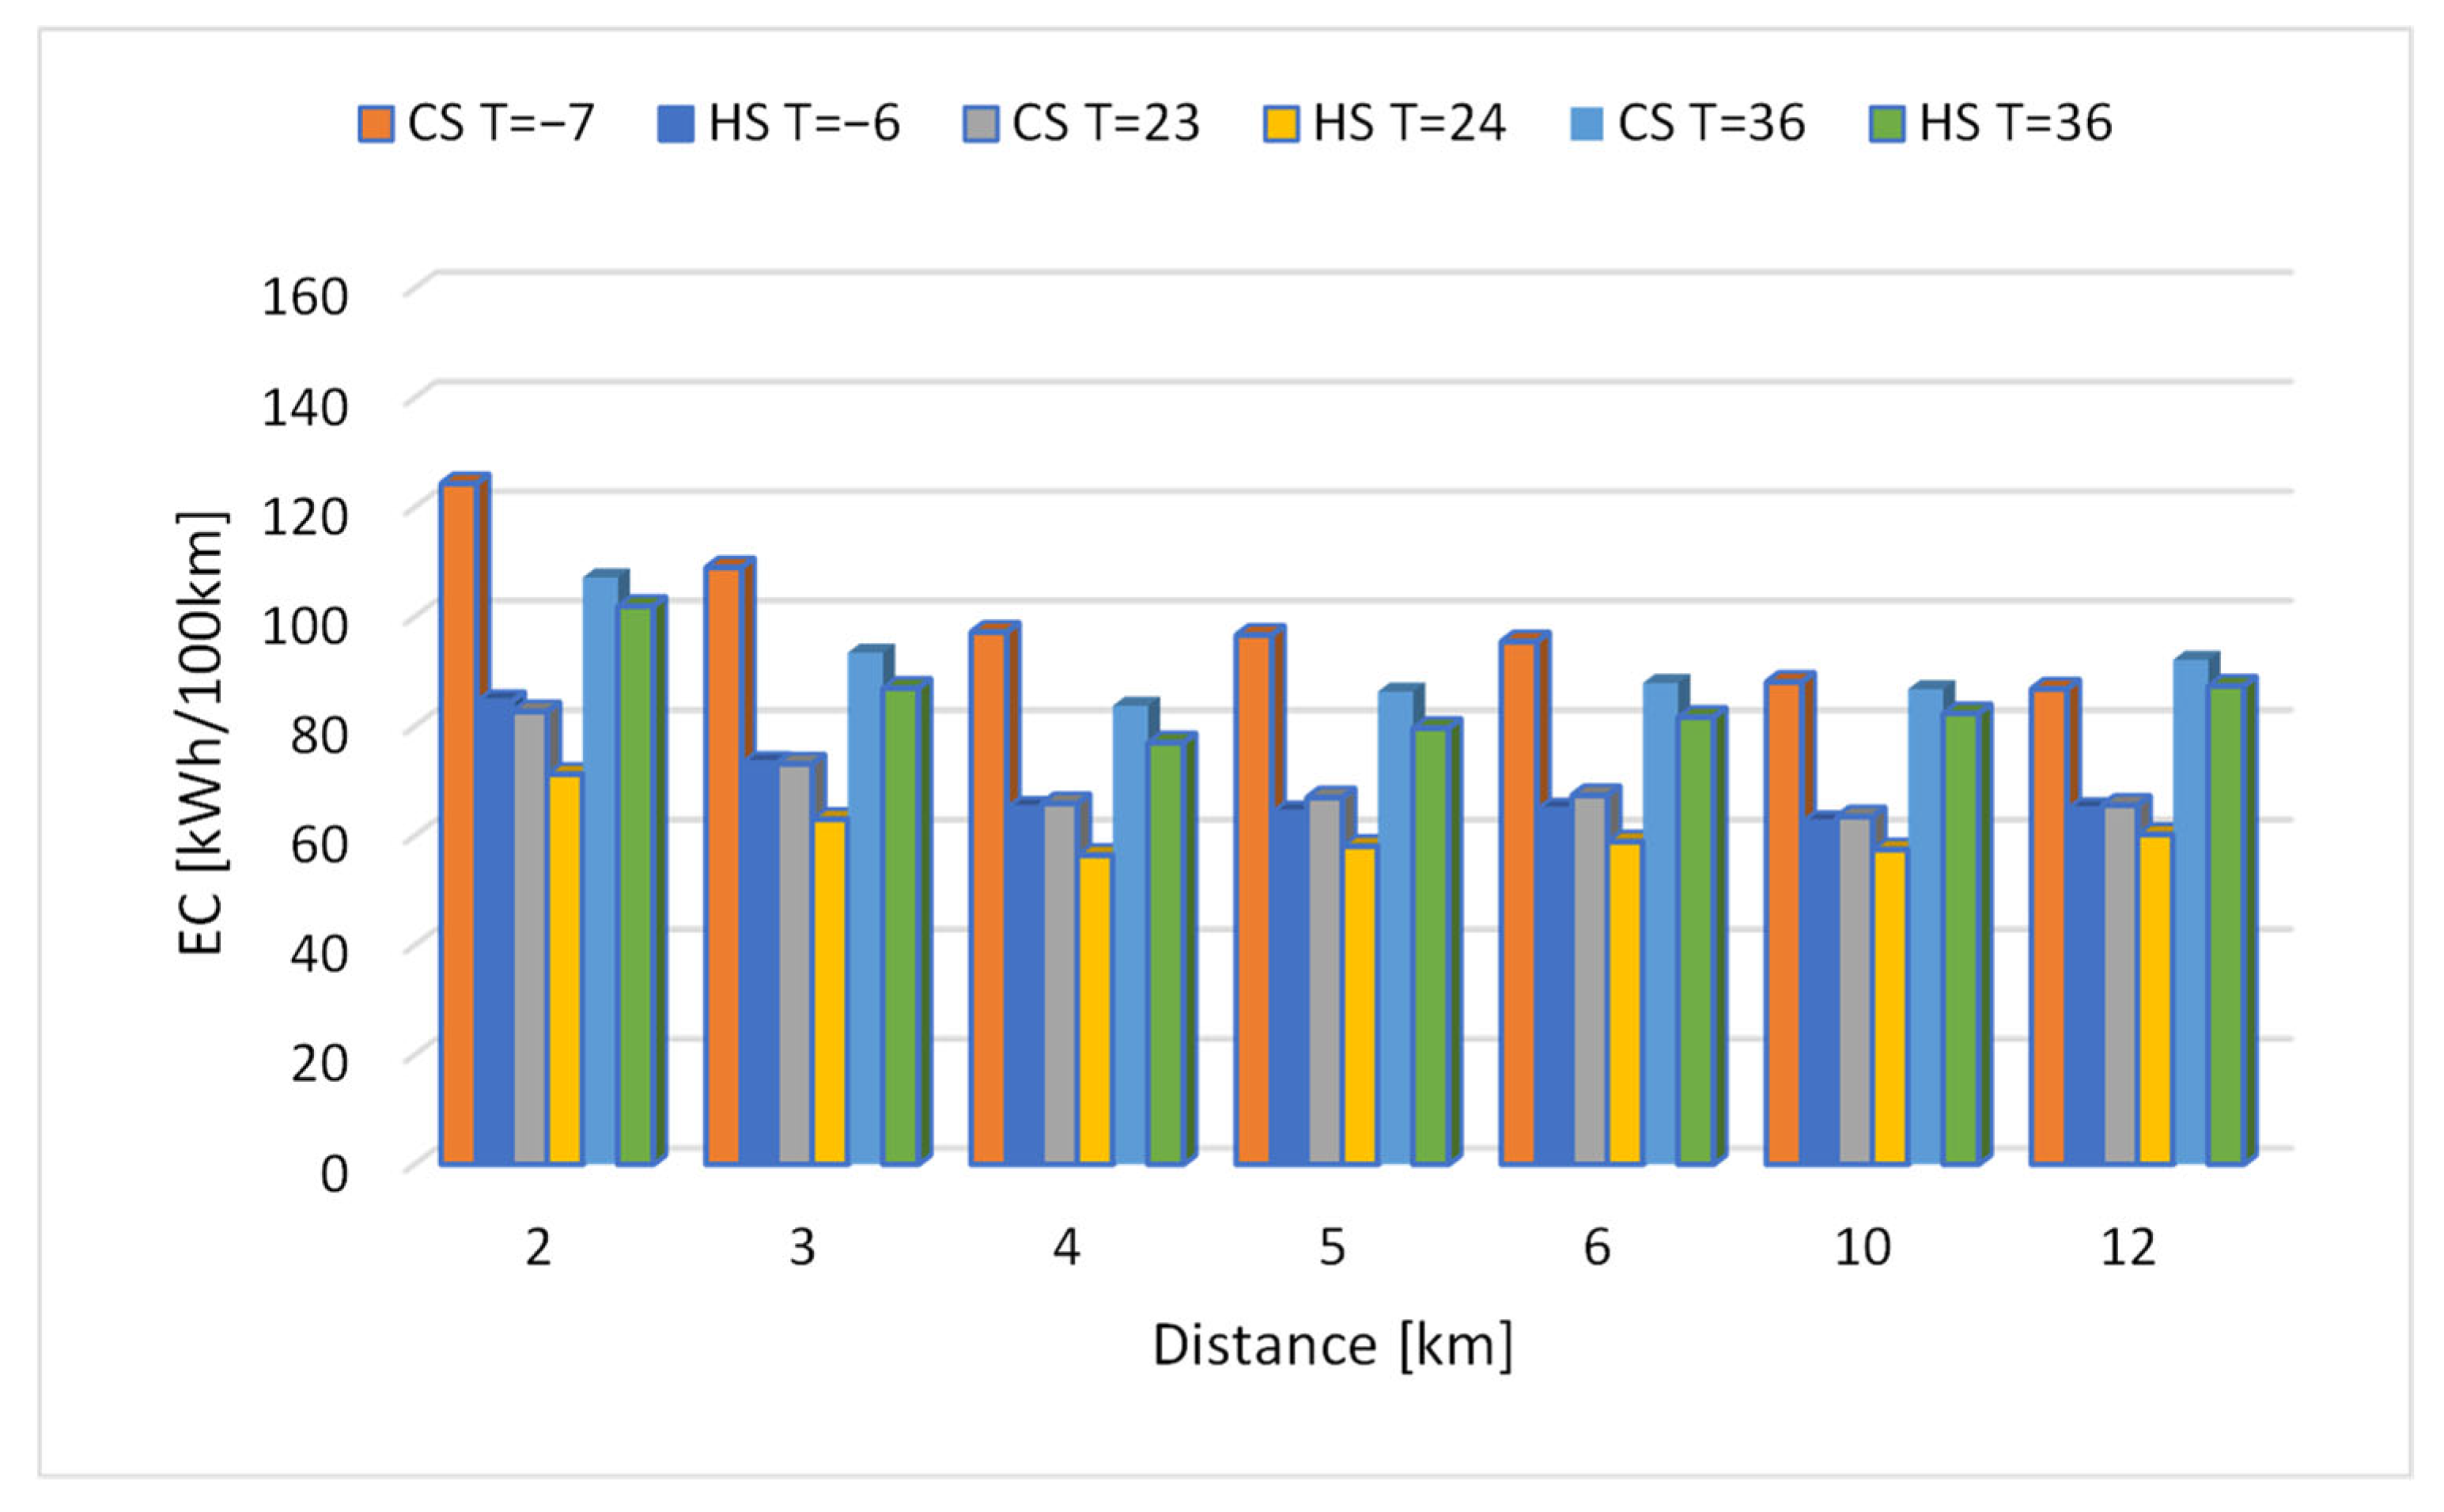
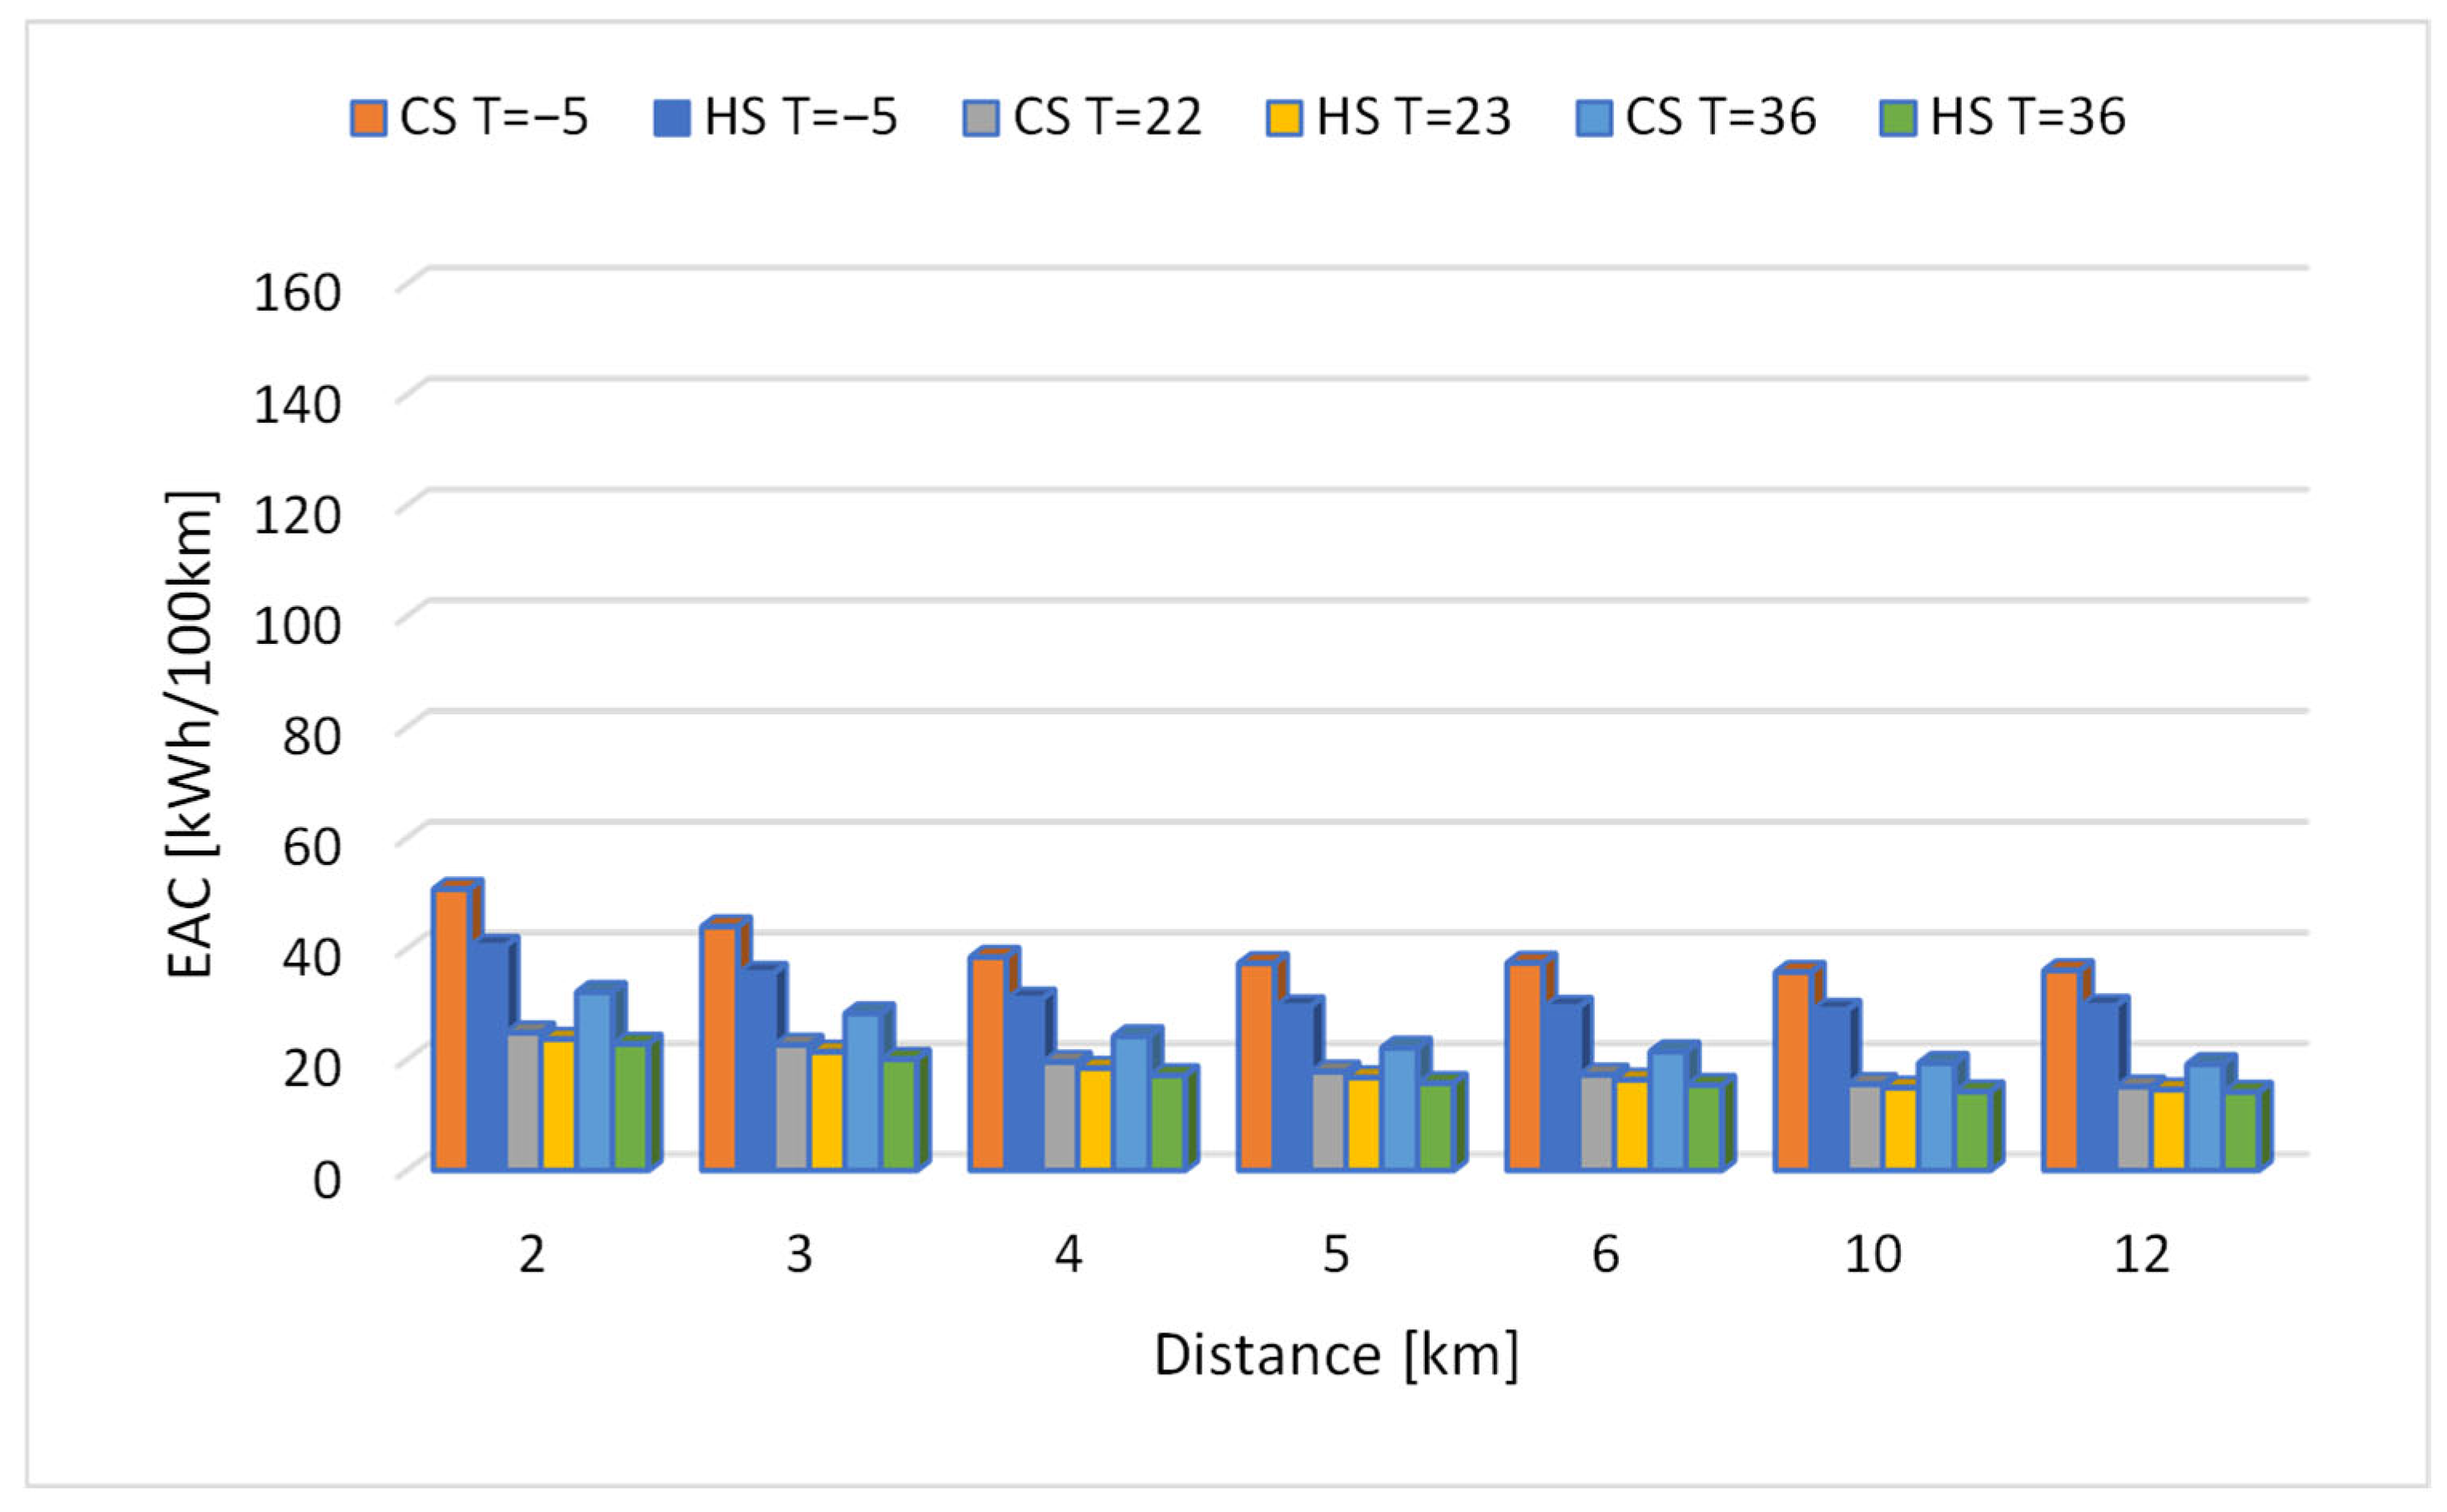
Considering the impact of distance on average energy consumption (Figure 7, Figure 8, Figure 9 and Figure 10), it is evident that short-distance trips are particularly unfavorable, as they are characterized by significantly higher average energy consumption—especially when driving begins with a cold start (CS). The relative differences in average energy consumption over a 2 km distance compared to a 12 km distance (corresponding to the entire UDDS cycle) for the analyzed vehicles at an ambient temperature of −6 ± 1 °C were approximately: 81% for the Ford C-Max Energi Plug-in Hybrid (Figure 9), 43% for the VW Jetta TDI (Figure 8), 89% for the Ford C-Max Hybrid (Figure 7), and 40% for the Ford Focus Electric (Figure 10). The highest energy consumption under CS conditions at −6 ± 1 °C over a 2 km distance was recorded for the Ford C-Max Energi Plug-in Hybrid, with an average of about 152 kWh/100 km. This may be attributed to a low state of charge (SOC) of the battery, which required recharging by the internal combustion engine after start-up. Under the same conditions, the Ford C-Max Hybrid consumed approximately 138 kWh/100 km, the VW Jetta TDI about 124 kWh/100 km, and the Ford Focus Electric about 50 kWh/100 km. These results indicate that for short-distance driving, the electric powertrain offers the lowest average on-road energy consumption. Higher average on-road energy consumption over short distances is characteristic of all types of vehicles and powertrains analyzed, in both CS and hot-start (HS) tests. The largest differences occur during the initial phase of the cycle (up to about 5 km). It should be noted that after the initial driving period—once the engine and drivetrain components have warmed up—subsequent energy consumption also depends on the driving cycle and driving style, and may increase after reaching a minimum due to rising resistance forces acting on the vehicle. This effect is particularly noticeable for the VW Jetta TDI, where during the HS test at 23 ± 1 °C, the minimum average energy consumption (about 56 kWh/100 km) was observed after approximately 4 km, followed by an increase to about 60 kWh/100 km at a distance of 12 km. Similar patterns were observed for this vehicle in other tests as well. The tested hybrid and electric vehicles exhibited a consistent decrease in average specific energy consumption with increasing distance under all analyzed test conditions.

3.2. CO2 Emissions

3.2.1. Impact of Cold Start on CO2 Emissions

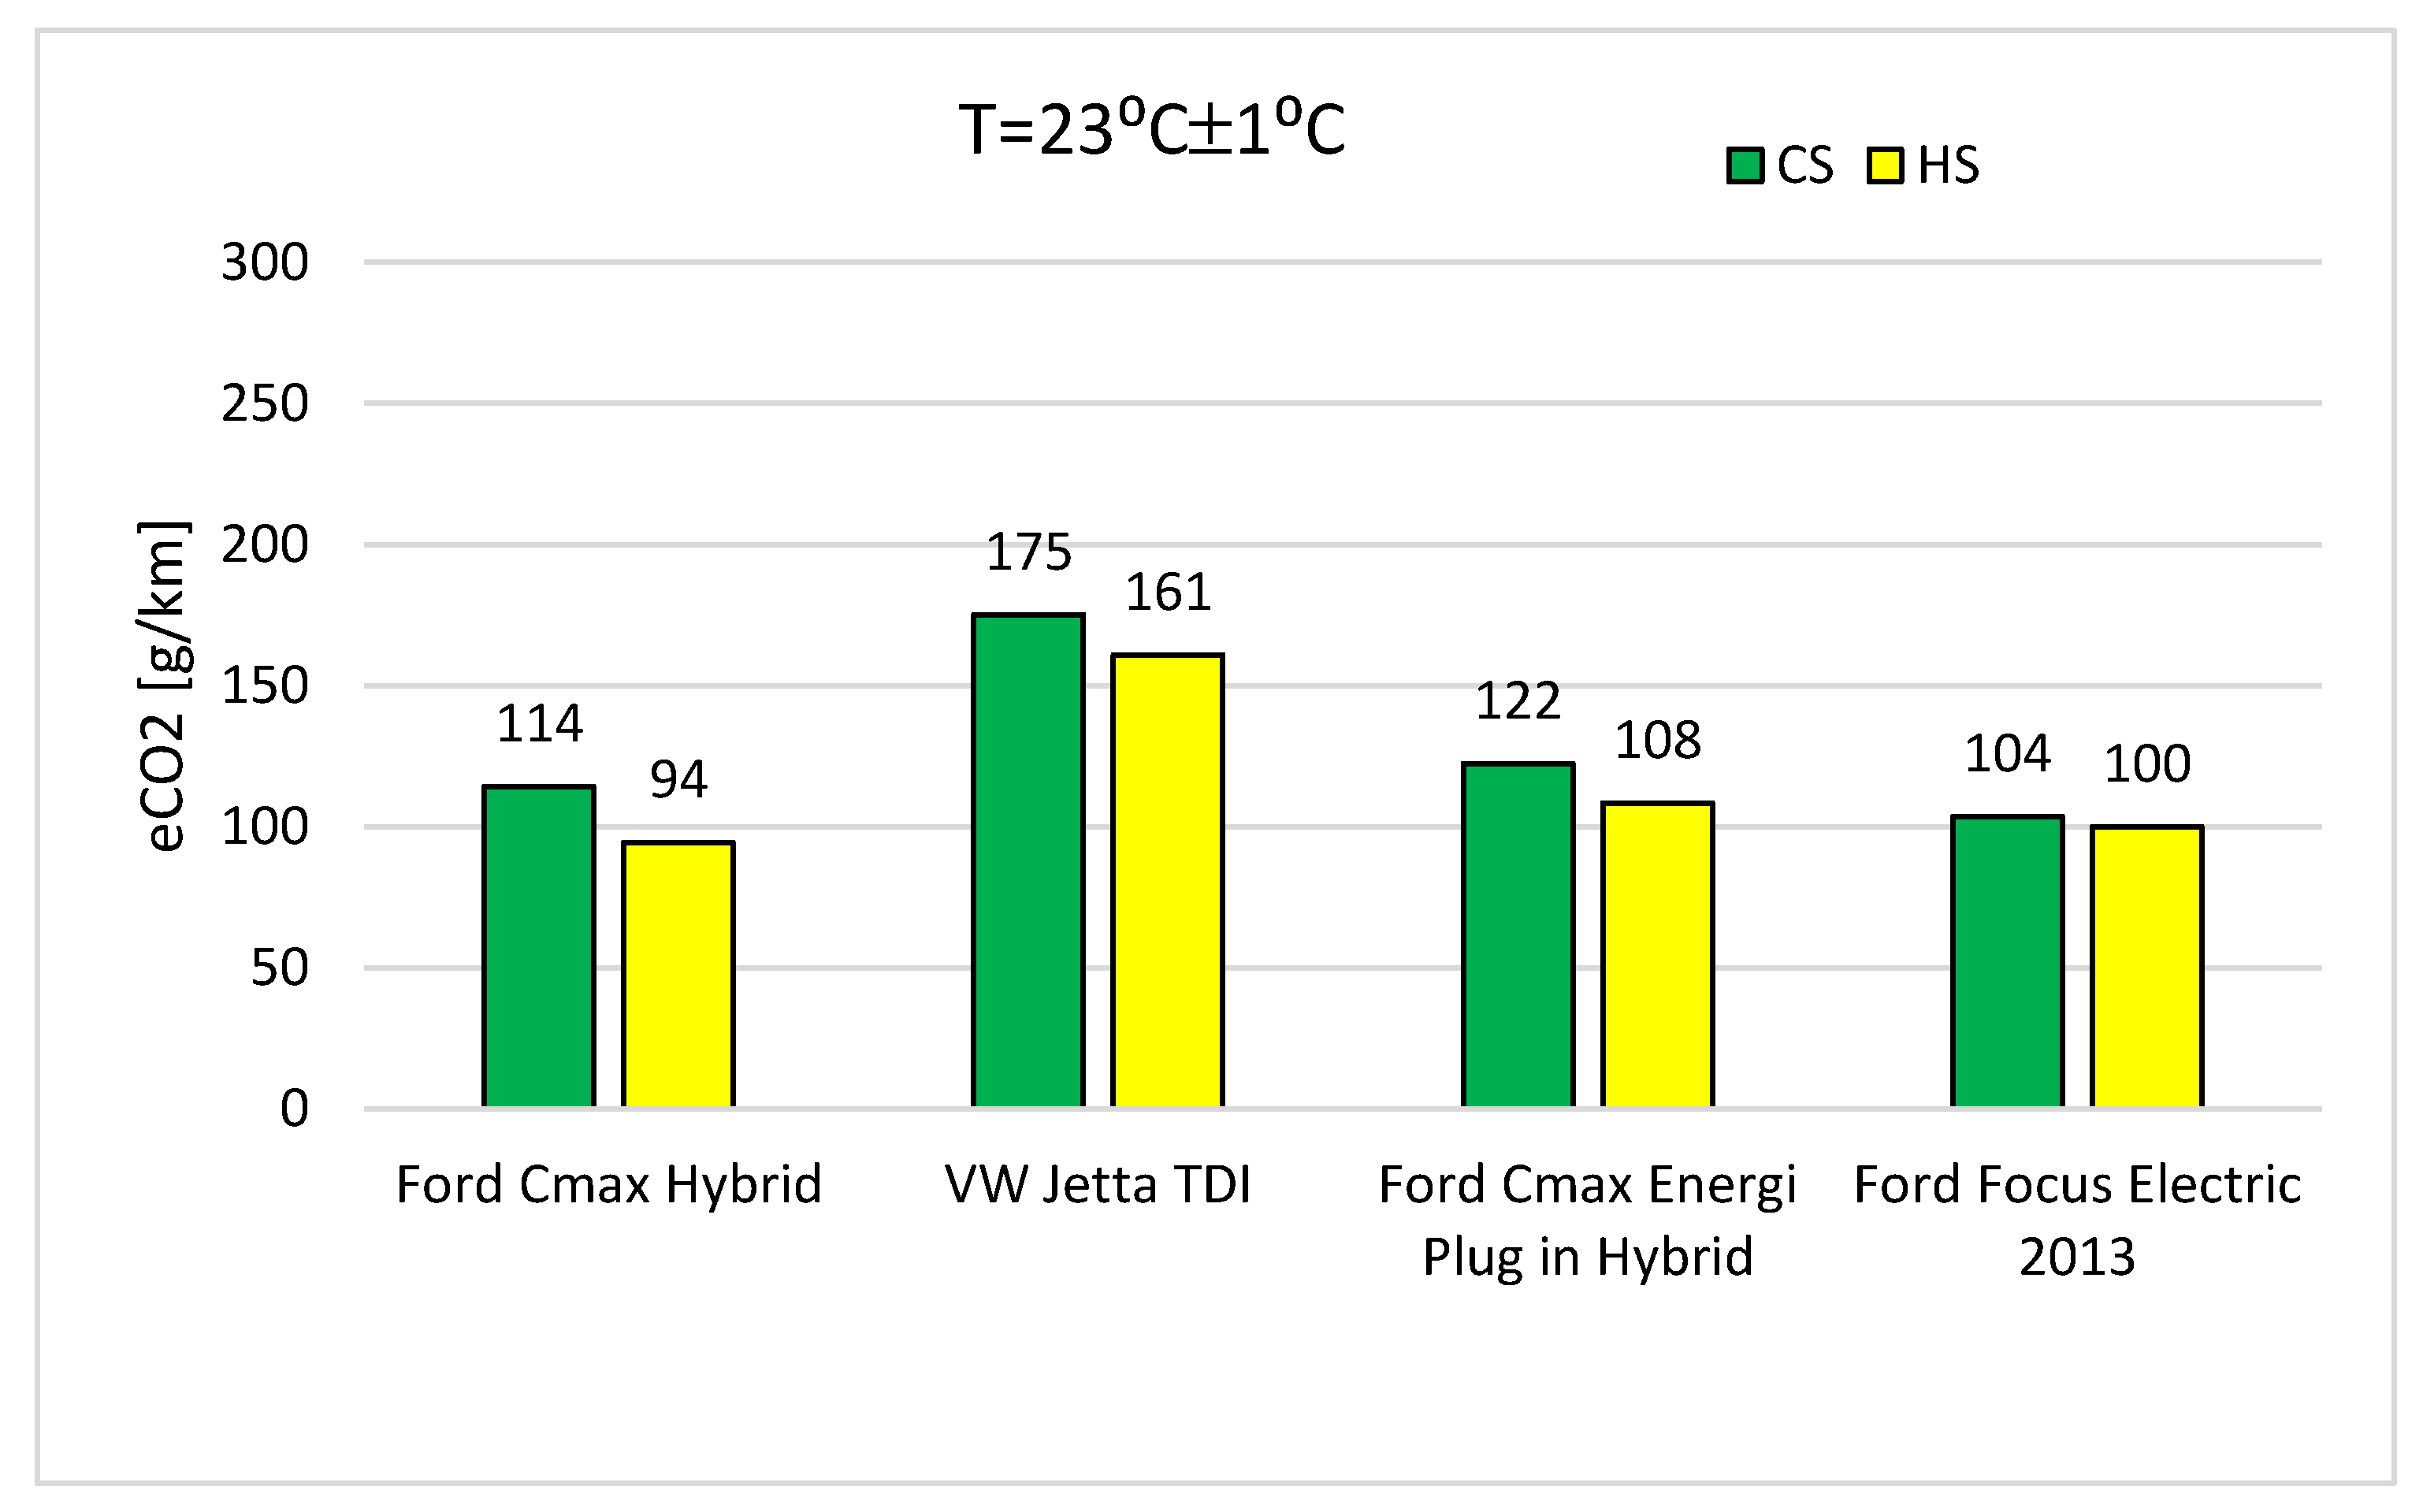
The results of the average on-road CO2 emissions in the UDDS cycle for the analyzed vehicles, depending on the engine thermal state (CS; HS) and for three ambient temperatures (−6 ± 1 °C, 23 ± 1 °C, and 36 ± 1 °C), are presented in Figure 11, Figure 12 and Figure 13. For hybrid vehicles, CO2 emissions were referenced, as in the case of energy consumption, to the emissions from exhaust gases associated with the fuel burned. For the electric vehicle, CO2 emissions were associated with electricity generation, transmission, and battery charging. The emission values were calculated using the emission factor for Poland provided by [62].
CO2 emissions are proportional to energy consumption. In the case of electric vehicles, they are associated with indirect emissions, which also depend on the energy sources and the energy mix of the power grid. For the purpose of calculating these emissions for the analyzed vehicle, both the emission factor for Poland [62] was used, and additional estimated CO2 emissions were calculated using emission factors for EU countries [8].
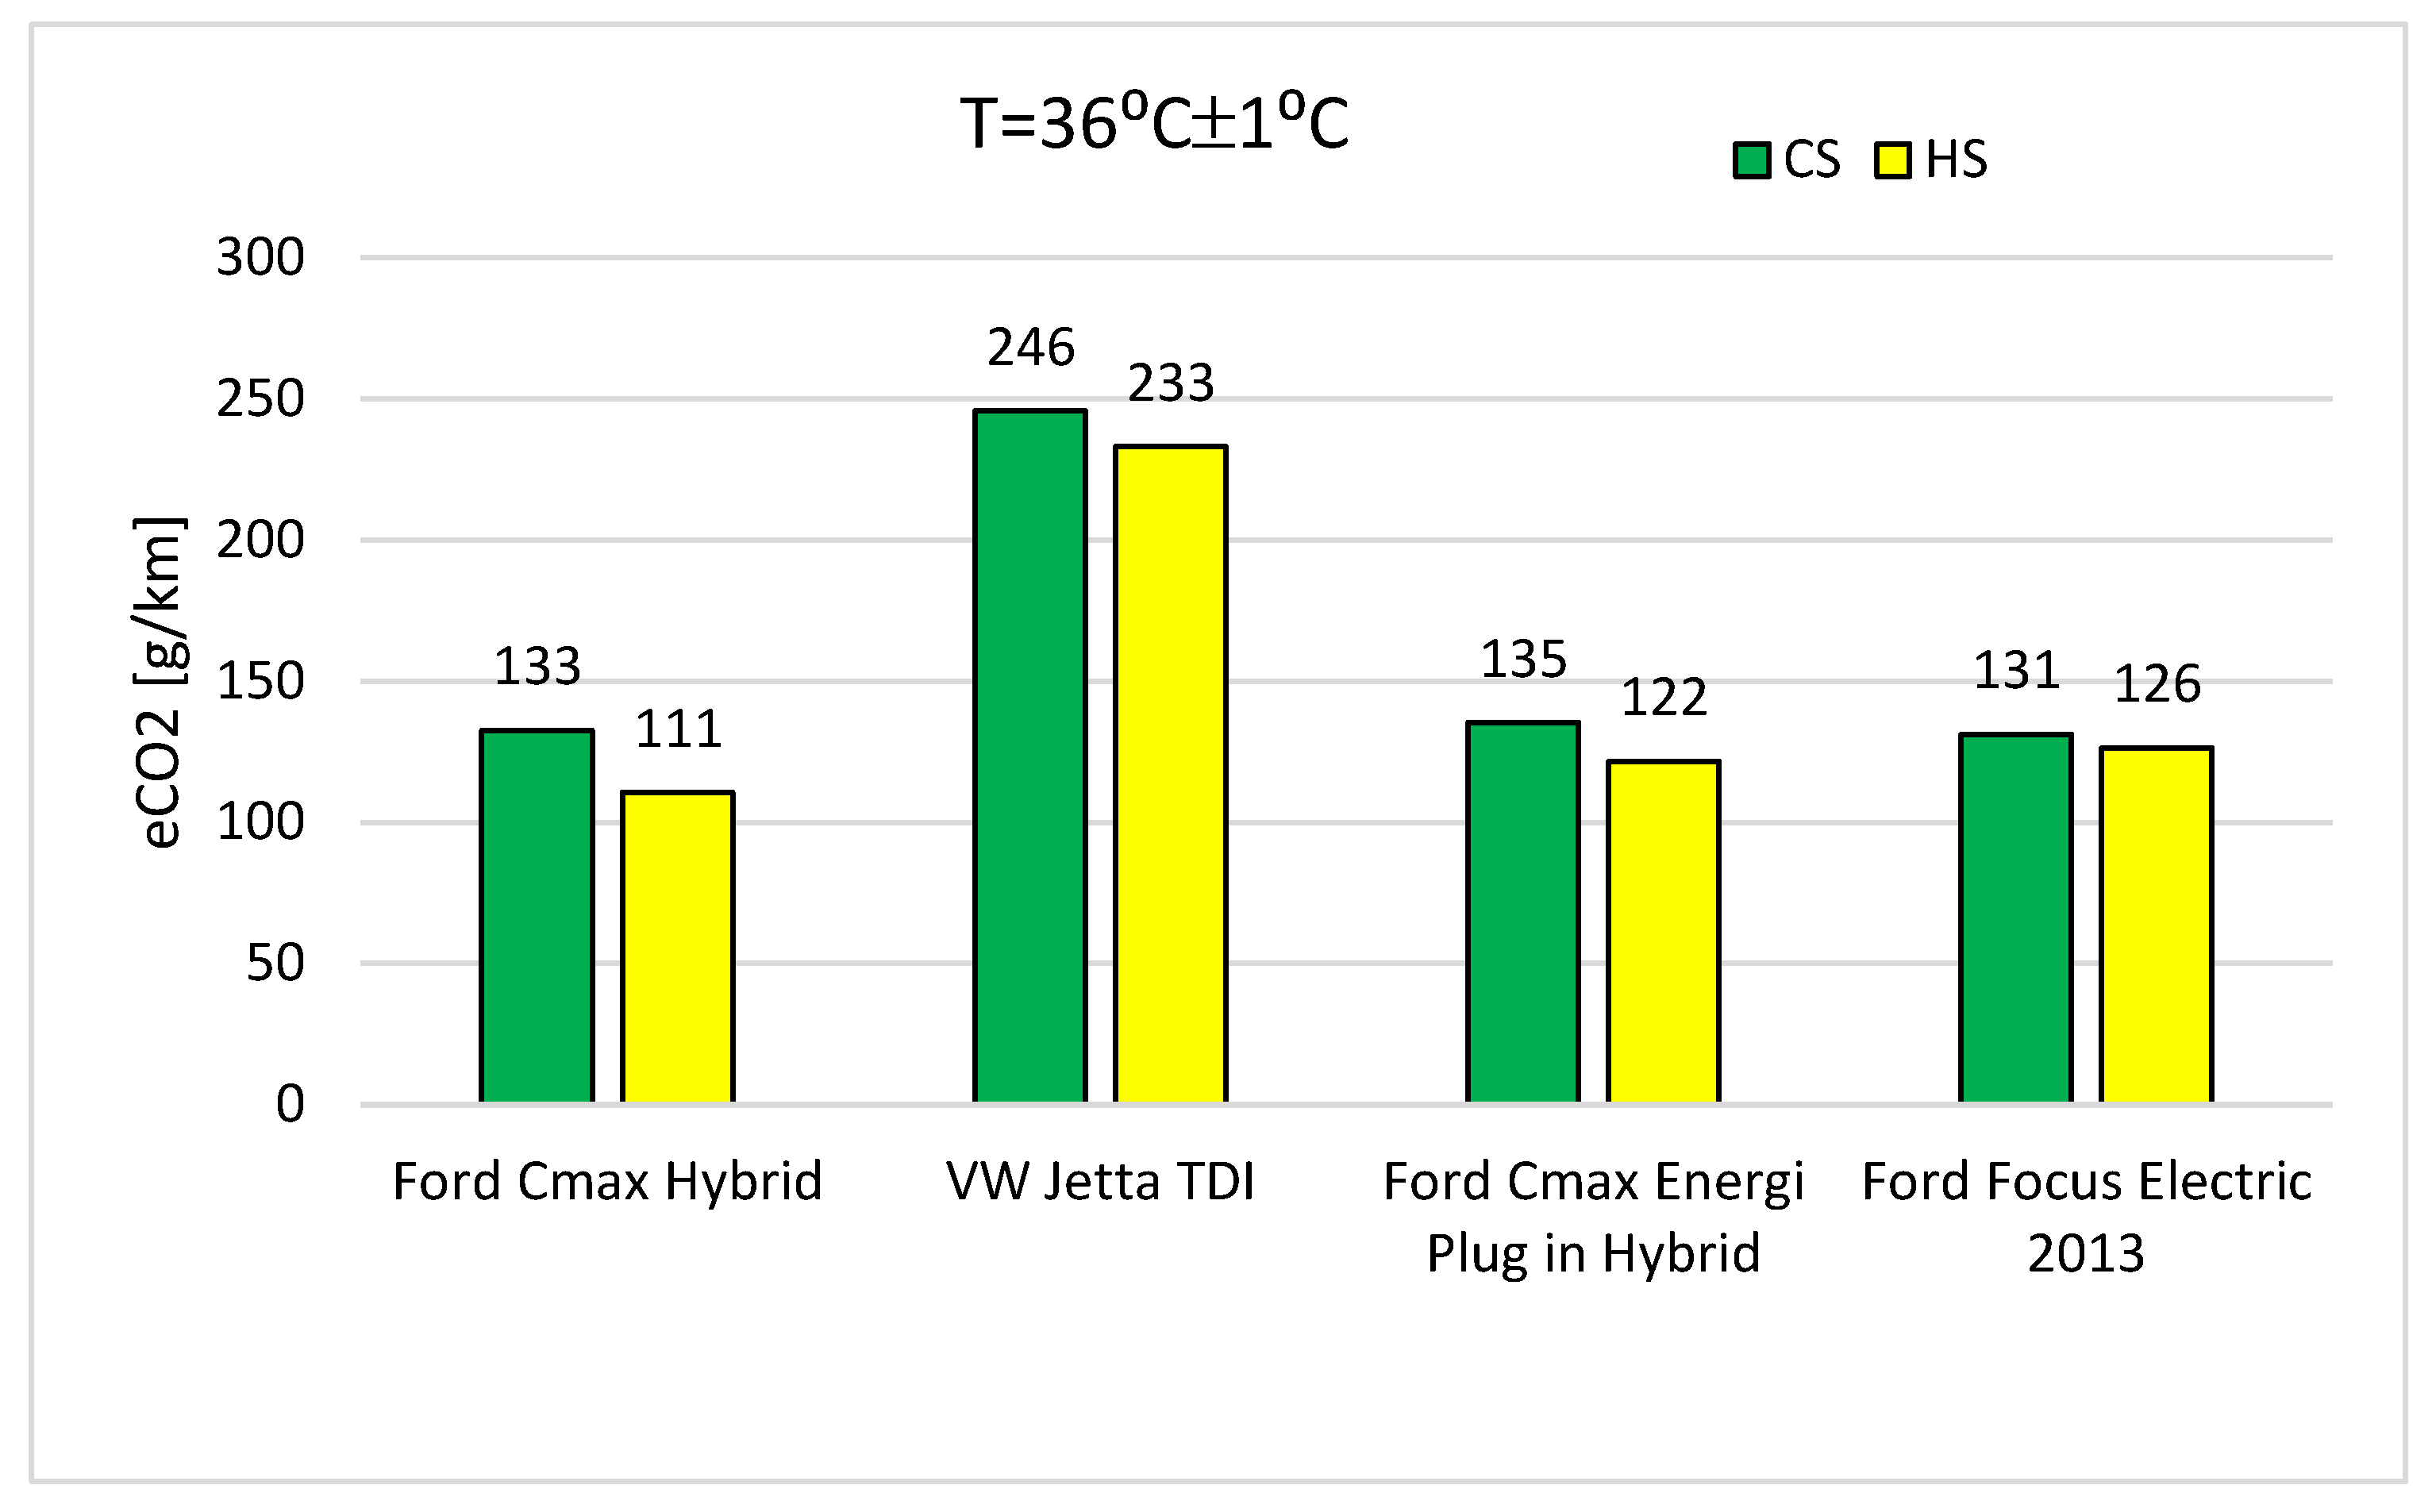
A comparison of the obtained on-road CO2 emission results shows that the internal combustion engine vehicle exhibited the highest emissions in the UDDS cycle. Under driving conditions at an ambient temperature of 36 ± 1 °C, the average CO2 emission value was approximately 246 g/km for the cold-start (CS) test and about 233 g/km for the hot-start (HS) test (Figure 13). For the other vehicles analyzed, CO2 emissions were significantly lower and amounted, respectively, to approximately 133 g/km (CS) and 111 g/km (HS) for the Ford C-Max Hybrid, about 135 g/km (CS) and 122 g/km (HS) for the Ford C-Max Energi, and approximately 131 g/km (CS) and 126 g/km (HS) for the Ford Focus Electric.
Considering the tests conducted at an ambient temperature of −6 ± 1 °C (Figure 11), the highest indirect CO2 emissions were observed for the analyzed electric vehicle, amounting to approximately 247 g/km for the cold-start (CS) test and about 203 g/km for the hot-start (HS) test. However, this is an estimated value and, as mentioned earlier, depends on the emission factor, which for Poland was assumed to be 685 kg CO2/MWh of electricity generated, based on data from [61]. The lowest CO2 emissions at −6 ± 1 °C were recorded for the Ford C-Max Hybrid, with values of approximately 195 g/km under CS conditions and about 126 g/km under HS conditions. The VW Jetta with an internal combustion engine also showed the highest emissions among vehicles equipped with combustion engines.
For the tests conducted at an ambient temperature of 23 ± 1 °C (Figure 12), the highest CO2 emissions were recorded for the VW Jetta with an internal combustion engine, with average UDDS cycle emissions of approximately 175 g/km for the cold-start (CS) test and about 161 g/km for the hot-start (HS) test. The lowest emissions in the CS test were observed for the Ford Focus Electric, with an average indirect CO2 emission value of approximately 104 g/km. In the HS test, the lowest emissions were recorded for the Ford C-Max Hybrid, at about 94 g/km.

3.2.2. Impact of Distance on CO2 Emissions

The results of the average on-road CO2 emissions for the analyzed vehicles, as a function of distance traveled from the start of the test in the UDDS cycle, are presented in Figure 14, Figure 15, Figure 16 and Figure 17 for three ambient temperatures (−6 ± 1 °C, 23 ± 1 °C, and 36 ± 1 °C). For the electric vehicle, CO2 emissions represent indirect emissions associated with the generation of electricity used for vehicle battery charging.
An analysis of the test results shows significant differences in both average on-road energy consumption and average on-road CO2 emissions, caused not only by variations in ambient temperature and the engine thermal state at the beginning of the drive, but also by the distance traveled.
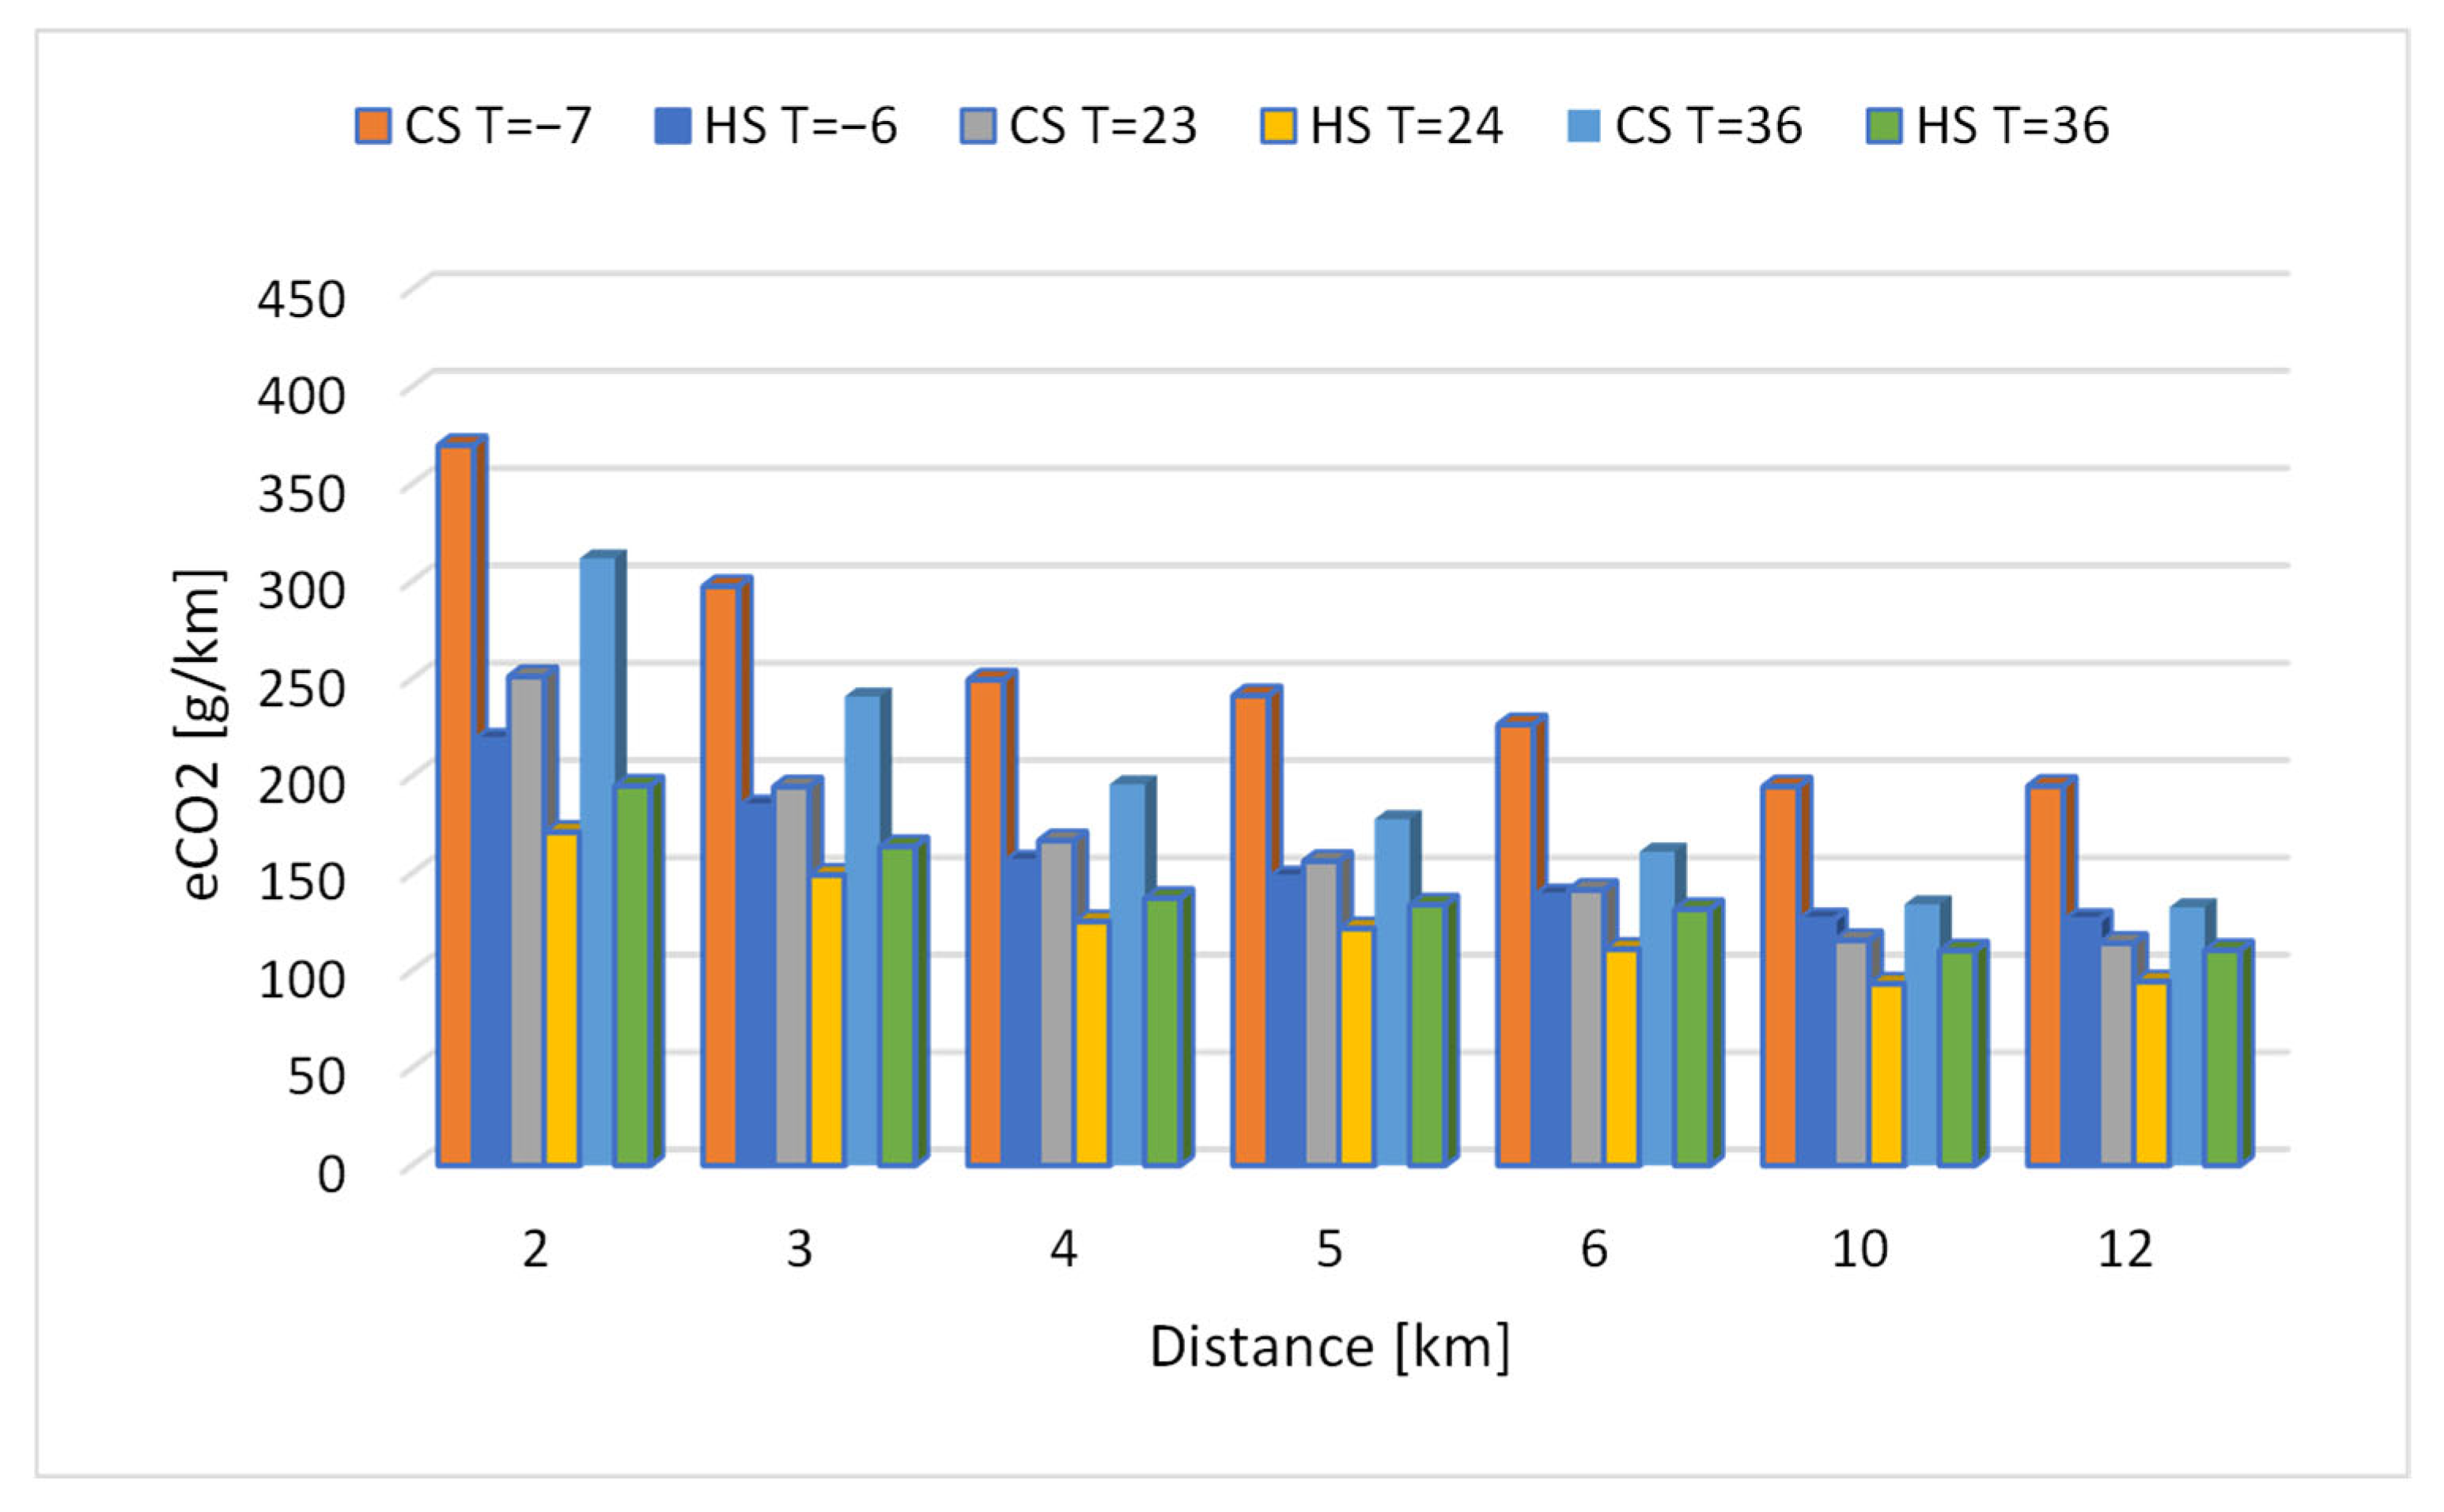
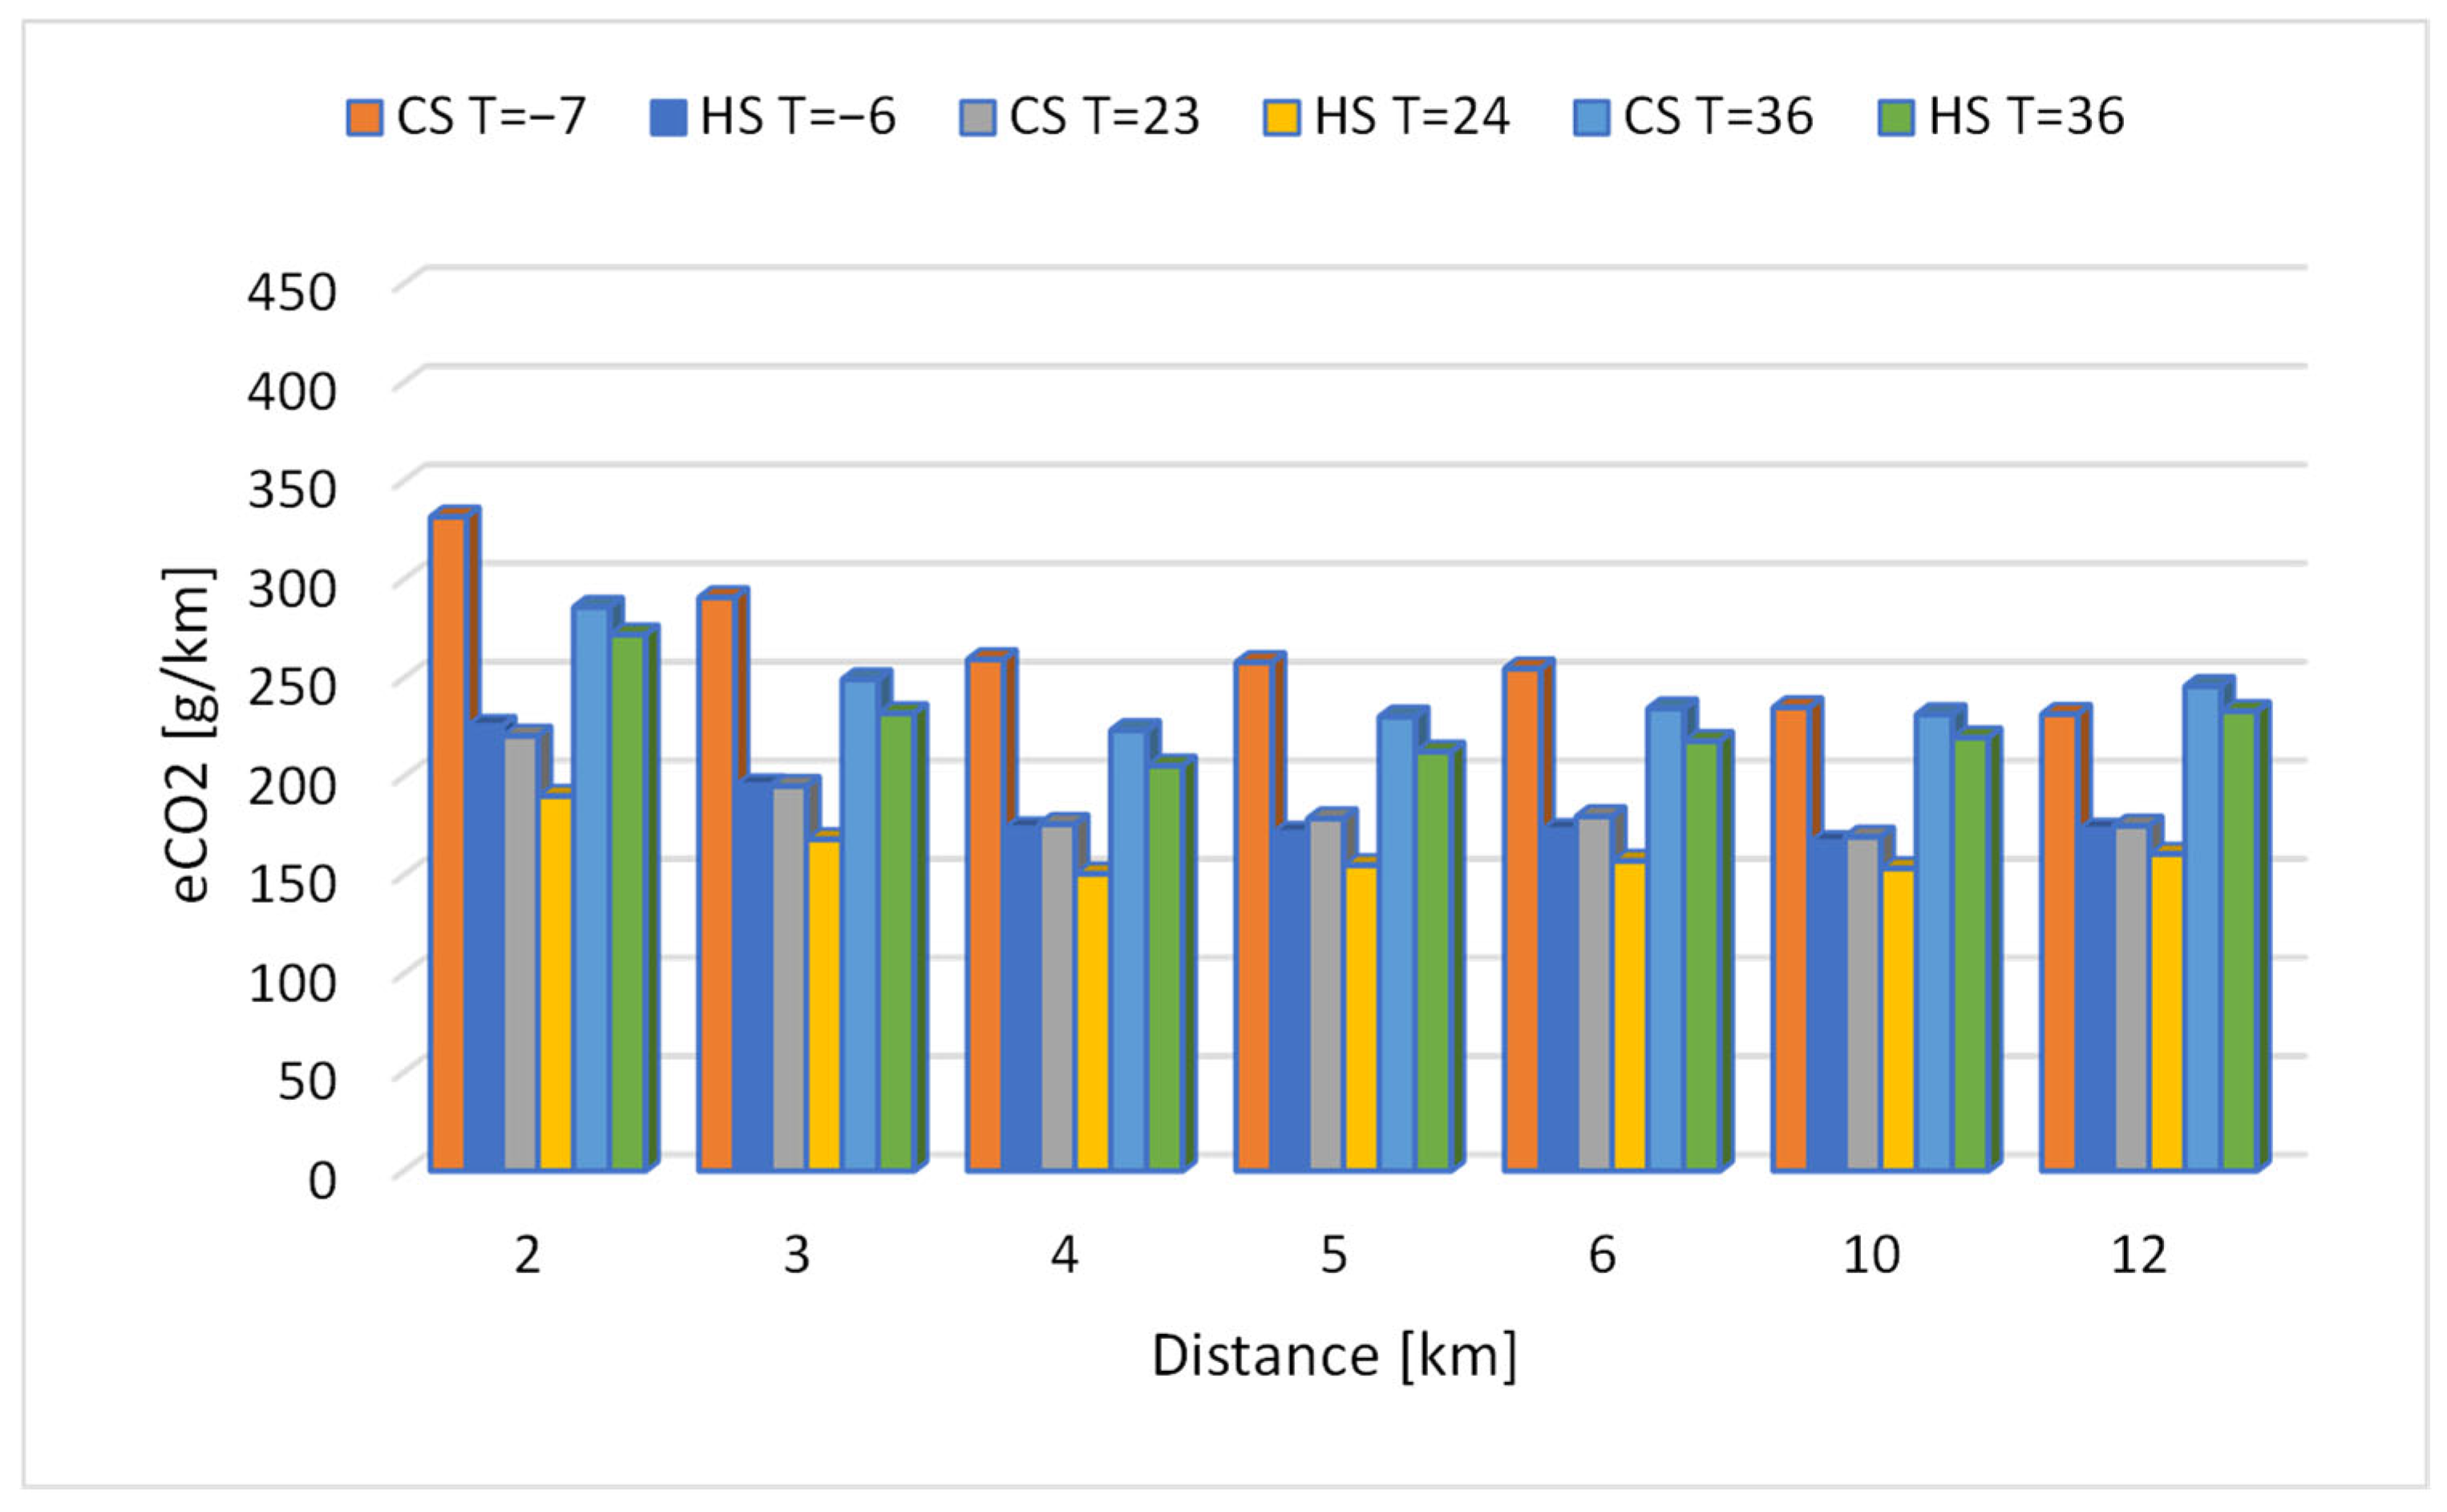
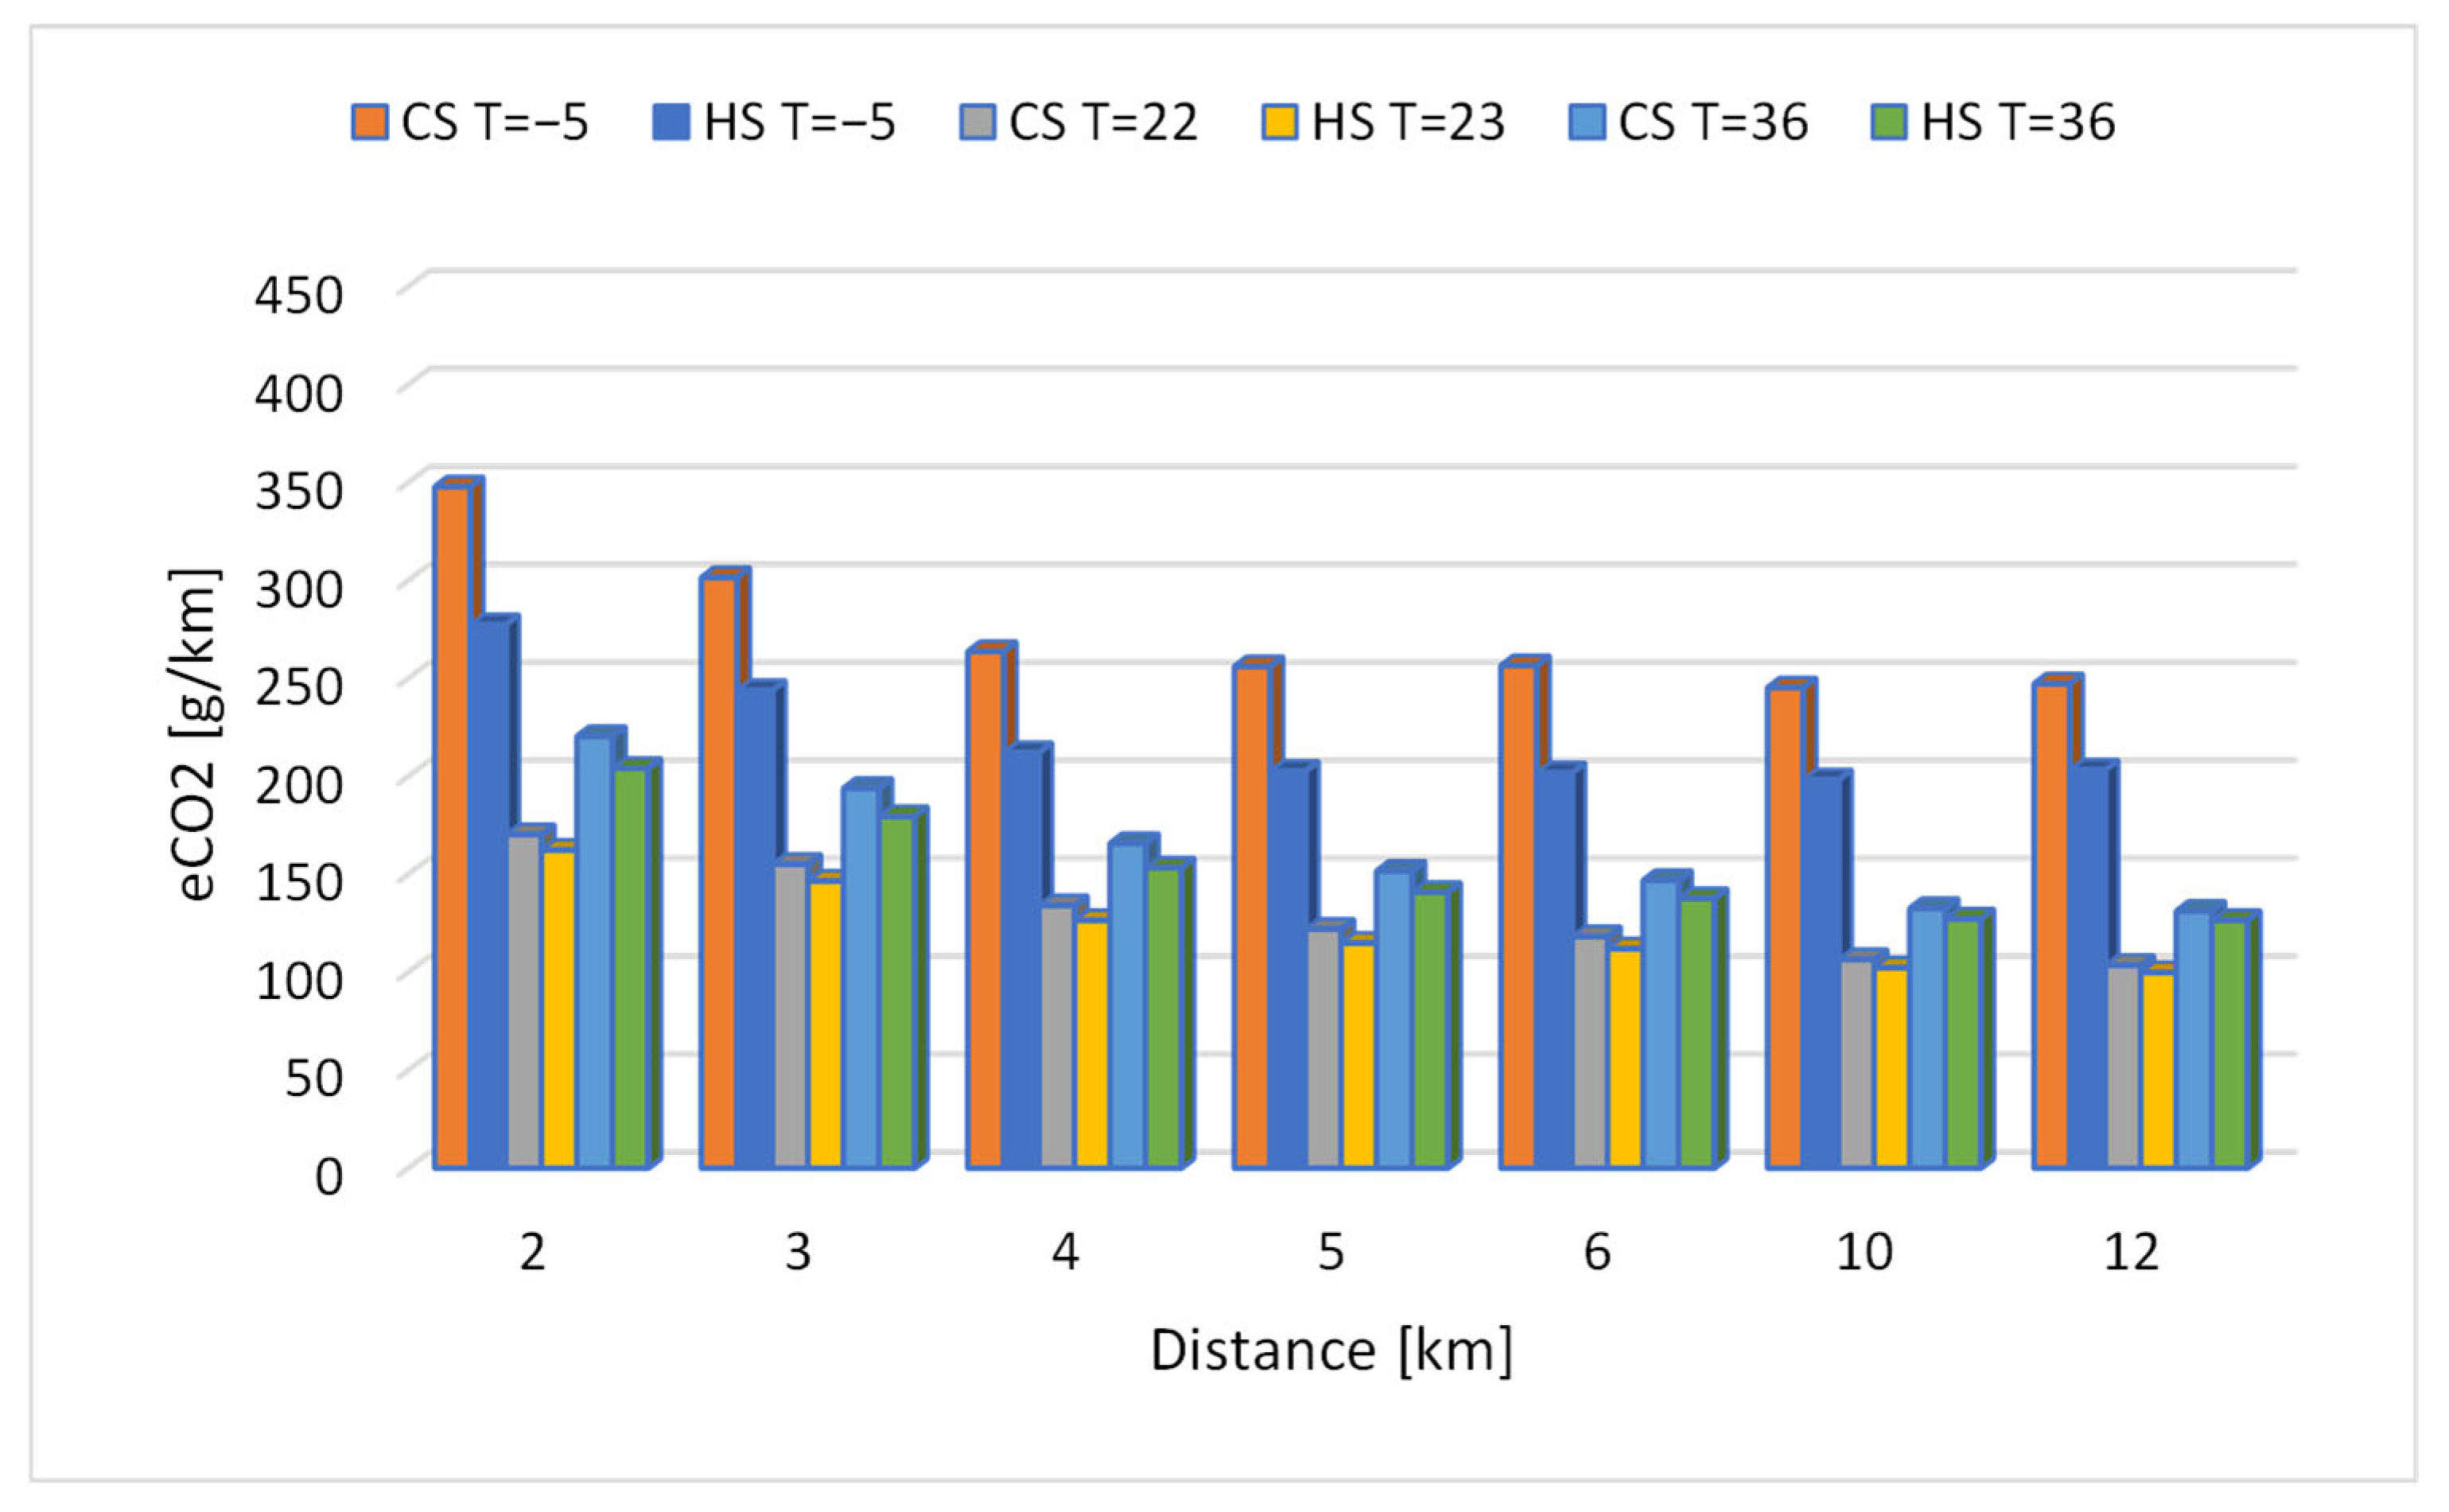
Similarly to energy consumption, CO2 emissions strongly depend on the distance traveled and decrease as the distance increases (Figure 14, Figure 15, Figure 16 and Figure 17). The highest CO2 emissions were observed for the Ford C-Max Energi in the cold-start (CS) test, reaching approximately 407 g/km for a distance of 2 km (Figure 16). Analogous to energy consumption, this value was about 81% higher compared to the emissions measured over a 12 km distance (approximately 224 g/km). Lower average emissions were recorded for the Ford C-Max Hybrid, for which CO2 emissions under CS conditions at −6 ± 1 °C (Figure 14) were approximately 369 g/km for a 2 km distance. Under the same ambient conditions, the VW Jetta recorded an average emission of about 332 g/km in the CS test over 2 km (Figure 15). For the Ford Focus Electric (Figure 17), under CS conditions at −6 ± 1 °C, the average indirect CO2 emissions for a 2 km distance were approximately 347 g/km.
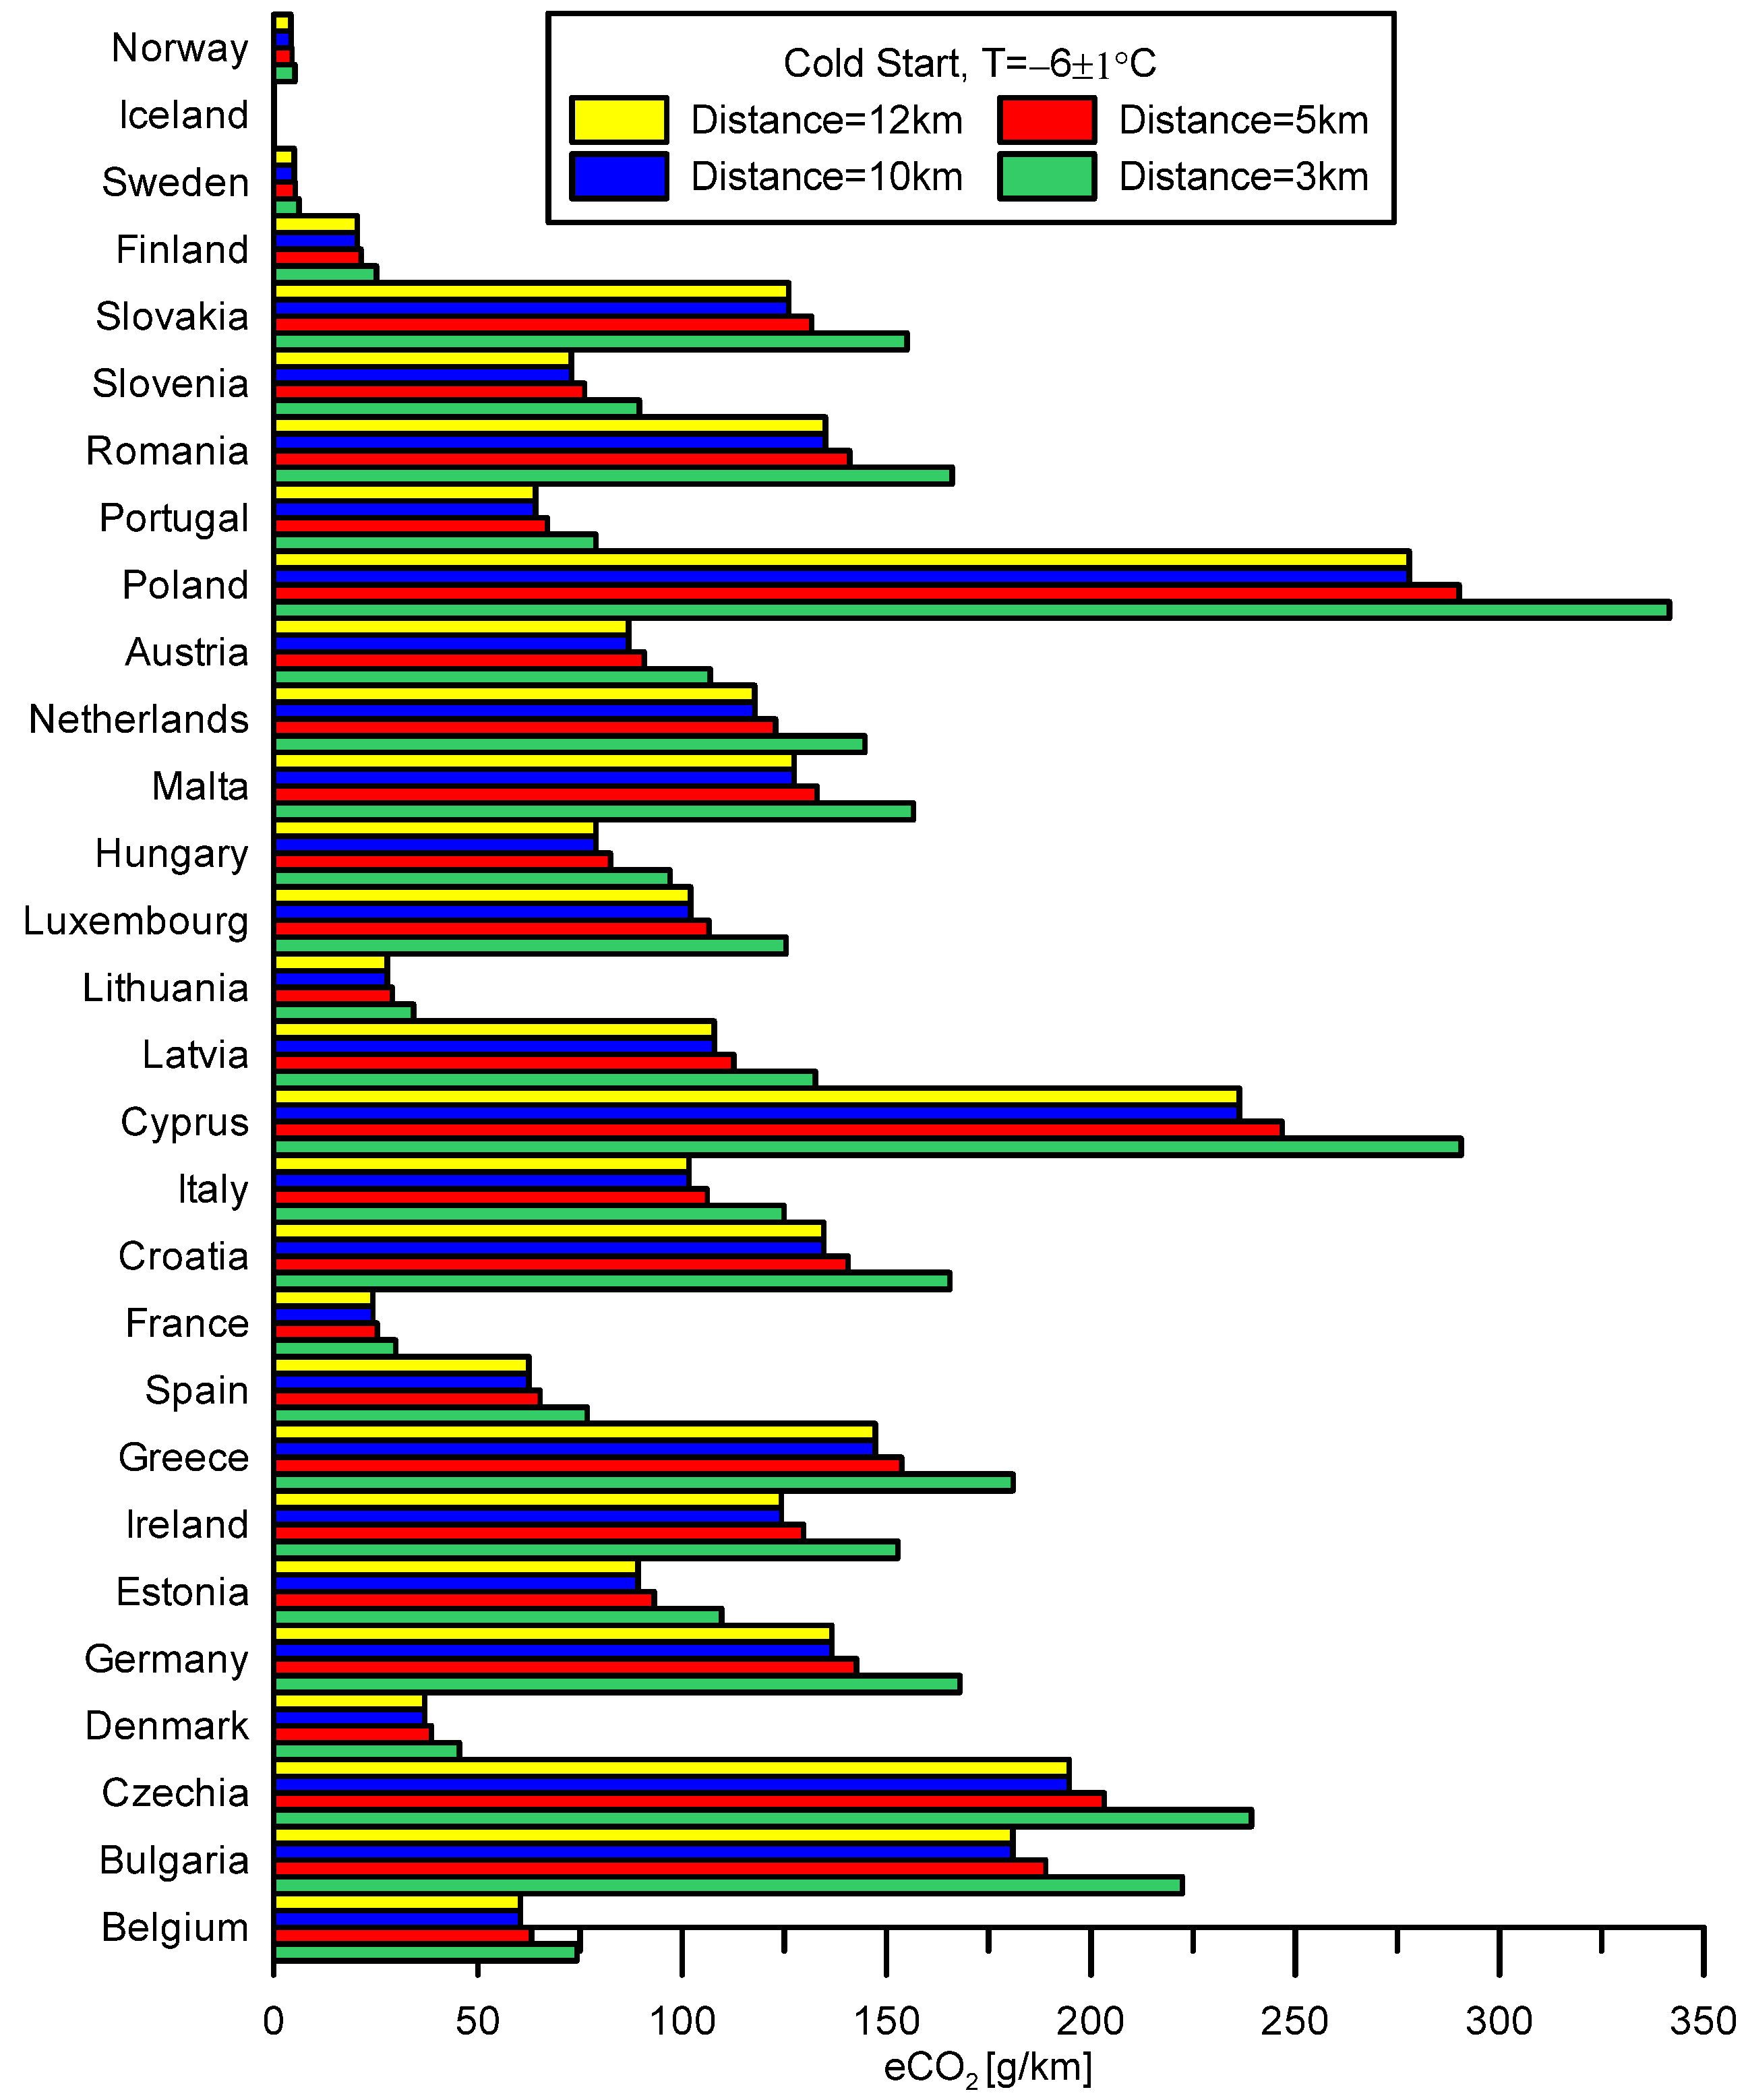
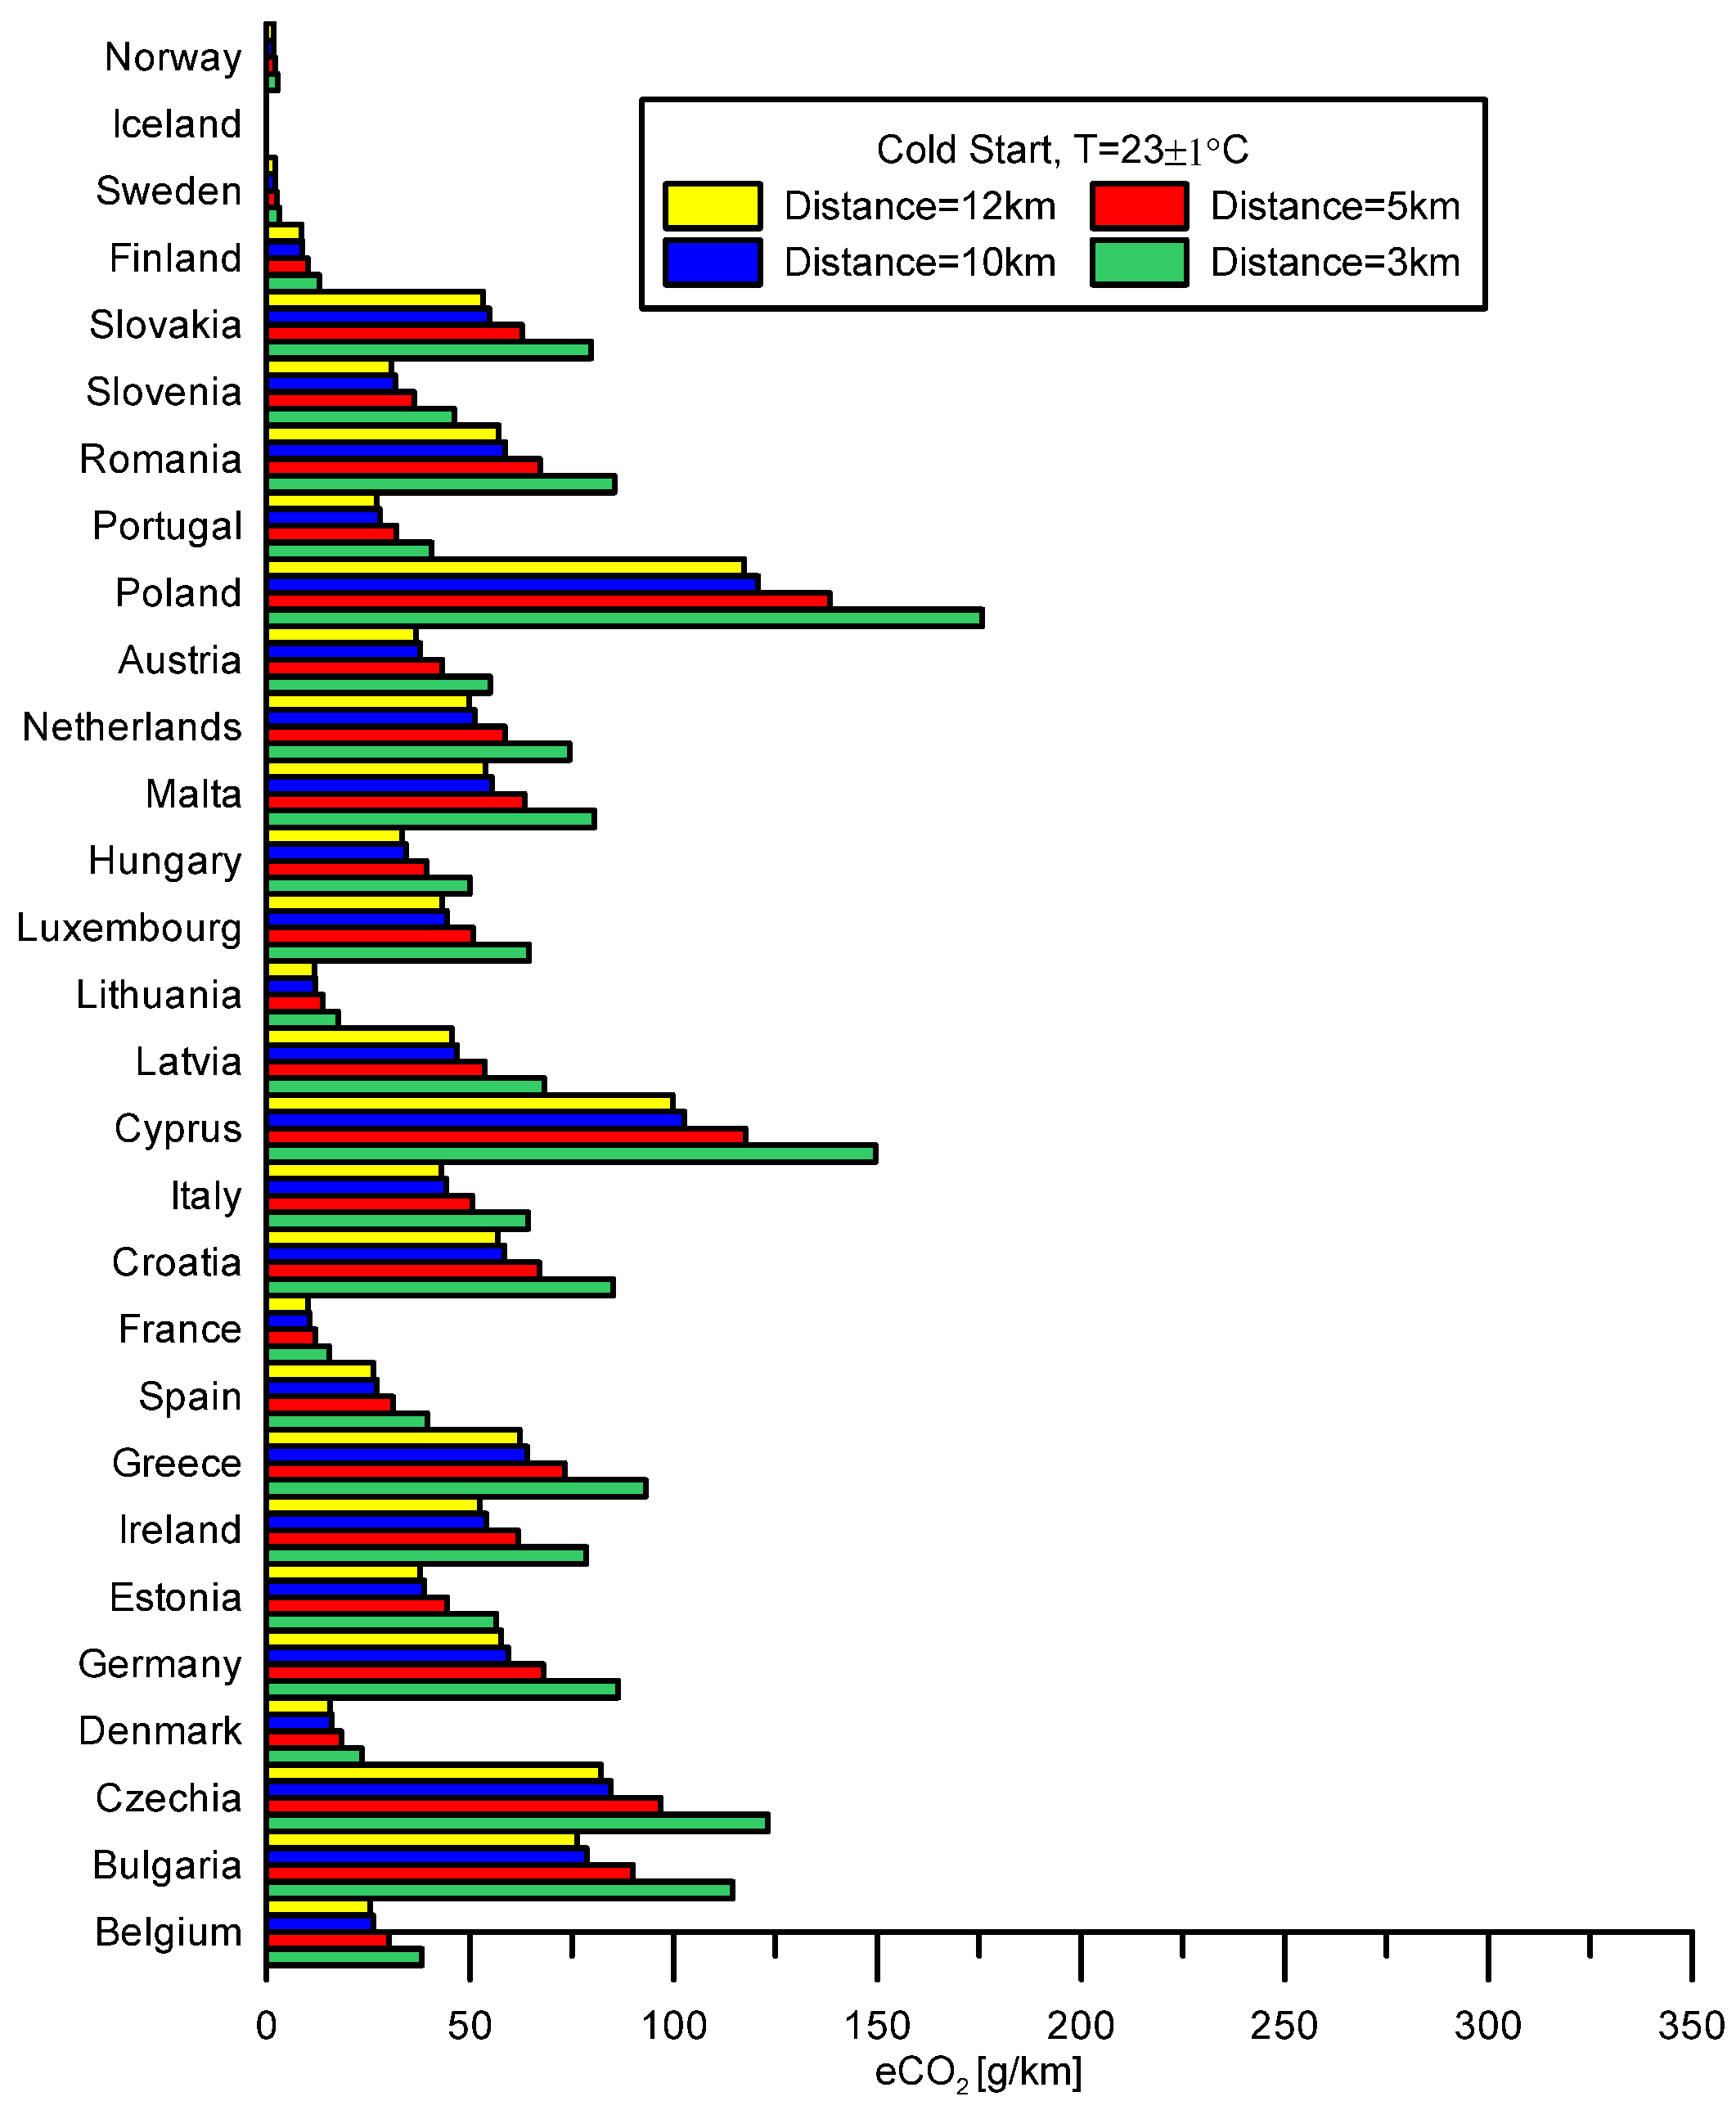
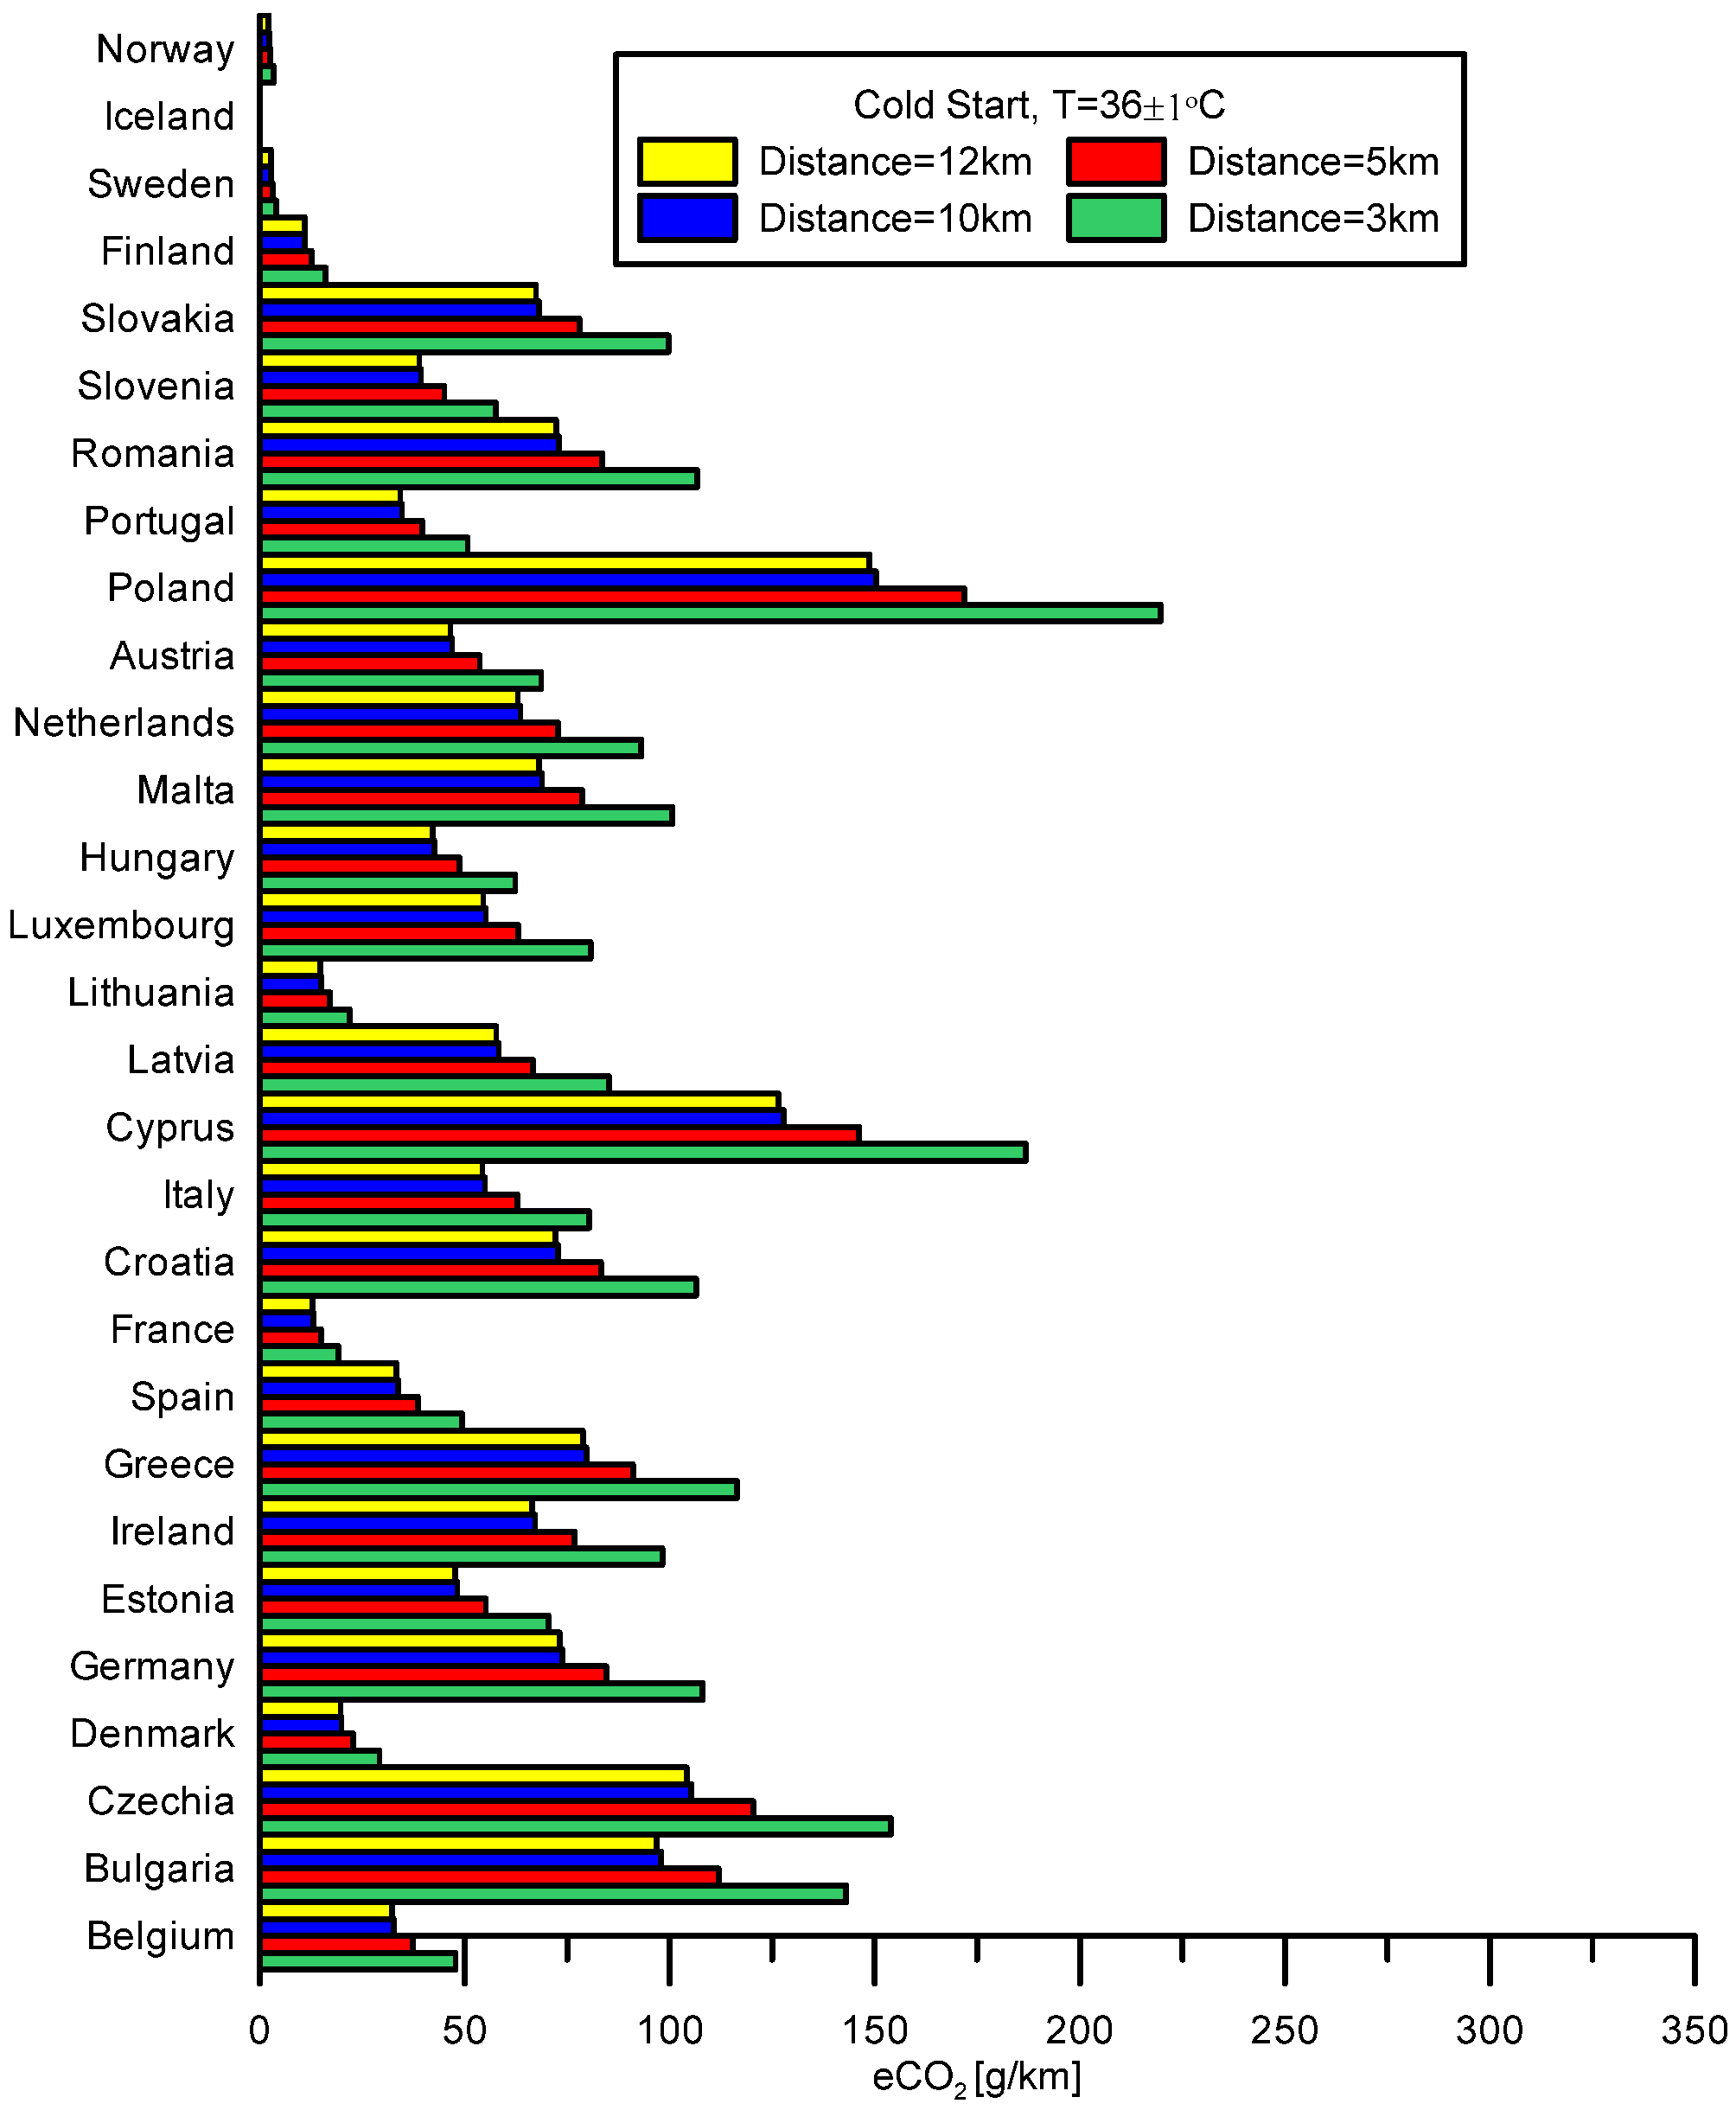
For electric vehicles, the indirect CO2 emissions associated with electricity generation vary significantly depending on the emission factors in individual EU countries [8]. For selected distances (3 km, 5 km, 10 km, and 12 km), calculations of the estimated emissions were carried out based on the respective electricity generation emission factors. The results are illustrated in Figure 18, Figure 19 and Figure 20.
A comparison of the estimated indirect CO2 emissions for the electric vehicle over selected distances in the cold-start (CS) tests (ambient temperature –6 ± 1 °C—Figure 18; ambient temperature 23 ± 1 °C—Figure 19; ambient temperature 36 ± 1 °C—Figure 20) shows that the differences among EU countries are substantial. The highest emissions were observed for Poland, while the lowest were recorded for Iceland. The estimated CO2 emission values for the analyzed distances and ambient temperatures are presented in Table A1, Table A2 and Table A3 in Appendix A. It should be noted, however, that these values were calculated based on emission factors from the most recent report, which provides the emission intensity data for EU countries for 2021. Considering the ongoing decarbonization of the electricity generation sector, current emission levels in individual countries would likely be lower. The objective of this study was to determine the extent to which ambient temperature, engine and vehicle component thermal state (including powertrain components, batteries, etc.), and distance traveled influence energy consumption and CO2 emissions.

4. Discussion

The analysis of the experimental results presented in this study revealed significant differences in energy consumption and CO2 emissions among vehicles equipped with different powertrains under simulated urban driving conditions in the UDDS cycle. A key factor strongly influencing both energy consumption and emissions—particularly over short driving distances—is the thermal state of the engine at the beginning of the test. For cold-start (CS) tests, energy consumption was consistently higher compared to hot-start (HS) conditions, with the largest differences observed during driving at a reduced ambient temperature (−6 °C). At this temperature, the internal combustion engine (ICE) vehicle exhibited the highest energy consumption over the entire UDDS cycle, while the battery-electric vehicle (BEV) showed the lowest. Among vehicles equipped with combustion engines, the CO2 emissions over the full UDDS cycle at this ambient temperature were also highest for the conventional ICE vehicle. However, when considering the indirect CO2 emissions associated with electricity generation for charging the battery of the analyzed electric vehicle, the resulting emission level—calculated using the Polish emission factor—was approximately 15 g/km higher in the cold-start UDDS cycle compared to the emissions of the internal combustion engine vehicle.
At ambient temperatures of approximately 23 °C and 36 °C, the conventional internal combustion vehicle exhibited significantly higher energy consumption and CO2 emissions over the entire UDDS cycle.
Considering shorter driving distances, higher energy consumption and greater CO2 emissions were observed as the distance decreased for the analyzed hybrid-electric and battery-electric vehicles. In the case of the internal combustion engine (ICE) vehicle, a decrease in energy consumption with increasing distance was observed across the entire UDDS cycle at ambient temperatures of approximately −6 °C and 23 °C. At an ambient temperature of about 36 °C, energy consumption decreased up to a distance of approximately 4 km and then increased. Similar trends were observed for CO2 emissions.
For the shortest distance of 2 km, the highest average on-road energy consumption—about 152 kWh/100 km (in the cold-start (CS) test at −6 °C)—was recorded for the plug-in hybrid vehicle. Under the same conditions, the average energy consumption of the battery-electric vehicle was about three times lower, at approximately 50 kWh/100 km. At a 2 km distance, the highest average CO2 emissions (about 407 g/km) were also observed for the plug-in hybrid vehicle. The lowest CO2 emissions at this distance under sub-zero ambient conditions (−6 °C) and cold-start operation were recorded for the conventional ICE vehicle, at approximately 332 g/km. However, the indirect CO2 emissions of the battery-electric vehicle under the same conditions were higher than those of the ICE vehicle, amounting to about 347 g/km.
Indirect CO2 emissions depend on the energy mix of a given country and, as confirmed by the analysis of EU countries using 2021 emission factors, they can vary significantly—from values close to zero (e.g., Iceland, Norway, Sweden) to very high levels (e.g., Poland, Cyprus, Bulgaria, Czechia).
To evaluate the significance of the impact of the engine thermal state and ambient temperature on energy consumption and CO2 emissions, Analysis of Variance (ANOVA) tests were conducted. The purpose of these tests was to determine whether statistically significant differences exist between the mean energy consumption values of the tested vehicles in UDDS cycle tests performed at different ambient temperatures (–6 ± 1 °C, 23 ± 1 °C, and 36 ± 1 °C) and depending on the engine thermal state (CS or HS), taking into account short distances (2, 3, 4, 5, 6, 10, and 12 km). The ANOVA test results are summarized in Table 3.
ANOVA results indicate that ambient temperature significantly affects energy consumption (CO2 emissions) in all analyzed cases. For all these tests, F-statistics and p-values confirm significance (p < 0.05). Similarly, the initial thermal state influences energy consumption, except for the BEV. For the Ford Focus Electric, the Thermal state factor has F = 1.6087, p = 0.212, indicating no significant effect.
A comparison of the average energy consumption values and the corresponding p-values is illustrated in Figure 21. Considering the engine thermal state (Figure 21a), the difference in the mean energy consumption values [kWh/100 km] between the cold-start and hot-start tests is the smallest for the electric vehicle. For the other vehicles, the influence of the engine thermal state on energy consumption (and consequently on CO2 emissions) is significant. The p-values were approximately 0.0037 for the Ford C-Max Energi plug-in hybrid, about 0.0004 for the Ford C-Max hybrid, and around 0.0014 for the VW Jetta TDI with an internal combustion engine.
Ambient temperature significantly affects vehicle energy consumption, regardless of the powertrain type (Figure 21b). The lowest p-value, p = 2.1 × 10⁻¹², was observed for the electric vehicle. Significant effects were also found for the other vehicles: p = 4.6 × 10⁻⁵ for the ICE vehicle (VW Jetta TDI), p = 0.0164 for the plug-in hybrid (Ford C-Max Energi), and p = 0.0223 for the hybrid (Ford C-Max).
For hybrid vehicles, particularly plug-in types, fuel consumption also depends on the state of charge (SOC) of the traction batteries when using grid electricity. At high SOC in charge-depleting mode, the internal combustion engine contribution is reduced, leading to lower fuel consumption and CO2 emissions.

5. Conclusions

The study demonstrates a clear advantage of electric drive under cold start conditions, particularly for short-distance trips. In summary, it can be concluded that short-distance trips (below 4 km) under cold-start conditions are the most unfavorable in terms of energy consumption and CO2 emissions, which can be significantly higher than the average operational values observed during longer trips (around 10 km). For short-distance driving, the use of battery-electric vehicles is the most advantageous option, as they are characterized by the lowest energy consumption and the least sensitivity to the reduced initial thermal state of the vehicle. These findings may also inform managers of urban transportation systems regarding the operation of vehicles over short distances.
The key limitations of the conducted analysis are related to the specific vehicles selected, the ambient temperatures, the Charge Sustaining operation of hybrid electric vehicles, and the use of the UDDS driving cycle, which differ from real-world operating conditions. Additional limitations include reliance on CO2 emission factors for both engine exhaust and grid electricity, evaluation of plug-in hybrids in charge-sustaining mode without accounting for grid electricity consumption, and the omission of factors such as wind, road surface variations, gradients, and cornering resistances. However, the primary objective of this study was to compare energy consumption and CO2 emissions of vehicles with different powertrains during short-distance driving, taking into account the thermal state and ambient temperature. Conducting such tests under real driving conditions (RDE) does not allow for the same level of precision and control as is achievable under laboratory conditions on a chassis dynamometer.

Author Contributions

Conceptualization, A.J.; methodology, A.J. and H.K.; software, A.J., H.K. and K.B.; validation, A.J., H.K. and K.B.; formal analysis, A.J.; investigation, A.J., H.K. and K.B.; resources, A.J., H.K. and K.B.; data curation, A.J.; writing—original draft preparation, A.J., H.K. and K.B.; writing—review and editing, A.J., H.K. and K.B.; visualization, A.J.; supervision, A.J. All authors have read and agreed to the published version of the manuscript.

Funding

This research received no external funding.

Data Availability Statement

The original contributions presented in this study are included in the article/Appendix A. Further inquiries can be directed to the corresponding author.

Acknowledgments

The authors express their gratitude to Argonne National Laboratory for providing the research results used in the analysis. This data is from the Downloadable Dynamometer Database (https://www.anl.gov/taps/downloadable-dynamometer-database (accessedon 2 January 2025)) and was generated at the Advanced Mobility Technology Laboratory (AMTL) at Argonne National Laboratory under the funding and guidance of the U.S. Department of Energy (DOE).

Conflicts of Interest

The authors declare no conflicts of interest.

Appendix A

Table A1. Estimated indirect CO2 emissions for the Ford Focus Electric, considering emission factors in EU countries in 2021 according to [8], for selected distances in the UDDS cycle at an ambient temperature of −6 ± 1 °C.
CountryIndirect CO2 Emission [g/km]
Distance = 3 kmDistance = 5 kmDistance = 10 kmDistance = 12 km
Belgium74.363.160.460.9
Bulgaria222.4188.9180.9182.4
Czechia239.3203.3194.7196.3
Denmark45.438.636.937.3
Germany168.0142.6136.6137.8
Estonia109.693.189.289.9
Ireland152.7129.7124.2125.3
Greece181.0153.7147.2148.4
Spain76.765.262.462.9
France29.925.424.324.5
Croatia165.5140.5134.6135.7
Italy124.9106.1101.6102.5
Cyprus290.6246.8236.4238.4
Latvia132.6112.6107.8108.7
Lithuania34.229.027.828.0
Luxembourg125.4106.5102.0102.9
Hungary97.082.478.979.6
Malta156.5132.9127.3128.4
Netherlands144.7122.9117.7118.7
Austria106.890.786.987.6
Poland341.6290.1277.9280.2
Portugal78.866.964.164.6
Romania166.0141.0135.0136.2
Slovenia89.576.072.873.4
Slovakia155.0131.6126.1127.1
Finland25.121.420.520.6
Sweden6.25.35.15.1
Iceland0.10.10.10.1
Norway5.24.44.24.3
Table A2. Estimated indirect CO2 emissions for the Ford Focus Electric, considering emission factors in EU countries in 2021 according to [8], for selected distances in the UDDS cycle at an ambient temperature of 23 ± 1 °C.
CountryIndirect CO2 Emission [g/km]
Distance = 3 kmDistance = 5 kmDistance = 10 kmDistance = 12 km
Belgium38.230.126.225.5
Bulgaria114.590.078.676.4
Czechia123.296.984.682.2
Denmark23.418.416.115.6
Germany86.468.059.457.7
Estonia56.444.438.737.6
Ireland78.661.854.052.4
Greece93.173.264.062.1
Spain39.531.127.126.3
France15.412.110.510.3
Croatia85.267.058.556.8
Italy64.350.644.142.9
Cyprus149.5117.6102.799.8
Latvia68.253.746.945.5
Lithuania17.613.812.111.7
Luxembourg64.550.844.343.1
Hungary49.939.334.333.3
Malta80.563.455.353.7
Netherlands74.458.651.149.7
Austria54.943.237.736.7
Poland175.8138.3120.7117.3
Portugal40.631.927.927.1
Romania85.467.258.757.0
Slovenia46.136.231.630.7
Slovakia79.762.754.853.2
Finland12.910.28.98.6
Sweden3.22.52.22.1
Iceland0.00.00.00.0
Norway2.72.11.81.8
Table A3. Estimated indirect CO2 emissions for the Ford Focus Electric, considering emission factors in EU countries in 2021 according to [8], for selected distances in the UDDS cycle at an ambient temperature of 36 ± 1 °C.
CountryIndirect CO2 Emission [g/km]
Distance = 3 kmDistance = 5 kmDistance = 10 kmDistance = 12 km
Belgium47.837.432.732.3
Bulgaria143.0111.997.896.8
Czechia153.9120.4105.3104.1
Denmark29.222.820.019.8
Germany108.084.573.973.1
Estonia70.555.148.247.7
Ireland98.276.867.266.5
Greece116.491.079.678.7
Spain49.338.633.733.4
France19.215.013.113.0
Croatia106.483.272.872.0
Italy80.362.854.954.4
Cyprus186.9146.2127.8126.4
Latvia85.366.758.357.7
Lithuania22.017.215.014.9
Luxembourg80.763.155.254.6
Hungary62.448.842.742.2
Malta100.778.768.868.1
Netherlands93.072.863.662.9
Austria68.753.747.046.5
Poland219.7171.8150.3148.7
Portugal50.739.634.734.3
Romania106.883.573.072.2
Slovenia57.645.039.439.0
Slovakia99.777.968.267.4
Finland16.212.611.110.9
Sweden4.03.12.72.7
Iceland0.00.00.00.0
Norway3.32.62.32.3

References

  1. Alhindawi, R.; Abu Nahleh, Y.; Kumar, A.; Shiwakoti, N. Projection of Greenhouse Gas Emissions for the Road Transport Sector Based on Multivariate Regression and the Double Exponential Smoothing Model. Sustainability 2020, 12, 9152. [Google Scholar] [CrossRef]
  2. Albuquerque, F.D.; Maraqa, M.A.; Chowdhury, R.; Mauga, T.; Alzard, M. Greenhouse gas emissions associated with road transport projects: Current status, benchmarking, and assessment tools. Transp. Res. Procedia 2020, 48, 2018–2030. [Google Scholar] [CrossRef]
  3. Ali, M.; Macioszek, E.; Onyelowe, K.; Yuen, C.W.; Arif, K. Interaction of activity travel, GHG emissions, and health parameters using R—A Step towards sustainable transportation system. Ain Shams Eng. J. 2024, 15, 103050. [Google Scholar] [CrossRef]
  4. Li, Y.; Ha, N.; Li, T. Research on Carbon Emissions of Electric Vehicles throughout the Life Cycle Assessment Taking into Vehicle Weight and Grid Mix Composition. Energies 2019, 12, 3612. [Google Scholar] [CrossRef]
  5. Zhang, W.; Li, Y.; Li, H.; Liu, S.; Zhang, J.; Kong, Y. Systematic review of life cycle assessments on carbon emissions in the transportation system. Environ. Impact Assess. Rev. 2024, 109, 107618. [Google Scholar] [CrossRef]
  6. Lu, Y.; Liu, Q.; Li, B.; Jiang, Q.; Li, Q. Energy mix-driven dynamic life cycle assessment on greenhouse gas emissions of passenger cars in China. J. Clean. Prod. 2024, 466, 142817. [Google Scholar] [CrossRef]
  7. Kocsis, D.; Kiss, J.T.; Arpad, I.W. Evaluating battery electric vehicle usage in the EU: A comparative study based on member state energy mixes. Heliyon 2024, 10, e30655. [Google Scholar] [CrossRef]
  8. Joana, B.; Fabio, M.-F.; Giulia, M. GHG Emission Factors for Electricity Consumption. European Commission, Joint Research Centre (JRC) PID. 2024. Available online: http://data.europa.eu/89h/919df040-0252-4e4e-ad82-c054896e1641 (accessed on 21 May 2024).
  9. European Commission. CO2 Emission Performance Standards for Cars and Vans. 2021. Available online: https://climate.ec.europa.eu/eu-action/transport/road-transport-reducing-co2-emissions-vehicles/co2-emission-performance-standards-cars-and-vans_en (accessed on 21 January 2024).
  10. Dornoff, J. CO2 Emission Standards for New Passenger Cars and Vans in the European Union; International Council on Clean Transportation: Washington, DC, USA, 2023; Available online: https://theicct.org/wp-content/uploads/2023/05/eu-co2-standards-cars-vans-may23.pdf (accessed on 9 January 2024).
  11. Twum-Duah, N.K.; Neves Mosquini, L.H.; Shahid, M.S.; Osonuga, S.; Wurtz, F.; Delinchant, B. The Indirect Carbon Cost of E-Mobility for Select Countries Based on Grid Energy Mix Using Real-World Data. Sustainability 2024, 16, 5883. [Google Scholar] [CrossRef]
  12. Mofolasayo, A. Assessing and Managing the Direct and Indirect Emissions from Electric and Fossil-Powered Vehicles. Sustainability 2023, 15, 1138. [Google Scholar] [CrossRef]
  13. Burchart, D.; Przytuła, I. Carbon Footprint of Electric Vehicles—Review of Methodologies and Determinants. Energies 2024, 17, 5667. [Google Scholar] [CrossRef]
  14. Messagie, M. Life Cycle Analysis of the Climate Impact of Electric Vehicles; Transport & Environment: Brussels, Belgium, 2020; Available online: https://www.transportenvironment.org/uploads/files/TE20-20draft20report20v04.pdf (accessed on 9 September 2025).
  15. Sobol, Ł.; Dyjakon, A. The Influence of Power Sources for Charging the Batteries of Electric Cars on CO2 Emissions during Daily Driving: A Case Study from Poland. Energies 2020, 13, 4267. [Google Scholar] [CrossRef]
  16. Ahmed, A.A.; Nazzal, M.A.; Darras, B.M.; Deiab, I.M. A Comprehensive Sustainability Assessment of Battery Electric Vehicles, Fuel Cell Electric Vehicles, and Internal Combustion Engine Vehicles through a Comparative Circular Economy Assessment Approach. Sustainability 2023, 15, 171. [Google Scholar] [CrossRef]
  17. Ali, Q.; Di Silvestre, M.L.; Lombardi, P.A.; Riva Sanseverino, E.; Zizzo, G. Electrifying the Road to Net-Zero: Implications of Electric Vehicles and Carbon Emission Coefficient Factors in European Power Systems. Sustainability 2024, 16, 5084. [Google Scholar] [CrossRef]
  18. Athanasopoulou, L.; Bikas, H.; Stavropoulos, P. Comparative Well-to-Wheel Emissions Assessment of Internal Combustion Engine and Battery Electric Vehicles. Procedia CIRP 2018, 78, 25–30. [Google Scholar] [CrossRef]
  19. Negri, M.; Bieker, G. Life-Cycle Greenhouse Gas Emissions from Passenger Cars in the European Union: A 2025 Update and Key Factors to Consider; International Council on Clean Transportation: Washington, DC, USA, 2025; Available online: https://theicct.org/wp-content/uploads/2025/07/ID-392-–-Life-cycle-GHG_report_final.pdf (accessed on 9 September 2025).
  20. Franzò, S.; Nasca, A. The environmental impact of electric vehicles: A novel life cycle-based evaluation framework and its applications to multi-country scenarios. J. Clean. Prod. 2021, 315, 128005. [Google Scholar] [CrossRef]
  21. Qing, G.; Xiang, Y.; Shang, Y.; Liu, X.; Zhou, H.; Huang, Y. Carbon footprint evaluation for electric vehicles considering green electricity trading. Renew. Energy 2024, 237, 121510. [Google Scholar] [CrossRef]
  22. Guo, B.; Hou, J.; Sun, A.; Song, F.; Jiang, Z. Beyond the average: Emissions from electricity and the implications of decarbonization policies in Guangdong. J. Clean. Prod. 2024, 480, 143911. [Google Scholar] [CrossRef]
  23. Joshua, R.K.A.; Subramanian, K.A. Comparative performance and emission analysis of internal combustion engine and battery electric vehicle under modified Indian drive cycle. Process Saf. Environ. Prot. 2024, 190 Pt B, 211–220. [Google Scholar] [CrossRef]
  24. Marczak, H.; Droździel, P. Analysis of Pollutants Emission into the Air at the Stage of an Electric Vehicle Operation. J. Ecol. Eng. 2021, 22, 182–188. [Google Scholar] [CrossRef] [PubMed]
  25. Guo, J.; Xie, D.; Jiang, Y.; Li, Y. A novel construction and evaluation framework for driving cycle of electric vehicles based on energy consumption and emission analysis. Sustain. Cities Soc. 2024, 117, 105951. [Google Scholar] [CrossRef]
  26. Abramek, K.F.; Gołębiewski, W.; Osipowicz, T.; Lewicki, W.; Klyus, O. Green Transformation of Transport on The Example of Emission Assessment of Carbon Dioxide (CO2) Emissions in Electric and Combustion Engine Vehicles During Operation. Commun. Int. Proc. 2023, 2023, 4238723. [Google Scholar] [CrossRef]
  27. Challa, R.; Kamath, D.; Anctil, A. Well-to-wheel greenhouse gas emissions of electric versus combustion vehicles from 2018 to 2030 in the US. J. Environ. Manag. 2022, 308, 114592. [Google Scholar] [CrossRef]
  28. Feng, Y.; Yang, J.; Dong, Z. Fuel Selections for Electrified Vehicles: A Well-to-Wheel Analysis. World Electr. Veh. J. 2021, 12, 151. [Google Scholar] [CrossRef]
  29. Ramírez-Díaz, A.J.; Ramos-Real, F.J.; Barrera-Santana, J. Well-to-Wheels for Light-Duty Vehicle Powertrains by Segments in Isolated Systems. Energies 2023, 16, 1018. [Google Scholar] [CrossRef]
  30. Qian, S.; Li, L. A Comparison of Well-to-Wheels Energy Use and Emissions of Hydrogen Fuel Cell, Electric, LNG, and Diesel-Powered Logistics Vehicles in China. Energies 2023, 16, 5101. [Google Scholar] [CrossRef]
  31. Kuyumcu, A.M.; Bingül, B.; Akar, F.; Yıldız, A. Well-to-wheel carbon footprint and cost analysis of gasoline, diesel, hydrogen ICE, hybrid and fully electric city buses. Energy 2024, 301, 131685. [Google Scholar] [CrossRef]
  32. Fandi, G.; Novák, J.; Chyský, J.; Šrom, J. Review and modeling on hydrogen fuel cells electric vehicle (HFCEV), in comparison with battery electrical vehicle (BEV) using MATLAB environment. Case study: Postal car. Energy Convers. Manag. X 2024, 24, 100684. [Google Scholar] [CrossRef]
  33. Xu, F.; Crawford, C.; Feng, Y.; Lin, Z.; Li, S. Environment-economic analysis of diesel, hybrid electric, plug-in hybrid electric trucks in China. Transp. Res. Part D: Transp. Environ. 2023, 117, 103661. [Google Scholar] [CrossRef]
  34. Dong, Y.; Guo, X.; Wang, M.; Xu, J. Modeling carbon intensity of electric vehicles in the well-to-wheels phase under different traffic flow conditions. iScience 2024, 27, 111070. [Google Scholar] [CrossRef] [PubMed]
  35. Jaworski, A.; Mądziel, M.; Lew, K.; Campisi, T.; Woś, P.; Kuszewski, H.; Wojewoda, P.; Ustrzycki, A.; Balawender, K.; Jakubowski, M. Evaluation of the Effect of Chassis Dynamometer Load Setting on CO2 Emissions and Energy Demand of a Full Hybrid Vehicle. Energies 2022, 15, 122. [Google Scholar] [CrossRef]
  36. Joint Research Centre; Pasaoglu, G.; Fiorello, D.; Martino, A.; Scarcella, G.; Alemanno, A.; Zubaryeva, A.; Thiel, C. Driving and Parking Patterns of European Car Drivers—A Mobility Survey; JRC Publications: Ispra, Italy, 2012; Available online: https://www.google.com/url?sa=t&source=web&rct=j&opi=89978449&url=https://publications.jrc.ec.europa.eu/repository/bitstream/JRC77079/driving%2520and%2520parking%2520patterns%2520-%2520final_online.pdf&ved=2ahUKEwjR9NTGppSQAxVGX_EDHSlhNIEQFnoECC0QAQ&usg=AOvVaw1JpsGVV6nyaKUMpC5RFKt8 (accessed on 2 January 2024).
  37. Jaworski, A.; Kuszewski, H.; Ustrzycki, A.; Balawender, K.; Lejda, K.; Woś, P. Analysis of the repeatability of the exhaust pollutants emission research results for cold and hot starts under controlled driving cycle conditions. Environ. Sci. Pollut. Res. 2018, 25, 17862–17877. [Google Scholar] [CrossRef]
  38. Jaworski, A.; Mądziel, M.; Kuszewski, H.; Lejda, K.; Balawender, K.; Jaremcio, M.; Jakubowski, M.; Wojewoda, P.; Lew, K.; Ustrzycki, A. Analysis of Cold Start Emission from Light Duty Vehicles Fueled with Gasoline and LPG for Selected Ambient Temperatures; SAE Technical Paper 2020-01-2207; SAE International: Warrendale, PA, USA, 2020. [Google Scholar] [CrossRef]
  39. Pielecha, J.; Merkisz, J.; Kurtyka, K.; Skobiej, K. Cold start emissions of passenger cars with gasoline and diesel engines in Real Driving Emissions tests. Combust. Engines 2019, 179, 160–168. [Google Scholar] [CrossRef]
  40. Pielecha, J.; Skobiej, K.; Kurtyka, K. Testing and evaluation of cold-start emissions from a gasoline engine in RDE test at two different ambient temperatures. Open Eng. 2021, 11, 425–434. [Google Scholar] [CrossRef]
  41. Hu, J.; Frey, H.C.; Boroujeni, B.Y. Contribution of Cold Starts to Real-World Trip Emissions for Light-Duty Gasoline Vehicles. Atmosphere 2023, 14, 35. [Google Scholar] [CrossRef]
  42. Lijewski, P.; Kozak, M.; Fuć, P.; Rymaniak, Ł.; Ziółkowski, A. Exhaust emissions generated under actual operating conditions from a hybrid vehicle and an electric one fitted with a range extender. Transp. Res. Part D Transp. Environ. 2020, 78, 102183. [Google Scholar] [CrossRef]
  43. Bieniek, A.; Graba, M.; Mamala, J.; Prażnowski, K.; Hennek, K. Energy consumption of a passenger car with a hybrid powertrain in real traffic conditions. Combust. Engines 2022, 191, 15–22. [Google Scholar] [CrossRef]
  44. Skuza, A.; Szumska, E.M.; Jurecki, R.; Pawelec, A. Modeling the Impact of Traffic Parameters on Electric Vehicle Energy Consumption. Energies 2024, 17, 5423. [Google Scholar] [CrossRef]
  45. Jung, H.; Silva, R.; Han, M. Scaling Trends of Electric Vehicle Performance: Driving Range, Fuel Economy, Peak Power Output, and Temperature Effect. World Electr. Veh. J. 2018, 9, 46. [Google Scholar] [CrossRef]
  46. Parker, N.C.; Kuby, M.; Liu, J.; Stechel, E.B. Extreme heat effects on electric vehicle energy consumption and driving range. Appl. Energy 2025, 380, 125051. [Google Scholar] [CrossRef]
  47. Ansari, A.; Abediasl, H.; Shahbakhti, M. Ambient Temperature Effects on Energy Consumption and CO2 Emissions of a Plug-in Hybrid Electric Vehicle. Energies 2024, 17, 3566. [Google Scholar] [CrossRef]
  48. Graba, M.; Mamala, J.; Bieniek, A.; Augustynowicz, A.; Czernek, K.; Krupińska, A.; Włodarczak, S.; Ochowiak, M. Assessment of Energy Demand for PHEVs in Year-Round Operating Conditions. Energies 2023, 16, 5571. [Google Scholar] [CrossRef]
  49. Szumska, E.M.; Jurecki, R.S. Parameters Influencing on Electric Vehicle Range. Energies 2021, 14, 4821. [Google Scholar] [CrossRef]
  50. Seo, J.; Vijayagopal, R.; Kim, N.; Rousseau, A.; Stutenberg, K. Effects of ambient temperature on electric vehicle range considering battery Performance, powertrain Efficiency, and HVAC load. Energy Convers. Manag. 2023, 326, 119493. [Google Scholar] [CrossRef]
  51. Walsh, P.; Isaac, R.; Vijayagopal, R.; Rousseau, A.; Seo, J.; Kim, N. Impact of Cold Ambient Temperature and Extreme Conditions on Electric Vehicles. 2024. Available online: https://www.energy.gov/sites/default/files/2024-10/Impact_of_Cold_Ambient_Temperature_on_BEV_Performance_v15_TechEditFinal_12Sep2024__0.pdf (accessed on 7 September 2025).
  52. Bao, J.; Mao, Y.; Zhang, Y.; Xu, H.; Jiang, Y.; Yang, Y. Critical Review of Temperature Prediction for Lithium-Ion Batteries in Electric Vehicles. Batteries 2024, 10, 421. [Google Scholar] [CrossRef]
  53. Zhang, X.; Li, Z.; Luo, L.; Fan, Y.; Du, Z. A review on thermal management of lithium-ion batteries for electric vehicles. Energy 2022, 238, 121652. [Google Scholar] [CrossRef]
  54. Agronne National Laboratory. Available online: https://www.anl.gov/taps/downloadable-dynamometer-database (accessed on 2 January 2025).
  55. DieselNet. Emission Test Cycles. FTP-75. Available online: https://dieselnet.com/standards/cycles/ftp75.php (accessed on 7 January 2022).
  56. Stutenberg, K.; Lohse-Busch, H.; Duoba, M.; Iliev, S.; Jehlik, F.; Di Russo, M. An Overview of Argonne’s Advanced Mobility Technology Laboratory Vehicle Systems Instrumentation and Evaluation Methodology; Argonne National Laboratory: Lemont, IL, USA, 2021. [Google Scholar] [CrossRef]
  57. European Commission. Commission Report Under Article 12 of Regulation (EU) 2019/631 on the Evolution of the Real-World CO2 Emissions Gap for Passenger Cars and Light Commercial Vehicles and Containing the Anonymised and Aggregated Real-World Datasets Referred to in Article 12 of Commission Implementing Regulation (EU) 2021/392. Available online: https://climate.ec.europa.eu/document/download/b644dafe-1385-4b56-98d9-21e7e9f3601b_en?filename=report.pdf (accessed on 1 September 2025).
  58. Di Russo, M.; Stutenberg, K.; Hall, C.M. Analysis of Uncertainty Impacts on Emissions and Fuel Economy Evaluation for Chassis Dynamometer Testing. In IEEE Transactions on Vehicular Technology; IEEE: Piscataway, NJ, USA, 2023; Volume 72, pp. 4236–4251. [Google Scholar] [CrossRef]
  59. Adamiak, B.; Andrych-Zalewska, M.; Merkisz, J.; Chłopek, Z. The uniqueness of pollutant emission and fuel consumption test results for road vehicles tested on a chassis dynamometer. Eksploat. I Niezawodn. Maint. Reliab. 2025, 27, 195747. [Google Scholar] [CrossRef]
  60. European Union. UN Regulation No 154—Uniform Provisions Concerning the Approval of Light Duty Passenger and Commercial Vehicles with Regards to Criteria Emissions, Emissions of Carbon Dioxide and Fuel Consumption and/or the Measurement of Electric Energy Consumption and Electric Range (WLTP) [2022/2124]. Available online: https://op.europa.eu/en/publication-detail/-/publication/ec09c0bb-609c-11ed-92ed-01aa75ed71a1 (accessed on 1 September 2025).
  61. Juhrich, K. CO2 Emission Factors for Fossil Fuels; German Environment Agency: Dessau-Rosslau, Germany, 2016; Available online: https://www.umweltbundesamt.de/sites/default/files/medien/1968/publikationen/co2_emission_factors_for_fossil_fuels_correction.pdf (accessed on 10 September 2025).
  62. Krajowy Ośrodek Bilansowania i Zarządzania Emisjami (KOBiZE). Emission Factors for CO2, SO2, NOx, CO, and Total Particulate Matter for Electricity Based on Information Contained in the National Database on Greenhouse Gas and Other Substance Emissions for the Year 2022. 2023. Available online: https://www.kobize.pl/uploads/materialy/materialy_do_pobrania/wskazniki_emisyjnosci/Wskazniki_emisyjnosci_2022.pdf (accessed on 21 May 2025). (In Polish).
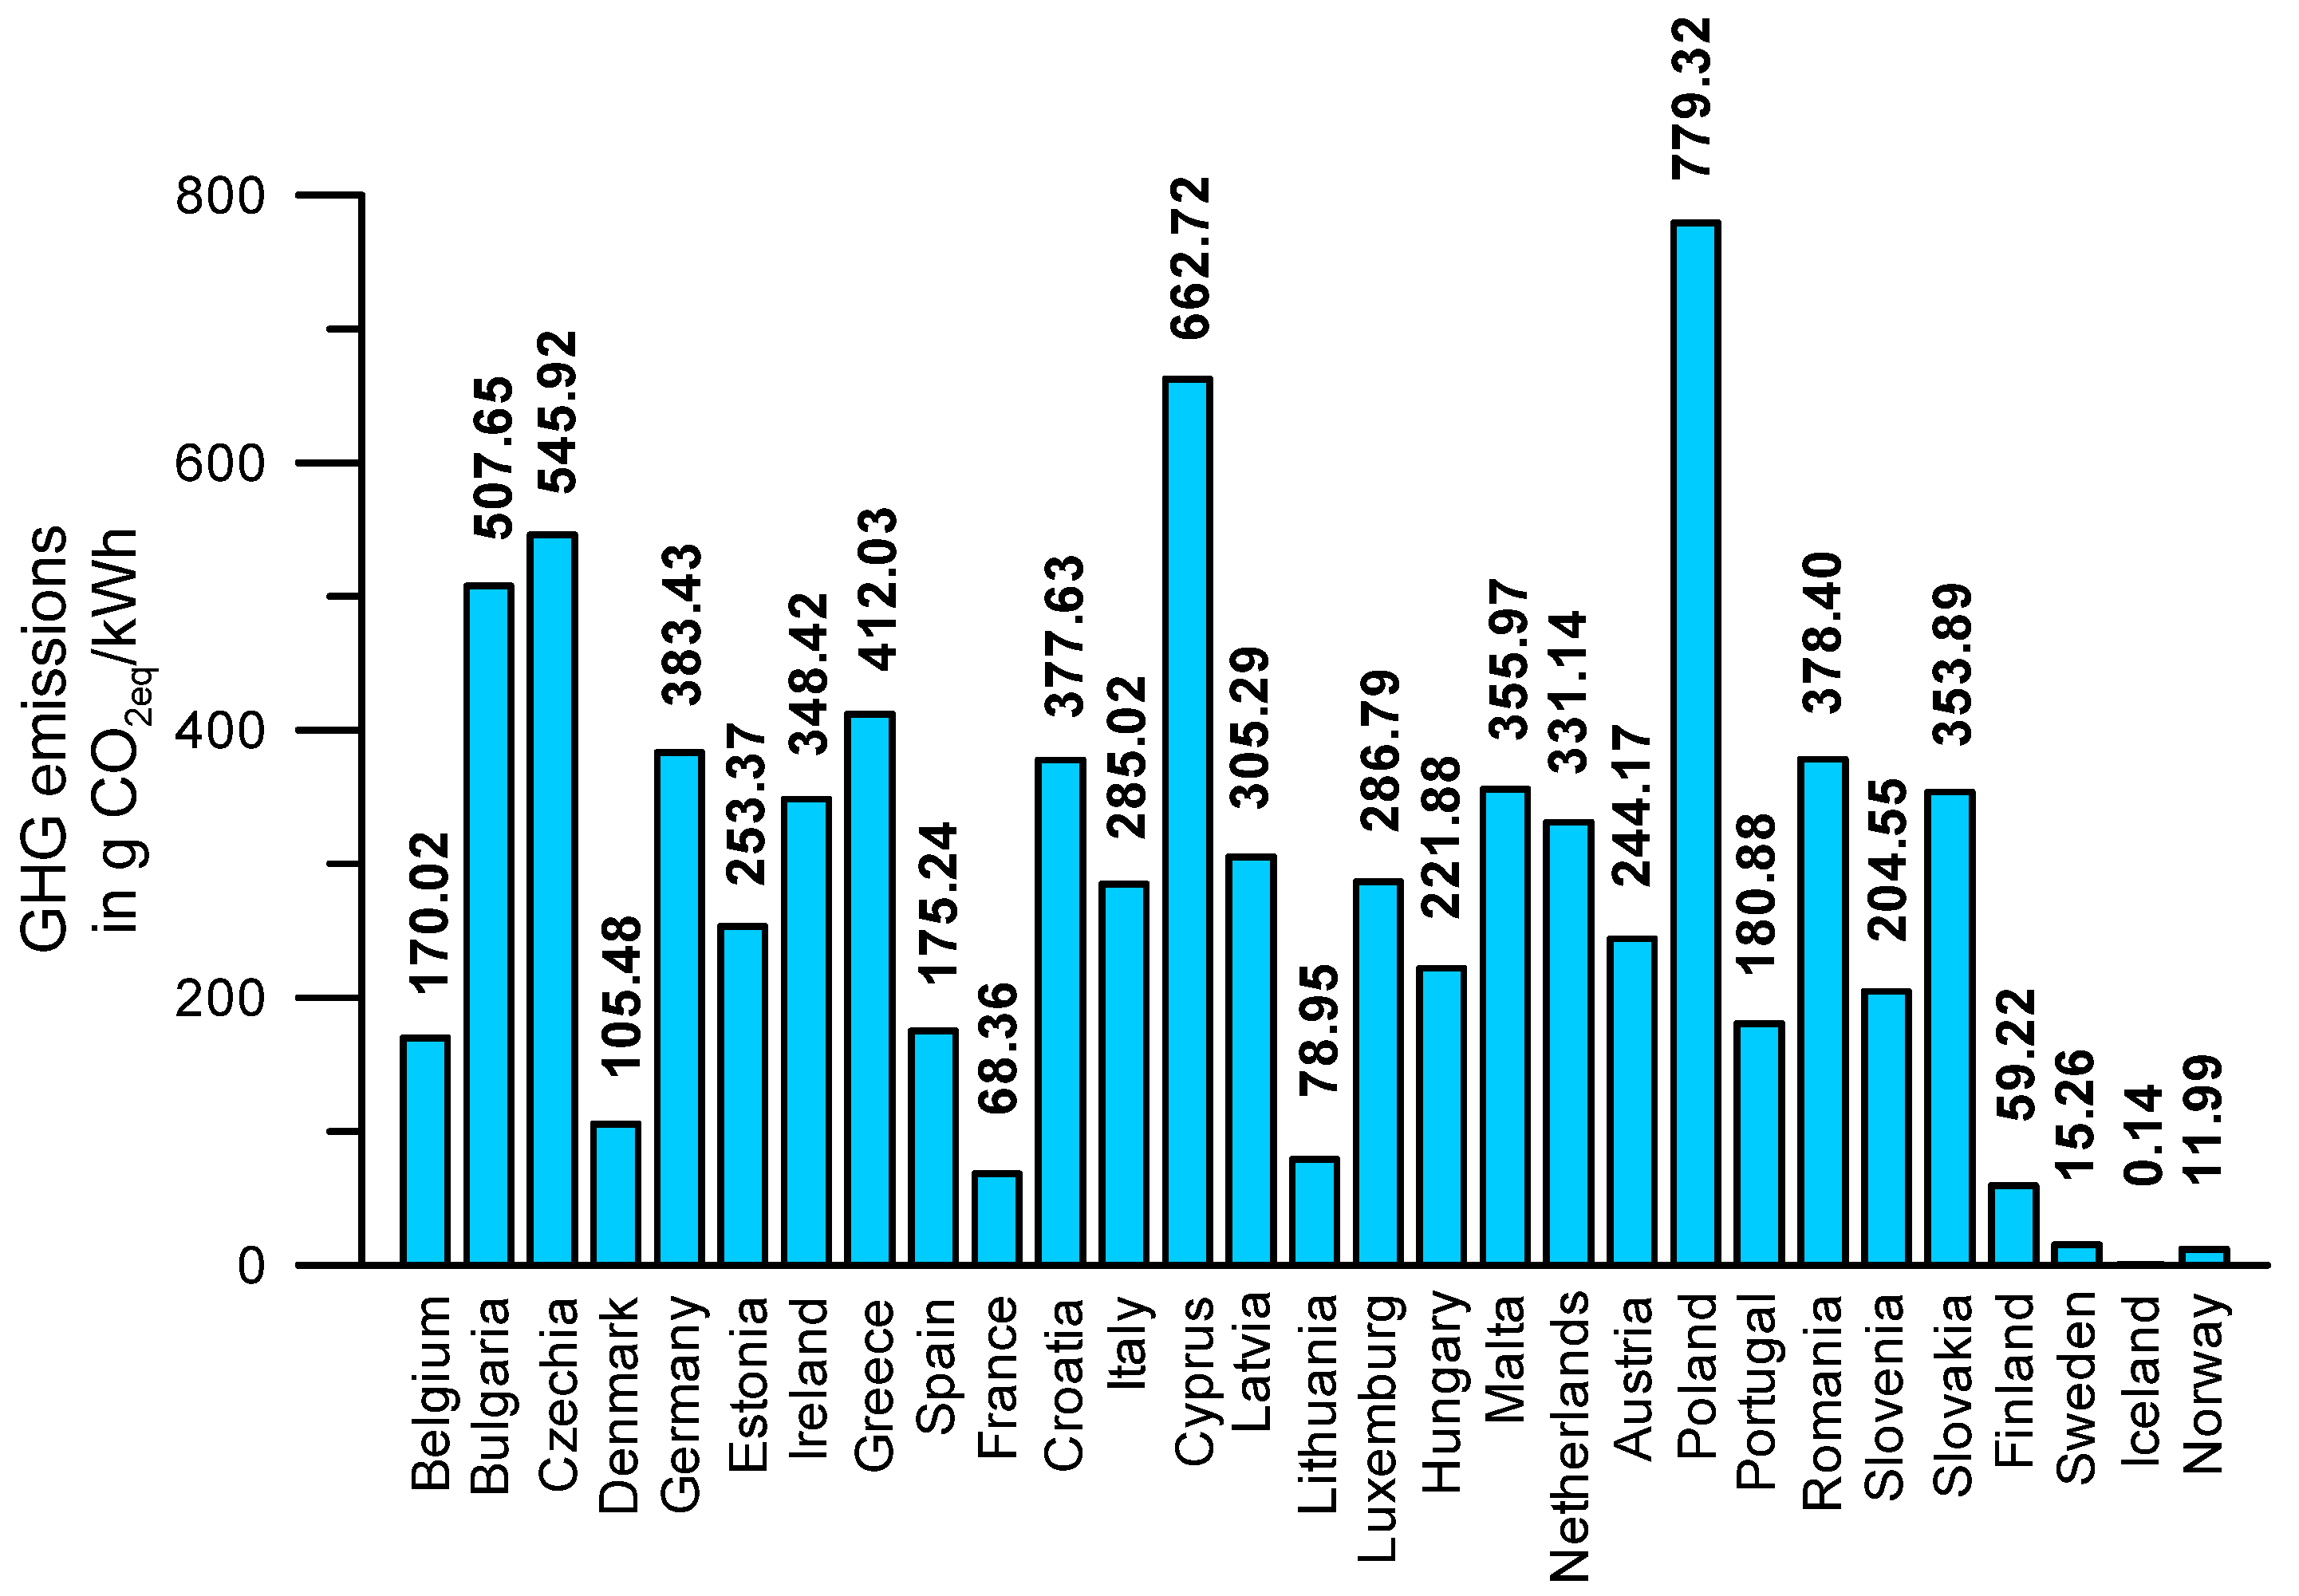
Figure 1. Emission factors in 2021 for national electricity for EU member states, Iceland and Norway: Activity-based (IPCC) approach, GHG emissions in g CO2eq/kWh [8].
Energies 18 06114 g001
Figure 2. Target CO2 emission limits [9,10].
Energies 18 06114 g002
Figure 3. U.S. EPA Urban Dynamometer Driving Schedule (UDDS) [55].
Energies 18 06114 g003
Figure 4. Comparison of energy consumption in the UDDS cycle for cold-start (CS) and hot-start (HS) conditions for the analyzed vehicles at an ambient temperature of T = −6 ± 1 °C.
Energies 18 06114 g004
Figure 5. Comparison of energy consumption in the UDDS cycle for cold-start (CS) and hot-start (HS) conditions for the analyzed vehicles at an ambient temperature of T = 23 ± 1 °C.
Energies 18 06114 g005
Figure 6. Comparison of energy consumption in the UDDS cycle for cold-start (CS) and hot-start (HS) conditions for the analyzed vehicles at an ambient temperature of T = 36 ± 1 °C.
Energies 18 06114 g006
Figure 7. Comparison of energy consumption as a function of distance traveled in the UDDS cycle for cold-start (CS) and hot-start (HS) conditions for the Ford C-Max Hybrid, considering different ambient temperatures.
Energies 18 06114 g007
Figure 8. Comparison of energy consumption as a function of distance traveled in the UDDS cycle for cold-start (CS) and hot-start (HS) conditions for the VW Jetta TDI, considering different ambient temperatures.
Energies 18 06114 g008
Figure 9. Comparison of energy consumption as a function of distance traveled in the UDDS cycle for cold-start (CS) and hot-start (HS) conditions for the Ford C-Max Energi Plug-in Hybrid, considering different ambient temperatures.
Energies 18 06114 g009
Figure 10. Comparison of energy consumption (from the grid) as a function of distance traveled in the UDDS cycle for cold-start (CS) and hot-start (HS) conditions for the Ford Focus Electric, considering different ambient temperatures.
Energies 18 06114 g010
Figure 11. Comparison of CO2 emissions in the UDDS cycle for cold-start (CS) and hot-start (HS) conditions for the analyzed vehicles at an ambient temperature of T = −6 ± 1 °C.
Energies 18 06114 g011
Figure 12. Comparison of CO2 emissions in the UDDS cycle for cold-start (CS) and hot-start (HS) conditions for the analyzed vehicles at an ambient temperature of T = 23 ± 1 °C.
Energies 18 06114 g012
Figure 13. Comparison of CO2 emissions in the UDDS cycle for cold-start (CS) and hot-start (HS) conditions for the analyzed vehicles at an ambient temperature of T = 36 ± 1 °C.
Energies 18 06114 g013
Figure 14. Comparison of average on-road CO2 emissions as a function of distance traveled in the UDDS cycle for cold-start (CS) and hot-start (HS) conditions for the Ford C-Max Hybrid, considering different ambient temperatures.
Energies 18 06114 g014
Figure 15. Comparison of average on-road CO2 emissions as a function of distance traveled in the UDDS cycle for cold-start (CS) and hot-start (HS) conditions for the VW Jetta TDI, considering different ambient temperatures.
Energies 18 06114 g015
Figure 16. Comparison of average on-road CO2 emissions as a function of distance traveled in the UDDS cycle for cold-start (CS) and hot-start (HS) conditions for the Ford C-Max Energi Plug-in Hybrid, considering different ambient temperatures.
Energies 18 06114 g016
Figure 17. Comparison of average on-road CO2 emissions as a function of distance traveled in the UDDS cycle for cold-start (CS) and hot-start (HS) conditions for the Ford Focus Electric, considering different ambient temperatures.
Energies 18 06114 g017
Figure 18. Comparison of average on-road CO2 emissions as a function of indirect emission factors in EU countries [8] for selected distances in the UDDS cycle under cold-start (CS) conditions for the Ford Focus Electric (ambient temperature −6 ± 1 °C).
Energies 18 06114 g018
Figure 19. Comparison of average on-road CO2 emissions as a function of indirect emission factors in EU countries [8] for selected distances in the UDDS cycle under cold-start (CS) conditions for the Ford Focus Electric (ambient temperature 23 ± 1 °C).
Energies 18 06114 g019
Figure 20. Comparison of average on-road CO2 emissions as a function of indirect emission factors in EU countries [8] and distance in the UDDS cycle under cold-start (CS) conditions for the Ford Focus Electric (ambient temperature 36 ± 1 °C).
Energies 18 06114 g020
Figure 21. Mean energy consumption of the tested vehicles: (a) for cold and hot start tests; (b) depending on ambient temperature (p-value indicated in parentheses).
Energies 18 06114 g021aEnergies 18 06114 g021b
Table 1. Vehicle setup information [54].
ParameterFord Focus
Electric 2013
Ford Cmax
Hybrid 2013
Ford Cmax
Energi 2013
VW Jetta
TDI 2013
Vehicle typeBattery-Electric VehicleHybrid/PetrolPlug-in Hybrid/PetrolConventional/
Diesel
Test weight (kg)1791181419081595
Target A (N)162.08796.781143.192134.139
Target B (N/(km/h))1.43641.00941.30371.0412
Target C (N/(km/h)2)0.026030.031950.028840.02692
Fuel typeelectricitypetrol/electricitypetrol/electricitydiesel
Fuel density (kg/dm3)-0.7410.7400.855
Fuel Net HV (MJ/kg)-42.70343.01542.694
Table 2. Engine oil temperature values at the beginning of the tests and battery state of charge (SOC) at the beginning and end of the tests [54].
ParameterFord Focus
Electric 2013
Ford Cmax
Hybrid 2013
Ford Cmax
Energi 2013
VW Jetta
TDI 2013
Cold start engine oil temperature (°C) for the test at −6 ± 1 °C-–6.3–6.5–6.3
Hot start engine oil temperature (°C) for the test at −6 ± 1 °C-52.255.374.5
Cold start engine oil temperature (°C) for the test at 23 ± 1 °C-25.525.022.4
Hot start engine oil temperature (°C) for the test at 23 ± 1 °C-62.560.189.5
Cold start engine oil temperature (°C) for the test at 36 ± 1 °C-24.026.526.5
Hot start engine oil temperature (°C) for the test at 36 ± 1 °C-64.865.196.3
SOC at the beginning/end of the CS test at −6 ± 1 °C (%)88.9/67.154.2/64.415.6/19.0-
SOC at the beginning/end of the HS test at −6 ± 1 (%)50.8/39.564.4/60.919.0/16.1-
SOC at the beginning/end of the CS test at 23 ± 1 °C (%)90.0/79.547.8/45.317.0/17.0-
SOC at the beginning/end of the HS test at 23 ± 1 (%)69.0/63.745.2/44.317.0/18.1-
SOC at the beginning/end of the CS test at 36 ± 1 °C (%)89.8/77.544.7/43.016.7/16.6-
SOC at the beginning/end of the HS test at 36 ± 1 °C (%)66.9/61.042.8/43.216.5/16.6-
Table 3. ANOVA of mean energy consumption by initial thermal state (CS/HS) and ambient temperature.
Source of VariationSSdfMSFp-ValueF-Test
VW Jetta TDI 2013
Thermal state (CS/HS)2415.612415.611.7580.0014174.084
Ambient Temperature4261.222130.613.0410.0000463.238
Ford Cmax Energi 2013
Thermal state (CS/HS)7594.917594.915.14560.0003684.084
Ambient Temperature5251.522625.74.57130.0164613.238
Ford Cmax Hybrid 2013
Thermal state (CS/HS)5800.515800.5438.8170.0004244.084
Ambient Temperature3809.221904.64.19890.0223083.259
Ford Focus Electric 2013
Thermal state (CS/HS)125.421125.421.60870.2120014.084
Ambient Temperature2323.421161.749.22321.48 × 10−123.238
Disclaimer/Publisher’s Note: The statements, opinions and data contained in all publications are solely those of the individual author(s) and contributor(s) and not of MDPI and/or the editor(s). MDPI and/or the editor(s) disclaim responsibility for any injury to people or property resulting from any ideas, methods, instructions or products referred to in the content.