Abstract
The integration of photovoltaic systems with heat pumps can significantly influence primary energy consumption indicators and therefore plays a particularly important role in the low-energy construction sector. This study provides a simulation-based assessment of the impact of selected photovoltaic panel parameters on the primary energy (PE) index in a low-energy building equipped with an air-source heat pump. The building, located in the relatively cold climate of north-eastern Poland, was analyzed in two insulation variants of the building envelope. In each variant and system configuration, the total amount of energy produced by the panels (EPV) and used by the system (Eused), as well as the degree to which the system’s electricity demand was covered by the photovoltaic panels (ηcov) and their self-consumption degree (ηself), were assessed. The results showed that, in the baseline scenarios, photovoltaic panels were able to generate 5586 kWh of electricity, covering an average of 60–63% of the system’s demand and achieving a self-consumption of approximately 59%. The EPV, Eused, and ηcov are inversely proportional to the ηself and PE index. The PE index, ηcov, and ηself ranged from 22.6 to 80 kWh/m2, 25.3 to 77.5%, and 23.9 to 100%, respectively, depending on the variant and configuration. The wide range of the obtained results confirms that the analyzed factors have a significant impact on the performance of building-integrated photovoltaic panels. In addition, the use of ASHP and PV instead of a gas boiler and grid electricity reduced both the EP index and CO2 emissions by 59–67%.
1. Introduction
In view of ever-tightening legal requirements for the energy performance of buildings, low-energy technologies are becoming the gold standard in modern residential construction []. However, effective operation of such facilities requires the use of additional systems based on renewable energy sources to minimize primary energy demand []. The literature highlights several solutions that improve the energy performance of buildings. Among them, air-source heat pumps and mechanical ventilation with heat recovery are often emphasized [,]. Photovoltaic panels [,] and energy storage systems [,] are also playing an increasingly important role, as their parameters have a significant impact on the final energy efficiency of the entire building []. In areas where heating dominates annual energy consumption, improving the thermal insulation of building partitions seems to be crucial [].
The leading technologies and measures for improving the energy efficiency of buildings have already been discussed widely in general approach [,,,]. Previous studies have demonstrated that the future of energy-efficient construction will be largely shaped by the integration of renewable energy sources, the development of control methods, and a robust policy framework promoting sustainable practices [].
The research conducted by Moran et al. [] in addition emphasized the necessity of minimizing the demand for space heating through highly airtight building envelopes while covering the remaining energy demand largely from renewable sources. Choi et al. [] in turn highlighted the high energy-saving potential resulting from the support of heat pumps with photovoltaics.
Photovoltaic panels are devices that use renewable energy (from the sun). They are characterized by a low or zero coefficient of non-renewable primary energy input for the production and delivery of energy carriers for technical systems []. They can function as decentralized electricity generation systems when combined with other sustainable technologies, increasing both energy and environmental efficiency []. Therefore, their integration with HVAC installations is crucial to improving the energy performance of buildings and reducing primary energy consumption []. Synergies between photovoltaic installations and nature-based solutions (NBS) such as green roofs, are also particularly promising as they improve the thermal insulation of buildings and reduce overheating in the summer months []. In addition, the integration of PV systems with energy storage, smart control strategies, or electric vehicle charging infrastructure can significantly increase self-consumption, reduce operating costs, and improve grid stability []. The versatility of photovoltaics allows their use in various renovation strategies. Combining passive and active energy-saving measures creates a comprehensive approach aligned with the goals of nearly zero-energy buildings (NZEB) and supports the broader decarbonization of the building stock [,]. However, optimizing the performance of photovoltaic panels with a focus on maximizing electricity generation efficiency requires detailed analysis and research into the impact of individual operational and geometric parameters on the energy balance and self-consumption potential.
Using energy simulations, Żukowski [] examined the importance of various heating and ventilation technologies, as well as changes in selected parameters for reducing energy needs in a small modular building. The author assessed the impact of the inclination angle of photovoltaic panels on the amount of energy produced. Results showed that, in Bialystok (Poland), the optimal angle was 39° for the year, 30° for the summer period, and 53° for the winter season. The author also estimated that the use of 16 photovoltaic panels and two photovoltaic–thermal collectors in the ground source heat pump variant allows the analyzed building to be classified as zero-energy. An assessment of the possibility of achieving energy self-sufficiency in residential buildings through the use of rooftop photovoltaic panels was also carried out by D’Agostino et al. [].
The factors influencing the efficiency of such photovoltaic systems were, in turn, identified by Ahmad et al. []. The analysis showed that, in addition to environmental parameters such as insolation and outdoor temperature, the efficiency of photovoltaics is equally determined by the type of building, roof geometry, orientation and angle of the panels, and even the consumption behavior of users.
The impact of different orientations of photovoltaic panels on the self-sufficiency and energy consumption of buildings was investigated by Middelhauve et al. [] and Talebizadeh et al. []. The results of the study indicated the high importance of the inclination and azimuth of photovoltaic panels themselves and the roof on which they are installed.
This is also confirmed by analyses conducted by Mondol et al. [] and Ołtarzewska and Krawczyk []. The first study showed that, in a maritime climate, maximum insolation and photovoltaic installation output occur for surfaces with a 30° south-facing slope, while minimum insolation and output occur for vertical surfaces with a 90° east or west orientation from the south. In the second work, using the example of a service building, it was estimated that changing the location of the panels from the south-eastern roof surface to the north-eastern one resulted in a 16–22% decrease in their efficiency.
It is worth noting that maximizing the annual output of panels alone may not translate into optimization of other system indicators, as pointed out by Litjens et al. []. The authors evaluated the orientation of photovoltaic panels in terms of increasing self-consumption and revenue. They estimated that, in domestic systems, the self-consumption rate can be increased by 5.4% by optimizing the orientation specifically for individual consumption. Similar conclusions based on the example of single-family houses located in Germany were presented by Lahnaoui et al. []. In this study, it was also shown that the optimal orientation is strongly dependent on the load profile of the receiver.
Numerous studies [,,,] have shown that computer simulations are currently widely used to identify optimal PV panel locations and configurations for specific geographical conditions. This allows various operating conditions to be tested without physical prototypes.
Existing models and best practices for the design and simulation of photovoltaic-assisted heat pump systems were discussed in a study by Rana et al. []. Among the simulation tools analyzed, the authors highlighted software such as TRNSYS, MATLAB, EnergyPlus, DesignBuilder, RETscreen, and SAM.
Based on numerical simulations, Zhao et al. [] investigated the characteristics of dust deposition and its impact on building-integrated photovoltaic panels, Abdallah and Zisis [] evaluated the aerodynamic properties of photovoltaic panels mounted on gable roofs, while Pendem and Mikkili [] studied the impact of photovoltaic panel configurations (series, series-parallel, bridge-linked, and honey-comb) on their performance under various partial shading conditions.
Using EnergyPlus software, Nešović et al. [] examined the impact of active (photovoltaic panels) and passive (wall and roof pergolas) solar systems on improving the energy and environmental performance of residential buildings in western Serbia.
Stamatellos et al. [] applied TRNSYS software to evaluate the expected energy efficiency of a building equipped with an inverter heat pump and high-efficiency rooftop photovoltaic panels. Based on the simulation results, the authors also optimized the surface area and inclination angle of the installed photovoltaic panels.
The advisability of using TRNSYS to assess the performance of PV-HP systems is also confirmed by other studies [,,].
The most important findings from the perspective of this study are summarized in the table below (Table 1).
Table 1.
The summary of the most important findings.
The main objective of this study was to assess the influence of selected parameters of a photovoltaic (PV) installation and the insulation standard of a building on the primary energy demand (PE) in a low-energy single-family building equipped with an air–water heat pump and a heat recovery ventilation system.
The research aimed to answer the following questions:
- To what extent do improvements in building insulation and changes in the PV system parameters (inclination, orientation, and number of modules) affect primary energy consumption in the building?
- How effectively can an air–water heat pump system supported by a PV installation cover the energy demand of a low-energy building in the climatic conditions of north-eastern Poland?
The hypothesis was put forward that improving the thermal insulation of the building’s external partitions and optimizing the parameters of the photovoltaic installation would significantly reduce the building’s primary energy demand and increase its energy self-sufficiency in terms of electricity generated on site.
This analysis combines issues related to the characteristics of photovoltaic panels and the operation of air-source heat pumps in low-energy buildings and responds to the growing need to assess the impact of the technical parameters of individual systems on the energy performance of buildings. Previous studies have lacked comprehensive analyses that simultaneously consider the variability of PV installation parameters, different building insulation variants, and their combined impact on primary energy indicators, especially in the cool climate of northeastern Europe. The presented research fills this gap by providing new data and conclusions that are important both for designers of hybrid systems and for the further development of methodologies for assessing the energy efficiency of buildings. The scientific and practical value of this study, as well as its relevance and innovativeness, are also reflected in the consistency of the results and conclusions with the measures currently being implemented in Poland to modernize buildings and decarbonize, supporting the energy transition. Furthermore, computer simulations carried out in the TRNSYS environment allowed for a controlled and repeatable assessment of the relationships between individual technical factors and system efficiency, which may constitute a valuable introduction to further research on the optimization of energy consumption in buildings.
2. Materials and Methods
2.1. Building
The subject of the analysis is a single-family residential building with low-energy technology. Two variants of its insulation were considered:
Variant I—with lower standard of heat transfer coefficients of building partitions (“U” of walls, roof and ground floor below 0.15 W/(m2∙K));
Variant II—with higher standard of heat transfer coefficients of building partitions (“U” of walls, roof and ground floor below 0.10 W/(m2∙K));
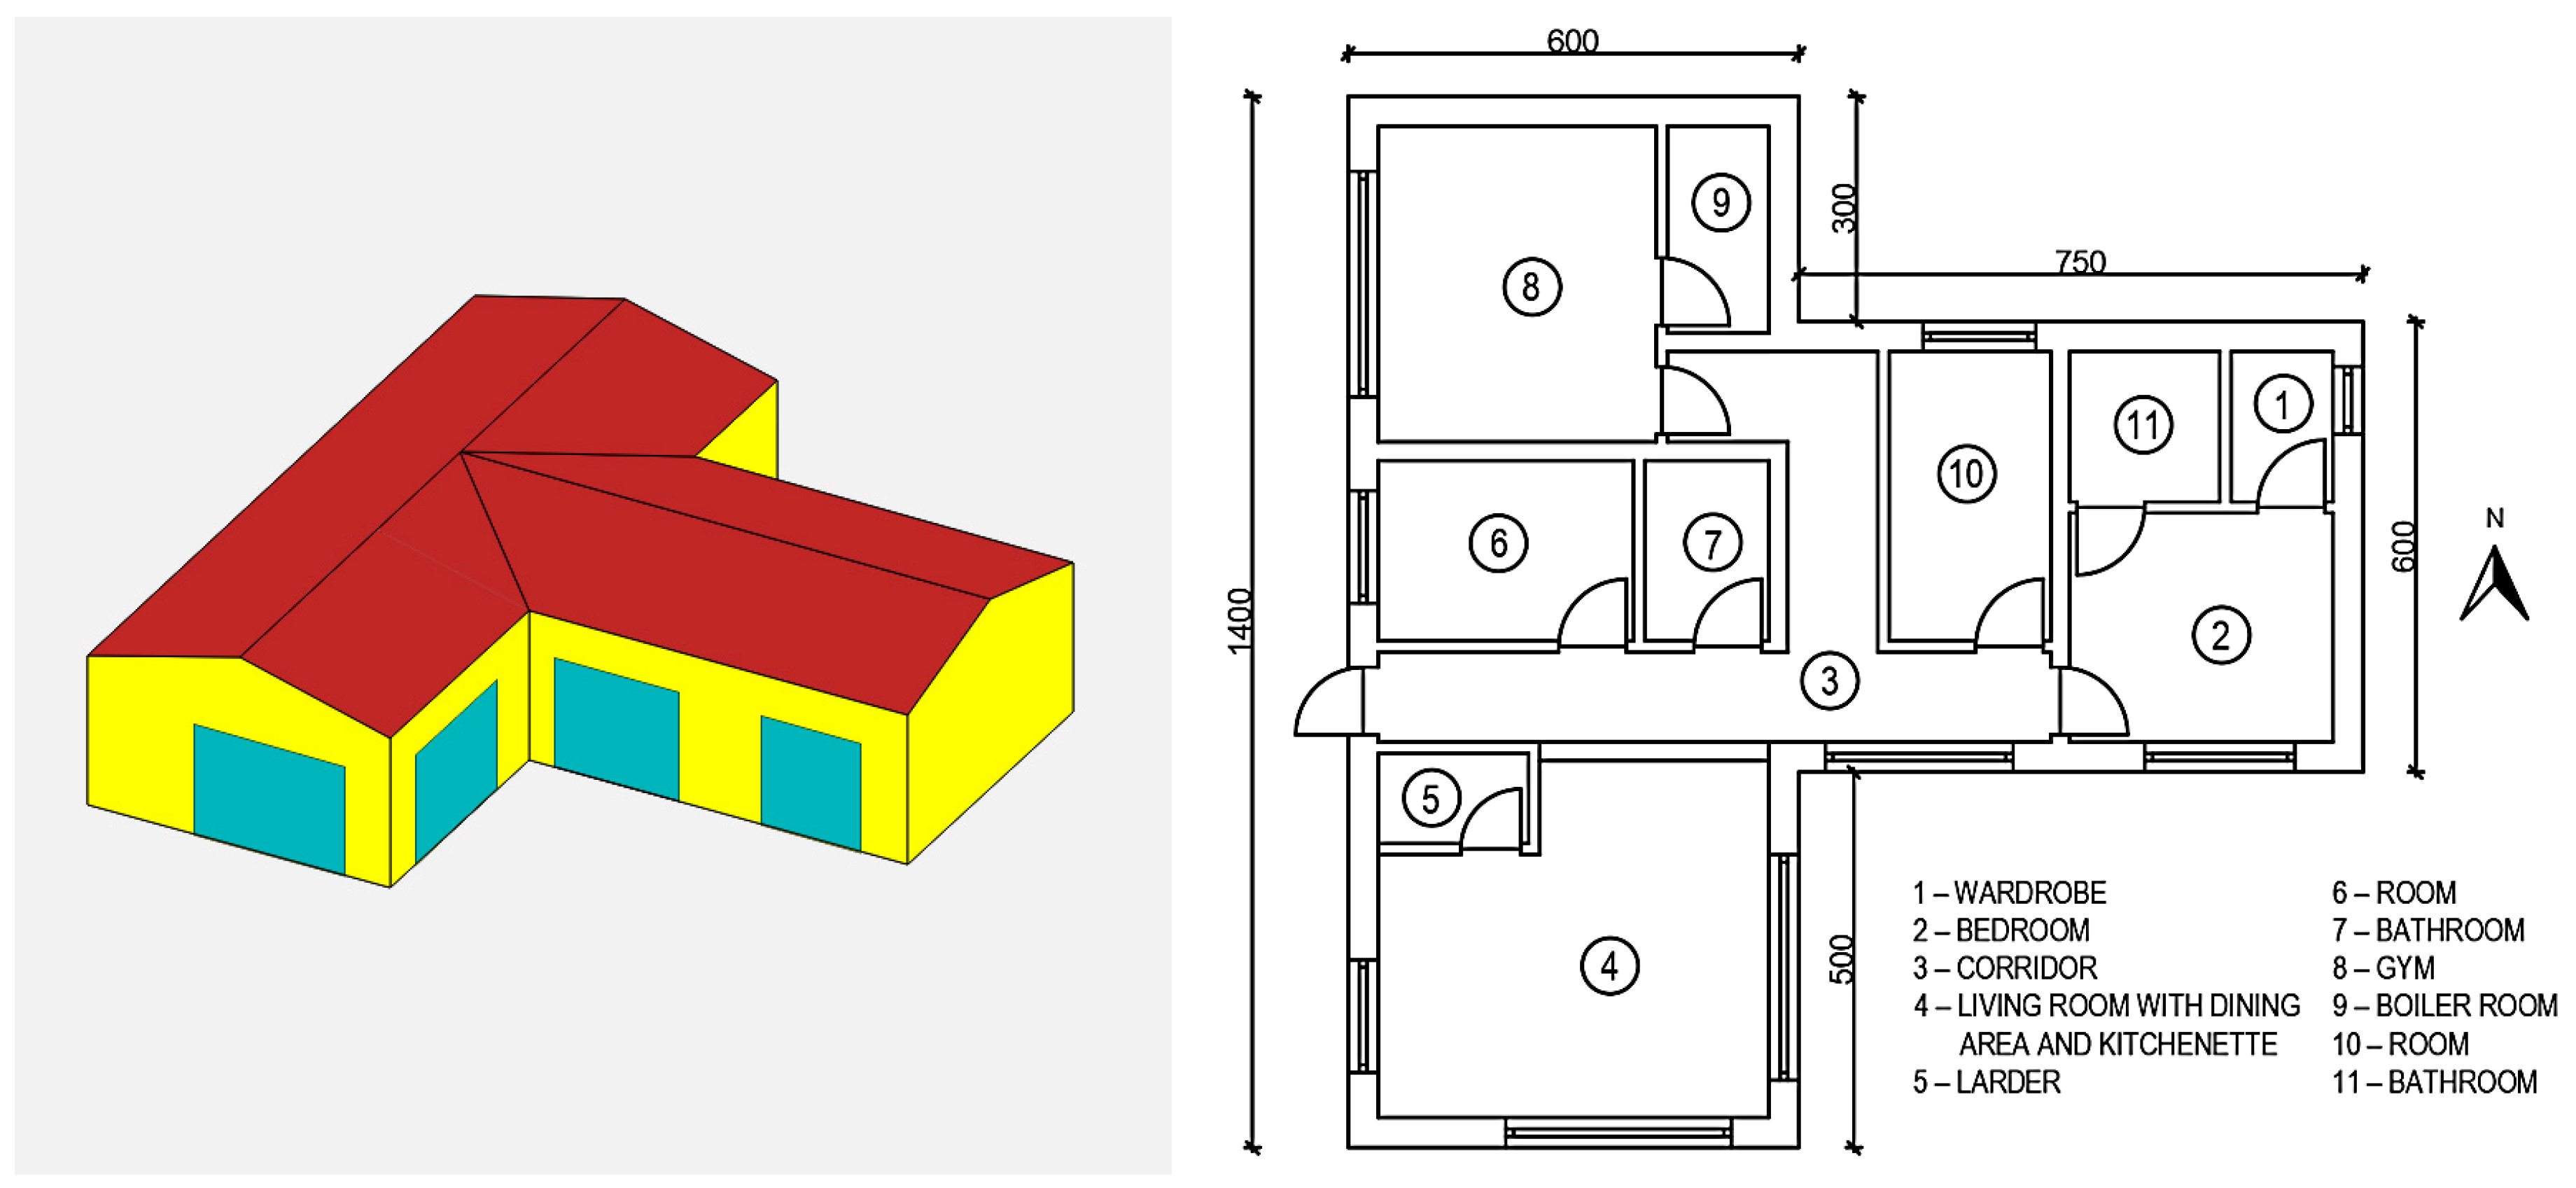
It consists of 11 rooms and has a total area of 129 m2 and a volume of 441 m3. The average height of the building is 3.4 m and the roof angle was adopted as 15° (slightly sloping).
For the purposes of this study, the study was assumed to be located in Białystok (23°09′ E, 53°08′ N), classified as climate zone IV according to PN-EN 12831:2006 [], humid continental climate zone (Dfb) according to the Köppen classification [], and climate zone 6A according to ASHRAE []. The simulation in TRNSYS used the Meteonorm v. 8 [] Typical Meteorological Year (TMY) dataset for Białystok. The dataset provides hourly data on, e.g., ambient temperature, solar radiation, wind speed, and humidity. The TMY data are generated from long-term measurements (2000–2019) and represent statistically average climatic conditions. While the dataset does not capture year-to-year variability, it allows for an indicative evaluation of the system’s performance under typical weather conditions. In real operation, lower temperatures and solar irradiance would increase the heating demand and reduce PV generation; however, the analysis of such seasonal deviations is beyond the scope of this study.
The model and plan of the analyzed building are shown in Figure 1, while the total area, thickness, and assumed heat transfer coefficients “U” of individual external envelopment elements are summarized in Table 2.
Figure 1.
Model and plan of the analyzed building. Colors indicate different external envelopment elements: red—roof, yellow—external walls, blue—windows.
Table 2.
Data of external envelopment elements.
The building model was created in SketchUp [] with the TRNSYS3d plugin and then implemented and modified in TRNBuild []. To determine the energy gains generated by people, lighting, and equipment, occupancy and usage schedules were implemented. It was assumed that the building is unoccupied in typical working hours (8:00–16:00) and, during this period, only a small amount of electricity is supplied to cover the standby operation of selected electrical devices or lighting (Figure 2). Furthermore, it was assumed that the building is intended for living of 4 people, each of whom generates heat gains of 100 W, and that heat gains from both lighting and equipment average 390 W during the building’s use in accordance with schedules.
Figure 2.
Schedules of occupancy, Dpeople (a), and use of lighting and equipment, Dlight (b).
Based on the above assumptions, the following relationships were used to estimate heat gains from people, lighting, and equipment:
To generalize and universalize the analysis, it was assumed that:
- All rooms are heated and cooled and equipped by heat recovery ventilation;
- The set temperature for the entire building is 20 °C for heating and 26 °C for cooling;
- The infiltration air change rate in the building was set at 0.2 1/h.
2.2. HVAC Systems
The system subjected to simulations consisted of air-to-water heat pump, mechanical heat recovery ventilation with a flow rate of 120 kg/h, and a buffer tank with a capacity of 120 L. Detailed data on heating performance of the heat pump, depending on the water and air temperature at the heat pump inlet, have been compiled on the basis of design materials and technical data provided by the manufacturer and then implemented to the heat pump component in the form of external files. Electricity was covered by photovoltaic panels installed on the roof, with any shortfall supplemented from the grid. The baseline scenario assumed 12 photovoltaic modules with an area of 1.868 m2 each.
Regardless of the variant, the energy demand calculations also assumed that domestic hot water is prepared using an electric instantaneous water heater and the total DHW consumption is 73 m3 per year (200 dm3 per day) and that cooling is provided by an air conditioner with an SEER coefficient of 6.0. However, these devices, as independent systems, were not included in the simulation models.
To model the underfloor heating in the building, an active layer with the following parameters was used: pipe spacing: 0.2 m, outer pipe diameter: 0.016 m, pipe thickness: 0.002 m, and thermal conductivity of the pipe wall: 1.58 kJ/(h∙m∙K).
The heating loop was controlled by a simple on/off thermostat with a setpoint temperature of 20.0 °C and a hysteresis of ±0.5 °C. When the indoor air temperature dropped below the lower threshold (19.5 °C), the thermostat activated the circulation pumps and initiated the operation of the air-source heat pump, which charged the buffer tank. Once the upper threshold (20.5 °C) was reached, the thermostat signal switched off the pumps and stopped the heat pump operation. The model does not provide for separate control of underfloor heating.
The control strategy assumes that mechanical ventilation would operate up to an outside temperature of 20 °C.
The system operation flow chart is presented in Figure 3.
Figure 3.
System operation flow chart.
2.3. Simulations
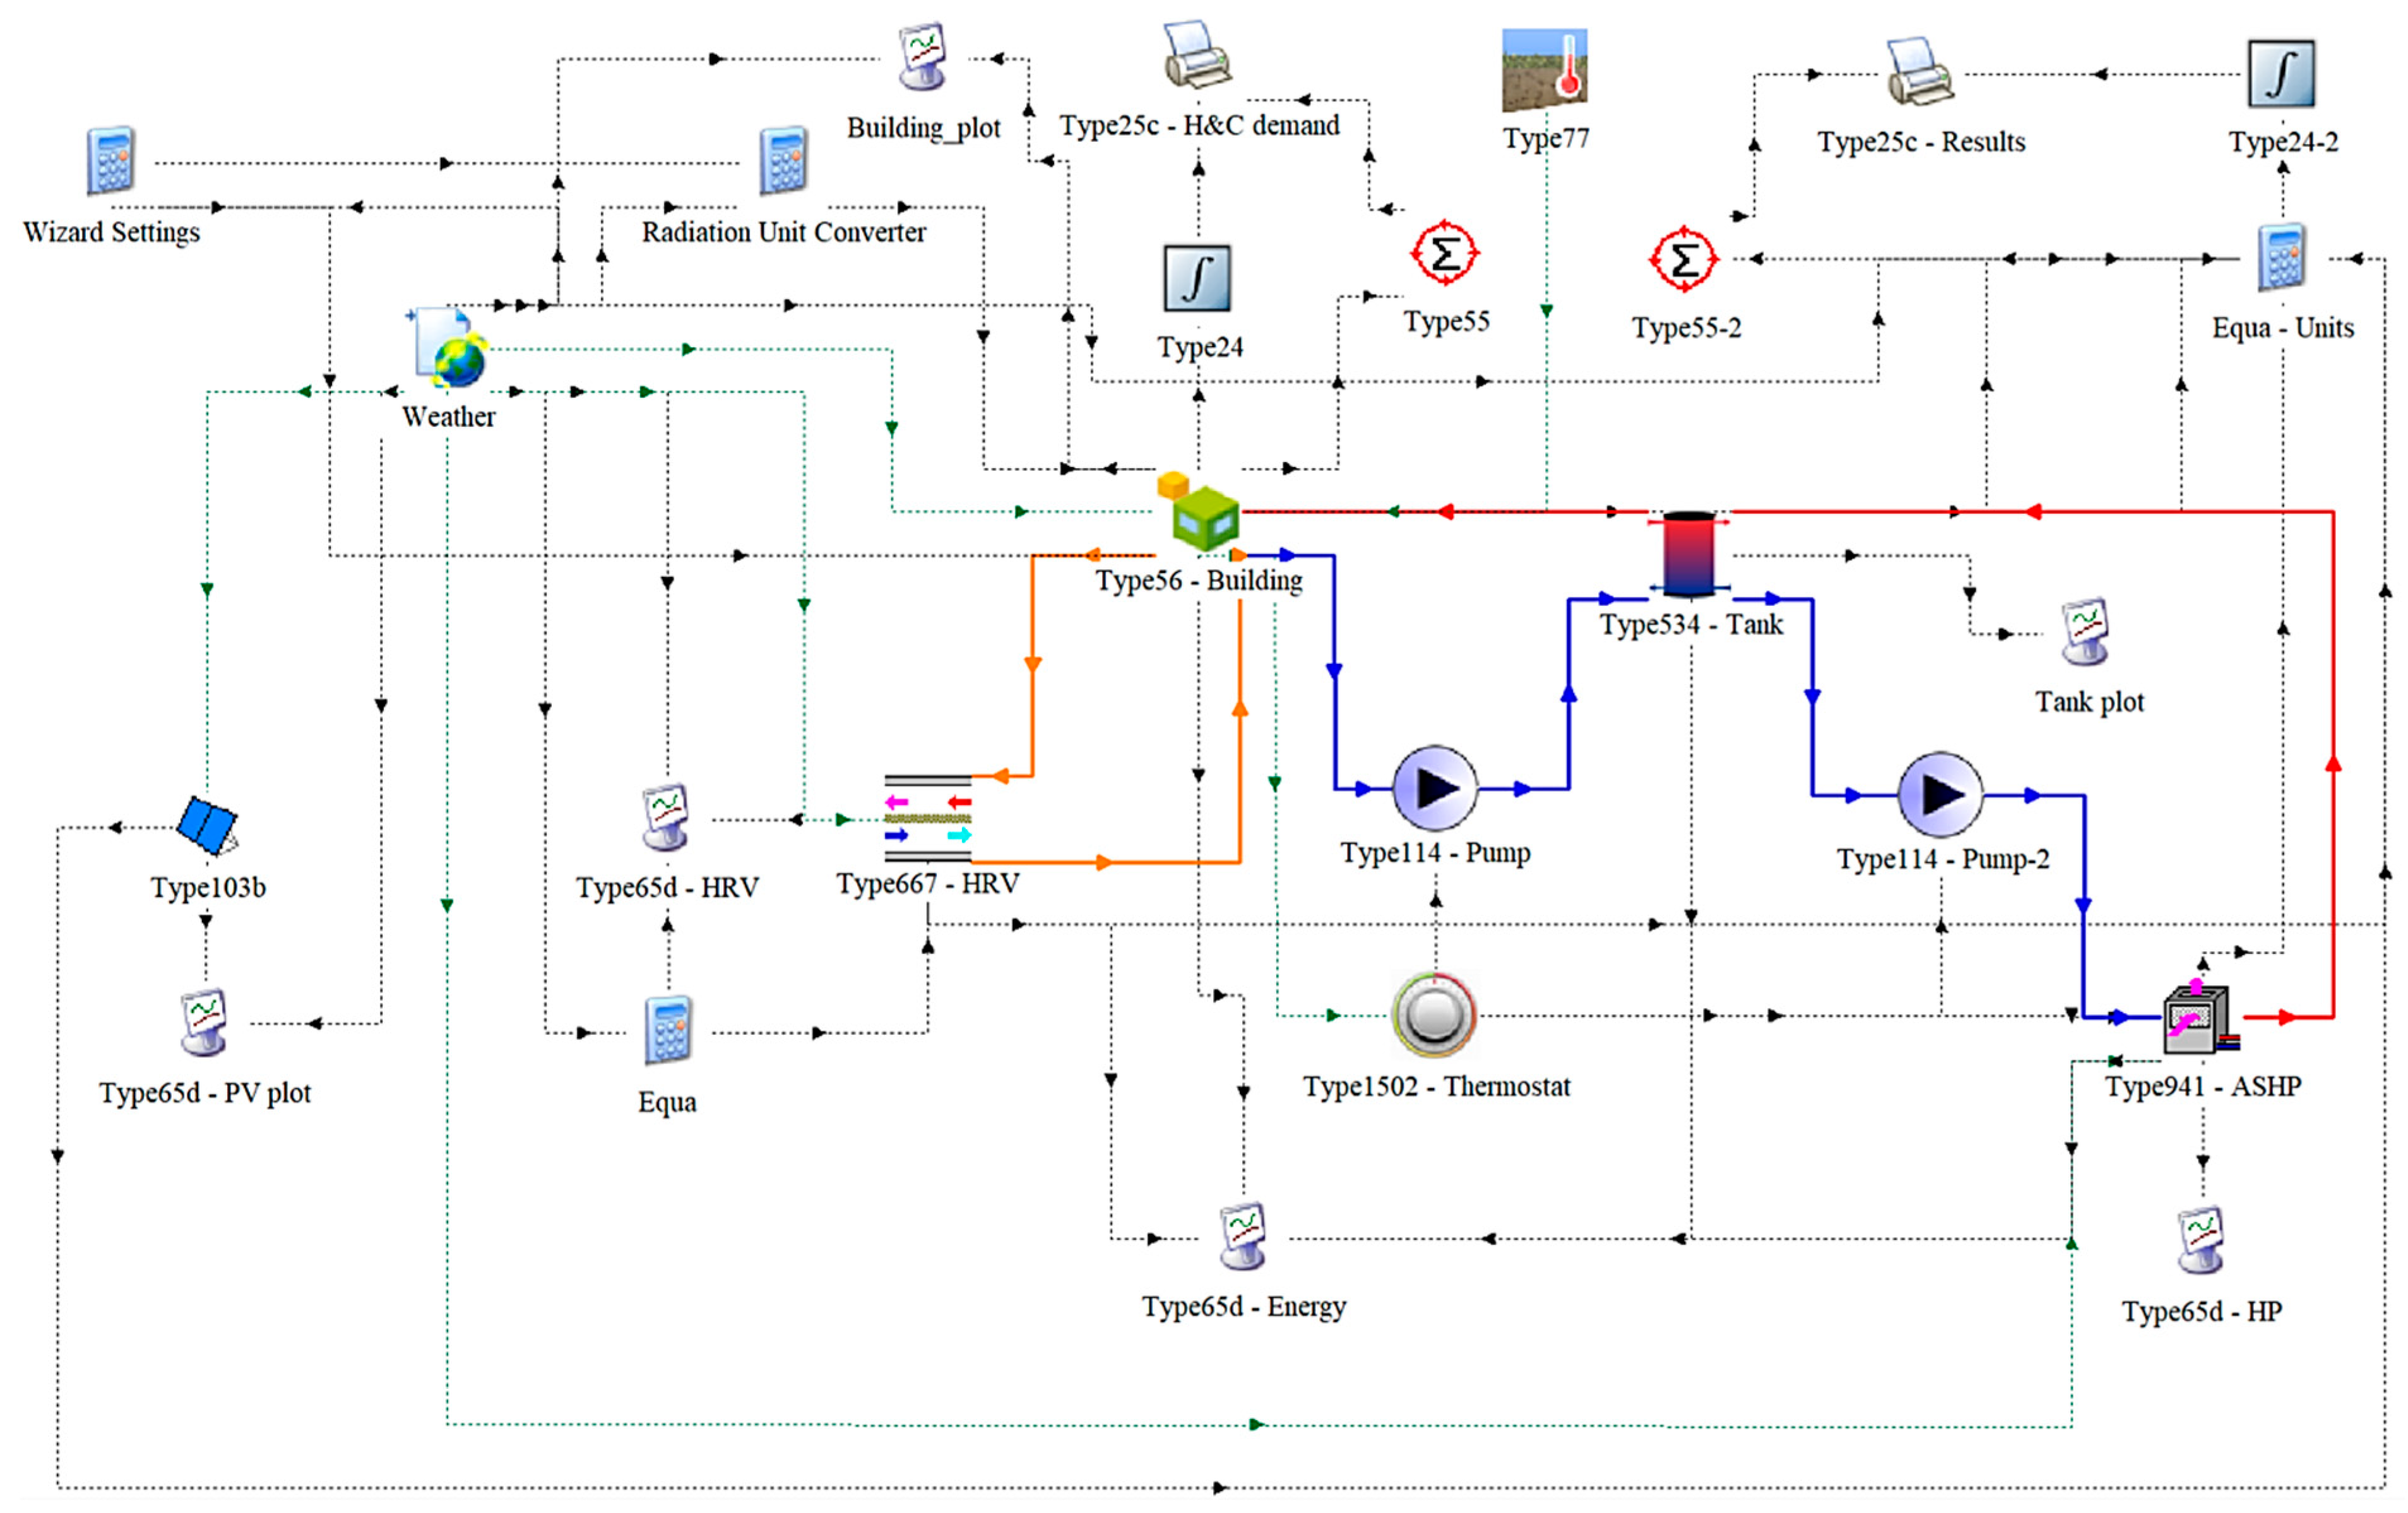
All simulations were performed using TRNSYS v. 18 software []. The main components of each model are shown in Figure 4 and included the following:
Figure 4.
TRNSYS system model []. The colors and arrows indicate the direction and type of flow: red—supply, blue—return, orange—airflow in the ventilation loop, green—weather data connections, black—control signals and other data links.
- Multi-zone building (Type 56) with an active layer;
- Air-to-water heat pump (Type 941);
- Buffer tank (Type 534);
- Mechanical ventilation with heat recovery (Type 667);
- Photovoltaic panels (Type 102b);
- Thermostat (Type 1502);
- Weather data (Type15-6) and soil temperature (Type77).
Additional components shown in Figure 4 include printers, online plotters, periodic integrators, printegrators, equations, etc.
The duration of simulation was 1 year (8760 h). Simulations were performed with a time step of 0.25 h and, depending on the parameter under investigation, the total, daily average, or annual average results were analyzed.
The adopted values of the most important parameters and inputs for individual components are summarized in the table below (Table 3).
Table 3.
Values of the main parameters and inputs of individual model components.
In the presented model, TRNSYS Type77 was used to define the boundary temperature used for floors adjacent to the ground in the building model (Type56). It was assumed that the ground temperature was constant and equal to 7.8 °C.
The primary (PE) energy was determined based on the following equations []:
where Qp—annual demand for non-renewable primary energy for technical systems [kWh/year], Qk—annual final energy demand supplied to a building or part of a building for technical systems [kWh/year], Af—area of rooms with regulated air temperature (heated or cooled area) [m2], Qp,H—annual demand for non-renewable primary energy for the heating system [kWh/year], Qp,W—annual demand for non-renewable primary energy for the domestic hot water preparation system [kWh/year], Qp,C—annual demand for non-renewable primary energy for the cooling system [kWh/year], Qk,H—annual final energy demand supplied to a building or part of a building for heating [kWh/year], Qk,W—annual final energy demand supplied to a building or part of a building for the domestic hot water system [kWh/year], and Qk,H—annual final energy demand supplied to a building or part of a building for cooling [kWh/year].
The values Qp,H, Qp,W, and Qp,C are calculated as the product of the annual final energy demand (Qk,H, Qk,W, and Qk,C) and non-renewable primary energy input factor for the production and delivery of the energy carrier for technical systems (wi). In this analysis, the coefficient wi was adopted in accordance with [] as:
- 1.1 for natural gas;
- 0.0 for solar energy;
- 2.5 for electricity from the grid.
To estimate the CO2 emissions conversion for the two system variants analyzed in comparison with a traditional system based on a gas-condensing boiler and electricity from the grid, based on [,], emission factors of 733 gCO2/kWh for electricity from the grid and 207.54 gCO2/kWh for natural gas boiler were adopted.
2.4. Analysis
In the first stage of the analysis, the results of the simulated system based on modern technologies and used in two variants of low-energy buildings were discussed in detail and then compared in terms of the PE index and CO2 emissions with these obtained for a traditional system based on a gas-condensing boiler and electricity from the grid. For the gas boiler, an efficiency of 100% was assumed and the same amount of energy produced as in the case of a heat pump. At this stage, two variants of the baseline scenario were considered, consisting of a system with 12 PV panels, air-source heat pump, heat recovery ventilation, air-conditioning unit, and electric instantaneous water heater, differing only in the insulation standard (Table 4). The individual components of the system are discussed in more detail with regard to their technical aspects in Section 2.2.
Table 4.
Main assumptions of the baseline scenario.
In the second stage, an in-depth parametric analysis of the proposed system was conducted (Table 5). This assessment investigated the influence of:
Table 5.
Main assumptions of the parametric analysis.
- Changing the inclination angle of photovoltaic panels;
- Changing the orientation of photovoltaic panels;
- Changing the total surface area (number of modules) of photovoltaic panels
on parameters such as the amount of energy produced by the photovoltaic panels (EPV) and used by the system (Eused), the primary energy indicator (PE), the degree to which the system’s electricity demand was covered by the photovoltaic panels (ηcov), and the degree of system consumption of energy generated by photovoltaic panels (ηself).
A combination of three calculation methods was used to determine the above parameters:
- Simulations—dynamic simulations of the heating system with an air-source heat pump and ventilation with heat recovery, as well as photovoltaic panels;
- Mixed—dynamic simulations of the building’s cooling load + manual calculations for air-conditioning;
- Estimation—assumption-based estimation for domestic hot water installation.
In the first stage, average daily results were considered, while, in the parametric analysis, the annual balance was considered.
3. Result and Discussion
3.1. Main Parameters of the System Performance in the Baseline Scenarios
The results of the simulation of the analyzed system for two variants of building insulation in the baseline scenarios are presented in Table 6.
Table 6.
Main parameters of the system performance in the baseline scenarios.
In Variant I, the amount of energy produced by the heat pump was 4787 kWh, which was almost 33% higher than in Variant II. The degree of reduction in the building’s heat demand associated with the improvement in the building’s thermal insulation was consistent with the results of the analysis presented by Jezierski et al. [] and Żukowski []. Furthermore, the heat pump was able to maintain the set temperature in 94.9% and 97.1% of time in Variants I and II, respectively. The average COP was marginally higher in Variant I, which was due to the fact that there was no need to heat the building in the “most favorable” conditions in Variant II. Mechanical ventilation in Variant II was characterized by a slightly higher (almost 2%) amount of recovered heat. The electricity consumption of the heat pump ranged from 1126 kWh in Variant II to 1480 kWh in Variant I, while, in the case of mechanical ventilation, it was 588 kWh regardless of the variant. The total amount of electricity generated by the photovoltaic installation was 5586 kWh in both variants, which is consistent with the results presented by Woroniak et al. [] (5445–5685 kWh from PV with an area of 26.2 m2). The use of photovoltaic panels allowed the system’s electricity demand to be covered by an average of over 70% in each of the analyzed days; however, taking into account the average annual result, it was 59.6% and 63.2% in Variants I and II, respectively (see Table 7), which highlights the need for and importance of electricity storage. The analogous situation can be observed in the case of the self-consumption degree of photovoltaic panel. Taking into account the average daily results, it was almost 77% regardless of the variant, while, on an annual level, it was 58.9% in Variant I and 59.4% in Variant II. It also corresponds to the results presented by Turoń []. The average temperature in the building and the supply temperature in the system reached similar values in both variants.
Table 7.
Primary and final energy demand of the system in the baseline scenarios.
The results of the system’s energy demand in the basic scenarios are presented in Table 7.
The total energy demand of individual system components was 5170 kWh in Variant II and almost 7% more in Variant I (5524 kWh). The final energy was 40.1 kWh/m2 in Variant II and 42.8 kWh/m2 in Variant I. This resulted in primary energy at the level of 100.2 kWh/m2 and 107.0 kWh/m2 assuming grid power supply and 36.8 kWh/m2 and 43.3 kWh/m2 taking into account the share of photovoltaic panels (respectively, in Variants II and I).
Considering a scenario typical for Polish households, in which a gas boiler would be used for heating instead of a heat pump and the other systems would be powered from the grid, the EP index would reach 119.2 kWh/m2 in Variant I and 110.7 kWh/m2 in Variant II. This is approximately 3 times higher than in the case of using a heat pump and photovoltaic panels.
A comparison of CO2 emissions for Variant I and II and the scenario assuming heating with gas boiler and the use of electricity from the grid is presented in Table 8.
Table 8.
Comparison of CO2 emission for the system in the baseline scenarios and with a gas boiler.
The annual carbon dioxide emissions for the system with an air-source heat pump and photovoltaic panels in the baseline scenario were 1636.3 kgCO2 for Variant I and 1414.72 kgCO2 for Variant II, which was, respectively, 58.7% and 62.5% lower than in the case of heating the building with a gas boiler and supplying the remaining systems from the grid. On the other hand, a study conducted by Wciślik and Kotrys-Działak [] showed that, in Polish conditions, using sufficiently powerful photovoltaic cells and a brine-water heat pump, it is possible to achieve a reduction in CO2 emissions of up to 90% compared to a gas boiler.
3.2. Influence of the Inclination Angle of Photovoltaic Panels
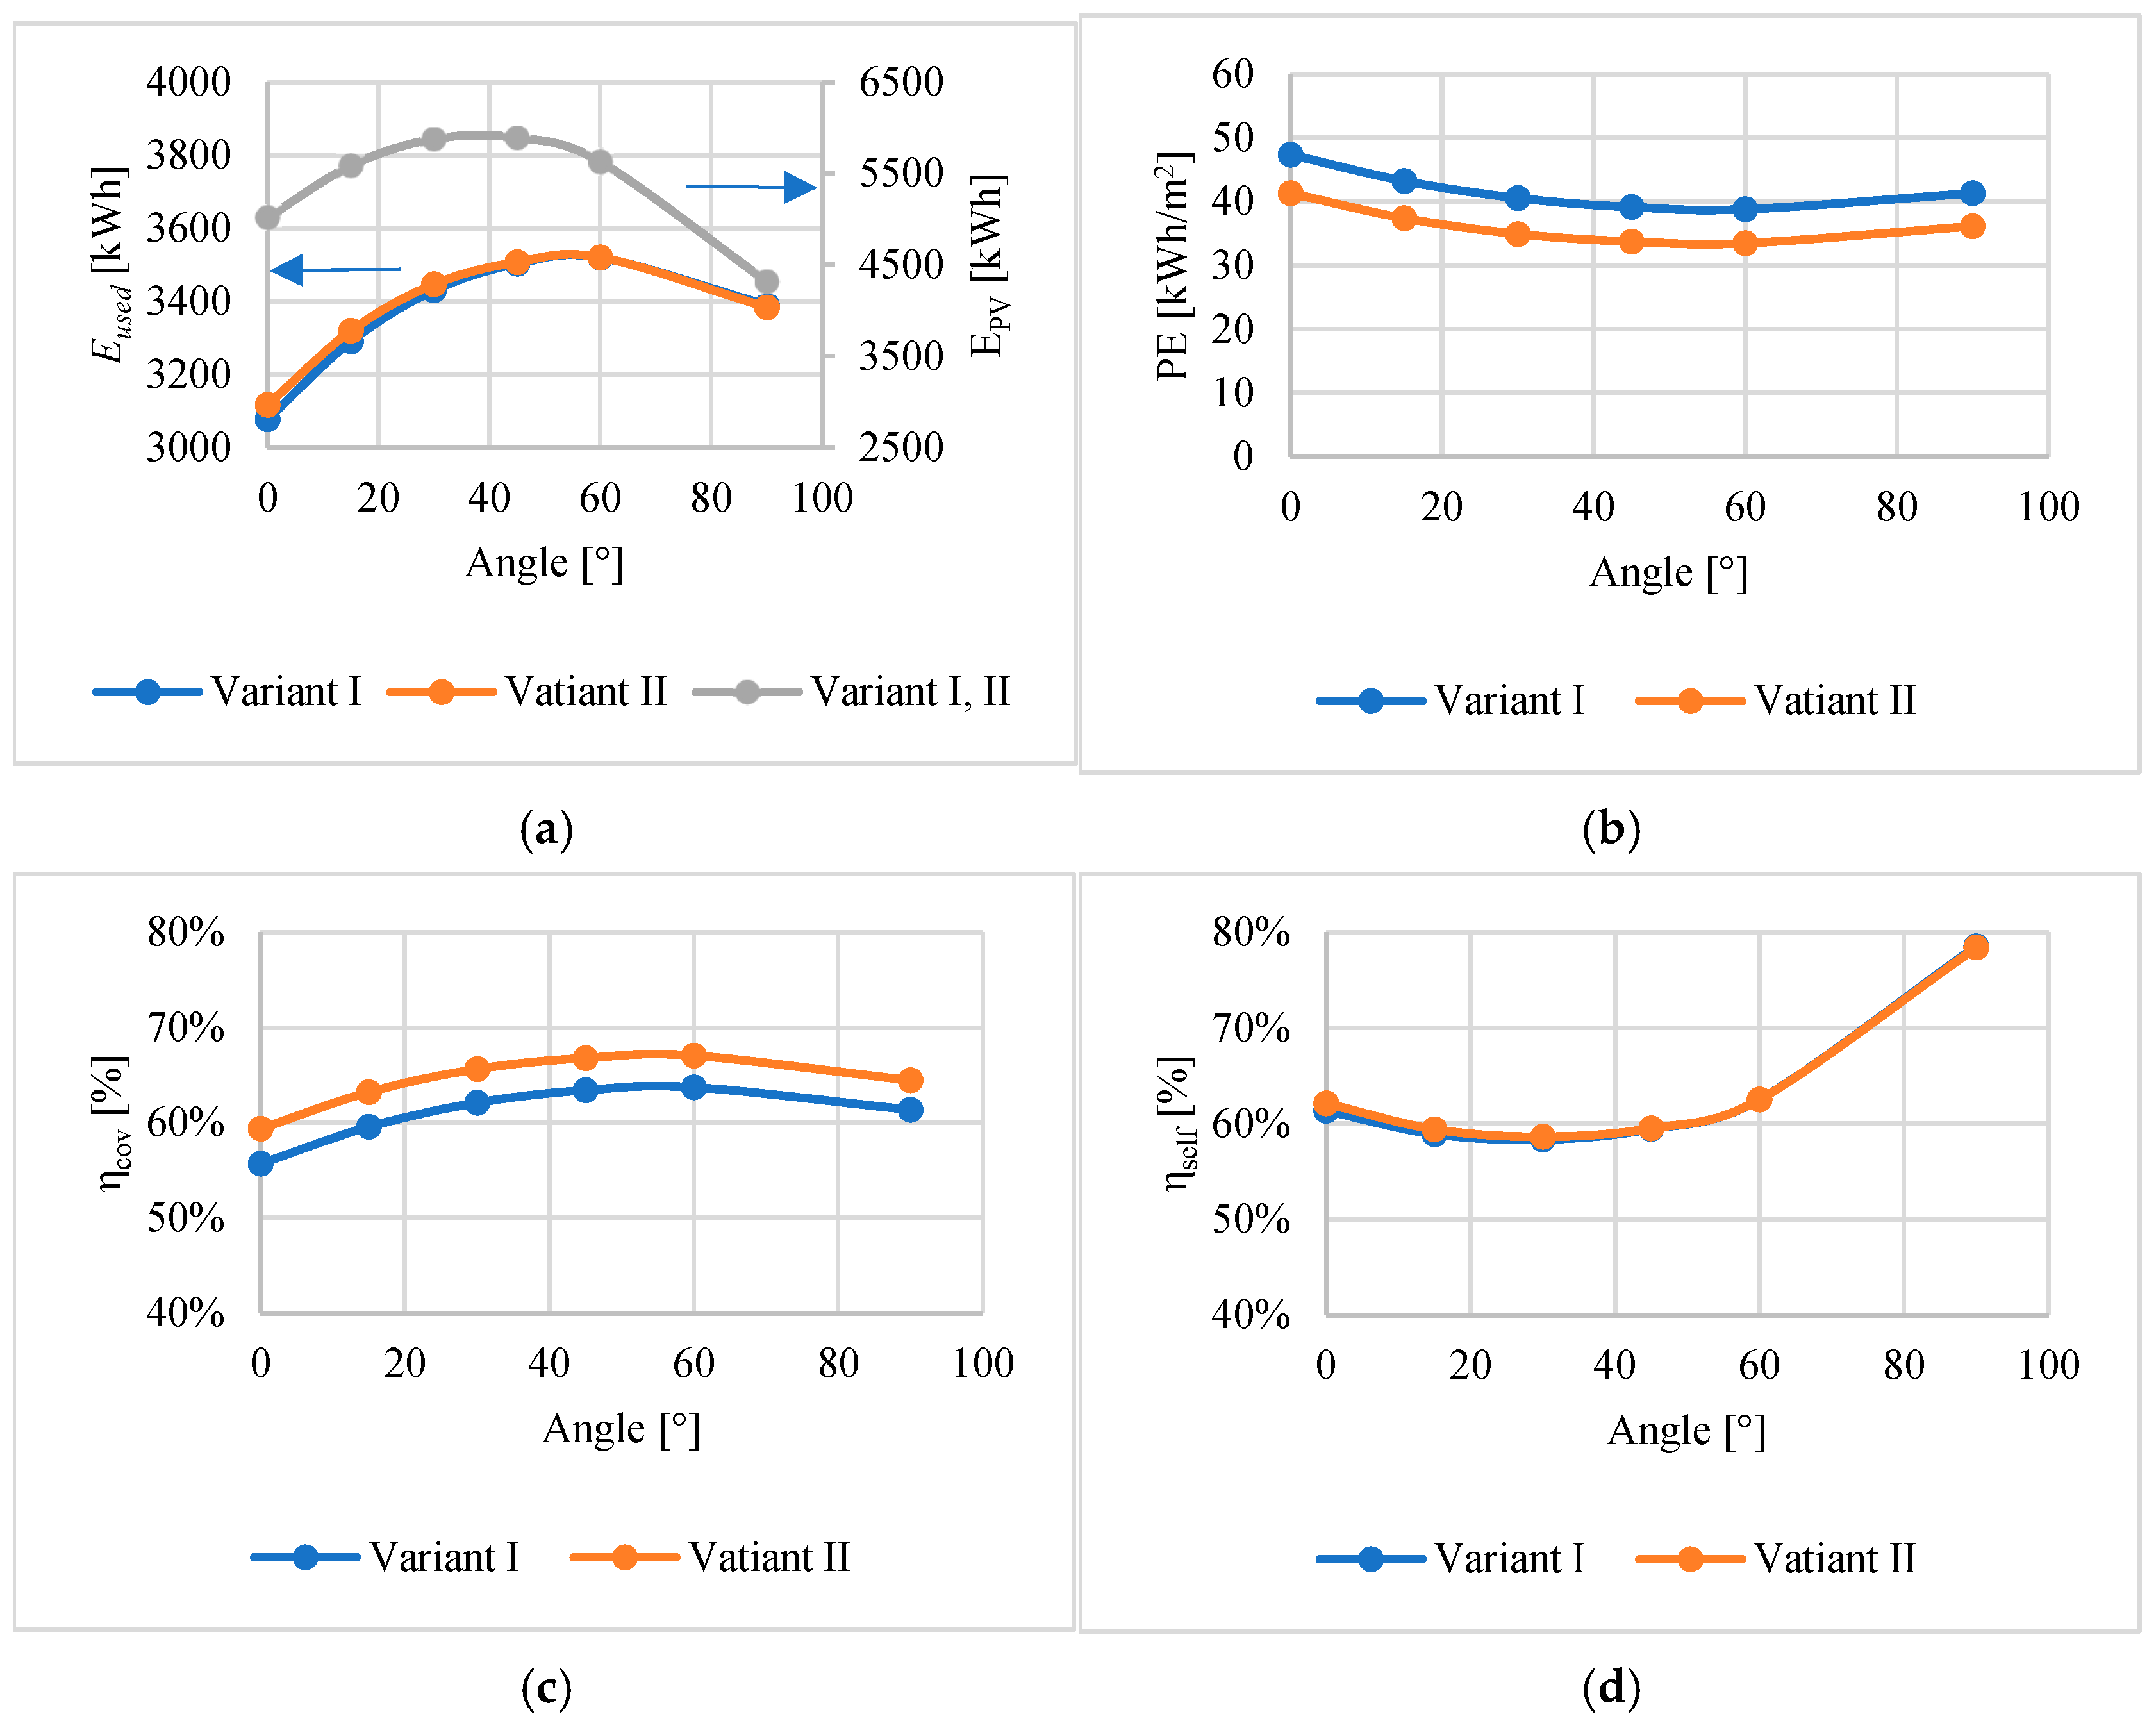
Figure 5 shows the influence of the inclination angle of photovoltaic panels on the amount of energy produced by the panels (EPV) and used by the system (Eused), the primary energy index (PE), the extent to which photovoltaic panels were able to cover the energy demand of the analyzed system (ηcov), and the extent to which energy produced by the panels was used by the system (ηself) in two building insulation variants.
Figure 5.
Influence of the inclination angle of photovoltaic panels on: (a) the amount of electricity produced by photovoltaic panels and used by the system, (b) the PE index, (c) the degree of coverage of the system’s electricity demand by photovoltaic panels, and (d) the degree of self-consumption of photovoltaic panels.
The total amount of electricity produced by photovoltaic panels was the same for both variants and increased with inclination of the PV panels to 45° and then decreased, reaching the lowest value (4316 kWh) at an inclination of 90°. The results obtained for angles of 30° and 45° were really similar and characterized by the highest value (almost 5900 kWh). The characteristics of the changes in the amount of energy produced by photovoltaic panels depending on the angle of inclination were consistent with those presented in [].
Considering the total amount of electricity produced by the panels and then used by the system, it increased up to an angle of 60°, with the highest growth rate observed between 0° and 30°. The maximum amount of energy used by the system was 3521 kWh (Variant II) and was 13% higher than the minimum (3117 kWh) obtained in the same variant. The difference between the variants was not significant, but the greatest differences can be observed for angles in the range of 0–30°.
The PE index decreased with the inclination angle of photovoltaic panels to 60° (a decrease of approx. 18–19%) and then increased slightly, reaching 41.3 kWh/m2 in Variant I and 36.2 kWh/m2 in Variant II. Regardless of the inclination angle of the panels, higher PE values characterized Variant I.
The degree of coverage of the system’s electricity demand by photovoltaic panels depending on the inclination angle ranged from 55.7% to 63.7% in Variant I and from 59.4% to 67.1% in Variant II. The course of changes in this parameter depending on the inclination angle of photovoltaic panels was analogous to that of the Eused parameter.
The degree of self-consumption of energy generated by photovoltaic panels depending on the inclination angle ranged from 58.4% to 78.6% in Variant I and from 58.6% to 78.4% in Variant II. The course of changes in this parameter depending on the inclination angle of photovoltaic panels was the opposite to that of the Eused and ηcov parameters. The highest degree of self-consumption was achieved at an angle of 90°, while the lowest at 30°.
3.3. Influence of the Orientation of Photovoltaic Panels
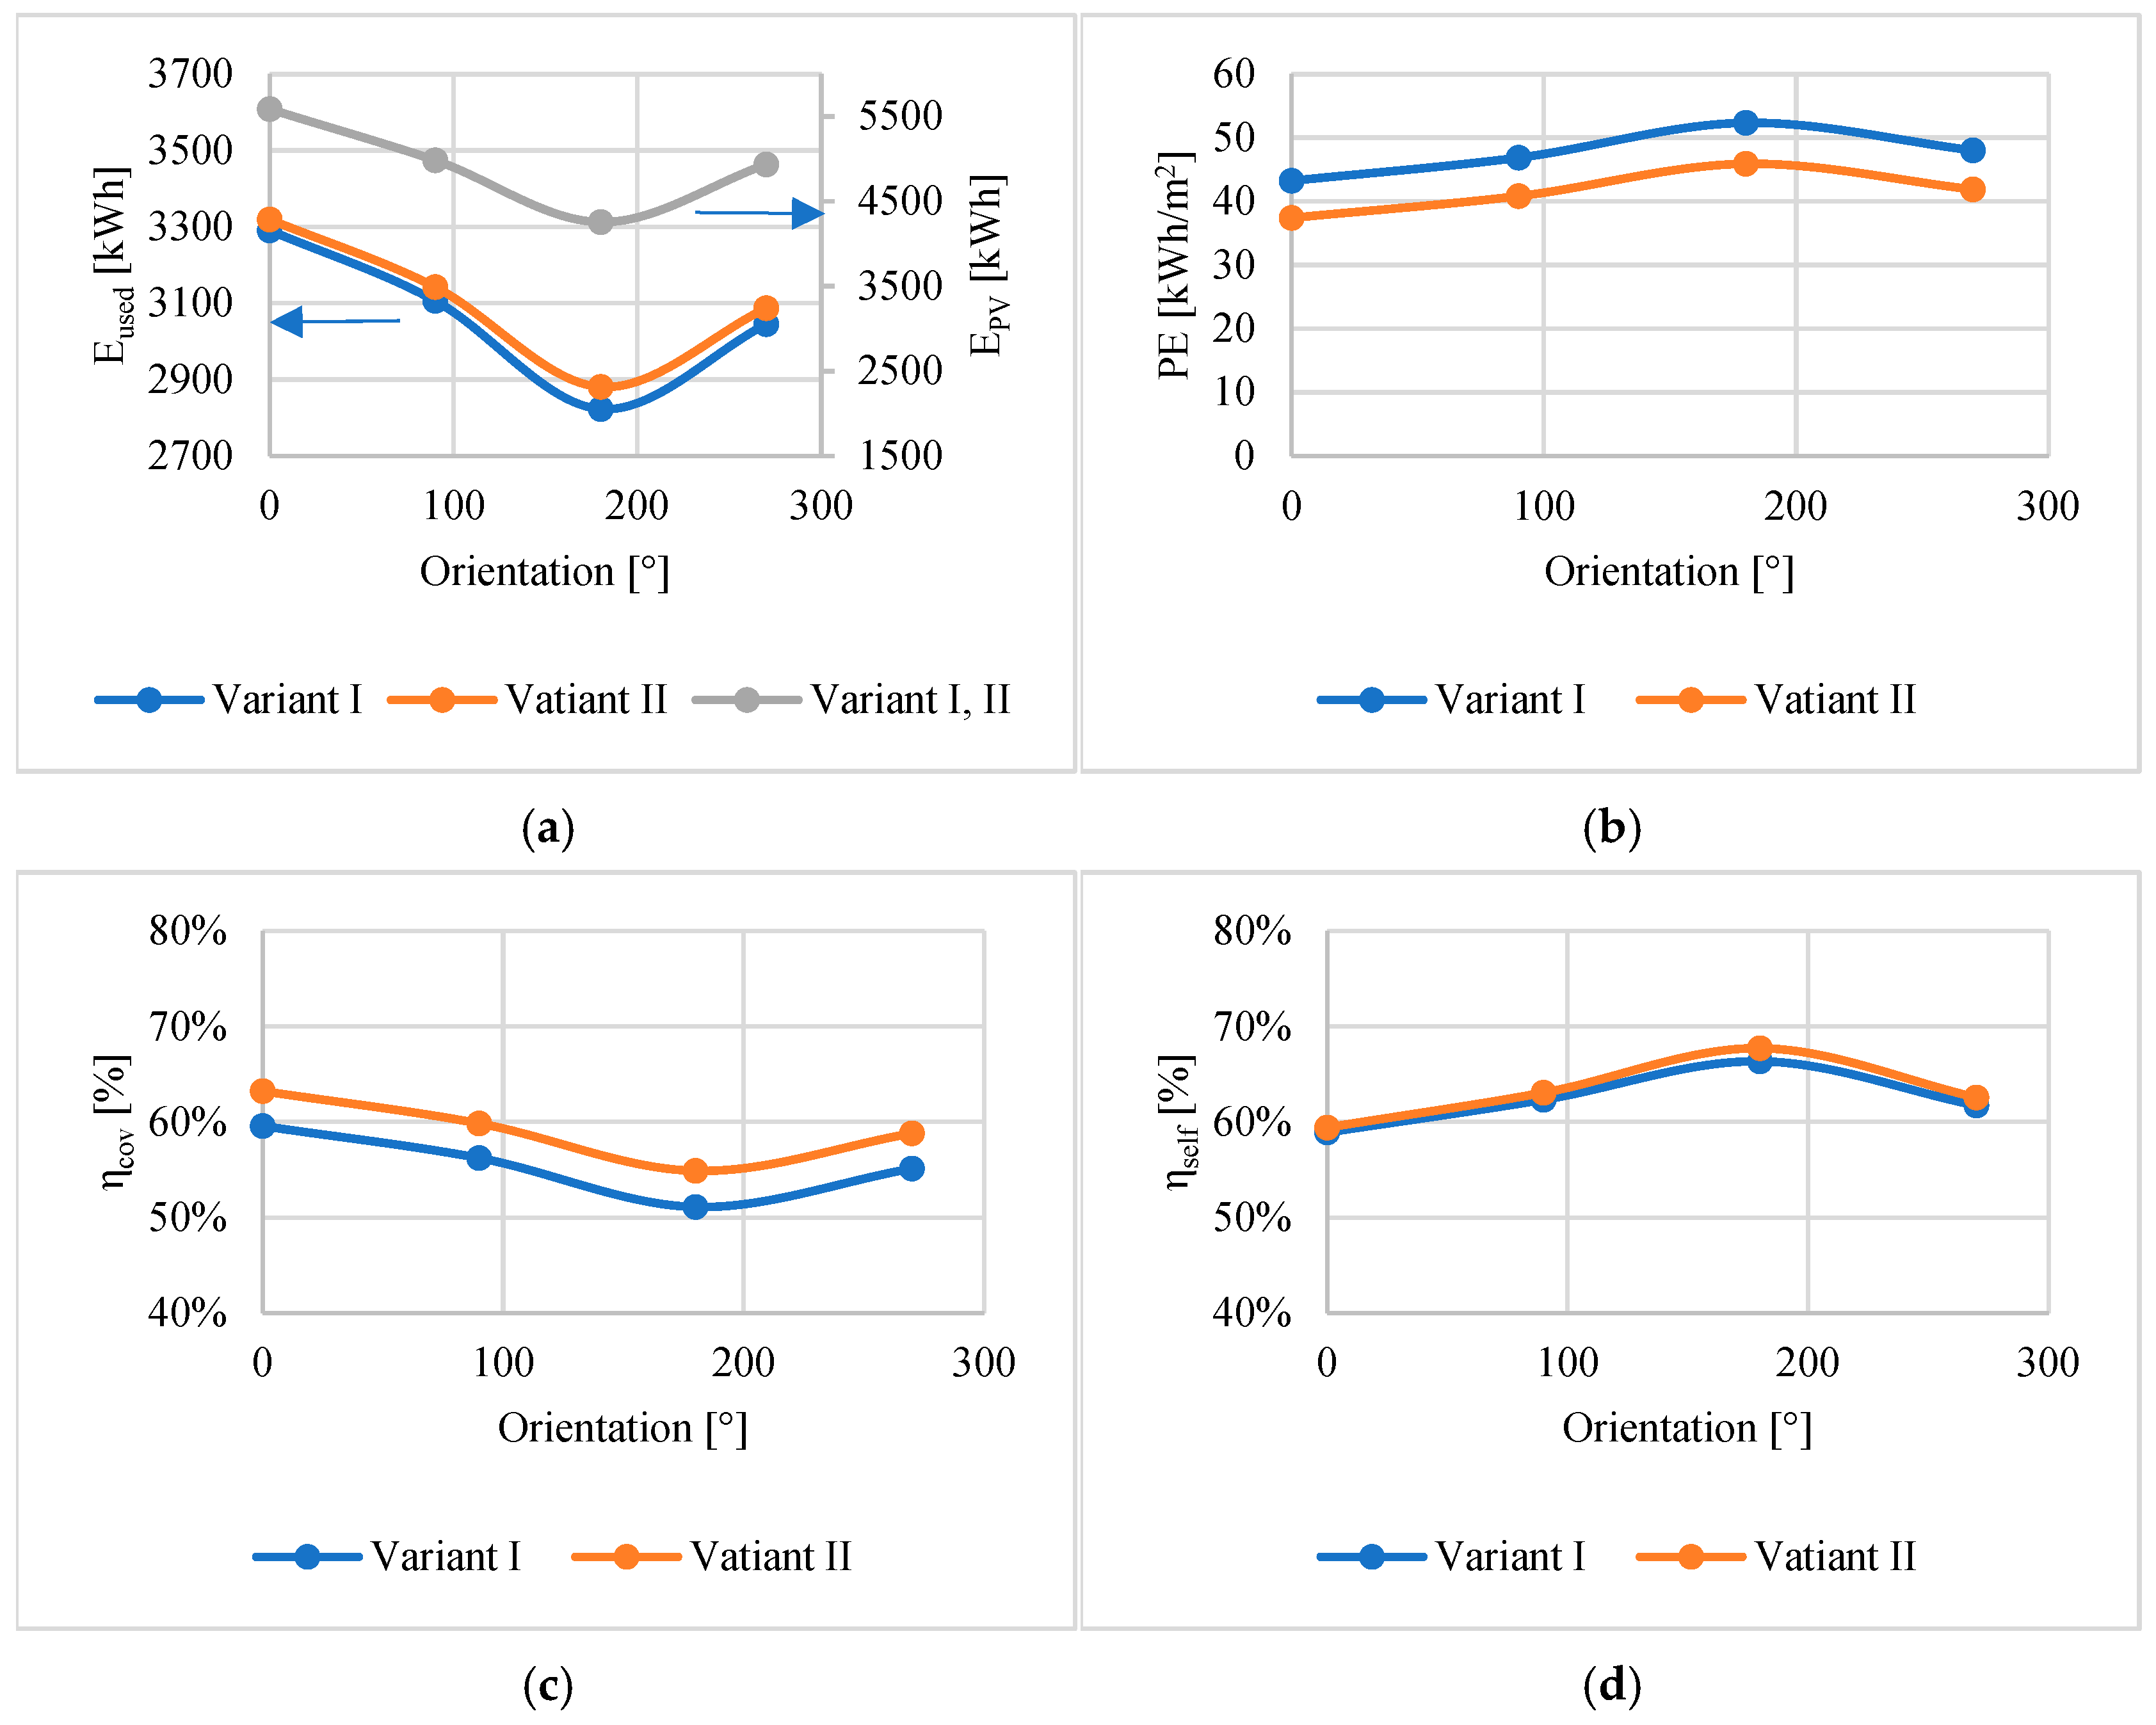
Figure 6 shows the influence of the orientation of photovoltaic panels on the amount of energy produced by the panels (EPV) and used by the system (Eused), the primary energy index (PE), the extent to which photovoltaic panels were able to cover the energy demand of the analyzed system (ηcov), and the extent to which energy produced by the panels was used by the system (ηself) in two building insulation variants.
Figure 6.
Influence of the orientation of photovoltaic panels on: (a) the amount of electricity produced by photovoltaic panels and used by the system, (b) the PE index, (c) the degree of coverage of the system’s electricity demand by photovoltaic panels, and (d) the degree of self-consumption of photovoltaic panels.
The total amount of electricity produced by the photovoltaic panels was the same for both variants and decreased from 5586 kWh to 4256 kWh as position of the PV panels changed from southern (0°) through western (90°) to northern (180°) and then increased when their orientation changed from northern to the eastern roof slope (270°). The results for the 90° and 270° orientations were similar (above 4900 kWh), with a slight advantage for the western direction. The amount of electricity produced by the panels and then used by the system followed the same pattern as EPV. The Eused values in Variant II were 0.9–2% higher than in Variant I.
The PE index increased as the orientation of the panels changed from 0° do 180° (by 21–23% depending on the variant) and then decreased from 180° to 270° (by approx. 8–9%).
The degree of coverage of the system’s electricity demand by photovoltaic panels depending on the orientation ranged from 51.1% to 59.6% in Variant I and from 54.9% to 63.2% in Variant II. As in the case of EPV and Eused, the highest values were achieved for the southern orientation (0°) and the lowest for the northern (180°). The prevalence of south-facing orientation of photovoltaic panels was also confirmed in a study by Middelhauve [].
The degree of self-consumption of energy generated by photovoltaic panels depending on the orientation ranged from 58.9% to 66.4% in Variant I and from 59.4% to 67.7% in Variant II. In contrast to EPV, Eused, and ηcov, the highest value was achieved for the northern orientation (180°), while the lowest for the southern (0°).
3.4. Influence of the Total Surface Area of Photovoltaic Panels
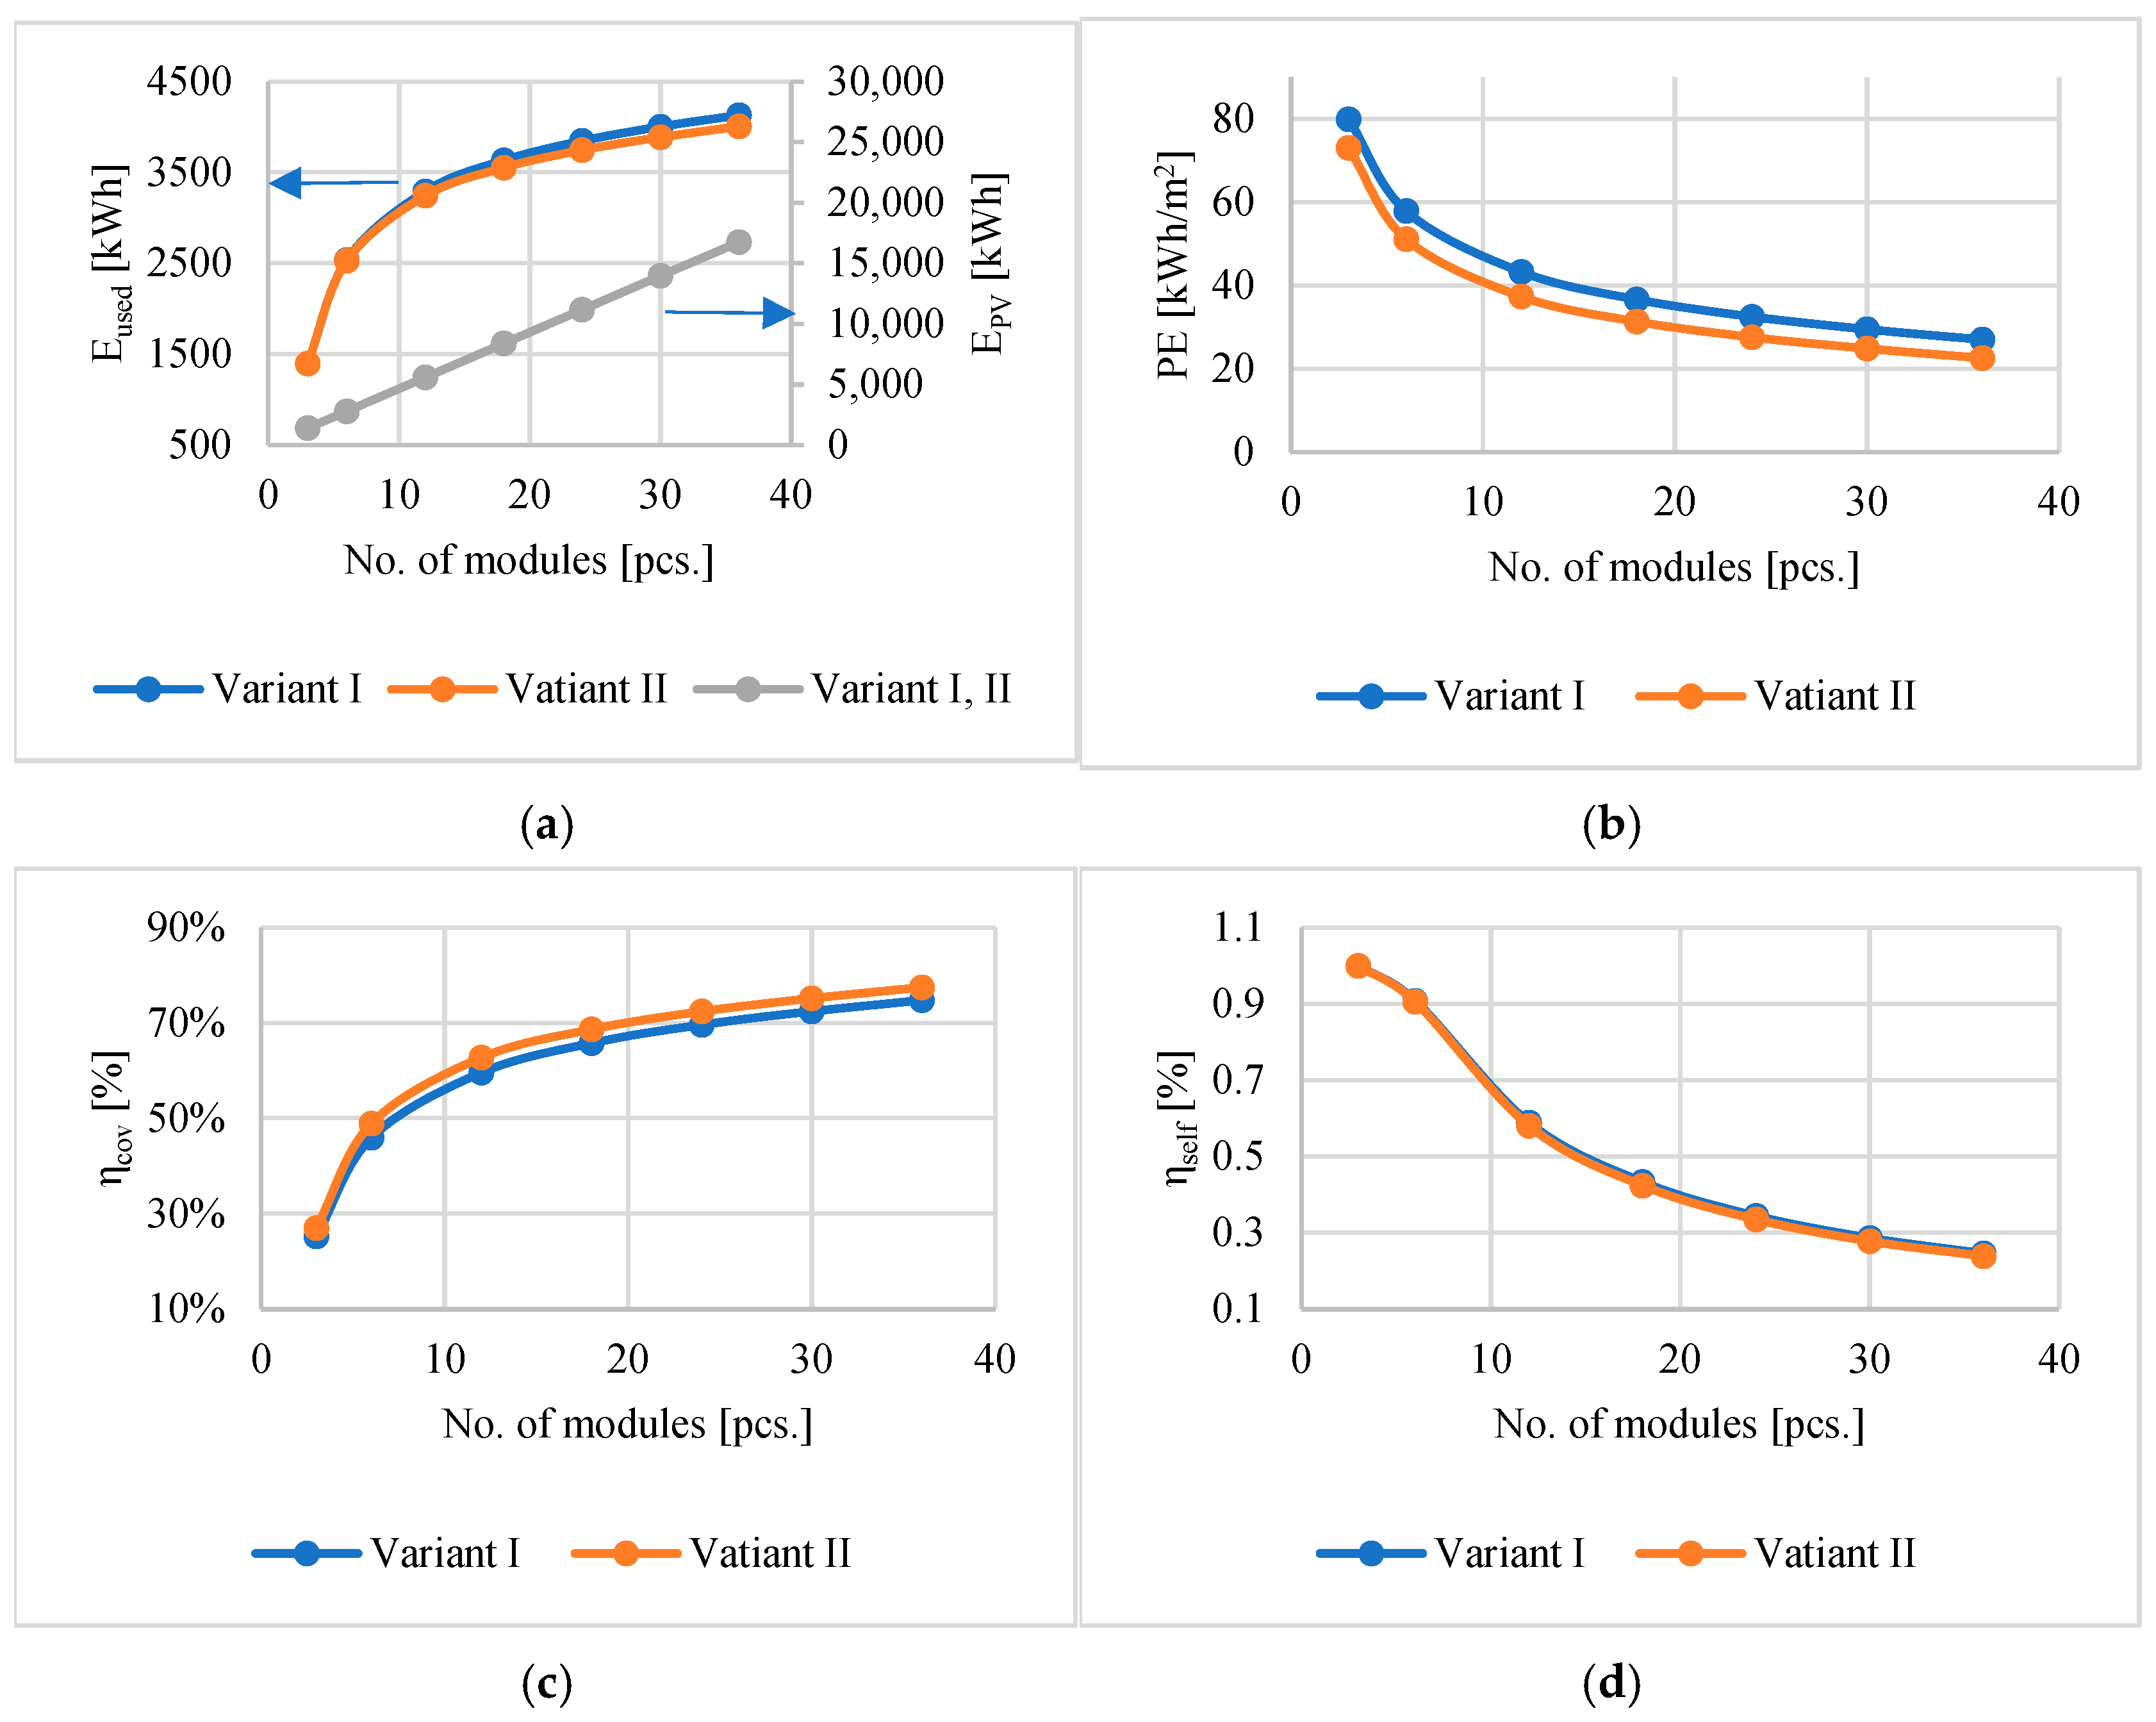
Figure 7 shows the influence of the total surface area of photovoltaic panels on the amount of energy produced by the panels (EPV) and used by the system (Eused), the primary energy index (PE), the extent to which photovoltaic panels were able to cover the energy demand of the analyzed system (ηcov), and the extent to which energy produced by the panels was used by the system (ηself) in two building insulation variants.
Figure 7.
Influence of the area of photovoltaic panels on: (a) the amount of electricity produced by photovoltaic panels and used by the system, (b) the PE index, (c) the degree of coverage of the system’s electricity demand by photovoltaic panels, and (d) the degree of self-consumption of photovoltaic panels.
The total amount of electricity produced by photovoltaic panels was the same for both variants and increased linearly with the number of PV modules and, thus, their surface area. For 3 modules, the value obtained was 1397 kWh, while, for 36 modules, it was as high as 16,759 kWh.
The amount of energy produced by photovoltaic panels and then used by the system was also directly proportional to their surface area but, in this case, it is worth noting that the dynamics of Eused changes decreased with the increase in the number of modules. For the panels with the smallest surface area (three modules), the system used 100% of the energy produced, while, in the case of the largest surface area (36 modules), only about 24% could be received by the system. The largest differences between the variants were observed for the largest number of modules, and it was almost 3%.
The PE index decreased with the increase in the number of installed PV modules (from 80 to 27 kWh/m2 in Variant I and from 73.1 to 22.6 kWh/m2 in Variant II), with the greatest dynamic observed in the range of 3–12 modules. As the total area of the PV modules increased, the dynamics of the PE changes decreased.
The degree of coverage of the system’s electricity demand by photovoltaic panels, depending on the number of modules, ranged from 25.3% to 74.8% in Variant I and from 27% to 77.5% in Variant II. The characteristics of changes in this parameter were the same as in the case of Eused. The differences between the individual variants ranged from 1.7 to 3.1 pps.
The degree of self-consumption of energy generated by photovoltaic panels depending on the number of modules ranged from 23.9% to 100%, taking both variants into account. The differences between the variants, regardless of PV area, were less than or equal to 1.0 pps. The characteristics of ηself depending on the area of photovoltaic panels were the opposite of those for the Eused and ηcov parameters. The highest degree of self-consumption was achieved with 3 modules, while the lowest with 36.
4. Conclusions
This study presents a simulation-based analysis of a modern HVAC system and the influence of selected photovoltaic panel parameters on the primary energy (PE) index in a low-energy building equipped with an air-source heat pump and heat recovery ventilation, considering two variants of building insulation. In each variant and each system configuration, the total amount of energy produced by the panels and used by the system were also assessed, as well as the degree to which the system’s electricity demand was covered by the photovoltaic panels and their self-consumption potential. A summary of the simulation results is provided in the table below (Table 9).
Table 9.
Summary of analysis results.
Based on the results obtained, it was demonstrated that:
- Improving the building’s thermal insulation reduced the amount of energy generated and used by the heat pump by 25% and 24%, respectively, while increasing the degree of maintaining the set temperature in the building by 2.2 pps;
- Mechanical ventilation provided significant support for heating the building, generating over 4000 kWh of energy per year.;
- In the baseline scenarios, photovoltaic panels were able to generate 5586 kWh of electricity, covering an average of 70–72% of the system’s demand based on daily results and 60–63% on an annual calculation;
- The degree of self-consumption of photovoltaic panels was inversely proportional to ηcov and, in the baseline scenarios, was on average almost 77% in daily settlements and approx. 59% for the whole year;
- All analyzed factors (inclination angle, orientation, and surface area) proved to be very important in planning a photovoltaic installation;
- Depending on the configuration of the analyzed parameters, the following results were achieved:
- 1397 kWh ≤ EPV ≤ 16,759 kWh;
- 1397 kWh ≤ Eused ≤ 4130 kWh;
- 25.3% ≤ ηcov ≤ 77.5%;
- 23.9% ≤ ηself ≤ 100%;
- 22.6 kWh/m2 ≤ PE ≤ 80 kWh/m2.
Based on the example of the analyzed building, it can be concluded that the most advantageous solution in the relatively cold climate of north-eastern Poland is to use thermal insulation with heat transfer coefficients of walls, floors, and roofs below 0.1 W/(m2∙K), while also using south-facing photovoltaic panels with an angle of inclination between 30 and 45° and a medium number of modules (10–20 pcs.).
The results obtained in this analysis are directly relevant to the building modernization and decarbonization measures currently underway in Poland. Government support instruments, such as the “Czyste Powietrze” (ang. Clean Air) program subsidizing thermal modernization and replacement of old heat sources and prosumer support programs, e.g., “Mój Prąd” (ang. My Electricity), already promote measures that our study has found to be effective in reducing energy demand.
In addition, as part of larger-scale investment frameworks (including the National Recovery Plan), the Polish government has allocated significant funds to energy-efficient building renovations, including the implementation of heat pump and photovoltaic panel solutions, as well as heat storage systems. Such combinations are expected to accelerate emissions reductions and increase the households’ resilience to energy price fluctuations, especially in the cold climate of north-eastern Poland, as confirmed in this study.
The results obtained in this analysis emphasize the importance of the technical parameters of photovoltaic panels for the energy performance of low-energy buildings with air-source heat pumps and provide an important introduction to further research on optimizing energy consumption in buildings.
The main limitations of this study include:
- Lack of calibration and/or validation of the model and its purely theoretical nature, which may lead to discrepancies with the results obtained under actual system operating conditions;
- Lack of taking into account life cycle cost (LCC) analysis and economic evaluation of variants, including the impact of variable electricity tariffs, which limited the possibility of analyzing profitability and economic optimization potential;
- Lack of including energy storage in the model (apart from the buffer tank);
- Use of simplified control logic based solely on the thermostat signal;
- Lack of taking into account seasonal variability and extreme weather conditions in the analysis.
Further research directions include extending the model with electricity storage components, implementing smart control strategies, analyzing the system’s operation in different climatic conditions, and evaluating individual scenarios in technical and economic terms in the context of the energy transition of buildings.
Author Contributions
Conceptualization, A.O., A.R.S. and D.A.K.; methodology, A.O.; software, A.O.; validation, A.O.; formal analysis, A.O.; investigation, A.O.; resources, A.O.; data curation, A.O.; writing—original draft preparation, A.O.; writing—review and editing, A.O., A.R.S. and D.A.K.; visualization, A.O.; supervision, D.A.K.; project administration, D.A.K.; funding acquisition, A.O. and D.A.K. All authors have read and agreed to the published version of the manuscript.
Funding
This research was carried out as a part of the works no. WI/WB-IIŚ/9/2022 and WZ/WB-IIL/2/2023 at the Bialystok University of Technology and was financed from the research subvention provided by the Minister responsible for science.
Data Availability Statement
Data is contained within this article.
Conflicts of Interest
The authors declare no conflicts of interest.
Nomenclature
The following symbols, Greek letters and abbreviations are used in this manuscript:
| Dpeople | Schedule of daily occupancy (-) |
| Dlight | Schedule of daily lighting and equipment usage (-) |
| EPV | Amount of energy produced by the photovoltaic panels (kWh) |
| Eused | Amount of energy used by the system (kWh) |
| PASHP | Amount of energy consumed by the air-source heat pump (kWh) |
| PHRV | Amount of energy consumed by the heat recovery ventilation (kWh) |
| Qpeople | Heat gains from people (kJ/h) |
| Qlight | Heat gains from light (kJ/h) |
| Qequip | Heat gains from equipment (kJ/h) |
| QPV | Amount of energy produced by the photovoltaic installation (kWh) |
| QASHP | Amount of energy produced by the air-source heat pump (kWh) |
| QHRV | Amount of energy produced by the heat recovery ventilation (kWh) |
| Tsupply | System supply temperature (°C) |
| Troom | Temperature in the room (°C) |
| U | Heat transfer coefficient (W/(m2∙K)) |
| ηcov | Degree of coverage of the system’s electricity demand by photovoltaic panels (%) |
| ηself | Degree of consumption by the system of energy generated by photovoltaic panels (%) |
| ηTset | Degree of maintaining the set room temperature (%) |
| ASHP | Air-source heat pump |
| COP | Coefficient of performance |
| DHW | Domestic hot water |
| EIWH | Electric instantaneous water heater |
| FE | Final energy |
| HP | Heat pump |
| HRV | Heat recovery ventilation |
| HVAC | Heating, ventilation, air conditioning |
| HX | Heat exchanger |
| PE | Primary energy |
| PV | Photovoltaic panel |
References
- Maduta, C.; D’Agostino, D.; Tsemekidi-Tzeiranaki, S.; Castellazzi, L.; Melica, G.; Bertoldi, P. Towards climate neutrality within the European Union: Assessment of the Energy Performance of Buildings Directive implementation in Member States. Energy Build. 2023, 301, 113716. [Google Scholar] [CrossRef]
- Sowa, S. The implementation of renewable energy systems, as a way to improve energy efficiency in residential buildings. Polityka Energetyczna Energy Policy J. 2020, 23, 19–36. [Google Scholar] [CrossRef]
- D’Agostino, D.; Mazzella, S.; Minelli, F.; Minichiello, F. Obtaining the NZEB target by using photovoltaic systems on the roof for multi-storey buildings. Energy Build. 2022, 267, 112147. [Google Scholar] [CrossRef]
- Wang, X.; Xia, L.; Bales, C.; Zhang, X.; Copertaro, B.; Pan, S.; Wu, J. A systematic review of recent air source heat pump (ASHP) systems assisted by solar thermal, photovoltaic and photovoltaic/thermal sources. Renew. Energy 2020, 146, 2472–2487. [Google Scholar] [CrossRef]
- Shahee, A.; Abdoos, M.; Aslani, A.; Zahedi, R. Reducing the energy consumption of buildings by implementing insulation scenarios and using renewable energies. Energy Inform. 2024, 7, 18. [Google Scholar] [CrossRef]
- Mghazli, M.O.; Bahrar, M.; Charai, M.; Lamdouar, N.; El Mankibi, M. Advancing the Net Zero emission building concept: Integrating photovoltaics and electrical storage for NZEB environmental performance in different energy and climate contexts. Sol. Energy 2025, 290, 113331. [Google Scholar] [CrossRef]
- Li, Y.; Rosengarten, G.; Stanley, C.; Mojiri, A. Electrification of residential heating, cooling and hot water: Load smoothing using onsite photovoltaics, heat pump and thermal batteries. J. Energy Storage 2022, 56, 105873. [Google Scholar] [CrossRef]
- Li, Y.; Mojiri, A.; Rosengarten, G.; Stanley, C. Residential demand-side management using integrated solar-powered heat pump and thermal storage. Energy Build. 2021, 250, 111234. [Google Scholar] [CrossRef]
- Lv, Y.; Si, P.; Liu, J.; Ling, W.; Yan, J. Performance of a Hybrid Solar Photovoltaic—Air Source Heat Pump System with Energy Storage. Energy Procedia 2019, 158, 1311–1316. [Google Scholar] [CrossRef]
- Wang, Y.; Hu, B.; Meng, X.; Xiao, R. A Comprehensive Review on Technologies for Achieving Zero-Energy Buildings. Sustainability 2024, 16, 10941. [Google Scholar] [CrossRef]
- Jaysawal, R.K.; Chakraborty, S.; Elangovan, D.; Padmanaban, S. Concept of net zero energy buildings (NZEB)—A literature review. Clean. Eng. Technol. 2022, 11, 100582. [Google Scholar] [CrossRef]
- Firoozi, A.A.; Oyejobi, D.O.; Firoozi, A.A. Innovations in energy-efficient construction: Pioneering sustainable building practices. Clean. Eng. Technol. 2025, 26, 100957. [Google Scholar] [CrossRef]
- Ibrahim, M.M.; Suarez-Lopez, M.J.; Hanafy, A.A.; William, M.A. Optimizing NZEB performance: A review of design strategies and case studies. Results Eng. 2025, 25, 103950. [Google Scholar] [CrossRef]
- Wu, W.; Skye, H.M. Residential net-zero energy buildings: Review and perspective. Renew. Sustain. Energy Rev. 2021, 142, 110859. [Google Scholar] [CrossRef]
- Moran, P.; Goggins, J.; Hajdukiewicz, M. Super-insulate or use renewable technology? Life cycle cost, energy and global warming potential analysis of nearly zero energy buildings (NZEB) in a temperate oceanic climate. Energy Build. 2017, 139, 590–607. [Google Scholar] [CrossRef]
- Choi, W.-J.; Lee, W.; Kim, D.-W.; An, Y.; Joo, H.-J.; Hong, J.Y.; Kim, M.-H. Experimental investigation of the energy performance of a photovoltaic-thermal assisted ground source heat pump system for net plus energy houses. Case Stud. Therm. Eng. 2025, 69, 105974. [Google Scholar] [CrossRef]
- Tamašauskas, R.; Šadauskiene, J.; Krawczyk, D.A.; Medeliene, V. Analysis of Primary Energy Factors from Photovoltaic Systems for a Nearly Zero Energy Building (NZEB): A Case Study in Lithuania. Energies 2020, 13, 4099. [Google Scholar] [CrossRef]
- Grazieschi, G.; Asdrubali, F.; Guattari, C. Neighbourhood sustainability: State of the art, critical review and space-temporal analysis. Sustain. Cities Soc. 2020, 63, 102477. [Google Scholar] [CrossRef]
- Evangelisti, L.; De Cristo, E.; Vollaro, R.D.L. In Situ Winter Performance and Annual Energy Assessment of an Ultra-Lightweight, Soil-Free Green Roof in Mediterranean Climate: Comparison with Traditional Roof Insulation. Energies 2025, 18, 4581. [Google Scholar] [CrossRef]
- Zukowski, M. A Small Modular House as a Response to the Energy Crisis. Energies 2022, 15, 8058. [Google Scholar] [CrossRef]
- Ahmad, A.; Power, N.; Finegan, E. Maximising solar PV potential: A comprehensive review of factors affecting photovoltaic installation and generation in a mild temperate oceanic climate. Sol. Energy Adv. 2025, 5, 100111. [Google Scholar] [CrossRef]
- Middelhauve, L.; Marechal, F.; Baldi, F.; Stadler, P.; Bloch, L. Influence of photovoltaic panel orientation on modern energy systems in residential buildings. In Proceedings of the 32nd International Conference on Efficiency, Cost, Optimization, Simulation and Environmental Impact of Energy Systems, Wroclaw, Poland, 23–28 June 2019; Available online: https://infoscience.epfl.ch/handle/20.500.14299/159220 (accessed on 23 August 2025).
- Talebizadeh, P.; Mehrabian, M.A.; Abdolzadeh, M. Prediction of the optimum slope and surface azimuth angles using the Genetic Algorithm. Energy Build. 2011, 43, 2998–3005. [Google Scholar] [CrossRef]
- Mondol, J.D.; Yohanis, Y.G.; Norton, B. The impact of array inclination and orientation on the performance of a grid-connected photovoltaic system. Renew. Energy 2007, 32, 118–140. [Google Scholar] [CrossRef]
- Ołtarzewska, A.; Krawczyk, D.A. Simulation and Performance Analysis of an Air-Source Heat Pump and Photovoltaic Panels Integrated with Service Building in Different Climate Zones of Poland. Energies 2024, 17, 1182. [Google Scholar] [CrossRef]
- Litjens, G.; Worrell, E.; van Sark, W. Influence of demand patterns on the optimal orientation of photovoltaic systems. Sol. Energy 2017, 155, 1002–1014. [Google Scholar] [CrossRef]
- Lahnaoui, A.; Stenzel, P.; Linssen, J. Tilt Angle and Orientation Impact on the Techno-economic Performance of Photovoltaic Battery Systems. Energy Procedia 2017, 105, 4312–4320. [Google Scholar] [CrossRef]
- Rana, S.; Sommerfeldt, N.; Pearce, J.M. Best practices of techno-economic methods for solar photovoltaic coupled heat pump analysis in cold climates. Energy Build. 2025, 328, 115196. [Google Scholar] [CrossRef]
- Pearce, J.M.; Sommerfeldt, N. Economics of Grid-Tied Solar Photovoltaic Systems Coupled to Heat Pumps: The Case of Northern Climates of the U.S. and Canada. Energies 2021, 14, 834. [Google Scholar] [CrossRef]
- Ha, S.W.; Park, S.H.; Eom, J.Y.; Oh, M.S.; Cho, G.Y.; Kim, E.J. Parameter Calibration for a TRNSYS BIPV Model Using In Situ Test Data. Energies 2020, 13, 4935. [Google Scholar] [CrossRef]
- Jakhar, S.; Soni, M.S.; Gakkhar, N. Parametric modeling and simulation of photovoltaic panels with earth water heat exchanger cooling. Geotherm. Energy 2016, 4, 10. [Google Scholar] [CrossRef]
- Zhao, W.; Han, Z.; Wu, Y.; Lu, H. Numerical simulation of dust deposition influences on building integrated photovoltaic array. Renew. Energy 2025, 250, 123334. [Google Scholar] [CrossRef]
- Abdallah, M.; Zisis, I. Wind-induced loads on photovoltaic (PV) panels on low-sloped gable roofs: Panel size effects. J. Wind. Eng. Ind. Aerodyn. 2025, 263, 106129. [Google Scholar] [CrossRef]
- Pendem, S.R.; Mikkili, S. Modeling, simulation, and performance analysis of PV array configurations (Series, Series-Parallel, Bridge-Linked, and Honey-Comb) to harvest maximum power under various Partial Shading Conditions. Int. J. Green Energy 2018, 15, 795–812. [Google Scholar] [CrossRef]
- Nešović, A.; Radaković, A.; Cvetković, D.; Kowalik, R.; Saveljić, I. Approaching the single-family building to the zero residential building status by implementing photovoltaic panels and external wall-roof pergolas for different locations in the Western Serbia region. Energy Build. 2025, 346, 116173. [Google Scholar] [CrossRef]
- Stamatellos, G.; Zogou, O.; Stamatelos, A. Energy Performance Optimization of a House with Grid-Connected Rooftop PV Installation and Air Source Heat Pump. Energies 2021, 14, 740. [Google Scholar] [CrossRef]
- Roselli, C.; Sasso, M.; Tariello, F. Integration between electric heat pump and PV system to increase self-consumption of an office application. Renew. Energy Environ. Sustain. 2017, 2, 28. [Google Scholar] [CrossRef]
- Marrasso, E.; Roselli, C.; Tariello, F. Comparison of Two Solar PV-Driven Air Conditioning Systems with Different Tracking Modes. Energies 2020, 13, 3585. [Google Scholar] [CrossRef]
- Mahjoob, A.; Ahmadi, P.; Afsaneh, H.; Vojdani, M.; Mortazavi, M. System sizing and transient simulation of a solar photovoltaic off-grid energy system in various climates with air heat pumps. Sustain. Energy Technol. Assess. 2022, 54, 102788. [Google Scholar] [CrossRef]
- Zukowski, M. Multi-aspect analysis of measures to reduce the building’s energy demand. J. Build. Eng. 2024, 91, 109758. [Google Scholar] [CrossRef]
- Jezierski, W.; Sadowska, B.; Pawłowski, K. Impact of Changes in the Required Thermal Insulation of Building Envelope on Energy Demand, Heating Costs, Emissions, and Temperature in Buildings. Energies 2021, 14, 56. [Google Scholar] [CrossRef]
- Cholewa, T.; Balaras, C.A.; Nižetić, S.; Siuta-Olcha, A. On calculated and actual energy savings from thermal building renovations—Long term field evaluation of multifamily buildings. Energy Build. 2020, 223, 110145. [Google Scholar] [CrossRef]
- Woroniak, G.; Piotrowska-Woroniak, J.; Woroniak, A.; Owczarek, E.; Giza, K. Analysis of the Hybrid Power-Heating System in a Single-Family Building, along with Ecological Aspects of the Operation. Energies 2024, 17, 2601. [Google Scholar] [CrossRef]
- Barwińska-Małajowicz, A.; Pyrek, R.; Szczotka, K.; Szymiczek, J.; Piecuch, T. Improving the Energy Efficiency of Public Utility Buildings in Poland through Thermomodernization and Renewable Energy Sources—A Case Study. Energies 2023, 16, 4021. [Google Scholar] [CrossRef]
- Rabczak, S.; Mateichyk, V.; Smieszek, M.; Nowak, K.; Kolomiiets, S. Evaluating the Energy Efficiency of Combining Heat Pumps and Photovoltaic Panels in Eco-Friendly Housing. Appl. Sci. 2024, 14, 5575. [Google Scholar] [CrossRef]
- Wciślik, S.; Kotrys-Działak, D. Thermal building upgrade with off-grid PV system: A Polish case. Energy Effic. 2021, 14, 1–22. [Google Scholar] [CrossRef]
- Hołota, E.; Życzyńska, A.; Dyś, G. Analysis of Real and Simulated Energy Produced by a Photovoltaic Installations Located in Poland. Energies 2025, 18, 5279. [Google Scholar] [CrossRef]
- PN-EN 12831; Instalacje Ogrzewcze w Budynkach—Metoda Obliczania Projektowego Obciążenia Cieplnego. Polski Komitet Normalizacyjny: Warszawa, Poland, 2006.
- Climate Podlaskie Voivodeship: Temperature, Climate Graph, Climate Table for Podlaskie Voivodeship. Available online: https://en.climate-data.org/europe/poland/podlaskie-voivodeship-499/ (accessed on 23 August 2025).
- ASHRAE. ANSI/ASHRAE Addendum a to ANSI/ASHRAE Standard 169-2020: Climatic Data for Building Design Standards; ASHRAE: Atlanta, GA, USA, 2020; Available online: https://xp20.ashrae.org/standard169/169_2013_a_20201012.pdf (accessed on 23 August 2025).
- Meteotest Meteonorm. 2020. Available online: https://meteonorm.com/en/ (accessed on 12 April 2025).
- SketchUp: Program Do Projektowania 3D. Available online: https://sketchup.com.pl/ (accessed on 11 April 2025).
- Solar Energy Laboratory, University of Wisconsin-Madison. Multizone Building modeling with Type56 and TRNBuild; TRNSYS 18 Documentation; University of Wisconsin-Madison: Madison, WI, USA, 2019; Available online: https://web.mit.edu/parmstr/Public/Documentation/06-MultizoneBuilding.pdf (accessed on 23 August 2025).
- Klein, S.A. TRNSYS 18: A Transient System Simulation Program. 2017. Available online: https://sel.me.wisc.edu/trnsys/features/features.html (accessed on 12 April 2025).
- Minister Infrastruktury i Rozwoju. Rozporządzenie Ministra Infrastruktury I Rozwoju z dnia 27 lutego 2015 r. w sprawie metodologii wyznaczania charakterystyki energetycznej budynku lub części budynku oraz świadectw charakterystyki energetycznej. Dziennik Ustaw Rzeczypospolitej Polskiej, 2015; p. 376. [Google Scholar]
- KOBiZE. Wskaźniki Emisyjności CO2, SO2, NOx, CO i Pyłu Całkowitego dla Energii Elektrycznej na Podstawie Informacji Zawartych w Krajowej Bazie o Emisjach Gazów Cieplarnianych i Innych Substancji za 2023 rok. Warsaw, December 2024. Available online: https://www.kobize.pl (accessed on 23 August 2025).
- KOBiZE. Wskaźniki Emisji Zanieczyszczeń ze Spalania Paliw dla Źródeł o Nominalnej mocy Cieplnej do 5 MW, Zastosowane do Automatycznego Wyliczenia Emisji w Raportach do Krajowej Bazy za Lata 2022–2024. Warsaw, January 2025. Available online: https://krajowabaza.kobize.pl/ (accessed on 23 August 2025).
- Turoń, M.K. Operation of a hybrid heating system based on heat pumps using a photovoltaic installation. Arch. Thermodyn. 2024, 45, 153–162. [Google Scholar] [CrossRef]
Disclaimer/Publisher’s Note: The statements, opinions and data contained in all publications are solely those of the individual author(s) and contributor(s) and not of MDPI and/or the editor(s). MDPI and/or the editor(s) disclaim responsibility for any injury to people or property resulting from any ideas, methods, instructions or products referred to in the content. |
© 2025 by the authors. Licensee MDPI, Basel, Switzerland. This article is an open access article distributed under the terms and conditions of the Creative Commons Attribution (CC BY) license (https://creativecommons.org/licenses/by/4.0/).