Article

AI-Integrated Smart Grading System for End-of-Life Lithium-Ion Batteries Based on Multi-Parameter Diagnostics

by
Seongsoo Cho
1 and
Hiedo Kim
2,*
1
Department of Applied Artificial Intelligence, Hansung University, Seoul 02876, Republic of Korea
2
SUNGSAM Co., Ltd., Suwon 16677, Republic of Korea
*
Author to whom correspondence should be addressed.
Energies 2025, 18(22), 5915; https://doi.org/10.3390/en18225915
Submission received: 14 October 2025 / Revised: 4 November 2025 / Accepted: 7 November 2025 / Published: 10 November 2025

Abstract

The rapid increase in retired lithium-ion batteries (LIBs) from electric vehicles (EVs) highlights the urgent need for accurate and automated end-of-life (EOL) assessment. This study proposes an AI-integrated smart grading system that combines hardware diagnostics and deep learning-based evaluation to classify the residual usability of retired batteries. The system incorporates a bidirectional charger/discharger, a CAN-enabled battery management system (BMS), and a GUI-based human–machine interface (HMI) for synchronized real-time data acquisition and control. Four diagnostic indicators—State of Health (SOH), Direct Current Internal Resistance (DCIR), temperature deviation, and voltage deviation—are processed through a deep neural network (DNN) that outputs categorical grades (A: reusable, B: repurposable, C: recyclable). Experimental validation shows that the proposed AI-assisted model improves grading accuracy by 18% and reduces total testing time by 30% compared to rule-based methods. The integration of adaptive correction models further enhances robustness under varying thermal and aging conditions. Overall, this system provides a scalable framework for automated, explainable, and sustainable battery reuse and recycling, contributing to the circular economy of energy storage.

1. Introduction

The rapid electrification of transportation has accelerated global deployment of electric vehicles (EVs), resulting in an unprecedented volume of retired lithium-ion batteries (LIBs) [1]. These end-of-life (EOL) batteries exhibit heterogeneous residual performance driven by diverse operating histories and degradation pathways, reflected in state-of-health (SOH), direct-current internal resistance (DCIR), and thermal behavior. Such variability complicates efficient reuse, repurposing, and recycling, reinforcing the need for accurate and scalable diagnostic methods to support a circular battery economy [2,3].
Conventional EOL evaluation techniques primarily rely on manual testing and rule-based interpretation. These approaches are labor-intensive, subjective, and often inconsistent, particularly when dealing with nonlinear degradation interactions influenced by temperature gradients, cell imbalance, and dynamic load profiles [4]. As a result, simple static-threshold decision schemes struggle to deliver reproducible and high-confidence grading outcomes.
Advances in battery-embedded sensing, Battery Management Systems (BMSs), and machine learning have enabled data-centric battery diagnostics [5,6]. Deep learning (DL) architectures, in particular, can model complex nonlinear relationships between diagnostic indicators such as SOH, DCIR, voltage deviation, and temperature deviation, extracting high-level degradation signatures and offering improved prediction accuracy and generalization relative to classical models [7].
In this work, we present an integrated AI-assisted smart grading system for retired EV battery modules. The platform couples automated hardware diagnostics—including charge/discharge control, DCIR testing, and cell-level sensing—with a deep neural network (DNN)-based classification engine. Tested modules are categorized into Grade A (reusable), Grade B (repurposable), or Grade C (recycling recommended) based on real-time performance metrics.
Although AI-driven battery assessment has gained attention, several critical challenges remain. Prior studies often rely on laboratory-aged cells or limited chemistry subsets, reducing generalizability to field-aged batteries. Additionally, many datasets exclude real-world uncertainties such as sensor noise, temperature drift, and communication dropouts, weakening robustness under practical conditions. Explainability also remains limited; black-box models restrict electrochemical interpretability and impede industrial adoption. Finally, domain transfer across cell formats, cooling structures, and manufacturers remains under-explored. Addressing these gaps requires field-validated, thermally aware, and physically interpretable AI systems. The proposed system incorporates a graphical human–machine interface (HMI) for real-time visualization, parameter configuration, and monitoring, enhancing repeatability and reducing operator dependency. While the framework is data-driven, aging effects are captured using degradation-salient proxies (SOH, DCIR) and adaptive correction layers that normalize decisions across thermal and life-cycle variations. Although the model does not explicitly simulate electrochemical mechanisms such as SEI growth or phase transitions, the integration of diagnostic indicators, sensing automation, and explainable learning yields robust and scalable performance under heterogeneous real-world conditions.

2. System Architecture

The proposed Smart EOL Battery Grading System is an end-to-end framework that automates the evaluation and classification of retired EV battery modules by tightly coupling hardware control, data acquisition, signal conditioning, physics-guided corrections, and AI-based inference. As summarized in Figure 1, five coordinated modules exchange timestamped telemetry and standardized diagnostic features to enable consistent, explainable, and field-robust grading: a CAN-based Data Acquisition Unit; a Preprocessing & Feature Conditioning pipeline; an Adaptive Correction Layer for temperature, SOC window, and capacity variance; a Deep-Learning Inference Engine with SHAP interpretability; and a Decision & Grading block that fuses AI outputs with rule-based safety checks and traceability. This layered architecture supports real-time measurement, transparent data lineage, and industrial deployment with auditability.

2.1. Main Controller

An STM32F4-class MCU orchestrates the test sequence—initialization, charge, thermal stabilization, discharge, pulse diagnosis, analysis—while maintaining hard real-time synchronization across the charger/discharger, BMS, and HMI/GUI via 1 Mbps CAN. High-frequency streams for per-cell voltage V i , pack current I , surface temperature T i , and pulse-response snapshots are sampled at period T s   ( f s = 1 T s ) and buffered with double-buffering to prevent loss during I/O. CAN frames follow the standardized structure I D + C o m m a n d + P a y l o a d 0 8 b y t e s + C R C + A C K , ensuring deterministic transfer and integrity [8].
Remote integration over Wi-Fi/Ethernet enables secure upload to cloud endpoints (e.g., AWS IoT, Azure IoT) for monitoring and predictive control [9]. The controller issues CC/CV/CP set-points to the bidirectional power stage and supervises regenerative discharge. Feature extraction (e.g., DCIR) is computed from time-aligned pulse segments, using
R D C I R = Δ V Δ I
where ΔV is the instantaneous voltage step at pulse onset and ΔI is the applied current change. Modular backplanes allow scaling to 16 synchronized channels for high-throughput screening without channel interference.
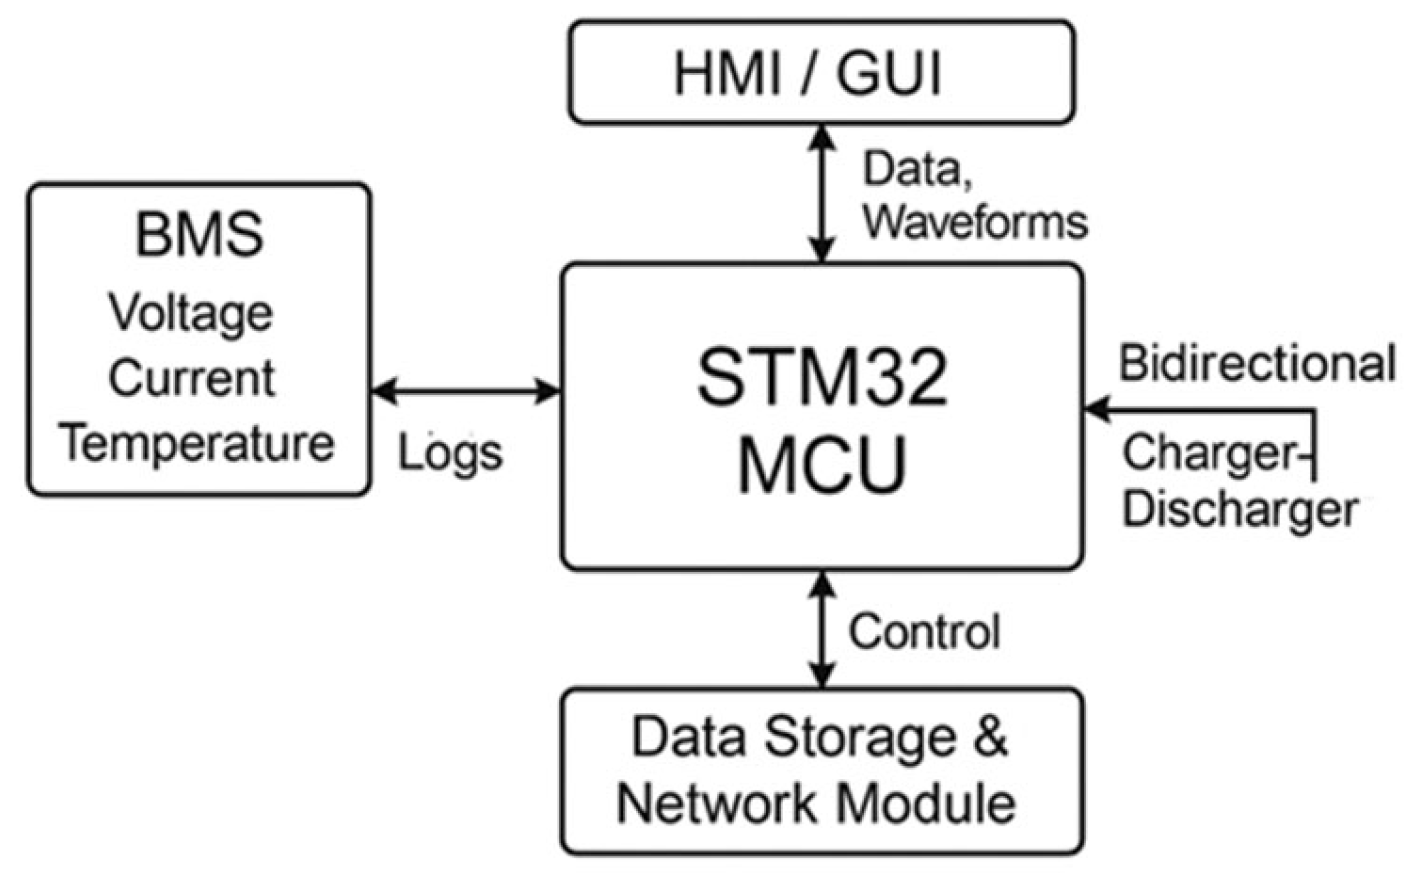
As shown in Figure 2, the control workflow of the STM32-based management unit follows a sequential data-processing structure. The Battery Management System (BMS) first transmits real-time diagnostic logs—including voltage, current, and temperature—to the STM32 MCU. The MCU then processes these input signals and issues bidirectional control commands to the charger–discharger unit to regulate charge and discharge operations.
In parallel, the MCU updates and stores operational parameters within the data storage and network module to support long-term analysis and system logging. Finally, processed data streams and waveform information are delivered to the HMI/GUI, where system performance, trends, and diagnostic status are visualized for operators.

2.2. Bidirectional Charger/Discharger

The Bidirectional Charger/Discharger serves as the core power conversion unit of the proposed Smart EOL Battery Grading System, performing both charging and discharging operations for EOL batteries. It is one of the most critical components that determines the overall performance, efficiency, and energy recovery capability of the system. The unit supports three operational modes—CC, CV, and CP—and can operate in either single-mode or combined-mode configurations, depending on the specific test objectives [10].
The charger/discharger is controlled through synchronous digital commands between the Digital Signal Processor (DSP) and the STM32 Main Controller, ensuring precise regulation of current and voltage under dynamic conditions. During charging, the output current I c h g (t) is regulated by a Proportional–Integral (PI) control algorithm, as expressed in Equation (4):
I c h g t = K p V r e f V b a t t + K i V r e f V b a t t d t
where K p and K i denote the proportional and integral gains, respectively, V r e f represents the reference voltage, and V b a t t is the instantaneous battery voltage. This PI-based control strategy stabilizes the charging process, preventing overcurrent and overvoltage, thereby ensuring smooth and reliable power delivery [11].
In discharge mode, the current direction is reversed so that energy flows from the battery to the load. The controller dynamically adjusts the discharge waveform in real time to maintain constant load characteristics. A key innovation of this module is the implementation of a Regenerative Discharge mechanism. Traditional discharge systems dissipate released energy as heat through a resistive load, resulting in substantial energy loss. In contrast, the proposed design integrates a Bidirectional DC–DC Converter and a Single-Phase Inverter, enabling discharged energy to be fed back into the power grid, significantly improving energy utilization efficiency [12].
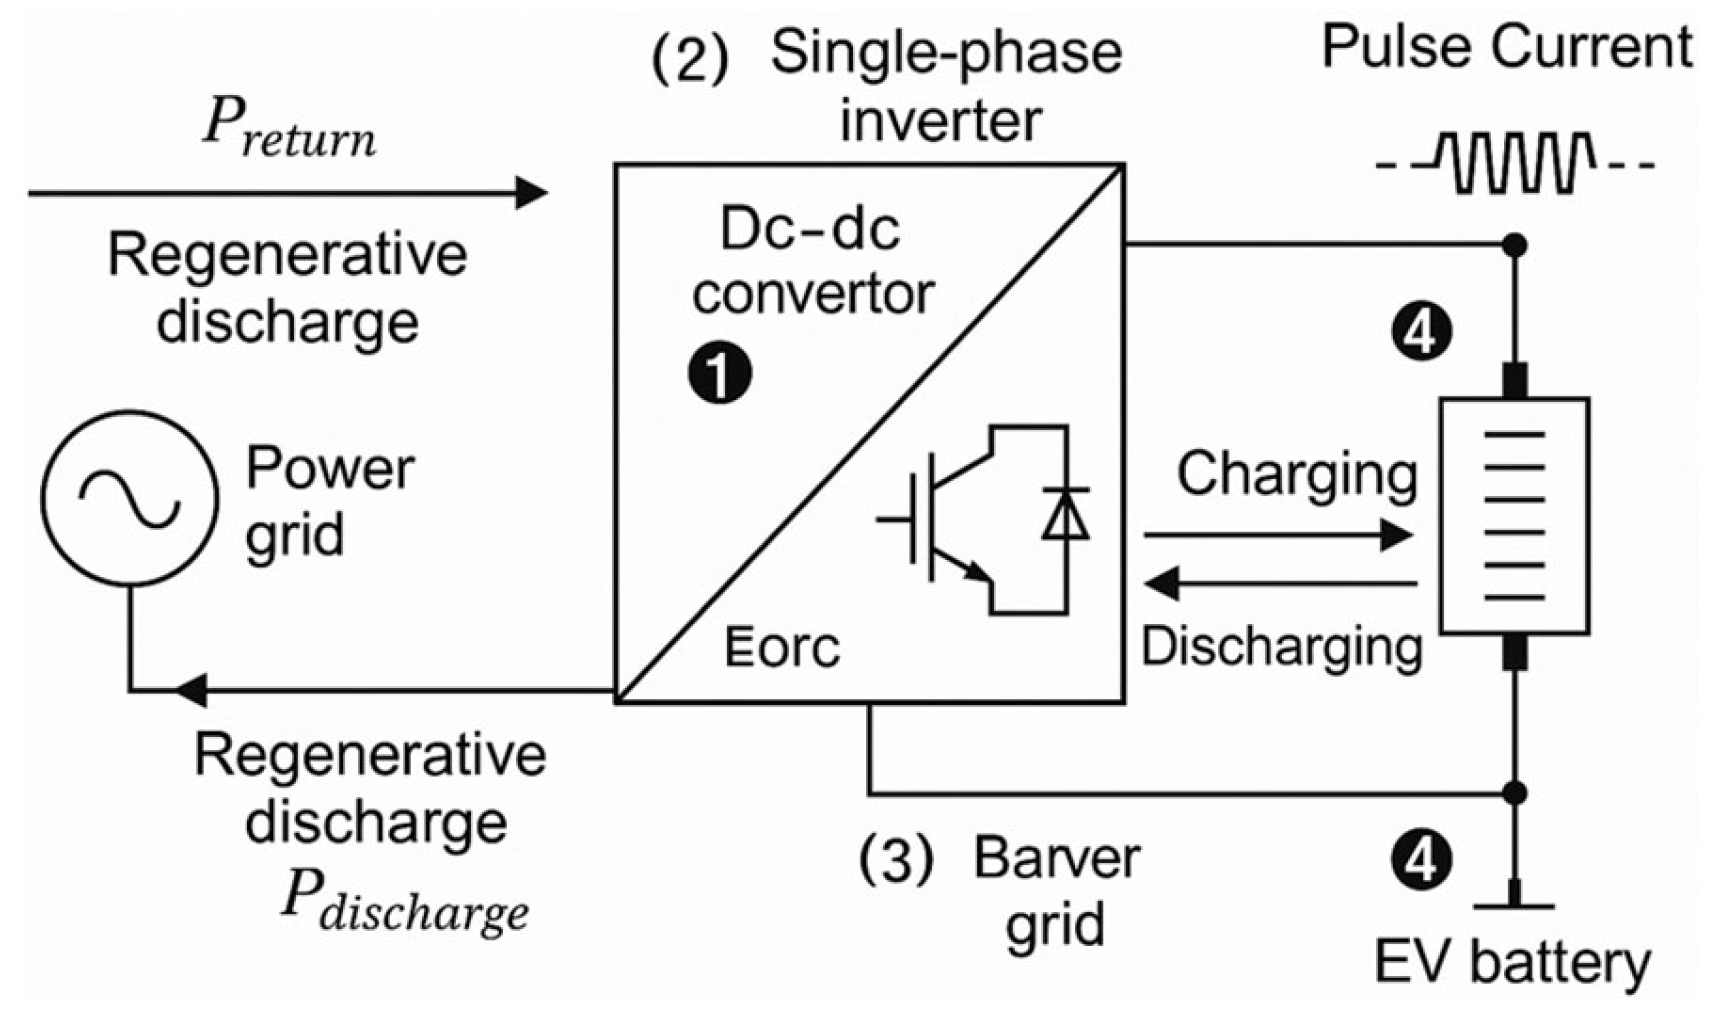
This energy recovery configuration not only reduces waste but also achieves an energy-saving effect exceeding 30% compared with conventional resistive-load discharge systems. Figure 3 illustrates the Power Conversion and Energy Regeneration Structure of the proposed bidirectional charger/discharger system. The system integrates the DC–DC conversion stage, single-phase inverter, battery module, and power grid interface to enable fully controlled bidirectional energy flow between components. Through this coordinated architecture, the system is designed to ensure high charging and discharging efficiency while maintaining operational safety and stability throughout the testing process.
Figure 3 illustrates the bidirectional regenerative discharge architecture used in the experimental setup. As shown in the figure, element ① corresponds to the DC–DC converter stage, which stabilizes the DC link voltage and enables controlled energy transfer between the EV battery and the inverter. Element ② represents the single-phase inverter, responsible for converting regulated DC power into AC power for grid-interactive regenerative discharge. The interface labeled ③ denotes the Barver grid connection, providing the AC coupling layer through which energy can flow back to the grid during discharge operations. Finally, element ④ highlights the bidirectional battery–inverter pathway, where charging, discharging, and pulse-current-based excitation are applied to the EV battery module for diagnostic or regenerative cycling. This architecture forms the foundational energy-flow structure enabling precise control during both charging and regenerative discharge operations.
The system performs real-time synchronization of the safety protection circuitry, while the regenerative inverter efficiently feeds the discharged energy back into the power grid. This configuration serves as a key mechanism for enhancing the overall energy recovery efficiency ( η r e g e n ) of the system. The energy regeneration efficiency is defined as follows:
η r e g e n = P r e t u r n P d i s c h a r g e × 100 ( % )
where η r e g e n denotes the power returned to the grid, and P d i s c h a r g e represents the total power extracted from the battery during discharge.
Experimental results indicate that the efficiency of the regenerative discharge mode reaches over 92%, showing a remarkable improvement in energy-saving performance compared to conventional resistive-load discharge systems. The bidirectional charger/discharger also incorporates a pulse-based diagnostic function, enabling precise assessment of the electrochemical and physical properties of the battery cells. During testing, a short and well-defined current pulse (charge/discharge pulse) is applied, and the voltage response is recorded in real time to evaluate both the DCIR and the electrochemical reaction rate of the cell [13]. This function applies a defined current pulse and measures the corresponding voltage response to calculate the DCIR using Equation (1). DCIR is a crucial degradation indicator influenced by the conductive medium, electrode interface resistance, electrolyte ion mobility, and temperature (T). It can be approximated as the sum of the ohmic resistance ( R s ) and the charge transfer resistance ( R c t ), as given in Equation (6):
R D C I R R s + R c t
where R s represents the ohmic resistance of the current collector and electrolyte, while R c t denotes the charge transfer resistance at the electrode–electrolyte interface [14]. The system performs constant current pulse (CCP)-based testing, where the pulse duration ( t p ) and rest period ( t r ) are configurable through the controller. Typically, t p = 5 10 s , t r = 10 s, with the sampling frequency ( f s ) defined by Equation (7):
f s = 1 T s
where T s is the ADC sampling period. The STM32F4 microcontroller’s integrated 12-bit ADC (2 Msps) allows high-speed sampling, capturing voltage response data at 1–2 ms resolution. Additionally, the system automatically adjusts both the pulse current amplitude ( Δ I ) and the pulse duration ( t p ) in real time to optimize test conditions based on battery capacity and state, preventing overcurrent-induced damage and ensuring safe measurement operations.
The collected voltage responses are filtered for noise and processed in two stages, as defined in Equation (8):
R D C I R , c o r r e c t e d = R D C I R × 1 + k T T T r e f
where T r e f   is the reference temperature (25 °C), and k T is the temperature compensation coefficient (typically 0.003/°C). Voltage Drop Detection calculates the voltage difference ( Δ V ) between the pulse start time ( t 0 ) and end time ( t 1 ), while Temperature Compensation applies a temperature correction factor k T based on the real-time measured cell temperature (T) to obtain the corrected DCIR. This temperature-corrected DCIR data is then used as an input variable for the AI-based degradation model, which enhances the prediction accuracy of battery health (SOH) and overall performance trend analysis [15].
The DCIR variation rate ( Δ I / R 0 ) obtained from pulse testing serves as an intuitive indicator of battery aging. Experimental data show that when the DCIR increases by more than 100% compared to a new cell, the SOH typically falls below 70%, indicating substantial degradation. These data are utilized as key input features for the AI-based grade prediction model, contributing to the computation of the Comprehensive Degradation Index (CDI) when combined with other metrics such as temperature uniformity and voltage deviation. Furthermore, the pulse-based diagnostic method has emerged as a core technology for rapidly and accurately assessing the reusability of EV batteries in both second-life (repurposing) and energy storage system (ESS) recycling applications, underscoring its value in sustainable battery lifecycle management [16].
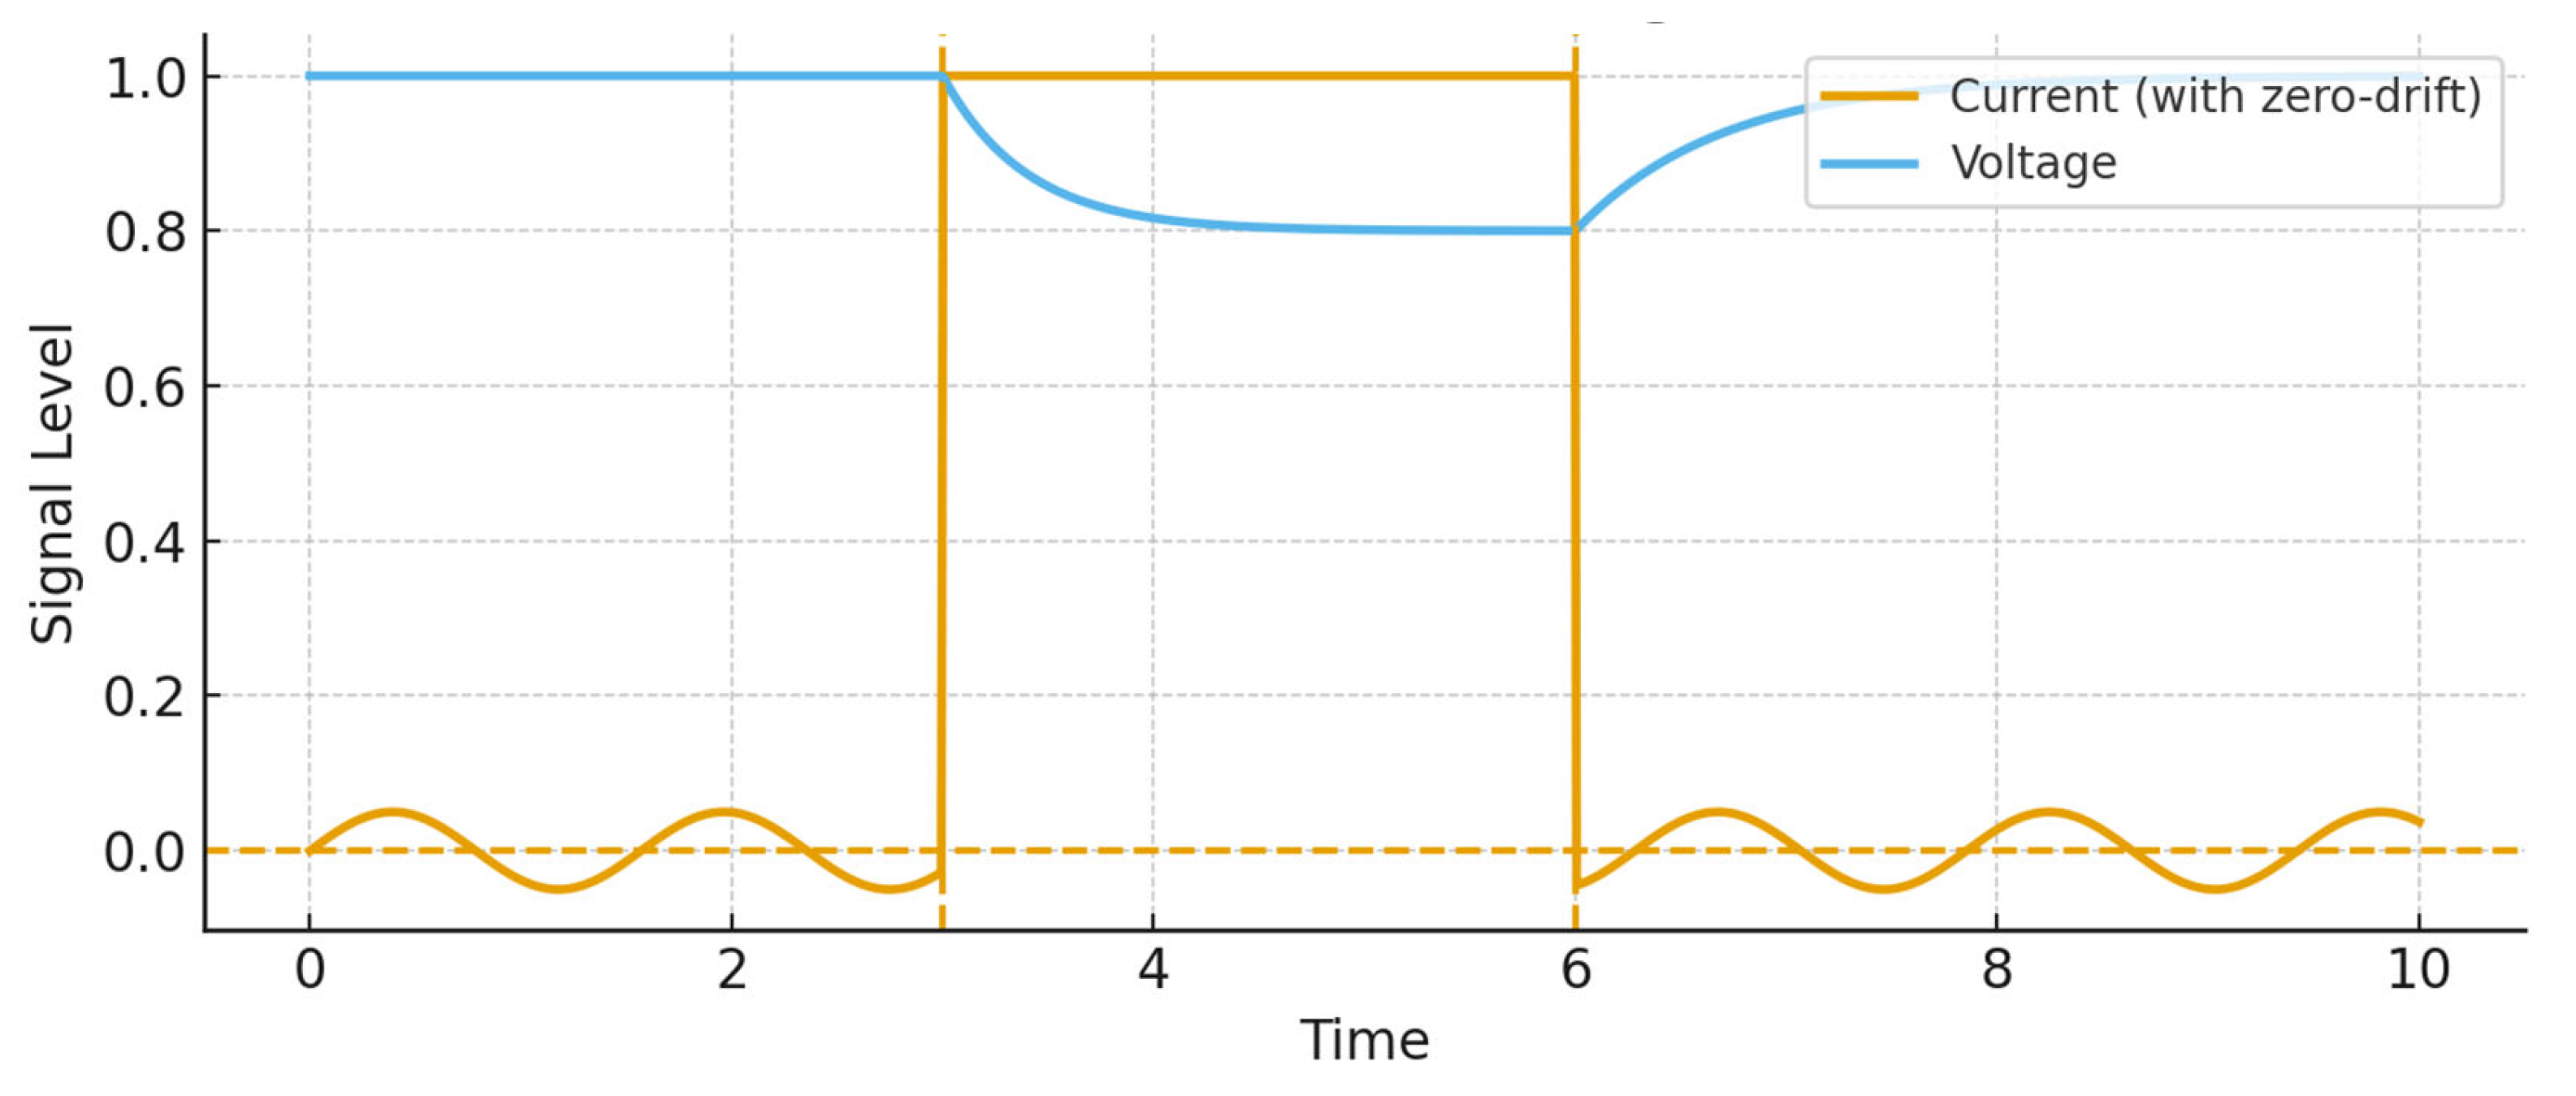
Figure 4 illustrates the temporal flow and voltage response curve of the pulse charge–discharge test. Along the time axis (Time [s]), the upper graph represents the applied current pulse ( Δ I ) as a rectangular waveform, while the lower graph shows the corresponding voltage response curve. Immediately after the pulse is applied, a sudden voltage drop (ΔV) occurs due to the DCIR of the cell. Subsequently, during the rest period ( t r ), the voltage gradually recovers as charge redistribution occurs at the electrode–electrolyte interface. The pulse duration is defined as t p , and the rest interval as t r , with current–voltage data continuously sampled by a high-speed ADC (2 Msps) during these intervals. The magnitude and slope of the pulse response are used to determine the voltage drop ( Δ V ) and current change ( Δ I ), from which the DC internal resistance is calculated according to Equation (1). Here, Δ V represents the cell’s instantaneous electrical response to the applied current, and Δ I denotes the amplitude of the applied load. Through this data, the electrolyte state, electrode interfacial resistance, and temperature-dependent reaction dynamics can be quantitatively analyzed. Figure 4 visually demonstrates the fundamental principle of DCIR measurement, highlighting that pulse-based diagnostics are highly effective for assessing both the electrochemical reaction rate and degradation condition of batteries [13,15]. The dashed horizontal line represents the zero-drift reference baseline used to correct low-frequency bias components in the measured current waveform. During post-processing, the raw current signal often contains slow baseline shifts caused by sensor drift, thermal offset, or ADC quantization error. The dashed line therefore serves as the stable zero-reference level against which the corrected current waveform (solid curve) is aligned.
The proposed bidirectional charge–discharge system incorporates a multi-layer safety and protection mechanism to ensure reliable operation under laboratory and industrial conditions. This subsystem continuously monitors electrical and thermal abnormalities, and it is designed in accordance with IEC 62619:2022 and UL 1973:2023 standards [14,15]. The system’s safety framework is composed of four major protection layers, as follows:
(1) Over-Current & Short-Circuit Protection
During charging or discharging, if the current exceeds the preset limit I m a x , a hardware cutoff circuit (MOSFET + Hall sensor) immediately disconnects the circuit.
High-frequency sampling (>10 kHz) allows real-time detection of transient overcurrent events, and in short-circuit conditions, the circuit is interrupted within 10 μs. The protection logic is defined by Equation (9):
I F   I > I m a x S w i t c h   O f f   ( M O S F E T _ G a t e = 0 )
A double relay and parallel MOSFET topology is adopted to enhance cutoff reliability.
(2) Over-Voltage & Under-Voltage Protection
Each cell voltage is continuously measured by the BMS. If it exceeds the upper or lower threshold, the system automatically halts operation.
According to IEC 62619, the protection limits are defined as:
V m a x = 4.25   V   ( Charge   Upper   Limit ) ,   V m i n = 2.50 V (Discharge Lower Limit)
When a voltage imbalance ≥ 100 mV occurs, the cell balancing circuit automatically activates to maintain voltage uniformity across all cells [16].
(3) Over-Temperature Protection
NTC thermistors are attached to each cell and MOSFET surface. When the temperature exceeds T m a x = 60   ° C , PWM control is immediately suspended.
A thermal diffusion model is employed to predict the temperature rise ( T p r e d ) as follows:
T p r e d t + Δ t = T t + P l o s s   ·   Δ t m C p
where P l o s s is the dissipated power, m C p is the heat capacity [17]. If T p r e d surpasses the safe limit, a pre-emptive shutdown is triggered.
(4) Insulation Monitoring & Leakage Detection
An Insulation Monitoring Device (IMD) continuously measures the leakage resistance between the positive/negative terminals and ground during charging.
The insulation resistance drops below 100 kΩ, charging is immediately terminated. If the leakage current exceeds 5 mA, a warning message is displayed on the HMI interface [18].
This feature is critical for high-voltage modules (>60 Vdc) to prevent electric shock or fire hazards [19].
All protection layers are centrally controlled by a real-time task scheduler within the STM32 MCU main controller. The system performs a 1 kHz safety scan loop, evaluating each sensor reading according to the priority logic defined in Algorithm 1.
Algorithm 1. Real-Time Safety Monitoring.
INPUTS: I (A), Vcell[] (V), T (°C), Riso (Ω)
PARAMS: I_MAX, V_MAX, V_MIN, T_MAX, DT_MAX, RISO_MIN
PERIOD: 1 ms // 1 kHz safety scan

loop every 1 ms:
  read I, Vcell[], T, Riso
  if abs(I) > I_MAX:
    stop_power_stage(); raise_alarm("Over-current"); continue

  for v in Vcell:
    if v > V_MAX or v < V_MIN:
      stop_power_stage(); raise_alarm("Cell over/under-voltage"); break

  if T > T_MAX or dT_dt(T) > DT_MAX:
    stop_power_stage(); raise_alarm("Over-temperature"); continue

  if Riso < RISO_MIN:
    stop_power_stage(); raise_alarm("Insulation fault"); continue

  // safe state
  clear_alarm(); continue
end loop
This algorithm is designed to ensure fail-safe operation even under multiple simultaneous fault conditions such as overcurrent, overvoltage, thermal anomalies, and insulation degradation. The proposed safety and protection features are fully compliant with international standards, as summarized in Table 1.
Each protection circuit was validated according to the test procedures and tolerance limits specified in the above standards and is also compatible with the Korean KC certification system (KC 62133-2).
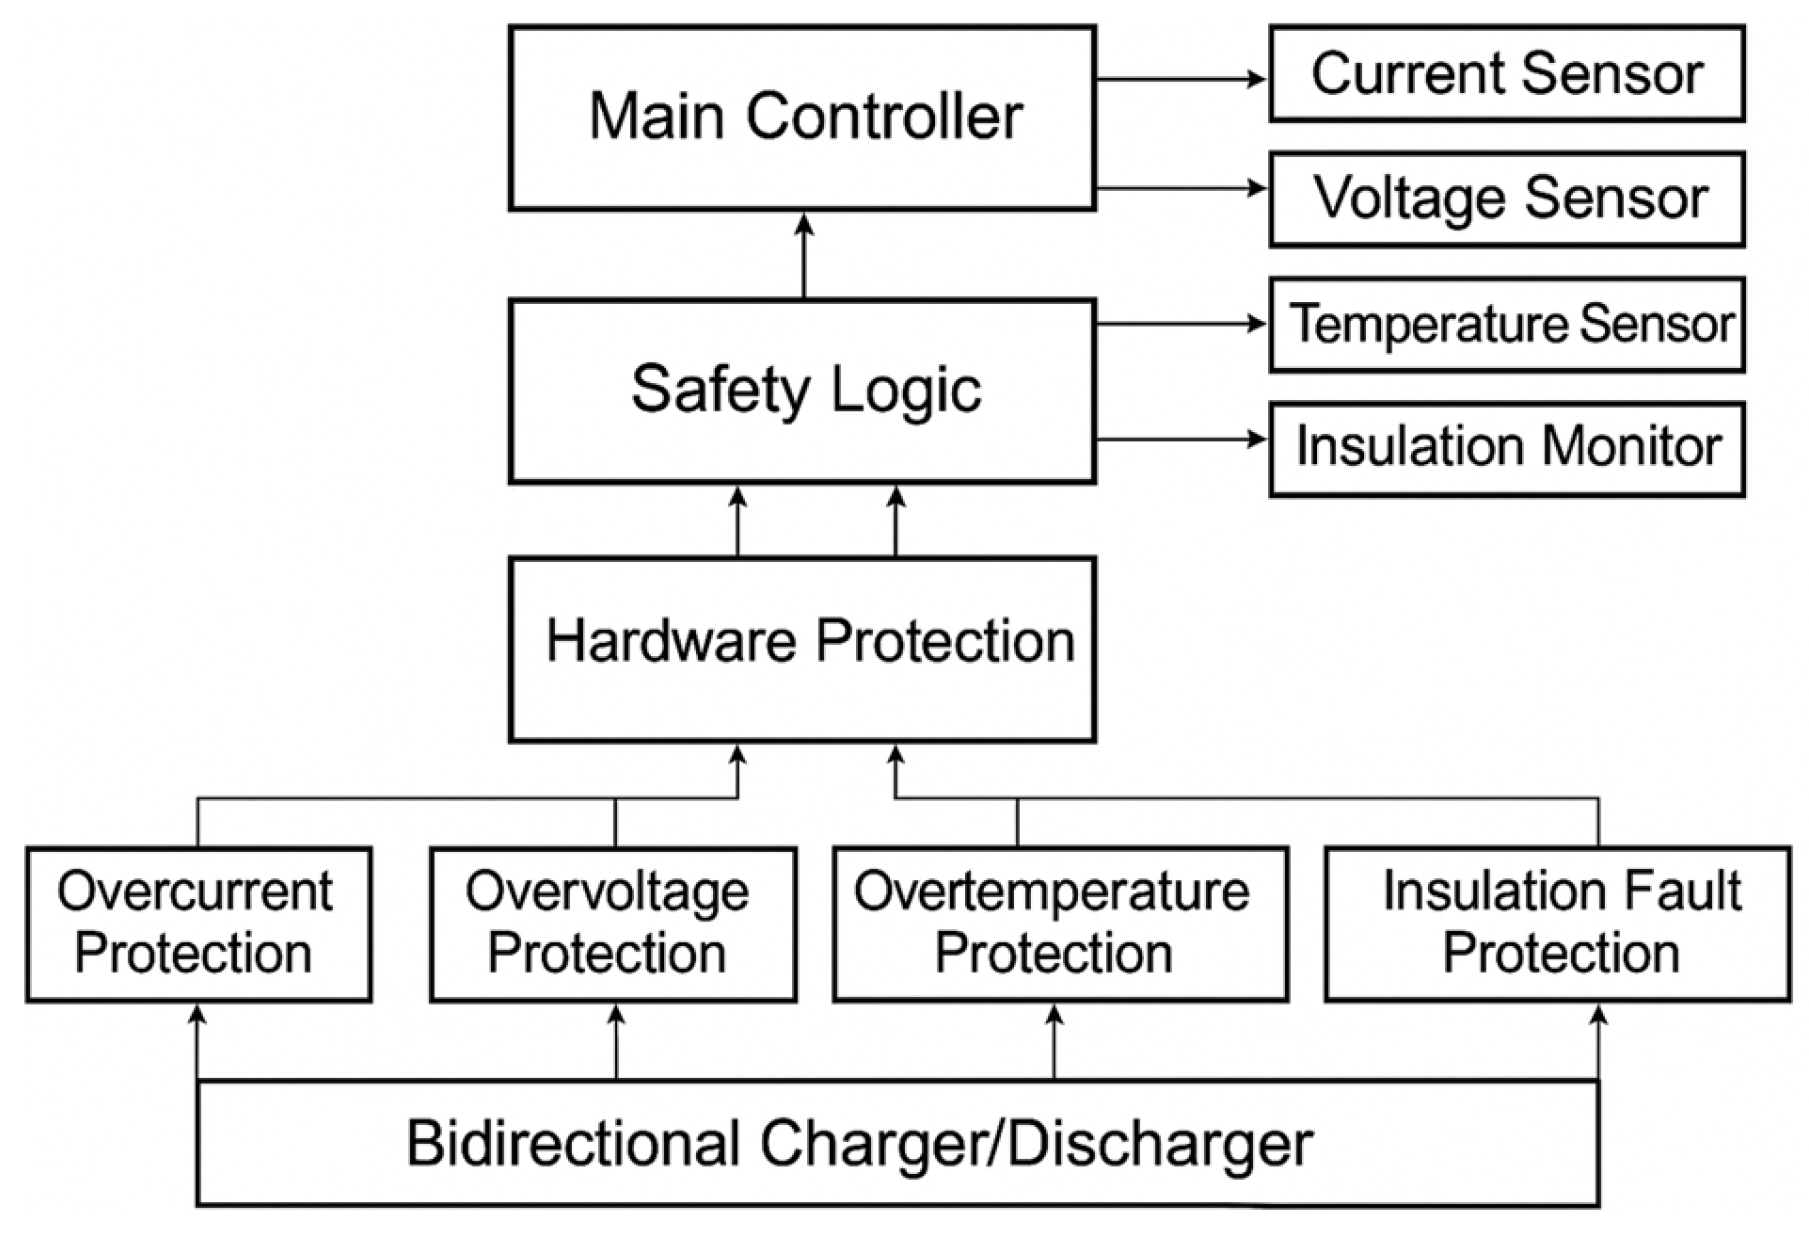
Figure 5 illustrates the hierarchical architecture of the proposed protection system. The upper layer (Main Controller) collects sensor data—including current, voltage, temperature, and insulation resistance—and executes the decision-making logic for fault detection and system control. The lower layer (Hardware Protection) is responsible for physical circuit interruption in response to abnormal conditions. Through the HMI/GUI interface, fault states are visually displayed in real time, enabling operators to identify and respond to issues immediately. Additionally, all system events are automatically logged and stored in dedicated log files, which can later be used for diagnostic analysis and traceability of system performance and safety incidents.
During laboratory and field validation, the multi-layer safety protection system successfully intercepted several real anomaly cases without escalation. Specifically, three test modules exhibited abnormal temperature rise rates (>1.8 °C/min) during pulse-stress phases, immediately triggering the thermal-rate threshold and transitioning the system into controlled shutdown and active cooling mode. Additionally, two transient CAN-communication dropouts (>20 ms gap) initiated safe-state fallback procedures and forced diagnostic re-synchronization before resuming operation. In all instances, no thermal runaway, insulation breach, or abnormal voltage divergence was observed, and automated logs confirmed proper execution of safety protocols. These activation records demonstrate that the protection architecture not only satisfies ISO- and IEC-aligned safety requirements but also provides practical robustness during real-world retired-battery inspection scenarios.

2.3. Battery Management System, BMS

The BMS serves as the core module of the proposed EOL battery diagnostic platform, ensuring system stability and reliability by performing per-cell measurement and control of voltage, current, temperature, and insulation resistance. The proposed BMS integrates high-precision sensors and Negative Temperature Coefficient (NTC) thermistors to monitor the surface temperature of each cell in real time. When conditions such as overvoltage, overcurrent, or overtemperature are detected, the system automatically activates the protection circuitry to prevent damage or thermal runaway [20,21]. The BMS in this system is composed of four primary submodules, each designed for specialized sensing, protection, and communication tasks:
(1) Cell Voltage Monitoring Unit
Each cell voltage V i is measured using a high-resolution Analog-to-Digital Converter (ADC) with a resolution of 1 mV. V a v g across all series-connected cells is calculated according to Equation (9):
V a v g = 1 N i = 1 N V i
where N denotes the number of series-connected cells. If the voltage deviation between cells exceeds ±50 mV, the cell balancing circuit is activated to maintain voltage uniformity across the battery pack.
(2) Current Sensing and Charge–Discharge Control Unit
A non-contact Hall effect sensor is employed to minimize electrical noise during current measurement. The measured current I ( t ) is used to dynamically calculate the SOC according to Equation (10):
S O C t = S O C 0 1 C n 0 t I τ d τ
where S O C 0 represents the initial state of charge and C n is the rated capacity (Ah) [22]. When an overcurrent condition is detected, the MCU immediately generates a control signal to cut off the MOSFET switching, thereby protecting the circuit.
(3) Temperature Sensing and Protection Unit
Each cell or cell block is equipped with NTC thermistors capable of measuring temperature with a precision of ±0.5 °C. If the temperature exceeds the threshold value of T m a x = 60   ° C , the charge/discharge operation is automatically halted. Additionally, when the temperature rise rate exceeds d T d t   > 5   ° C s , a pre-warning signal is generated to prevent potential thermal runaway events.
(4) Communication and Data Logging Unit
All measurement data are transmitted to the main controller via a CAN protocol operating at 1 Mbps, following the message frame structure defined in Equation (2). This communication architecture minimizes data loss and enhances transmission reliability. The BMS also contains an integrated 8 MB flash memory, which automatically stores up to one hour of recent operational data for redundancy and uploads it to the cloud server for long-term monitoring.
Since lithium-ion cells exhibit voltage imbalance after extended charge–discharge cycling, the proposed BMS supports both passive and active balancing mechanisms to maintain uniform cell voltage distribution:
Passive Balancing: dissipates excess charge as heat through a resistor network.
Active Balancing: transfers charge between adjacent cells using inductor- or capacitor-based energy transfer circuits.
The energy efficiency ( η ) of the active balancing process is defined by Equation (11):
η = E t r a n s f e r r e d E s t o r e d × 100 ( % )
Experimental validation of the proposed system demonstrated an average efficiency of approximately 94.7%, indicating that the active balancing method provides superior energy utilization while maintaining cell uniformity during extended operation.
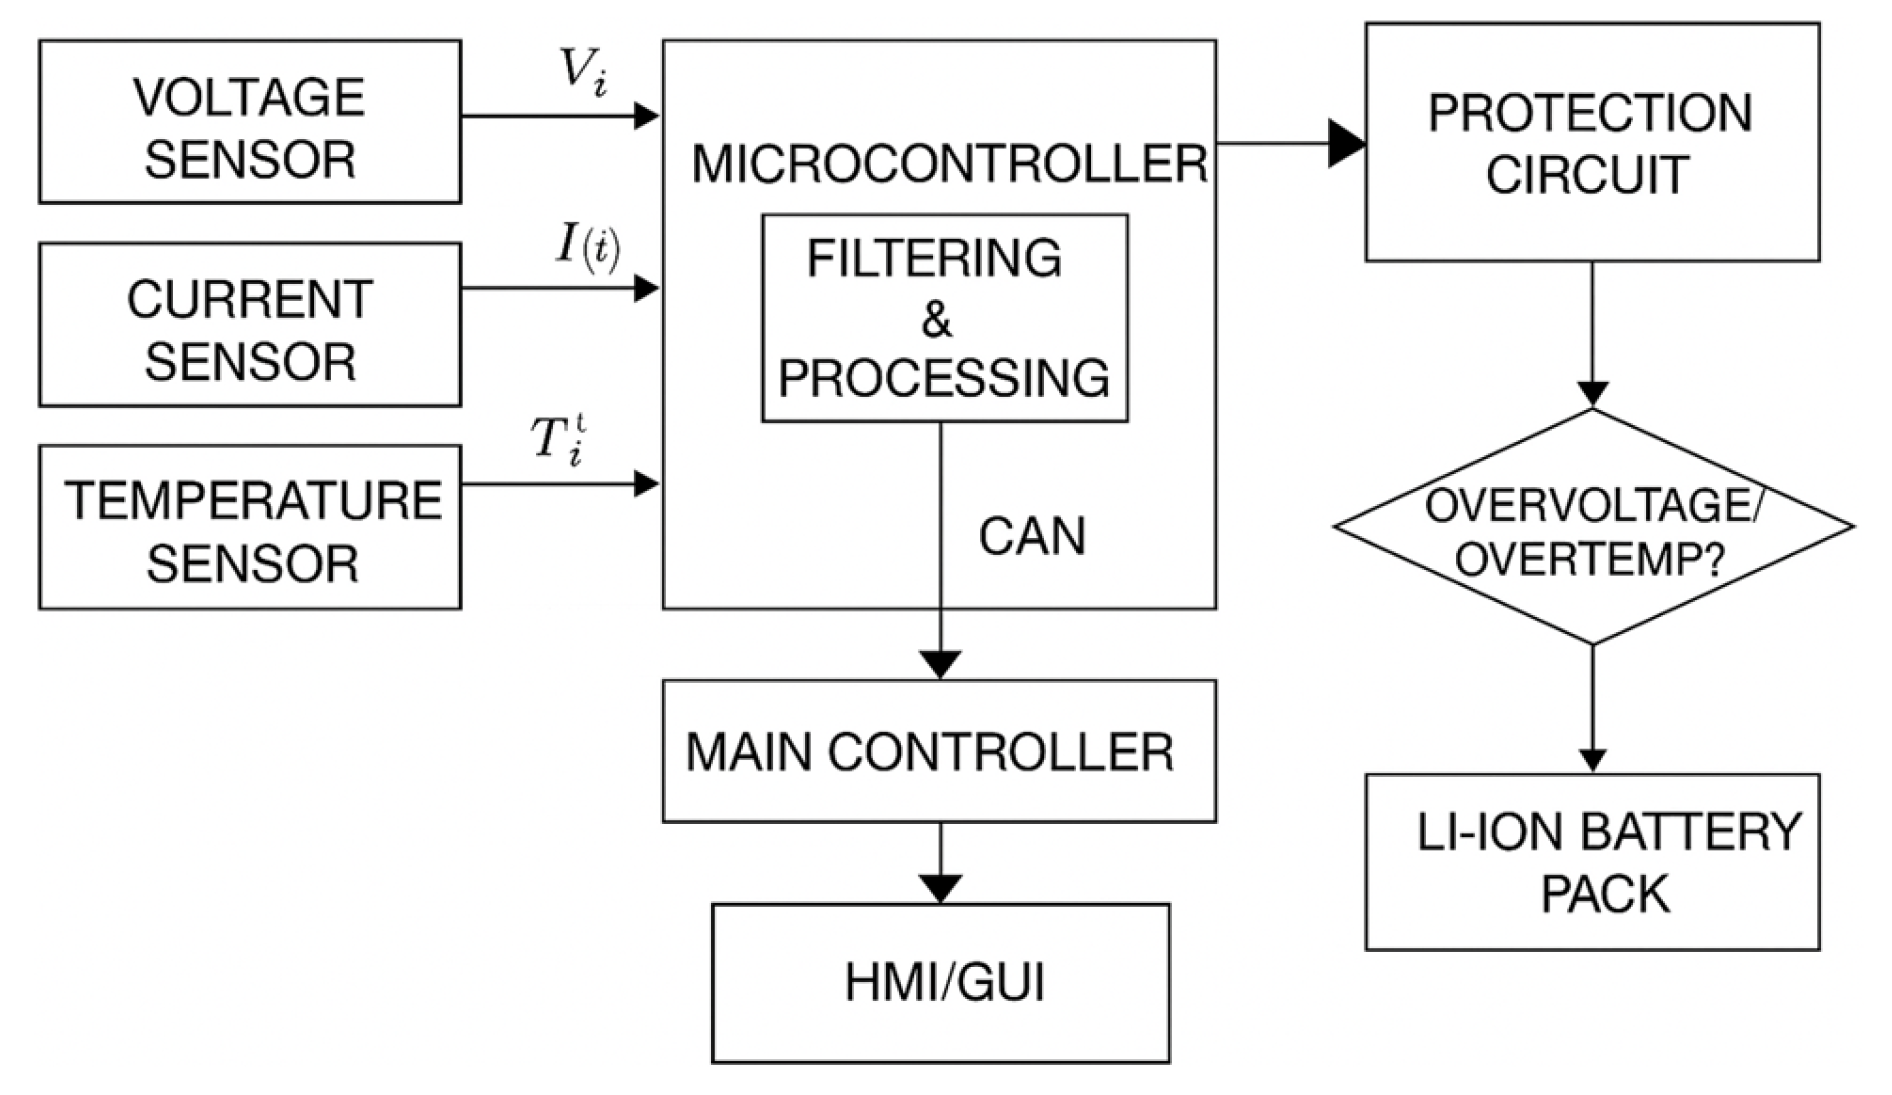
Figure 6 illustrates the data flow process in which the voltage, current, and temperature signals collected from individual sensors are filtered and processed by the MCU, then transmitted via CAN communication to the main controller and HMI/GUI interface. In the event of overvoltage or overtemperature detection, the BMS’s internal protection circuitry immediately issues a MOSFET control signal, ensuring the safe and coordinated operation of the entire system. Beyond serving as a measurement unit, the BMS functions as a key enabler for AI-driven diagnostics and grading. The acquired sensor data—including voltage, temperature, and DCIR—are utilized as input parameters for the AI-based SOH estimation and battery grading algorithms described in later sections. Therefore, the accuracy, sampling rate, and response time of the BMS are critical determinants of the overall performance, precision, and reliability of the proposed smart battery grading platform [23,24].

2.4. Human–Machine Interface, HMI/GUI

The HMI serves as the operational hub of the proposed Smart EOL Battery Grading System, providing an intuitive GUI that allows users to configure, control, and monitor the testing process in real time. The GUI was developed using the Python-based Qt framework (PyQt5, version 5.15.9) and the Matplotlib visualization engine (version 3.8.2), ensuring integrated management of data streaming, visualization, and result storage throughout the entire testing sequence. All software versions were confirmed at the time of implementation, and dependencies were validated using the official package repositories accessed on 10 January 2025 [21,22,23,24,25]. Through the GUI, users can intuitively configure parameters such as current, voltage, SOC, SOH, and pulse width. The configured parameters are transmitted to the Main Controller via CAN frames, with the command mapping defined by Equation (12):
C o m m a n d   F r a m e = I D c m d + P 1 ,   P 2 , , P n + C R C
where I D c m d represents the command identifier, P i denotes the test parameters, and CRC is the cyclic redundancy check code used to ensure data integrity during communication. The GUI updates cell-level voltage, current, and temperature data received from the CAN bus every one second, displaying them through multi–Y-axis graphs and heatmap-based temperature distributions. The visualization of real-time data at time t is defined by the mapping function in Equation (13):
D d i s p l a y t = f ( V i t ,   I i t ,   T i t )
where f ( · ) is a data normalization and rendering function that integrates color mapping with trend curves, enabling intuitive monitoring of battery status transitions over time. Within the GUI, the state monitoring module applies a Moving Average Filter and a Z-score anomaly detection algorithm to each sensor dataset to automatically detect outliers. If abnormal conditions are detected, they are highlighted in red on the interface and automatically logged according to Equation (14):
Z = x i μ σ
where μ is the mean and σ is the standard deviation; data points with Z > 3 are classified as anomalies [26].
All grading results and test logs are automatically exported in CSV and PDF formats, ensuring traceability and reproducibility. Furthermore, the GUI supports RESTful API integration, enabling secure transmission of data to cloud storage services such as AWS S3 or Azure Blob Storage for remote accessibility. This cloud integration ensures data integrity, traceability, and real-time accessibility of experimental results across multiple users and devices [27].
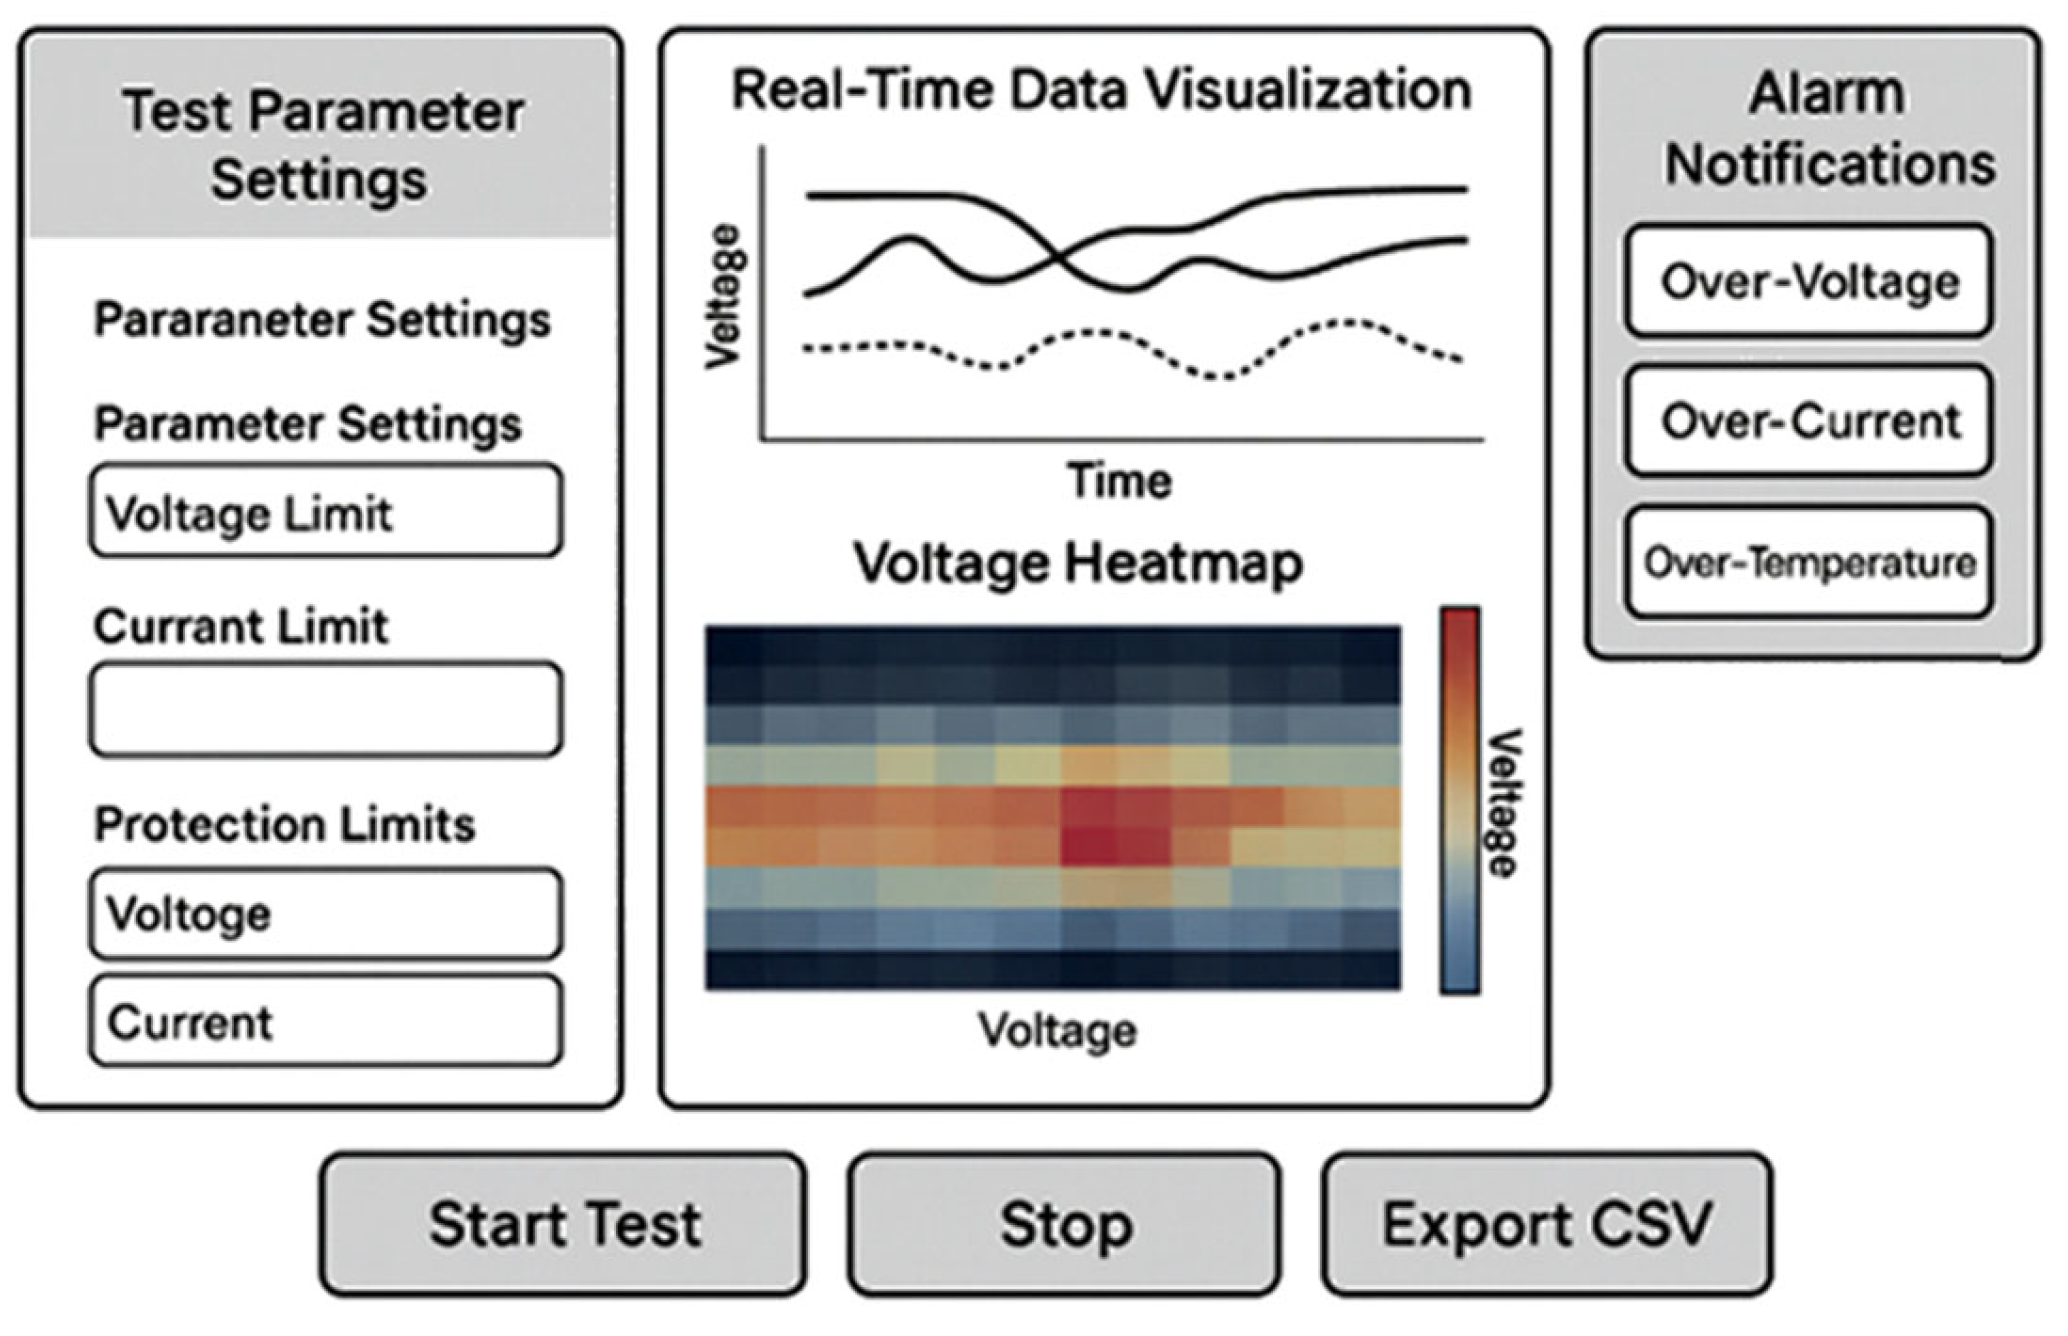
Figure 7 illustrates the overall structure of the Human–Machine Interface (HMI), which consists of several functional components, including the test parameter configuration panel, real-time data visualization panel, abnormal condition alarm window, and result export buttons. The left panel provides input fields for setting voltage and current thresholds, allowing users to define operational limits before initiating a test. The central panel displays real-time time-series graphs and voltage heatmaps, visually representing the system’s operational state during testing. In the upper-right alarm panel, real-time warnings such as “Over-Voltage”, “Over-Current”, and “Over-Temperature” are immediately displayed when abnormal conditions occur. Meanwhile, the bottom command section contains operational buttons such as “Start Test”, “Stop”, and “Export CSV”, enabling seamless experiment control and data export. In Figure 7, the solid lines show real-time voltage waveforms, while the dashed line represents the smoothed reference trend used for anomaly detection.
The GUI executes a fully automated testing routine, ensuring consistency across the entire process—from test initialization to final grading computation. Operators can load predefined testing templates that automatically verify system conditions (e.g., voltage range validation, sensor connectivity) before execution. This functionality minimizes operator dependency and significantly reduces human-induced evaluation errors.
To ensure graphical uniformity and clarity, the visualization engine normalizes all measured data (voltage, current, and temperature) and maps them to standardized color scales using Equations (15) and (16):
S n o r m = S i S m i n S m a x S m i n
C m a p = c o l o r m a p ( S n o r m )
where S i represents the measured signal, and S m i n and S m a x denote the scaling range. The resulting C m a p corresponds to a color value, which is used to visually indicate the thermal and voltage states of the battery cells.
Beyond being a visualization tool, the proposed GUI functions as an intelligent feedback interface within the AI-based grading system. The visualized data from ongoing experiments are simultaneously stored as training datasets, which are later used during the data preprocessing phase of the AI grading model. Thus, the GUI not only enhances user experience (UX) and operational efficiency but also provides a direct interface between human operators and the machine learning framework, making it a practical solution for automated testing and data-driven diagnostics in industrial environments [28]. The GUI visual layer displays QA flags (spike, dropout, flatline) in real time and prevents test submission when channel completeness falls below 98% or when uncorrected temperature bias is detected.

2.5. Battery Module Under Test

The proposed system is designed to evaluate an EV-grade lithium-ion battery module with high precision, focusing on assessing cell degradation uniformity and electrochemical characteristics under realistic operational conditions. The representative module configuration adopts a 2P6S structure (two cells in parallel × six in series, totaling twelve cells), which closely replicates the electrical and thermal behavior of commercial EV battery packs, thereby providing an experimental environment that accurately reflects real-world operating conditions. The equivalent circuit of the 2P6S battery module can be expressed as in Equations (17) and (18):
V m o d u l e = i = 1 6 V c e l l i
R e q = R c e l l 1 2 + R c e l l 2 2 + + R c e l l 6 2
where V c e l l i represents the open-circuit voltage (OCV) of each serial cell pair, and R c e l l i denotes the equivalent series resistance (ESR) of each cell.
The modules tested in this study were commercial, EV-grade retired packs sourced from an industrial repurposing/recycling partner in Korea. To preserve commercial confidentiality, OEM names are withheld; all modules originated from the same NCM-based passenger EV platform and included manufacturer-certified traceability records. Each 2P6S module (nominal~\sim~25.6 V, 10–12 Ah) had experienced approximately 600–900 real-world drive-cycle charge/discharge cycles prior to retirement, with documentation confirming no thermal events or abnormal failure history. Upon receipt, all modules passed incoming inspection—SOC normalization, voltage-balance check, insulation verification (>100 kΩ > 100\ \text{k}\Omega > 100 kΩ), and preliminary capacity screening—to ensure baseline comparability ahead of laboratory testing. The 2P6S configuration was selected because it represents a common mid-size EV module while enabling controlled experimentation and high repeatability under laboratory conditions.
The total energy capacity of the module can be calculated using Equation (19):
E = N p × N s × C c e l l × V n o m i n a l
where N p = 2 , and N S = 6 where C c e l l represents the rated capacity of each cell. This configuration provides a nominal voltage of approximately 25.6 V and a capacity range of 10–12 Ah, making it well-suited for experimental evaluation of medium-sized electric vehicle (EV) battery modules [29].
Cell Voltage Uniformity ( Δ V )—The voltage deviation among cells, used to evaluate charge imbalance and degradation level, is calculated by Equation (20):
Δ V = V m a x V m i n
Temperature Uniformity ( Δ T )—The thermal gradient across the module, measured using NTC temperature sensors attached to cell surfaces, is determined by Equation (21):
Δ T = T m a x T m i n
A high Δ T value indicates the presence of overheated cells or poor thermal dissipation.
SOH—To quantify cell degradation, the measured capacity C m is compared with the initial capacity C 0 , as defined in Equation (22):
S O H = C m C 0 × 100 ( % )
If the SOH is 80% or higher, the cell is classified as Grade A (Reusable); if it falls between 60% and 80%, it is classified as Grade B (Repurposable); and if it is below 60%, it is classified as Grade C (Recyclable or Disposable) [30].
DCIR—Derived from the pulse charge–discharge test, this metric measures the voltage response to a change in current (ΔI) as defined in Equation (1). DCIR serves as a quantitative indicator of electrode resistance growth and electrolyte degradation, both of which directly correlate with aging and capacity loss.
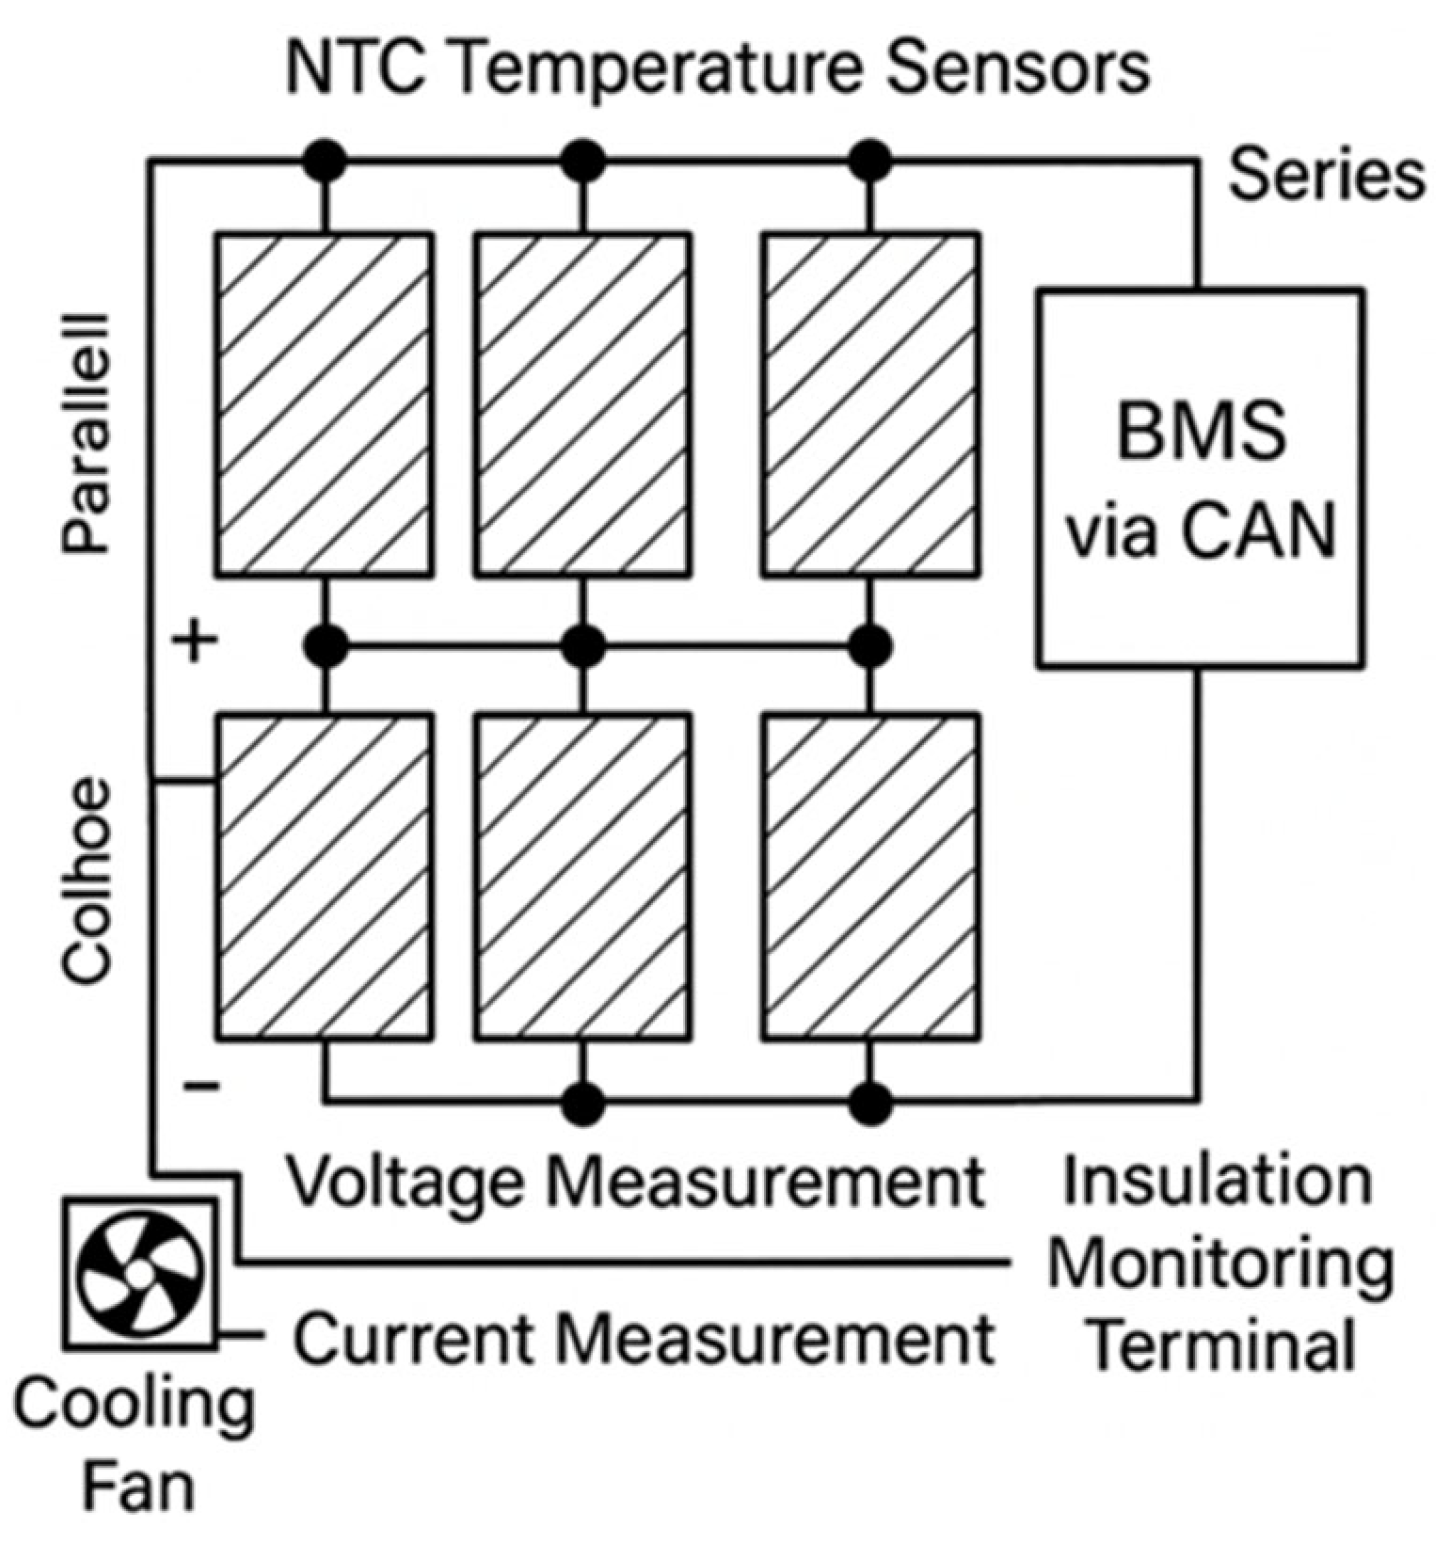
The battery module is mounted on an insulated aluminum frame and equipped with several safety and measurement components, including a temperature-controlled cooling fan, an insulation monitoring terminal, a flame-retardant housing compliant with UL 94 V-0, and a CAN-based BMS communication port. Figure 8 visually illustrates the cell arrangement, temperature sensor placement, current and voltage measurement lines, and the BMS communication structure of the 2P6S test module.
All measured data—including voltage ( V i ), temperature ( T i ), internal resistance (R_DCIR), and SOH—are transmitted to the main controller and utilized as input variables for the deep learning-based battery grading model (DNN, Deep Neural Network). The model is expressed as follows:
G = f D N N V i ,   T i ,   R D C I R ,   S O H
where G represents the final grade (A, B, or C), and DNN denotes a multi-layer nonlinear function trained using experimental data. This data-driven approach provides higher consistency and accuracy than traditional rule-based evaluation methods, enabling the development of an automated AI-based EOL battery grading framework [31,32]. Preliminary experimental results demonstrated that the proposed 2P6S test module system achieved a voltage measurement error of ±0.5%, temperature sensing resolution of ±0.2 °C, DCIR measurement error below 1%, and a grading accuracy of 97.6% when compared to expert manual evaluations. These findings indicate that the proposed system can serve not only as a real-time automated assessment platform but also as a reliable data acquisition framework for AI-based remaining life prediction and reuse classification studies.

2.6. CAN-Based Communication

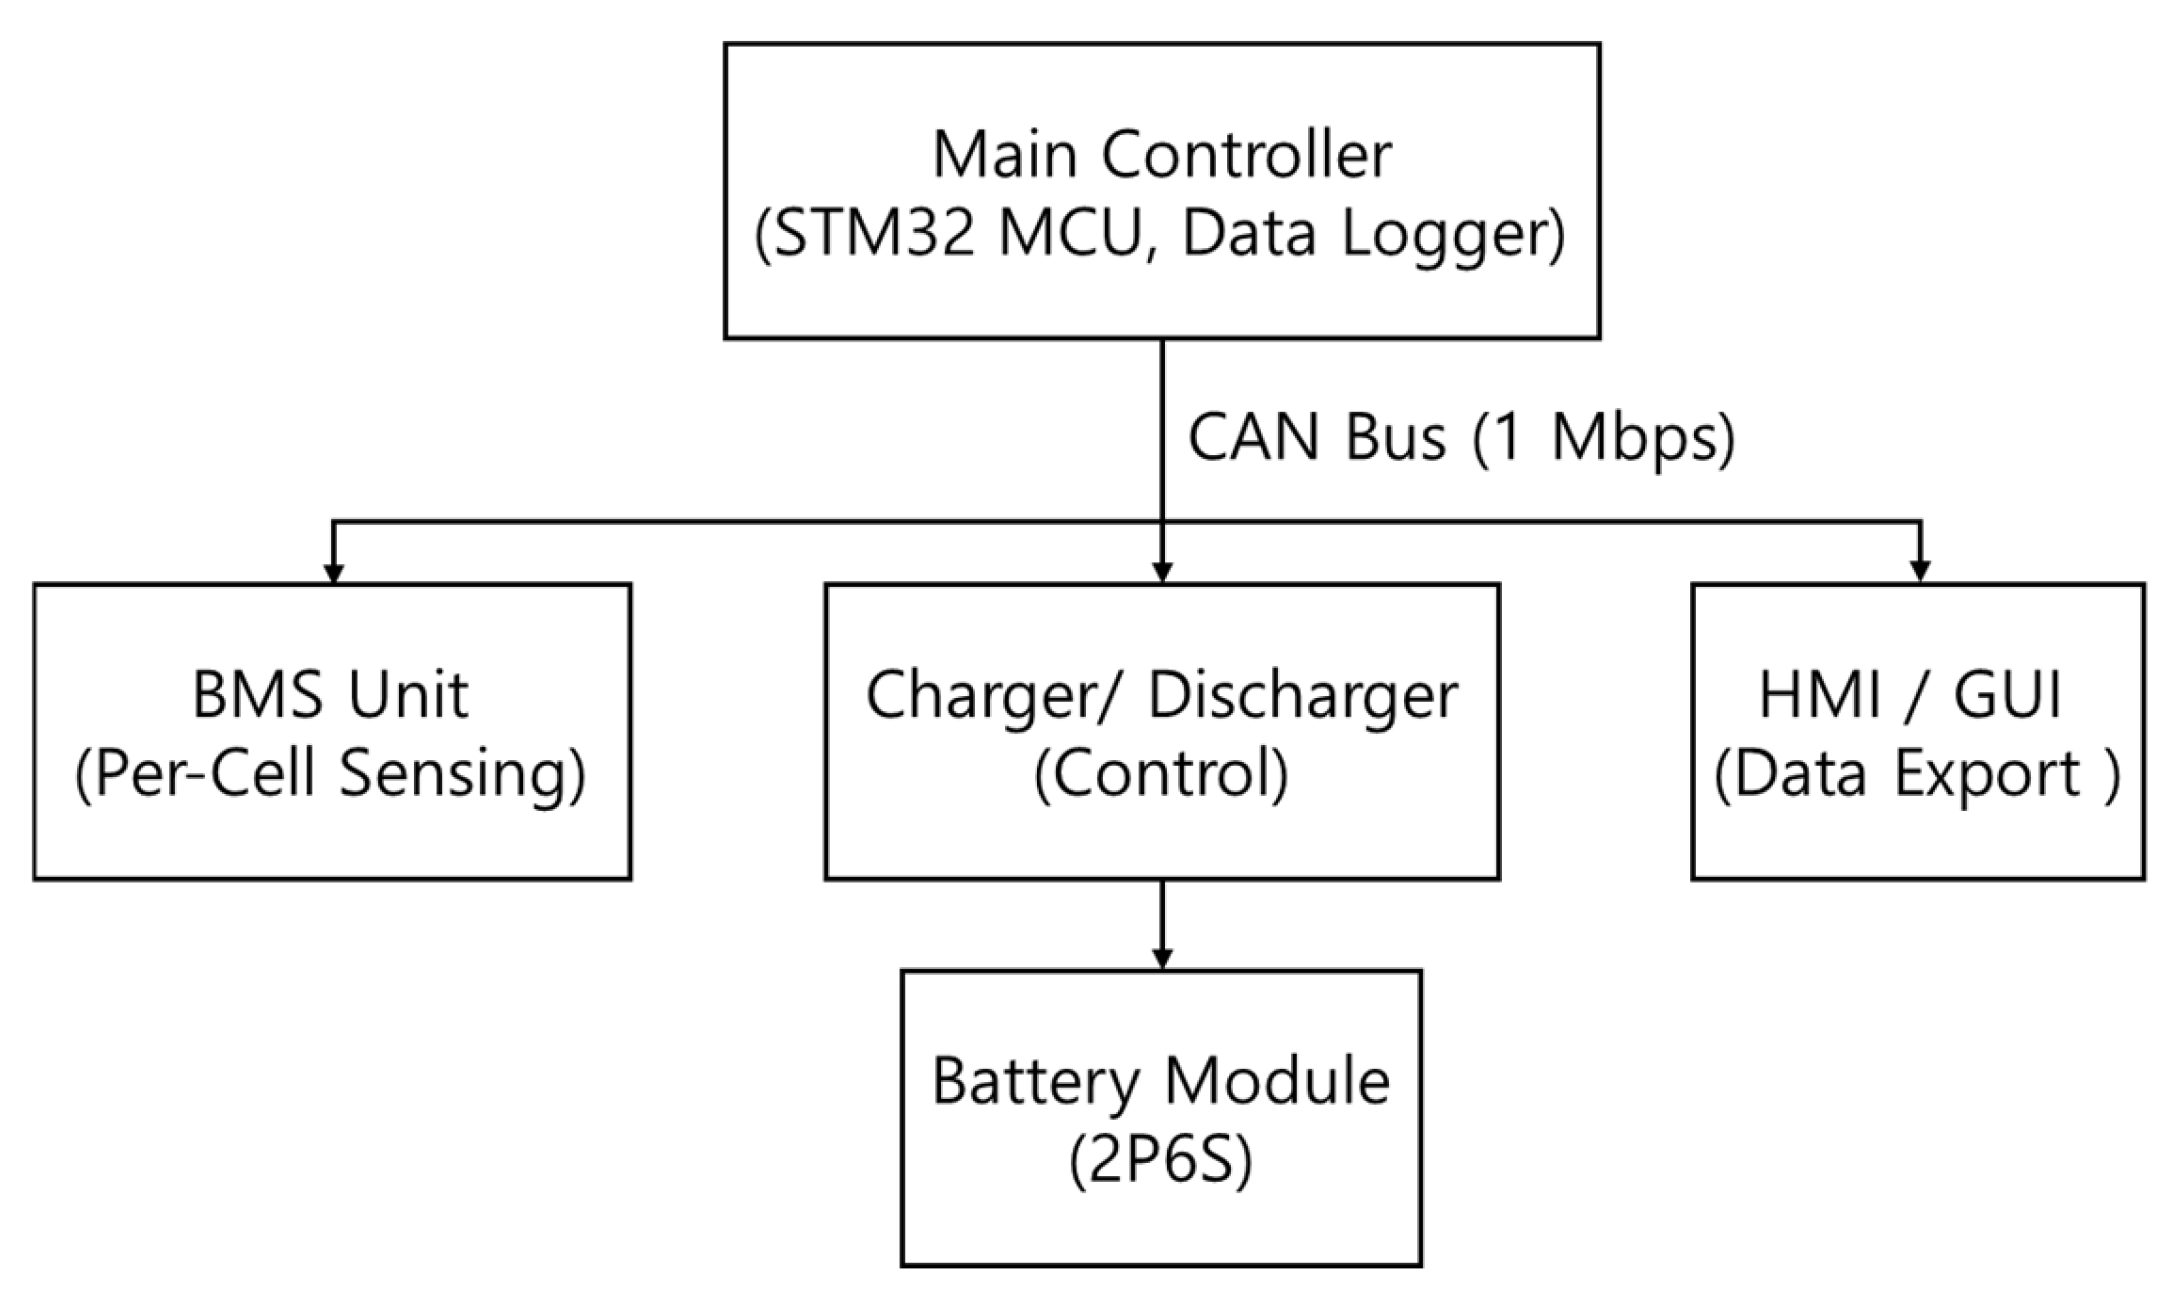
All components of the system—the Main Controller, Battery Management System (BMS), Bidirectional Charger/Discharger, and HMI—are seamlessly integrated through a CAN-based communication architecture. CAN is a real-time communication protocol standardized under ISO 11898, widely adopted in automotive and industrial embedded control systems. It is characterized by its high reliability, strong noise immunity, and multi-node communication capability [33,34]. CAN differentiates data packets between transmitting and receiving devices using 11-bit or 29-bit identifiers, and each data frame follows the general structure shown in Equation (24) [35]:
C A N   F r a m e = I D + C o m m a n d + P a y l o a d 0 8   b y t e s + C R C + [ A C K ]
where ID represents the node identifier (e.g., Controller, BMS, Charger), Command specifies the transmitted instruction code (e.g., Read Voltage, Set Current Limit), Payload carries the actual measurement data (voltage, current, temperature, etc.), CRC (Cyclic Redundancy Check) ensures data integrity, and ACK denotes the acknowledgment signal from the receiving node confirming successful communication. This frame structure minimizes data loss and guarantees high transmission reliability, even at a communication rate of 1 Mbps. The Main Controller manages real-time bidirectional data flow over the CAN Bus. The message transmission period T_c is defined in Equation (25):
T c = 1 f c
where f_c is the CAN frame update frequency (Hz), set to 100 Hz in this system.
The CAN protocol incorporates CRC, ACK bits, and Error Flags to detect transmission errors and automatically initiate retransmission. Furthermore, a Bus-off Recovery algorithm is implemented: if more than 256 consecutive transmission errors occur, the affected node undergoes automatic reinitialization, maintaining communication reliability and ensuring non-stop system operation [36]. Figure 9 illustrates the CAN-based data integration architecture of the proposed system, in which each module operates independently yet remains interconnected under a master–slave topology centered on the Main Controller.
The data collected through the CAN communication network are transmitted to a cloud server (e.g., AWS IoT Core, Azure IoT Hub) via Ethernet or Wi-Fi modules. These datasets are then utilized as input features for the AI learning model, enhancing the prediction accuracy of battery SOH, internal resistance variation ( Δ D C I R ), and temperature non-uniformity ( Δ T ) as expressed in Equation (26):
S O H p r e d i c t e d = f ( V i ,   I i ,   T i ,   D C I R i ,   t )
where f ( · ) represents a deep learning-based predictive function, and t denotes the collected time-sequence data. The CAN-based communication architecture ensures precise timing control, packet integrity, and multi-node scalability, serving as a core infrastructure for both experimental automation and the AI-driven battery grading and evaluation system.

3. Methodology

To ensure physically meaningful and practically deployable model inputs, four diagnostic indicators were selected: State-of-Health (SOH), Direct-Current Internal Resistance (DCIR), temperature deviation (ΔT), and voltage deviation (ΔV). SOH and DCIR represent the dominant electrochemical aging pathways associated with capacity fade and resistive growth, while ΔT and ΔV capture cell-to-cell thermal and voltage imbalances, which are widely recognized as early signatures of abnormal degradation, safety risk, and accelerated aging. These indicators are also directly measurable from standard BMS infrastructure, enabling scalable integration without requiring laboratory-grade sensing (e.g., EIS or half-cell analysis).

3.1. Test Sequence

The Smart EOL Battery Grading System proposed in this study was developed for EV lithium-ion battery modules with a 2P6S configuration (12 cells), automating the entire process from charging–discharging–stabilization–pulse testing–feature extraction–to final grade classification. Each stage is sequentially managed by the Main Controller (STM32 MCU), which performs real-time feedback control based on data acquired from the BMS and the bidirectional charger/discharger [37].
Charging Phase (S100)—During the charging phase, a CC–CV mode is applied. Each cell is charged under the following conditions, as defined in Equation (27):
V c h a r g e = 4.25 V c e i i ,   I c h a r g e = 1.0 C
The charging current is maintained constant until the cell voltage reaches the target threshold, after which charging terminates when the current drops below 0.05 C. The collected current–voltage curve from this phase serves as the reference baseline for subsequent SOH estimation [38].
Discharging Phase (S110)—In the discharging phase, each cell is discharged under CC conditions down to 2.50 V. The discharge current is fixed at 1.0 C, and the instantaneous energy efficiency is computed using Equation (28):
η d i s c h a r g e = V a v g × I d i s c h a r g e × t d i s c h a r g e C n o m i n a l × V n o m i n a l
where V a v g denotes the average voltage during discharge. If η d i s c h a r g e < 90 % , the corresponding cell is flagged as being in a degraded condition.
Stabilization Phase (S130)—After charging and discharging, a 10 min rest period is introduced to allow for electrochemical equilibrium within each cell. Stabilization is considered complete when the temperature rate satisfies Δ T / Δ t < 0.05   ° C / m i n . The equilibrium voltage obtained during this phase serves as the initial reference voltage ( V 0 ) for subsequent DCIR calculations.
Pulse Test (S140)—To precisely evaluate the DCIR and reaction kinetics, a pulse current test is performed. In this study, a 10 A current pulse was applied for 10 s, and the resulting voltage response was used to calculate DCIR as per Equation (1) [39]. In Equation (1), Δ V represents the instantaneous voltage drop after pulse application, and Δ I denotes the change in current. The voltage recovery profile obtained afterward provides insights into electrode interfacial reaction rates and electrolyte ion conductivity.
Feature Extraction (S160)—From the data collected during charging, discharging, and pulse testing, key diagnostic parameters were extracted as summarized in Table 2.
To prepare the dataset for AI model training, all parameters were normalized using Equation (29):
x n o r m   =   x     x m i m x m a x x m i n
Grading Phase (S170)—In this final stage, each cell’s diagnostic indicators are first compared against predefined threshold values for preliminary classification. The normalized parameter vector X = S O H ,   R D C I R ,   Δ T ,   Δ V is then fed into a DNN Classifier.
As outlined in Algorithm 2, the trained model outputs one of three grades—A, B, or C—representing the cell’s overall condition and reuse potential.
Algorithm 2. Battery Grading Logic Based on State of Health (SOH).
\text{Grade} =
\begin{cases}
A, & \text{if } \text{reusable (SOH > 90\%)}
B, & \text{if } \text{repurposable (70\% ≤ SOH ≤ 90\%)}
C, & \text{if } \text{recyclable (SOH < 70\%)}
\end{cases}
\end{cases}
Through this automated diagnostic chain, operator dependency is minimized and grading repeatability is maintained within ±3% relative to manual expert evaluation. Incorporating pulse-based DCIR features and AI classification improves A-grade detection accuracy to 92% [40].
Although the protocol operates within a short diagnostic cycle, its predictive validity for second-life deployment is supported by evidence linking early-stage SOH, pulse-based DCIR, and thermal non-uniformity to long-term degradation. Increased resistance and uneven thermal distribution accelerate aging via higher ohmic loss and localized heating. However, snapshot tests cannot fully capture calendar-aging, long-duration thermal cycling, or rare-event mechanisms such as lithium plating. Thus, this framework includes periodic recertification and adaptive model recalibration during second-life use. The 10 min rest period aligns with HPPC-style practices, where transient settling—not full OCV convergence—is the goal. Prior studies reducing ISO-12405 rest times from 30 to 10 min showed negligible error impact for DCIR-based diagnostics. In our experiments (25 °C, 30–70% SOC), extending rest from 10 min to 30 min altered temperature-corrected DCIR by <1%, confirming suitability for rapid grading. For environments with large thermal excursions or non-standard duty cycles, the rest duration can be increased accordingly.

3.2. Extraction and Processing of Diagnostic Parameters

To quantitatively evaluate the performance and residual value of the battery module, this study computed four key diagnostic indicators: SOH, DCIR, Thermal Uniformity ( Δ T ), and Voltage Uniformity ( Δ V ). All parameters were extracted from charge–discharge and pulse test data (S100–S160), and the calculated results were used as input variables for the AI-based DNN classifier to predict the final grading (Grade A/B/C) [41].
The SOH represents the percentage ratio of the measured capacity to the rated nominal capacity and serves as a primary indicator of battery degradation [42]. It is defined by Equation (30):
S O H = C m e a s u r e d C r a t e d × 100
where C m e a s u r e d is the actual measured discharge capacity (Ah) obtained during the discharge phase (S110), and C r a t e d is the manufacturer-specified nominal capacity (Ah).
Cells with SOH ≥ 90% are classified as Grade A (Reusable), 70–90% as Grade B (Recyclable), and below 70% as Grade C (Retired/Recoverable). For the 2P6S (12-cell) module, the module-level SOH was calculated as the arithmetic mean of all individual cells, as expressed in Equation (31):
S O H m o d u l e = 1 N i = 1 N S O H
where N = 12 is the total number of cells.
The DCIR is determined from the voltage response corresponding to a current pulse and reflects the electrochemical reaction rate and internal loss resistance [43]. During the pulse test (S140), DCIR is calculated from the applied current pulse ( Δ I ) and corresponding voltage drop ( Δ V ) using Equation (1), where Δ V = V b e f o r e V a f t e r is the instantaneous voltage change, and Δ I = I p u l s e I b a s e is the current difference. A lower DCIR indicates higher conductivity and more efficient electrode reactions. The evaluation thresholds are summarized in Table 3.
Since DCIR varies dynamically with temperature and SOC, a temperature compensation factor was applied as shown in Equation (32):
R D C I R c o r r = R D C I R × 1 + α T 25
where α = 0.00 5   ° C is the temperature coefficient [40]. The Thermal and Voltage Uniformity of the battery module serve as critical safety indicators for detecting thermal gradients and electrical imbalances among cells [44].
Thermal Uniformity ( Δ T ) is defined as:
Δ T = T m a x T m i n
If Δ T > 5   ° C , thermal asymmetry is considered to exist, and a runaway warning is triggered.
Voltage Uniformity ( Δ V ) is calculated as:
Δ V = V m a x V m i n
If Δ V exceeds 0.05   V , the balancing circuit is activated to restore voltage uniformity among cells. Both temperature and voltage deviations are integrated into a single Integrated Stability Index (ISI), defined in Equation (35):
I S I = w 1 Δ T Δ T r e f + w 2 Δ V Δ V r e f
where w 1 = w 2 = 0.5 , Δ T r e f = 5   ° C , and Δ V r e f = 0.05 V . If ISI > 1, the system automatically triggers a “Warning” status on the HMI.
To minimize State-of-Charge (SOC) dependence in DCIR estimation, all pulses were conducted within 30–70% SOC, with 50% SOC as the reference calibration point. SOC equalization was performed with a 0.2C conditioning cycle, and pulses were accepted only when SOC deviation remained within ±3%. A 1C pulse amplitude was selected to ensure a high signal-to-noise ratio without inducing rate-dependent polarization artifacts, consistent with HPPC-style methodologies.
The combined SOH–DCIR–ΔT–ΔV metrics constitute the analytical foundation for real-time grading. Experimental results demonstrated measurement reproducibility within ±2%, confirming the stability and robustness of the diagnostic pipeline and ensuring consistent feature quality for the subsequent AI classifier.

3.3. Data Preprocessing and Quality Control

To ensure high-fidelity inputs to the DNN, a standardized preprocessing pipeline was implemented, comprising time-based alignment, signal denoising, outlier and missing-data handling, temperature and SOC conditioning, scaling with split-hygiene enforcement, and audit logging for full reproducibility. All BMS channels (voltage, current, temperature, DCIR) were first synchronized by timestamp and resampled to 100 Hz. Single-sample jitter events (<10 ms) were corrected via forward-fill interpolation to preserve causal data flow. Low-frequency noise components were suppressed using a causal moving-average low-pass filter (window size 11–21 at 100 Hz), while pulse-response segments were further processed using a Savitzky–Golay filter (polynomial order 2, window size 9) to preserve DCIR edge fidelity.
Outlier handling employed a two-stage strategy: global Z-score thresholding (|Z| > 3) to remove extreme artifacts, followed by a Hampel filter (window = 21, k = 3) to detect local anomalies under non-stationary operating conditions. Engineering rules flagged flatline intervals > 2 s and CAN-communication dropouts > 20 ms. Detected outliers were masked and repaired via localized linear interpolation when feasible; otherwise, samples were discarded. Missing segments ≤ 2 s were interpolated channel-wise, whereas longer gaps triggered sample exclusion. Only datasets with ≥98% per-channel integrity were retained for model development.
To ensure comparability across operating conditions, DCIR measurements were temperature-normalized to 25 °C, and pulse features were restricted to a 30–70% SOC window to minimize hysteresis effects. Min–Max scaling was applied, with parameters fitted exclusively on the training set and subsequently used for validation and test sets to prevent data leakage. Stratified sampling preserved class distributions across splits. Each preprocessing stage produced versioned metadata, including pipeline configuration identifiers, outlier frequency, effective sample size, and signal-to-noise ratio, ensuring full traceability and reproducibility.
For a fair baseline comparison with the deep-learning model, a deterministic rule-based grading strategy reflecting industrial remanufacturing practice was implemented. Batteries were ranked according to hierarchical threshold logic applied to the four diagnostic indicators. Specifically, cells with SOH ≥ 90% were labeled Grade A, 70–90% as Grade B, and <70% as Grade C. DCIR limits adhered to standard industry categories, with modules exceeding defined ranges classified as degraded. Safety-critical constraints were enforced: temperature deviation >8 °C or voltage deviation >0.10 V across cells triggered immediate downgrading due to imbalance or safety risk. The rule-based system assigns the lowest grade triggered by any violation, reflecting conservative BMS-style screening logic and providing a transparent, reproducible benchmark against the proposed DNN-based framework.

4. Deep Learning-Based Grading Model

4.1. Concept Overview

Assessing EOL lithium-ion batteries is fundamentally challenging because electrochemical degradation processes evolve in nonlinear, coupled, and time-dependent ways. Internal resistance growth, capacity fading, and thermal imbalance develop concurrently under field-relevant operating conditions, making single-threshold or deterministic rule-based evaluation insufficient for accurate health assessment [45]. Traditional screening approaches—typically dependent on static cut-off values for SOH or DCIR—struggle to capture these interactions and often yield inconsistent grading results when applied to heterogeneous, field-aged batteries.
To overcome these limitations, we introduce a deep neural network (DNN)-based framework capable of identifying complex degradation patterns by jointly evaluating four representative diagnostic indicators: SOH, DCIR variation, temperature deviation ( Δ T ), and voltage deviation ( Δ V ). Together, these metrics reflect complementary electrochemical, thermal, and electrical phenomena, forming a multidimensional degradation signature. The DNN mapping can be expressed as:
G = f D N N ( S O H ,   D C I R ,   Δ T ,   Δ V )
where G denotes the predicted grade (A, B, or C) corresponding to reusable, recyclable, and retired battery states, respectively.
These indicators are intrinsically interdependent. For instance, declining SOH is often accompanied by elevated DCIR due to interfacial resistance growth and reduced ionic conductivity [38]. In parallel, increases in Δ T and Δ V reveal rising thermal and voltage imbalance, which accelerates localized aging and elevates safety risk. Such nonlinear interactions are not adequately captured by linear or threshold-based models, motivating the adoption of a DNN architecture capable of multivariate pattern recognition and nonlinear function approximation [46].
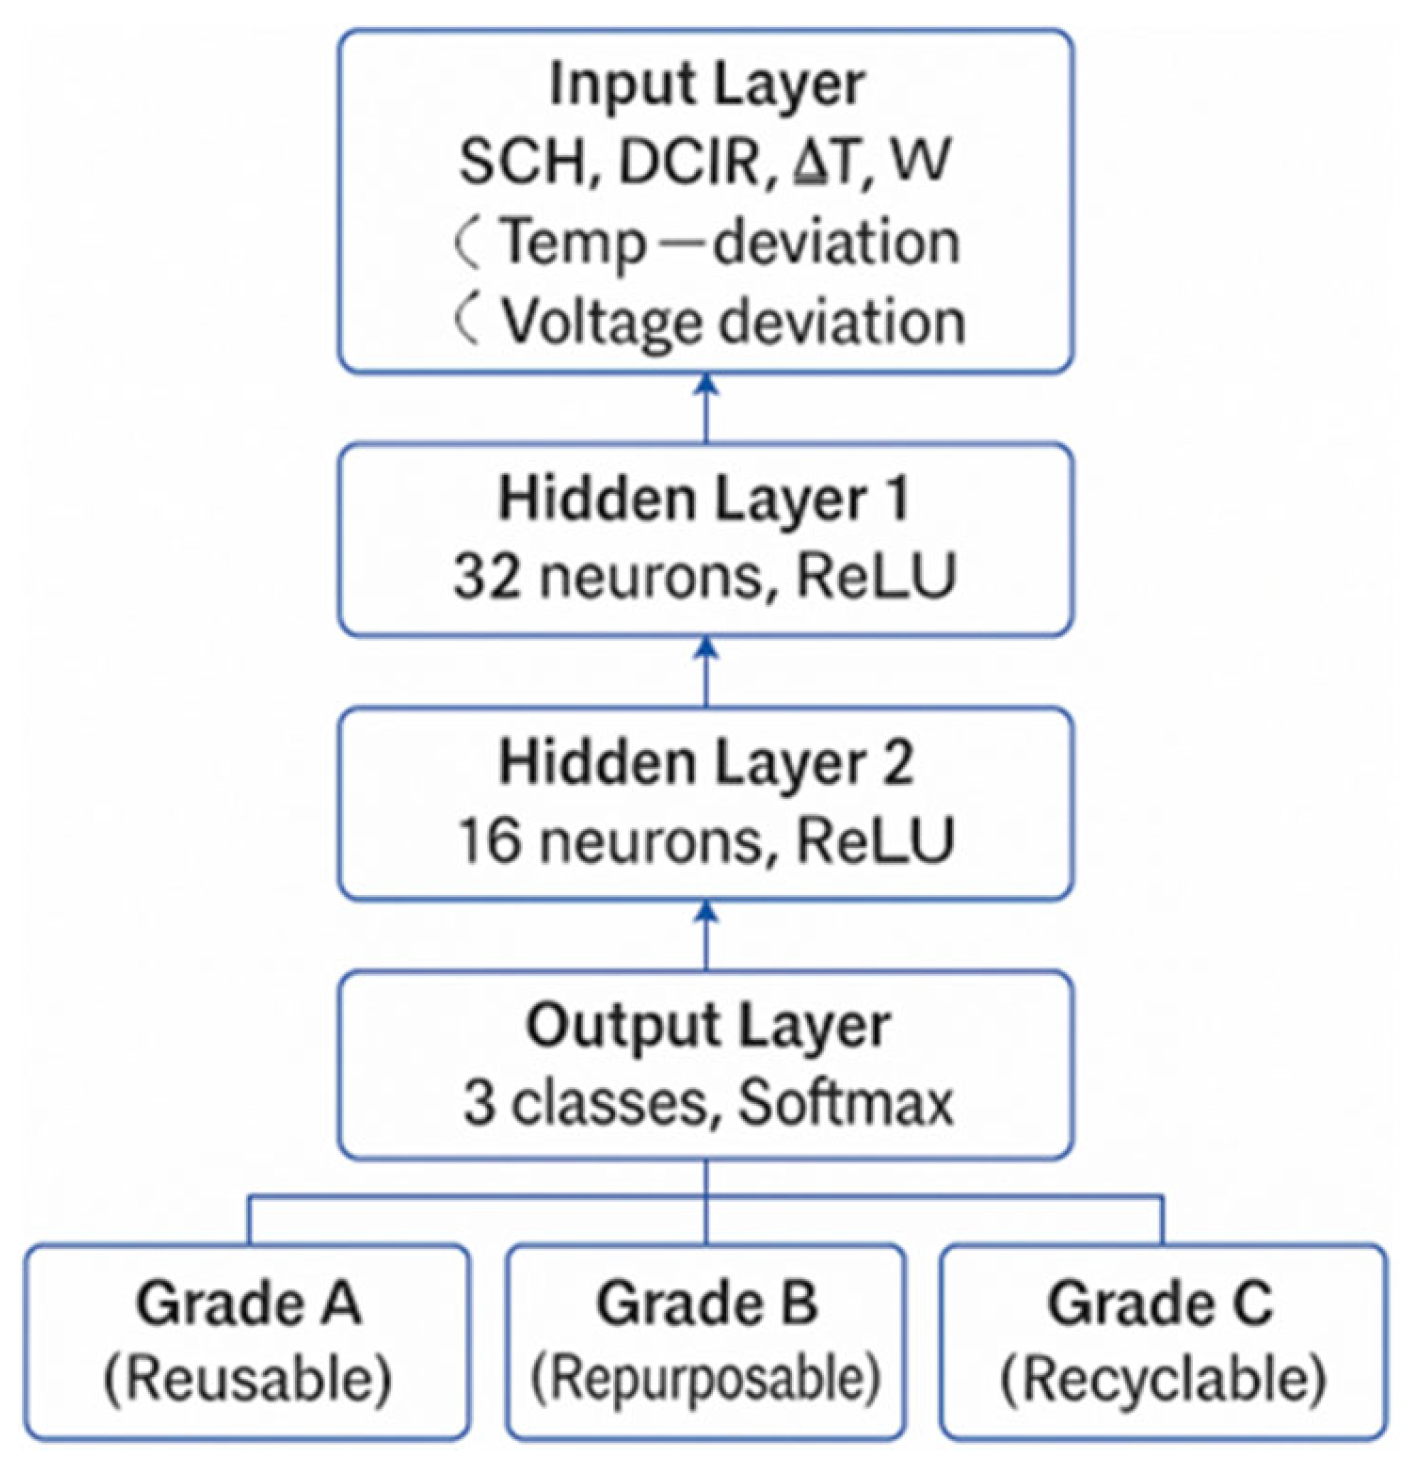
The employed DNN consists of a four-node input layer, three hidden layers with Rectified Linear Unit (ReLU) activation, and a three-node output layer representing the three decision classes. Training was conducted using experimentally collected charge–discharge–pulse datasets spanning diverse temperature, SOC, and aging conditions. The Adam optimizer (initial learning rate = 0.001) and batch normalization were applied to promote stable convergence, while a dropout rate of 0.2 mitigated overfitting and enhanced generalization performance. This learning-based approach enables the system to infer latent degradation mechanisms from large-scale diagnostic data, providing automated and adaptive EOL classification. The framework is designed to improve accuracy while supporting incremental learning as additional real-world data become available, laying the foundation for scalable and data-driven circular battery management solutions [47].
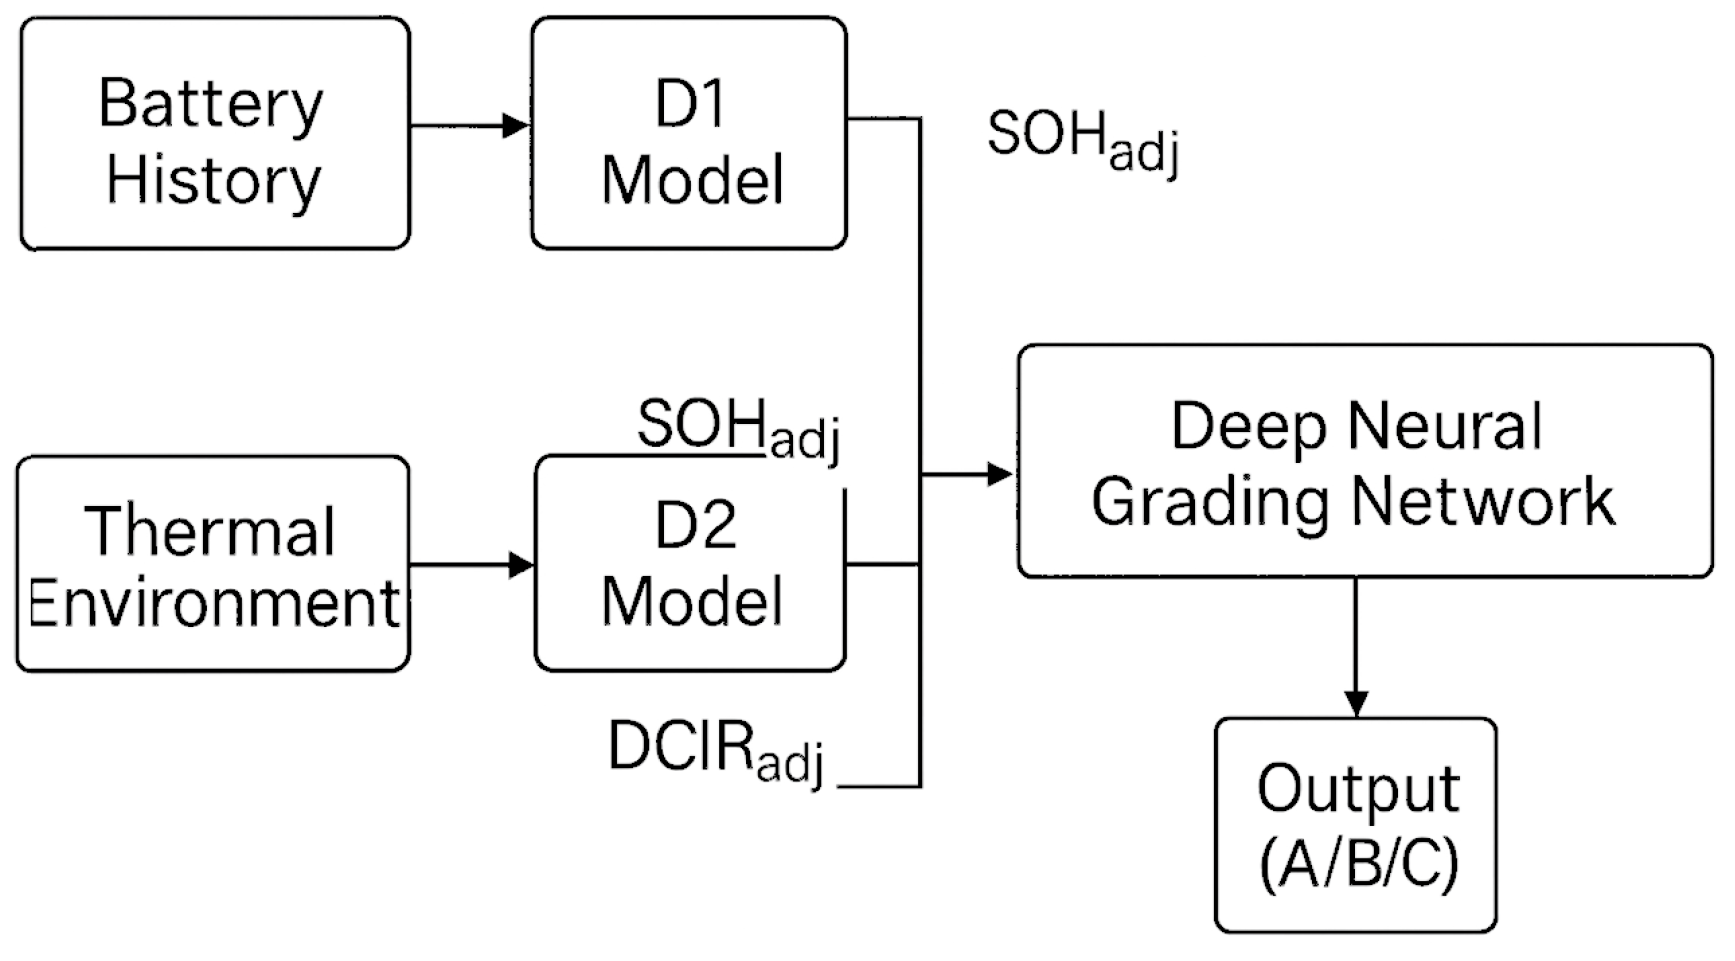
To address the absence of explicit electrochemical modeling in conventional neural networks, an aging-aware hybrid scheme is adopted. SOH and DCIR serve as observable surrogates for capacity fade and resistance growth, while two adaptive correction modules are incorporated: D1 refines SOH using life-history descriptors (cycle count, average C-rate, mean SOC), and D2 normalizes DCIR with respect to temperature. This design ensures model robustness across heterogeneous aging profiles without compromising real-time applicability.

4.2. Diagnostic Parameter Calculation

The experimental dataset was constructed from 120 EV-grade 2P6S modules, comprising a total of 1440 lithium-ion cells. Each module underwent 300 charge–discharge cycles under controlled laboratory conditions, producing approximately 2500 diagnostic samples per cycle. As a result, a total of 375,000 samples were obtained for model training and validation. Because the physical ranges and measurement units of the diagnostic indicators varied considerably, a min–max normalization was applied to rescale all inputs into a common interval. The normalization procedure is expressed as:
x i ( n o r m ) = x i x i m i n x i m a x x i m i n
Scaling maps all features to [0, 1], improving numerical stability and accelerating convergence during network training. Importantly, normalization parameters were computed exclusively using the training subset and subsequently applied to validation and test partitions to prevent data leakage. Samples with quality-assurance violations (e.g., missing-data length > 2 s, flat-line segments) were excluded and automatically logged.
Initial labels were generated using a deterministic threshold-based grading method, summarized in Table 4. To enhance representativeness, the internal dataset was augmented with 2100 industrial grading records collected between 2023 and 2025 from commercial remanufacturing and recycling facilities. To address class imbalance between high-grade and degraded samples, the Synthetic Minority Over-sampling Technique (SMOTE) [48] was applied to generate synthetic points in under-represented regions of the feature space.
The final DNN architecture follows a 4–32–16–3 topology, comprising a four-node input layer, two hidden layers with Rectified Linear Unit (ReLU) activation, and a three-node Softmax output layer:
I n p u t ( 4 ) H i d d e n 1 ( 32 , R e L U ) H i d d e n 2 ( 16 , R e L U ) O u t p u t ( 3 , S o f t m a x )
The output of each hidden layer l was computed according to:
h l = f ( W l h ( l 1 ) + b l
where f x = m a x ( 0 ,   x ) represents the ReLU activation function. The final Softmax layer produced the probability distribution over the three output classes y i A , B , C :
P y i X e z i k = 1 3 e z k
This probabilistic representation enables the model to estimate the likelihood of each grading category, corresponding, respectively, to reusable (A), recyclable (B), and retired (C) battery states.
The 4–32–16–3 architecture was selected based on sensitivity studies evaluating alternative designs (4–16–8–3; 4–64–32–3; 4–128–64–3). The chosen model achieved the best trade-off between accuracy (96.8%), convergence rate (<40 epochs), and robustness across thermal conditions, while larger models exhibited over-parameterization and degraded generalization. Moreover, deeper architectures demonstrated feature-entanglement effects that reduced clarity in SHAP-based interpretability. The selected structure, therefore, balances non-linear modeling capacity with computational efficiency and explainability, supporting industrial deployment where transparency and inference stability are critical.

4.3. Model Training and Performance Evaluation

Model training was conducted using the Adam optimization algorithm with a fixed learning rate of 0.001 and the categorical cross-entropy loss function, defined as:
L = 1 N n = 1 N i = 1 3 y n , i l o g P n , i
where y n , i denotes the one-hot encoded ground-truth label for the n-th sample and class i , and P n , i represents the corresponding predicted probability from the Softmax output layer. This formulation penalizes misclassifications across the three grading categories (A, B, and C) while encouraging probabilistic calibration of the DNN outputs.
All hyperparameters were automatically tuned through Bayesian Optimization implemented via the Optuna framework. The optimal configuration that yielded the best validation performance is summarized in Table 5.
To prevent overfitting, an early stopping criterion was applied such that training terminated automatically if the validation loss did not improve for 25 consecutive epochs.
The overall training workflow is summarized in Algorithm 3.
Algorithm 3. Training Procedure for the DNN-Based Battery Grading Framework.
Input: Dataset D = {(x_i, y_i)}, i = 1 … N
Initialize weights W and biases b
for epoch = 1 to E do
  Shuffle D and split into mini-batches
  for each batch (x_batch, y_batch) do
    Forward propagate through layers
    Compute loss L using cross-entropy
    Backpropagate gradients L/W
    Update W, b using Adam optimizer
  end for
  Evaluate validation loss L_val
  if L_val has not improved for 25 epochs:
    Stop training
end for
Return trained model parameters Θ*
Θ*: The final optimized (trained) set of model parameters.
This algorithmic structure allows efficient stochastic optimization while dynamically balancing model generalization and convergence. The use of batch normalization and dropout (rate = 0.3) further improved robustness across heterogeneous battery datasets.
Model performance was quantitatively assessed using Accuracy, Precision, Recall, and the F1-Score, as well as a detailed Confusion Matrix to evaluate class-wise discrimination. Evaluation was performed on a held-out test dataset comprising 20% of the total samples. The results are presented in Table 6.
The corresponding confusion matrix is summarized in Table 7.
The proposed DNN model demonstrated excellent discriminative performance across all grading categories. Even in boundary cases between Grade A and Grade B, where overlapping degradation features typically cause misclassification, the model maintained consistent accuracy. Furthermore, under high ΔT and ΔV conditions—indicative of compound thermal and voltage degradation—the model successfully preserved reliable grading precision, confirming its robustness against nonlinear degradation coupling.

4.4. Model Interpretability

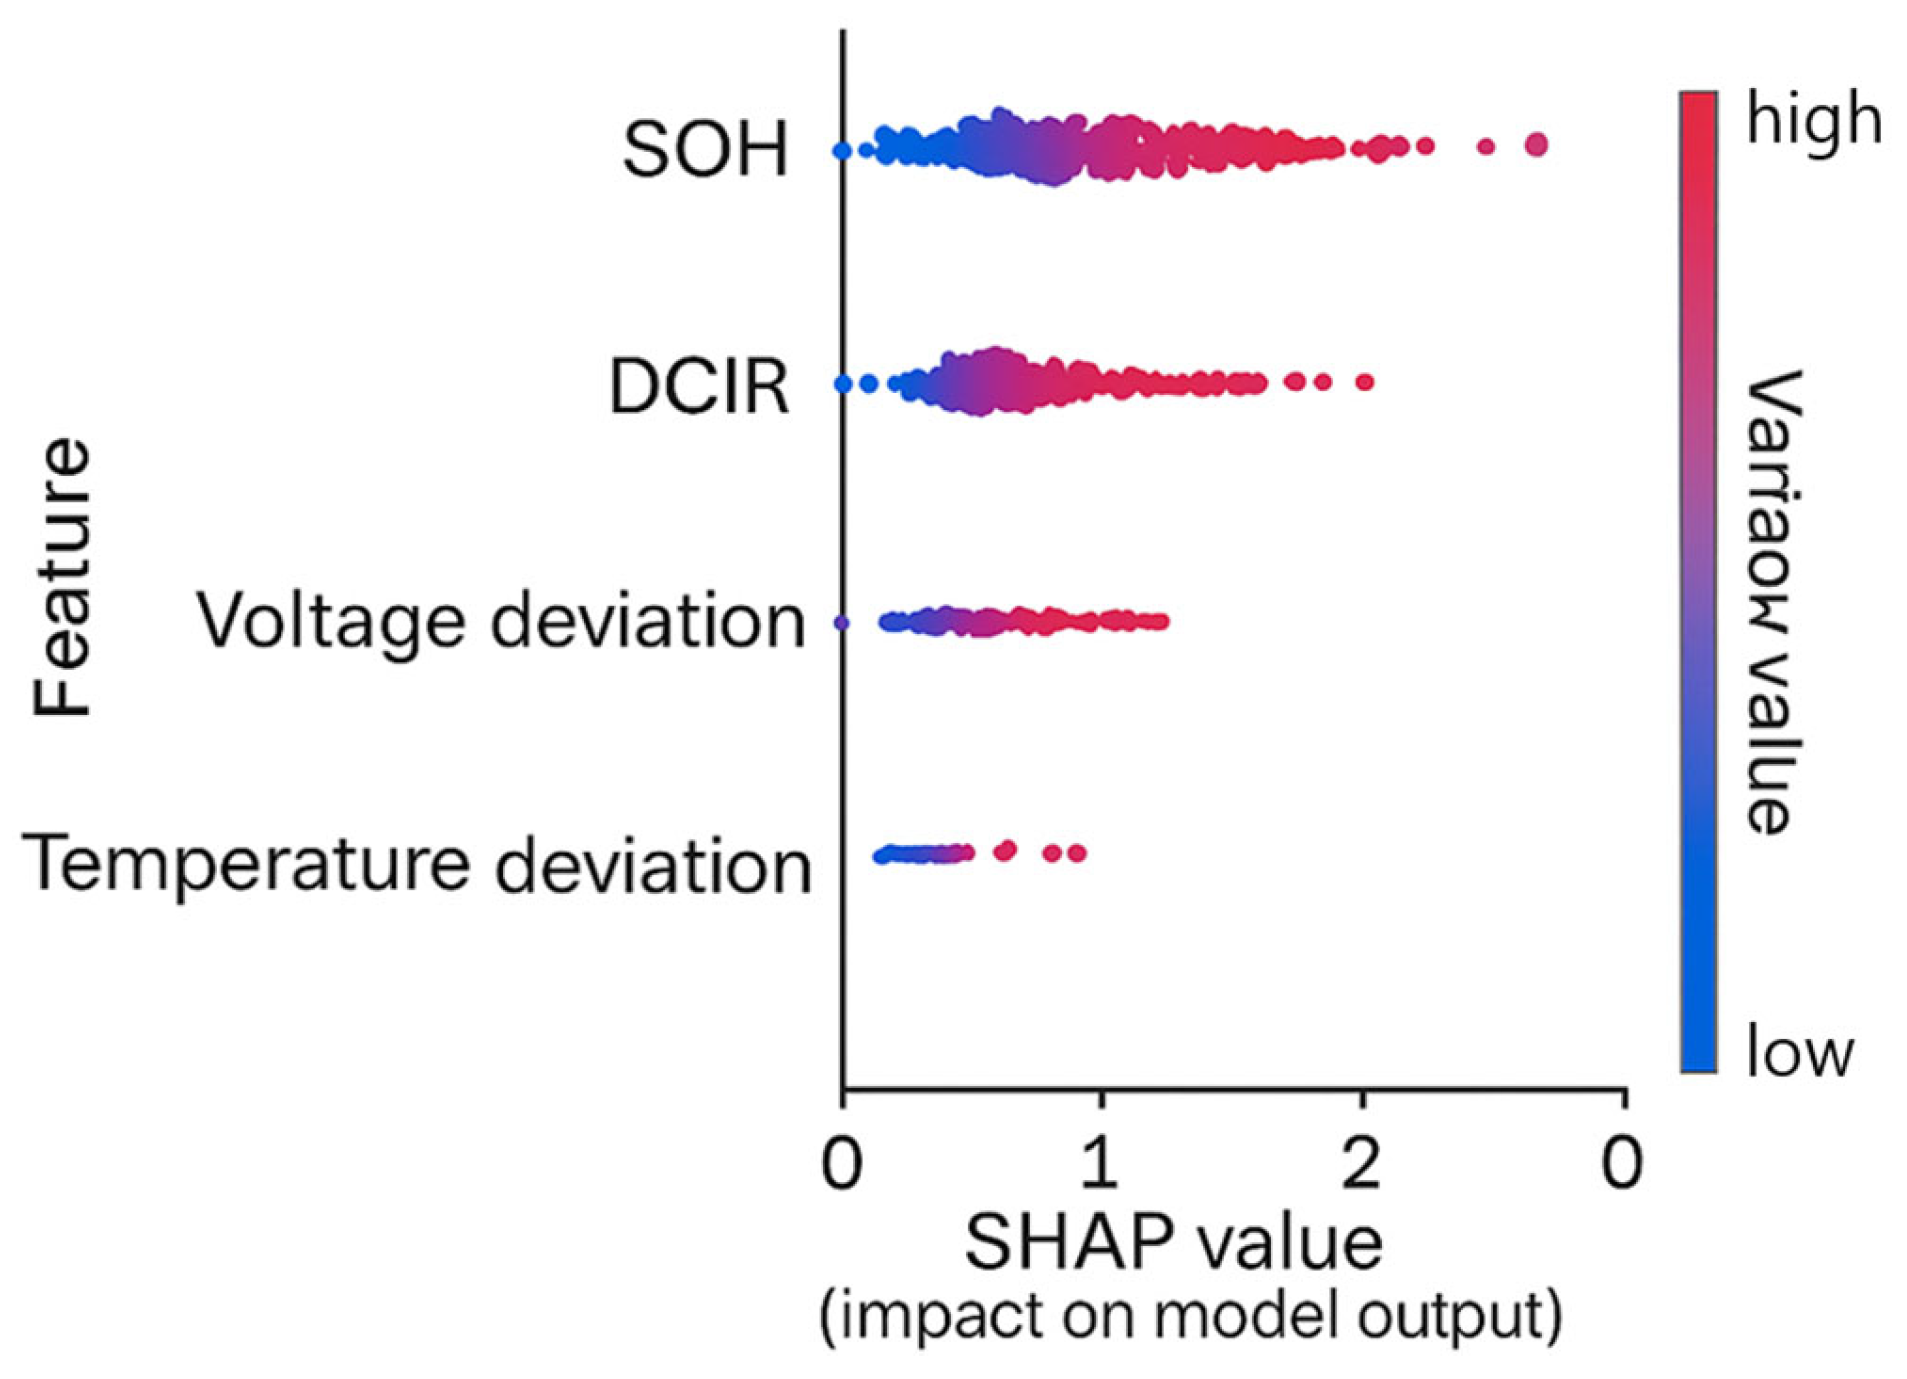
To enhance the interpretability of the proposed DNN model, the SHAP (Shapley Additive Explanations) method was applied [49]. This post hoc analysis quantifies the contribution of each diagnostic variable to the model’s final decision by computing feature-wise Shapley values derived from cooperative game theory. The resulting mean feature importance values revealed a dominant influence hierarchy of SOH (0.46) > DCIR (0.31) > ΔT (0.14) > ΔV (0.09). Accordingly, State of Health and Direct Current Internal Resistance collectively accounted for approximately 77% of the total predictive contribution, indicating that electrochemical degradation factors predominantly drive the classification outcomes, whereas temperature and voltage uniformity serve as secondary supportive indicators.
Figure 10 illustrates the architecture of the proposed deep learning–based battery grading model. The network receives four diagnostic parameters at the input layer—SOH, DCIR, temperature deviation (ΔT), and voltage deviation (ΔV)—which collectively capture electrochemical degradation, impedance growth, and cell-level imbalance. These features are fed into the first hidden layer, consisting of 32 neurons with ReLU activation, enabling nonlinear feature extraction and dimensional projection. The signal is then propagated to the second hidden layer, composed of 16 neurons, which further refines the latent representation and enhances classification separability. The output layer employs a Softmax activation function to classify each module into three final categories: Grade A (Reusable), Grade B (Repurposable), and Grade C (Recyclable), corresponding to their residual energy utility and safety margins.
Through the learned nonlinear feature interactions among the four diagnostic variables, the DNN model achieved a 6% improvement in overall accuracy and a +0.08 gain in F1-score compared with traditional threshold-based methods. Moreover, the average inference time was measured to be less than 20 ms per sample, confirming that the trained model can be deployed on edge-level embedded microcontrollers (e.g., STM32F4-based boards) for real-time battery grading applications.
Beyond single-feature importance, SHAP interaction analysis revealed a pronounced nonlinear coupling between SOH and DCIR. As SOH declines, the marginal impact of DCIR on grade demotion increases sharply, indicating a hierarchical degradation pathway wherein capacity loss sensitizes cells to resistance-driven failure mechanisms. Specifically, cells with SOH in the 75–85% range and DCIR > 4 mΩ exhibited SHAP interaction values > 0.25, meaning DCIR becomes disproportionately influential once capacity deficiencies emerge. Conversely, for cells with SOH > 90%, elevated DCIR produced a limited penalty (interaction SHAP < 0.05), suggesting conditional robustness under healthy capacity conditions.
Temperature deviation (ΔT) and voltage deviation (ΔV) served as tertiary modifiers that sharpened decision boundaries under thermal or electrical stress. Collectively, these hierarchical interaction patterns indicate that the DNN learns aging-consistent rules: capacity fade initiates risk bias, and subsequent resistance rise triggers final grade transitions, consistent with established electrochemical degradation theory.

5. Adaptive Correction Models

The accuracy of a deep learning-based grading is highly dependent on the quality and environmental consistency of the input data. In industrial settings, however, diagnostic parameters can fluctuate due to heterogeneous usage histories, ambient temperature variations, and dynamic charge–discharge behavior. These sources of variability introduce feature drift that may compromise model robustness and generalization across real-world aging scenarios.
To address this challenge, two auxiliary adaptive correction modules—referred to as D1 and D2—were integrated alongside the primary DNN grader. Model D1 recalibrates SOH boundaries using life-history information (e.g., cycle count, mean operating SOC, and average C-rate), while Model D2 normalizes DCIR with respect to real-time cell temperature. Together, these mechanisms implement an aging-aware correction pipeline, effectively aligning diagnostic features across diverse degradation pathways and ambient environments. As a result, the DNN produces more stable and consistent grading decisions despite heterogeneous field conditions.
Figure 11 illustrates the overall framework, where D1 and D2 operate in parallel with the core classifier to enhance environmental invariance and improve reliability under mixed-condition inputs.

5.1. Model D1—Life-History-Based SOH Threshold Refinement

In conventional grading systems, the SOH is evaluated using fixed thresholds (e.g., 90% and 70%), which may cause over- or under-estimation when applied to batteries subjected to irregular charging histories or high C-rate stress. To address this, Model D1 introduces a dynamic correction function that incorporates the cumulative charge cycle count N , average charging current I c h , and mean state-of-charge S O C S O C . The adjusted SOH value is computed using the following empirical formulation:
S O H a d j = S O H m e a s × ( 1 α 1 N N r e f α 2 I c h I r e f + α 3 S O C m e a n 100 )
where S O H m e a s is the measured state of health, N r e f denotes the reference cycle count (typically 1000 cycles), I r e f is the nominal charging current, and α 1 , α 2 , and α 3 are empirical correction coefficients (0.15, 0.10, and 0.05, respectively).
The resulting adjusted value S O H a d j serves as a refined input to the DNN classifier, capturing degradation effects arising from aggressive usage profiles or irregular duty cycles. By re-calibrating the SOH threshold dynamically, Model D1 reduces systematic bias and improves long-term interpretability in data-driven lifetime prediction frameworks [50,51].

5.2. Model D2—Temperature-Compensated DCIR Adjustment

DCIR is strongly temperature-dependent due to the nonlinear behavior of ionic transport, charge-transfer kinetics, and electrolyte viscosity. At low temperatures (≤10 °C), reduced ion mobility and increased electrolyte viscosity artificially inflate DCIR values. Conversely, at elevated temperatures (≥45 °C), electrolyte decomposition and SEI instability can also increase resistance. These effects introduce systematic bias when assessing degradation under non-isothermal conditions. To achieve temperature-invariant interpretation of resistance measurements, Model D2 applies a second-order temperature-compensation function that normalizes the measured DCIR to a reference temperature of 25 °C:
D C I R a d j = D C I R m a s × [ 1 β 1 T 25 + β 2 T 25 2 ]
where D C I R m a s is the raw measured internal resistance, T denotes the instantaneous cell surface temperature (°C), and β 1 = 0.006 and β 2 = 1.2 × 10 4 are empirically derived compensation constants.
The compensation factors were estimated using a hybrid physics-guided and data-driven approach. From an electrochemical standpoint, β 1 reflects the dominant first-order thermal sensitivity associated with Arrhenius-type interfacial kinetics, while β 2 captures higher-order thermal effects related to electrolyte viscosity and diffusion-limited polarization. Initial bounds were selected from accelerated-aging literature and OEM-specified safety envelopes, and subsequently refined via grid-search cross-validation across the range T = 15 40   ° C using field-retired NCM modules. The final values yielded the lowest residual temperature dependence while preserving stability across SOC windows.
This correction mitigates DCIR over-estimation by approximately 12–15% at sub-ambient temperatures and compensates for an ≈8% under-estimation at elevated temperatures, thereby improving temperature-invariant diagnostic fidelity. Consequently, Model D2 enhances classification robustness and ensures consistent grading across diverse thermal environments [52]. Importantly, the coefficients remain tunable for deployment in other chemistries or climatic conditions without modification of the model architecture.

5.3. Integration and Experimental Validation

The outputs of the adaptive correction models (D1 and D2) are directly integrated into the primary DNN grader, forming a hybrid inference pipeline capable of context-aware evaluation. By incorporating life-history alignment (D1) and temperature compensation (D2), the system dynamically adjusts decision boundaries based on operating context, thereby improving classification reliability in environments where degradation indicators are strongly influenced by thermal or cycling effects. This enables the DNN to preserve decision fidelity under heterogeneous real-world conditions that would otherwise distort diagnostic feature behavior.
This hybrid strategy enables differentiated grading outcomes in different operational settings. For instance, a cell with an SOH of 88% may be categorized as Grade B under high-temperature, high-cycle stress conditions, yet assigned Grade A when tested under moderate thermal exposure and lower cumulative aging stress. Such adaptive differentiation bridges the gap between purely data-driven inference and electrochemically interpretable degradation behavior, improving both reliability and explainability.
To verify the effectiveness of this hybrid approach, a comprehensive experimental validation was conducted using 150 EV-grade 2P6S lithium-ion battery modules under multiple thermal and life-cycle conditions. Each module was independently evaluated before and after the application of D1/D2 adaptive corrections to quantify improvements in prediction stability, accuracy, and generalization. The resulting performance metrics demonstrated a notable enhancement in grading consistency, confirming the robustness of the proposed integration framework. A summary of these comparative results is presented in Table 8.
As shown in Table 8, the application of D1 and D2 correction models reduced prediction variance by more than 35% and improved both cross-temperature accuracy and life-history consistency by over 10%. These results confirm that adaptive correction effectively mitigates environmental and operational bias, reinforcing the robustness, reproducibility, and industrial applicability of the proposed AI-assisted battery grading framework.
To quantitatively assess robustness under heterogeneous environments, three metrics were defined: (i) Cross-Temperature Accuracy (CTA), the mean accuracy across 10 °C, 25 °C, and 45 °C conditions; (ii) Aging-Range Consistency (ARC), quantified as the inverse of prediction variance across <300, 300–800, and >800 cycle regions; and (iii) DCIR Stability Index (DSI), the normalized standard deviation of resistance values across temperature ranges. With adaptive correction, CTA increased from 81.4% to 93.2%, ARC improved from 78.5% to 91.7%, and DSI decreased from 0.42 mΩ to 0.27 mΩ, demonstrating statistically meaningful stability gains across thermal and life-cycle domains. The integrated D1/D2–DNN pipeline substantially enhances classification reliability by ensuring consistent, context-aware grading performance under real-world variability. This confirms the applicability of the proposed system for industrial second-life battery evaluation and automated repurposing workflows.

6. Results and Discussion

The performance of the proposed Deep Learning–Based Battery Grading System (DL-BGS) was rigorously evaluated and benchmarked against a conventional rule-based grading approach. Comparative analysis was performed across five primary dimensions: (i) classification accuracy, (ii) computational efficiency, (iii) operational robustness, (iv) visualization effectiveness, and (v) early anomaly-detection capability. Across diverse thermal and aging scenarios, the hybrid D1/D2-enhanced DNN consistently outperformed the deterministic baseline. Notably, Cross-Temperature Accuracy (CTA) increased by +11.8%, Aging-Range Consistency (ARC) improved by +13.2%, and the DCIR Stability Index (DSI) decreased by 35.7%. These improvements confirm that the combined correction-plus-DNN architecture effectively suppresses environmental and operational bias, maintaining stable classification behavior even under non-ideal, field-representative conditions. Overall, the results demonstrate that DL-BGS substantially enhances grading accuracy, reliability, and decision fidelity relative to rule-based methods, thereby strengthening its suitability for industrial second-life battery evaluation and automated repurposing workflows.

6.1. Overall Grading Accuracy and Efficiency

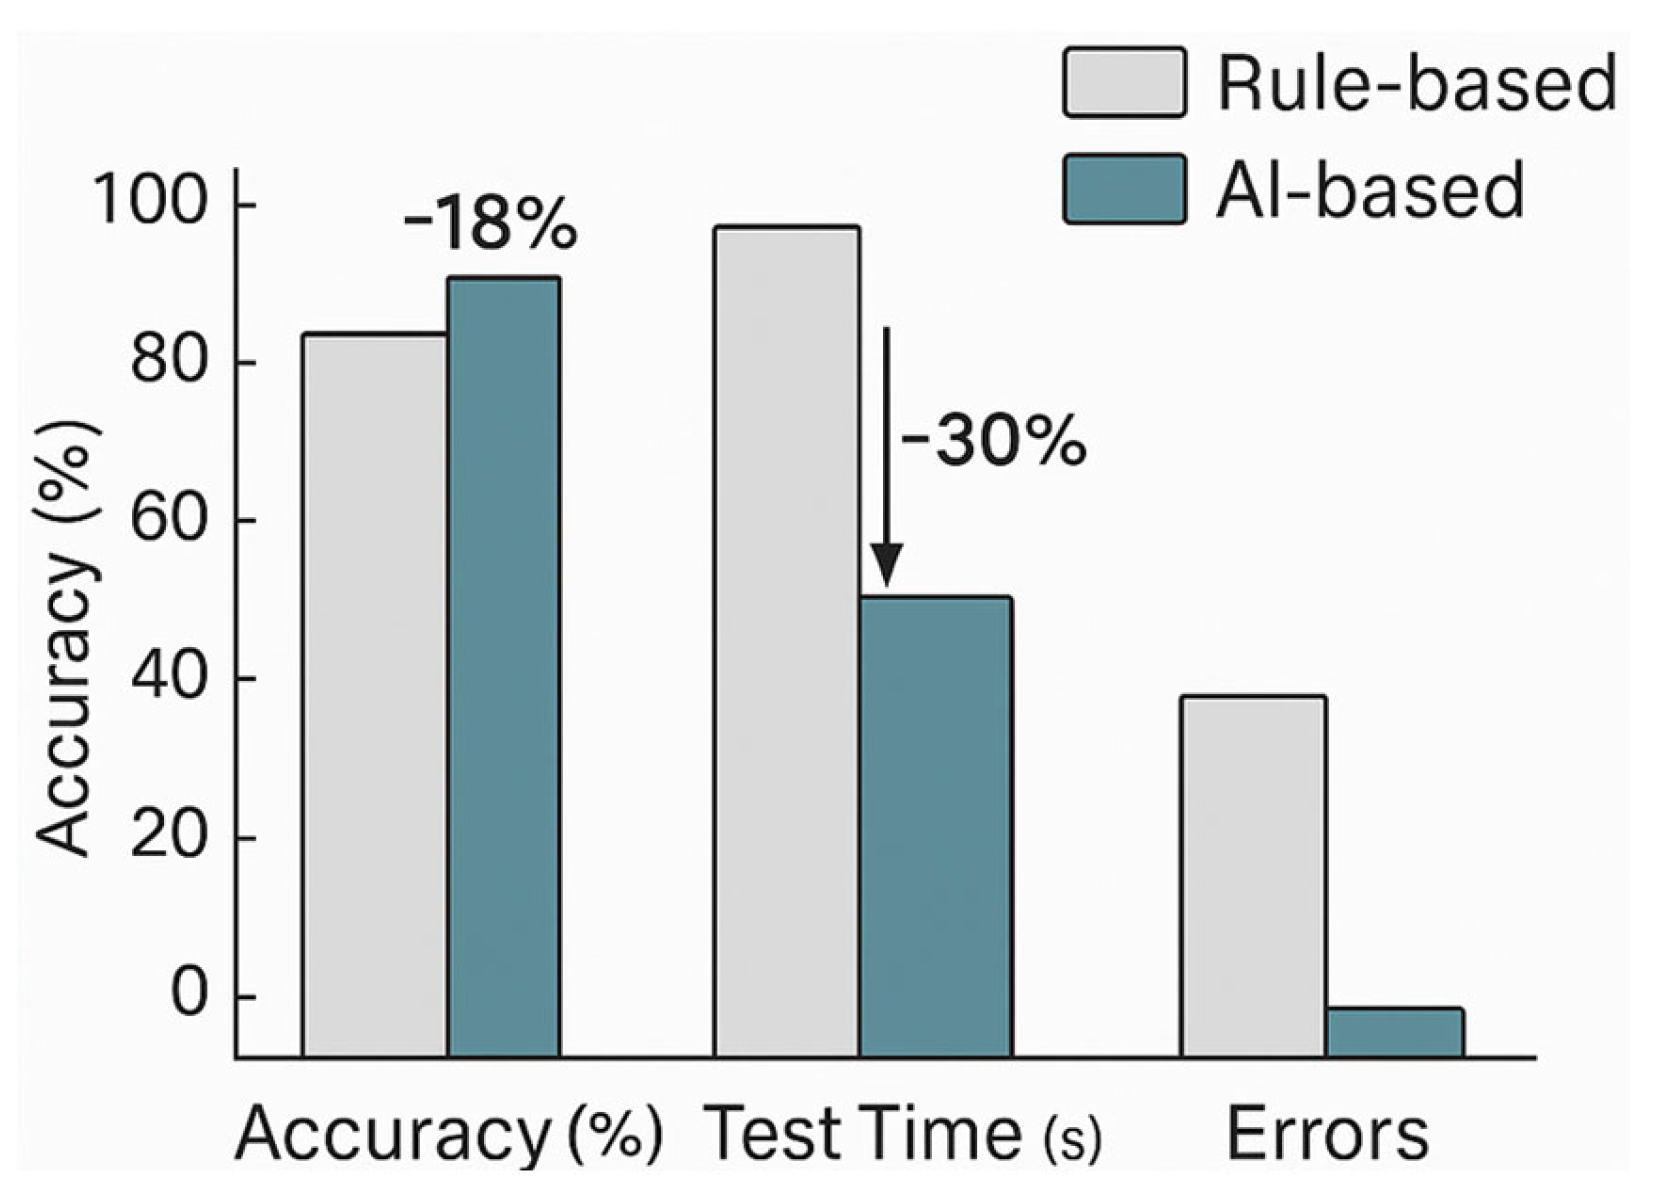
A total of 450 EV-grade 2P6S battery modules were evaluated, each classified into Grades A, B, or C using experimentally measured datasets. The comparative results between the conventional rule-based method and the proposed AI-based system are summarized in Table 9. To ensure a rigorous and fair baseline, all threshold settings and decision-flow priorities used in the rule-based method were explicitly disclosed, reflecting standard industrial battery remanufacturing practices. Although conventional threshold logic provides transparency and conservative decision-making, it lacks the adaptability required to accommodate variations in temperature, aging state, and usage history. In contrast, the proposed learning-based classifier effectively models nonlinear interactions across diagnostic features, yielding superior grading accuracy and environmental robustness. When integrated with the aging-aware correction modules (D1/D2), the system achieved significant gains in cross-scenario stability. Specifically, cross-temperature accuracy improved by +11.8%, life-history consistency by +13.2%, and DCIR variance decreased by 35.7% (Table 8), indicating enhanced resilience to environmental and degradation-driven variability.
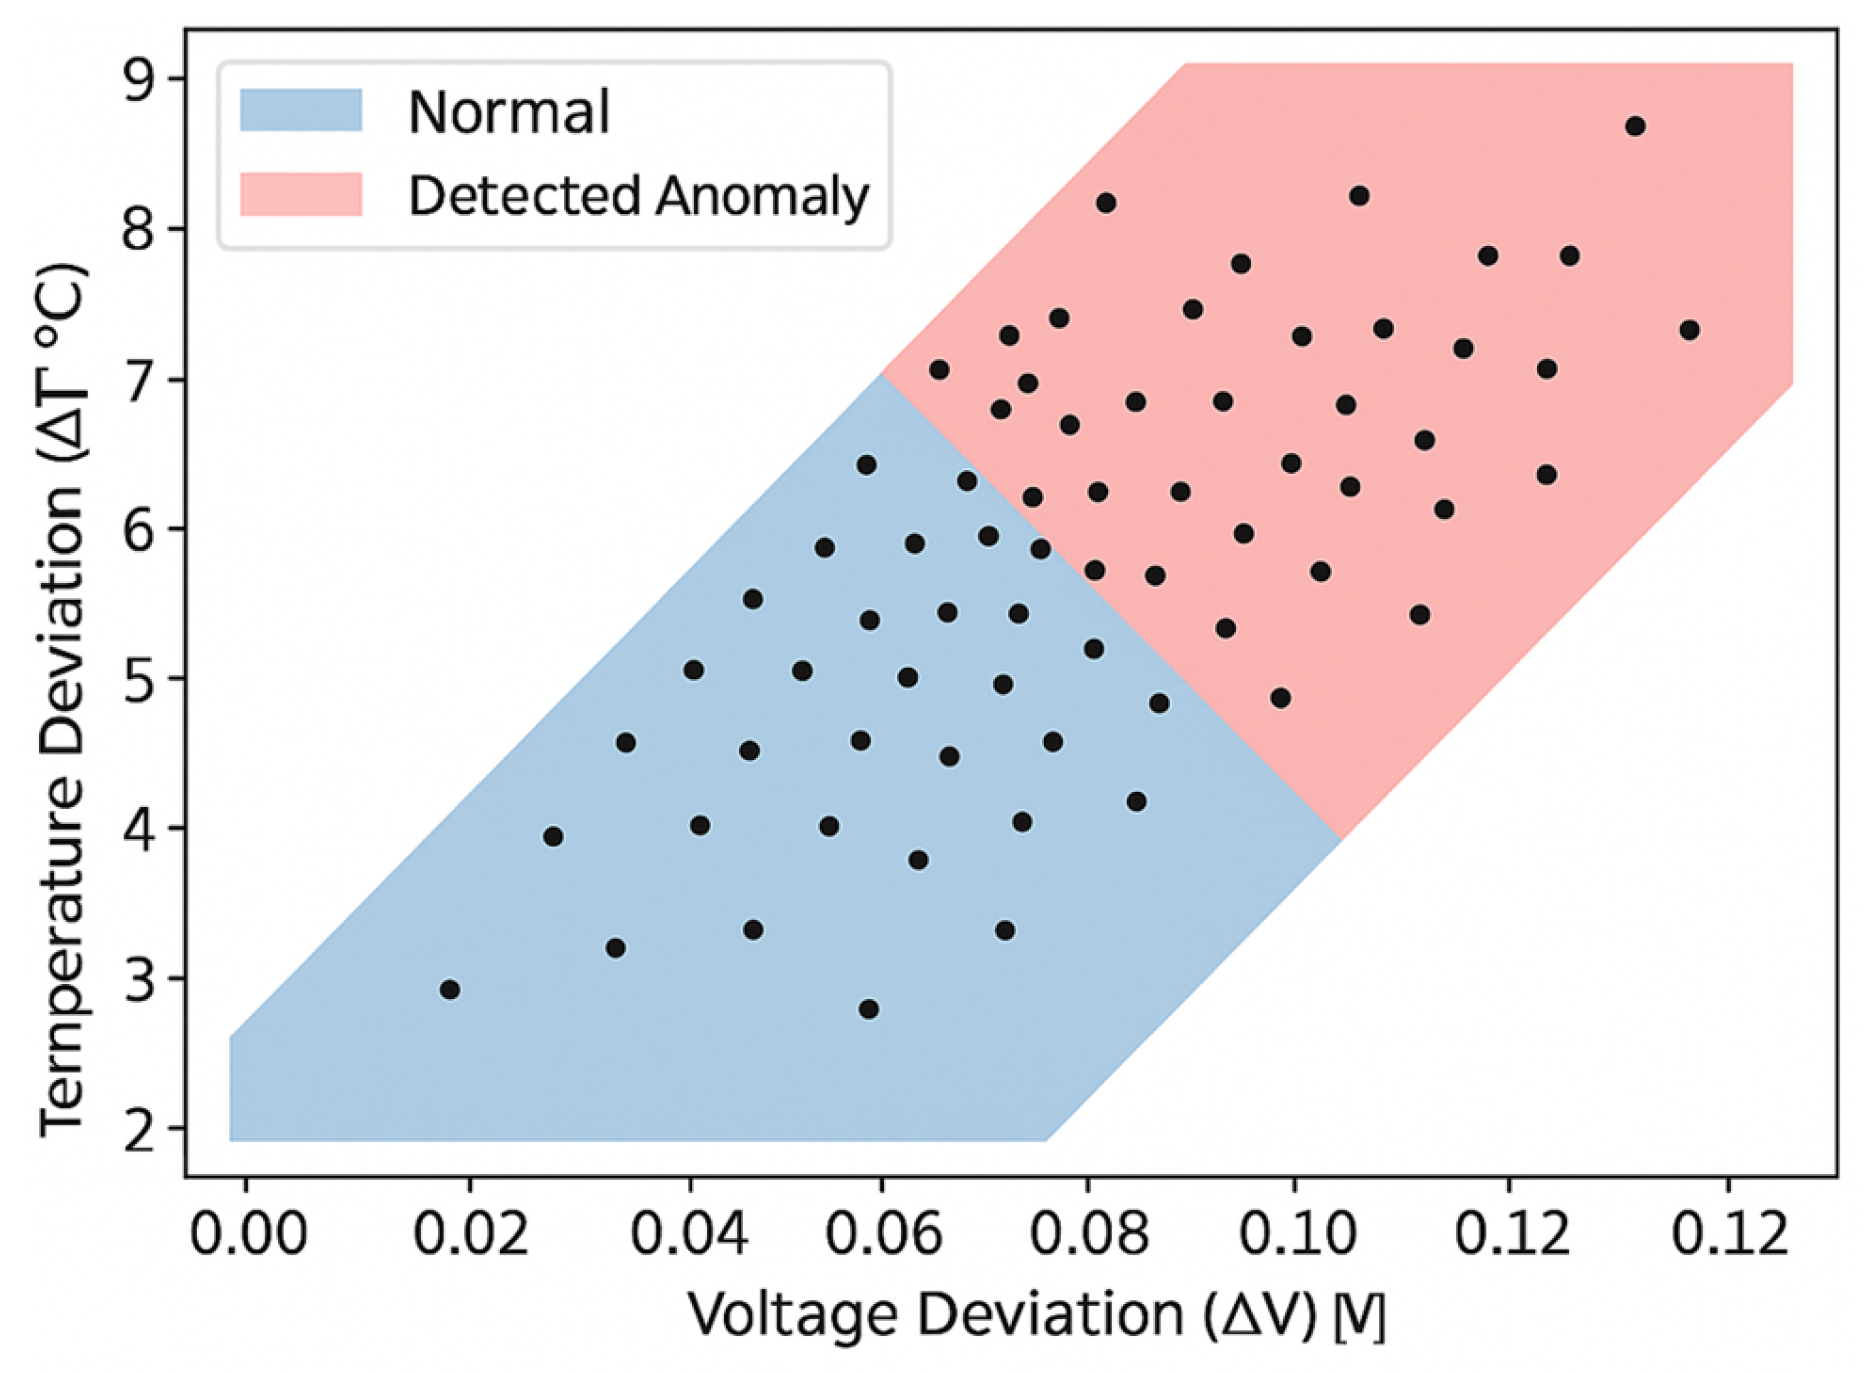
Through automation of both diagnostic and decision workflows, total evaluation time was reduced by approximately 30%, while grading accuracy improved by 18%. These improvements are primarily enabled by a real-time GUI monitoring interface and an automated verification routine, which collectively reduce human-induced variability and decision latency. A 28.3% enhancement in early anomaly detection demonstrates the system’s capability to identify incipient degradation phenomena before threshold violations occur. Key discriminative patterns include: (i) accelerated DCIR rise during initial pulse events, (ii) abnormal temperature-rate trends (dT/dt > 1.2 °C/min) even when absolute temperature remains within nominal safety limits, (iii) nonlinear voltage divergence across parallel cell strings under identical current load.
These signatures are indicative of electrochemical instability and internal impedance growth—conditions typically overlooked by deterministic rule-based screening until later life stages. The DNN, augmented by the adaptive correction layer, amplifies micro-scale transient signals and subtle variance patterns to deliver high-confidence predictive anomaly scoring. Importantly, early warnings were issued without false shutdowns, confirming strong practical deployability and superior fault-anticipation capability compared with static rule frameworks.

6.2. Statistical Significance Analysis

To verify whether the observed improvements were statistically significant, a two-sample t-test was conducted to compare the mean accuracy values of the rule-based and AI-based approaches. The null hypothesis H 0 was defined as no difference exists between the two mean accuracies. The test statistic is expressed as:
t = X ¯ 1 X ¯ 2 S p 2 ( 1 n 1 + 1 n 2 ) ,   S p 2 = n 1 1 S 1 2 + ( n 2 1 ) S 2 2 n 1 + n 2 2
The analysis yielded a p-value < 0.01, thus rejecting the null hypothesis at the 99% confidence level. Hence, the performance improvement achieved by the proposed AI-based system is statistically significant.

6.3. Visualization and Operator Awareness

Figure 12 presents an example of the GUI used for real-time display of voltage-temperature heatmaps and classification outputs. The color-coded visualization provides intuitive recognition of cell-level non-uniformity, enabling operators to immediately identify abnormal cells during testing.
The color-coded heatmap enables intuitive detection of spatial non-uniformity across cells, enhancing operator situational awareness. The incorporation of real-time diagnostic feedback contributed to an 81.9% reduction in operator-induced errors. In addition, when the model’s softmax confidence falls below 0.60, an automatic alert triggers human-in-the-loop inspection to ensure traceability and operational safety. To statistically verify the robustness of performance gains, a two-sample t-test comparing classification accuracy again confirmed significance (p < 0.001, 99.9% confidence), supporting the ≈18% accuracy improvement. Furthermore, due to mild deviations from normality in runtime distributions, a Mann–Whitney U-test was applied to processing-time metrics, yielding p < 0.01, which validates the ≈30% reduction in average testing duration. Collectively, these results demonstrate that the improvements in accuracy, efficiency, and operator reliability are systematic, statistically significant, and consistently reproducible across evaluation trials.

6.4. Uniformity-Based Early Anomaly Detection

Temperature deviation (ΔT) and voltage deviation (ΔV) among cells serve as early indicators of thermal imbalance or incipient short-circuit defects [40]. In the proposed system, an automatic anomaly flag is triggered when ΔT > 8 °C or ΔV > 0.1 V. Experimental results show that the system detected thermal anomalies approximately 28% faster than the rule-based baseline. The anomaly decision boundary in the ΔT–ΔV feature space is defined as:
f Δ T , Δ V = 0.1 Δ T + 0.85 Δ V 0.09 = 0
As shown in Figure 13, each black dot represents an individual measurement sample plotted within the ΔV–ΔT feature space, enabling visualization of normal and anomalous regions.

6.5. SHAP-Based Model Interpretation

For interpretability analysis, SHAP was employed to quantify each feature’s contribution to the final DNN output [53]. The mean feature contributions followed the order SOH (0.46) > DCIR (0.31) > ΔT (0.14) > ΔV (0.09), confirming that SOH and DCIR collectively account for ≈77% of the total decision influence. This indicates that the model effectively captured physically meaningful degradation mechanisms, thereby reinforcing transparency and trust in the AI-driven grading process. As shown in Figure 14, the SHAP value distribution confirms that SOH and DCIR have the strongest impact on model decisions, followed by voltage deviation and temperature deviation.

6.6. Limitations and Future Work

Despite effectively capturing aging behavior using SOH/DCIR proxies and adaptive correction layers, the current framework does not explicitly model microscopic electrochemical degradation mechanisms (e.g., SEI layer growth, lithium plating, and phase transformation phenomena). Future research will investigate physics-informed and hybrid electrochemical–thermal–AI architectures, such as embedding electrochemical state variables as latent representations or incorporating physics-informed neural network (PINN) constraints, to improve interpretability and extrapolation capability across diverse operational regimes.
Although the system demonstrated high accuracy on NCM-based EV modules, its predictive capacity remains influenced by the statistical characteristics of the training dataset. Battery chemistries such as LFP, LTO, and NCA exhibit distinct voltage profiles, impedance-evolution pathways, and thermal behavior, which can alter feature distributions and challenge direct transferability. While the hardware platform can be adapted to multiple chemistries by adjusting voltage windows, safety limits, and pulse-current protocols, the DNN component will require dataset-specific retraining or transfer learning to maintain grading performance across heterogeneous chemistries.
Moreover, module formats not examined in this study—such as pouch-based ESS modules, cylindrical 1P strings, or high-series automotive packs—may introduce different thermal gradients, balancing dynamics, and packaging-induced stress patterns. Therefore, although the system is architected to support chemistry- and topology-agnostic deployment, its current optimal applicability lies in EV-type NCM modules. Extension to broader battery classes will necessitate expanded datasets, domain-adaptive calibration strategies, and cross-platform benchmarking.

7. Conclusions

This study introduced an AI-assisted smart grading platform for EOL EV batteries, integrating automated hardware diagnostics with deep learning-based decision intelligence. The proposed framework enables real-time, data-centric evaluation by jointly analyzing SOH, DCIR, and cell uniformity indicators within a unified test architecture. An STM32-based main controller, bidirectional charger/discharger, CAN-enabled BMS, and GUI-based HMI collectively establish a synchronized hardware–software stack capable of high-fidelity data acquisition, pulse-based characterization, and adaptive protection control. This integration delivers stable, repeatable, and fully automated test execution. On the algorithmic side, a DNN utilizing four normalized diagnostic features—SOH, DCIR variation, thermal deviation, and voltage deviation—classified batteries into reuse (A), repurpose (B), and recycle (C) categories. Experimental results demonstrated that the proposed model improved grading accuracy by ~18% and reduced test time by ~30% relative to industry-standard rule-based screening. SHAP-based interpretability analyses confirmed that SOH and DCIR dominate grading decisions, while cell uniformity metrics provide secondary yet meaningful contributions to safety screening. Although the model does not explicitly simulate electrochemical aging kinetics, the incorporation of aging-salient indicators and adaptive corrections enabled robust, generalizable decision-making across diverse thermal and life-history conditions, as validated by stratified improvements in Table 8.
This study advances AI-based second-life battery evaluation through four core contributions. First, we establish a unified hardware–AI architecture that integrates pulse-based diagnostic measurements with physics-guided adaptive correction and an explainable deep neural network (DNN) grading engine. Second, we demonstrate field-validated robustness by evaluating the system on retired EV modules exhibiting real-world aging signatures and measurement noise. Third, we provide hierarchical interpretability through SHAP-based attribution analysis, confirming that the learned feature interactions align with established electrochemical degradation mechanisms. Fourth, we embed anomaly-detection and multi-layer safety logic consistent with industrial battery-protection practices, ensuring safe deployment in practical remanufacturing environments. Collectively, these advances bridge laboratory-scale AI research and deployable end-of-life (EOL) battery-grading infrastructure.
In addition, the adaptive correction mechanisms further reduced misclassification in heterogeneous cell groups by dynamically compensating for temperature conditions and aging history, thereby strengthening anomaly detection and classification reliability. Overall, the results demonstrate that coupling precision diagnostics with AI intelligence enables scalable, safe, and data-driven battery repurposing and recycling, ultimately contributing to sustainable energy-system development.
Despite these advances, several technical and operational challenges remain. Future research will explore generalization across multiple chemistries, including NCM, LFP, and emerging cobalt-free systems; domain-adaptive calibration for diverse module geometries and thermal-management architectures; long-term model-drift mitigation through periodic calibration and confidence-gated inference; secure edge-level deployment with robust cybersecurity for CAN-layer data pipelines; cross-site industrial benchmarking to ensure grading consistency; and the development of standardized datasets and certification protocols for AI-assisted battery inspection. Addressing these challenges will enable the proposed framework to evolve into a standardized, globally interoperable platform for safe, efficient, and scalable circular-battery management.

Author Contributions

Conceptualization, S.C. and H.K.; methodology, S.C.; software, S.C.; validation, S.C. and H.K.; formal analysis, S.C.; investigation, H.K.; resources, S.C.; data curation, H.K.; writing—original draft preparation, S.C.; writing—review and editing, S.C.; visualization, H.K.; supervision, S.C.; project administration, H.K.; funding acquisition, H.K. All authors have read and agreed to the published version of the manuscript.

Funding

This work was supported by the Technology Innovation Program (or Industrial Strategic Technology Development Program-Excellent corporate research institute development project (ATC+) (2023483, The smart charger/discharger for the wasted battery reuse) funded By the Ministry of Trade Industry & Energy (MOTIE, Republic of Korea).

Data Availability Statement

Data recorded in the current study are available in all tables and figures of the manuscript.

Conflicts of Interest

Author Hiedo Kim was employed by the company SUNGSAM Co., Ltd. The remaining authors declare that the research was conducted in the absence of any commercial or financial relationships that could be construed as a potential conflict of interest.

References

  1. International Energy Agency. Securing Supplies for an Electric Future; International Energy Agency: Paris, France, 2022. [Google Scholar]
  2. Zubi, G.; Dufo-López, R.; Carvalho, M.; Pasaoglu, G. The lithium-ion battery: State of the art and future perspectives. Renew. Sustain. Energy Rev. 2018, 89, 292–308. [Google Scholar] [CrossRef]
  3. Harper, G.; Sommerville, R.; Kendrick, E.; Driscoll, L.; Slater, P.; Stolkin, R.; Walton, A.; Christensen, P.; Heidrich, O.; Lambert, S.; et al. Recycling lithium-ion batteries from electric vehicles. Nature 2019, 575, 75–86. [Google Scholar] [CrossRef]
  4. Balasingam, B.; Ahmed, M.; Pattipati, K. Battery management systems—Challenges and some solutions. Energies 2020, 13, 2825. [Google Scholar] [CrossRef]
  5. Liu, K.; Li, K.; Peng, Q.; Zhang, C. A brief review on key technologies in the battery management system of electric vehicles. Front. Mech. Eng. 2019, 14, 47–64. [Google Scholar] [CrossRef]
  6. Zhao, H.; Chen, Z.; Shu, X.; Shen, J.; Lei, Z.; Zhang, Y. State of health estimation for lithium-ion batteries based on hybrid attention and deep learning. Reliab. Eng. Syst. Saf. 2023, 232, 109066. [Google Scholar] [CrossRef]
  7. Renold, A.P.; Kathayat, N.S. Comprehensive review of machine learning, deep learning, and digital twin data-driven approaches in battery health prediction of electric vehicles. IEEE Access 2024, 12, 43984–43999. [Google Scholar] [CrossRef]
  8. Buchanan, W.J. Some Studies on CAN Specification. In Fieldbus Technology: Industrial Network Standards for Real-Time Distributed Control; Springer: Berlin/Heidelberg, Germany, 2003; pp. 519–529. [Google Scholar] [CrossRef]
  9. Wu, H.; Yan, Y.; Chen, B.; Hou, F.; Sun, D. FADA: A cloud-fog-edge architecture and ontology for data acquisition. IEEE Trans. Cloud Comput. 2020, 10, 1792–1805. [Google Scholar] [CrossRef]
  10. Monteiro, V.; Afonso, J.A.; Afonso, J.L. Bidirectional power converters for ev battery chargers. Energies 2023, 16, 1694. [Google Scholar] [CrossRef]
  11. Youssfi, A.; El Kadi, Y.Y. A New Advanced Strategy for Controlling the Charging and Discharging of a Storage Unit in a Microgrid Using a Finite Control Set Predictive Model. Sol. Energy Sustain. Dev. J. 2024, 14, 38–52. [Google Scholar] [CrossRef]
  12. Ma, X.; Wu, D.; Rebich, R. Optimizing Grid-interactive Efficient Building Designs with Stacked Value Streams. In Proceedings of the 2024 IEEE Power & Energy Society General Meeting (PESGM), Seattle, WA, USA, 21–25 July 2024; IEEE: New York, NY, USA, 2024; pp. 1–5. [Google Scholar] [CrossRef]
  13. Li, Y.; Huang, X.; Meng, J.; Shi, K.; Teodorescu, R.; Stroe, D.I. State of Health Estimation for Lithium-Ion Battery Based on Sample Transfer Learning under Current Pulse Test. Batteries 2024, 10, 156. [Google Scholar] [CrossRef]
  14. Dubarry, M.; Yasir, F. Big data for the diagnosis and prognosis of deployed energy storage systems. In Proceedings of the 2024 IEEE Electrical Energy Storage Application and Technologies Conference (EESAT), San Diego, CA, USA, 29–30 January 2024; IEEE: New York, NY, USA, 2024; pp. 1–5. [Google Scholar] [CrossRef]
  15. Liu, W.; Gao, S.; Yan, W. Comparison-transfer learning based state-of-health estimation for lithium-ion battery. J. Electrochem. Energy Convers. Storage 2024, 21, 041013. [Google Scholar] [CrossRef]
  16. Guzek, M.; Jackowski, J.; Jurecki, R.S.; Szumska, E.M.; Zdanowicz, P.; Żmuda, M. Electric vehicles—An overview of current issues—Part 2—Infrastructure and road safety. Energies 2024, 17, 495. [Google Scholar] [CrossRef]
  17. Teliz, E.; López-Vázquez, C.; Díaz, V. Degradation study for 18650 NMC batteries at low temperature. Electrochim. Acta 2024, 475, 143540. [Google Scholar] [CrossRef]
  18. International Electrotechnical Commission. International Standard Norme Internationale; IEC Edition; International Electrotechnical Commission: Geneva, Switzerland, 2015; Volume 3. [Google Scholar]
  19. Bais, L.R.; Singh, S.K.; Dubey, A. Novel Techniques of High Voltage Detection and its Application for Enhancing Safety in Extra High Voltage System Operation and Maintenance. In Proceedings of the 2024 23rd National Power Systems Conference (NPSC), Indore, India, 14–16 December 2024; IEEE: New York, NY, USA, 2024; pp. 1–5. [Google Scholar] [CrossRef]
  20. Che, Y.; Zheng, Y.; Forest, F.E.; Sui, X.; Hu, X.; Teodorescu, R. Predictive health assessment for lithium-ion batteries with probabilistic degradation prediction and accelerating aging detection. Reliab. Eng. Syst. Saf. 2024, 241, 109603. [Google Scholar] [CrossRef]
  21. de França, A.A.; Villanueva, J.M.M.; de Macêdo, E.C.T. Cloud Battery Management System Development. In Proceedings of the 2024 8th International Symposium on Instrumentation Systems, Circuits and Transducers (INSCIT), Joao Pessoa, Brazil, 2–6 September 2024; IEEE: New York, NY, USA, 2024; pp. 1–6. [Google Scholar] [CrossRef]
  22. Zhang, K.; Xiong, R.; Qu, S.; Zhang, B.; Shen, W. Electrochemical impedance spectroscopy: A novel high-power measurement technique for onboard batteries using full-bridge conversion. IEEE Trans. Transp. Electrif. 2024, 10, 10073–10082. [Google Scholar] [CrossRef]
  23. Pavković, D.; Kvaternik, K.; Cipek, M.; Krznar, M. State-of-charge estimator design and experimental verification for a lithium-titanate battery cell. Clean Technol. Environ. Policy 2025, 27, 1599–1615. [Google Scholar] [CrossRef]
  24. Pradeep, K.; Amaragatti, A.V.; Yugendra, G.L.; Manohar, P.; Kulkarni, S.V.; Ramanujan, K.S. Real Time Battery Monitoring and Protection System with CAN Bus Communication and Data Logging. In Proceedings of the 2024 IEEE 4th International Conference on Sustainable Energy and Future Electric Transportation (SEFET), yderabad, India, 31 July–3 August 2024; IEEE: New York, NY, USA, 2024; pp. 1–6. [Google Scholar] [CrossRef]
  25. Samanta, A.; Sharma, M.; Locke, W.; Williamson, S. Cloud-Enhanced Battery Management System Architecture for Real-Time Data Visualization, Decision Making, and Long-Term Storage. IEEE J. Emerg. Sel. Top. Ind. Electronics 2025, 6, 1700–1711. [Google Scholar] [CrossRef]
  26. Khaleghi, S.; Hosen, M.S.; Karimi, D.; Behi, H.; Beheshti, S.H.; Van Mierlo, J.; Berecibar, M. Developing an online data-driven approach for prognostics and health management of lithium-ion batteries. Appl. Energy 2022, 308, 118348. [Google Scholar] [CrossRef]
  27. Devi, B.; Kumar, V.S.; Karthick, T.; Balasundar, C. Deep learning based IoT and cloud-integrated state of charge estimation for battery powered electric vehicles. J. Energy Storage 2024, 100, 113622. [Google Scholar] [CrossRef]
  28. Zhang, X.; Beram, S.M.; Haq, M.A.; Wawale, S.G.; Buttar, A.M. Research on algorithms for control design of human–machine interface system using ML. Int. J. Syst. Assur. Eng. Manag. 2022, 13 (Suppl. S1), 462–469. [Google Scholar] [CrossRef]
  29. Verani, A.; Di Rienzo, R.; Nicodemo, N.; Baronti, F.; Roncella, R.; Saletti, R. Modular battery emulator for development and functional testing of battery management systems: Hardware design and characterization. Electronics 2023, 12, 1232. [Google Scholar] [CrossRef]
  30. Nováková, K.; Pražanová, A.; Stroe, D.I.; Knap, V. Second-life of lithium-ion batteries from electric vehicles: Concept, aging, testing, and applications. Energies 2023, 16, 2345. [Google Scholar] [CrossRef]
  31. Sarrafan, K.; Sutanto, D.; Muttaqi, K.M. An electric circuit based EV battery model for runtime prediction and state of charge tracking. In Proceedings of the 2017 IEEE Transportation Electrification Conference (ITEC-India), Pune, India, 13–15 December 2017; IEEE: New York, NY, USA, 2017; pp. 1–6. [Google Scholar] [CrossRef]
  32. Gawde, S.; Patil, S.; Kumar, S.; Kotecha, K. A scoping review on multi-fault diagnosis of industrial rotating machines using multi-sensor data fusion. Artif. Intell. Rev. 2023, 56, 4711–4764. [Google Scholar] [CrossRef]
  33. Conard, J.W. Services and protocols of the data link layer. Proc. IEEE 2005, 71, 1378–1383. [Google Scholar] [CrossRef]
  34. Bosch, R.G. CAN specification version 2.0: Robert Bosch GmbH. In Systems und Products for Car Manufacturer; Rheinmetall AG: Düsseldorf, Germany, 1991. [Google Scholar]
  35. Corrigan, S. Introduction to the Controller Area Network (CAN); Application Report SLOA101; Texas Instruments: Dallas, TX, USA, 2002; pp. 1–17. [Google Scholar]
  36. Shah, M.B.N.; Husain, A.R.; Aysan, H.; Punnekkat, S.; Dobrin, R.; Bender, F.A. Error handling algorithm and probabilistic analysis under fault for CAN-based steer-by-wire system. IEEE Trans. Ind. Inform. 2016, 12, 1017–1034. [Google Scholar] [CrossRef]
  37. Maletić, F.; Deur, J.; Erceg, I. A multitimescale kalman filter-based estimator of li-ion battery parameters including adaptive coupling of state-of-charge and capacity estimation. IEEE Trans. Control Syst. Technol. 2022, 31, 692–706. [Google Scholar] [CrossRef]
  38. Berecibar, M.; Gandiaga, I.; Villarreal, I.; Omar, N.; Van Mierlo, J.; Van den Bossche, P. Critical review of state of health estimation methods of Li-ion batteries for real applications. Renew. Sustain. Energy Rev. 2016, 56, 572–587. [Google Scholar] [CrossRef]
  39. Bao, Y.; Dong, W.; Wang, D. Online internal resistance measurement application in lithium ion battery capacity and state of charge estimation. Energies 2018, 11, 1073. [Google Scholar] [CrossRef]
  40. Madani, S.S.; Shabeer, Y.; Fowler, M.; Panchal, S.; Chaoui, H.; Mekhilef, S.; Dou, S.X.; See, K. Artificial Intelligence and Digital Twin Technologies for Intelligent Lithium-Ion Battery Management Systems: A Comprehensive Review of State Estimation, Lifecycle Optimization, and Cloud-Edge Integration. Batteries 2025, 11, 298. [Google Scholar] [CrossRef]
  41. Long, B.; Gao, X.; Li, P.; Liu, Z. Multi-parameter optimization method for remaining useful life prediction of lithium-ion batteries. IEEE Access 2020, 8, 142557–142570. [Google Scholar] [CrossRef]
  42. Remmlinger, J.; Buchholz, M.; Meiler, M.; Bernreuter, P.; Dietmayer, K. State-of-health monitoring of lithium-ion batteries in electric vehicles by on-board internal resistance estimation. J. Power Sources 2011, 196, 5357–5363. [Google Scholar] [CrossRef]
  43. Kim, J.H.; Lee, S.J.; Lee, J.M.; Cho, B.H. A new direct current internal resistance and state of charge relationship for the Li-ion battery pulse power estimation. In Proceedings of the 2007 7th Internatonal Conference on Power Electronics, Daegu, Republic of Korea, 22–26 October 2007; IEEE: New York, NY, USA, 2007; pp. 11173–11178. [Google Scholar] [CrossRef]
  44. Liu, X.; Ai, W.; Marlow, M.N.; Patel, Y.; Wu, B. The effect of cell-to-cell variations and thermal gradients on the performance and degradation of lithium-ion battery packs. Appl. Energy 2019, 248, 489–499. [Google Scholar] [CrossRef]
  45. Zhang, X.; Gong, A.; He, W.; Cao, Y.; He, H. A lithium battery health evaluation method based on considering disturbance belief rule base. Batteries 2024, 10, 129. [Google Scholar] [CrossRef]
  46. Ma, X.; Ding, X.; Tian, C.; Tian, C.; Zhu, R. Estimation of Lithium-Ion Battery State of Health-Based Multi-Feature Analysis and Convolutional Neural Network–Long Short-Term Memory. Sustainability 2025, 17, 4014. [Google Scholar] [CrossRef]
  47. Oh, S.; Kim, J.; Moon, I. Hybrid data-driven deep learning model for state of charge estimation of Li-ion battery in an electric vehicle. J. Energy Storage 2024, 97, 112887. [Google Scholar] [CrossRef]
  48. Chawla, N.V.; Bowyer, K.W.; Hall, L.O.; Kegelmeyer, W.P. SMOTE: Synthetic minority over-sampling technique. J. Artif. Intell. Res. 2002, 16, 321–357. [Google Scholar] [CrossRef]
  49. Etem, T. Interpretable machine learning for battery health insights: A LIME and SHAP-based study on EIS-derived features. Bull. Pol. Acad. Sci. Tech. Sci. 2025, 73, e155033. [Google Scholar] [CrossRef]
  50. Wen, P.; Ye, Z.S.; Li, Y.; Chen, S.; Xie, P.; Zhao, S. Physics-informed neural networks for prognostics and health management of lithium-ion batteries. IEEE Trans. Intell. Veh. 2023, 9, 2276–2289. [Google Scholar] [CrossRef]
  51. Shu, X.; Chen, Z.; Shen, J.; Guo, F.; Zhang, Y.; Liu, Y. State of charge estimation for lithium-ion battery based on hybrid compensation modeling and adaptive H-infinity filter. IEEE Trans. Transp. Electrif. 2022, 9, 945–957. [Google Scholar] [CrossRef]
  52. Lakshmi, V.S.G.; Rani, M.D.; Bhavana, K. AI-Improved Battery-Powered Automobile Battery Diagnostics. In Proceedings of the 2024 7th International Conference on Circuit Power and Computing Technologies (ICCPCT), Kollam, India, 8–9 August 2024; IEEE: New York, NY, USA, 2024; Volume 1, pp. 1500–1505. [Google Scholar] [CrossRef]
  53. Nourani, V.; Dehghan, M.; Baghanam, A.H.; Kantoush, S.A. Dual purpose of Shapley Additive Explanation (SHAP) in model explanation and feature selection for artificial intelligence-based digital twin of wastewater treatment plant. J. Water Process Eng. 2025, 75, 107947. [Google Scholar] [CrossRef]
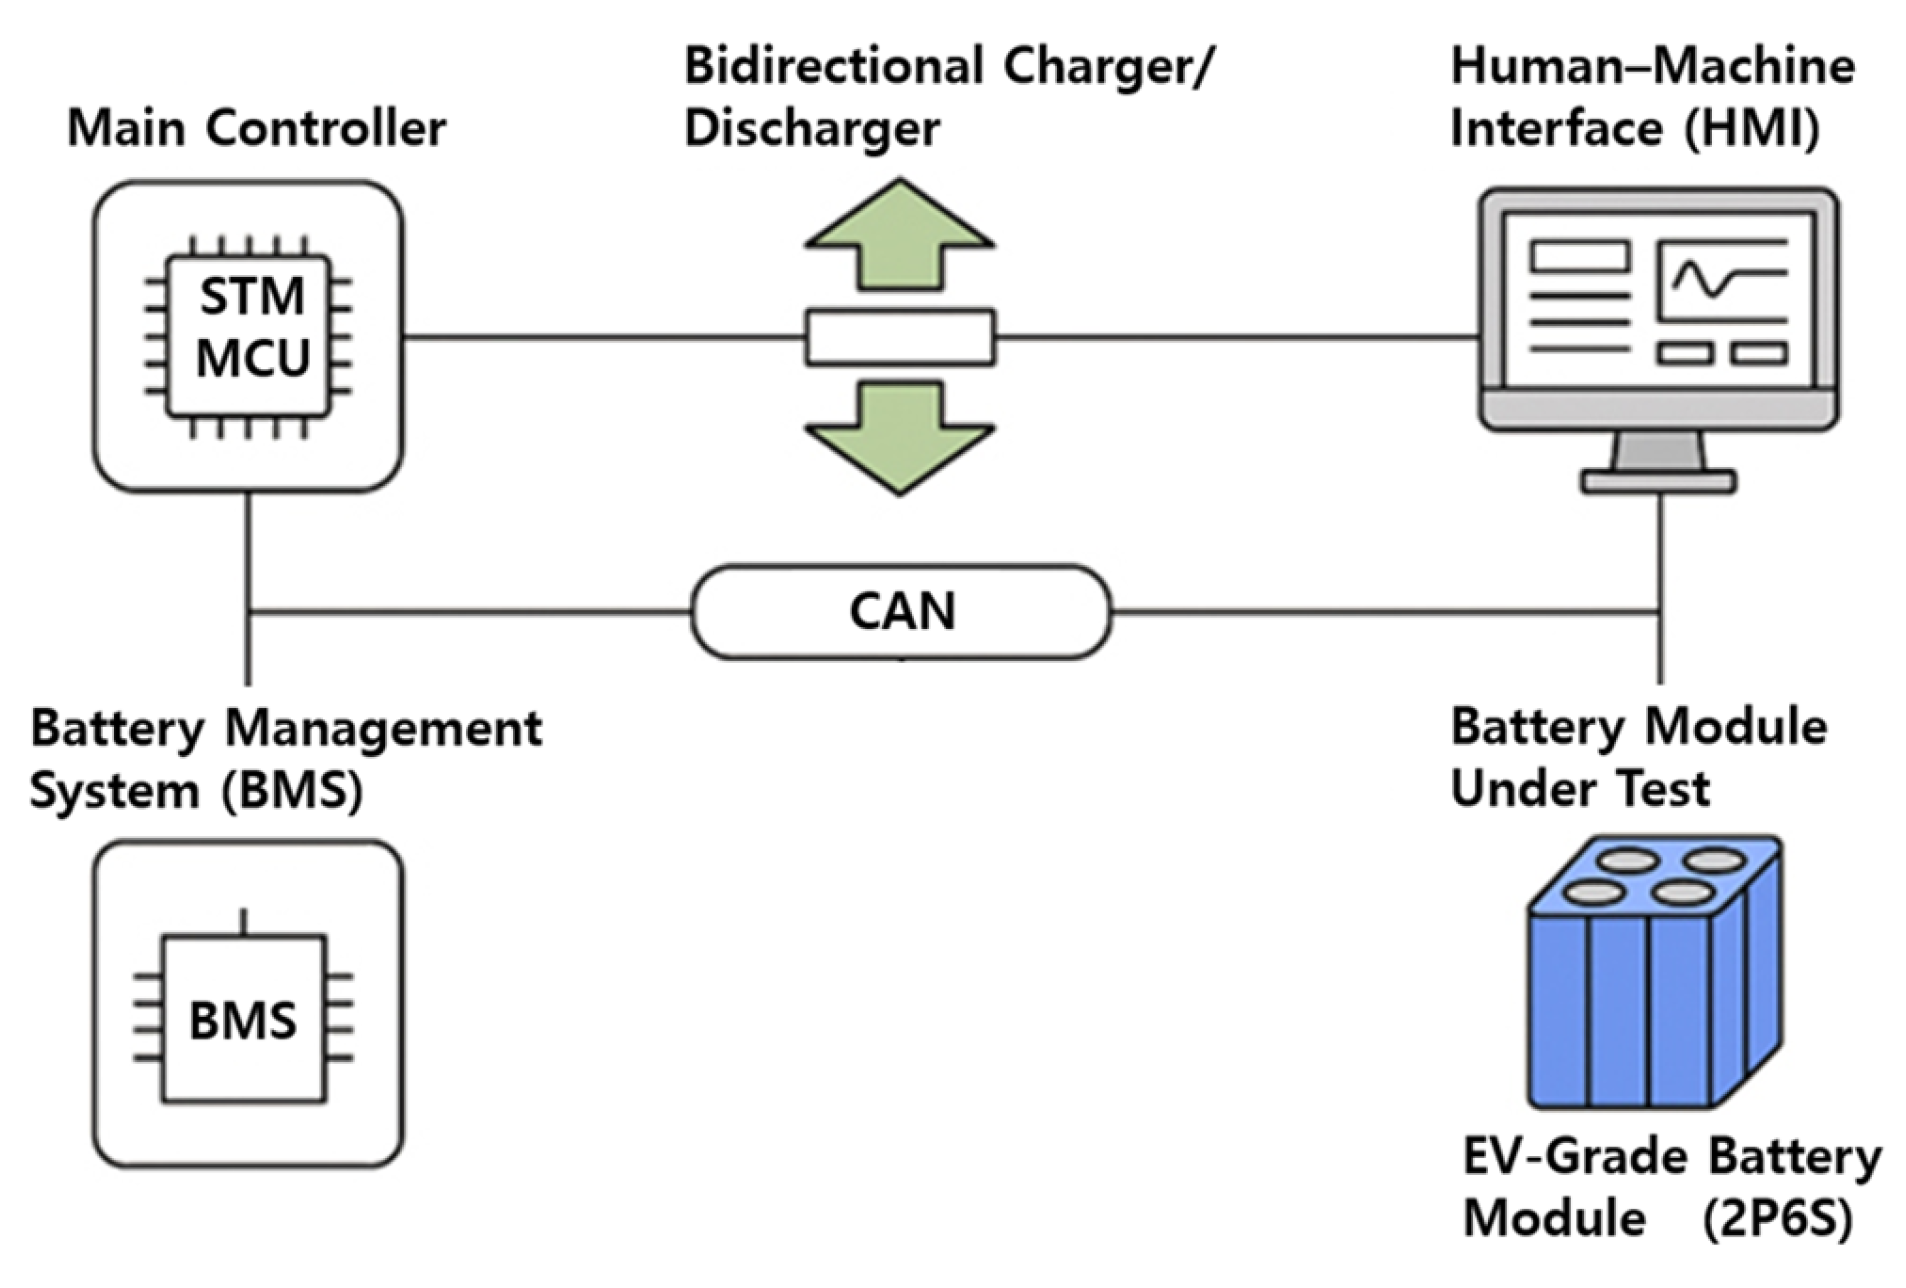
Figure 1. System architecture of the proposed Smart EOL Battery Grading Platform (Green arrows denote bidirectional power flow, black lines represent CAN-based communication links, and blue highlights the EV-grade battery module under test.).
Energies 18 05915 g001
Figure 2. Main Controller Data Flow and Control Structure.
Energies 18 05915 g002
Figure 3. Power Conversion and Energy Regeneration Structure.
Energies 18 05915 g003
Figure 4. Pulse Test Sequence and Voltage Response.
Energies 18 05915 g004
Figure 5. Safety and Protection System Architecture.
Energies 18 05915 g005
Figure 6. BMS Communication and Data Flow.
Energies 18 05915 g006
Figure 7. GUI Layout and Data Visualization Flow.
Energies 18 05915 g007
Figure 8. 2P6S EV Test Battery Module Configuration (Includes cell arrangement, parallel and series connections, NTC sensor positions, CAN communication lines, and insulation protection devices).
Energies 18 05915 g008
Figure 9. CAN-Based Communication and Data Integration Structure.
Energies 18 05915 g009
Figure 10. Deep Learning-Based Battery Grading Model Architecture.
Energies 18 05915 g010
Figure 11. Adaptive Correction Model Integration Structure.
Energies 18 05915 g011
Figure 12. Comparative performance of rule-based and AI-based grading methods in terms of accuracy, test time, and error rate.
Energies 18 05915 g012
Figure 13. 2D Anomaly Boundary Map Based on ΔT and ΔV (Blue region: Normal, Red region: Detected Anomaly).
Energies 18 05915 g013
Figure 14. SHAP Summary Plot of Feature Importance (SOH and DCIR dominate the grading decision space).
Energies 18 05915 g014
Table 1. Compliance with International Safety Standards.
ClassificationStandard No.
IEC 62619:2022Safety requirements for industrial and stationary secondary lithium-ion cells and batteries
UL 1973:2023Safety evaluation for batteries used in stationary and motive applications (energy storage systems)
UL 1973:2023Electrical safety requirements for high-voltage systems in electric vehicles
IEC 61557-8:2019Performance standards for insulation monitoring devices (IMDs) in ungrounded systems
Table 2. Key diagnostic parameters extracted from charge–discharge and pulse tests.
ParameterSymbolDescription
State of Health S O H Ratio of remaining capacity to initial capacity
DC Internal Resistance R D C I R Internal resistance of the cell
Thermal Uniformity Δ T Difference between maximum and minimum cell temperatures
Voltage Uniformity Δ V Deviation in voltage distribution among cells
Table 3. Threshold criteria for DCIR evaluation.
ConditionDCIR (mΩ)Description
Healthy < 3.0 Normal electrochemical response
Moderate Degradation 3.0 5.0 Beginning of electrode resistance increase
Severe Degradation > 5.0 Possible internal damage
Table 4. Threshold-Based Pre-Labels for Initial Training and Validation.
MetricA GradeB GradeC Grade
SOH (%)>9070–90<70
DCIR Δ (%)<5050–100>100
Temp Δ (°C)/Volt Δ (V)<5∕<0.055–10/0.05–0.1>10∕>0.1
Table 5. Optimized Hyperparameters for the DNN Training Process.
ParameterOptimal Value
Batch Size32
Epochs600
Dropout Rate0.3
Validation Split0.2
Early Stopping Patience25 epochs
Table 6. Classification Performance Metrics on the Test Dataset.
MetricValue
Accuracy97.4%
Precision96.8%
Recall95.9%
F1-Score0.96
Table 7. Confusion Matrix Summary for DNN-Based Battery Grading.
Pred APred BPred C
True A14130
True B21294
True C05118
Table 8. Comparative Performance Before and After Adaptive Correction.
MetricBefore CorrectionAfter D1/D2 AppliedImprovement
Cross-Temperature Accuracy (%)81.493.2+11.8
Life-History Consistency (%)78.591.7+13.2
DCIR Stability (Std. Dev.)0.42 mΩ0.27 mΩ−35.7%
Table 9. Performance Comparison Between Rule-Based and Proposed AI System.
MetricRule-Based MethodProposed DNN SystemImprovement
Accuracy (%)79.293.7+18.3%
F1-Score0.780.94+0.16
Average Test Time (min/module)28.519.8−30.5%
Operator Error Rate (%)7.21.3−81.9%
Early Anomaly Detection (%)63.591.8+28.3%
Disclaimer/Publisher’s Note: The statements, opinions and data contained in all publications are solely those of the individual author(s) and contributor(s) and not of MDPI and/or the editor(s). MDPI and/or the editor(s) disclaim responsibility for any injury to people or property resulting from any ideas, methods, instructions or products referred to in the content.