Article

Comprehensive Analysis of De-Icing Technologies for Wind Turbine Blades: Mechanisms, Modeling, and Performance Evaluation

Department of Electrical and Computer Engineering, Memorial University of Newfoundland, St. John’s, Newfoundland & Labrador A1B 3X5, Canada
*
Author to whom correspondence should be addressed.
Energies 2025, 18(20), 5486; https://doi.org/10.3390/en18205486
Submission received: 8 September 2025 / Revised: 11 October 2025 / Accepted: 15 October 2025 / Published: 17 October 2025

Abstract

The accumulation of ice on wind turbine blades presents a significant challenge in cold and high-altitude regions, where it alters the aerodynamic profile of the blades, increases drag, and reduces lift. Icing can reduce annual energy production by 20–40%, with extreme cases causing up to 37.5% generation loss due to earlier stalls and increased aerodynamic resistance. This research goal is to investigate the impact of ice formation on wind turbine performance and to evaluate the effectiveness of various mitigation measures. This study focuses on the Electro-Impulse De-Icing (EIDI) method and an approach to design and simulate it in COMSOL Multiphysics version 6.2, incorporating coupled electromagnetic, structural, and heat transfer physics to capture the generation of the Lorentz force and the resulting blade response. Quantitative analysis demonstrates that EIDI requires approximately 550–1450 kWh of energy per icing season for blades ranging from 30–80 m, which is significantly lower than conventional thermal systems (>8000 kWh) and more reliable against thick glaze ice than ultrasonic methods. The results highlight the potential of EIDI as a localized, energy-efficient solution that minimizes aerodynamic degradation and downtime, thereby offering higher reliability and long-term viability for wind turbines in cold climates.

1. Introduction

Wind energy has garnered significant attention and experienced substantial development in recent years, largely due to the global expansion of new energy power systems. Wind energy is becoming a vital part of the renewable energy mix due to its increasing integration into power infrastructure. By 2030, the European Union is expected to have an estimated total installed wind capacity of 323 GW, delivering around 888 TWh, or over 30% of its entire electricity demand [1]. Similarly, Canada is projected to have approximately 23 GW of cumulative wind capacity by 2035 [2]. As wind energy continues to grow globally, a growing number of wind turbines are being installed to meet the expanding demand [3,4].
The reliable and efficient performance of wind energy systems is compromised by ice buildup on wind turbine blades in cold and high-elevation locations. Ice accumulation on the blades can alter the turbine’s aerodynamic shape, increase resistance, decrease lift power, and often result in reduced power production [5]. It is evident that in severe cases, this can lead to rotor imbalance, wind turbine shutdowns, increased mechanical wear, and potential safety hazards from falling ice. Nowadays, it is essential to address these concerns as wind power usage increases in colder climates to maintain high efficiency, ensure structural safety, and support a consistent, reliable supply of renewable energy during extreme weather conditions [6].
Across the globe, reports indicate that power outages have occurred in extensive areas due to the shutdown of wind turbines caused by icing, leaving tens of thousands or even hundreds of thousands of people without electricity [7,8]. The study examined the failure of 517 wind turbines, collectively having a power capacity of 682 MW, over a period of 29 months, resulting in power losses. Of these losses, 18,966 MWh were attributed to icing, representing 28.86% of the total loss, making it the leading cause. This figure is 1.85 times greater than the 10,267 MWh loss attributed to other interventions. As illustrated in Figure 1, the impact of icing on turbine power generation efficiency is significant [8]. Ice accumulation on wind turbine blades has adverse effects on aerodynamic efficiency, resulting in decreased power generation and increased operational hazards. A review of combined methods for ice detection and mitigation [5] highlights the limitations of existing ice-sensing technologies and the need for dependable, blade-integrated techniques to identify the presence, type, and thickness of ice. This research classified ice detection sensors into three categories based on their reactions to changes in blade mass, signal reflection, and disruptions in the electric field, also noting the promise of optical and capacitive sensors despite certain practical difficulties [5].
A fast computational model based on factors of iced airfoils was examined in [9] to measure wind turbine performance under various icing amounts. The findings show that ice accumulation significantly reduces lift while increasing drag; as a result, it leads to lower efficiency and an increased risk of stalling. To increase energy efficiency in the case of blade icing conditions, some researchers [10] introduced a steam thermal de-icing control system utilizing a backpropagation neural network (BPNN). It can be seen that this system proposes real-time control of inlet air temperature according to environmental factors and blade conditions, thereby improving heating precision and minimizing energy waste. Their BPNN methodology offers improved modeling without relying on intricate aerodynamic formulas, making it adaptable to diverse weather scenarios. On the other hand, a study [11] introduces an advanced device that combines image analysis technology, laser sensors, and acoustic de-icing technology for the real-time monitoring of ice build-up on wind turbine blades, along with de-icing and blade wear forecasting. They combine image recognition and machine learning techniques (including a combination of Logistic Regression, Random Forest, and gradient-boosted decision Trees) to evaluate the severity of ice accumulation and predict blade wear. They proposed that all information be transmitted to cloud platforms for evaluation, offering an effective and automated approach to de-icing in small and medium-sized turbines, as compared to relying on manual techniques. Another study demonstrated [12] a flexible, self-sustaining sensor designed to track icing on wind turbine blades, addressing the drawbacks of indirect detection methods, such as power curve analysis and vibration analysis. It is evident that they utilize the concepts of dielectric shift and complex impedance, and their proposed sensor enables the real-time monitoring of ice thickness, along with wireless data transmission. Their design minimizes aerodynamic disruption, and implementing temperature compensation enhances accuracy and positioning. As a result, it represents a viable solution for enhancing the efficiency of wind turbines in colder climate areas.
The Electro-Impulse De-Icing (EIDI) approach for wind turbine blades offers a quick and efficient solution to ice deposition in colder climates [13]. Technology includes electromagnetic pulse coils attached to the blade, which produce rapid electromagnetic pulses that generate mechanical stresses, forcing the ice to detach quickly. The simulation was conducted using COMSOL Multiphysics version 6.2 to optimize the coil design and settings. In that experiment, the device removed a 10 mm thick ice layer from an aluminum plate in less than one-thirtieth of a second [13]. The de-icing effect covered an area up to 40 times the coil size, indicating a high potential for practical wind turbine applications. To detect ice buildup on wind turbine blades by integrating physics-based insights with advanced data analysis techniques, a model, called MFT-PI, examines how ice mass increases and how power output decreases to identify key patterns [14]. A method called Relief is used to select the most important features, which are then fed into a neural network trained with a triplet loss function. The model performed better than traditional methods when tested on real SCADA data from two turbines, indicating that it could be a reliable and accurate method for detecting icing early on.
The impact of ice buildup on wind turbine blades can adversely affect performance, especially in colder regions. Using a combination of simulation tools and real turbine data (CFD-WTIC-ILM), a study on a 15 MW turbine found that ice primarily forms along the leading edge of the blades, disrupting airflow [15]. This caused the turbine to reach its rated power at a higher wind speed of 13 m/s instead of 10.59 m/s and resulted in power losses of up to 37.5%. Over the course of a year, that adds up to a 22% energy loss. The approach used here gives a clearer picture of icing-related efficiency drops. As illustrated in Figure 1, the impact of icing on turbine power generation efficiency is significant.
On the other hand, different types of ice, such as rime and glaze, develop depending on weather conditions, including wind, temperature, and moisture [16]. The accumulation of ice depends on how air flows around the blades, cuts down power output, and stresses the machinery. This study presents various approaches to addressing this issue, ranging from specialized coatings to heating systems and innovative technologies such as electro-impulse methods. It also discusses the current state of research and what may come next to enhance the reliability of turbines in icy conditions.
However, when ice forms, it disrupts the airflow over the blades, adding drag and reducing lift, ultimately causing a drop in output. To accurately estimate these power losses, researchers investigated several modeling approaches focusing on computational fluid dynamics (CFD) and blade element momentum theory to demonstrate how the accuracy of these models is affected by variables such as surface temperature, phase transitions, and droplet behavior. The study illustrates both the benefits and drawbacks of present approaches by analyzing several simulation tools, including hybrid approaches [17].
Although many studies have investigated ice detection and mitigation strategies for wind turbines, key gaps remain. Most existing work emphasizes sensor development, aerodynamic modeling of iced airfoils, or thermal and coating-based anti-icing solutions. Electro Impulse De-Icing (EIDI) has been studied in aerospace applications, but its feasibility for large-scale wind turbines has not been fully established. Prior work often neglects scaling to utility-size blades, durability under repeated pulses, and direct comparison of energy demand against thermal or ultrasonic systems. Furthermore, many studies rely on simplified flat plate models rather than realistic curved blades and composite materials, which limits their transferability to practical applications.
The novelty of the research lies in three main contributions. First, it provides a quantitative assessment of how ice accretion degrades aerodynamic performance, demonstrating significant losses in lift and increased drag. Second, it develops a Multiphysics simulation framework in COMSOL Multiphysics Version 6.2 that couples electromagnetic, thermal, and structural fields to study Lorentz force-driven de-icing. Third, and most distinctively, it presents a detailed analysis of energy consumption for EIDI, scaling the results to 30 m, 50 m, and 80 m blades, and comparing seasonal energy use with thermal and ultrasonic systems. The results confirm that EIDI requires only 550–1450 kWh per icing season, which is substantially lower than the 8000-kWh required by thermal systems, while retaining superior effectiveness against thick glaze ice compared to ultrasonics. By combining aerodynamic impact assessment, Multiphysics simulation, and energy benchmarking, the research’s novelty lies in establishing a robust basis for evaluating the practical viability of EIDI for wind turbine de-icing.

2. Mechanism and Contributing Factors of Wind Turbine Icing

2.1. Influence of Windspeed on Turbine Blade Icing

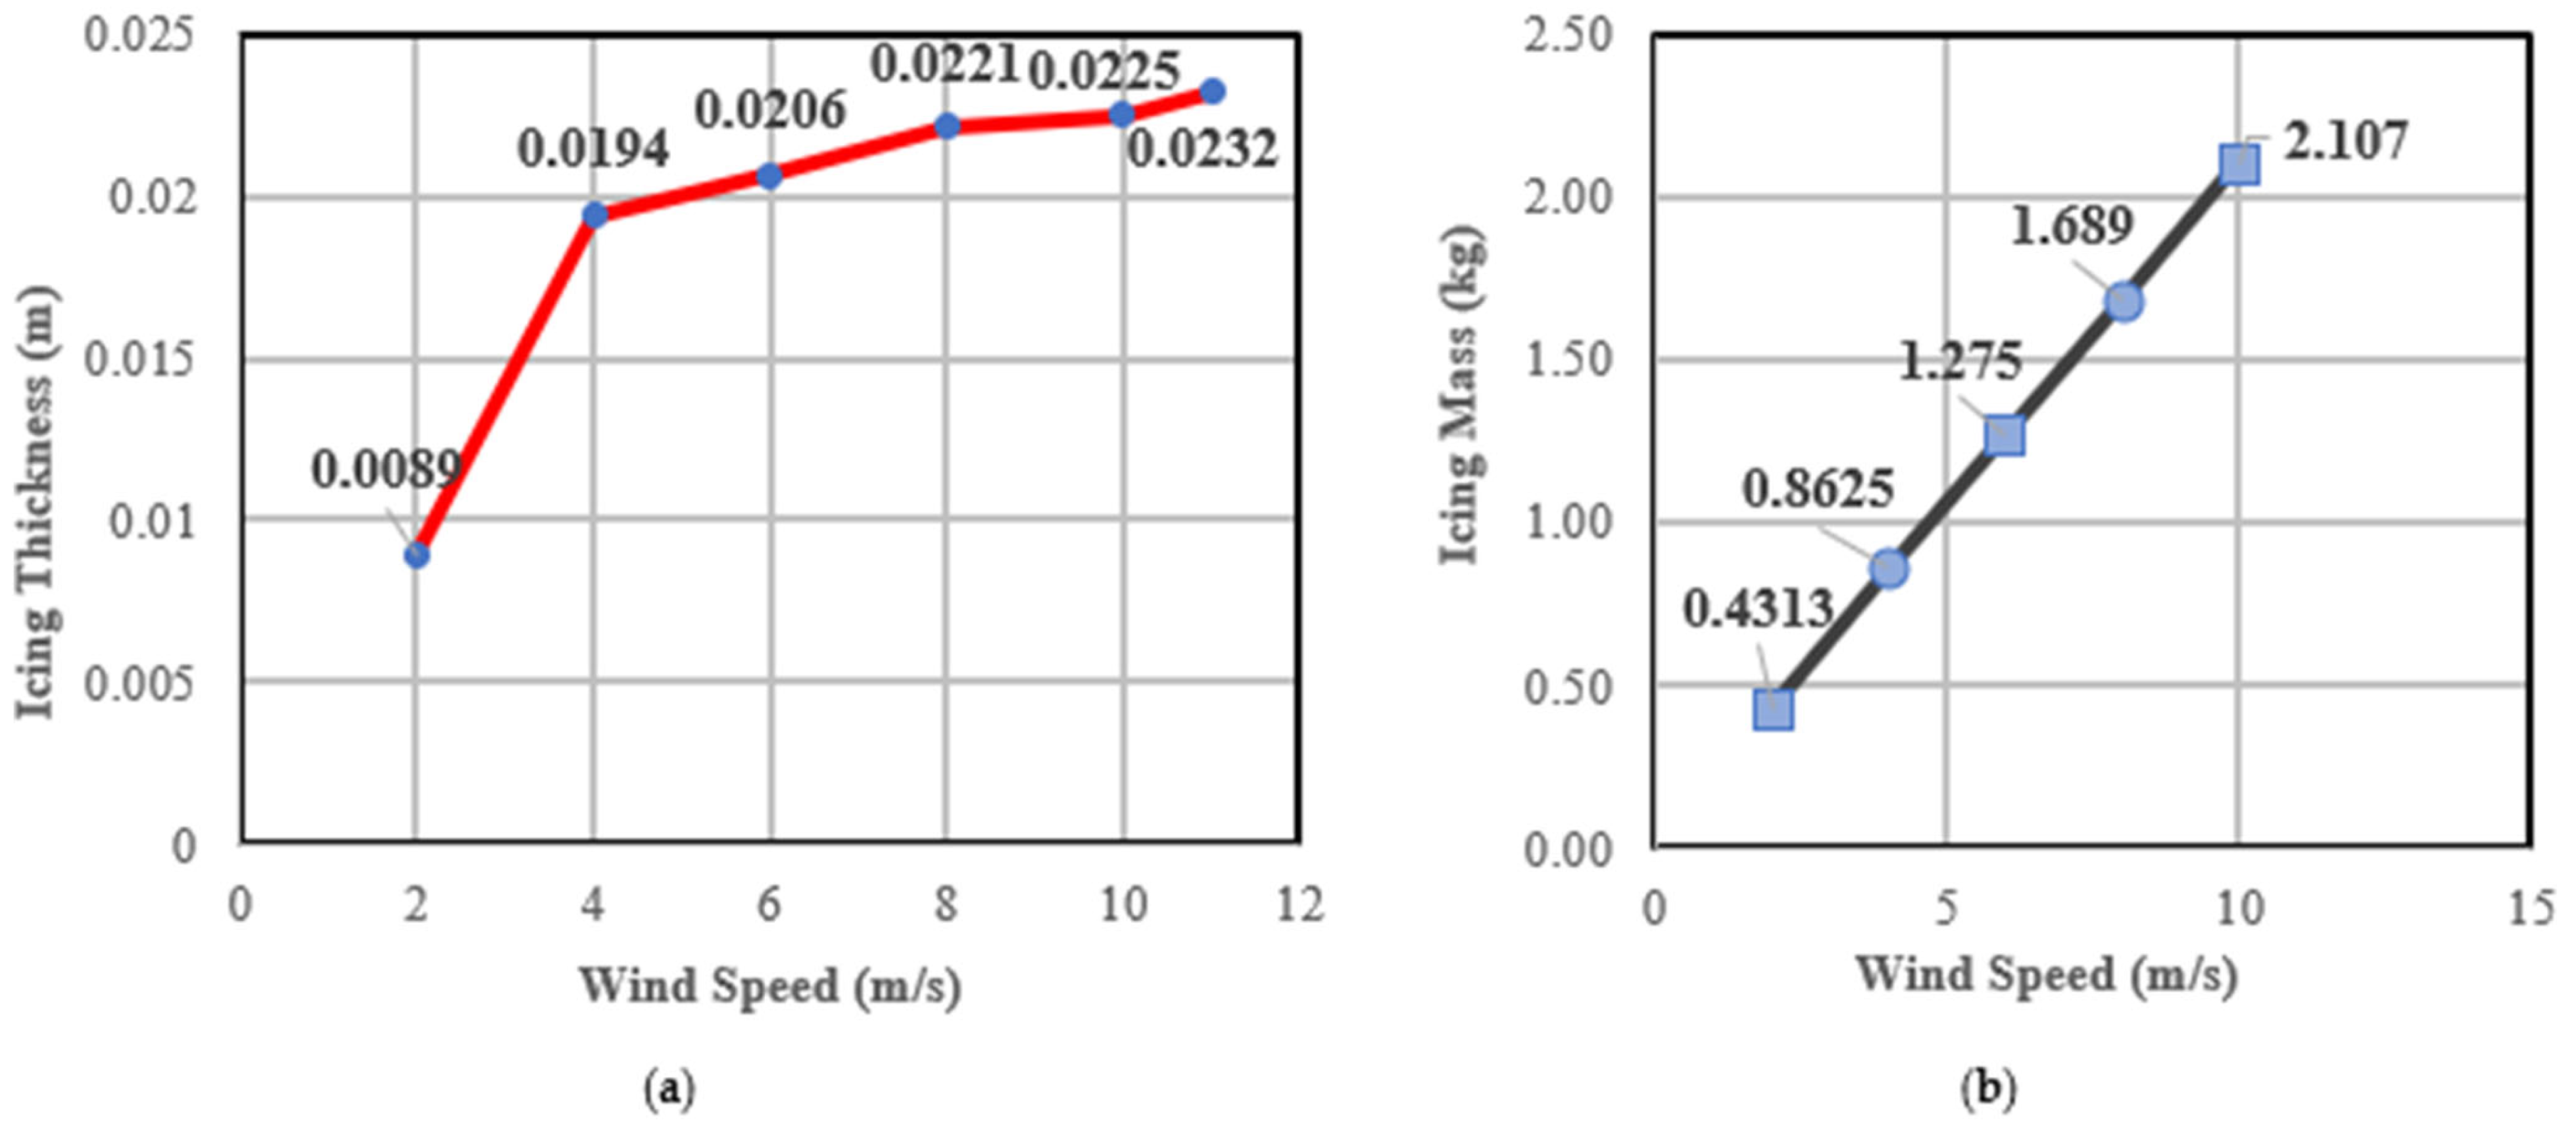
The effect of wind speed on ice development on turbine blades was investigated [18]. Even though the temperature remained constant, they observed that the ice thickness on the blades grew by 117% when the wind speed increased from 2 to 4 m/s. The icing thickened more slowly as wind speeds increased up to 10 m/s, but the total amount of ice mass continued to build steadily as more water droplets were delivered onto the blade surface by faster winds, as shown in Figure 2.

2.2. Influence of Temperature on Turbine Icing

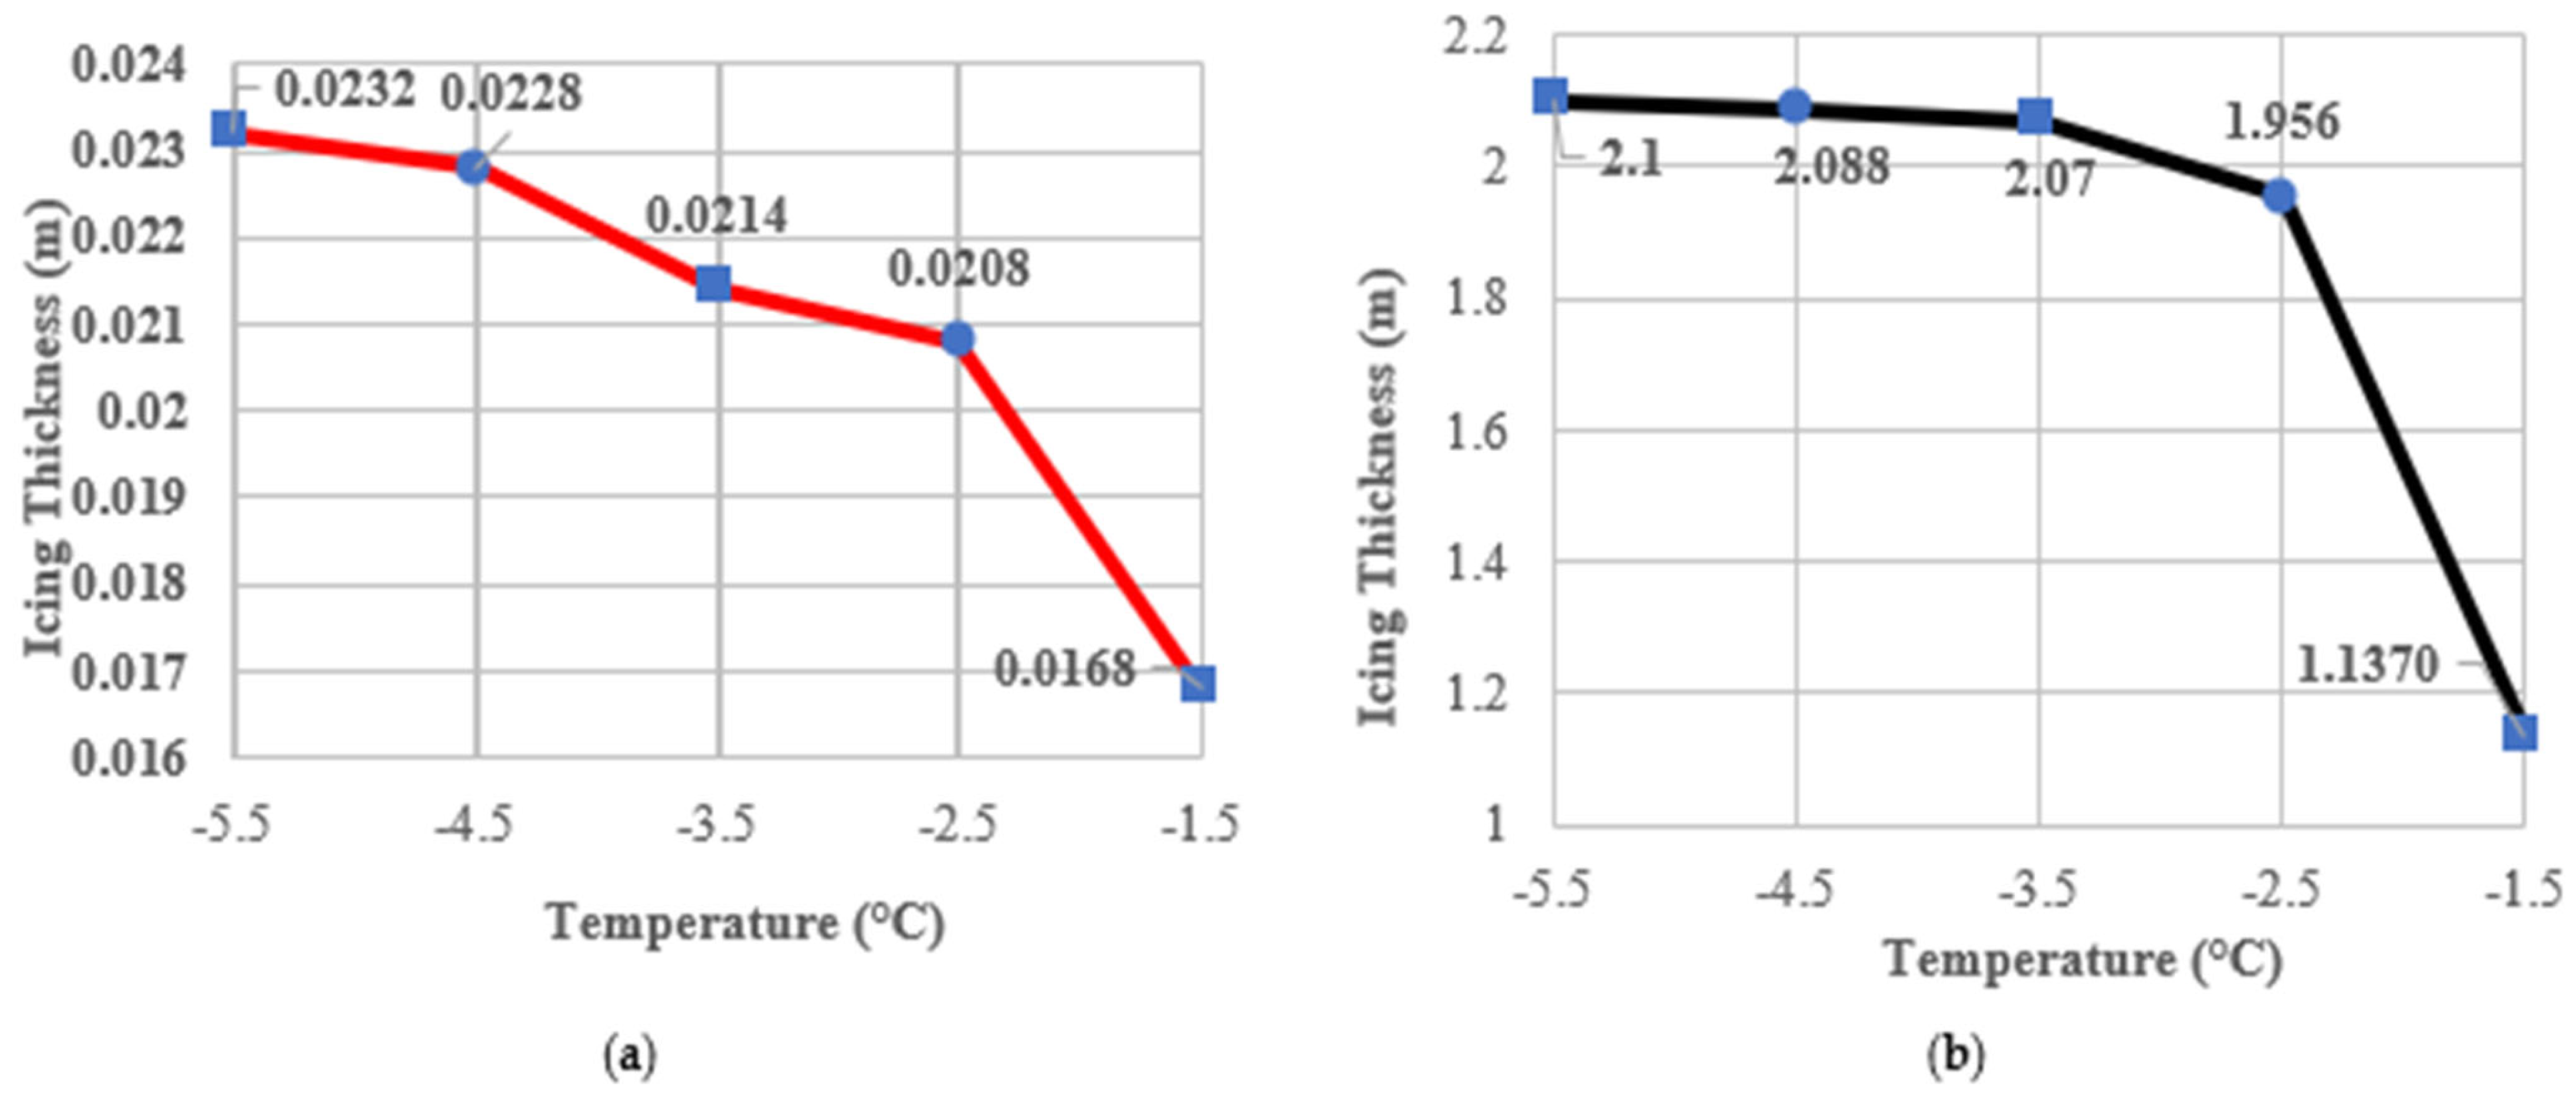
When wind speed stayed constant and temperature dropped from −1 °C to −2 °C, icing mass and maximum thickness on wind turbine blades rose by 71% and 24%, respectively [18]. However, as the temperature dropped from −2 °C to −5 °C, the icing mass and thickness increased by 1.7% and 0.9%, respectively. As illustrated in Figure 3, lower temperatures result in a larger freezing coefficient, causing a greater number of water droplets to freeze upon impact. At the same time, the water coating becomes less mobile, concentrating on the area with the most ice buildup near the leading edge of the blades.

2.3. Effect of Rim and Glaze Ice

When wind turbine blades spin through cold, moist air, supercooled water droplets often collide with their surface. Some droplets freeze instantly, while others slide along the blade before turning into ice or dripping off. This process produces different types of ice, depending on the weather conditions. Most of the buildup happens on the leading edge and the windward side of the blade, while the leeward side usually sees little. The ice layer is usually thinnest at the root and becomes thickest toward the tip, where sharp, angular formations often appear [19].
Rime ice forms in very cold conditions, usually between −13 °C and −8 °C. Here, tiny crystals or fog droplets freeze the moment they hit the blade. The result is a white, grainy coating with a low density of 0.3–0.6 g/cm3. Rime forms quickly on the windward side, resulting in a rough, dry texture. While it does not add much weight, even a thin layer can disturb the smooth airflow over the blade. This reduces lift, increases drag, and reduces the turbine’s efficiency. Glaze ice forms under milder, wetter conditions, typically between −4 °C and 0 °C. Droplets spread out before freezing, leaving behind a clear, dense coating with a density close to that of pure ice (approximately 0.9 g/cm3). Glaze ice sticks tightly to the blade and adds significant weight. Because it often forms unevenly, it can disrupt the rotor’s balance, create vibrations, and, in severe cases, force the turbine to shut down [20,21].
Sometimes the two types are mixed. In temperatures between −10 °C and −3 °C, blades can accumulate a mixture of rime and glaze ice, resulting in deposits that are dense, translucent, and more difficult to predict. Regardless of the type, icing reduces performance and poses significant challenges for the safe and reliable operation of wind power.

3. Impact of Icing on Power Generation

The icing on wind turbine blades has a significant impact on their aerodynamic performance and energy production. The buildup of ice alters the blade’s shape by increasing roughness and modifying the camber, resulting in a reduction in lift and an increase in drag. These alterations in aerodynamics lower the turbine’s power coefficient, subsequently decreasing the total energy captured from the wind. Field data indicate that losses due to ice can represent over 20–30% of total annual energy losses in colder regions. In a specific case, 517 turbines with a combined capacity of 682 MW experienced an energy loss of 18,966 MWh due to icing over a 29-month period, which was 1.85 times greater than the losses from all other fault types combined [8]. Moreover, icing often causes turbines to achieve rated power at higher wind speeds. For example, a 15 MW turbine was examined through CFD and WTIC-ILM simulation. It was demonstrated that ice accumulation on the leading edge resulted in the turbine reaching rated power at 13 m/s, rather than the typical 10.59 m/s, resulting in a 37.5% reduction in power under standard operating conditions [15]. This change impacts the capacity factor and increases stress on components such as gearboxes and generators. Additionally, icing can cause automatic shutdowns or reductions in output to prevent structural damage or ice shedding, particularly when turbines detect an imbalance. These shutdowns result in energy losses due to downtime and can contribute to grid instability.
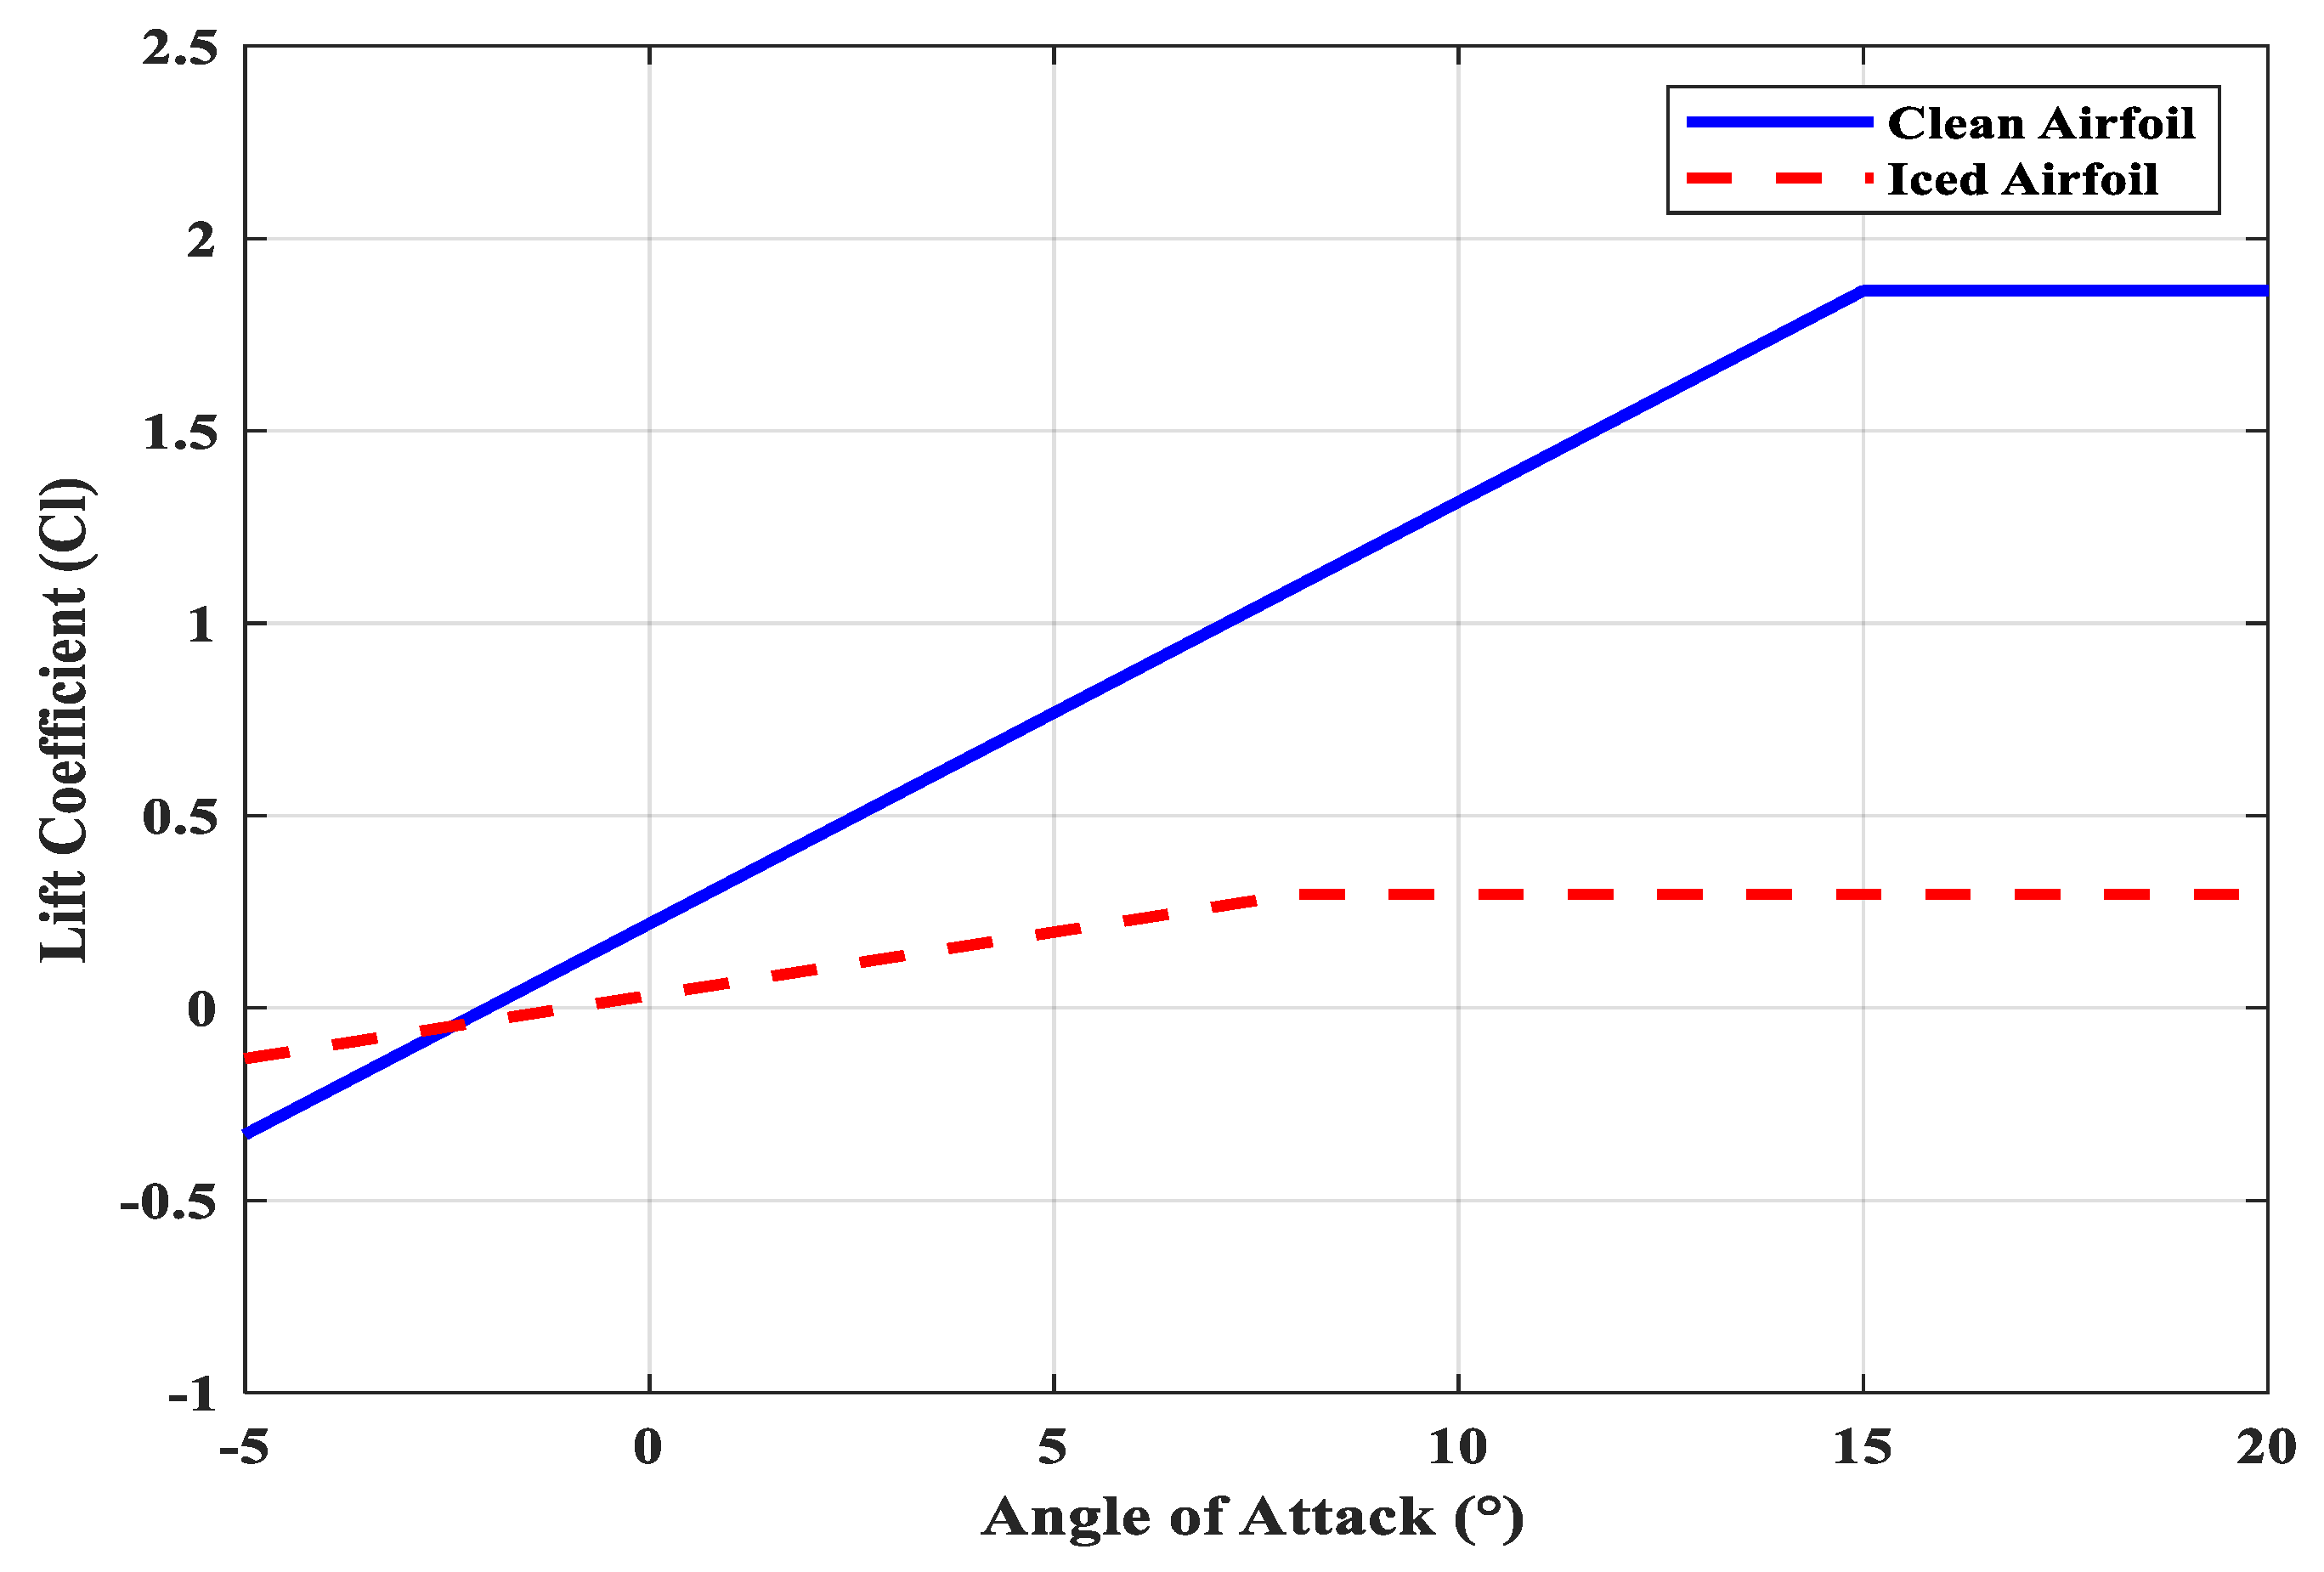
Modeling studies utilizing NACA 2412 airfoils have further detailed these effects. MATLAB version R2023b simulations comparing clean blades with iced blades reveal that icing results in a more than 30% reduction in the lift coefficient slope and causes stalls to occur at lower angles of attack. The lift-to-drag ratio declines sharply, resulting in a significant drop in efficiency, as shown in Figure 4 above. The resulting stall and decline in performance create compounding effects on energy output, especially during peak winter months when demand is typically higher.

4. Analysis of NACA 2412 Airfoil: Aerodynamic Impact of Ice Accretion

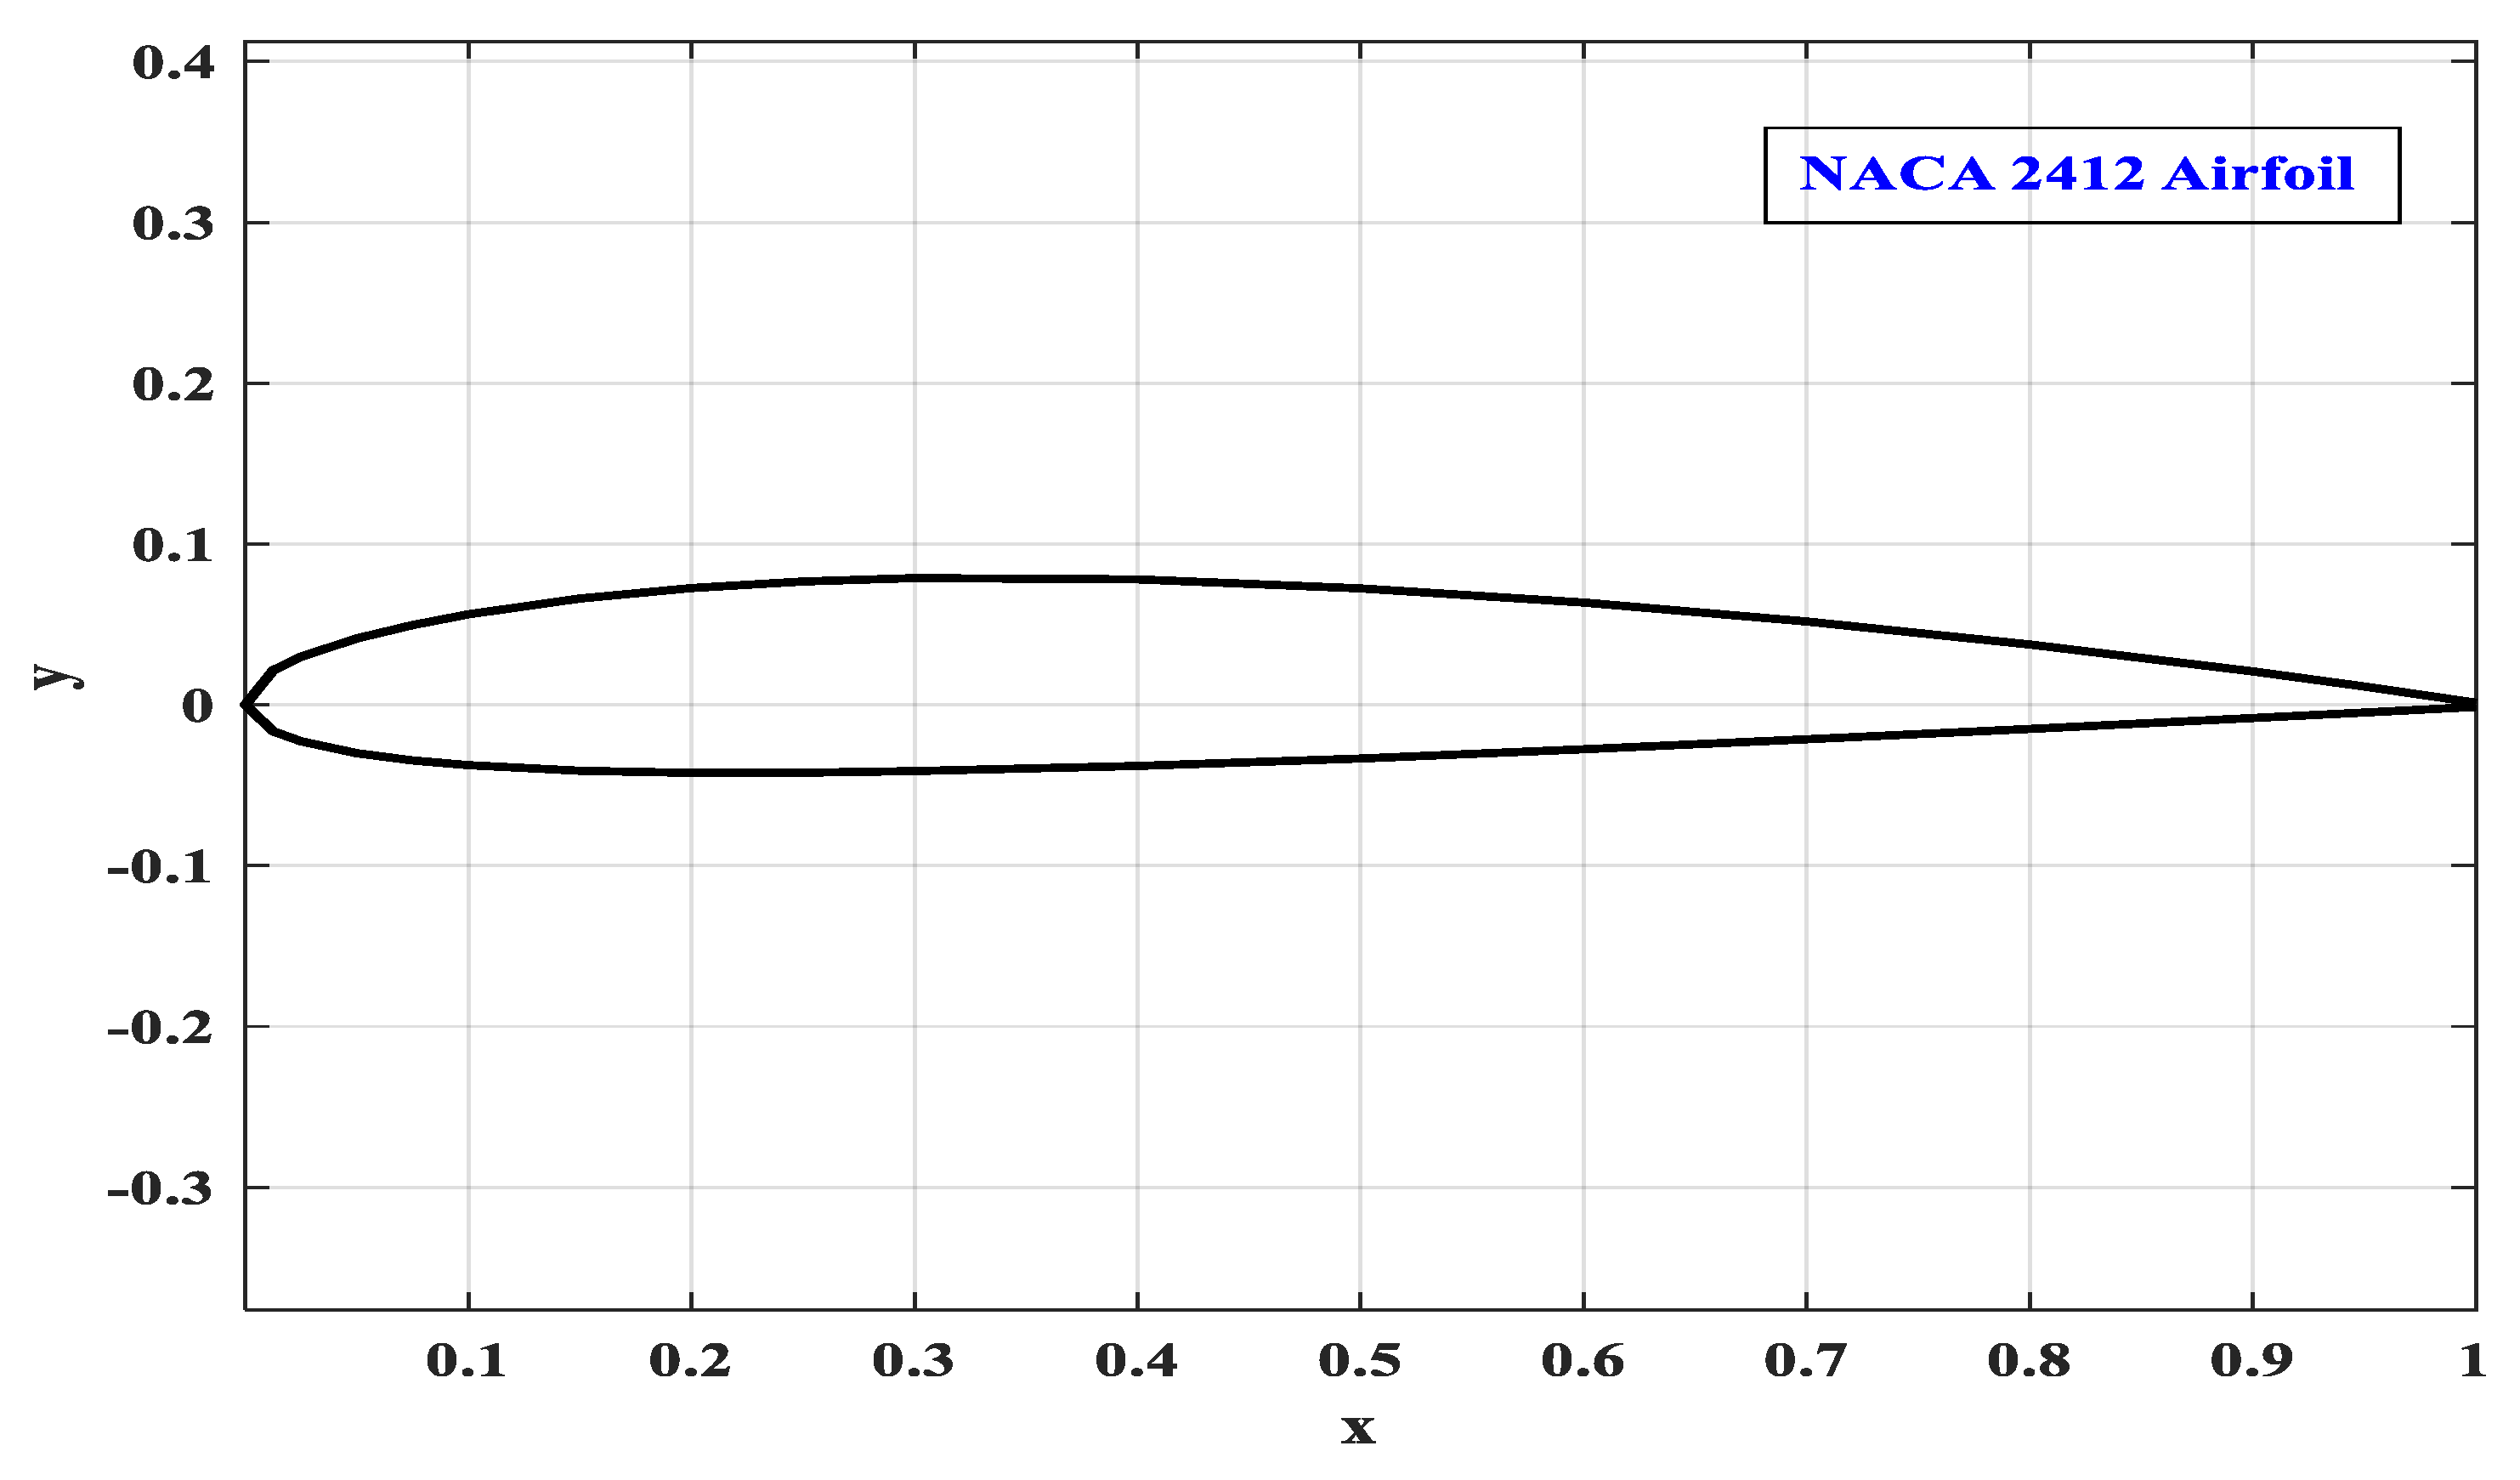
Ice accretion on wind turbine blades significantly degrades their aerodynamic properties by changing the surface shape and increasing roughness [22]. This affects lift generation and increases the likelihood of stalling. For this purpose, a NACA 2412 Airfoil is designed, which is shown in Figure 5, and then it is used to compare the lift performance of a clean NACA 2412 Airfoil with an iced version using MATLAB simulation version R2023b.

4.1. Impact of Atmospheric Conditions on Ice Adhesion

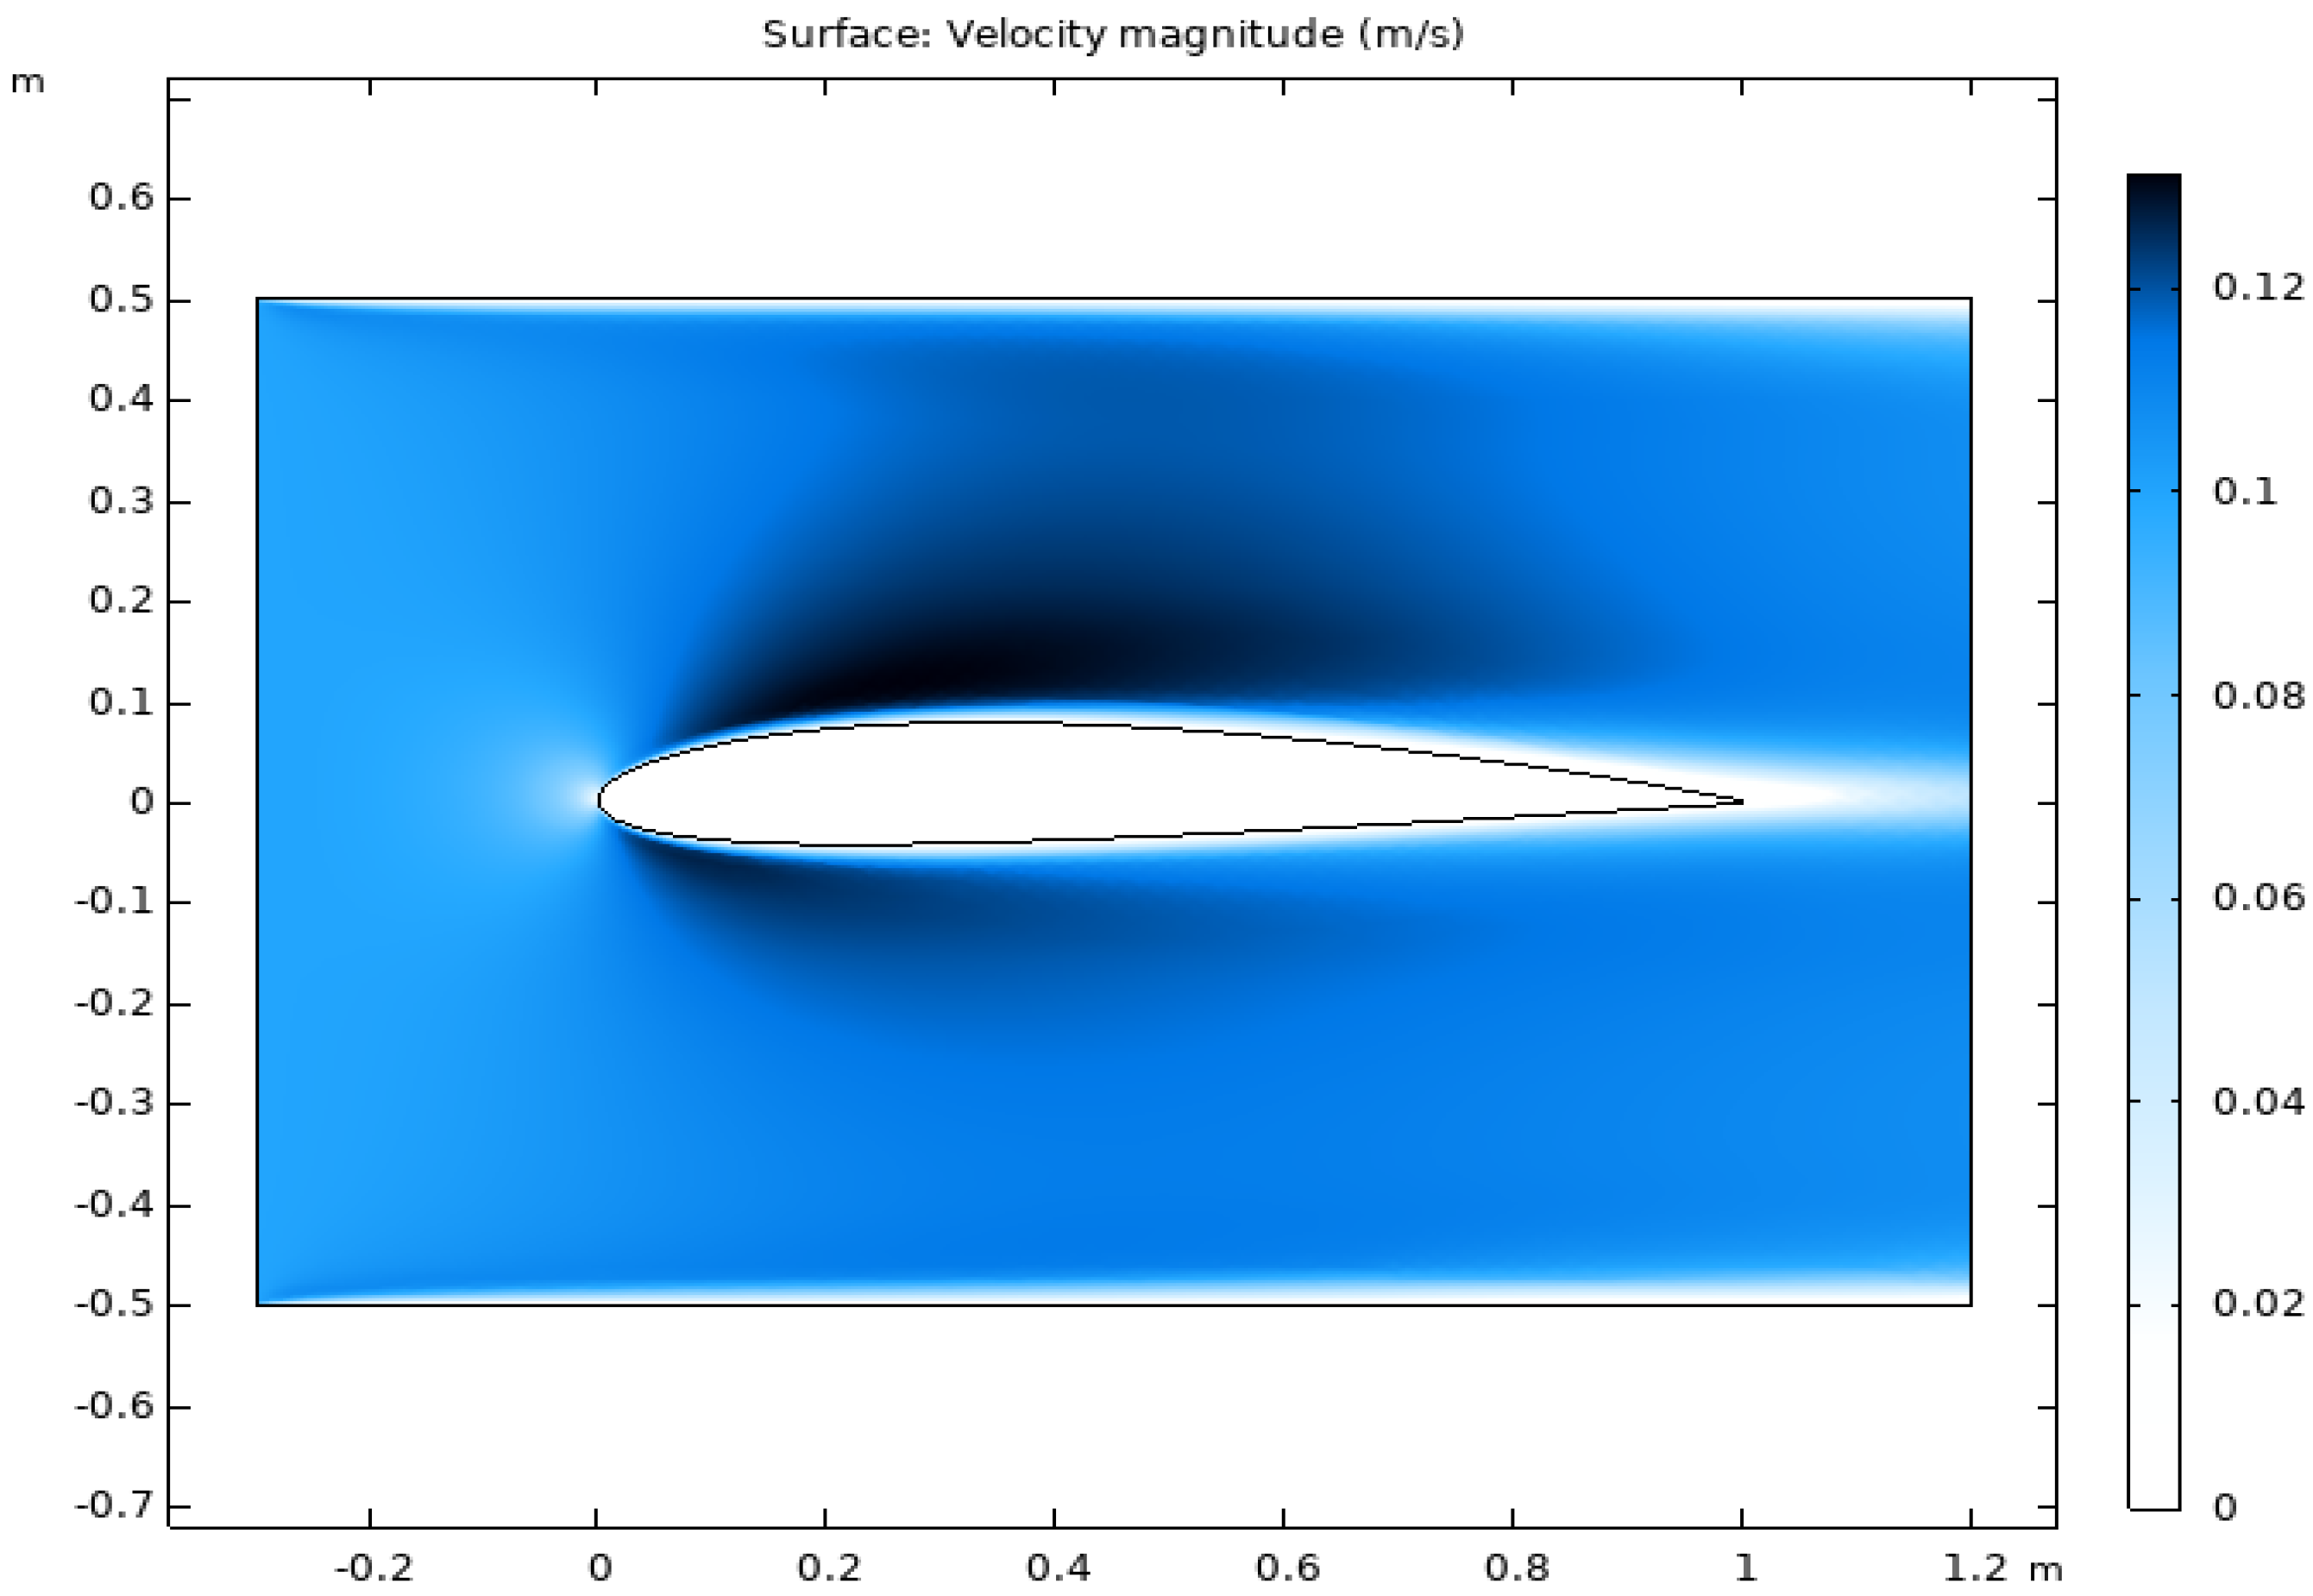
Environmental parameters such as air temperature, wind speed, and liquid water content strongly influence both ice adhesion strength and accretion morphology on wind turbine blades [23]. While the present simulation framework does not explicitly incorporate atmospheric variability, preliminary laminar flow analyses around a NACA airfoil section, as shown in Figure 6, highlight how velocity and pressure gradients define droplet impingement zones and, therefore, potential ice accumulation hotspots. These results reinforce the importance of coupling EIDI simulations with established icing prediction tools such as FENSAP-ICE and LEWICE, which capture the thermodynamic and microphysical processes of in-flight and in-situ icing [24,25]. Incorporating such aerodynamic-thermodynamic coupling is identified as an essential future step to enhance the predictive fidelity and transferability of the present results to real-world operating conditions.
Figure 6 above shows higher velocity gradients near the leading edge and on the upper surface, consistent with the generation of aerodynamic lift.
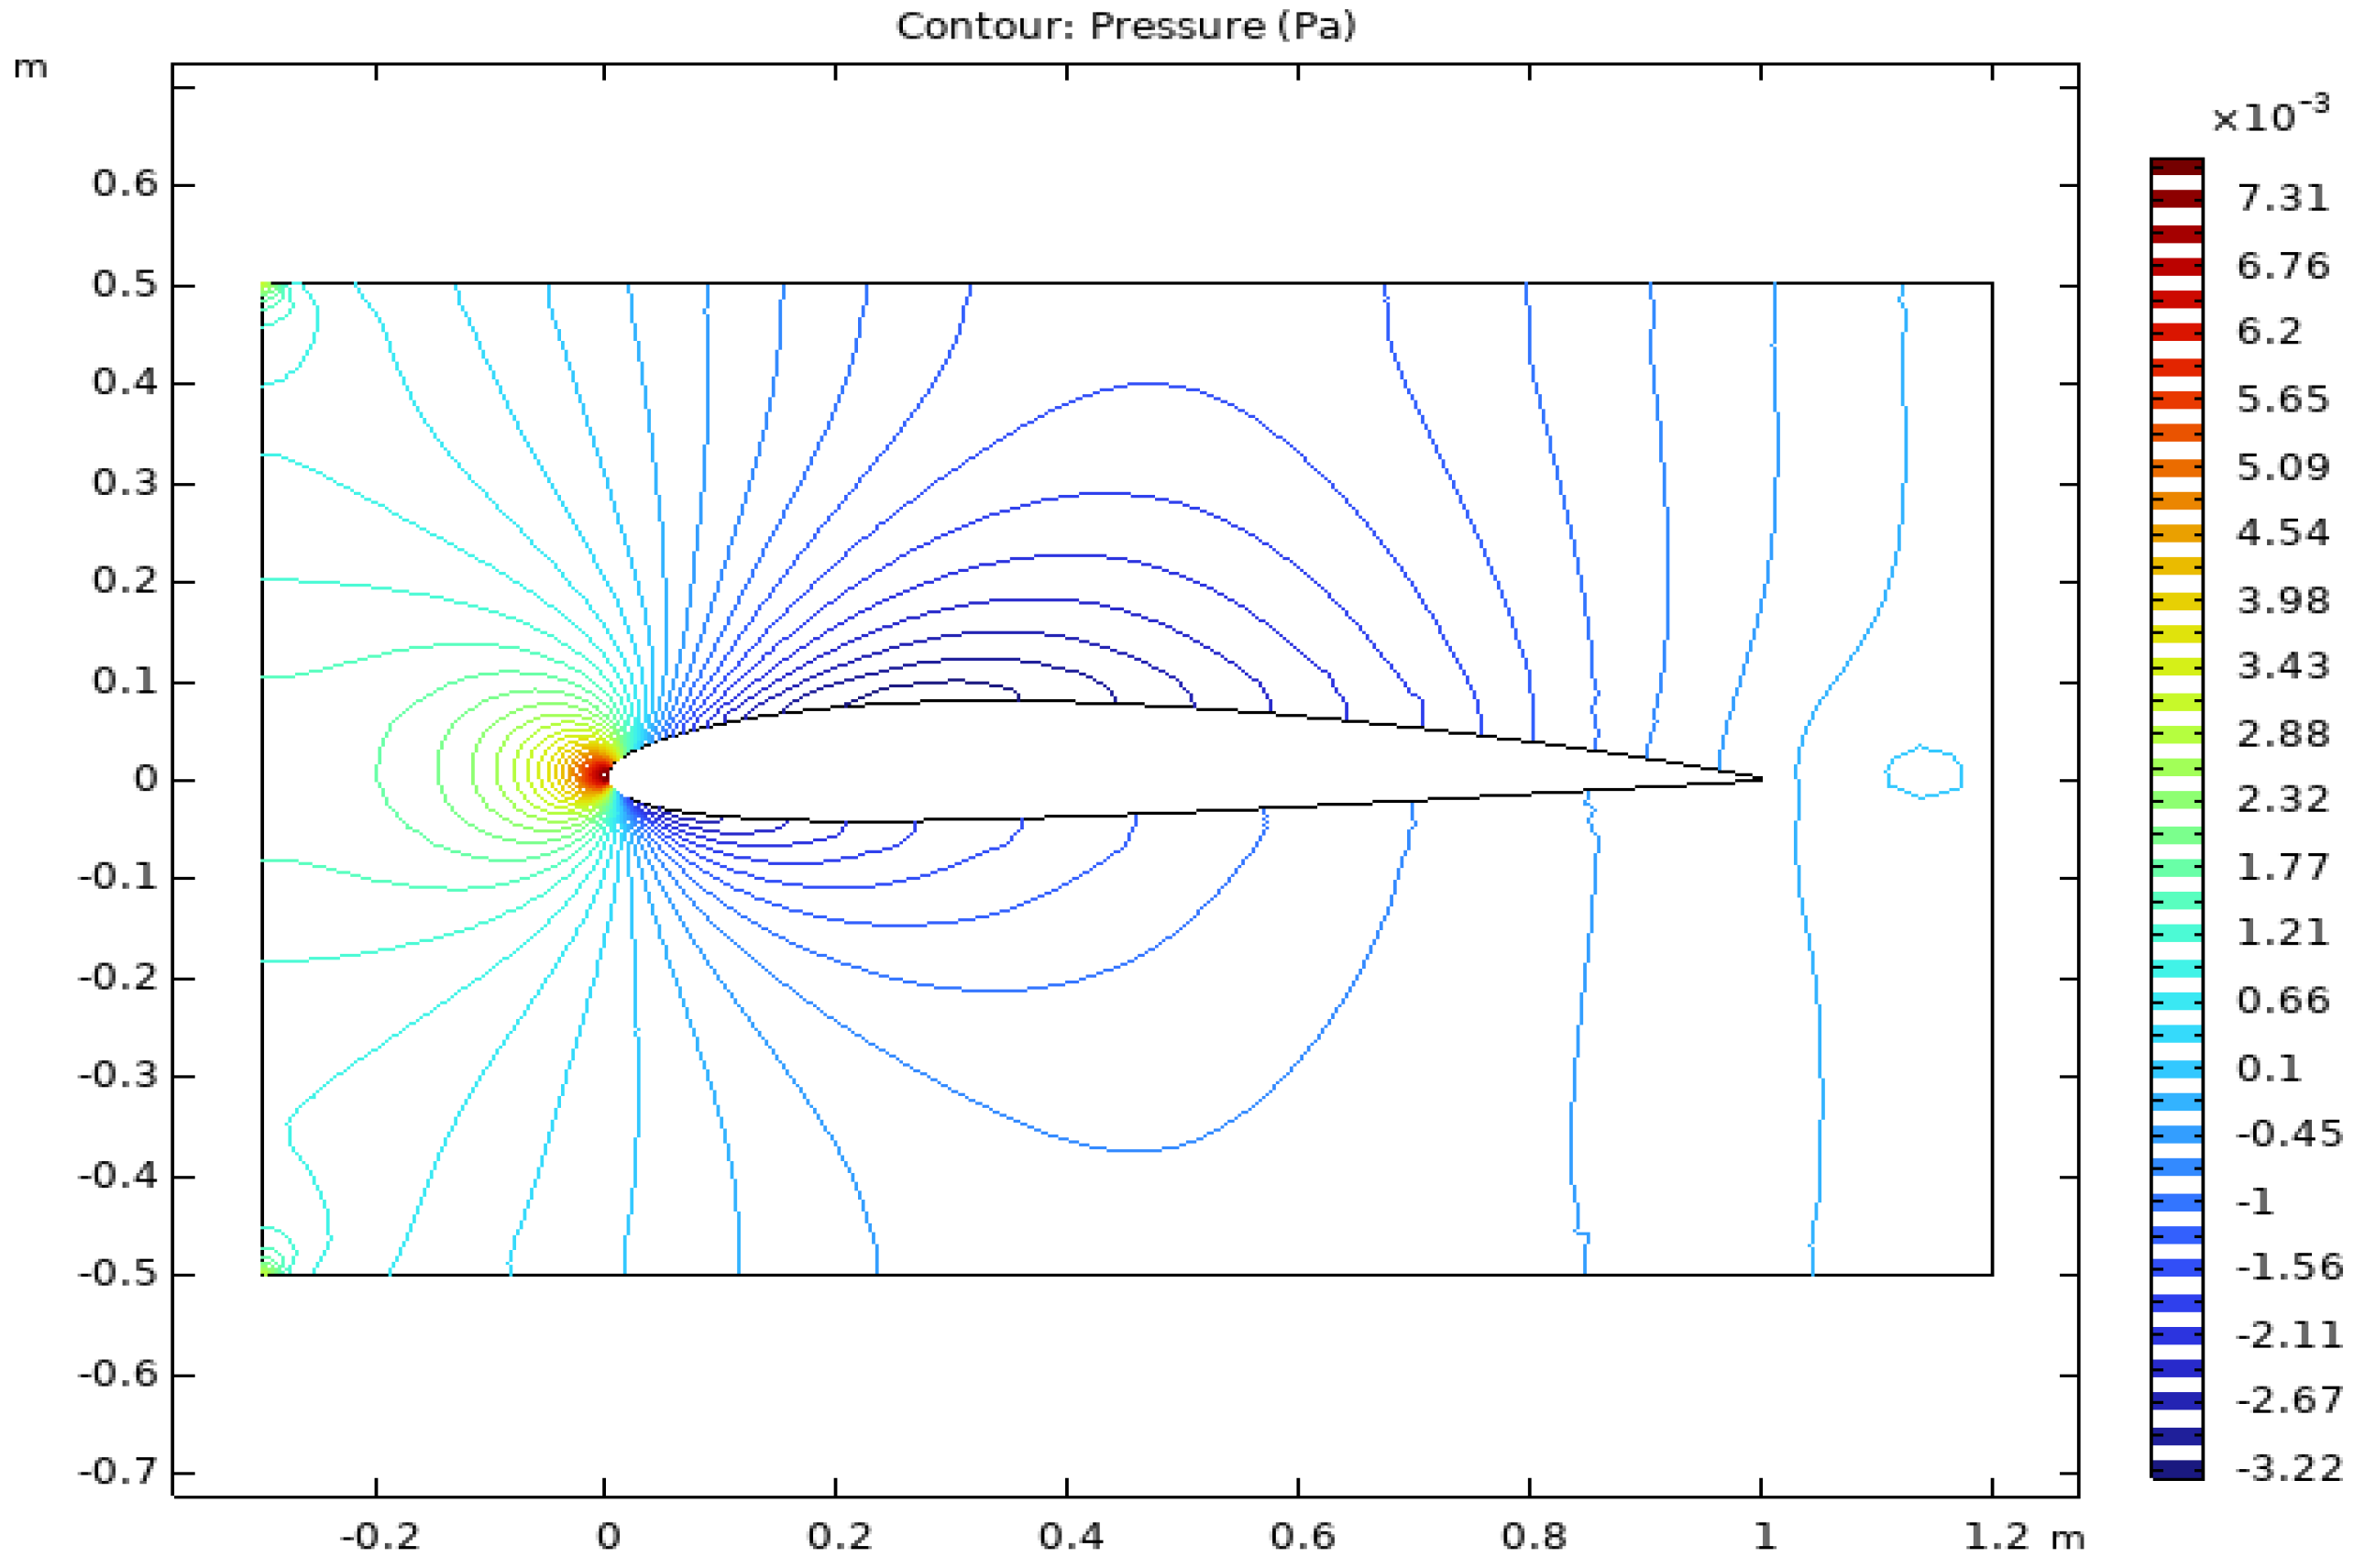
Figure 7 illustrates pressure gradients along the suction and pressure sides. High-pressure regions are observed at the stagnation point on the leading edge, while low-pressure zones predominate on the suction side, confirming the generation of lift.
The velocity magnitude and pressure contour plots around the NACA 2412 airfoil provide complementary insights into aerodynamic performance under icing conditions. The velocity distribution in Figure 6 illustrates a pronounced acceleration of flow over the suction surface, accompanied by a low-velocity region downstream, confirming the lift-enhancing mechanism of a clean blade. The pressure contour in Figure 7 highlights the expected aerodynamic pressure differential: a high-pressure stagnation region at the leading edge and a low-pressure zone on the suction side, which together generate lift.
When ice accretion occurs, these distributions are significantly altered. Ice deposits thicken the leading edge, disturb boundary layer flow, and increase surface roughness. This disrupts the smooth gradient observed in Figure 6 and reduces the suction-side pressure deficit in Figure 7, thereby lowering lift and increasing drag. Severe icing, such as glaze ice, can even trigger premature flow separation, exacerbating aerodynamic losses.
The Electro-Impulse De-Icing (EIDI) strategy modeled in this study aims to restore these clean-airfoil distributions by mechanically detaching ice layers. By re-establishing the high-velocity suction-side flow and the pressure differential across the blade, EIDI mitigates icing-induced aerodynamic penalties and prevents the observed efficiency losses of up to 30–40% in iced turbines reported in the literature.

4.2. Modeling the Impact of Ice Accretion on Lift and Stall Performance

The lift coefficient C L can be calculated using the formula,
C L = 2 π ( α α 0 )
where,
C L   = Lift   coefficient ,   α = Angle   of   attack   and   α 0 = Zero-lift angle
The stall is modeled by limiting the lift coefficient following the stall angle. The lift slope of the iced airfoil is reduced to 30% that of the clean airfoil, and the stall occurs earlier [26].
Icing reduces the slope d C L d α due to boundary layer separation and surface roughness. For iced airfoils:
C L , i c e d = η × 2 π ( α α 0 )
where, η = Degradation factor
To simulate a stall,
C L ( α ) = 2 π α α 0 ,    α α s t a l l C L α s t a l l ,    α > α s t a l l
The drag also increases significantly due to ice. The lift-to-drag ratio L D drops sharply. The drag coefficient C d can be estimated as:
C d = C d o + k C L 2
where C d o increases with ice, and k is the drag factor.
The comparison in Figure 8 illustrates the aerodynamic degradation of a NACA 2412 airfoil under moderate glaze-ice accretion. The clean airfoil exhibits a higher lift coefficient and a delayed stall, maintaining aerodynamic efficiency up to an angle of attack of approximately 15°. In contrast, the iced airfoil, representing a 3–5 mm glaze-ice layer near the leading edge, shows a 30% reduction in lift slope and an earlier stall onset. This degradation aligns with experimental observations [27,28] that reported lift reductions of 25–40% for comparable ice thicknesses. The results confirm that even thin glaze-ice layers significantly impair aerodynamic performance by disrupting boundary-layer attachment and increasing flow separation.

5. Sensing Mechanisms for Detecting Ice Formation on Wind Turbine Blade Surface

Detecting ice formation on wind turbine blades accurately and promptly is crucial for minimizing performance declines and preventing potential structural damage. Methods for ice detection are generally categorized into two types: indirect and direct.

5.1. Indirect Methods: Deduce Icing Conditions from Variations

In turbine performance metrics such as power output, rotor speed, or vibrations. Strategies like analyzing power curve deviations and SCADA-based monitoring are cost-effective but frequently experience false positives and delayed reactions, particularly under changing environmental circumstances [5,6]

5.2. Direct Methods

It depends on actual measurements taken from the blade surface, providing greater accuracy.
  • Capacitive sensors: Identify changes in permittivity resulting from ice buildup. Although they are precise, they demand robust installation to endure extreme conditions.
  • Optical and infrared sensors: Assess changes in light reflection caused by ice accumulation. These systems are quick and sensitive but can be affected by dirt or fog.
  • Ultrasonic sensors: detect ice through variations in sound wave propagation. They are effective for thicker ice layers but are vulnerable to noise interference.
  • Microwave sensors: utilize frequency shifts caused by variations in dielectric properties to confirm the presence of ice. They deliver high precision and rapid responses.
  • Flexible dielectric impedance sensors: provide real-time, wireless ice thickness monitoring with minimal aerodynamic disruption [5].
Recent progress includes the incorporation of AI and machine learning with SCADA data and imaging technologies. Models like Random Forests and Neural Networks have been developed to recognize and categorize ice formations, predict blade deterioration, and provide immediate updates to cloud-based systems [7]. These intelligent systems enhance automation, minimize false alerts, and facilitate predictive maintenance strategies. Even with these technological strides, challenges persist concerning sensor longevity, energy usage, and dependable wireless data transmission on rotating blades. Nonetheless, merging direct sensing techniques with AI-enhanced analysis presents a promising avenue for developing scalable, real-time ice detection systems that enhance safety and energy efficiency in wind farms located in cold climates.

6. De-Icing Techniques

De-icing methods are crucial for restoring the aerodynamic efficiency of wind turbine blades that suffer from ice buildup. These techniques can be divided into two main categories: active and passive methods. While passive strategies are designed to prevent or mitigate ice formation (anti-icing), de-icing specifically targets the removal of ice that has already formed through thermal, mechanical, or electromagnetic approaches.
  • Thermal De-Icing
Thermal systems are among the most common and effective techniques. These include internal electric heating elements embedded within the blade and external heating films applied on the blade surface. Heat is generated via resistive elements powered by the turbine or grid, melting the ice or weakening its adhesion [5].
2.
Electro-Impulse and Ultrasonic De-Icing
Electro-Impulse De-Icing (EIDI) works by applying a brief, high-voltage pulse through a coil, creating an electromagnetic force that separates the ice from the blade. This method is efficient in terms of energy and acts quickly but requires dependable integration into the blade design [6].
3.
Ultrasonic de-icing
It employs high-frequency mechanical vibrations to break and detach ice. These can effectively address thin ice layers and can be embedded in specific sections of the blade; however, their long-term performance during operation remains under study [7].
4.
Mechanical and Pneumatic Systems
Certain blades utilize mechanical actuators or inflatable boots that periodically alter the shape of the blade surface, leading to the cracking and removal of ice. While effective in specific areas, these approaches can complicate maintenance and are typically better suited for smaller turbines.
5.
Hybrid and Intelligent Systems
Recent studies emphasize the importance of integrating sensing technology with de-icing methods to develop intelligent hybrid systems. These systems rely on real-time data from sensors and weather predictions to initiate de-icing processes only when necessary, thus optimizing energy consumption and minimizing wear on components [7].
A comparative analysis of various deicing techniques, including their energy consumption, effectiveness, and complexity, is presented in Table 1 below.

7. Multiphysics Simulation of Electro Impulse Ice Mitigation Technique

The Electro-Impulse De-Icing (EIDI) technology eliminates ice from wind turbine blades by generating strong Lorentz forces in embedded coils using pulsed high currents. This simulation can be efficiently represented in COMSOL Multiphysics version 6.2 by combining electromagnetic, thermal, and structural physics.

7.1. Principle of Electro-Impulse De-Icing

The electric pulse de-icing technology utilizes a helical coil inserted directly beneath the inner surface of the wind turbine blade. This coil is part of an electromagnetic induction system designed to produce strong, quick mechanical pulses capable of melting ice off the blade. The operation begins with a DC power supply charging an energy storage capacitor through a control switch. When the capacitor is fully charged, a trigger signal activates a thyristor, which releases the stored energy during a high-current pulse via the helical coil. This quick discharge produces a high-intensity, short-duration magnetic field.
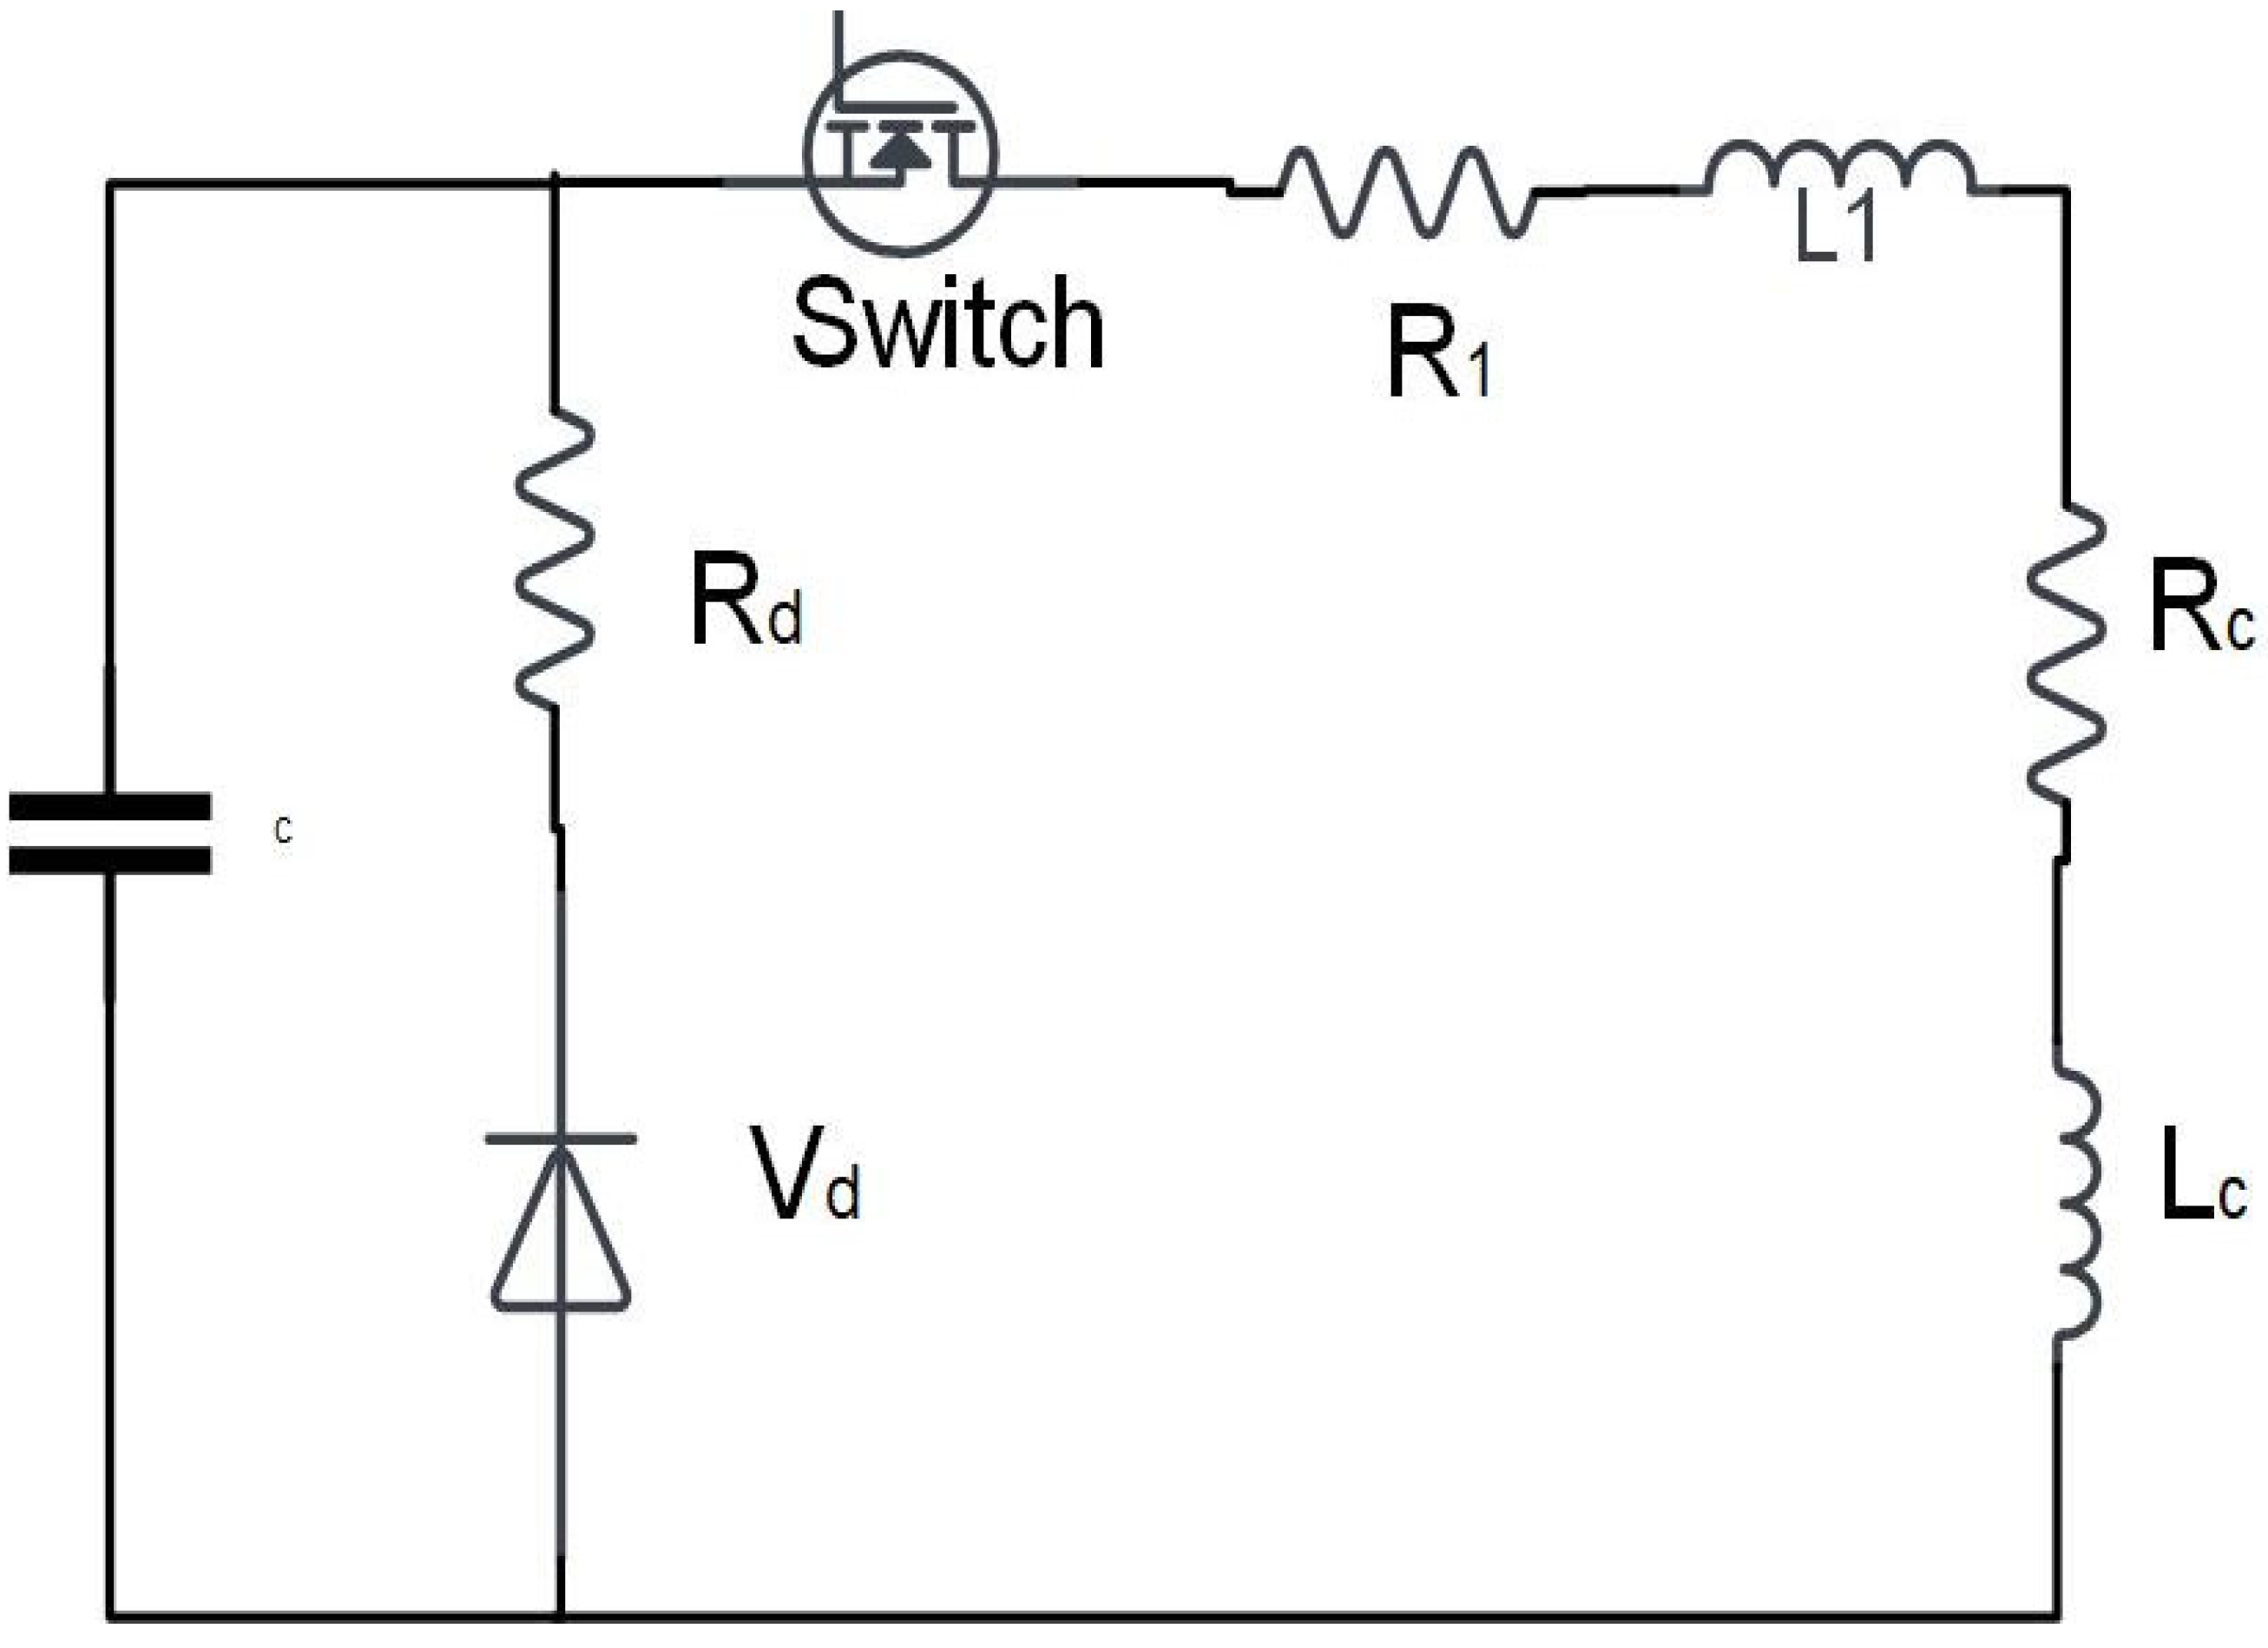
The magnetic pulse creates eddy currents in the conductive metallic shell bonded to the blade, resulting in a Lorentz force. This force causes the plate to gently bend and vibrate, breaking the link between the ice coating and the blade surface. As a result, the ice separates and falls away due to gravity. This approach can be repeated automatically as long as the icing conditions remain. The current response in this system is similar to that of a weakly damped RLC circuit, allowing for quick energy discharge with negligible losses. To protect the system, particularly the capacitor bank, a clamp diode prevents reverse current flow during operation. A simple circuit configuration is shown in Figure 9 below.

7.2. Simulation Set Up

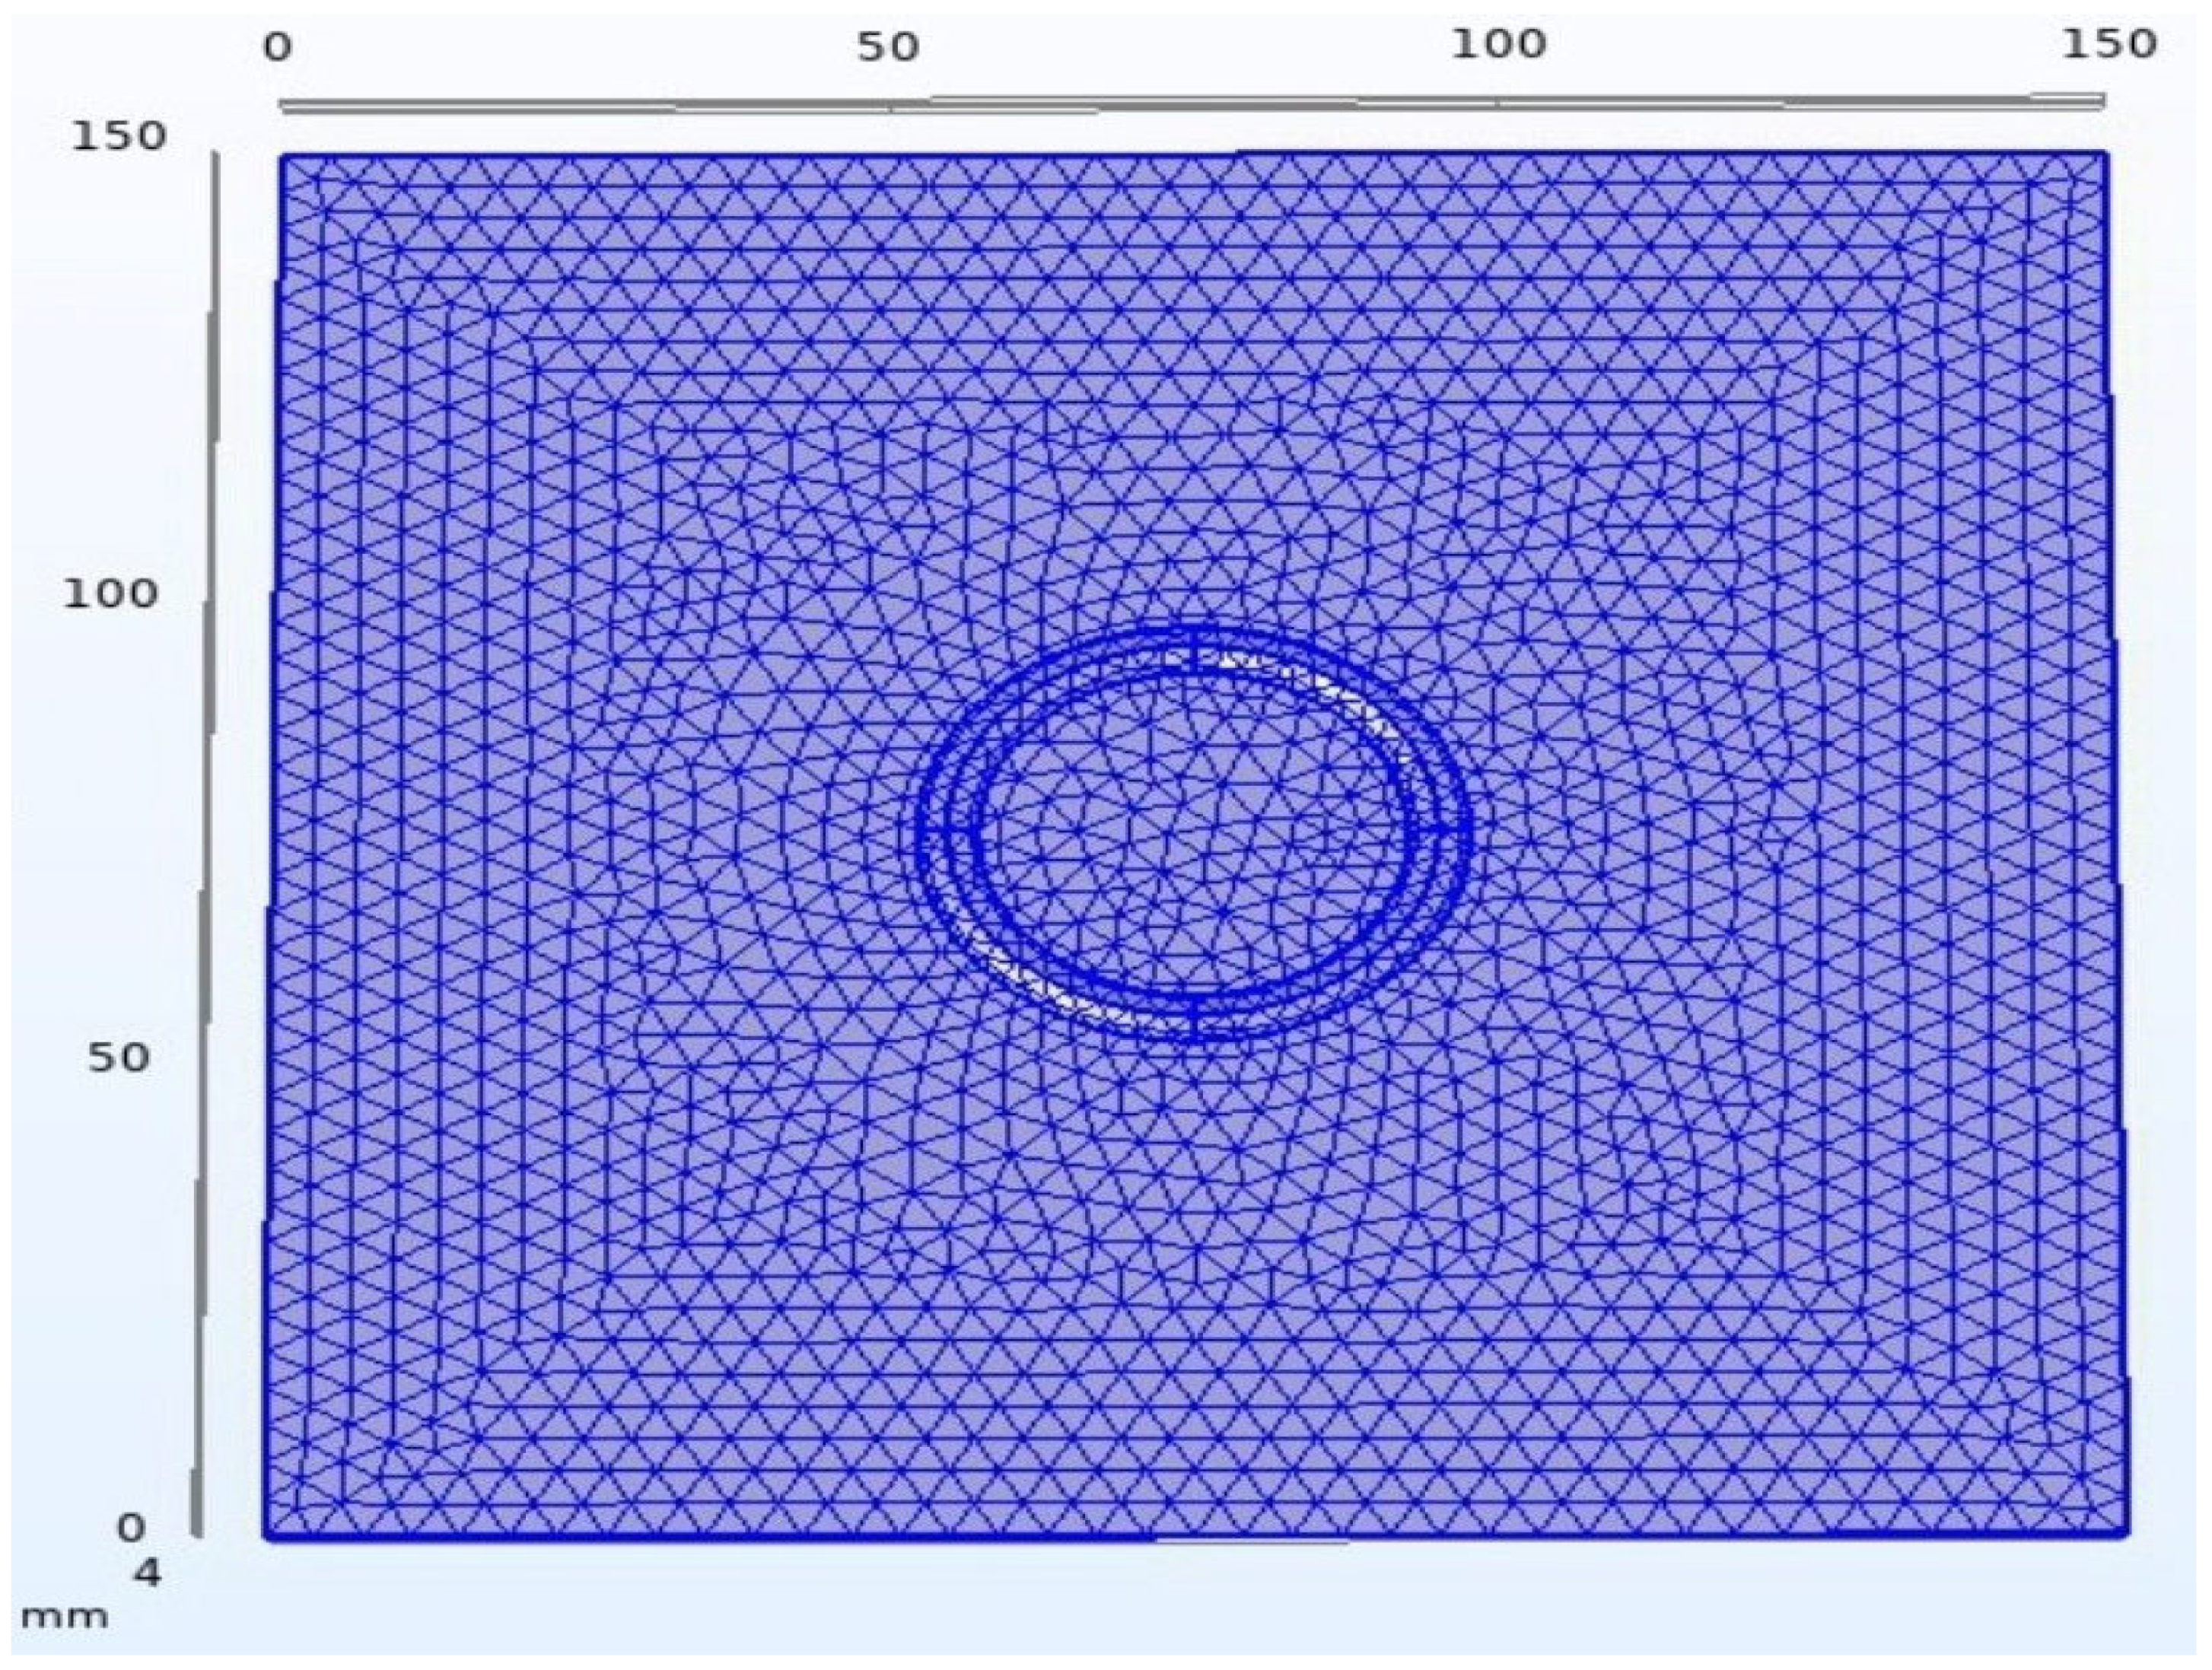
The EIDI technology offers a non-thermal, impulse-driven alternative, in which electromagnetic forces generated by rapid current pulses in a coil separate ice layers from a conductive surface, as shown in Figure 10 below.
On the other hand, the materials used in the simulation, namely aluminum and copper coils, are listed in Table 2 below.

8. Time-Dependent Electromagnetic-Thermomechanical Coupling Analysis in EIDI Systems

The aim of this study is to investigate the transient electromagnetic response and induced Lorentz forces in an electro-impulse deicing setup using COMSOL Multiphysics version 6.2. The model consisted of a circular copper coil mounted over an aluminum plate, excited with an exponentially decaying current pulse to simulate a high-amplitude impulse discharge. The coupled physics interfaces included:
  • Magnetic Fields (mf)—to solve transient magnetic flux density and induced Lorentz forces.
  • Solid Mechanics (solid)—to analyze resulting structural deformation and stress.

8.1. Simulation Parameter Selection

A time-dependent current pulse was defined analytically as:
I ( t ) = I 0 · e t / τ · ( t 0 )
The parameters selected for the electro-impulse de-icing (EIDI) model were based on values reported in both experimental studies and validated numerical work. A discharge current of 5000 A was used, which falls comfortably within the 1–10 kA range commonly applied in laboratories and prototype systems [29,30,31]. This value represents a practical compromise: large enough to generate Lorentz forces capable of breaking the ice bond, but not so high as to demand impractically complex circuitry. For the copper coil, a resistance of 0.05 Ω was assumed. Published designs for high-current pulsed coils generally report resistance between 0.01 and 0.1 Ω [32], and our choice falls within this range. It is therefore representative of a feasible winding design, one that minimizes heating losses while still allowing rapid current rise. The pulse duration was set at 400 µs, which is consistent with the 100–1000 µs range reported in the literature [33]. A value in this range is essential, as it ensures that the mechanical impulse is delivered before the ice layer can relax thermally. Table 3 below shows the simulation parameters for the study.
The exponential current decay constant was set at 200 µs, corresponding to the RLC discharge time (τ = L/R). This value aligns with reported figures for similar prototypes, which typically range from 100 to 300 µs [29,30]. Finally, the repetition rate of five pulses per minute was chosen to represent moderate icing conditions (around 2–5 mm accretion thickness). Prior studies suggest that 5–10 pulses per minute are sufficient to repeatedly loosen and shed ice without excessive energy use [29,34]. These values strike a balance between physical realism and practical feasibility, enabling the model to capture key behaviors of EIDI systems while remaining grounded in established engineering practices.

8.2. Simulation Output

8.2.1. Magnetic Flux Density Norm (B-Field) vs. Time

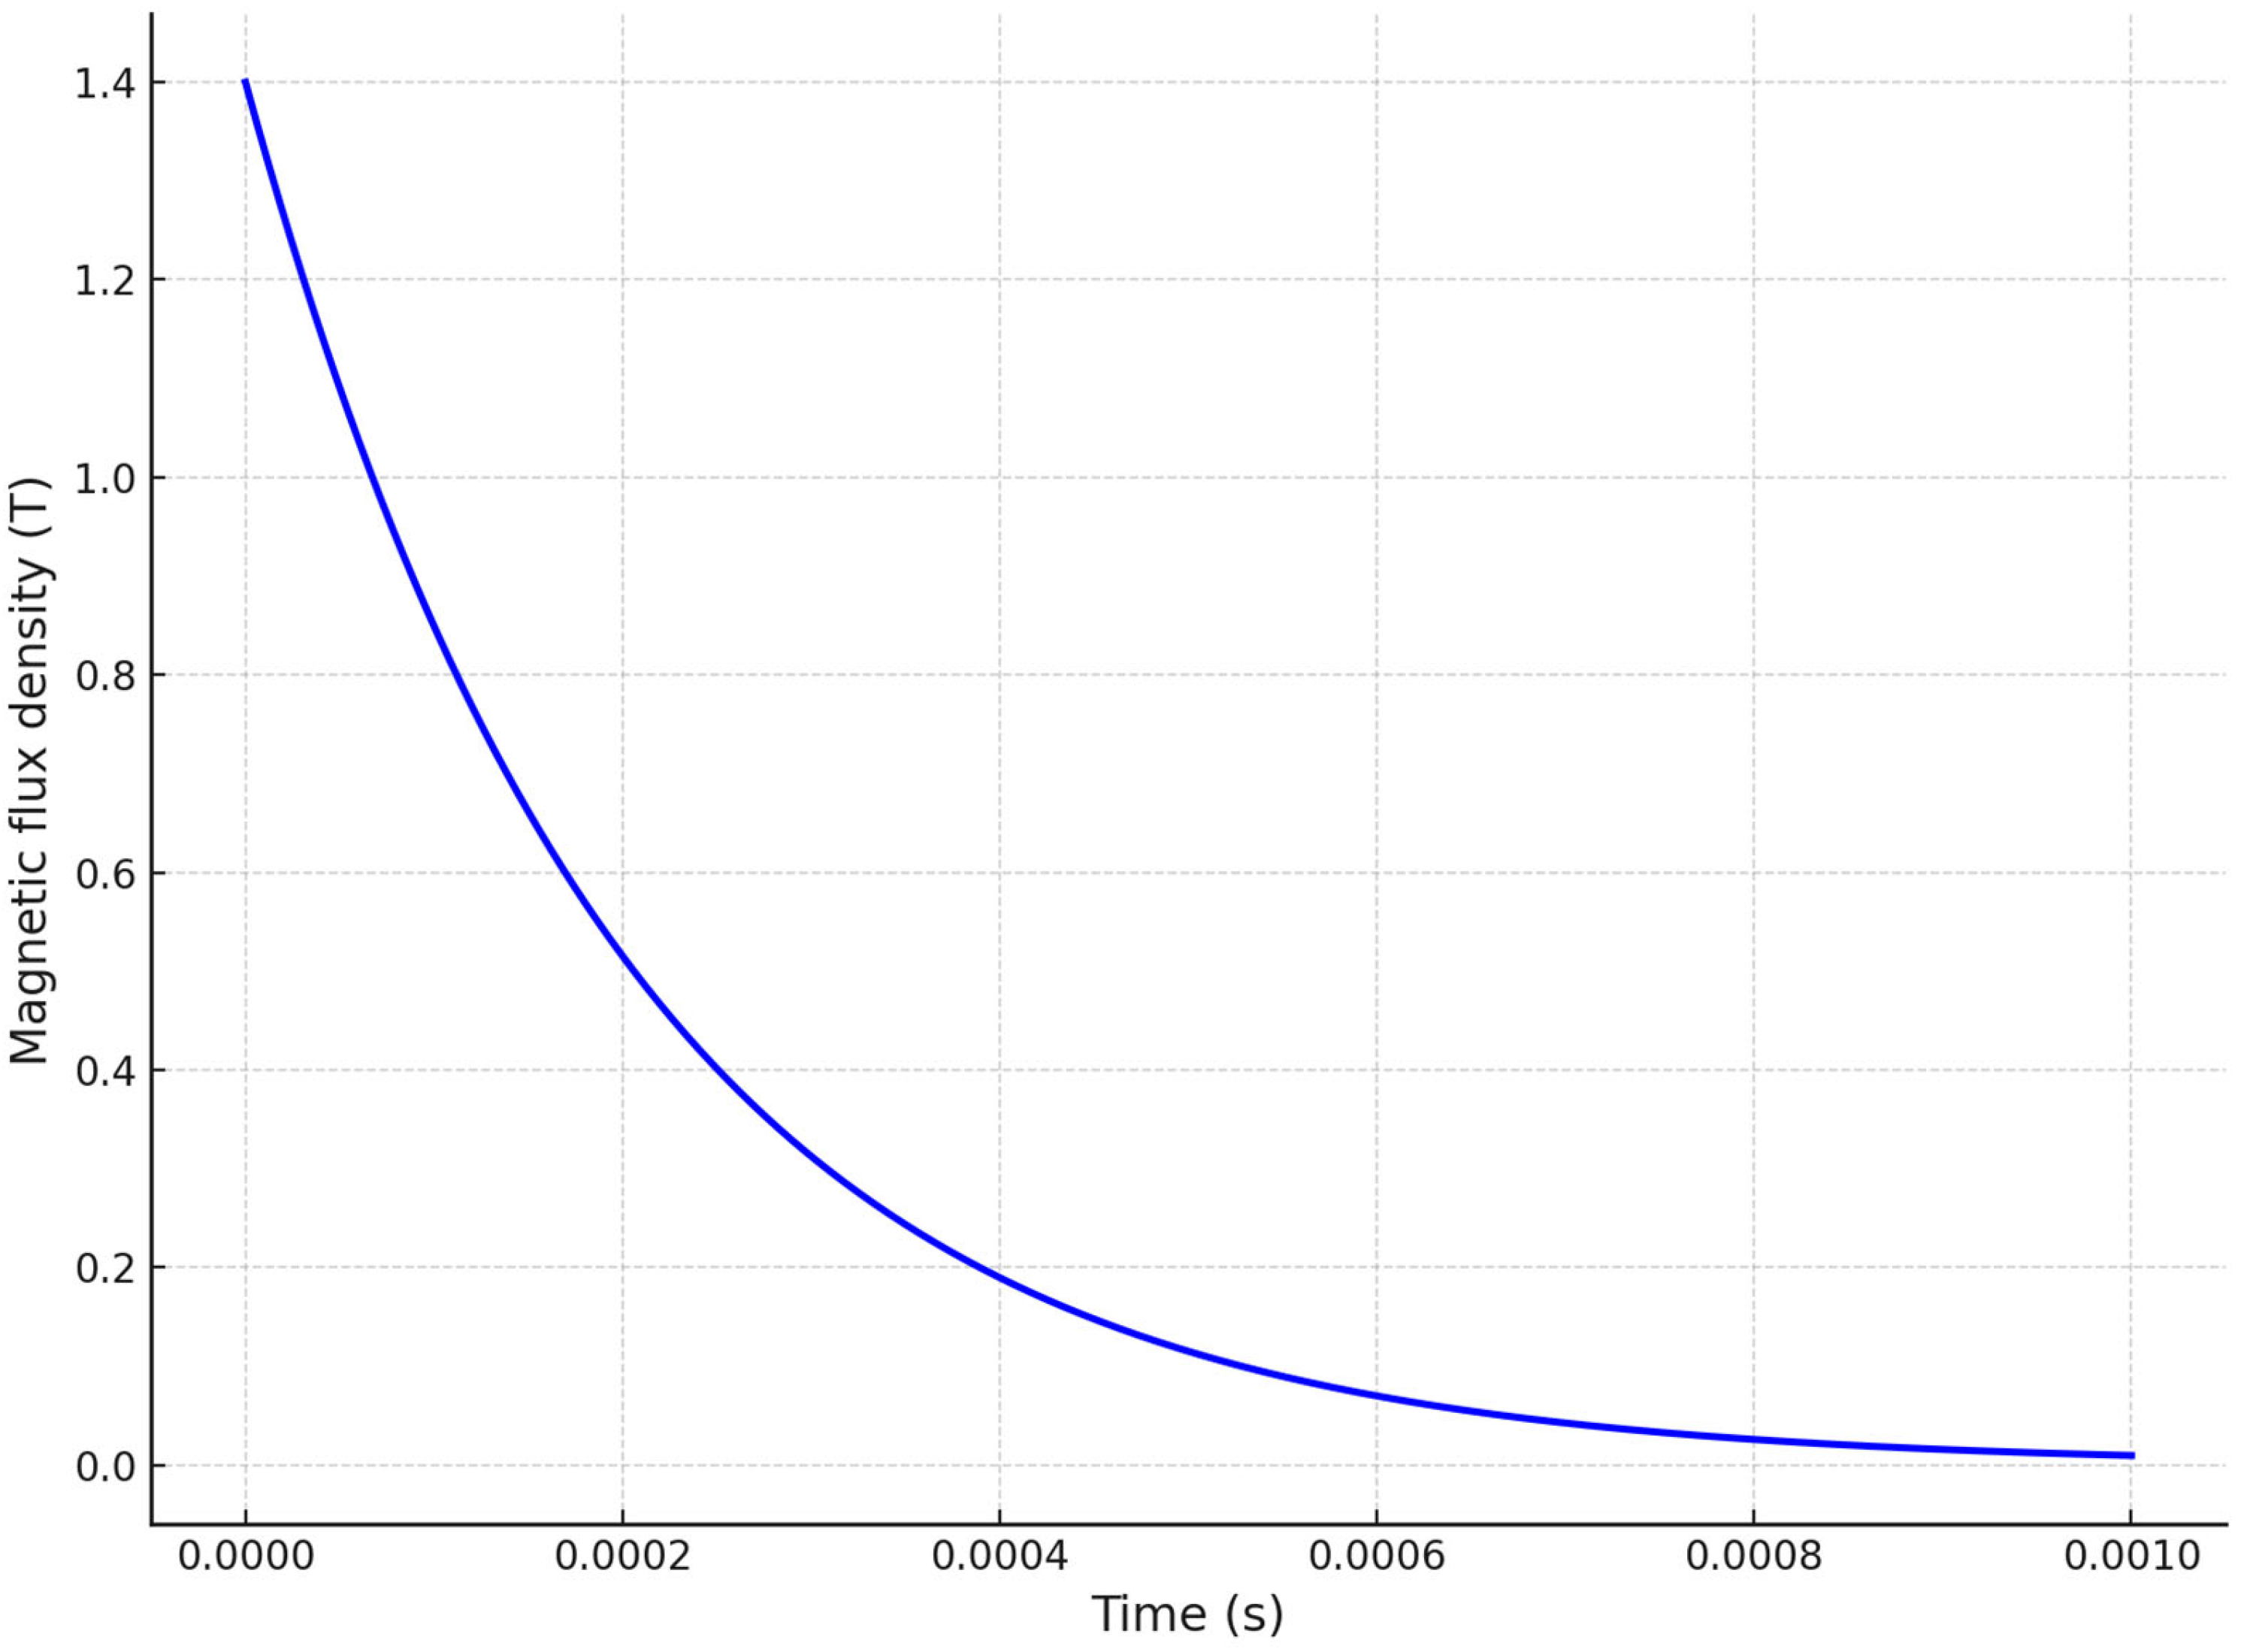
The transient magnetic field, as shown in Figure 11, peaks at ~1.4 T at t = 0, followed by an exponential decay to nearly zero over ~0.9 ms, reflecting the current pulse decay profile. This behavior confirms that the magnetic field closely follows the driving current, indicating minimal delay between current excitation and field generation.

8.2.2. Input Current Pulse vs. Time

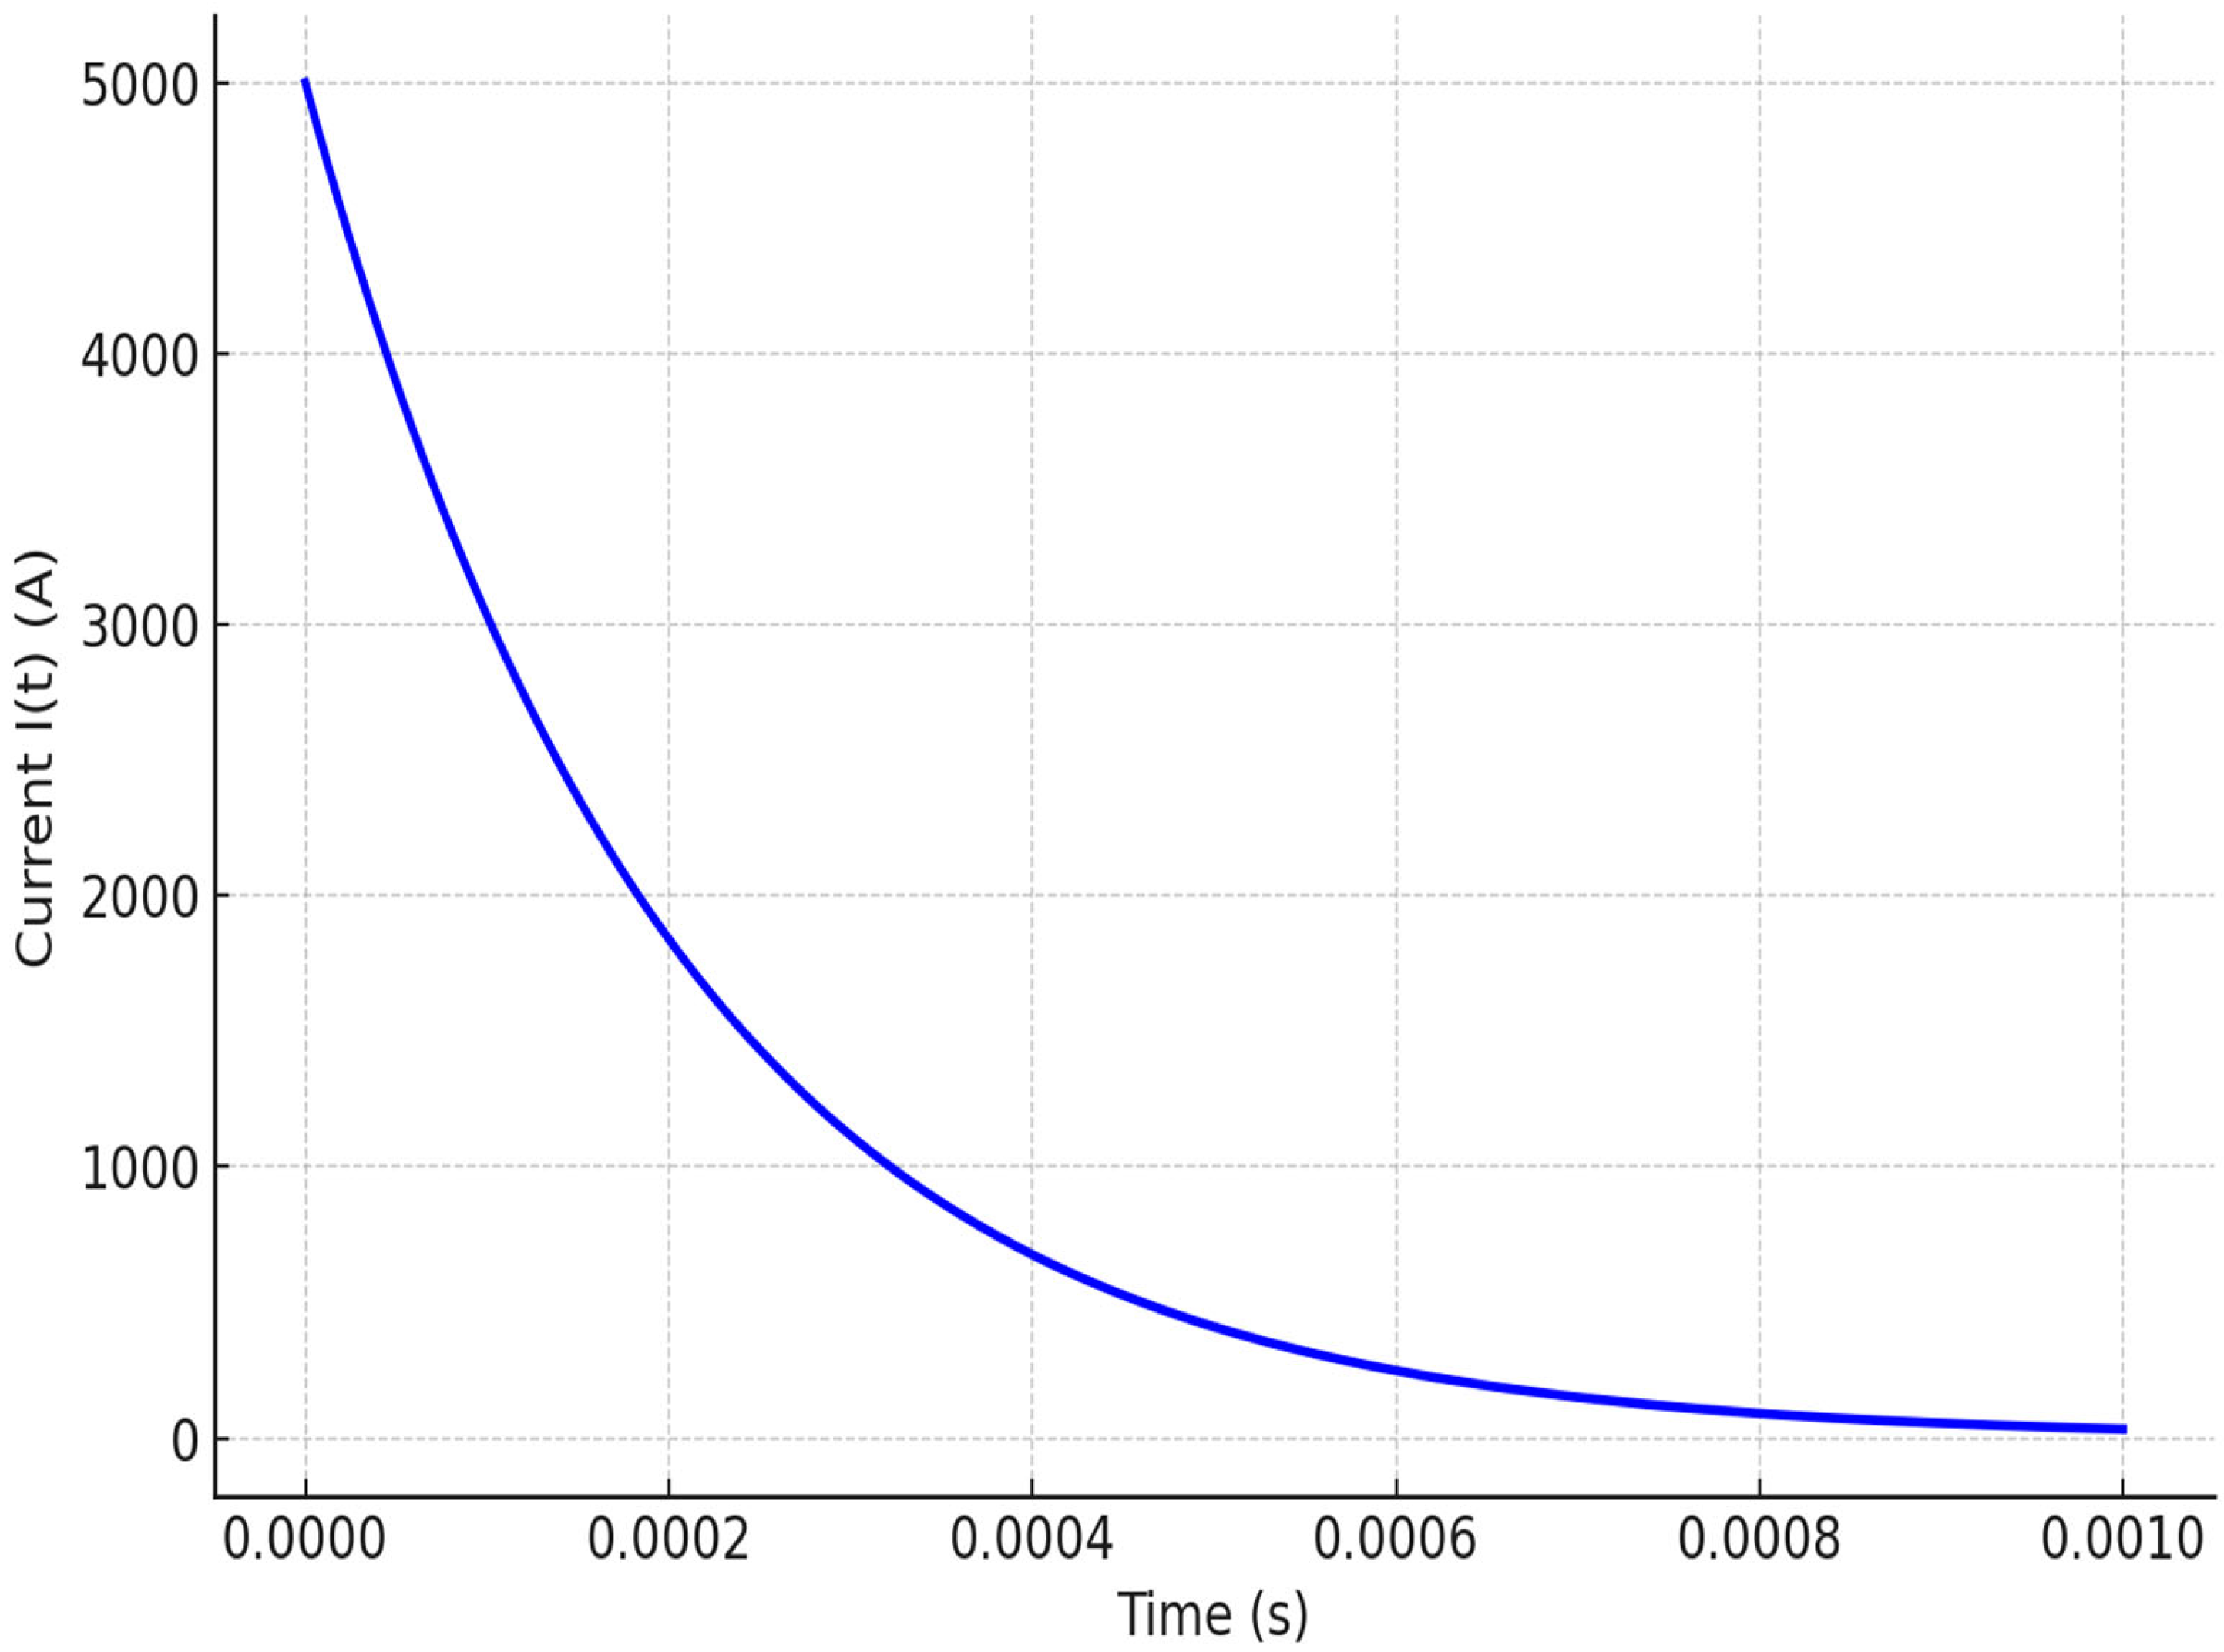
The applied current pulse starts at 5000 A and decays exponentially with the same time constant as the B-field, confirming the accurate definition of the current, as demonstrated in Figure 12. This high initial magnitude produces the necessary strong Lorentz force to induce de-icing vibrations.

8.2.3. Lorentz Force Density Distribution

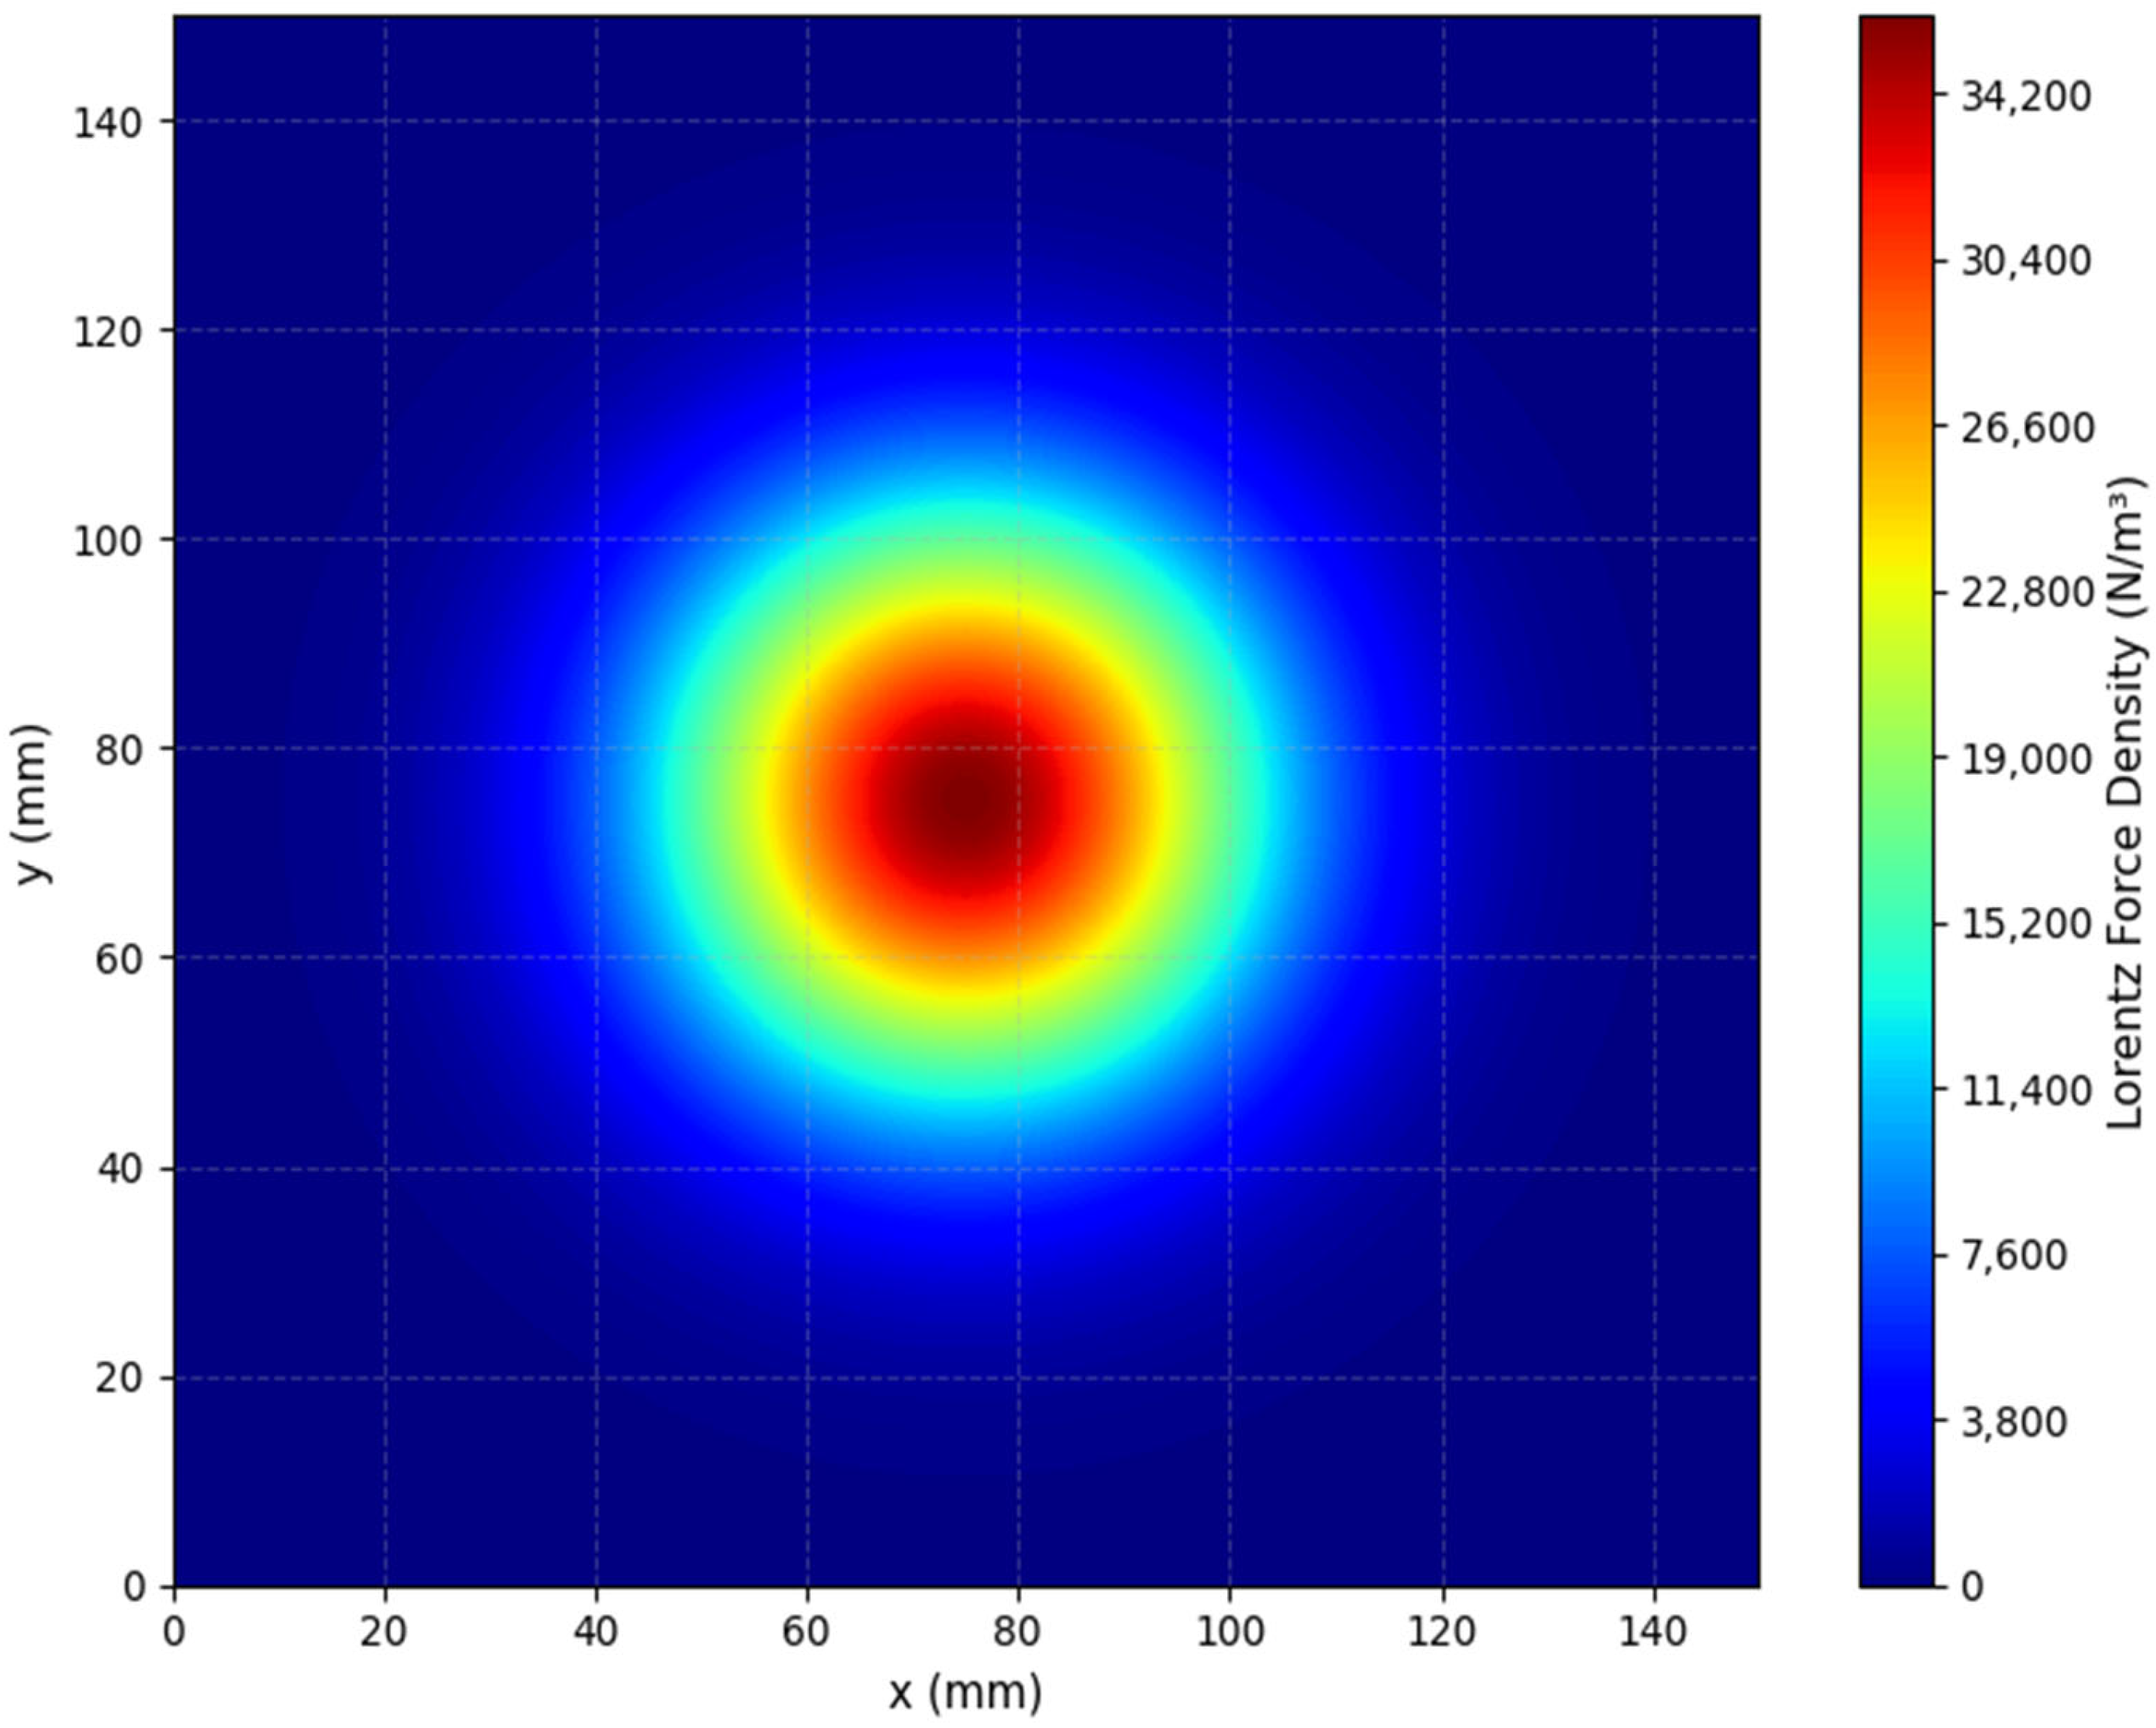
The plot in Figure 13 shows the spatial distribution of Lorentz force density in the plate at peak current excitation. The force is concentrated around the circumference of the coil, with maximum values on the inner and outer periphery of the conductor region.
This distribution indicates that the strongest mechanical impulse is localized near the coil windings. Such localized force application is beneficial for initiating high-frequency flexural waves in the plate, which contributes to the detachment of ice layers. The decay of force magnitude away from the coil confirms the spatially selective nature of electromagnetic excitation.
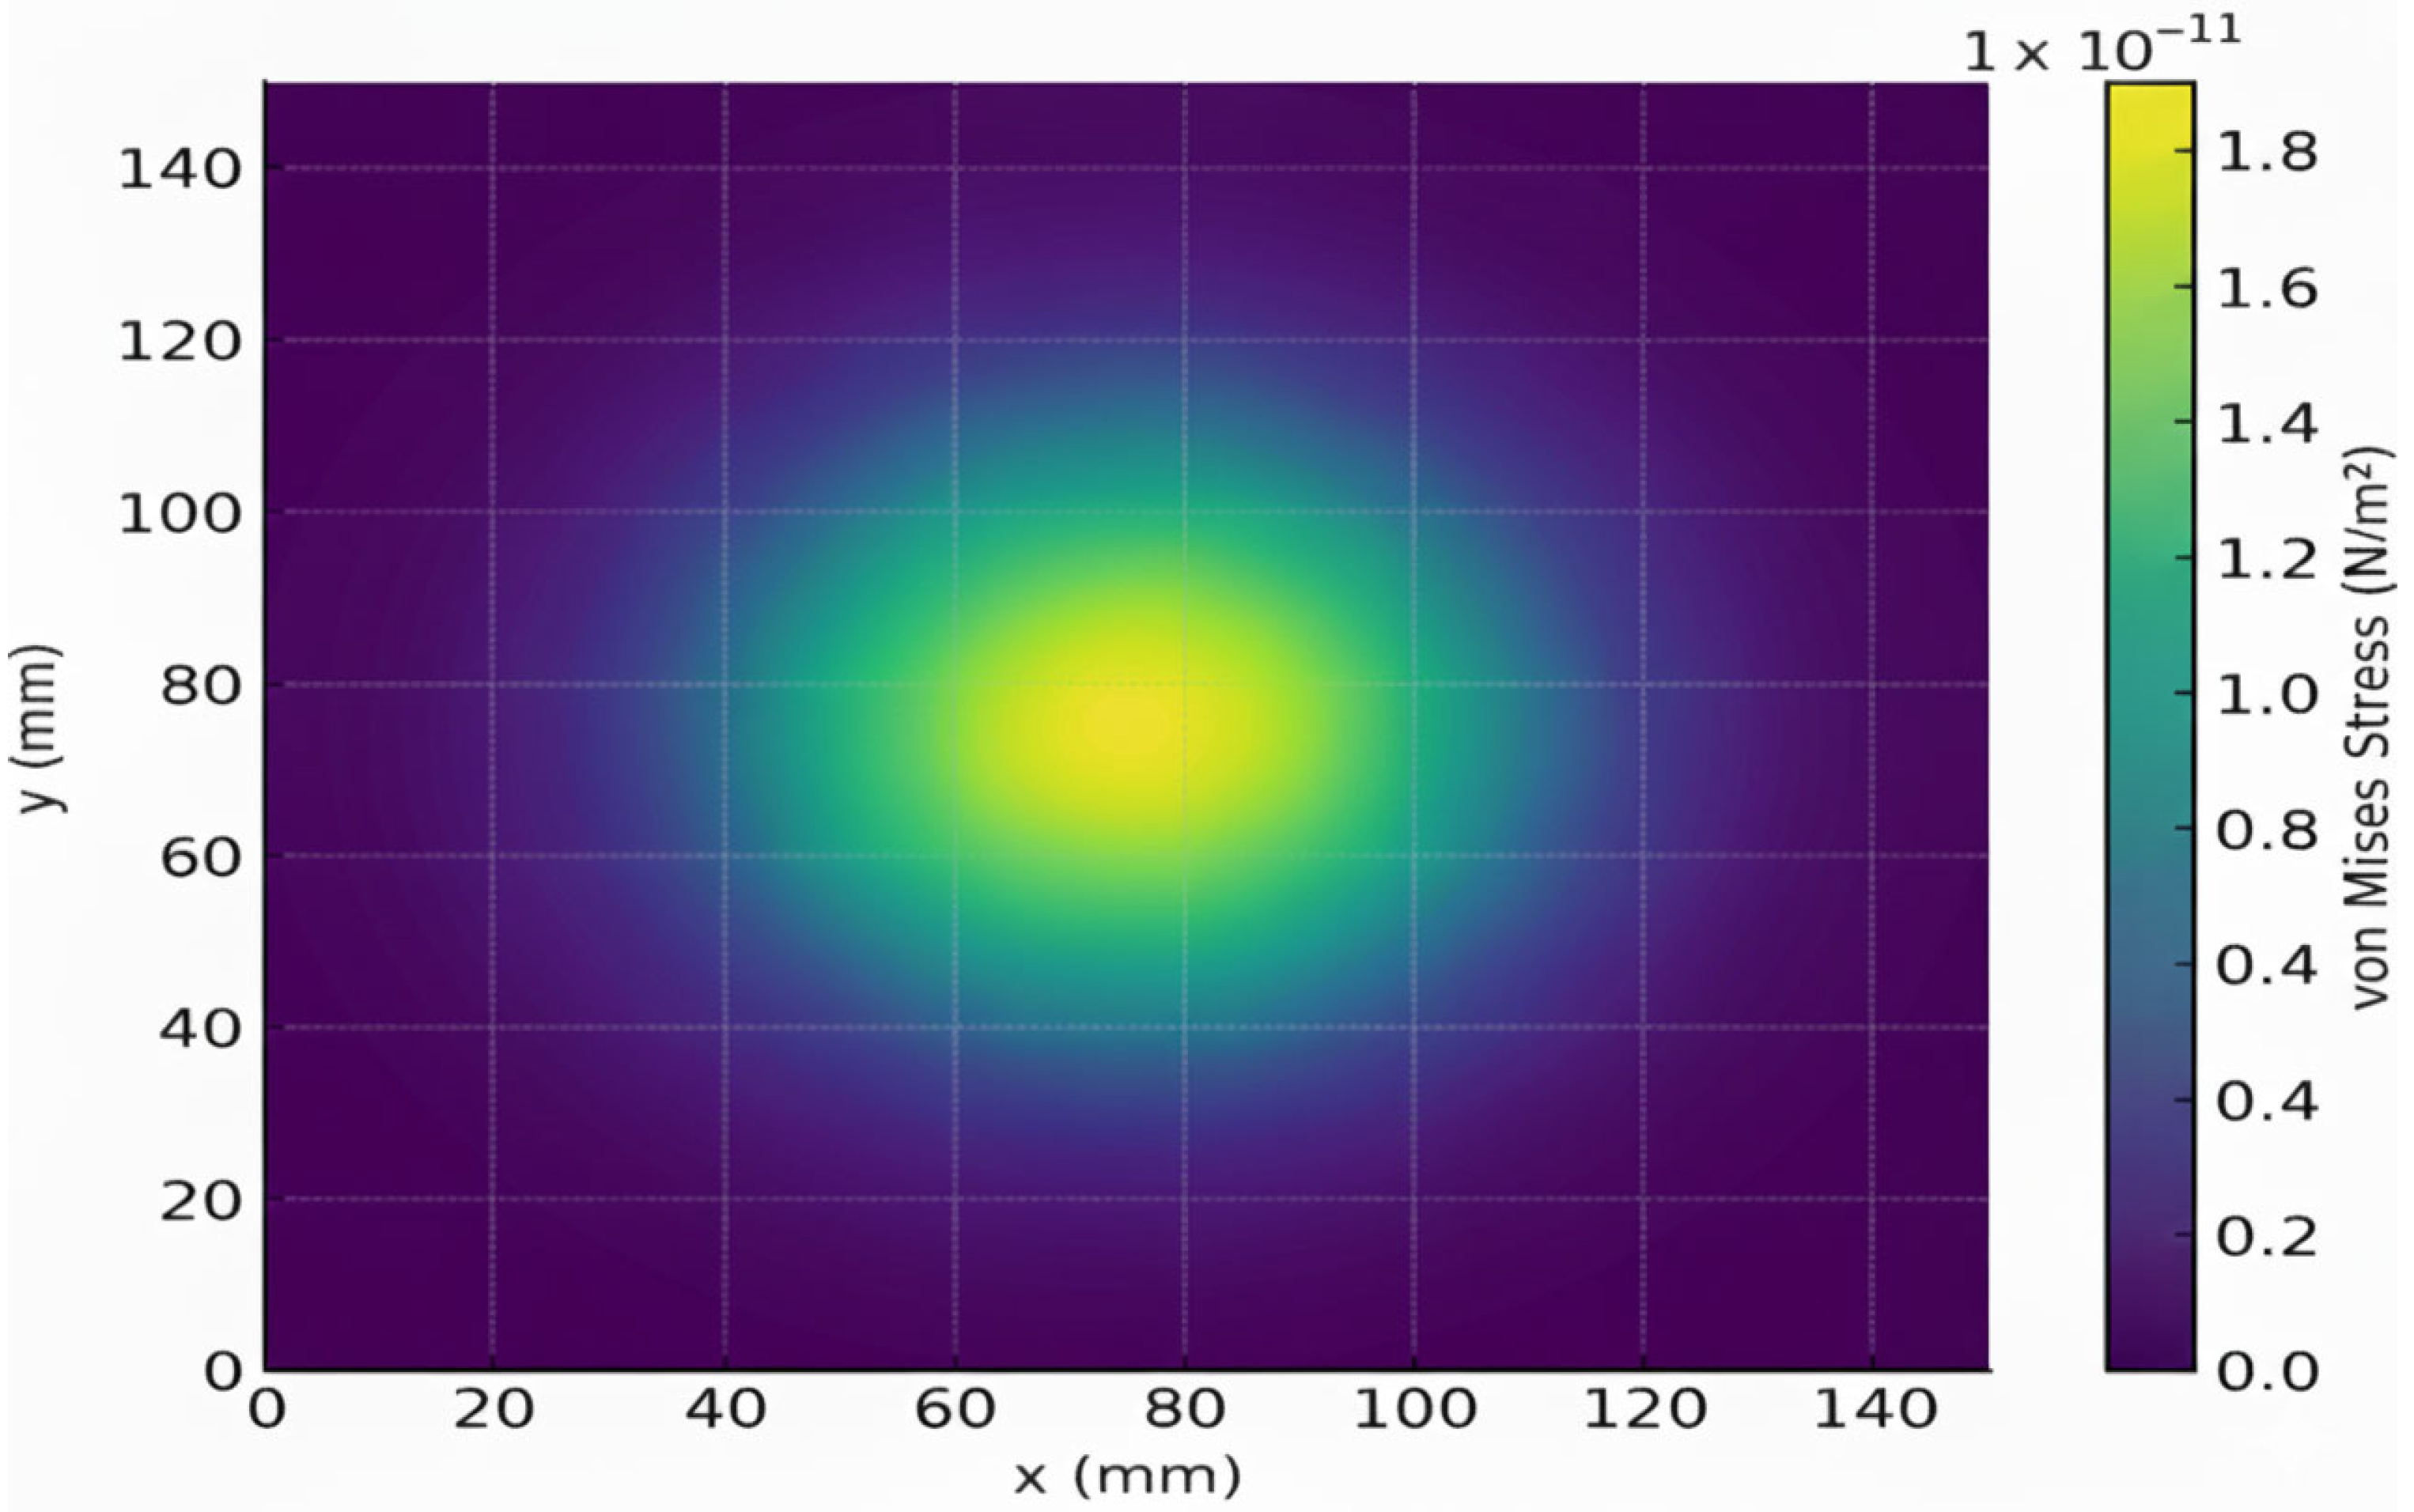
Figure 14 clearly demonstrates the von Mises stress distribution in the aluminum plate during a time-dependent electromagnetic pulse simulation. Localized stress is concentrated around the coil region, where Lorentz forces are most significant. Stress intensity decreases radially outward, indicating minimal mechanical deformation in distant regions. The distribution highlights the coil’s influence on inducing localized elastic strain in the conductive plate.

9. Electromagnetic–Thermomechanical Coupling

The transient coupling between electromagnetic and mechanical fields was analyzed in COMSOL Multiphysics version 6.2, confirming that energy transfer efficiency remains above 85% within the defined pulse duration. The specific impulse energy, defined as energy input per unit de-iced area (J/m2), was estimated between 30 and 45 J/m2, which is consistent with reported EIDI aircraft experiments [31]. Although the process is primarily mechanical, transient Joule heating produces a minor interfacial temperature rise of 3–5 °C, which reduces local ice adhesion and aids fracture propagation [35].

10. Simulation Findings and Discussion

The simulation outcomes confirm the efficacy of Electro-Impulse De-Icing (EIDI) as a precise, non-thermal method for eliminating ice from wind turbine blades. The transient magnetic field and Lorentz force profiles closely mirrored the characteristics of the input pulse, validating the accurate coupling between the electrical and mechanical components. The strong localization of both magnetic flux density and force around the coil area reinforces the concept of directing mechanical impulses at key adhesion points, thereby reducing energy loss and preventing excessive structural stress on the entire blade.
The results highlight some key aspects,
  • Increasing peak current I0 would proportionally scale Lorentz forces.
  • Modifying coil geometry can tailor force distribution to match critical ice adhesion regions.
  • Plate material selection will strongly influence vibration efficiency.
These results are consistent with earlier research, which indicates that localized impulse forces can effectively initiate high-frequency flexural waves, facilitating ice detachment without a significant contribution from thermal energy. Increasing the amplitude of the peak current directly enhances the Lorentz force, providing a simple method for performance improvement. Alterations in coil design and the selection of materials for the conductive layer can additionally affect the efficiency of vibration propagation and the reliability of ice removal.

10.1. Energy Consumption Analysis of EIDI System

The energy required for one electro-impulse event can be estimated from the resistive losses in the coil during the discharge. The instantaneous power dissipated in the coil is expressed as
P t = I t 2 R
where is the time-dependent current, and R is the coil resistance. For a short exponential pulse of duration Tp, the energy dissipated can be approximated as
E P u l s e = 0 T p I t 2 R   d t   ~   I 0 2 · R · T P
where I 0 is the peak discharge current.
E P u l s e = 500 J .
Thus, a single impulse requires approximately 500 J (0.00014 kWh).
At a repetition rate of 5 pulses/min, over one hour and over one day, the electricity consumption will be 0.0417 kWh and 0.167 kWh/day.
  • Daily and Seasonal Operation
For icing conditions requiring 4 h of operation per day over a 5-month season (≈150 days), the total consumption is 25 kWh. This value (25 kWh/season) can be treated as the baseline consumption per coil.
2.
Energy Scaling with Blade Length
If coils are distributed approximately one per meter of blade length along the leading edge, total seasonal energy demand scales linearly.
3.
Energy Consumption under Zone-Based Distribution
Using the baseline seasonal consumption of 25 kWh per coil, the energy demand can be scaled according to the coil placement strategy. For a 50 m blade, for example:
  • Root (0–10 m): 1 coil every 2 m → ~5 coils → 125 kWh/season
  • Mid-span (10–35 m): 1 coil per meter → ~25 coils → 625 kWh/season
  • Tip (35–50 m): 1 coil every 2.5 m → ~6 coils → 150 kWh/season
  • Total: ~36 coils → 900 kWh/season
This is approximately 28% lower than the linear model (1250 kWh), showing that zone-based coil placement significantly reduces energy demand while targeting the most critical aerodynamic and icing zones.
This analysis, as shown in Table 4, indicates that zone-based coil placement yields a more accurate estimate of energy demand compared to uniform scaling. For large blades (50–80 m), the reduction is significant (20–30%) because fewer coils are required at the root and tip, where ice accretion has less impact on performance. Importantly, this aligns with industry practices for sectional heating and impulse control, which prioritize the mid-span leading edge for effective ice mitigation [35,36].
Seasonal energy demand for EIDI systems, as shown in Table 5, exhibits a near-linear increase with both blade length and pulse repetition rate. For smaller blades (30 m), the requirement ranges from ~330 kWh at 3 pulses/min to ~880 kWh at 8 pulses/min, while mid-sized blades (50 m) consume between ~540 kWh and ~1440 kWh under the same conditions. For utility-scale blades of 80 m length, the energy demand can exceed 2.3 MWh per icing season when operated at higher pulse frequencies. These results highlight the trade-off between ensuring reliable de-icing and minimizing energy consumption, emphasizing that optimizing pulse repetition rates is critical for achieving operational efficiency.

10.2. Comparative Energy Consumption Analysis of EIDI, Thermal, and Ultrasonic De-Icing Systems

While Electro-Impulse De-Icing (EIDI) has been primarily evaluated through simulation in this study, its practical relevance can only be understood when compared with other established de-icing methods. Thermal systems remain the most widely implemented technology in wind turbines, but are known for their high energy demand, often several megawatt-hours per season for large blades. Ultrasonic methods, on the other hand, consume orders of magnitude less energy but face limitations in effectiveness against thicker glaze ice. To contextualize the performance of EIDI, a comparative energy consumption study is made across blade lengths of 30–80 m, highlighting its efficiency advantages relative to conventional approaches, as shown in Table 6 below.

10.3. Performance and Energy Assessment of EIDI in Comparison to Thermal and Ultrasonic De-Icing Methods

The energy requirements of de-icing technologies vary substantially depending on the underlying mechanism. In this study, Electro-Impulse De-Icing (EIDI) was estimated to consume approximately 550 kWh, 900 kWh, and 1450 kWh per icing season for 30 m, 50 m, and 80 m blades, respectively, assuming a pulse repetition rate of 5 pulses/min and zone-based coil distribution. These results are consistent with earlier findings, which indicate that EIDI systems achieve effective ice shedding through short, high-current pulses while maintaining comparatively low energy demand [29,30,31].
By contrast, electrothermal systems rely on continuous surface heating across large blade areas, resulting in significantly higher energy requirements. Reported values typically range from 6000 kWh for smaller blades to over 24,000 kWh per season for 80 m blades, depending on heating density and environmental severity [34]. Ultrasonic de-icing methods, on the other hand, demonstrate exceptional energy efficiency, with demands generally reported in the range of 1–8 kWh per season [35]. However, their effectiveness is primarily limited to thin rime ice and is considerably reduced in cases of thicker, strongly bonded glaze ice.
These comparisons emphasize that EIDI offers a compelling balance: while less energy-efficient than ultrasonic systems, it provides robust mechanical effectiveness against severe icing, and at the same time achieves an order-of-magnitude reduction in energy consumption relative to electrothermal approaches. This trade-off underscores the practical potential of EIDI for large-scale wind turbines, particularly in regions with moderate to severe icing conditions, where both reliability and efficiency are crucial.

10.4. Trade-Offs and Practical Considerations

  • Operational Trade-Offs: Anti-Icing, De-Icing, and Hybrid Approaches
Anti-icing systems are prevalent in modern wind farms in cold-climate countries (e.g., Sweden, Finland, Canada) due to their ability to prevent ice accretion, albeit at the expense of continuous high energy demand. De-icing methods like EIDI are more suitable for smaller or legacy turbines, or sites with less frequent icing, since they activate only when needed. Hybrid systems, combining sensor-based anti-icing with EIDI backup, are emerging as a compromise that balances energy use, reliability, and cost-effectiveness.
2.
Energy Consumption Trade-Offs
This study conducted a comparative analysis of energy consumption. Results show that EIDI consumes one order of magnitude less energy than thermal heating while remaining effective against both rime and glaze ice. Ultrasonic methods consume even less energy, but their effectiveness is limited primarily to thin rime ice. This highlights EIDI’s unique position as a compromise between energy efficiency and robustness, making it an attractive option for sites facing moderate to severe icing conditions.
3.
Fatigue and Structural Durability
While EIDI pulses are highly effective in detaching ice, the long-term structural effects of repeated electromagnetic loading must be carefully considered. Localized stress cycling, particularly near fasteners, joints, or embedded coil interfaces, can lead to fatigue accumulation that degrades structural integrity over the course of decades of service. NASA’s Electro-Impulse De-Icing studies have acknowledged test fatigue and electromagnetic interference effects in early design validation work [30]. Moreover, modern wind turbine design standards require fatigue evaluation over the operational lifetime, typically via cycle-counting methods (e.g., rainflow) and damage accumulation (Miner’s rule) to ensure component reliability under variable loads [37]. Given these factors, future work should integrate fatigue life modeling into the EIDI framework linking pulse histories to S-N curves or stochastic damage models to assess whether de-icing pulses meaningfully shorten blade lifetime under realistic duty cycles.
4.
Geometric Simplifications in Modeling
The use of a flat aluminum plate simplifies analysis by isolating electromagnetic-mechanical coupling; however, it does not fully capture the stress localization and wave reflections present in real curved blade sections. As a result, the present results are likely conservative. Extending simulations to NACA airfoil sections and composite laminates will be crucial for more realistic evaluations.
5.
Material Trade-Offs: Aluminum vs. Composites
Aluminum was chosen here for its well-characterized properties and straightforward implementation in COMSOL Multiphysics version 6.2. However, real blades are constructed from CFRP/GFRP composites, which exhibit anisotropic elasticity and lower conductivity. These differences influence both the Lorentz force distribution and stress propagation, indicating that future studies should extend this framework to composite blades for practical applicability.
The comparison of various de-icing methods is presented in Table 7, highlighting energy consumption, effectiveness, and complexity of integration. The findings reveal that although conventional techniques are reliable, they require significant energy, whereas the Electro-Impulse De-Icing (EIDI) system demonstrates greater efficiency and quicker reaction times, rendering it more appropriate for applications in cold climates.

11. Limitations and Future Directions

Although this study provides important insights into the potential of Electro-Impulse De-Icing (EIDI), several limitations must be acknowledged. The simulations were carried out on a flat aluminum plate, rather than on a curved composite blade. This simplification was chosen deliberately, as it offers a controlled and well-defined baseline for understanding the underlying physics of Lorentz force generation and stress propagation. However, in real wind turbine blades, curvature, layered composites, and anisotropic material properties will influence both electromagnetic coupling and stress wave dynamics. The results presented here should therefore be seen as a conservative foundation, with future work directed toward extending the approach to airfoil geometries and composite layups.
Another limitation lies in the purely simulation-based approach. While Multiphysics modeling in COMSOL version 6.2 allows us to capture coupled electromagnetic-mechanical interactions, the absence of experimental validation reduces confidence in directly extrapolating results to field conditions. At the same time, this work provides a valuable first step in narrowing the design space by identifying realistic pulse currents, durations, and repetition rates, thereby reducing the complexity of future laboratory testing. Small-scale experiments, such as impulse testing on aluminum or composite surfaces, are a natural next stage, and the present results provide a solid physics-based justification for such trials.
Finally, the study does not yet fully incorporate the complexity of the operational environment, including temperature fluctuations, wind shear, and humidity. Long-term factors, such as blade fatigue due to repetitive pulsing and coil durability, were also outside the current scope. Recognizing these limitations, however, is a strength: it provides a clear research roadmap for advancing EIDI from simulation to deployment. Extending the model to include environmental coupling, composite materials, and comparative benchmarking with thermal, ultrasonic, and hybrid anti-/de-icing systems will be essential for future work. In this context, the present study should not be viewed as an endpoint but as a necessary foundation. By quantifying force distributions, stress fields, and energy requirements in a simplified but transparent setup, this work provides the baseline data needed to guide experimental validation and system integration. The limitations identified here directly point to the next steps required to translate EIDI into a reliable, scalable, and energy-efficient solution for wind turbines in cold climates. Future developments will explore hybrid architectures coupling EIDI with smart sensing and electro-thermal pre-heating modules for adaptive, energy-optimized operation.

12. Concluding Remarks

This study analyzed the impacts of icing on wind turbine blades and evaluated the Electro-Impulse De-Icing (EIDI) method through Multiphysics simulations. Ice accretion was shown to reduce lift, increase drag, and cause energy losses of up to 37.5%. EIDI generated Lorentz force densities on the order of 4 × 10⁴ N/m3, with a pulse setup (5000 A, 400 µs, 5 pulses/min) requiring only ~900 kWh per season for a 50 m blade. This represents an order of magnitude less energy than thermal systems (~13,000 kWh) while retaining effectiveness against both rime and glaze ice.
The results demonstrate EIDI’s potential as an energy-efficient and robust de-icing solution, offering significantly lower energy demand than thermal methods and greater reliability than ultrasonic techniques. While simplifications such as flat aluminum plate modeling were employed, the study provides a reproducible baseline for electromagnetic-mechanical coupling in de-icing. Future extensions should include composite blades, realistic environmental conditions, and experimental validation. Moreover, EIDI may be most effective as part of hybrid anti-/de-icing architectures, combining efficiency with operational reliability for cold-climate wind farms.

Author Contributions

Conceptualization, S.P. and A.S.; methodology, S.P.; software, S.P. and A.S.; validation, S.P. and A.S.; formal analysis, S.P. and A.S.; investigation, S.P. and A.S.; resources, S.P. and A.S.; data curation, S.P. and A.S.; writing—original draft preparation, S.P. and A.S.; writing—review and editing, S.P. and A.S.; visualization, S.P. and A.S.; supervision, A.A.K.; project administration, S.P. and A.S. All authors have read and agreed to the published version of the manuscript.

Funding

This research was supported by Memorial Seed Funds.

Data Availability Statement

The original contributions presented in this study are included in the article. Further inquiries can be directed to the corresponding author.

Conflicts of Interest

The authors declare no conflict of interest.

References

  1. WindEurope. Wind Energy in Europe: Scenarios for 2030; WindEurope: Brussels, Belgium, 2017. [Google Scholar]
  2. National Energy Board. Canada’s Energy Future: Energy Supply and Demand Projections to 2035. An Energy Market Assessment 2011; National Energy Board: Calgary, AB, Canada, 2011. [Google Scholar]
  3. Bevrani, H.; Afzal, F.; Virk, M.S. Review of Icing Effects on Wind Turbine in Cold Regions. E3S Web Conf. 2018, 72, 01007. [Google Scholar]
  4. Castellani, F.; Astolfi, D. Editorial on Special Issue ‘Wind Turbine Power Optimization Technology’. Energies 2020, 13, 1796. [Google Scholar] [CrossRef]
  5. Madi, E.; Pope, K.; Huang, W.; Iqbal, T. A review of integrating ice detection and mitigation for wind turbine blades. Renew. Sustain. Energy Rev. 2019, 103, 269–281. [Google Scholar] [CrossRef]
  6. Gao, L.; Hu, H. Wind turbine icing characteristics and icing-induced power losses to utility-scale wind turbines. Proc. Natl. Acad. Sci. USA 2021, 118, e2111461118. [Google Scholar] [CrossRef]
  7. Davis, N.; Hahmann, A.N.; Clausen, N.-E.; Žagar, M. Forecast of Icing Events at a Wind Farm in Sweden. J. Appl. Meteorol. Climatol. 2014, 53, 262–281. [Google Scholar] [CrossRef]
  8. Pérez, J.M.P.; Márquez, F.P.G.; Hernández, D.R. Economic viability analysis for icing blades detection in wind turbines. J. Clean. Prod. 2016, 135, 1150–1160. [Google Scholar] [CrossRef]
  9. Hu, Q.; Hu, Z.; Li, B.; Fu, X.; Rao, L.; Duan, J. The Rapid Computational Model for Power Output of Ice-covered Wind Turbines Based on Airfoil Aerodynamic Parameters. In Proceedings of the 2023 IEEE Sustainable Power and Energy Conference (ISPEC), Chongqing, China, 28–30 November 2023; pp. 1–6. [Google Scholar] [CrossRef]
  10. Lin, X.; Zheng, R.; Xu, L.; Wang, C.; Wu, T.; Yang, W.; Liao, Z.; Kang, P. Design of Steam Thermal Deicing Control System for Wind Turbine Blades Based on BP Neural Network Algorithm. In Proceedings of the 2023 International Conference on Power, Electrical Engineering, Electronics and Control (PEEEC), Athens, Greece, 25–27 September 2023; pp. 565–570. [Google Scholar] [CrossRef]
  11. Wang, F.; Niu, L.; Wang, T.; Ye, L. Wind Turbine Blade Icing Monitoring, De-Icing and Wear Prediction Device Based on Machine Vision Recognition Algorithm. In Proceedings of the 2024 IEEE 2nd International Conference on Control, Electronics and Computer Technology (ICCECT), Jilin, China, 26–28 April 2024; pp. 687–694. [Google Scholar] [CrossRef]
  12. Luo, J.; Yang, H.; Chen, X.; Huang, L.; Li, B.; Hu, H. Design of a Flexible Icing Monitoring Sensor with Dielectric Shift”. In Proceedings of the 2024 14th International Conference on Power and Energy Systems (ICPES), Chengdu, China, 13–16 December 2024; pp. 193–197. [Google Scholar] [CrossRef]
  13. Huang, T.; Jiang, X.; Chen, Y.; Wang, M. Experimental Study on Electro-Impulse De-Icing of Wind Turbine Blades. In Proceedings of the 6th Asia Conf. Power and Electrical Engineering (ACPEE), Chongqing, China, 8–11 April 2021; pp. 205–210. [Google Scholar] [CrossRef]
  14. Jin, X.; Zhang, X.; Cheng, X.; Jiang, G. A Physics-Based and Data-Driven Feature Extraction Model for Blades Icing Detection of Wind Turbines. IEEE Sens. J. 2023, 23, 3944–3955. [Google Scholar] [CrossRef]
  15. Chuang, Z.; Yi, H.; Chang, X.; Liu, H.; Zhang, H.; Xia, L. Comprehensive Analysis of the Impact of the Icing of Wind Turbine Blades on Power Loss in Cold Regions. J. Mar. Sci. Eng. 2023, 11, 1125. [Google Scholar] [CrossRef]
  16. Zhang, Z.; Zhang, H.; Zhang, X.; Hu, Q.; Jiang, X. A Review of Wind Turbine Icing and Anti/De-Icing Technologies. Energies 2024, 7, 2805. [Google Scholar] [CrossRef]
  17. Apata, O.; Mavende, T. An Overview of Power Loss Estimation in Wind Turbines Due to Icing. In Wind Turbines-Design, Control and Applications; IntechOpen: London, UK, 2024. [Google Scholar] [CrossRef]
  18. Yu, D.; Si, G.; Kong, X.; Wen, J.; Chen, F.; Zhang, D.; Cao, T. Icing mechanism and prediction analysis of fan blades. Chin. J. Comput. Mech. 2021, 38, 27–336. (In Chinese) [Google Scholar]
  19. Etemaddar, M.; Hansen, M.O.L.; Moan, T. Wind turbine aerodynamic response under atmospheric icing conditions. Wind Energy 2014, 17, 241–265. [Google Scholar] [CrossRef]
  20. Zhang, Z.; Zhang, H.; Yue, S.; Zeng, W. A Review of Icing and Anti-Icing Technology for Transmission Lines. Energies 2023, 16, 601. [Google Scholar] [CrossRef]
  21. Zhang, Z.; Zhang, H.; Yue, S.; Zhang, X.; Li, C.; Zeng, W. Growth characteristics and influence analysis of insulator strings in natural icing. Electr. Power Syst. Res. 2024, 228, 110097. [Google Scholar] [CrossRef]
  22. Gao, L.; Liu, Y.; Zhou, W.; Hu, H. An experimental study on the aerodynamic performance degradation of a wind turbine blade model induced by ice accretion process. Renew. Energy 2019, 133, 663–675. [Google Scholar] [CrossRef]
  23. Petrenko, K.B.; Whitworth, R.W. Physics of Ice; Oxford University Press: Oxford, UK, 1999. [Google Scholar]
  24. Aliaga, C.; Aubé, J.; Habashi, W.G. FENSAP-ICE-Unsteady: Unified in-flight icing simulation methodology for aircraft, rotorcraft and jet engines. J. Aircr. 2010, 47, 925–938. [Google Scholar] [CrossRef]
  25. Myers, T. Extension to the Messinger model for aircraft icing. AIAA J. 2001, 39, 211–218. [Google Scholar] [CrossRef]
  26. Caccia, F.; Guardone, A. Numerical simulations of ice accretion on wind turbine blades: Are performance losses due to ice shape or surface roughness? Wind. Energy Sci. 2023, 8, 341–362. [Google Scholar] [CrossRef]
  27. Addy, H.E., Jr. Ice Accretions and Their Aerodynamic Effects on Wings and Airfoils; NASA Glenn Research Center Report NASA/TP-2000-210031; NASA Glenn Research Center: Cleveland, OH, USA, 2000. [Google Scholar]
  28. Ozcer, N.; Schnell, P.B.; Fleming, M.S. Aerodynamic performance degradation of iced NACA 2412 airfoil under varying ice thickness. Cold Reg. Sci. Technol. 2021, 188, 103425. [Google Scholar]
  29. Jiang, J.; Wang, Y. Studies on the Electro-Impulse De-Icing System of Aircraft. Aerospace 2019, 6, 67. [Google Scholar] [CrossRef]
  30. Zumwalt, G.W. Electro-Impulse De-Ice Testing Analysis and Design; NASA Contractor Report 1799; NASA Scientific and Technical Information Division: Washington, DC, USA, 1988. [Google Scholar]
  31. Guan, X.; Zhang, H.; Shi, Y.; Wang, Z. Numerical and experimental study on the fracture characteristics of electro-impulse de-icing for aircraft wings. Eng. Fract. Mech. 2025, 295, 110555. [Google Scholar]
  32. Velkoff, V.; Ketcham, A. Electro-Impulse De-Icing of Aircraft Structures; NASA Contractor Report CR-1799; NASA Lewis Research Center: Cleveland, OH, USA, 1968. [Google Scholar]
  33. Power, D. Electro-Impulse De-Icing System for Aircraft; NASA Contractor Report 195459; NASA Lewis Research Center: Cleveland, OH, USA, 1995. [Google Scholar]
  34. Goraj, Z. An overview of the deicing and antiicing technologies with prospects for the future. In Proceedings of the 25th International Congress of the Aeronautical Sciences (ICAS), Yokohama, Japan, 29 August–3 September 2004; p. 547. [Google Scholar]
  35. Palacios, J.; Smith, C.; Brown, D.C. Development of an electro-thermal anti-icing system for wind turbine blades. J. Sol. Energy Eng. 2011, 133, 011007. [Google Scholar]
  36. Quayson-Sackey, E.; Endalew, T.A.; Jonkman, J.M. Technological advancements for anti-icing and de-icing blade section control. Cold Reg. Sci. Technol. 2024, 226, 104070. [Google Scholar] [CrossRef]
  37. IEC 61400-1:2019; Wind Turbines—Design Requirements. International Electrotechnical Commission: Geneva, Switzerland, 2019.
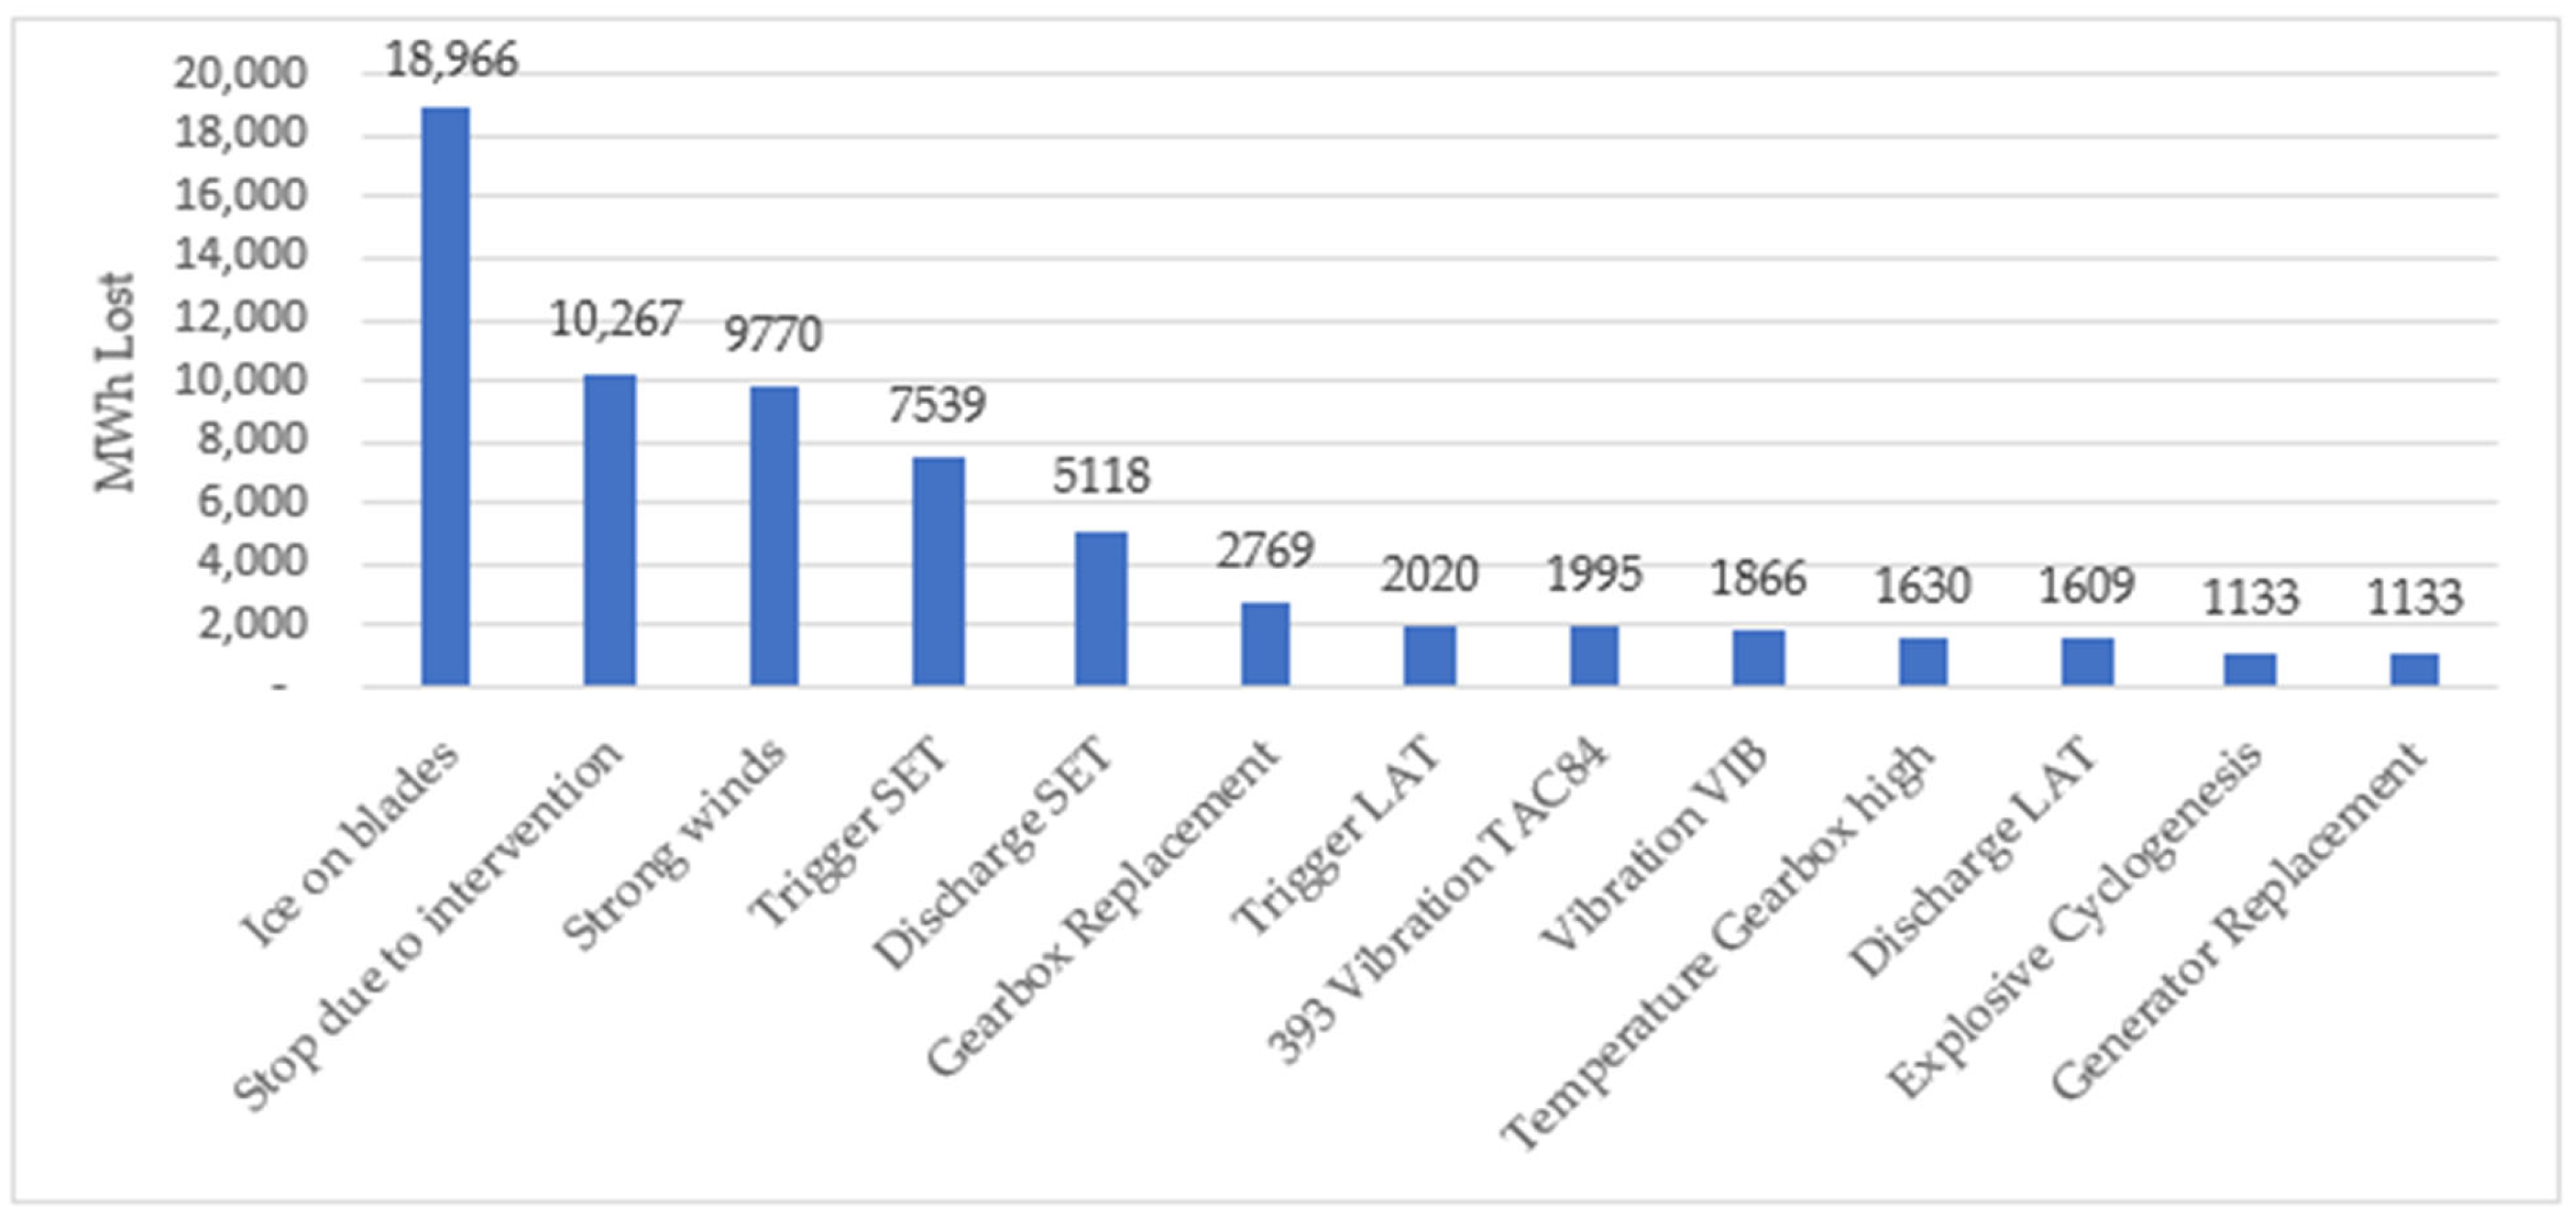
Figure 1. Generation loss statistics caused by various faults [8].
Energies 18 05486 g001
Figure 2. Relationship between icing and wind speed. (a) Icing mass at different wind speeds. (b) Maximum icing thickness at different wind speeds [18].
Energies 18 05486 g002
Figure 3. The relationship between icing mass, maximum icing thickness, and temperature. (a) Icing thickness at various temperatures. (b) Icing mass at various temperatures [18].
Energies 18 05486 g003
Figure 4. Wind turbine power output in normal vs. icing conditions.
Energies 18 05486 g004
Figure 5. NACA 2412 airfoil Model.
Energies 18 05486 g005
Figure 6. Surface plot of velocity magnitude (m/s) around a NACA airfoil profile.
Energies 18 05486 g006
Figure 7. Pressure contour distribution around a NACA 2412 airfoil at steady-state flow.
Energies 18 05486 g007
Figure 8. Clean vs. Iced Condition: Lift and Stall Behavior Comparison (Ice thickness 3–5 mm).
Energies 18 05486 g008
Figure 9. Simple electric pulse coil discharge circuit design.
Energies 18 05486 g009
Figure 10. Finite element mesh of the aluminum plate and copper coil assembly used in the electro-impulse de-icing simulation. A denser mesh is applied around the coil region to accurately capture localized electromagnetic field gradients.
Energies 18 05486 g010
Figure 11. Time-dependent magnetic flux density norm at the coil region, showing an exponential decay from ~1.4 T to near zero within 0.9 ms.
Energies 18 05486 g011
Figure 12. Applied exponentially decaying current pulse, defined analytically in COMSOL, starting at 5000 A with τ = 200 µs.
Energies 18 05486 g012
Figure 13. Lorentz force density distribution at peak excitation in the aluminum plate, illustrating localized mechanical impulse zones around the coil windings.
Energies 18 05486 g013
Figure 14. Time-dependent von Mises stress distribution (N/m2) in the aluminum plate at peak Lorentz force, illustrating localized stress concentration around the coil region.
Energies 18 05486 g014
Table 1. Comparative Analysis Between Different Techniques [5].
TechniquePrincipleEnergy UseEffectivenessIntegration
Complexity
Electric HeatingResistive heatingHighHighModerate
Electro-Impulse (EIDI)Magnetic shock pulseLowHighHigh
Ultrasonic
Vibrations
Acoustic vibrationLowModerateModerate
Mechanical
Actuators
Blade surface movementMediumModerateHigh
Pneumatic BootsSurface inflationMediumModerateModerate
Intelligent Hybrid SystemsSensor-driven optimizedVariableHighHigh
Table 2. Material Properties Used in Simulation.
MaterialPropertyValueUnit
Aluminum PlateElectrical Conductivity3.5 × 107S/m
Density2700kg/m3
Young’s Modulus70GPa
Poisson’s Ratio0.33-
Copper CoilElectrical Conductivity5.8 × 107S/m
Turns per Coil10-
Coil Radius30mm
Table 3. Simulation Parameters.
ParameterValueUnitDescription
I 0 5000APeak current amplitude
τ 2 × 10 4 sDecay time constant
Tp 4 × 10 4 sPulse duration (for reference)
Table 4. Seasonal energy consumption of EIDI systems for different blade lengths under linear and zone-based scaling assumptions.
Blade Length (m)Linear Scaling (kWh/Season)Zone-Based Scaling
(kWh/Season)
30 m~750~540
50 m~1250~900
80 m~2000~1450
Table 5. Seasonal energy consumption (kWh) of Electro-Impulse De-Icing (EIDI) systems as a function of blade length and pulse repetition rate.
Blade Length (m)Pulse Rate
(Pulses/Min)
Seasonal Energy
(kWh)
303330
305550
308880
503540
505900
5081440
803870
8051450
8082320
Table 6. Comparative seasonal energy demand (kWh) of electro-impulse de-icing (EIDI), thermal heating, and ultrasonic vibration systems across wind turbine blade lengths of 30–80 m.
Blade Length (m)MethodSeasonal Energy (kWh)
30EIDI (5 pulses/min)550
30Thermal~8000
30Ultrasonic~3.5
50EIDI (5 pulses/min)900
50Thermal~13,000
50Ultrasonic~4.5
80EIDI (5 pulses/min)1450
80Thermal~19,500
80Ultrasonic~6.0
Table 7. Comparative evaluation of de-icing methods for wind turbine blades.
MethodEnergy Demand (kWh/Season, 50 m Blade)Reliability
(Ice Types)
Fatigue/Structural ImpactIntegration ComplexityKey Trade-Offs
EIDI~900 (5 pulses/min) High (rime + glaze)Possible fatigue near joints under repeated impulses Moderate (coils, capacitors, HV safety)Efficient vs. thermal, less effective than anti-icing, structural fatigue requires study
Thermal~13,000 High (all ice types)Minimal fatigue, but long-term heating may degrade coatingsHigh (large heating mats, high power draw)Reliable but very energy-intensive
Ultrasonic~4–5 Moderate (rime ice only)Low fatigue, but adhesives can degradeHigh (actuator integration, bonding reliability)Ultra-low energy but limited effectiveness for thick glaze ice
Hybrid6000–10,000 Very High (sensor-triggered)Low-Moderate (depends on subsystem)Very High (complex control + integration)Balances prevention + removal, but cost and system complexity are high
Disclaimer/Publisher’s Note: The statements, opinions and data contained in all publications are solely those of the individual author(s) and contributor(s) and not of MDPI and/or the editor(s). MDPI and/or the editor(s) disclaim responsibility for any injury to people or property resulting from any ideas, methods, instructions or products referred to in the content.