Article

Deterioration of Exhaust Emissions in Ageing Gasoline Vehicles Assessed by RDE Testing

1
Faculty of Civil and Transport Engineering, Poznan University of Technology, 60-965 Poznan, Poland
2
Faculty of Transport, Warsaw University of Technology, 00-662 Warszawa, Poland
*
Author to whom correspondence should be addressed.
Energies 2025, 18(21), 5822; https://doi.org/10.3390/en18215822
Submission received: 28 September 2025 / Revised: 31 October 2025 / Accepted: 3 November 2025 / Published: 4 November 2025
(This article belongs to the Special Issue Performance and Emissions of Vehicles and Internal Combustion Engines)

Abstract

The paper assesses the change in air pollutant emissions from a petrol passenger vehicle with changing mileage. The search for solutions enabling the assessment of the change in air pollutant emissions, considering the phenomenon of vehicle ageing, justifies the need to verify the actual air pollutant emissions from used vehicles. The fleet of vehicles used in Poland has an operational age exceeding 12 years, and the number of vehicles imported from Western Europe each year reaches almost 1 million. The research method used in the paper included conducting road tests, known as real driving emissions (RDE) tests of air pollutant emissions for a single vehicle, at different times and with various mileages. The petrol vehicle was operated by one driver whose driving style and routes were comparable and constant throughout the year. The RDE results were compared with data specifying the vehicle’s operating age and mileage to verify the research hypothesis, assuming increased emissions with increasing vehicle mileage. The emissions of basic air pollutants were determined as part of the research conducted using specialist equipment. The research results were obtained for one vehicle, and the experiment was carried out over several years. The results show differences in the emissions of selected chemical compounds depending on the petrol vehicle’s mileage and operating age while ensuring comparable driving technique and operation of one vehicle over a longer time period of 8 years. The vehicle’s age and mileage influence air pollutant emissions. The obtained results show a change in the emission of selected chemical compounds depending on the mileage, thereby confirming the validity of the adopted hypothesis.

1. Introduction

Road transport, alongside the energy industry, is the main source of air pollutant emissions in Europe. Despite reduced emissions of harmful exhaust compounds in the European Union since 1990 (CO by 90%, NOx by 66%, NMVOC by 90%, PM2.5 by 47%), transport still accounts for 39% of NOx emissions, 11% of PM2.5 emissions and 37% of CO emissions. Further steps should include the creation of a balanced climate and health policy (including programmes such as Fit for 55, Euro 7, and the development of electromobility) [1].
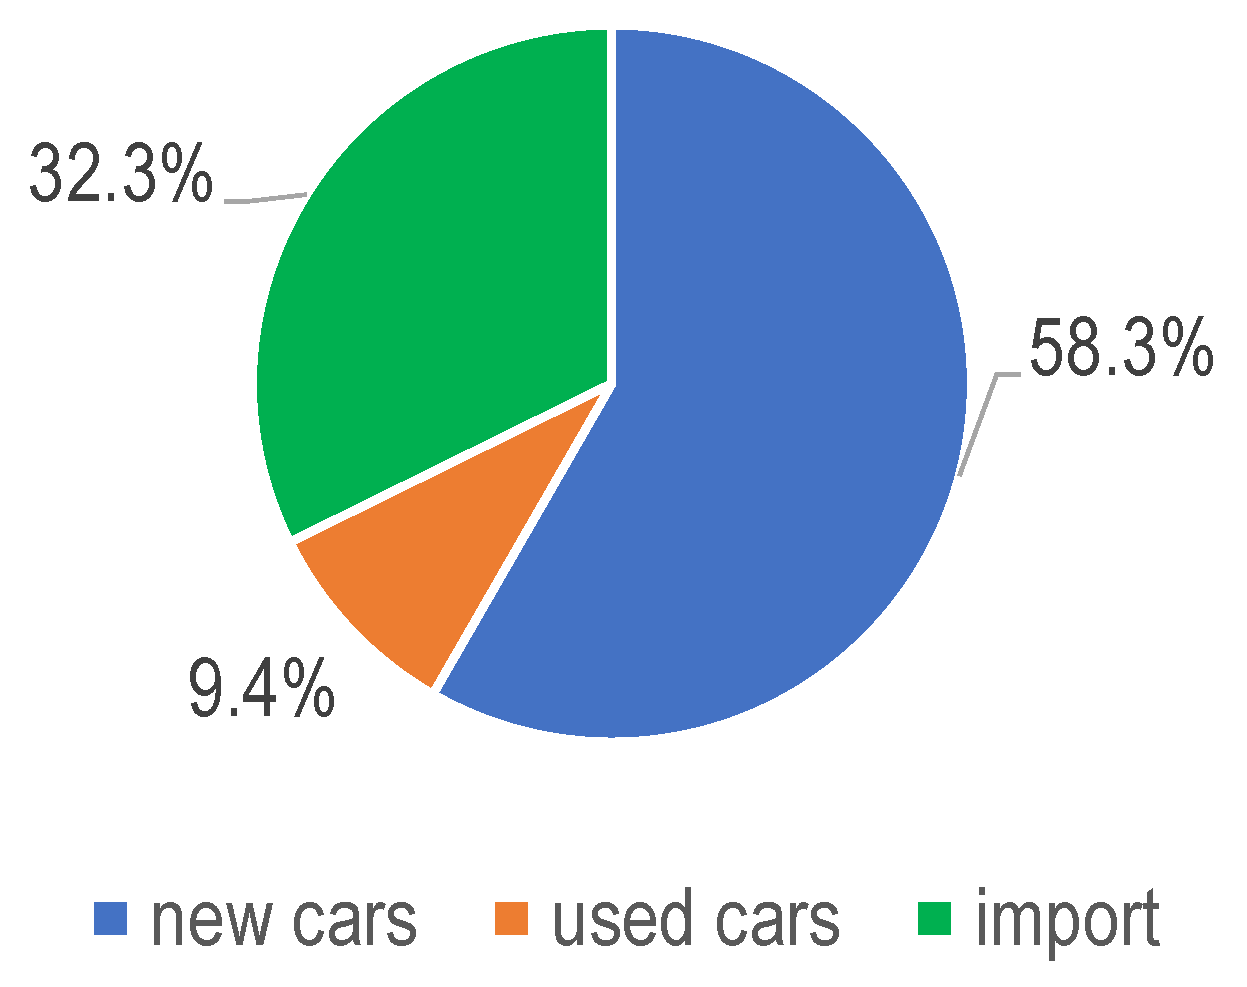
The passenger vehicle market in Poland saw record numbers of vehicle registrations. Over 285,000 new passenger vehicles were registered in Poland at the end of the first half of 2025, of which 167,000 were vehicles with alternative power sources [2]. The latter included over 138,000 hybrid vehicles (HEVs), over 14,000 plug-in hybrid vehicles (PHEVs), and over 13,000 electric vehicles (EVs) (Figure 1). This means that interest in alternative power sources for passenger vehicles is growing among new vehicle buyers. New vehicles registered in 2025 account for as much as 32% of all vehicles registered in Poland.
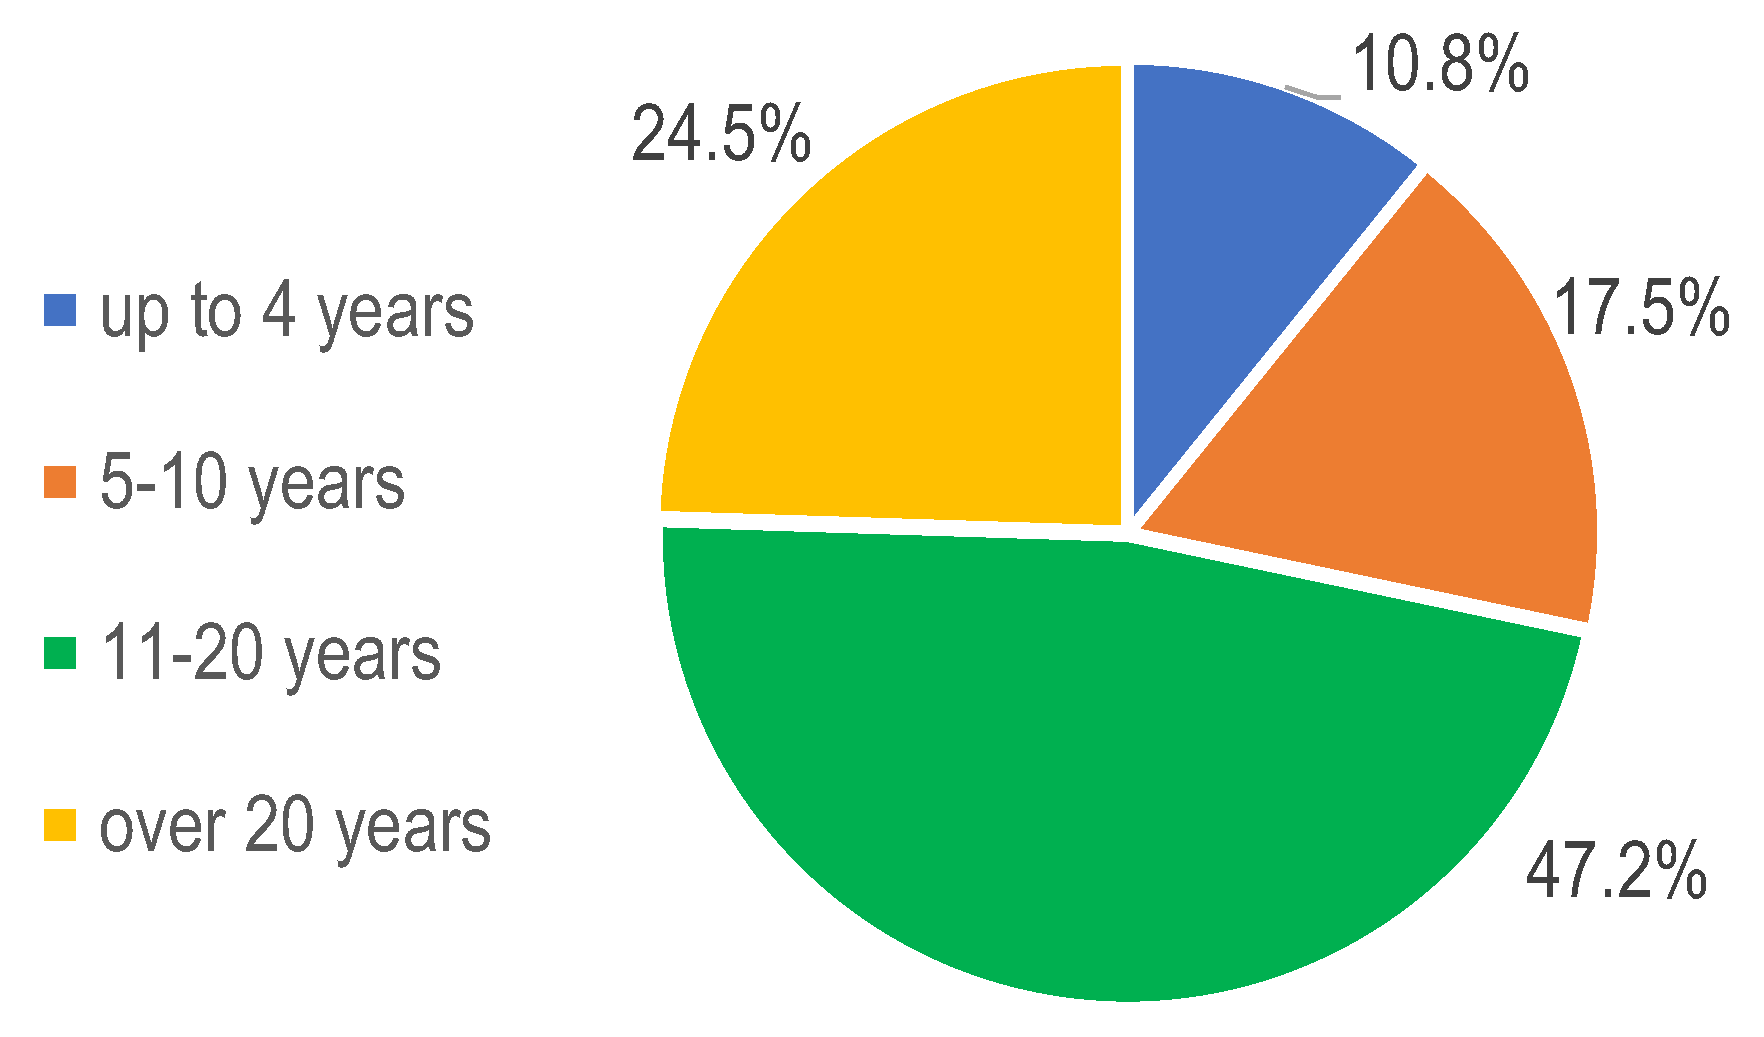
Registrations of used vehicles will account for approximately 10% in 2025, while registrations of imported vehicles will be the most dominant, amounting to as much as 58% in the first half of 2025 (Figure 2). In the first and second quarters of 2025 alone, over 514,000 passenger vehicles were imported into Poland, most of which were fairly worn-out petrol vehicles. The above issue of importing vehicles from Western Europe may soon pose a major challenge in terms of transport’s environmental impact. In addition to the costs associated with recycling and disposing of imported vehicles, the issue of air pollutant emissions from petrol vehicles deserves special attention.
Methods that improve the verification of actual air pollutant emissions still seem to be relevant. This is particularly important in relation to used conventional passenger vehicles, especially those powered by petrol. It is worth noting that passenger vehicles up to 4 years old accounted for only 11% of the passenger vehicle fleet at the end of 2022 (Figure 3). Passenger vehicles between five and ten years old accounted for 17% of motor vehicles. The largest group of vehicles are aged between 11 and 20 years (49%). The oldest vehicles in Poland, i.e., over 20 years old, account for 23% of all passenger vehicles. There are therefore nearly twice as many older vehicles as there are vehicles with a service life of up to 4 years [3,4]. This phenomenon is primarily caused by large imports of used vehicles from Western Europe.
The average age of passenger vehicles imported to Poland at the end of the first half of 2025 is just over 12 years. This is primarily due to petrol passenger vehicles (12.64 years, to be precise). An interesting fact is the clearly growing demand for used electric cars (+35.0%). It can be assumed that air pollutant emissions change with the age and mileage of petrol passenger vehicles. The results of other reports indicate that heavy goods vehicles have the greatest impact on the environment [5]. In the US in 2010, 30% of the HDV fleet accounted for 50% of nitrogen oxide emissions; in 2018, this figure had fallen to just 16%. In contrast, 14% of light vehicles in 2010 were responsible for 50% of these emissions, and in 2018 this share decreased to 11%. Older vehicles, although representing a small proportion of the fleet, have a disproportionately large impact on the environment. This paper presents how air pollutant emissions from a gasoline-powered vehicle change over eight years. The aim of research results relating to emissions generated by a single vehicle under RDE testing have not been published. While research results from technical inspections and research results from RDE tests for various vehicles powered by the same fuel have been published, results demonstrating changes in air pollutant emissions from a single vehicle over eight years have not been published. The presentation of test results for air pollutant emissions from vehicle exhausts operated over eight years and the change in these emissions over that time constitutes the novelty of the presented results. Previously, such RDE test results had not been published. The presented results employed a small sample size due to the time-consuming nature of the research and limited access to vehicles that could be studied over eight years. The study sample did not reflect the actual population of vehicles on Polish roads. However, the test vehicle was selected based on repetitive operating conditions and good technical condition, resulting from frequent technical inspections per the manufacturer’s recommendations.

2. The Issue of Changes in Vehicle Emissions During Their Service Life

Vehicle ageing is an issue that constitutes a significant stage in the operation of any mechanical device. The manner of operation, frequency of periodic inspections and repairs affect the reliability and service life of vehicles. In addition to the mechanical dimension, the above factors also influence air pollutant emissions. Factors affecting air pollutant emissions include the type of fuel, working conditions and the transport mode type. However, it turns out that the vehicle’s age has a significant impact on the functioning of exhaust gas treatment systems.
The technical condition of vehicles, their age, and the manner in which they are operated and maintained should be subject to more thorough verification in terms of the passenger vehicles’ environmental impact. Verification of actual air pollutant emissions is part of the concept of sustainable transport development. It is worth noting here that in December 2022, the European Parliament and the Council adopted the Corporate Sustainability Reporting Directive, known as the CSRD, on corporate sustainability reporting [6]. The Directive entered into force in Poland on 5 January 2023, increasing the scope of corporate responsibility in terms of ESG, i.e., environmental, social and corporate governance. The European Sustainability Reporting Standards are a manifestation of ESG principles. In other words, entrepreneurs, including those in the transport sector, will be obliged to report on whether they meet the criteria for classifying their activities as more sustainable. The search for methods to verify changes in emissions as a function of vehicle age is a current and important issue, given the statistical data cited above.
The introduction of new legal regulations (including the new Euro 7 standard) is not only associated with lower exhaust emissions (in particular, PN counting from 10 nm) but also applies to new limits for brake dust (e.g., 7 mg/km for ICE, 3 mg/km for BEV) and introduces limits for tyre abrasion (C1 from 2028, C2 from 2030, C3 from 2032) [7]. The compliance period is also extended (e.g., passenger cars M1/N1–200,000 km or 10 years). A minimum battery efficiency is introduced (for category M1) for electric vehicles: ≥80% after 5 years/100,000 km, ≥72% after 8 years/160,000 km. A special ‘Euro 7G’ category will be created for hybrid vehicles that automatically switch to electric mode in zero-emission zones.
The issue of vehicle ageing in the literature mainly refers to the assessment of the ageing of exhaust gas treatment systems, i.e., catalytic converters and particulate filters, which are responsible for reducing pollutant emissions in exhaust gases. The literature also mentions statistical inferences based on tests of harmful exhaust emissions conducted at vehicle inspection stations. Research on the analysis of vehicle ageing and its impact on pollutant emissions is not focused on a single type of study. They are conducted in various research tests (laboratory tests—using various cycles, at vehicle inspection stations, road tests using only exhaust gas concentration measurements, or in road tests). The first studies on exhaust emissions from high-mileage vehicles began about a decade ago in Switzerland [8]. The results obtained showed that emissions double depending on the vehicle class (approx. 115,000 km—Euro 1, 125,000 km—Euro 2, 180,000 km—Euro 3 and 220,000 km—Euro 4). The research was conducted using remote sensing on a sample of approximately 1.1 million vehicles. Other studies on this issue [9] concern a method for converting data from remote sensing of vehicle emissions, which are naturally expressed as fuel indicators (e.g., g/kg of fuel), into more practical distance-based emission indicators (g/km). The aim was to enable wider use of remote sensing technology in creating emission inventories and assessing transport policies. A different approach to the issue of increased emissions was presented by the authors of [10]. They estimated emission factors (Exhaust Factor, g/kg of fuel) for various vehicles in Dublin (cars, taxis, vans, buses) using remote sensing. The results obtained showed a significant increase in nitrogen oxide emissions from passenger vehicles, particularly city taxis. This was the result of the significant mileage of such vehicles, which reduced the effectiveness of exhaust gas treatment systems.
Studies using data from vehicle inspection stations only concern vehicles subject to inspection but do not directly indicate the relationship between exhaust emissions and vehicle age. The authors of [11] assessed the impact of vehicle age on CO and HC concentrations in exhaust gases. A test of over 1000 vehicles in Rwanda showed that 16% of vehicles up to 20 years old failed the carbon monoxide emission test. For older vehicles, this percentage was 55%. Durability tests were also presented in [12], which concerned a fleet of taxis (including dual-fuel vehicles). The paper’s final conclusions were that CNG taxis reduced CO emissions (by 87%) and HC emissions (by approximately 10%), while NOx emissions increased (by 14%) compared to petrol taxis. The impact of vehicle mileage was recorded in relation to CO and HC (after 200,000 km) and was more than 50% higher than for vehicles with low mileage. The aim of [13] was to examine changes in compliance with vehicle emission standards throughout their entire service life. The conclusion was a recommendation for more detailed testing during vehicle technical inspections. At the same time, the authors pointed to the need for PN measurements for vehicles with diesel engines and NOx measurements for petrol vehicles during annual periodic inspections.
Other studies on vehicle ageing and its impact on exhaust emissions are conducted under laboratory conditions on a chassis dynamometer. Tests on petrol vehicles (China 6 class) [14] indicate increased emissions of carbon monoxide (DF = 1.6) and nitrogen oxides (DF = 1.5), while at the same time, in the initial period (up to 40,000 km), these tests showed a reduction in particulate matter, which was associated with the formation of a filter layer in the GPF. The authors of the study presented in [15] used emission tests to determine exhaust emission deterioration factors. They used the following tests: WLTC, SRC and AMA. The WLTC (Worldwide harmonised Light-duty Test Cycle) reflects average real-world driving conditions and is used to measure emissions during type approval (Type I test). The SRC (Standard Road Cycle) test is a road cycle originally developed by the US EPA and introduced into European regulations in the Type V test procedure for testing the durability of exhaust gas treatment systems. The AMA (Approved Mileage Accumulation) test is considered obsolete, but it formed the basis for determining emission deterioration factors (DFs) during type approval. Some authors [16] use the ARTENIS test for such studies to assess the increase in exhaust emissions during DPF filter regeneration (Euro 5 diesel). The authors demonstrated an increase in NOx, CO, HC, CO2 and particulate emissions of up to 15–100%. Table 1 compares tests that can be used to perform accelerated durability testing.
Comparative studies of vehicle emissions under different conditions (but under laboratory conditions) are also being conducted in China. The authors of [17] conducted tests using the following test cycles: CLTC (China Light-Duty Test Cycle), WLTC and RDE (simulated on a dynamometer). The authors have demonstrated that the most significant issue with conventional and hybrid vehicles remains emissions during cold starts, which account for the majority of NOx, CO, and PM emissions. The authors point out that it is necessary to refine cold start management strategies in order to reduce this portion of emissions in urban conditions. A report [18] comparing Euro 6d-Temp emission class vehicles in RDE tests found that all emission standards were met but noted increased carbon monoxide emissions during the motorway section. However, some researchers state outright [19] that RDE tests do not always reflect the specific traffic conditions in a given area. European tests are insufficient for assessing vehicles in other conditions (e.g., Australian). The authors recommend that changes are needed in this area and propose the introduction of local measurements that are more responsive to the specific characteristics of a given region.
The authors of [20] present the conclusions from a study of pollutant emissions in the exhaust gases of diesel vehicles under RDE road test conditions. However, a set of seven different vehicles, all of which had diesel engines with a similar displacement not exceeding 2 dm3, constituted the subjects of the study. As a result of research conducted in [20], a significant increase in air pollutant emissions was demonstrated with the increasing mileage of passenger vehicles. NOx emissions in the tests performed were 70% higher for vehicles with a mileage exceeding 86,000 km. CO emissions were 23% higher for vehicles with a mileage of more than 86,000 km, while CO2 emissions were 19% higher for vehicles with a mileage of more than 86,000 km. It can therefore be assumed that in Poland, where the average mileage of passenger vehicles is nearly 17,000 km per year [21], vehicles over 5 years old have higher air pollutant emissions than those in their first five years of their service life. In countries where average annual mileage is significantly higher, reaching nearly 30,000 km per year, e.g., the Netherlands and Spain, increased air pollutant emissions may occur after only three years of operation of diesel passenger vehicles. In order to make research into changes in emissions over the vehicle service life more reliable, it is advisable, as indicated by the authors of [20], to conduct research on the same type of vehicle or a group of identical vehicles over a longer period of time, ensuring the same driving style and repeatable operating conditions.
The issue of transport’s negative environmental impact is also related to the implementation of alternative forms of transport, such as electric vehicles. The introduction of electric and hybrid vehicles is linked to efforts to reduce greenhouse gas emissions from transport. In [22], the authors conducted research to determine whether electric vehicles can be called zero-emission vehicles. This is possible when using environmentally sustainable power sources for vehicles and after implementing modern battery production technologies. Long-term vehicle operation also results in the need to replace battery packs, the production of which is very energy-intensive. Assuming that electric vehicles in the Polish market receive a technical warranty for nearly 160,000 km of mileage, the battery in an electric vehicle may need to be replaced after a service life of 8 years [21,23]. Compared to vehicles whose emissions increase at mileage levels above 86,000 km, this means that electric vehicles, like conventional vehicles [20], are characterised by a marked increase in air pollutant emissions as the age of passenger vehicles, including electric vehicles, increases. By switching to electricity generation sources that have a lower environmental impact, it is possible to reduce emissions from the production of electricity needed to power electric and hybrid vehicles [24]. However, as indicated in [22,24], electric and hybrid vehicles are not zero-emission vehicles. It is worth noting that the location of battery production itself has an impact on the amount of air pollutant emissions. The authors of [25] emphasise the importance of the energy mix used to power electric vehicles and the location of battery production. These two factors in relation to electric vehicles affect the amount of air pollutant emissions during the service life of electric vehicles. The carbon footprint of electric vehicles therefore depends to a large extent on the electricity generation source and emissions associated with battery production. It can also be assumed that transitional vehicle power technologies, such as hybrid drives, offer solutions that ensure lower air pollutant emissions. However, as pointed out in [26], hybrid vehicles consume less conventional fuel, but vehicle hybridisation does not bring the expected benefits in terms of air quality, especially in urban areas. The authors of [27] indicate that vehicle age and technological changes, including the current trend towards the wider implementation of electric vehicles, among others, affect transport’s environmental impact. In [27], no studies of air pollutant emissions under road or laboratory conditions were conducted, but a model simulating the internal dynamics of vehicle population growth and air pollutant emissions was used. The authors highlight an important aspect of the use of older vehicles, especially those from the secondary market. A simulation model was used to study the deterioration in emissions and to measure the effects of implementing control and maintenance programmes and introducing cleaner fuels. The results of simulation studies confirmed the impact of vehicle usage intensity and vehicle age on air pollutant emissions. It can therefore be concluded that, with regard to conventional vehicles, the search for new exhaust gas treatment systems and the modelling of the systems’ ageing processes are of key importance and have an impact on pollutant emissions in passenger vehicle exhaust gases.
A similar approach, but using modern tools, including artificial intelligence and machine learning, is presented in [28]. The author used modelling techniques to predict changes in air pollutant emissions based on data from road tests and vehicle diagnostic interfaces. However, no measurable change in air pollutant emissions resulting from the advancing age of vehicles has been specified. The authors of [29] used a similar scheme for assessing factors affecting the environmental performance of vehicles. They used over 460,000 vehicle test results for their analysis, and the interpretation was performed using the GBDT (Gradient Boosting Decision Tree) and SHAP (Shapley Additive Explanations) machine learning methods. The results obtained confirmed that the vehicle inspection station (18%), vehicle brand (15%) and service life (10%) have the greatest impact. This methodology enables emissions modelling in the context of an ageing passenger vehicle fleet and allows appropriate decisions to be made, e.g., control measures for selected types of transport. Activities related to vehicle inspection and supervision in the context of changing pollutant emissions are very important.
As mentioned in [30], inspecting old vehicles that are over 15 years old can lead to an effective reduction in air pollutant emissions. In their paper [30], the authors developed an emissions model that takes into account global vehicle fleet turnover between 1970 and 2020. In [31], the authors reviewed the factors influencing air pollutant emissions. Emissions are influenced by driving style and driver skills, vehicle type, fuel type, engine specifications (engine power and capacity), congestion, spatial conditions, road type, driving speed, weather conditions, season, and, importantly, vehicle age. The issues of testing vehicle air pollutant emissions are complicated due to the variability of technologies and operating conditions of vehicles encountered on the roads. In [32], the impact of vehicle age on actual mileage was analysed based on data concerning the age of vehicles used in Italy. Based on research, it has been found that the average mileage of 10-year-old passenger vehicles is approximately 40% of the mileage covered in the first year of their service life. The intensity of passenger vehicle use will therefore also have a decisive impact on air pollutant emissions. This percentage drops to around 10% for 20-year-old passenger vehicles. The decline in the intensity of use of vehicles older than 10 years is associated with increased unreliability, as well as a significant increase in air pollutant emissions. Scrappage schemes for old vehicles and the implementation of clean transport zones therefore appear to be important for improving air quality, especially in urban areas. The effectiveness of exhaust gas treatment systems changes as vehicles age.
Research is being conducted to determine the relationship between laboratory tests and the actual ageing effects of exhaust gas treatment systems. Exhaust gas treatment systems are quite expensive, which is why ageing tests are carried out during the design process. The authors of [33] confirm that accelerated ageing, equivalent to conventional engine dynamometer tests (e.g., 20 h of testing = 130,000 km), in terms of the degradation of exhaust gas treatment systems, can be achieved by using a lower test temperature. As pointed out in [34], using the rapid ageing method for catalysts, a catalyst operating at 800 °C for 50 h exhibits characteristics similar to those of an exhaust gas treatment system for a vehicle with a mileage of 150,000 km. Similarly, the authors of [35] determined that catalyst operation at 800 °C for 16 h corresponds to an exhaust gas treatment system with a mileage of 135,000 miles. It can therefore be concluded that the vehicle’s age, or rather its mileage, is a factor that influences air pollutant emissions. The issue of vehicle age’s impact on air pollutant emissions was also addressed in [36], which attempted to determine the impact of vehicle age on environmental pollution based on technical inspections of 600 vehicles. The study found that air pollutant emissions generated by vehicles older than 12 years were 50% higher than the air pollutant emission standards in force in Israel at the time. Therefore, [36] presents comprehensive analyses based on technical inspections, but these studies were not carried out using modern methods of measuring air pollutant emissions in road tests. Among the study’s key conclusions was the need to ensure the proper operation of passenger vehicle engines and to launch larger-scale research into vehicle exhaust emission control. Air pollutant emissions generated by passenger vehicles are also affected by fuels and the standards governing their production, as well as exhaust emission standards for passenger vehicles [37]. The authors of [38] point out that a variety of often complementary technologies should be used to treat exhaust gases along with technological progress and the introduction of increasingly stringent air pollutant emission standards. Particulate matter filters in conventional vehicles and exhaust gas recirculation systems are solutions used to reduce pollution, but as indicated above, these systems are subject to ageing processes, which reduce their effectiveness in treating exhaust gases. Thus, as vehicles age, especially in terms of mileage, air pollutant emissions increase due to the declining efficiency of exhaust gas treatment systems. The issue of limiting transport’s negative environmental impact was addressed in [39]. The authors analysed the reduction in particulate emissions and air pollution through the use of new solutions improving the functioning of piston-cylinder systems. The areas analysed included new materials for selected engine components, as well as the impact on emissions of technical factors related to engine designs, i.e., valve spacing, engine displacement, and materials used in engine construction. The authors of [40] examined the costs of repairs and revenues generated by the operation of road transport vehicles. Buses were the subject of the research. The conclusion was that the service life of vehicles has a significant impact on operational efficiency. It can be assumed that the service life of vehicles, in the context of earlier conclusions from the literature review, affects the efficiency of exhaust gas treatment systems and increases air pollutant emissions.
In matters related to operation, the topic of vehicle operation system modelling is addressed. For this purpose, semi-Markov processes are used, based on three operating states: use, operational downtime and repair [41]. Due to the random nature of vehicle breakdowns, knowledge of stochastic processes is essential for maintaining their effective and safe operation. An example is modelling using the Poisson process. Air pollutant emission studies are widely known [42], especially with regard to air pollutant emission studies in road conditions. However, air pollutant emission testing is not commonly observed in the context of a vehicle’s varying age. There are a few publications in the literature that refer to this issue.
Other scientific publications not directly related to the issue of the impact of vehicle age and technical condition on air pollutant emissions include papers [43,44]. Nevertheless, with regard to the subject matter of this paper, based on the results of the literature, it can be concluded that the vehicle’s age, especially its mileage, is a factor that affects the extent of pollutant emissions. In order to determine this for petrol vehicles, it is advisable to carry out emission tests under road conditions, as this method provides the most realistic emission results. Other methods, such as stationary emissions testing under road conditions, indicate a change in air pollutant concentrations with the distance of the test probe from the test vehicles. There are few studies analysing actual changes in air pollutant emissions over time. In road conditions, such studies have only been conducted in relation to different vehicles of varying ages, but no studies have been conducted on changes in air pollutant emissions depending on the mileage (age) of the same vehicles. Such tests are lengthy, and various factors often influence the exhaust emissions results (driving style, road conditions, vehicle servicing, etc.).

3. Research Problem and Method

In order to verify the above phenomenon in relation to petrol vehicles, pollutant emission tests were carried out under road conditions. Air pollutant emission testing using RDE tests for various transport modes (mopeds [45], rail vehicles [46], buses [47], motor vehicles [48]) is currently the most accurate and widely used method for determining harmful substance emissions. Road tests for air pollutant emissions are standardised (to a fairly large extent) and conducted in real road conditions, taking into account variable external factors. At the same time, meeting the static and dynamic parameters of such tests allows them to be compared with each other.
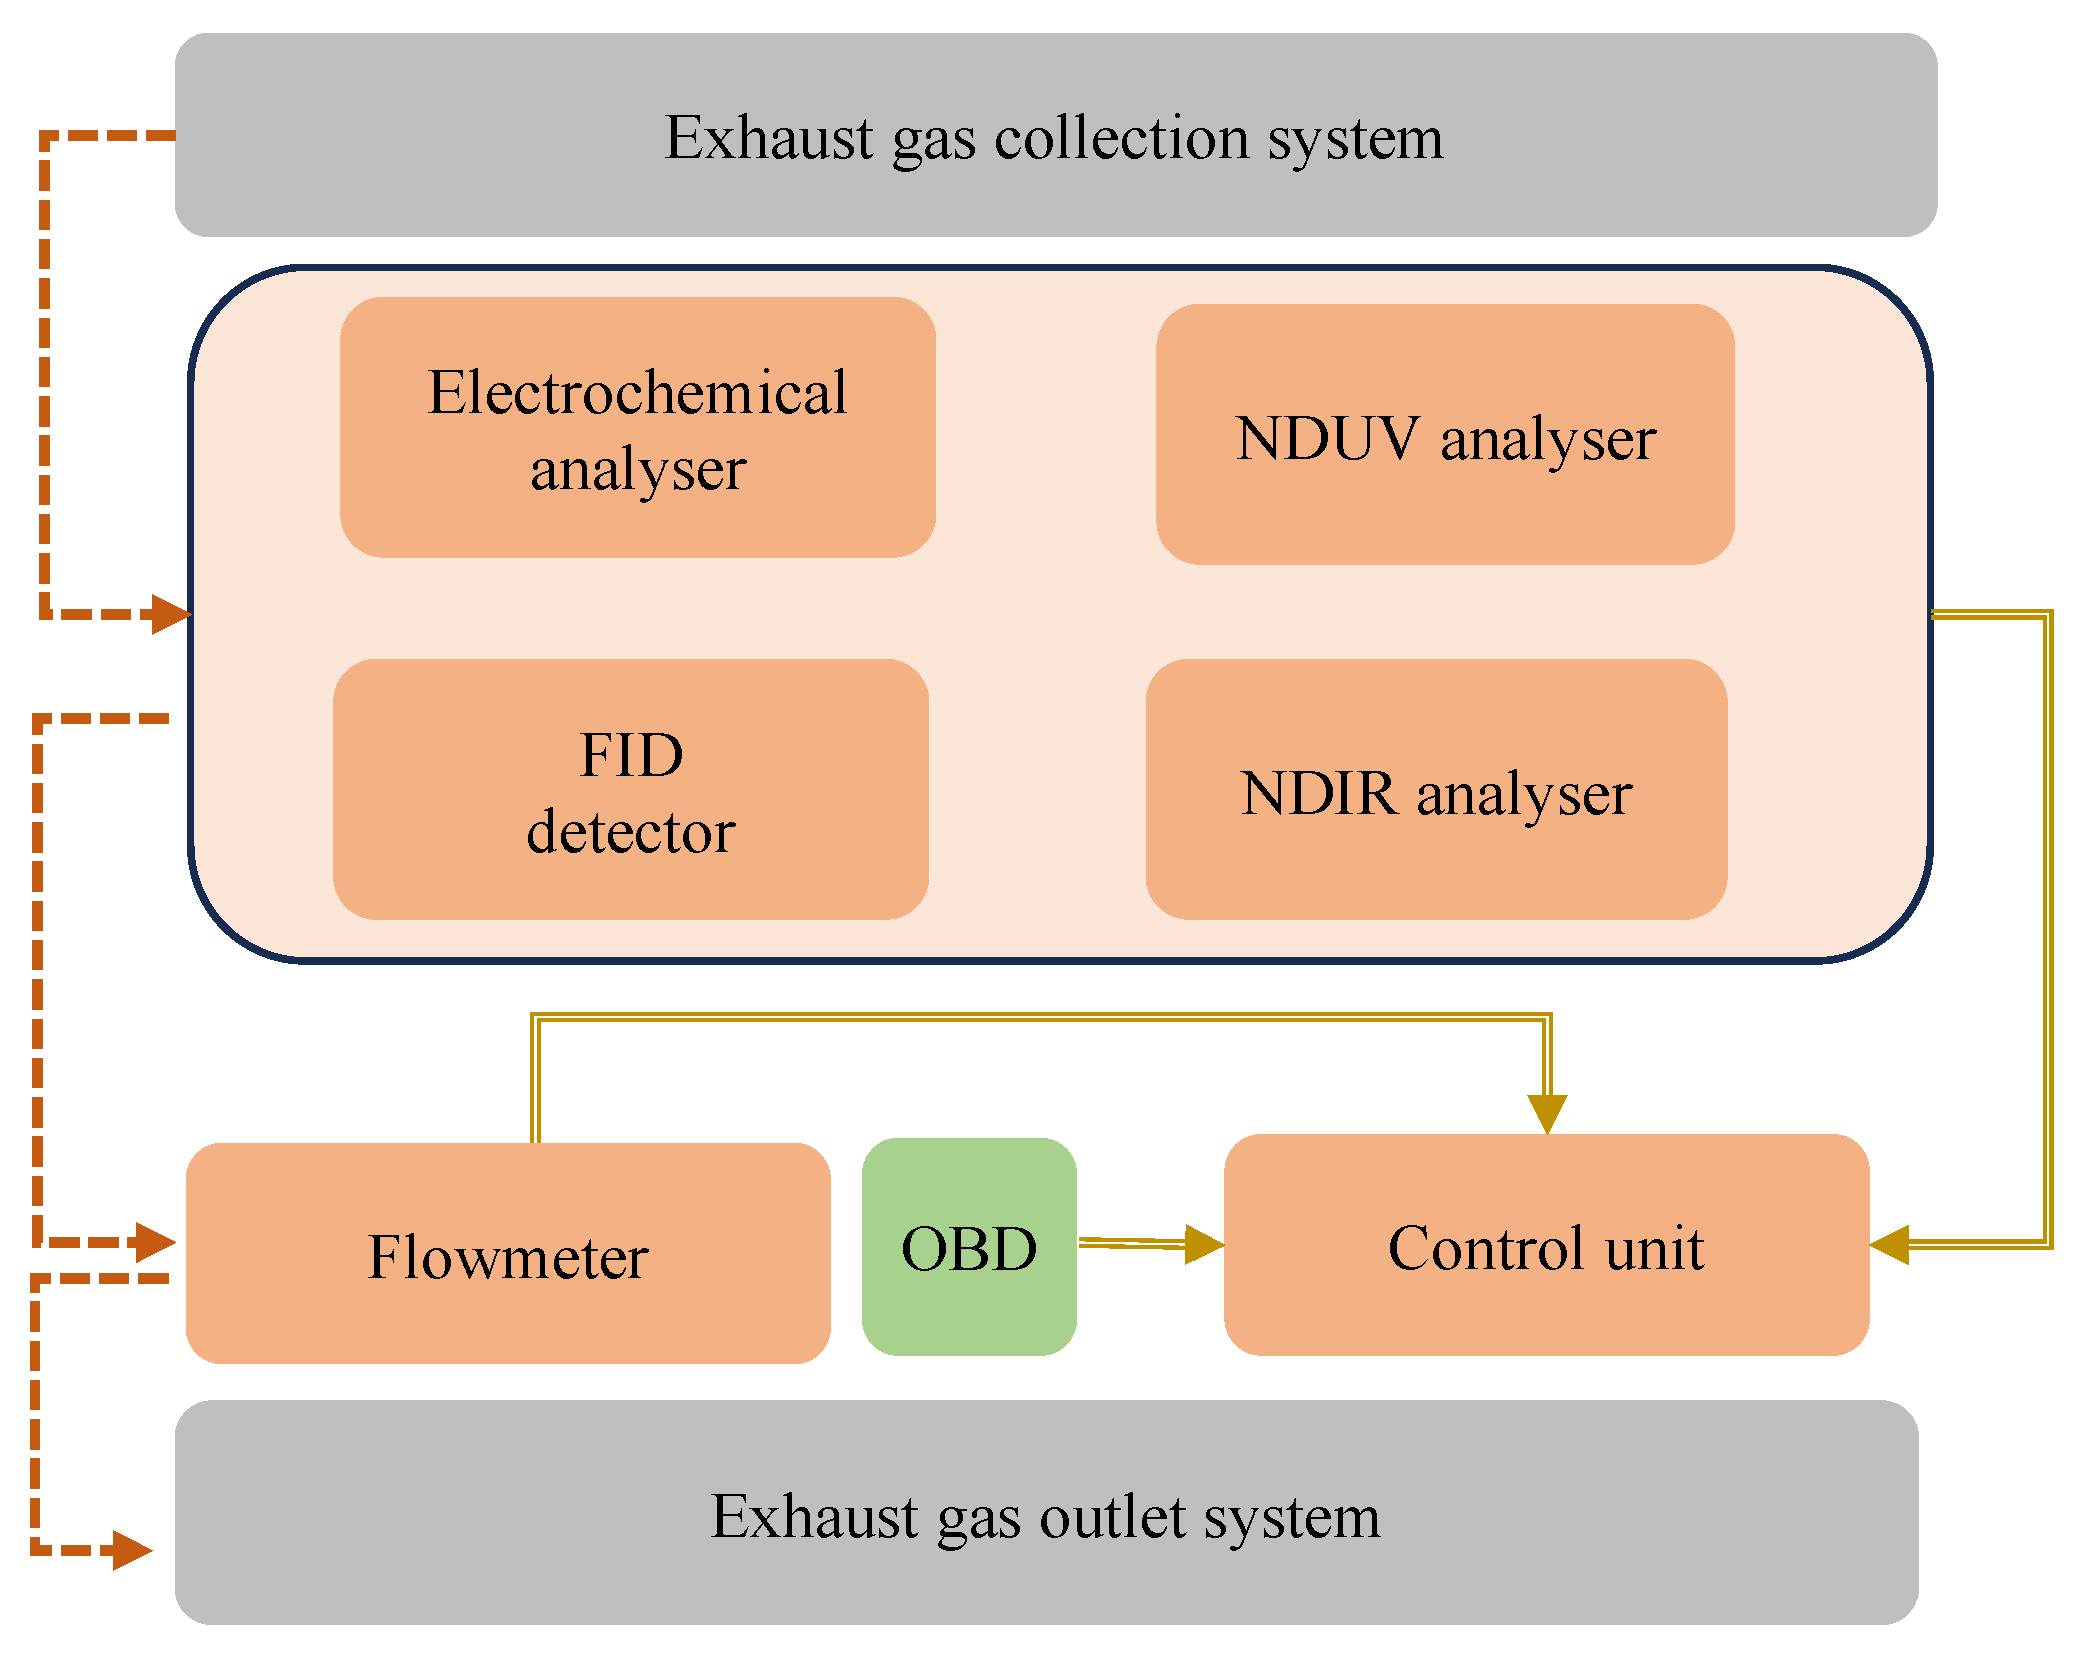
The research method used in the paper involves conducting road tests of air pollutant emissions for a single vehicle with a 2.0 dm3 gasoline engine. The vehicle was in service for 8 years. Several measurements of air pollution emissions were taken during this time. In total, the vehicle covered a distance of nearly 170,000 km over a period of 8 years. The annual mileage fluctuated around 23,000 km. The presented results employed a small sample size due to the time-consuming nature of the research and limited access to vehicles that could be studied over eight years. However, the test vehicle was selected based on repetitive operating conditions and good technical condition, resulting from frequent technical inspections per the manufacturer’s recommendations. The vehicle was operated by one driver and serviced at an authorised service station. Semtech DS testing equipment was used as part of the research method to perform accurate measurements of air pollutant emissions. The test accuracy provided by the SEMTECH DS device was ±3% for CO, CO2, and NOx. The results of air pollutant emissions from road tests for the test vehicle at various time intervals were compared with data specifying the vehicle’s age and mileage. The measurement of exhaust gas components as part of the tests was carried out using testing equipment, which included: a non-dispersive analyser using non-dispersive ultraviolet (NDUV), where the concentration of nitrogen oxides was determined, and an NDIR (Non-dispersive infrared) analyser, which measured the concentration of carbon monoxide and carbon dioxide. The oxygen concentration was measured using an electrochemical analyser. Vehicle travel parameters and geographical coordinates were also recorded during the road emission measurements to create a travel map. Figure 4 shows a diagram of the procedure for measuring harmful exhaust gases.
Research using the presented test setup was also conducted earlier for diesel vehicles, and the results of the research are presented in [20]. It was decided to use RDE road tests as part of the research method due to their comprehensiveness and full representation of actual emissions in road conditions. The variability of road conditions was taken into account in the studies as testing was carried out in urban, suburban and motorway areas. The route undergoing testing was located in and around the Poznań agglomeration. The route and the shares of individual route types during the research met the conditions set out in the standards [49]. Each test trip covered at least 16 km in urban conditions and at least the same distance in suburban and motorway conditions. The tests’ duration could not exceed 2 h on a case-by-case basis, but this time was sufficient to maintain the speed profile when testing at a maximum of 60 km/h in urban areas, a maximum of 90 km/h in suburban areas and up to 130 km/h on motorways. The research focused on examining the impact of a vehicle’s age on air pollutant emissions using a single petrol passenger vehicle being studied over a period of eight years.

4. Research Experiment

Multiple air pollutant emission tests were conducted on a single petrol passenger vehicle as part of a research experiment. The vehicle underwent RDE testing at regular intervals, which allowed us to verify how air pollutant emissions change over time. The authors used a Mercedes Benz 204, model C 200 4MATIC, with a 2.0 dm3 engine, manufactured in 2016, with an engine power of 135 kW, compliant with the Euro 6 emission standards. The test vehicle was powered by petrol. The vehicle was first registered in September 2016. The dates of the test vehicle’s subsequent technical inspections were as follows: September 2019 (mileage 69,568 km), September 2021 (mileage 105,059 km), September 2022 (mileage 131,973 km), September 2023 (mileage 152,130 km), September 2024 (mileage 170,718 km). The RDE tests (Table 2) were performed in accordance with the guidelines set out in RDE testing standards [50]. The total distance travelled by the tested vehicle imposed by the RDE procedure in each test was at least 48 km, of which at least 16 km was allocated to each test, covering the urban, rural, and motorway sections of the RDE test. The vehicle’s engine was cold before the test began. Each test lasted no longer than 120 min. The test equipment assembly took approximately two hours, and the disassembly took approximately one hour. Tests were conducted in the Poznań metropolitan area and surrounding areas, due to the possibility of performing the test in various road conditions. The perfect technical condition of the vehicle and the regular technical inspections and replacement of key operating components were crucial for the test results.
Oil changes and filter replacements were performed on average every 23,000 km. Braking system consumables were replaced at similar intervals, with the system’s first repair taking place in 2019. From the point of view of air pollution emissions, a significant repair was the fault in the NOx sensor, which was replaced in 2022. Technical inspections were carried out at intervals specified by Polish regulations, i.e., in 2019, 2021, 2023 and 2024. The frequency of technical inspections in terms of replacing operating fluids was in accordance with the recommendations of the authorised service station. The specification of repairs performed on the test vehicle is presented in Table 3.
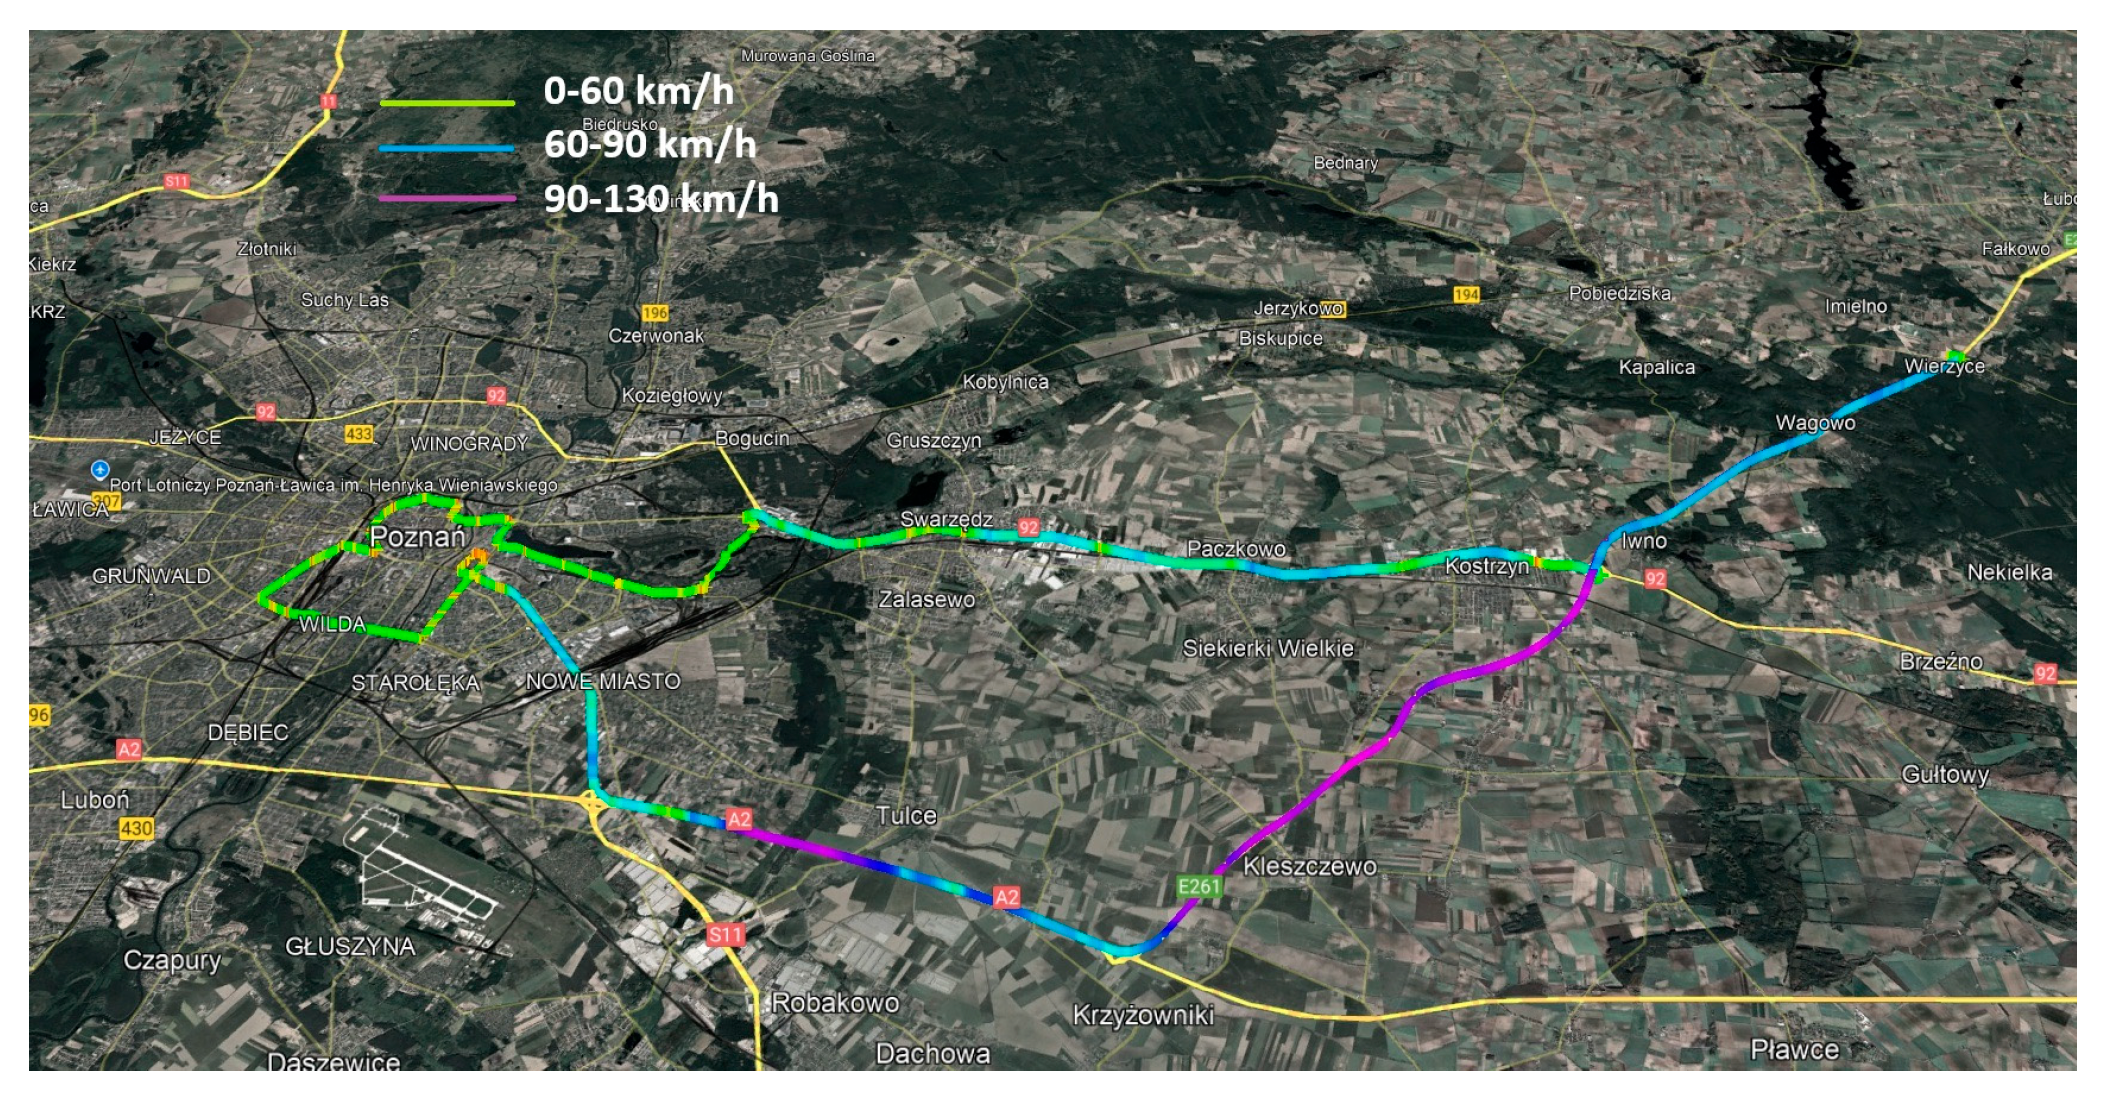
The first serious mechanical fault occurred in the eighth year of the test vehicle’s service life. From a technical perspective, the vehicle underwent regular servicing, and maintenance of the basic systems related to the drive unit operation was carried out in accordance with the manufacturer’s guidelines. The trip route taken by the test vehicle in each RDE test was similar. This ensured that the traffic conditions during the test were comparable for each measurement. The driving conditions were also comparable in terms of the time of day of the test and the driver’s driving style. The research conducted in 2017 and 2019 was performed in spring, while the research in 2022 and 2024 was conducted in summer. The impact of atmospheric conditions on the test results was not analysed. Each test run was repeated four times, and the traffic conditions were reproducible. The tests were carried out between March and August (compare Table 2), with ambient temperatures ranging from 18 °C to 25 °C and relative humidity between 35% and 65%. The same driver performed all test runs. The vehicle mass and the driver were the same during each test. Testing in the urban area was conducted in the city of Poznań and concluded on national road 92. Then, testing began in suburban conditions and continued to the Wierzyce junction (S5 road). At the Wierzyce junction (S5 road), the route turned back and the test moved to the motorway section, where the vehicle travelled at the highest possible speed, and after entering the A2 motorway at a speed of up to 130 km/h. The urban route (0–60 km/h) is marked in green, the rural route (60–90 km/h) is marked in blue, and motorway route (90–130 km/h) is marked in purple. The trip route taken by the test vehicle is shown in Figure 5.
In each test, the vehicle covered 76–92 km; the share of stops and driving time above 100 km/h in all RDE tests were very similar and did not affect the test results. All drives by the vehicle undergoing RDE testing should be similar, but due to unplanned roadworks, traffic congestion or diversions, the total distance covered in each measurement varied. Figure 6 shows the test vehicle with the test equipment installed, and Figure 7 shows examples of driving conditions in urban, rural and motorway sections of the RDE test.
The air pollutant emission results presented in Table 4 were recorded as part of the RDE tests.

5. Analysis of Working Conditions and Operational Test Results

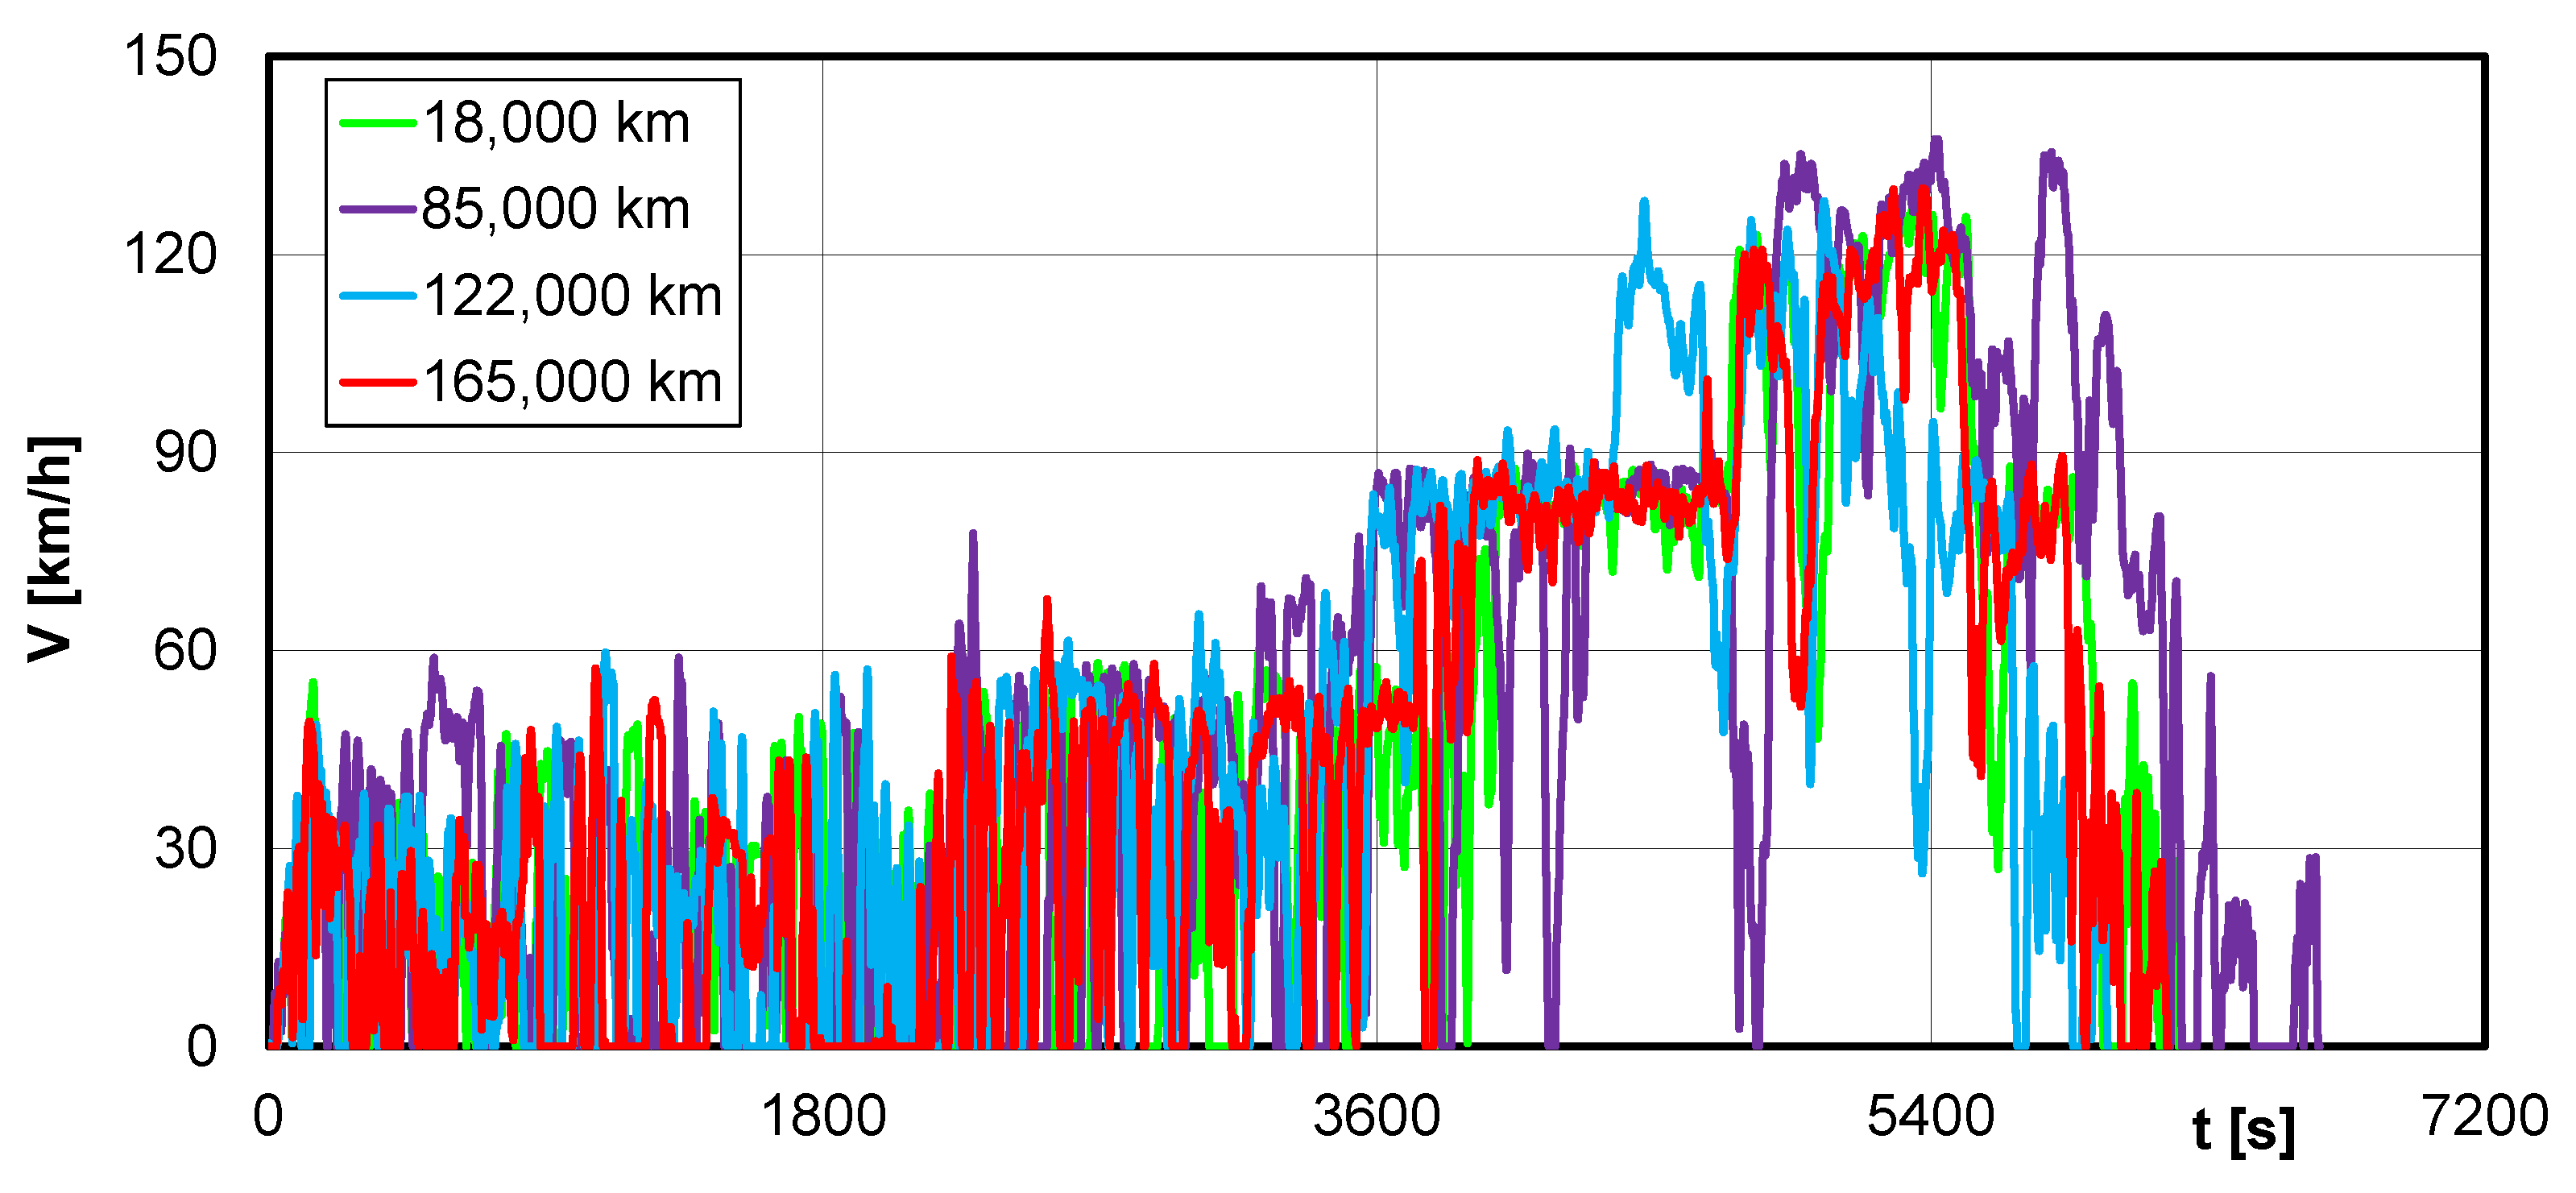
The vehicle speed profiles shown in Figure 8 refer to four RDE tests after mileage of: 18,000 km, 85,000 km, 122,000 km and 165,000 km. A very similar pattern can be observed in all cases—from the initial phase of driving with numerous stops and short accelerations (urban phase) through a section of gradual acceleration to a steady speed of around 90 km/h (rural phase), which transitions into the motorway phase with speeds ranging from 120 to 135 km/h (Figure 8). Each profile therefore shares a common feature—it consists of three phases, which are defined by the RDE test. The differences between individual mileages mainly concern changes in vehicle speed, varying them only slightly. The uniqueness of each trip is an attribute of road tests, while the method of determining trip parameters is set with a tolerance that has been maintained throughout all tests. This tolerance applied to route length, traffic conditions, test duration, etc. In summary, a common feature of all graphs is a similar layout and sequence of driving phases, which indicates that the same cycle is being followed. The discrepancies result from the frequency of stops and the intensity of momentary speed changes. In one case, the RDE test (after 85,000 km) covered a longer distance due to current traffic conditions. However, this did not affect the fulfilment of the static test parameters (Table 5) and the test’s positive result.
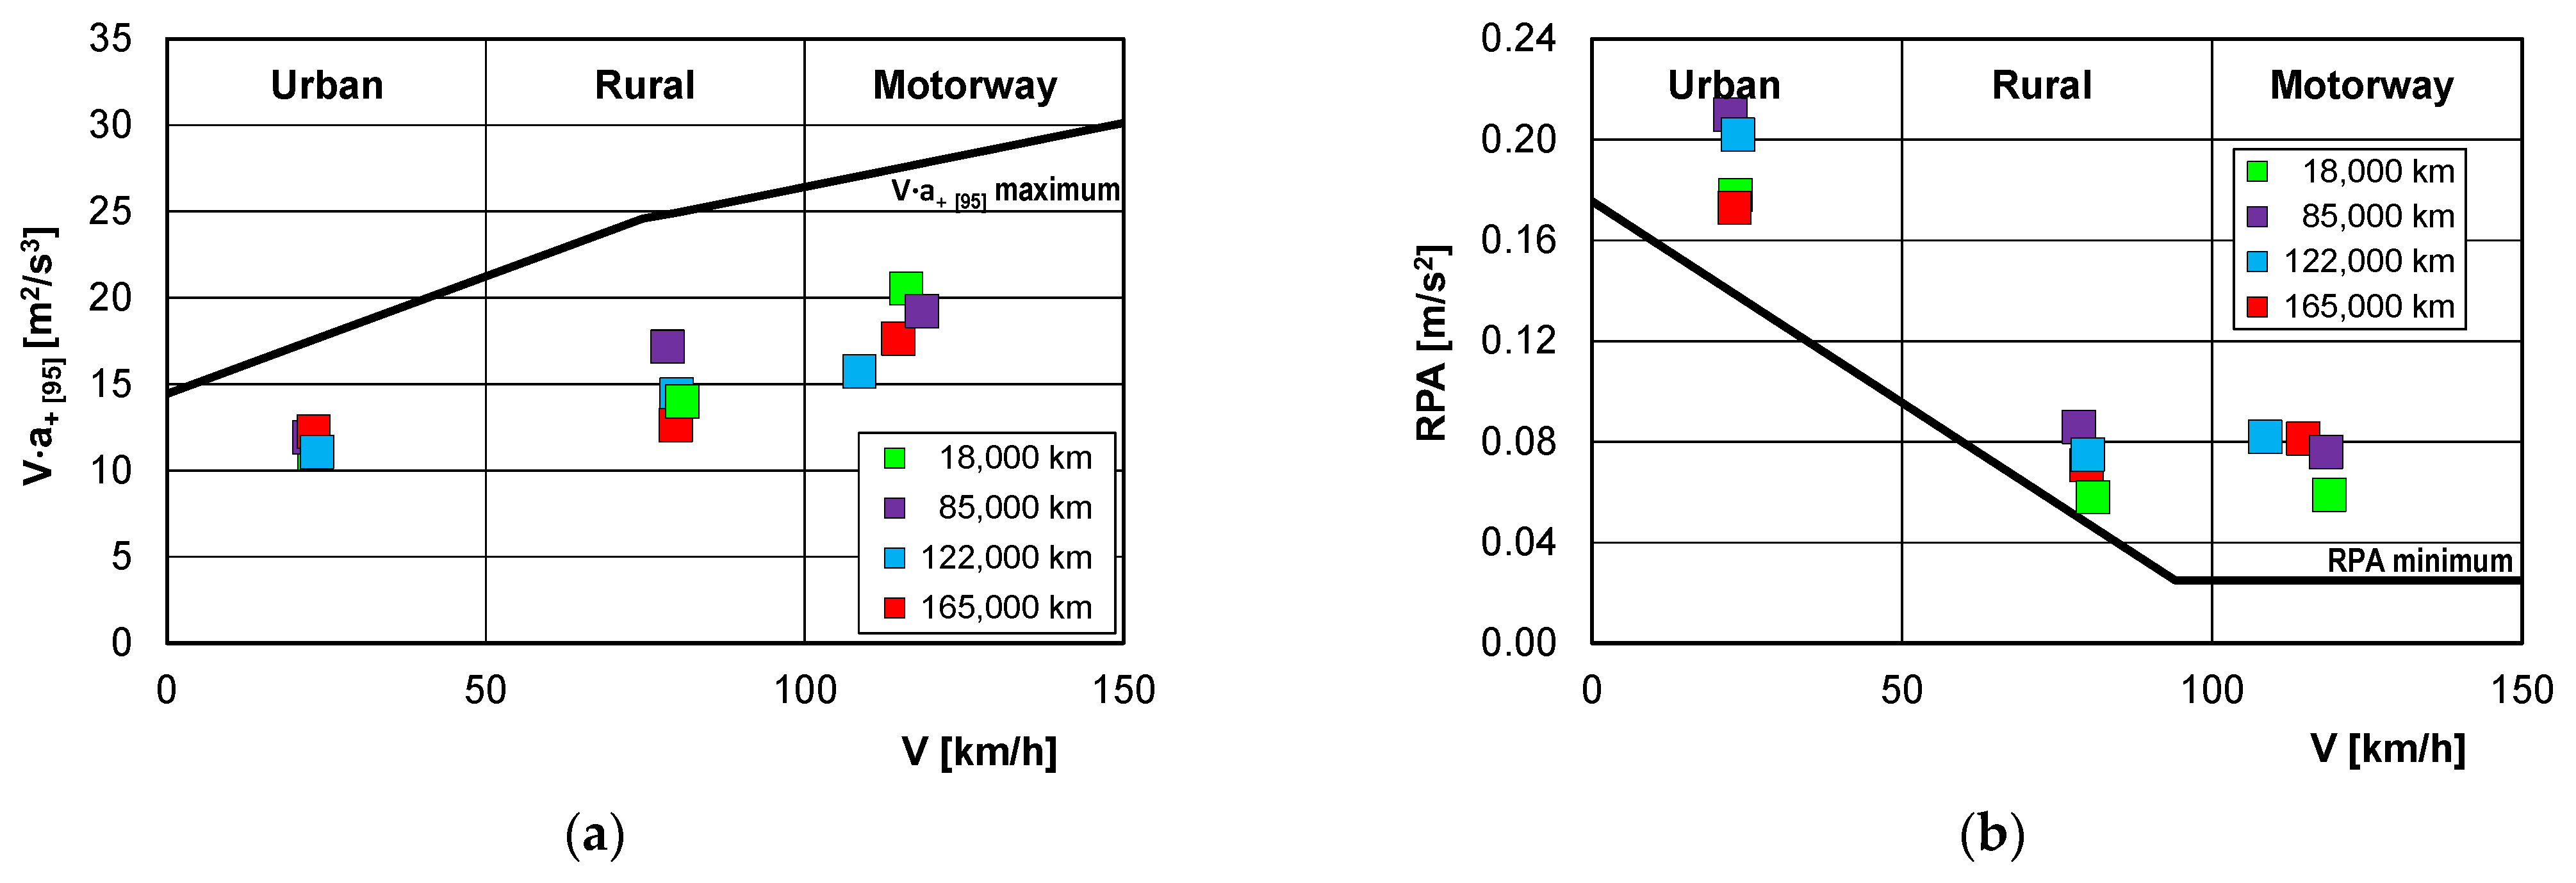
Dynamic driving conditions were considered for two parameters (Figure 9): for the 95th percentile of the product of vehicle speed and positive acceleration (V·a+ [95]) and relative positive acceleration (RPA). The first parameter prevents excessive driving dynamics in the test’s individual parts. The second one, on the other hand, forces minimal acceleration while driving.
The values of the V·a+ [95] parameter observed in Figure 9a for the urban section are within the range of 9–13 m2/s3 and are almost unchanged for each trip. For the rural section, the parameter’s values are characterised by a greater spread—11–17 m2/s3. In the motorway section, values ranging from 15 to 20 m2/s3 were obtained. The second parameter is relative positive acceleration (Figure 9b). This parameter prevents overly static driving and eliminates driving with systems that maintain a constant vehicle speed. For the test’s urban section, it ranged from 0.17 to 0.21 m/s2. In the rural section, it was 0.05–0.08 m/s2 and was approximately 5% higher than the minimum. In the motorway section, this parameter had similar values and was greater than the minimum (0.25 m/s2).
Given that the permissible values for dynamic parameters were not exceeded in any part of the test, it can be concluded that the test was performed correctly in terms of both static and dynamic parameters. Therefore, it was decided to compare the exhaust emissions of the tested vehicles.
Figure 10 compares the cumulative emission intensity (mass) of the tested harmful exhaust compounds for tests performed at different vehicle mileages. In Figure 10a, which refers to carbon dioxide emissions, all curves are very similar in nature. This indicates a steady increase in the analysed value during the RDE test, regardless of the vehicle’s mileage. A clear stepwise increase is visible when considering the intensity of carbon monoxide emissions (Figure 10b), which is caused by the compound’s periodically increased emissions, mainly during acceleration in the first moments of vehicle operation (cold exhaust gas treatment system). It should be noted that all tests were performed from a cold start (an RDE procedure requirement), which resulted in increased carbon monoxide emissions during the first kilometres of the test’s urban phase. An analysis of changes in nitrogen oxide emissions (Figure 10c) shows that the greatest differences occur during the motorway phase, i.e., when the engine is under the greatest load. The most dynamic increase is observed for a mileage of 165,000 km—the curve rises sharply in the final phase, which may suggest a significant increase in nitrogen oxide emissions during the later period of vehicle use. A consistent trend was observed for all three components, showing that all exhaust components tested increase their share in the exhaust gases as the vehicle travels.
Table 6 presents detailed data on the emissions of harmful compounds and fuel consumption in the individual parts of the RDE test (urban, rural, motorway). An analysis of these data shows that the urban phase has the greatest impact on the increase in carbon monoxide emissions, while the highest rise in nitrogen oxide emissions occurs during the motorway phase. For a high-mileage vehicle, this is likely related to the reduced efficiency of the catalytic converter and the significant increase in exhaust gas flow rate.
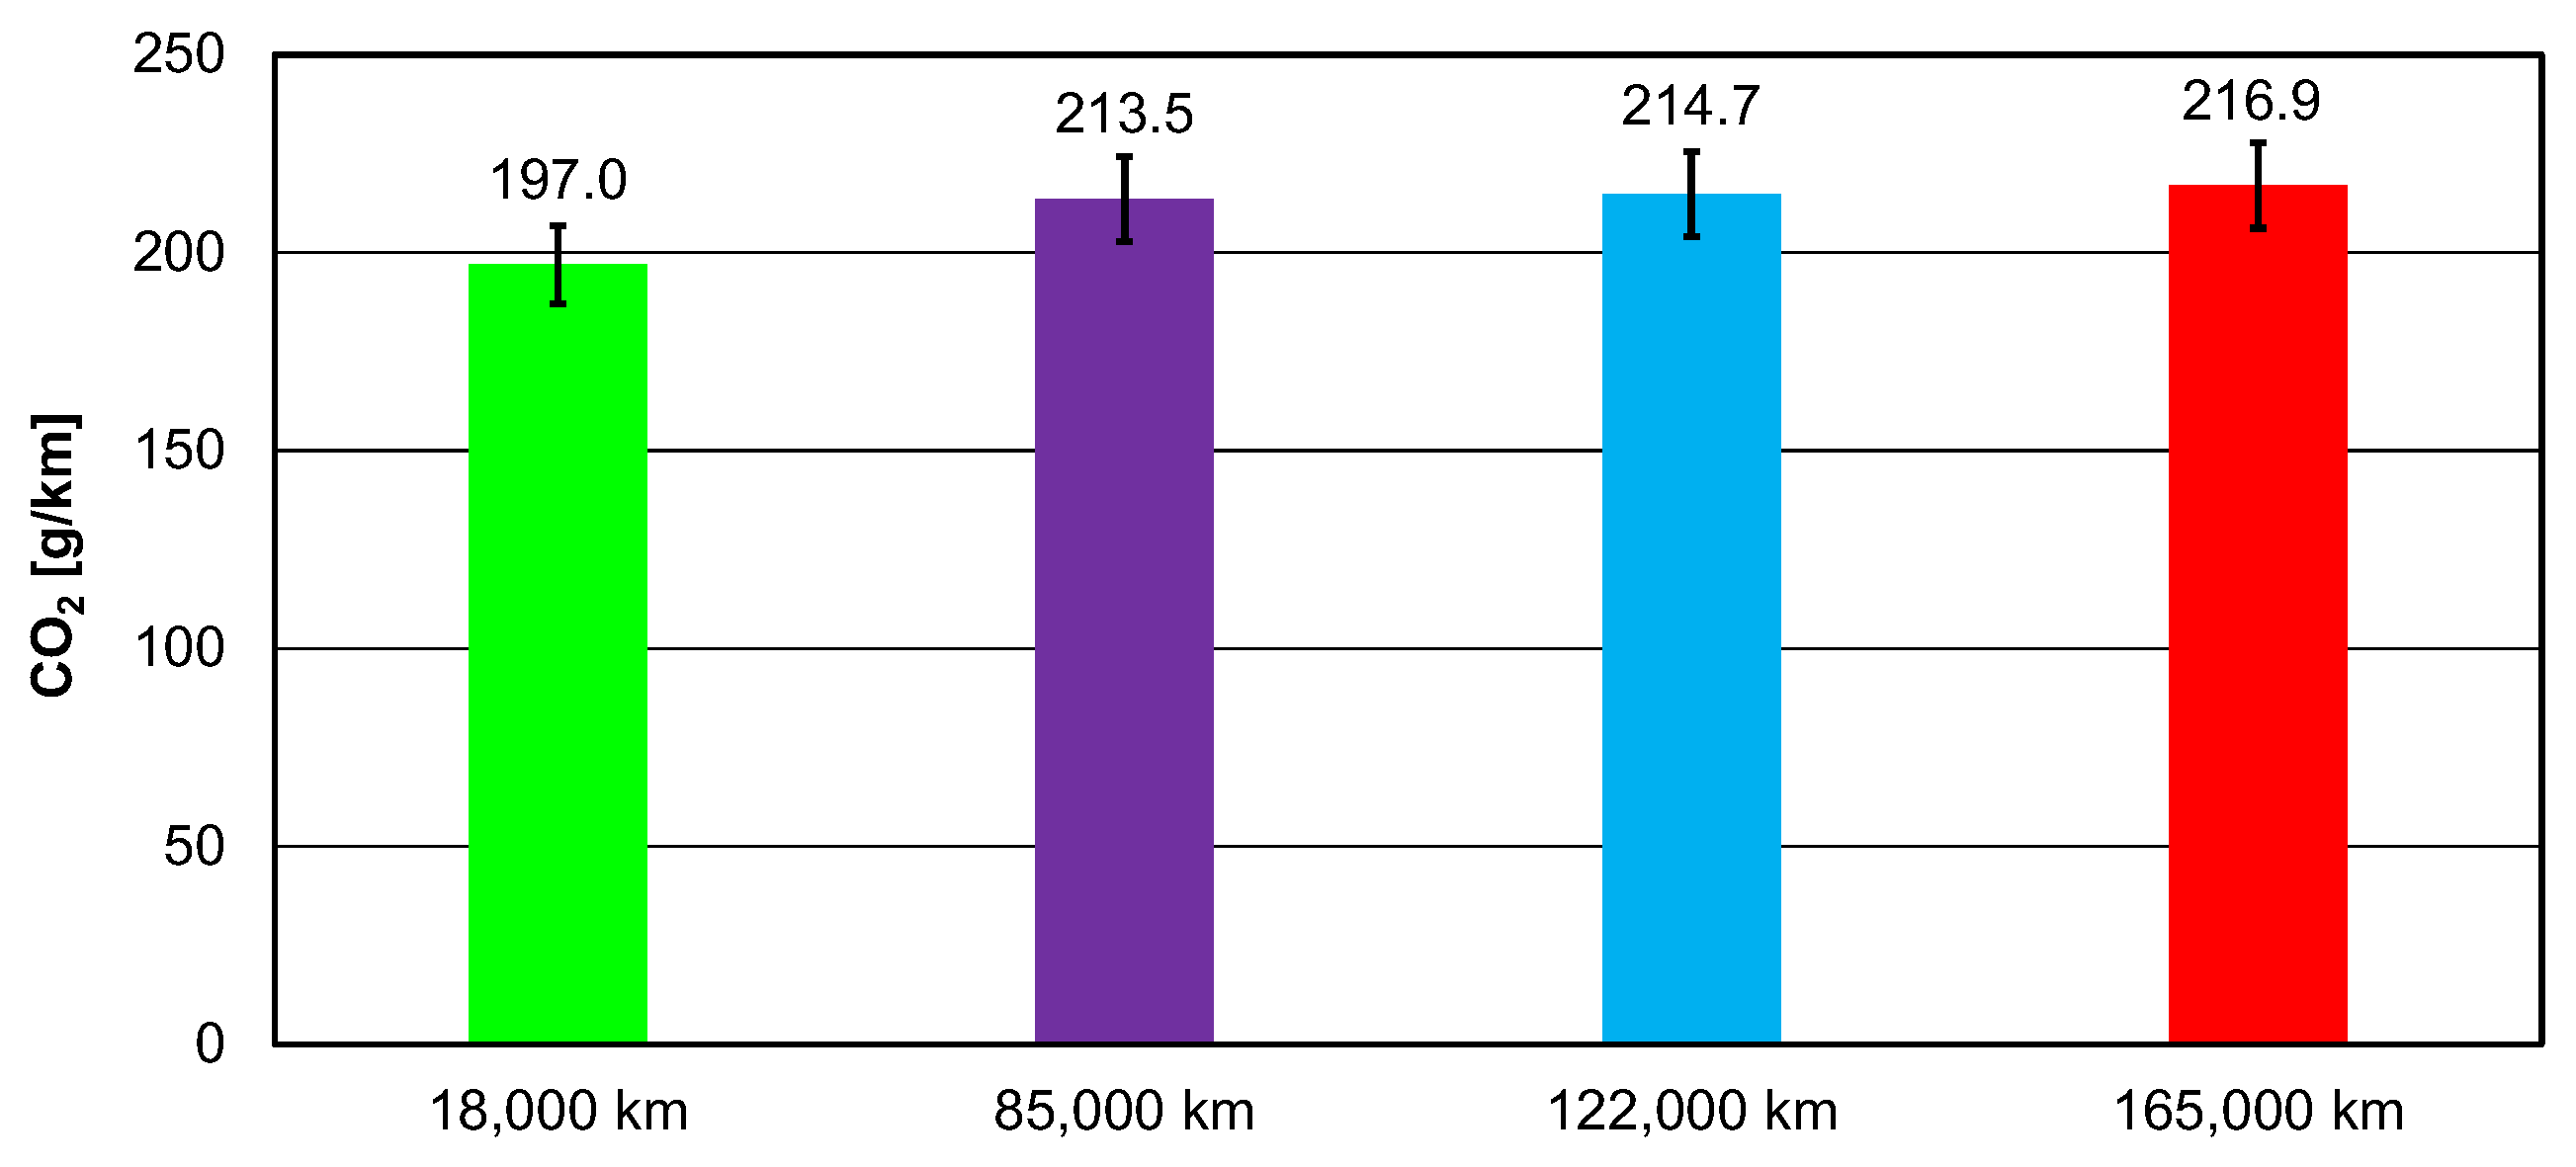
The above analysis is also reflected in the results of road pollutant emissions. The following figures compare changes in road emissions of exhaust compounds and fuel consumption depending on vehicle mileage (for the tested stages of operation: 18,000 km, 85,000 km, 122,000 km and 165,000 km). An increase in road carbon dioxide emissions (Figure 11) is observed, but the increase is small—by about 10% over the entire research cycle. The initial value at 18,000 km is 197 g/km, while for the highest mileage it reaches 216.9 g/km. This increase indicates a decrease in vehicle efficiency with age. The fuel consumption during the mileage is consistent with these results (Figure 12). The initial consumption of 7.76 L/100 km increased to 8.55 L/100 km at the highest mileage.
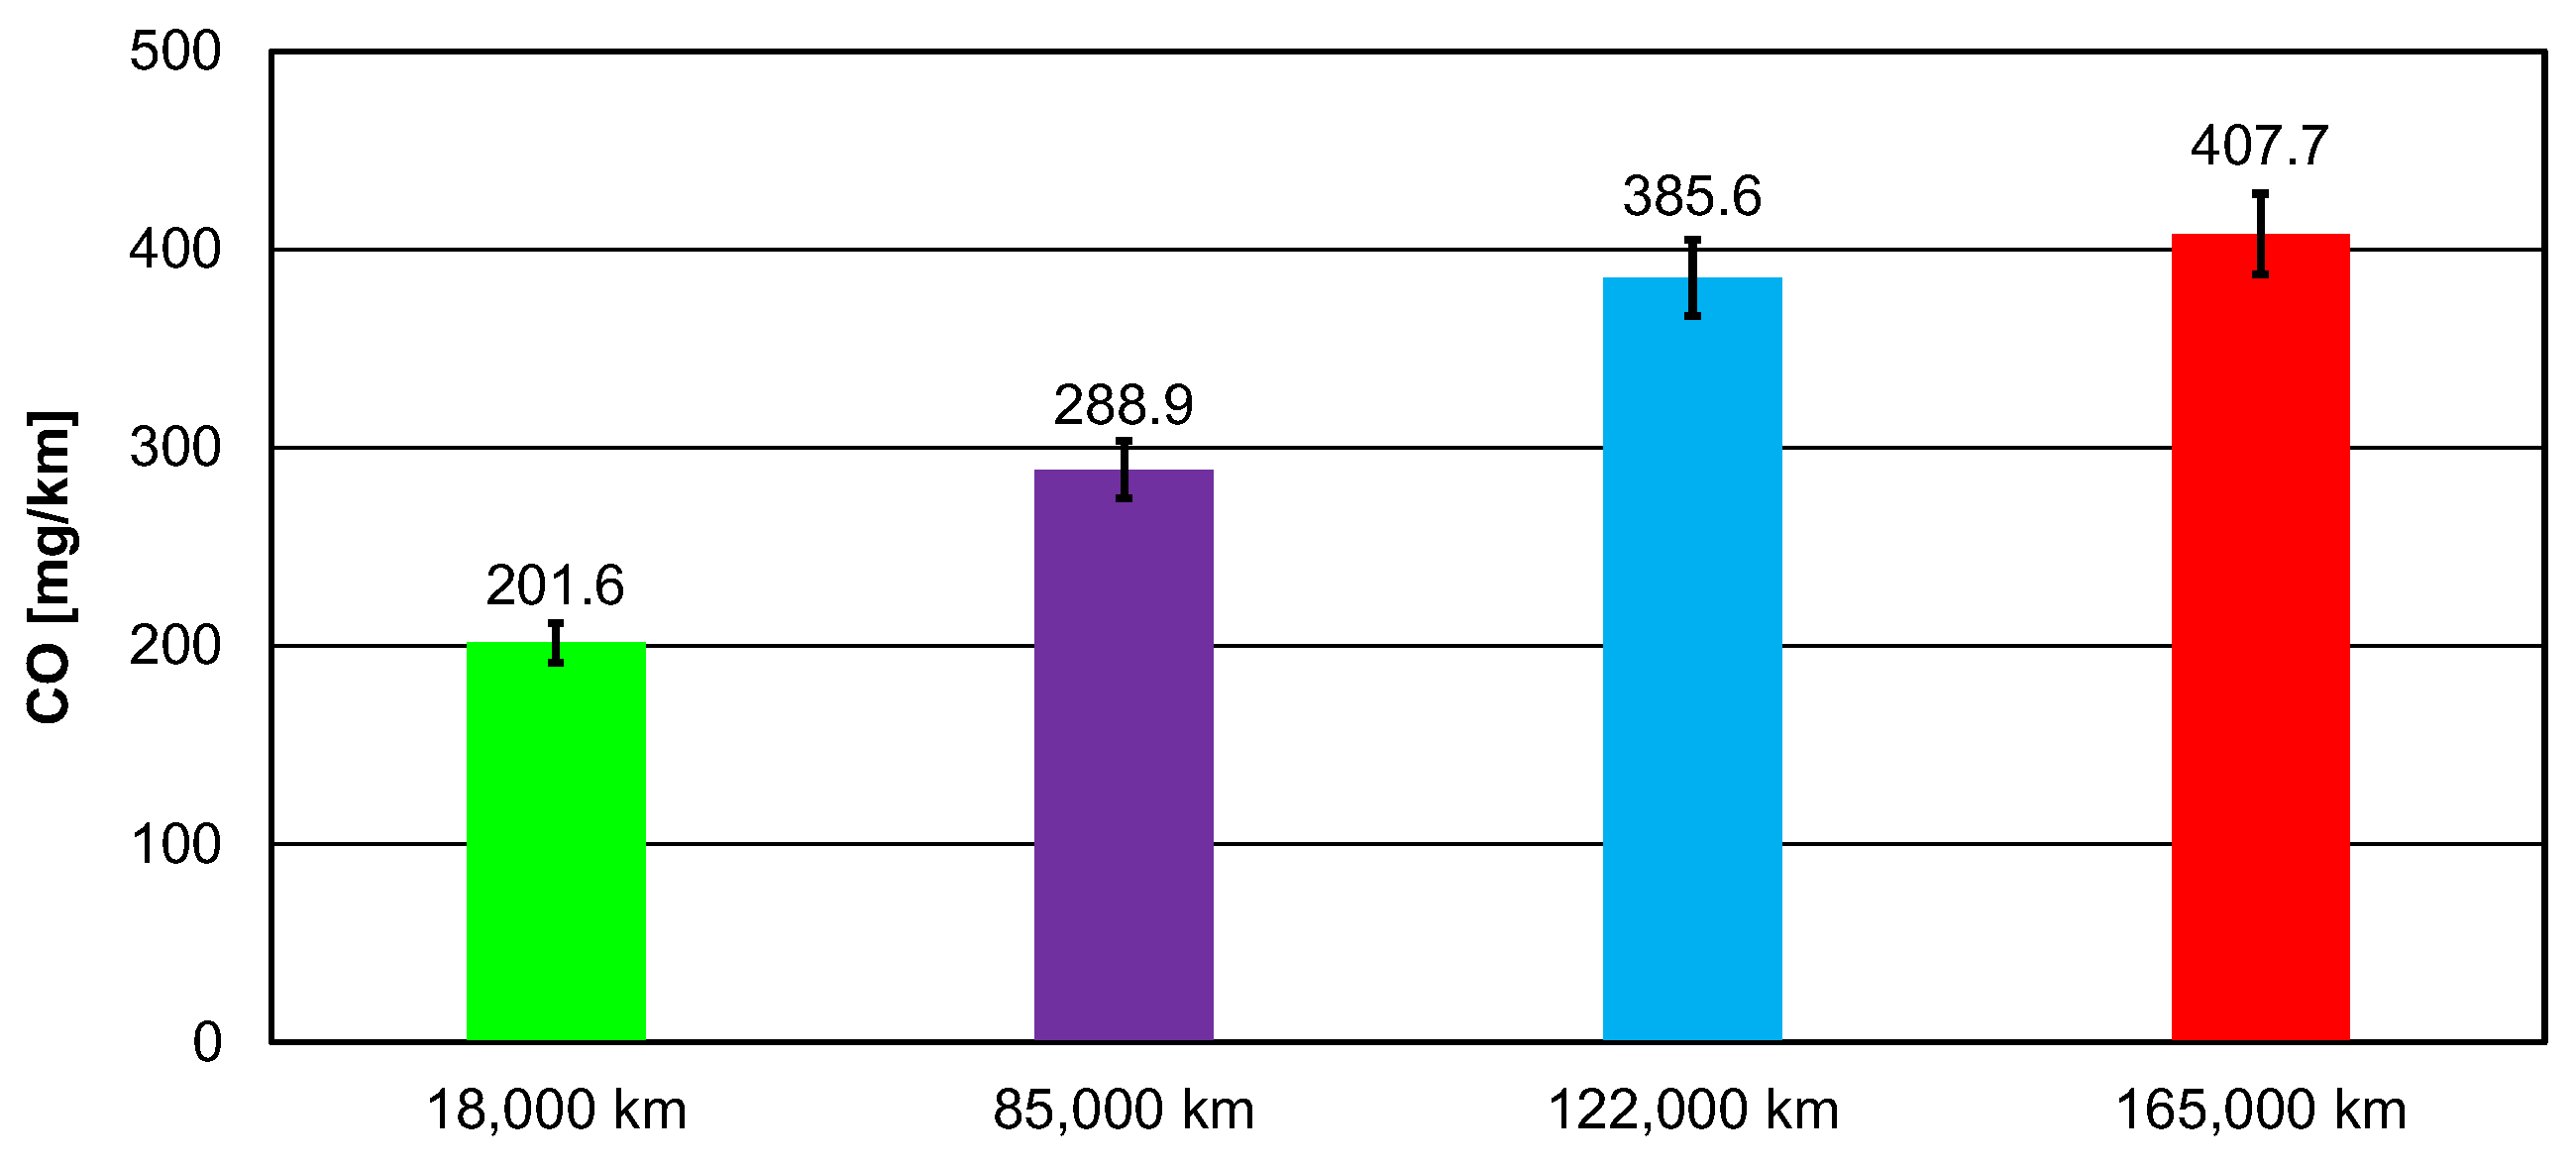
The error bars shown in below figures represent the standard deviation, which was determined based on four measurements. The main value presented in each graph corresponds to the mean value.
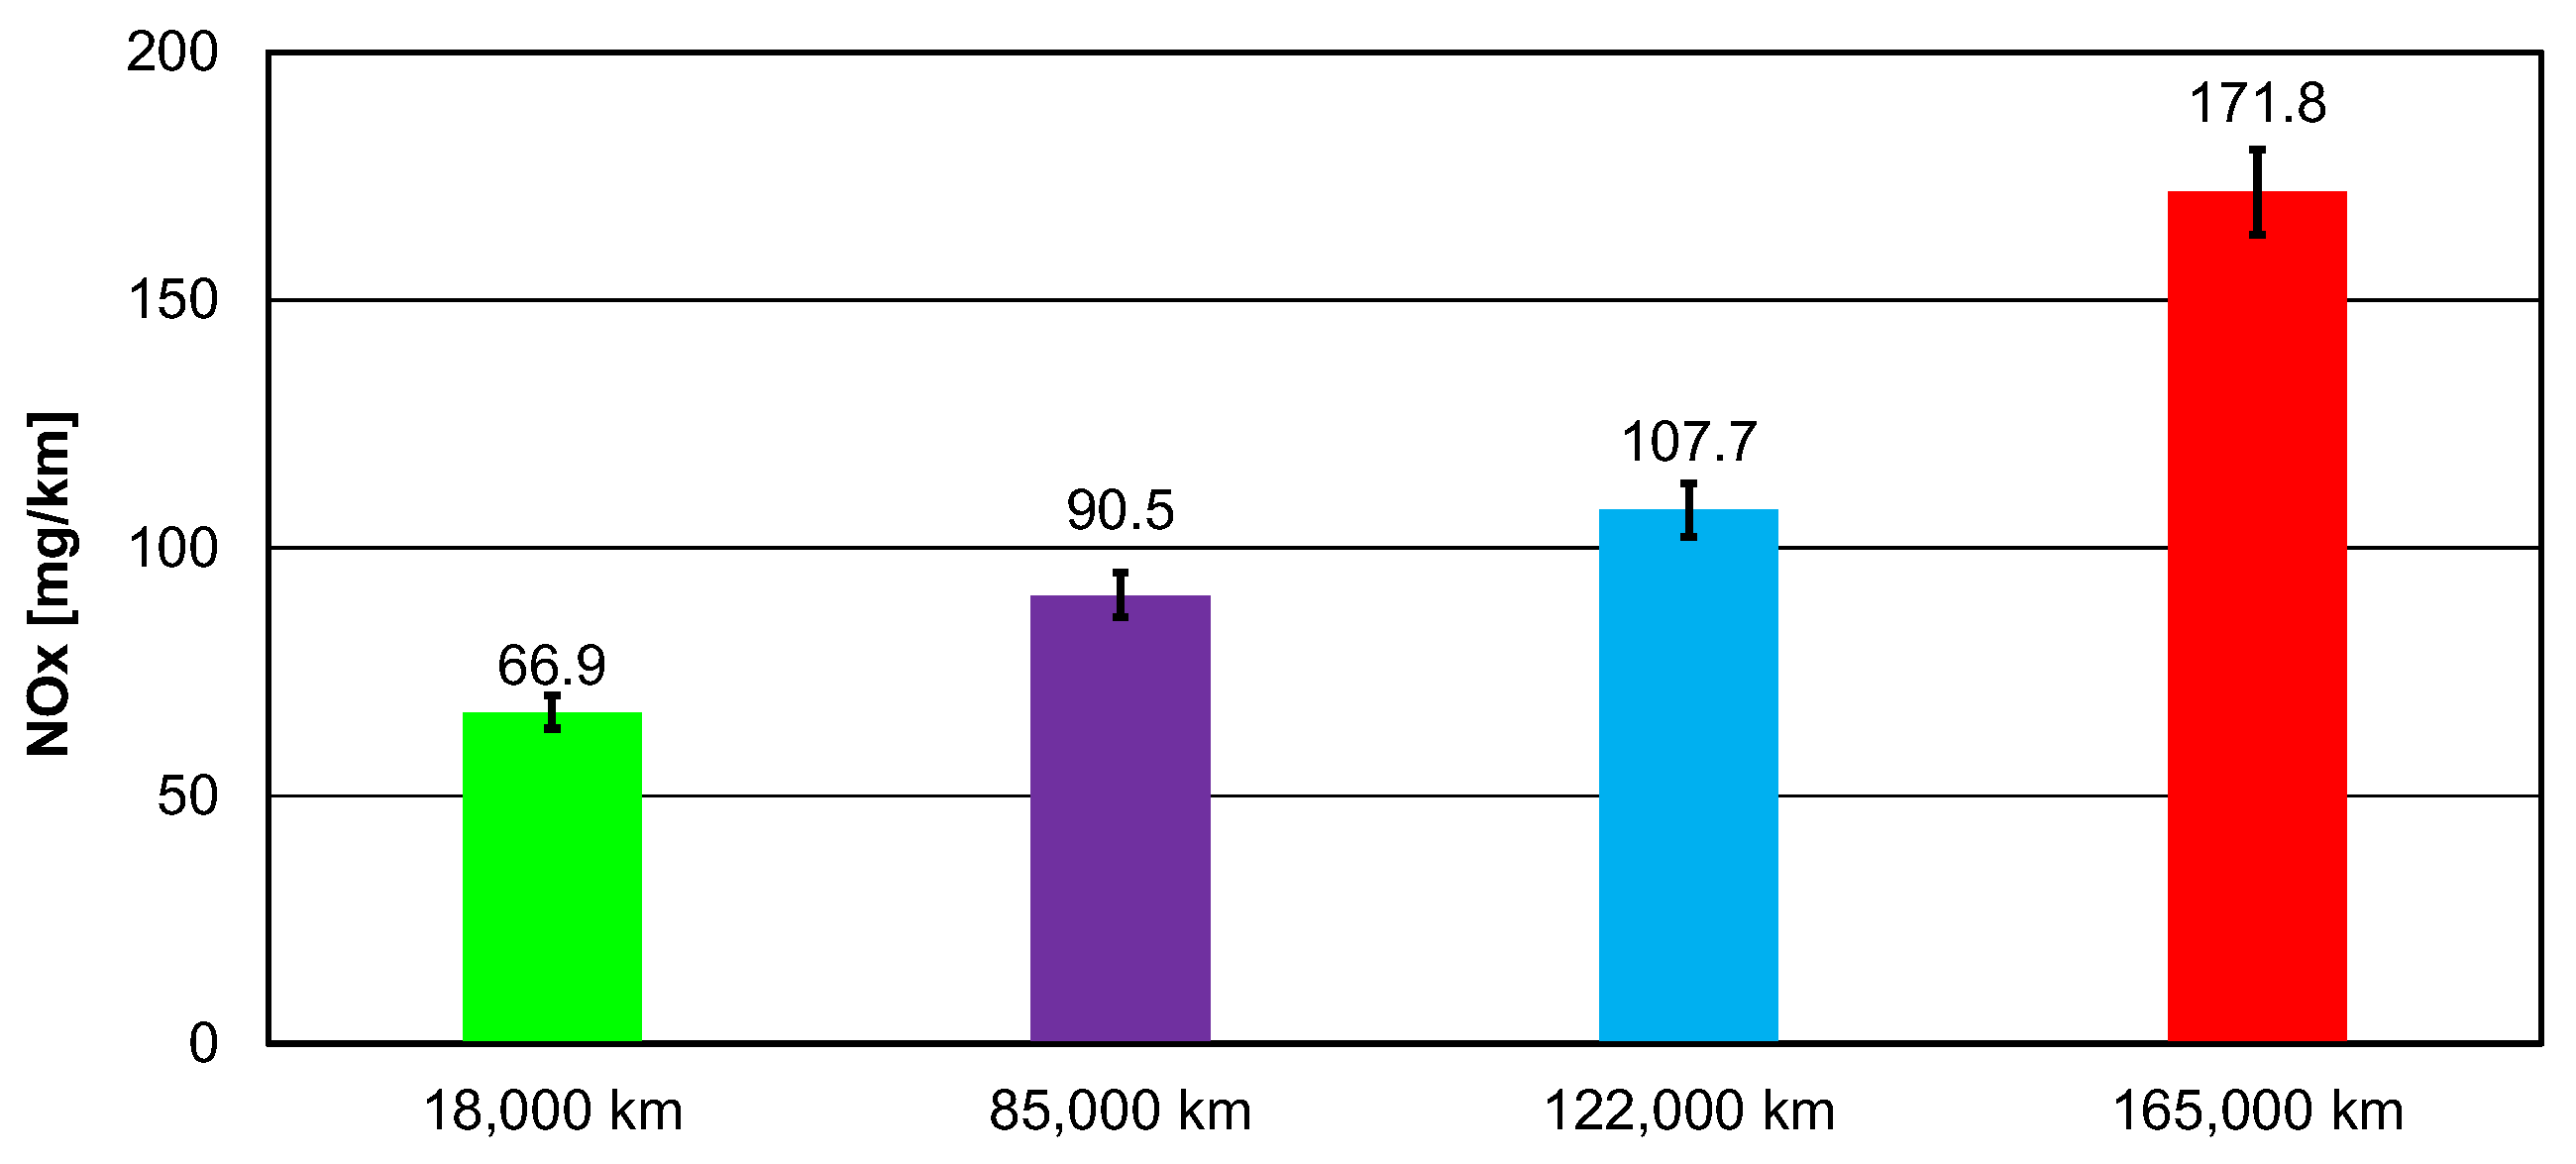
Changes in road carbon monoxide emissions are similar in nature. The initial value of 201.6 mg/km increased (at 165,000 km) more than twice—to 407.7 mg/km. This indicates a clear deterioration in the combustion process or a reduced efficiency of the exhaust gas treatment systems as mileage increases (Figure 13). Road nitrogen oxide emissions have also increased significantly (Figure 14). In the initial period of operation, these emissions amounted to 66.9 mg/km (18,000 km), increasing in subsequent measurements to 90.5 mg/km (85,000 km) and 107.7 mg/km (122,000 km), reaching 171.8 mg/km (165,000 km) at 165,000 km. This increase indicates a reduced effectiveness of exhaust gas treatment systems (possible reduced efficiency of the exhaust gas recirculation system, higher temperature in the combustion chamber or reduced efficiency of the three-way catalyst).
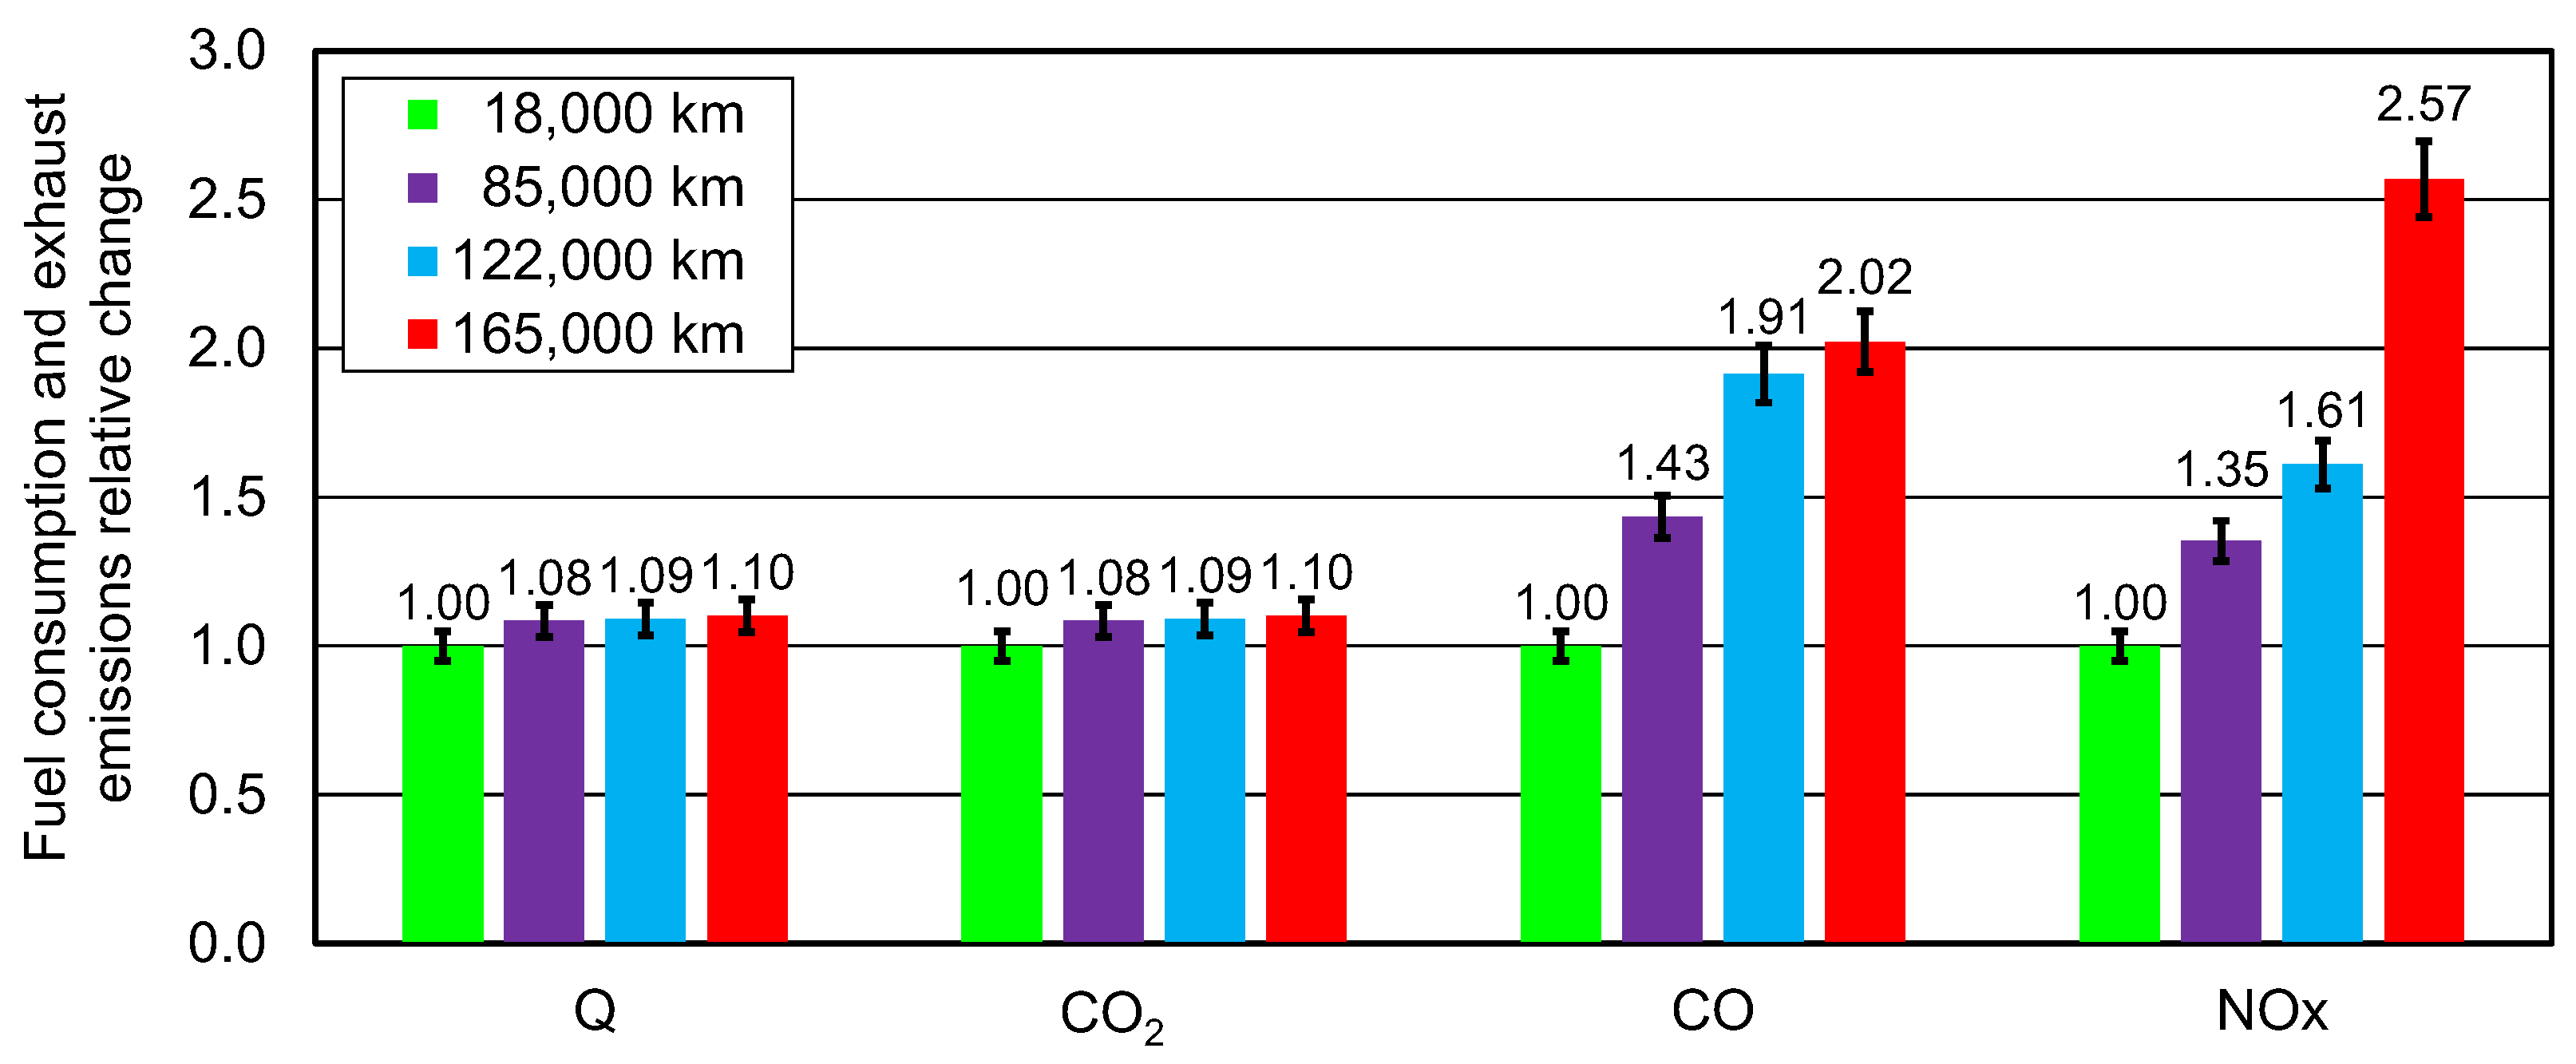
All analysed parameters (road emissions of harmful compounds and fuel consumption) confirm the thesis that as the vehicle mileage increases, so do the emissions of the discussed exhaust components, as well as fuel consumption. This means that ageing of the drive train and exhaust gas treatment systems leads to a deterioration in both the technical efficiency of the vehicle and its environmental performance. This relationship is almost proportional. Further comparative tests should be carried out on a larger number of vehicles in order to draw detailed conclusions and establish general (mathematical) relationships between vehicle performance and increased emissions of individual harmful components. The emission and fuel consumption results during the test were recorded by the testing equipment, which was operational during the tests and subject to periodic, mandatory calibration.

6. Conclusions

There are few publications in the literature with research results that demonstrate the actual impact of vehicle ageing on air pollutant emissions. A similar publication concerning diesel vehicles [20] demonstrated a significant impact of ageing on the emission of basic pollutants found in passenger car exhaust gases. However, the small number of publications in the analysed field is due to complex and time-consuming research procedures. The research presented in this paper was conducted over an eight-year period of vehicle operation. Furthermore, considering the time-consuming process of each test and the necessary preparation of the vehicle and route, there are very few results of this type of testing, and there is a lack of data for analysis to be used to develop a method for estimating changes in air pollutant emissions during the operation of passenger vehicles. As part of the research conducted using specialised equipment, the emissions of basic air pollutants, i.e., the concentration of carbon monoxide, carbon dioxide and nitrogen oxides, were determined and correlated with the operating history of the tested petrol vehicle (Figure 15).
The conclusions from the RDE tests are as follows:
  • the change in carbon dioxide emissions (and thus fuel consumption) during the entire operational test increased by approximately 10% (the largest increase of 8% occurred after the test at 85,000 km); the subsequent increase was not as significant;
  • the change in road carbon monoxide emissions was linear up to a mileage of approximately 120,000 km, and in this test, it was more than 90% higher than in the test at 18,000 km; in the latest test, it increased by less than 5%;
  • the change in road nitrogen oxide emissions was the greatest of all exhaust components tested during the petrol vehicle’s road tests; after approx. 100,000 km, there was an increase of approx. 50–60%, and a subsequent test after 165,000 km revealed an increase in NOx emissions of approximately 150% compared to the first test.
Operating age affects air pollutant emissions for both diesel- and gasoline-powered vehicles. This is confirmed by the presented research results for gasoline-powered vehicles and those already published [20] for diesel-powered vehicles. Analysing the obtained research results and comparing the air pollutant emissions for gasoline- and diesel-powered vehicles, it can be concluded that:
  • For diesel-powered vehicles [20], NOx emissions in the RDE tests performed were 70% higher for vehicles with mileage higher than 86,000 km. CO emissions were 23% higher for vehicles with mileage higher than 86,000 km, while CO2 emissions were 19% higher for vehicles with mileage higher than 86,000 km.
  • For petrol-powered vehicles, NOx emissions in the RDE tests were approximately 35% higher for a mileage of 85,000 km. CO emissions were 43% higher for a mileage of 85,000 km, while CO2 emissions were approximately 8% higher for a mileage of 85,000 km.
It can therefore be assumed that in Poland, where the average annual mileage of passenger cars is nearly 17,000 km, vehicles over 5 years old have air pollutant emissions higher than those declared by their manufacturers, regardless of the type of fuel used, i.e., gasoline or diesel. The results obtained in this study refer to a single vehicle. Previous studies conducted for diesel-powered vehicles [20] were performed on seven vehicles whose engines had similar displacement but whose technical condition and driving styles varied. Therefore, the results presented in this article are novel compared to previous publications. However, research limitations related to the small population of vehicles tested should be considered. In this context, continuing similar studies on a bigger population of vehicles with conventional engines is advisable.

Author Contributions

Conceptualization, J.P. and P.P.; methodology, J.P. and P.P.; software, J.P. and P.P.; validation, J.P. and P.P.; formal analysis, J.P. and P.P.; investigation, J.P. and P.P.; resources, J.P. and P.P.; data curation, J.P. and P.P.; writing—original draft preparation, J.P. and P.P.; writing—review and editing, J.P. and P.P.; visualisation, J.P. and P.P.; supervision, J.P. and P.P.; project administration, J.P. and P.P.; funding acquisition, J.P. and P.P. All authors have read and agreed to the published version of the manuscript.

Funding

This research received no external funding.

Data Availability Statement

The original contributions presented in this study are included in the article material. Further inquiries can be directed to the corresponding author.

Acknowledgments

The paper was developed as part of a research project supporting scientific activity in the field of Civil Engineering and Transport titled “Remote Sensing Method for Measuring the Environmental Impact of Transport Means in Terms of Air Pollutant Emissions, Vibrations and Noise”.

Conflicts of Interest

The authors declare no conflicts of interest.

Abbreviations

The following abbreviations are used in this manuscript:
AMAApproved Mileage Accumulation
BEVBattery Electric Vehicle
CLTCChina Light-Duty Test Cycle
CNGcompressed natural gas
COCarbon Monoxide
CO2Carbon Dioxide
CSRDCorporate Sustainability Reporting Directive
DFDilution Factor
DPFDiesel Particulate Filter
EPAEnvironmental Protection Agency
ESGEnvironmental, Social and corporate Governance
FIDFlame Ionisation Detector
GBDTGradient Boosting Decision Tree
HDVHeavy-Duty Vehicle
HEVHybrid Electric Vehicle
ICEInternal Combustion Engine
MMotorway
NDIRNon-Dispersive Infrared
NDUVNon-Dispersive Ultraviolet
NMVOCNon-Methane Volatile Organic Compound
NOxNitrogen Oxides
OBDOn-Board Diagnose
PHEVPlug-in Hybrid Electric Vehicle
PMParticulate Matter
PNParticle Number
RRural
RDEReal Driving Emissions
RPARelative positive acceleration
SHAPShapley Additive Explanations
SRCStandard Road Cycle
UUrban
USUnited States
VVelocity
V·a+ [95]95th percentile of the product of vehicle speed and positive acceleration
WLTCWorldwide harmonised Light-duty Test Cycle

References

  1. Eickenhorst, R.; Koch, T. An experimental study on aging effects of fuel-cut events including sound optimized torque reduction on modern three-way catalysts. Automot. Engine Technol. 2024, 9, 4. [Google Scholar] [CrossRef]
  2. Quarterly Report by PZPM and KPMG, Q2/2025, Automotive Industry. Available online: https://www.pzpm.org.pl/pl/Publikacje/Raporty (accessed on 1 September 2025).
  3. Balcerzyk, D. Rejestracje Samochodów Osobowych i Dostawczych w Sierpniu 2025 roku [Registrations of Passenger Cars and Light Commercial Vehicles in August 2025]. Available online: https://www.samar.pl/rynek-w-liczbach/rejestracje-nowych-samochodow-osobowych-i-dostawczych-2025-2025 (accessed on 1 September 2025).
  4. Automotive Industry Report, 2024/2025. Polish Automotive Industry Association. Available online: https://www.pzpm.org.pl/en/content/download/11094/68141/file/RAPORT_PZPM_07_12_2024_lekki.pdf (accessed on 3 September 2025).
  5. Emissions Distributions by Vehicle Age and Policy Implications. TRUE—The Real Urban Emissions Initiative, FIA Foundation, 2020. Available online: https://theicct.org/sites/default/files/publications/US-TRUE-emissions-distribution-oct2020.pdf (accessed on 22 September 2025).
  6. Corporate Sustainability Reporting, 2025. Available online: https://finance.ec.europa.eu/capital-markets-union-and-financial-markets/company-reporting-and-auditing/company-reporting/corporate-sustainability-reporting_en (accessed on 13 September 2025).
  7. Dornoff, J.; Rodríguez, F. Euro 7: The New Emission Standard for Light-and Heavy-Duty Vehicles in the European Union. 2024. Available online: https://theicct.org/wp-content/uploads/2024/03/ID-116-%E2%80%93-Euro-7-standard_final.pdf (accessed on 12 September 2025).
  8. Borken-Kleefeld, J.; Chen, Y. New emission deterioration rates for gasoline cars-Results from long-term measurements. Atmos. Environ. 2015, 101, 58–64. [Google Scholar] [CrossRef]
  9. Davison, J.; Bernard, Y.; Borken-Kleefeld, J.; Farren, N.; Hausberger, S.; Sjödin, Å.; Tate, J.; Vaughan, A.; Carslaw, D. Distance-based emission factors from vehicle emission remote sensing measurements. Sci. Total Environ. 2020, 739, 139688. [Google Scholar] [CrossRef] [PubMed]
  10. Mahesh, S.; McNabola, A.; Smith, W.; Timoney, D.; Ekhtiari, A.; Fowler, B.; Willis, P.; Rose, R.; Wareham, J.; Walker, H.; et al. On-road remote sensing of vehicles in Dublin: Measurement and emission factor estimation. Transp. Res. Part D Transp. Environ. 2023, 117, 103620. [Google Scholar] [CrossRef]
  11. Ntamwiza, J.M.V.; Ishimwe, N. Assessing the impact of vehicle characteristics on exhaust emissions in Rwanda: A study of gasoline engine vehicles amidst urbanization and transportation growth. Urban Plan. Transp. Res. 2025, 13, 1. [Google Scholar] [CrossRef]
  12. Wang, Y.; Xing, Z.; Zhang, H.; Wang, Y.; Du, K. On-road mileage-based emission factors of gaseous pollutants from bi-fuel taxi fleets in China: The influence of fuel type, vehicle speed, and accumulated mileage. Sci. Total Environ. 2022, 819, 151999. [Google Scholar] [CrossRef]
  13. Ligterink, N.E.; Kadijk, G.; Elstgeest, M.; van Mensch, P. Emission Compliance Over the Lifespan of a Vehicle. Research Group Sustainable Transport and Logistics. Available online: https://publications.tno.nl/publication/34634061/8uWBz9/ligterink-2019-emission.pdf (accessed on 9 September 2025).
  14. Wang, J.; Xu, Z.; Lu, W.; Ding, Y.; Wang, Y.; Hao, L.; Ge, Y. Emission durability of a China-6 light-duty gasoline vehicle. Sustainability 2024, 6, 7526. [Google Scholar] [CrossRef]
  15. Zardini, A.; Giechaskiel, B.; Martini, G. Durability Demonstration Programme for EURO6 Passenger Cars: Thermal Load to After-Treatment Systems; Final report, EUR 29278 EN; Publications Office of the European Union: Luxembourg, 2018. [Google Scholar] [CrossRef]
  16. Alves, C.A.; Lopes, D.J.; Calvo, A.I.; Evtyugina, M.; Rocha, S.; Nunes, T. Emissions from light-duty diesel and gasoline in-use vehicles measured on chassis dynamometer test cycles. Aerosol Air Qual. Res. 2015, 15, 99–116. [Google Scholar] [CrossRef]
  17. Wang, Y.; Hao, C.; Ge, Y.; Hao, L.; Tan, J.; Wang, X.; Zhang, P.; Wang, Y.; Tian, W.; Lin, Z.; et al. Fuel consumption and emission performance from light-duty conventional/hybrid-electric vehicles over different cycles and real driving tests. Fuel 2020, 278, 118340. [Google Scholar] [CrossRef]
  18. Targa, J.; Colina, M.; Banyuls, L.; González Ortiz, A.; Soares, J. Status Report of Air Quality in Europe for Year 2024, Using Validated and Up-to-Date Data (ETC-HE Report 2025/1). European Topic Centre on Human Health and the Environment, 2024. Available online: https://www.eionet.europa.eu/etcs/all-etc-reports (accessed on 6 September 2025).
  19. The Real World Emissions Driving Test: 2017 Fuel Economy and Emissions Report. Australian Automobile Association, ABMARC. 2017. Available online: https://www.aaa.asn.au/wp-content/uploads/2018/03/Real-World-Driving-Emissions-Test-Summary-Report.pdf (accessed on 11 September 2025).
  20. Pryciński, P.; Pielecha, J.; Korzeb, J.; Jachimowski, R.; Pielecha, P. Impact of vehicle aging and mileage on air pollution emissions. Energies 2025, 18, 939. [Google Scholar] [CrossRef]
  21. Sowa, T. Przebieg Samochodu a Jego Wiek-Czy Duża Liczba na Liczniku Musi Oznaczać, że Pojazd Jest Stary? [Car Mileage and Age-Does a High Number on the Odometer Necessarily Mean that the Vehicle is Old?]. Available online: https://mubi.pl/poradniki/przebieg-samochodu-a-jego-wiek/ (accessed on 2 September 2025).
  22. Varma, M.; Mal, H.; Pahurkar, R.; Swain, R. Comparative analysis of greenhouse gases emission in conventional vehicles and electric vehicles. Int. J. Adv. Sci. Technol. 2020, 29, 689–695. [Google Scholar]
  23. Czarnecki, P. Ile Wytrzymuje Bateria w Samochodzie Elektrycznym? [How Long Does the an Electric Car Battery Last?]. Available online: https://www.toyota-okecie.pl/ile-wytrzymuje-bateria-w-samochodzie-elektrycznym (accessed on 12 September 2025).
  24. Pryciński, P. Selected emissivity assessment issues for electric and hybrid vehicles. Combust. Engines 2025, 202, 27–35. [Google Scholar] [CrossRef]
  25. Malik, F.H.; Ayadi, W.; Hussain, G.A.; Haider, Z.M.; Alkhatib, F.; Lehtonen, M. Evaluating carbon emissions: A lifecycle comparison between electric and conventional vehicles. World Electr. Veh. J. 2025, 16, 287. [Google Scholar] [CrossRef]
  26. Huang, Y.; Surawski, N.C.; Organ, B.; Zhou, J.L.; Tang, O.H.; Chan, E.F. Fuel consumption and emissions performance under real driving: Comparison between hybrid and conventional vehicles. Sci. Total Environ. 2019, 659, 275–282. [Google Scholar] [CrossRef]
  27. Zachariadis, T.; Ntziachristos, L.; Samaras, Z. The effect of age and technological change on motor vehicle emissions. Transp. Res. Part D Transp. Environ. 2001, 6, 221–227. [Google Scholar] [CrossRef]
  28. Mądziel, M. Modeling exhaust emissions in older vehicles in the era of new technologies. Energies 2024, 17, 4924. [Google Scholar] [CrossRef]
  29. Zhimei, Q.; Xiong, Y.; Tian, H.; Deng, X.; Qin, P.; Zhan, Y.; Wang, B.; Zeng, X. Influential factors for the emission inspection results of urban in-use vehicles: From an ensemble learning perspective. J. Air Waste Manag. Assoc. 2022, 72, 815–827. [Google Scholar] [CrossRef]
  30. Yan, L.; Zhang, Q.; Zheng, B.; He, K. Modeling fuel-, vehicle-type-, and age-specific CO2 emissions from global on-road vehicles in 1970–2020. Earth Syst. Sci. Data 2024, 16, 4497–4509. [Google Scholar] [CrossRef]
  31. Sharmilaa, G.; Ilango, T. A review on influence of age of vehicle and vehicle traffic on air pollution dispersion. Mater. Today Proc. 2022, 60, 1629–1632. [Google Scholar] [CrossRef]
  32. Caserini, S.; Pastorello, C.; Gaifami, P.; Ntziachristos, L. Impact of the dropping activity with vehicle age on air pollutant emissions. Atmos. Pollut. Res. 2013, 4, 282–289. [Google Scholar] [CrossRef]
  33. Lyu, L.; Wang, J.; Yin, H.; Ji, Z.; Tan, J.; Hao, L.; Ge, Y. Accelerated aging for after-treatment devices of diesel engine: Method, emission characteristics, and equivalence. Appl. Energy 2024, 355, 122234. [Google Scholar] [CrossRef]
  34. Kunwar, D.; Carrillo, C.; Xiong, H.; Peterson, E.; DeLaRiva, A.; Ghosh, A.; Datye, A.K. Investigating anomalous growth of platinum particles during accelerated aging of diesel oxidation catalysts. Appl. Catal. B Environ. 2020, 266, 118598. [Google Scholar] [CrossRef]
  35. Schmieg, S.J.; Oh, S.H.; Kim, C.H.; Brown, D.B.; Lee, J.H.; Peden, C.H.; Kim, D.H. Thermal durability of Cu-CHA NH3-SCR catalysts for diesel NOx reduction. Catal. Today 2012, 184, 252–261. [Google Scholar] [CrossRef]
  36. Anilovich, I.; Hakkert, A.S. Survey of vehicle emissions in Israel related to vehicle age and periodic inspection. Sci. Total Environ. 1996, 189, 197–203. [Google Scholar] [CrossRef]
  37. Liu, H.; Qi, L.; Liang, C.; Deng, F.; Man, H.; He, K. How aging process changes characteristics of vehicle emissions? A review. Crit. Rev. Environ. Sci. Technol. 2020, 50, 1796–1828. [Google Scholar] [CrossRef]
  38. Yu, T.; Li, K.; Wu, Q.; Yao, P.; Ke, J.; Wang, B.; Wang, Y. Diesel engine emission aftertreatment device aging mechanism and durability assessment methods: A review. Atmosphere 2023, 14, 314. [Google Scholar] [CrossRef]
  39. Milojević, S.; Glišović, J.; Savić, S.; Bošković, G.; Bukvić, M.; Stojanović, B. Particulate matter emission and air pollution reduction by applying variable systems in tribologically optimized diesel engines for vehicles in road traffic. Atmosphere 2024, 15, 184. [Google Scholar] [CrossRef]
  40. Niewczas, A.; Rymarz, J.; Dębicka, E. Stages of operating vehicles with respect to operational efficiency using city buses as an example. Eksploat. I Niezawodn. Maint. Reliab. 2019, 21, 21–27. [Google Scholar] [CrossRef]
  41. Borucka, A.; Niewczas, A.; Hasilova, K. Forecasting the readiness of special vehicles using the semi-Markov model. Eksploat. I Niezawodn. Maint. Reliab. 2019, 21, 662–669. [Google Scholar] [CrossRef]
  42. Suarez-Bertoa, R.; Valverde, V.; Clairotte, M.; Pavlovic, J.; Giechaskiel, B.; Franco, V.; Astorga, C. On-road emissions of passenger cars beyond the boundary conditions of the real-driving emissions test. Environ. Res. 2019, 176, 108572. [Google Scholar] [CrossRef]
  43. Bielaczyc, P.; Merkisz, J.; Pielecha, J.; Woodburn, J. RDE-Compliant PEMS Testing of a Gasoline Euro 6d-TEMP Passenger Car at Two Ambient Temperatures with a Focus on the Cold Start Effect; SAE Technical Paper; SAE International: Warrendale, PA, USA, 2020. [Google Scholar] [CrossRef]
  44. Fuć, P.; Lijewski, P.; Siedlecki, M.; Sokolnicka, B.; Szymlet, N. Analysis of particle mass and number emission from an SI engine with direct fuel injection and a particulate filter. IOP Conf. Ser. Mater. Sci. Eng. 2018, 421, 042019. [Google Scholar] [CrossRef]
  45. Lijewski, P.; Szymlet, N.; Fuć, P.; Domowicz, A.; Rymaniak, Ł. The effect of start-stop systems on scooter exhaust emissions. Transp. Res. Part D Transp. Environ. 2021, 91, 102684. [Google Scholar] [CrossRef]
  46. Kamińska, M.; Kołodziejek, D.; Szymlet, N.; Fuć, P.; Grzeszczyk, R. Measurement of rail vehicles exhaust emissions. Combust. Engines 2022, 189, 10–17. [Google Scholar] [CrossRef]
  47. Rymaniak, L. Comparison of the combustion engine operating parameters and the ecological indicators of an urban bus in dynamic type approval tests and in actual operating conditions. MATEC Web Conf. 2017, 118, 00009. [Google Scholar] [CrossRef]
  48. Pryciński, P.; Wawryszczuk, R.; Korzeb, J.; Pielecha, P.; Murawski, J. Selected vehicle emission assessment issues in passenger transport services. Combust. Engines 2023, 195, 14–22. [Google Scholar] [CrossRef]
  49. Regulation of the Commission (EU) no. 2016/427 of 10 March 2016 Amending Regulation (EC) no. 692/2008 as Regards Emissions from Light Passenger and Commercial Vehicles. Available online: http://data.europa.eu/eli/reg/2016/427/oj (accessed on 2 September 2025).
  50. RDE Act 4. Commission Regulation (EU) 2018/1832 of 5 November 2018 Amending Directive 2007/46/EC of the European Parliament and of the Council, Commission Regulation (EC) No 692/2008 and Commission Regulation (EU) 2017/1151 for the Purpose of Improving the Emission Type Approval Tests and Procedures for Light Passenger and Commercial Vehicles, Including Those for In-Service Conformity and Real-Driving Emissions and Introducing Devices for Monitoring the Consumption of Fuel and Electric Energy. Official Journal of the European Union L 301/1. 27 December 2018. Available online: http://data.europa.eu/eli/reg/2018/1832/oj (accessed on 3 September 2025).
Figure 1. Structure of passenger vehicles registered in Poland in QI2025 by type (based on data from [2]).
Energies 18 05822 g001
Figure 2. Structure of vehicles registered in Poland in QI2025 by type (based on data from [3]).
Energies 18 05822 g002
Figure 3. Age structure of passenger vehicles in Poland in 2018–2022 (based on data from [4]).
Energies 18 05822 g003
Figure 4. Measurement method diagram (own elaboration).
Energies 18 05822 g004
Figure 5. Vehicle trip route in RDE tests, scale 1:130,000 (own elaboration).
Energies 18 05822 g005
Figure 6. Vehicle undergoing RDE testing.
Energies 18 05822 g006
Figure 7. Traffic conditions of RDE testing in: (a) urban areas, (b) rural areas, (c) motorways.
Energies 18 05822 g007
Figure 8. Speed profiles for all measurements throughout the entire vehicle service life.
Energies 18 05822 g008
Figure 9. Comparison of dynamic test parameters in real traffic conditions at different vehicle mileages: (a) 95th percentile of the product of speed and positive acceleration, (b) relative positive acceleration.
Energies 18 05822 g009
Figure 10. Cumulative mass values of: (a) carbon dioxide, (b) carbon monoxide, (c) nitrogen oxides during measurements at different vehicle mileages.
Energies 18 05822 g010
Figure 11. Road carbon dioxide emissions at different vehicle mileages (with error bars marked).
Energies 18 05822 g011
Figure 12. Fuel consumption at different vehicle mileages (with error bars marked).
Energies 18 05822 g012
Figure 13. Road carbon oxide emissions at different vehicle mileages (with error bars marked).
Energies 18 05822 g013
Figure 14. Road nitrogen oxide emissions for different vehicle mileages (with error bars marked).
Energies 18 05822 g014
Figure 15. Relative change in fuel consumption and road emissions of individual exhaust components during operational testing (with error bars marked).
Energies 18 05822 g015
Table 1. Comparison of research tests used in durability studies.
FeatureWLTCSRCAMAARTEMIS
ApplicationEmission measurement in the type approval testAccelerated ageing of exhaust gas treatment systemsAgeing cycle for determining emission deterioration factorsExhaust gas emission
assessment
Mapping traffic conditionsHighLowLowHigh
Heat loadModerateSignificant (especially for a Diesel with DPF)LowModerate
Current applicationType I approval testType V (durability, DF)Unused (obsolete)DPF durability
Table 2. Characteristics of the RDE tests performed (own elaboration).
Measurement FeatureMeasurement
No. 1
Measurement
No. 2
Measurement
No. 3
Measurement
No. 4
Vehicle mileage at time of measurement18,000 km85,000 km122,000 km165,000 km
Measurement date15 April 201711 March 201915 June 20221 August 2024
Measurement duration103.3 min111.0 min99.2 min102.62 min
Distance travelled during measurement76.73 km91.16 km76.91 km77.12 km
Measurement locationPoznań and surroundingsPoznań and surroundingsPoznań and surroundingsPoznań and surroundings
Table 3. Specification of technical inspections and repairs (own elaboration).
ActivitiesRDE Test Vehicle RepairsDateMileage
Type 1Oil change, oil filter, air filter, fuel filter, cabin filter replacementOctober 201723,000 km
Type 1Oil change, oil filter, air filter, fuel filter, cabin filter replacementOctober 201846,000 km
Type 1Oil change, oil filter, air filter, fuel filter, cabin filter replacementOctober 201970,000 km
Type 1Oil change, oil filter, air filter, fuel filter, cabin filter replacementOctober 202092,000 km
Type 1Oil change, oil filter, air filter, fuel filter, cabin filter replacementOctober 2021105,000 km
Type 1Oil change, oil filter, air filter, fuel filter, cabin filter replacementAugust 2023151,000 km
Type 1Oil change, oil filter, air filter, fuel filter, cabin filter replacementAugust 2024165,000 km
Type 2Replacement of brake pads and brake discsOctober 201846,000 km
Type 2Replacement of brake pads and brake discsOctober 201970,000 km
Type 2Replacement of brake pads and brake discsOctober 202092,000 km
Type 2Replacement of brake pads and brake discsOctober 2021105,000 km
Type 2Replacement of brake pads and brake discsAugust 2023151,000 km
Type 2Replacement of brake pads and brake discsAugust2024165,000 km
Type 3Windscreen repairNovember 2021110,000 km
Type 4NOx sensor replacementApril 2022118,000 km
Type 5Right drive shaft replacementSeptember 2024170,000 km
Table 4. Results of air pollutant emission measurements (own elaboration).
Measurement
Number
Measurement
Date
Mileage
[km]
CO2 Emission [g/km]CO Emission [mg/km]NOx Emission [mg/km]
Measurement 115 April 201718,000196.97201.5666.90
Measurement 211 March 201985,000213.53288.9890.47
Measurement 315 June 2022122,000214.74385.65107.72
Measurement 41 August 2024165,000216.93407.74171.78
Table 5. Static parameters of emission tests performed.
Parameter18,000 km85,000 km122,000 km165,000 km
Urban (U) [km]27.6925.9125.6526.61
Rural (R) [km]28.9831.8027.2029.04
Motorway (M) [km]22.0833.4524.0721.47
Total trip [km]76.7391.1676.9177.12
Urban share [%]36.0828.4233.3534.50
Rural share [%]35.1334.8935.3637.65
Motorway share [%]28.7836.6931.2927.84
Urban: average speed [km/h]23.1222.2923.5122.96
Urban: stop share [%]28.3928.9023.4328.31
Average speed (cold phase) [km/h]20.9319.1820.0121.45
Max speed (cold phase) [km/h]55.1947.3048.7549.24
Stop time (cold phase) [s]42.0033.0066.0045.00
Time trip [min]103.30111.0099.17102.62
Table 6. Emission data for the different traffic conditions.
Test PhaseMileageCO2 [g/km]CO [mg/km]NOx [mg/km]Q [L/100 km]
Urban18,000 km272.01321.2831.5310.71
85,000 km336.501264.09138.6313.26
122,000 km314.371135.42133.7912.39
165,000 km319.90979.95135.1212.61
Rural18,000 km143.79185.3445.065.65
85,000 km160.31378.48176.026.32
122,000 km162.45183.60127.336.40
165,000 km160.57312.04179.546.33
Motorway18,000 km167.7971.28137.906.61
85,000 km168.88145.57201.246.65
122,000 km167.67139.34148.406.61
165,000 km165.55232.35377.076.52
Disclaimer/Publisher’s Note: The statements, opinions and data contained in all publications are solely those of the individual author(s) and contributor(s) and not of MDPI and/or the editor(s). MDPI and/or the editor(s) disclaim responsibility for any injury to people or property resulting from any ideas, methods, instructions or products referred to in the content.