1. Introduction
In recent decades, especially since the 1950s, the world has been faced with a rapid population increase; the current world population is more than 8 billion. The size of the global population is projected to continue rising to 11 billion in 2100 when it is expected to stabilize [
1]. The modern world faces the problem of global warming and the emission of harmful greenhouse gases due to the growing use of fossil fuels. The most important mechanisms for the fight against climate change are increasing energy efficiency in all sectors and the introduction of renewable energy sources.
Due to rapid technological progress and the limited capacity of arable land, energy consumption in the agricultural sector has increased. Energy use in agriculture depends on the country’s development level and the applied agricultural practices. Geographical location also plays an important role. Poor and developing countries have limitations due to energy availability, low use of modern technologies, and high use of manual labor. Developed countries have higher goals, such as optimizing energy consumption, reducing greenhouse gas emissions, and applying renewable energy technologies [
2].
Energy consumption in the agriculture sector has a small share of global energy consumption, even in developing countries. In OECD countries, a share of 3–5% of total energy consumption is related to agriculture; in developing countries, energy consumption in the agriculture sector is in the range of 4–8% [
3]. Many studies have discussed energy use in agriculture in the EU, but they are often limited to specific conditions and products. In 2012, the energy consumption of the 27 EU countries in the “agriculture/forestry” sector was 1.071 PJ, or 2.2% of the final energy consumption in the EU [
4]. The last data and analysis showed that annual energy use in the agricultural sector in the EU is 1431 PJ, which corresponds to 3.7% of total energy consumption in the European Union [
5,
6]. Most of this energy comes from non-renewable energy sources. In agriculture, energy is used directly and indirectly. Direct energy use includes energy consumed for heating, cooling, lighting, electric equipment, machinery, irrigation, transportation, harvesting, and basic farm operations. Indirect energy use refers to energy used for inputs necessary for agricultural production (fertilizers, pesticides, seeding material) [
7].
Modern agriculture today is based on greenhouses, which are widely used for the indoor cultivation of flowers, vegetables, and other agricultural products. They are designed to provide better quality plants that grow out of season in a controlled environment, protected from wind, rain, snow, and inappropriate conditions [
8]. Despite their small share in total energy consumption, greenhouses are great energy consumers. Greenhouse energy efficiency and greenhouse gas emissions can be significantly improved by using renewable energy technology. In that way, the dependence of the agricultural sector on fossil fuels was also reduced. The application of solar technology in greenhouses can be an adequate substitute for energy resources because solar energy technology provides inexhaustible and clean energy with low GHG emissions [
9].
Solar greenhouses are designed to collect solar energy (with passive or active solar systems) during sunny days and store heat for use at night or during cloudy periods. It can be said that solar greenhouses use the maximum potential of solar energy primarily for heating but also for lighting [
7]. This type of greenhouse is a single-slope greenhouse, which has a glass south-oriented roof, while the north-oriented roof and side walls are heat-insulated, made from different non-massive constructions [
10]. Active solar systems, like photovoltaics, can be used for electricity production. Different systems can be used for greenhouse heating, but the best solution is the ground source pump because it provides energy for both heating and cooling throughout the year [
11,
12,
13]. Implementing a ventilation system regulates the overheating and the relative air humidity in the greenhouse [
14]. The first greenhouse energy analyses were carried out in the 1970s, after the oil crisis and the rising energy prices, when the search for alternative energy solutions began [
2]. In recent decades, a large number of scientists have investigated various designs of greenhouses and the possibility of improving their energy efficiency with renewable energy technologies. These analyses are certainly useful for the long-term sustainability program because they are closely related to energy efficiency and environmental protection.
Photovoltaic implementation at greenhouses and the improvement in greenhouse energy efficiency through the variation in different parameters were the subject of numerous investigations and analyses. Dragicevic [
15] analyzed the optimum orientation of a greenhouse for different climatic conditions in the city of Belgrade to maximize the amount of collected solar energy. The influence of solar greenhouse shape on its energy behavior and thermal conductivity is investigated by Mobtaker et al. [
16]. Bazgaou et al. modeled different greenhouses (various types of glazing) in TRNSYS, and energy analysis showed that a certain amount of heating/cooling energy could be saved by using Argon Double Glazing [
17]. Hassanien et al. [
18] presented a review of the solar energy applications in greenhouses (for cooling, heating, and lighting) and energy generated by photovoltaics. The same topic is analyzed by Gorjian et al. [
11]. Kumar, in his paper, also considered solar technology implementation in greenhouses. He concluded that the main problem was the shading effect and recommended semi-transparent PV technology as a reasonable solution for environmentally friendly electricity generation [
12]. Yano and Cossu [
19] presented a review of different PV module applications in solar greenhouses, with attention to electricity consumption and PV shading effects on plants. Trypanagnostopoulos et al., in their paper [
20], investigated the influence of different PV installations (fixed and sun-tracking) on the plant shading in the greenhouse. Gao et al. conducted energy analyses of a greenhouse with sun-tracking PV modules and concluded that sun-tracking increases energy generation by 7.40% compared to the fixed position [
21]. Cuce et al., in their paper [
22], considered PV modules in greenhouses among the other renewable strategies, and they found that an energy saving of 80% can be achieved by adding renewable technologies to the conventional greenhouse. Fatnassi et al. [
23] analyzed two different prototypes of greenhouses (symmetric and asymmetric) with PV panels (placed straight-line and checkerboard) with a CFD model. Results showed that the greenhouse model with checkerboard-placed PV has a better distribution of solar energy. Some authors discussed the implementation of modern photovoltaic technology in greenhouses—such as building-integrated photovoltaics [
16,
24,
25]. This type of semi-transparent PV cells is very attractive because of enhanced thermal stabilization. The payback period of modern solar greenhouses with photovoltaic modules is analyzed by Wang et al. [
26]. They investigated solar greenhouses in China, and the result for the payback period was less than 9 years.
A ground-source heat pump (GSHP) is a good replacement alternative for a conventional heating, ventilation, and air conditioning (HVAC) system (fossil fuel-based). Also, GSHP can work only with renewable energy [
27]. That is why this solution is suitable for greenhouses, which can be located in rural areas, far from the electricity distribution network. Many scientists have been researching the application of heat pumps in greenhouses in the last few years. Urbancl et al. [
28] presented solutions for greenhouse heating with geothermal potential for two different locations—Slovenia and Serbia. Vadiee and Martin studied energy flows in a closed greenhouse. The result of their investigation was that GSHP is a good choice for greenhouse heating/cooling, compared with a gas-burning heating system and an evaporative cooling system [
29]. Benli, in his paper [
30], analyzed horizontal and vertical GSHP for greenhouse heating, and the conclusion is that vertical GSHP is a better solution due to its performance (COP and temperature changes). Simulations were conducted for mild climate regions in Turkey. Noorollahi et al. performed the numerical and economic analysis of a greenhouse with a GSHP and gas heating system in Iran [
31]. They concluded that GSHP in Iran is not cost-effective because of the low price of natural gas and the higher initial costs of GSHP systems. D’Arpa et al. conducted a similar analysis for greenhouses in Italy [
32]. Yang and Rhee evaluate surplus air thermal energy in the Korean greenhouse with a ground-source heat pump. Greenhouses operated during the cold season, and the maximum energy saving was 25.7% monthly [
33]. Hou et al. provided a numerical simulation of a solar greenhouse with GSHP using the EnergyPlus software. The obtained results for average values of COP were 4.66 and 5.35 for heating and cooling, respectively [
34]. Zhou et al. compared hybrid heating systems with groundwater source heat pump systems and fuel oil heaters. Heat pumps saved 36% of energy and reduced CO
2 emissions by 49% [
35]. Russo et al. [
36] carried out energy and environmental analysis for the Photovoltaic-Geothermal Heat Pump integrated system in a greenhouse. In comparison with conventional petroleum air generators, the energy payback time was 1 year, and the emission payback time was 2.25 years for the heat pump system. The investigation of solar greenhouses with GHSP and PV in the Mediterranean climate is presented in [
37]. Solar greenhouses located in Albenga, Italy, are modeled using the EnergyPlus software, and the results obtained showed good agreement with experimental measurements for an appropriate greenhouse in the same location.
Zero-net-energy greenhouses can be achieved by the simultaneous application of multiple renewable energy technologies. Jiang et al. investigated solar greenhouses in the cold climate of China, and they have attained energy optimization with the aim of reaching zero-net-energy solar greenhouses. The greenhouse model had PV modules and a payback period of 5.23 years [
38]. Yildirim and Bilir [
13] evaluated a greenhouse with a hybrid system (PV and GSHP) in the Mediterranean climate. Renewable energy technologies cover greenhouse energy consumption with a rate from 86.8% to 104.5%, achieving the zero-net-energy greenhouse concept. Sun et al. [
39] analyzed the possibilities for improving the energy efficiency of the Chinese greenhouse and achieving a near-zero-energy solar greenhouse. A new form of solar greenhouse included internal and external insulation and a ground-source heat pump.
The city of Kragujevac, located in Šumadija, central Serbia, has a moderate continental climate and extremely good conditions for agricultural production. In recent years, the number of greenhouses in the entire territory of Šumadija has increased significantly. Some of them are designed as solar greenhouses to use the good potential of solar energy as much as possible (mean annual insolation at the city of Kragujevac is 1447.85 kWh/m
2 [
40]). Previous research has shown that in the Serbia and Balkan regions, there are no studies investigating greenhouses. Considering the growing number of greenhouses, the increase in agricultural production, and increasing energy consumption, there is a need to find energy-efficient solutions for greenhouses, which include renewable energy sources. From a review of previous research in this area, it can be concluded that the implementation of photovoltaics and GSHP in solar greenhouses can save a large amount of energy and CO
2 emission, which will be presented in subsequent investigations.
In this paper, energy optimization of solar greenhouses with GSHP and photovoltaics (located in Kragujevac, Serbia) is performed. GSHP provides energy for heating in the winter period, as well as energy for cooling in the summer period, while the PV array generates electricity, which can be used for lighting, fans, and GSHP operation (
Figure 1). A photovoltaic system is an on-grid system that can store surplus electricity in the electricity grid or purchase it when it cannot meet the greenhouse’s electricity needs. The aim of energy optimization is to minimize the primary energy consumption in the greenhouse. At the optimal position of greenhouse and photovoltaics, generated electricity has a maximum value. An optimization routine was carried out for the defined optimal photovoltaics slope angle for Kragujevac (37.5°, in accordance with [
41]), and the optimal value of the azimuth angle was obtained to achieve the highest value of generated energy. In further analysis, PV cell efficiency was varied. Obtained results show values of final and primary greenhouse energy consumption, generated energy by PV system, heating and cooling energy, and avoided operative primary energy consumption. With the installation of a photovoltaic system of appropriate capacity and higher PV cell efficiency, it is possible to realize the zero-net-energy solar greenhouse. Also, a greenhouse environmental and economic analysis was conducted. Results for the CO
2 emission, emission payback time, and economic evaluation with payback period are also presented in the paper. The analyzed solar greenhouse model with implemented GSHP and PV was designed using the Open Studio plug-in in Google SketchUp, the EnergyPlus software was used for the simulation of energy flows in the greenhouse, and the Genopt software was used for energy optimization.
This paper is important for analyzing and optimizing the simultaneous application of several renewable energy technologies in the agriculture sector, i.e., in solar greenhouses. There is an extremely small number of studies in which the application of multiple renewable energy technologies in agriculture was investigated. Scientists were mainly concerned with the application of one of these technologies and the possibility of saving energy. This study presents a comprehensive analysis of the minimization of energy consumption in the greenhouse, the maximization of energy generation with GSHP and PV, and the reduction in CO2 emissions. It has been proven that greenhouses can meet their own energy needs with GSHP and PV modules. This modernized method of agricultural production further leads to higher profits and greater independence of agriculture as an economic brunch.
Another innovation of this study is optimizing the azimuth angle of a solar greenhouse with a PV array and a GSHP. Many scientists conducted their analysis with tilt-angle optimization. This paper represents a step forward in the field of greenhouses with renewable energy technologies. This is very important for the agricultural sector in the Balkan Peninsula. In this paper, the optimal value of the tilt angle for the city of Kragujevac was used. The optimal azimuth angle of −8° was obtained by optimization routine. This result shows that the east-west orientation is not always the most optimal solution for greenhouse energy balance, especially if heating energy, cooling energy, and energy generated by the PV array are considered.
The results of this investigation are significant for scientists, greenhouse owners, agricultural engineers, and stakeholders in agriculture who want to improve agricultural production by implementing sustainable energy practices.
2. Materials and Methods
2.1. Software Simulation and Optimization
The methodological framework of the numerical investigations presented in this paper contains different software, such as the Open Studio plug-in for Google SketchUp (1.0.11), EnergyPlus (8.7.1), and GenOpt (2.0.0).
SketchUp is a 3D software tool used for
virtual building design using a real-world coordinate system. OpenStudio is a plug-in to the GoogleSketchUp software that connects the simulation of the energy behavior of a building in EnergyPlus with the 3D environment of GoogleSketchUp. This software allows the user to create an EnergyPlus input file (
idf file) using standard SketchUp tools, adding as much detail and information as possible to build zones and surfaces of the building. It allows easy creation of building geometry: forming zones (rooms), building walls through which heat is transferred, construction of windows, doors, etc. [
42].
EnergyPlus is a program for energy analysis, simulation of the energy behavior of buildings, and the use of renewable energy sources in different types of buildings. The development of the EnergyPlus software began in 1996 at the Lawrence Berkeley Laboratory in the USA and is based on the foundations of two programs: DOE-2 and BLAST [
43]. The basis of the EnergyPlus software is a building model based on the basic principles of heat transfer. Using a building model designed by the user, EnergyPlus calculates the heating/cooling needs necessary to maintain thermal comfort, enables the proper design of the HVAC system, determines energy consumption, and simulates numerous other energy behaviors of the building (with different systems) in real operating conditions. The validity of the software was tested several times, and the results obtained were compared with the ASHRAE standard settings. The results obtained by software simulations matched the results of the calculation methods according to the ASHRAE standards with extremely high accuracy. The most important confirmation of validity was obtained in tests performed according to the IEA HVAC BEST TEST E100-E200 procedures [
44].
With an Open Studio plug-in for Google SketchUp and EnergyPlus, a solar greenhouse model was designed. The input file for EnergyPlus (idf file) contains all geometric, construction, and thermal parameters of a greenhouse (geometry, coordinates, materials, heat transfer data, etc.). EnergyPlus is a modular-type software; hence, it is easy to implement different systems to the existing greenhouse model—a photovoltaic array and ground-source heat pump. The simulation of EnergyPlus uses weather data from its own weather files. In this investigation, the EnergyPlus software, which includes a model of solar radiation, was used to simulate the energy behavior of a greenhouse. During the simulation, results were obtained for the distribution of energy consumption in a greenhouse, heating/cooling energy, generated energy by renewable energy systems, electricity surplus sold to the grid, emission of GHG, etc.
Finding the optimal azimuth angle of a greenhouse and the optimal PV cell efficiency was conducted using the GenOpt software [
45], which has an independent platform and a library with an adaptive Hooke–Jeeves optimization algorithm [
46]. GenOpt optimization minimizes the objective function evaluated by the user. The objective function is defined in the Ini file. In this case, the objective function is the negative value of the greenhouse avoided operative primary energy consumption (Equation (4)). The Ini file contains all parameters (obtained with EnergyPlus simulation) that are required for optimization. GenOpt varies the value of the azimuth angle (Equations (5) and (6)) until it gets the minimum value of avoided operative primary energy consumption. For optimal azimuth of the greenhouse (A), avoided operative primary energy consumption (E
PR) will have the maximum value. After determining the optimal azimuth angle, the second step was to determine the optimal value of PV cell efficiency to achieve the zero-net-energy greenhouse.
Environmental and economic analyses of the different greenhouses were also conducted to point out the significance of the application of renewable energy sources to greenhouses. Emission savings and investment payback periods are highlighted.
2.2. Model of Solar Greenhouse with Photovoltaics and GSHP
The analyzed solar greenhouse is located in the city of Kragujevac, in the central part of Serbia (latitude 44.1° N and longitude 20.55° E). Kragujevac has a moderate continental climate—warm summers with temperatures as high as 37 °C and cool winters with snow and temperatures as low as −19 °C [
42].
The model of the analyzed south-faced solar greenhouse (
Figure 2) has a rectangular shape (20 × 8 m) and a floor area of 160 m
2. The greenhouse is installed along the east-west direction (an azimuth angle of 0°), and it is designed with modular elements, which allow for quick assembly at the site location. Greenhouse materials have good thermal characteristics.
The frame of the greenhouse determines its shape, which is obtained by stacking modular aluminum elements. The supporting greenhouse structure is made of steel, giving the greenhouse the appropriate strength and stability and allowing the installation of PV panels in the extension of its southern wall. Side walls (east and west) are vertical, with the shape of an irregular quadruple, and they are perpendicular to the ground. The side walls, the north wall, the south wall, and the door are made of non-massive sandwich constructions that are easily mounted on an aluminum frame. These constructions consist of two layers of aluminum sheet (thickness 2 mm) placed at a distance of 100 mm, while the space between them is filled with polyurethane foam. They are also available in the modern markets, with a heat transfer coefficient of 0.269 W/m2K. Each side wall has an exterior door (2 × 2.5 m). The south wall has a rectangular shape with dimensions of 20 × 0.5 m, and it continues to the south roof. The south roof has a slope angle of 40°and dimensions of 20 × 6.78 m. Its total area is 135.6 m2, and it consists of 60 same windows (dimensions of 2.18 × 0.97 m, with a total area of 126.88 m2). The windows on the south roof are double-glazed with glass of 4 mm thickness, mounted at a distance of 13 mm. The space between the glass layers is filled with air. The solar transmittance coefficient of glass is 0.9, the solar heat gain coefficient (SHGC) is 0.859, and the U-value is 1.45 W/m2K. The ridge of the greenhouse is at a height of 4.86 m, in which the south roof is cut by the north roof. The north roof has dimensions of 20 × 5.61 m, a total area of 112.2 m2, and a slope angle of 60°, and it extends to the ground. The PV panels are placed in a way that they do not create a shadow inside the greenhouse during the day, which is important for growing plants.
The simulations assume that three people work in the greenhouse for 5 h per day; their presence and the emission of their heat are taken into account. The air in the greenhouse changes its condition during the day; it can be overly humid or full of various gases and needs to be replaced with fresh air. This is possible with ventilation when the characteristics of the air are changed and improved to suit the needs of the crops grown in the greenhouse. Cross-natural ventilation, which relies on the wind and is achieved by opening doors, is provided in the months when the greenhouse is overheated—from 1 April to 30 September. The number of air changes per hour is 2 (1/h). This type of natural ventilation is good for Serbian conditions because of the dry summer climate. Also, it is a good solution in spring and autumn during moderate weather when the nights are cool. With natural ventilation, heat buildup is avoided during the day; hence, this strategy makes it possible to save a great amount of energy for cooling.
Photovoltaics. Photovoltaic panels are implemented in the solar greenhouse model, and they are placed on the ridge of the greenhouse. The length on which the PV panels are placed is the same as the length of the greenhouse (20 m), while the width of the field with mounted PV panels is 2 m, which means that the area covered by PV panels is 40 m
2. This surface area continues to the south roof and does not shade the greenhouse (
Figure 3). The photovoltaic slope angle is 37.5°—the optimal value for the city of Kragujevac [
41].
The on-grid PV system consists of a PV array and an inverter. The operation of the PV array is simulated using the EnergyPlus software, and a mathematical model of Generator–Photovoltaic–Simple is implemented [
43]. The modeling was performed with the assumption that the generated electricity is consumed immediately while the surplus, if any, is sold to the electricity grid. In this research, monocrystalline PV panels were considered because they have the highest efficiency at 15–22%. Its average module efficiency is 22% in the modern market today, while the maximum PV module efficiency achieved is 24.3% (produced by Aiko Solar (Shanghai, China) in 2023) [
47]. The model PV efficiency in EnergyPlus for this investigation is set at 20%.
Ground-source heat pump (GSHP). A modeled solar greenhouse with heating and cooling uses a ground-source heat pump. This system, in modern science, is proven to be the most cost-effective. The working fluid in GSHP is water mixed with 15% glycol. The circulation pump works with a constant flow of a working fluid of 0.0033 m
3/s. GSHP has a horizontal heat exchanger in the ground, which has two horizontal loops (2 × 300 m) with tubes of 6.35 cm diameter and a U value of 0.391 W/mK. The heat exchanger transfers heat/cold from the ground to the consumer. The auxiliary heater has a nominal capacity of 12 kW. The average seasonal value of COP, obtained by EnergyPlus, was 4.8. In Kragujevac, during the winter, the constant temperature of the ground is 14 °C; hence, the GSHP draws the heat from the earth (Source side). Passing through tubes in the ground, the working fluid evaporates, and the vapor goes to the compressor unit to raise the pressure and temperature. After that, the steam goes to the heat exchanger, where it cools, transfers heat, and condenses. Cold working fluid re-enters the exchanger in the ground and absorbs its heat, thereby repeating the process until the GSHP operating mode changes [
48]. The Load side of the GSHP uses air as a working fluid. In the heat exchanger, air receives heat from the water, and with fans, heated air transfers to the thermal zones. There is also an additional heater that uses electricity; it is activated when the air temperature does not meet the needs of the thermal zone. In front of the heat exchanger, there is a mixer in which the external air mixes with heated air.
The EnergyPlus software changes the mode between cooling and heating by using a thermostat and return valve. During the cold season, the greenhouse has to be heated to keep the temperature above the ambient temperature. This is necessary for plant growth. During the hot season, temperatures in the greenhouse can reach over 50 °C; thus, the air in the greenhouse has to be cooled. For this purpose, natural ventilation is not sufficient, but also additional conventional cooling devices must be used. EnergyPlus defines two heat exchangers (heating and cooling) to approach the operation of a single heat exchanger which works in heating or cooling mode:
heating mode: from 1 November to 1 April, air temperature is 16 °C (from 07–17 h) and 10 °C (from 17–07 h);
cooling mode: from 1 April to 1 November, air temperature is 28 °C (from 07–19 h) and 20 °C (from 19–07 h).
2.3. Energy Analyses of Solar Greenhouse
The model of the solar greenhouse, as well as the installed PV array and GSHP, is described in the previous section. PV array generates electricity, which is used to satisfy the greenhouse energy needs—lighting, fans, and GSHP operation, as mentioned earlier. GSHP uses energy stored underground for greenhouse heating and cooling.
Results for greenhouse energy consumption are obtained by EnergyPlus simulation. Total final energy consumption (
E) in a solar greenhouse presents a sum of heating energy consumption (
EH), cooling energy consumption (
EC), energy consumption for lighting (
EL), and energy consumption of appliances (
EA):
Energy generated by PV array (
EGEN) covers partial or complete greenhouse energy needs. Net final energy consumption in a solar greenhouse with a PV array is:
while net primary energy consumption can be calculated as:
where
REL = 3.04 stands for the primary conversion multiplier [
49].
Heat and mass flow in the solar greenhouse are calculated by EnergyPlus [
43,
49].
2.4. Optimization Procedure
The energy optimization procedure of the Genopt software was performed to determine the optimal azimuth angle and optimal PV efficiency by minimizing energy consumption and achieving a zero-net-energy greenhouse. The avoided operative primary energy consumption in the solar greenhouse—due to the operation of the PV system and ground-source heat pump—consists of different terms. The first term relates to the yearly generated energy; the second term relates to the yearly value of embodied energy of the PV system, increased by the value of energy consumed on its installation and maintenance; the third term refers to the yearly value of embodied energy of the ground-source heat pump increased by the value of energy consumed on its installation and maintenance. So, avoided operative primary energy consumption
EPR can be written as:
where:
EGEN—yearly generated energy, J;
Eem,PV—embodied energy of PV array, J;
Cm = 1/LC, where LC is the life cycle of the PV array, years;
Cinst,PV—coefficient of installation and maintenance of PV systems during the whole life cycle [
50];
Eem,GSHP—embodied energy of the ground-source heat pump, J;
Cinst,GSHP—coefficient of installation and maintenance of GSHP during the whole life cycle [
50];
Cm1 = 1/LC1, where LC1 is the life cycle of the ground-source heat pump, years.
According to Alsema’s investigations presented in [
51,
52], the life cycle of the photovoltaic array is set to 20 years, while the embodied energy of the PV array is set to 3.75 GJ/m
2. The life cycle of the ground-source heat pump is set to 15 years, and its embodied energy is set to 0.6 GJ [
53].
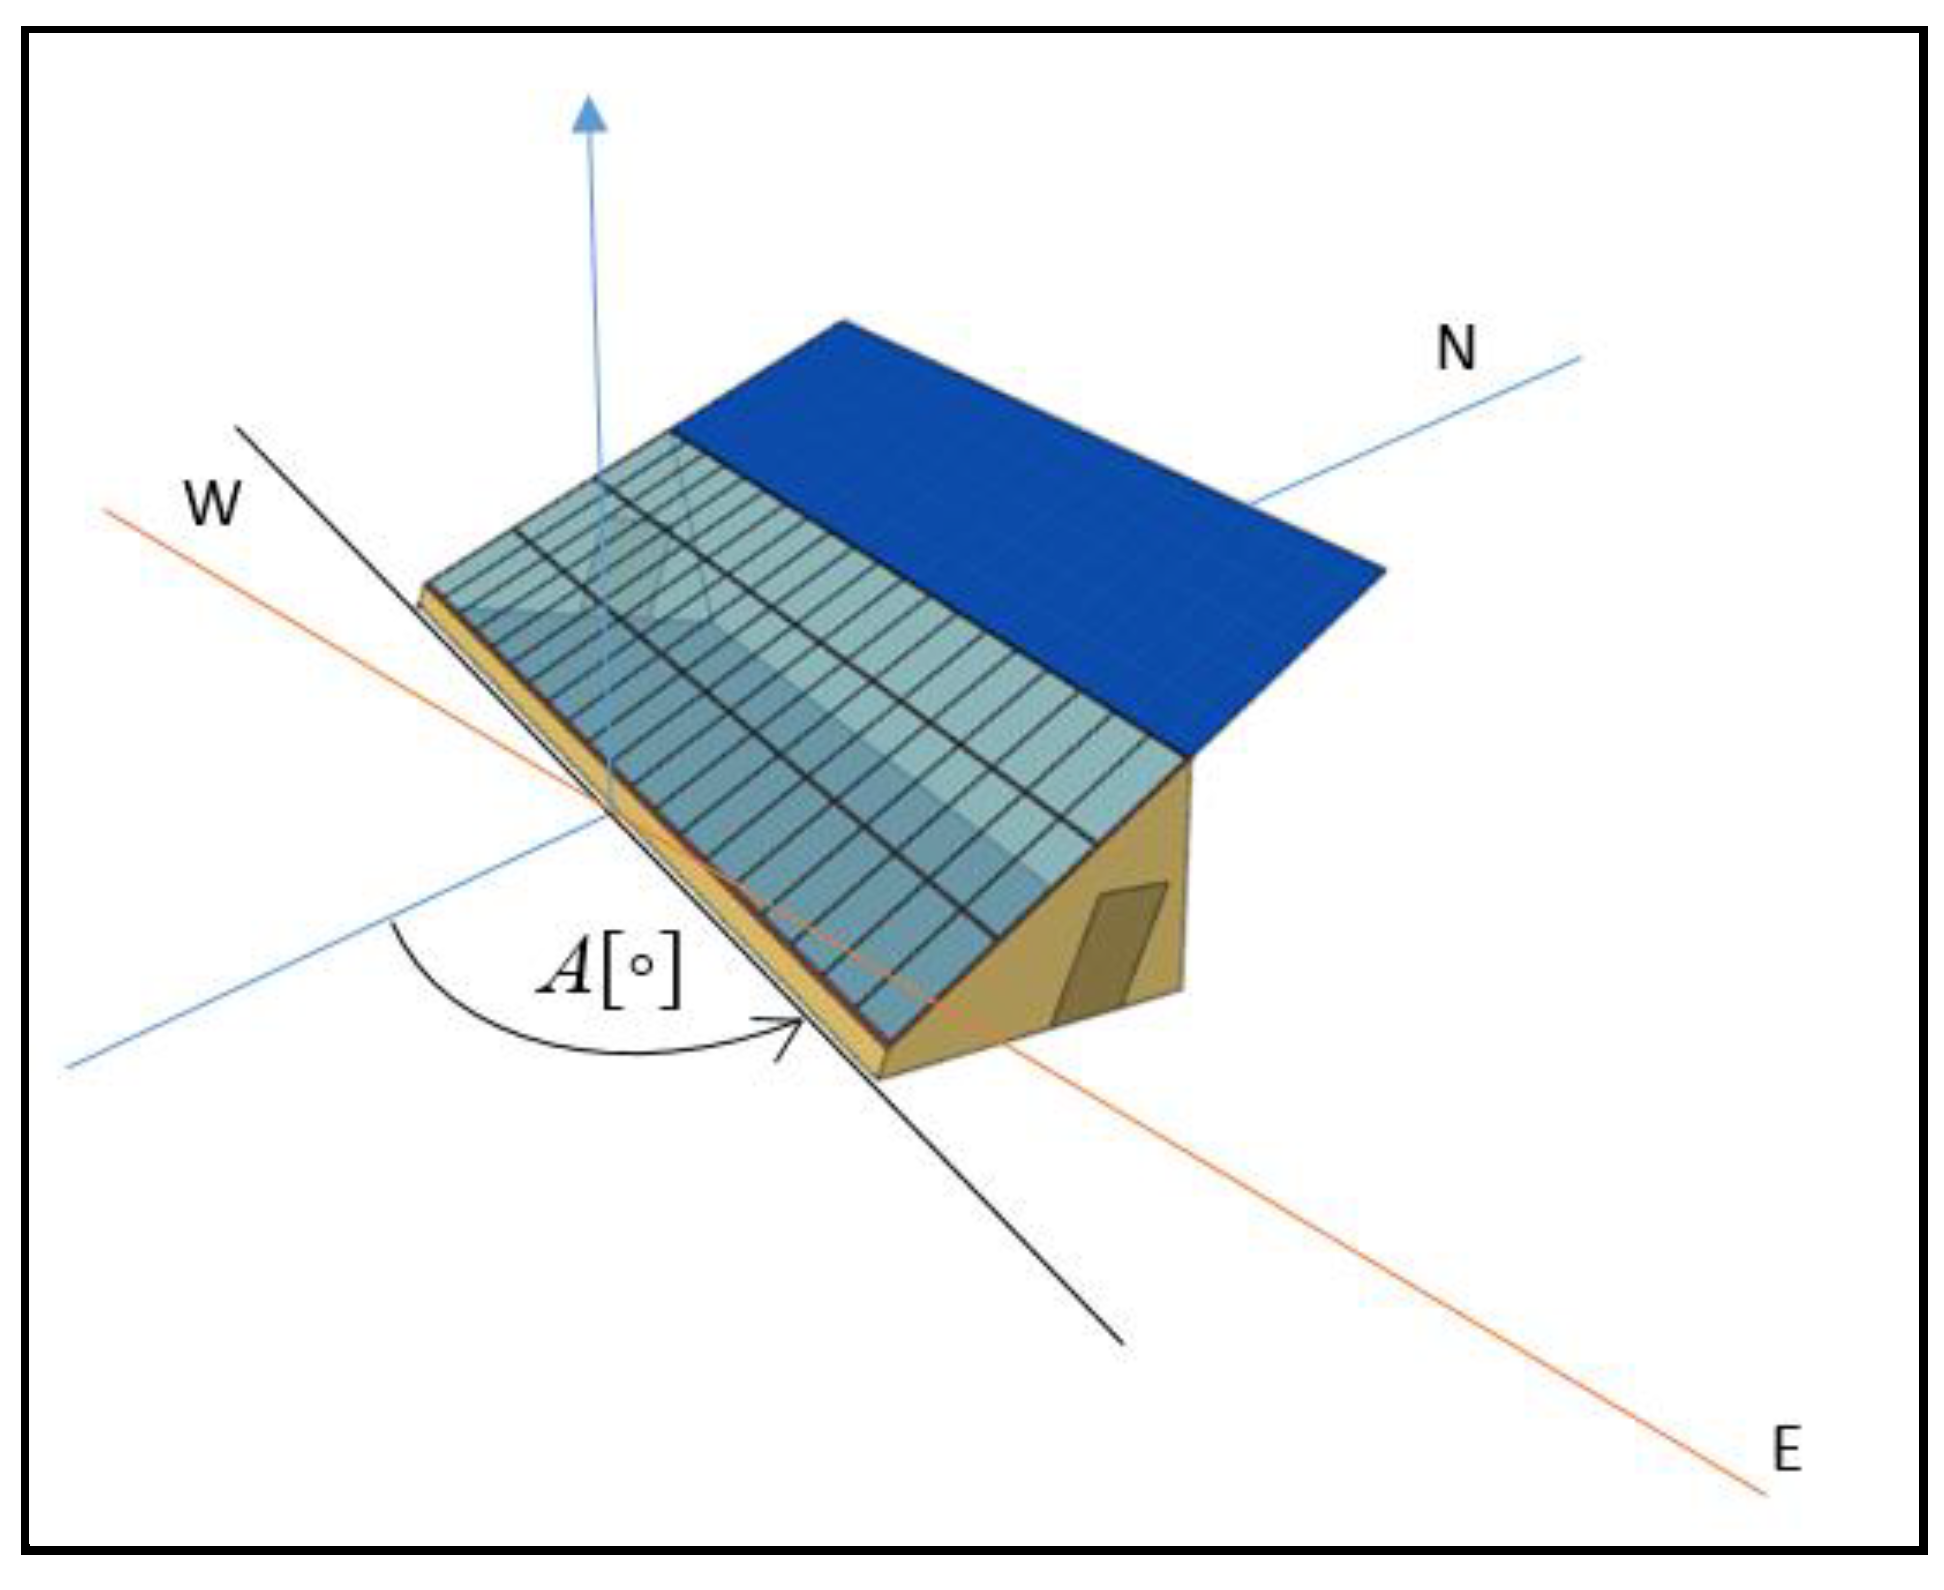
EnergyPlus uses equatorial and horizon coordinate systems to define the object’s position in the solar radiation model [
43,
48]. In these systems, coordinates are azimuth (azimuth angle), declination, solar altitude, and hour angle. The azimuth angle determines the position of the PV panel relative to the south—it is the angle between the vertical plane of the PV array and the south direction. The azimuth angle is 0° when the PV module is south-oriented, it is positive when the PV array is facing to the west, and it is negative when the PV module is facing to the east. Azimuth angle A in the mathematical model is presented with the next equations:
where:
t—hour angle, rad;
β—tilt angle, rad;
δ—declination, rad;
ϕ—solar altitude, rad;
EnergyPlus transforms Equations (5) and (6) into Cartesian coordinates for further calculations in its own algorithm. In this paper, the optimal value of the azimuth angle is determined in order to achieve minimal energy consumption in a solar greenhouse. In that case, greenhouse primary energy consumption will be minimized.
After defining the optimal position of the greenhouse, the PV module efficiency was optimized in the process of energy optimization. This value is based on the energy generated by the PV array. A zero-net-energy greenhouse can be obtained with optimal values of the azimuth angle and optimal cell efficiency of the PV array.
2.5. Environmental Analysis of Installed Renewable Energy Systems
The installed renewable energy systems emit an amount of CO
2 into the atmosphere when generating electricity and energy for heating/cooling. These systems have minimal harmful impact on the environment, and their carbon dioxide emissions are presented as:
where:
EmCO2—CO2 emission from renewable energy systems, kg CO2/year;
EmCO2, PV—CO2 emission from the PV array, kg CO2/year;
EmCO2, GSHP—CO2 emission from the ground-source heat pump, kg CO2/year.
CO
2 emission from the photovoltaic array is 50 g CO
2 per kWh of generated electricity [
54], while CO
2 emission from the ground-source heat pump is 250 g CO
2 per kWh of generated energy [
55].
The total emission of CO
2 is equal to the sum of the CO
2 emissions of the installed PV array and ground-source heat pump and the embedded emission of CO
2 emitted during the production of analyzed systems (PV and GSHP):
where:
EmTOT, CO2—total emission of CO2 from renewable energy systems, kg CO2/year;
EmCO2, PV, emb—embedded emission of CO2 of photovoltaics, kg CO2/year;
EmCO2, GSHP, emb—embedded emission of CO2 of ground-source heat pump, kg CO2/year.
According to the embedded emission data from The British Centre for Alternative Technology [
56], the embedded emission of CO
2 for grid-connected PV systems (regions of Southern Europe) is 35 g CO
2/kWh of generated electricity, while embedded emission of CO
2 of GSHP is 150 g CO
2/kWh of generated energy [
53]. CO
2-avoided emissions in the solar greenhouse with GSHP and PV are calculated for the case of electricity used for greenhouse heating and cooling. The carbon intensity of electricity generation in Serbia for 2023 is 636 g CO
2/kWh of generated energy [
57].
2.6. Economical Analysis of Installed Renewable Energy Systems
2.6.1. Economic Analysis of PV Array
For economic evaluations of PV arrays, the value of the investment (I
PV), financial profit (FP), and investment payback time (IPB) is calculated based on currently valid data on the PV market and obtained results for generated, sold, and purchased energy. The value of the investment (I
PV) depends on the cost of the PV array (I
PVarray), the investment cost of the inverter (I
INV), and the mounting cost of the PV array and inverter (P
mount), which is a percentage addition to the investment cost of the PV array and inverter:
Investment costs for the PV array and inverter include the average price of the analyzed PV array (for monocrystalline cells and PV module efficiency of 20%, the investment cost is 0.1 €/Wp—in the calculation procedure for the value of the investment I
PV, this value is multiplied by the generated electricity (in W)), and the average price for an on-greed solar inverter of 1400 € [
58]. The complete procedure for calculating the value of investment (in €) is given in [
59].
Financial profit FP (in €/year), in this case, depends on electricity purchased and sold to the grid, its prices, and the annual expense of the PV system. Equation (10) shows how to determine the financial profit:
where:
- –
ELSOLD—surplus electricity generated by PV array, sold to the grid, kWh;
- –
ELNET—net-purchased electricity from the grid, kWh;
- –
PSOLD—price of the energy generated by PV and sold to the network as surplus (feed-in tariff), €/kWh;
- –
PNET—price of energy purchased from the grid, €/kWh;
- –
RPV—annual expense of the PV system, € [
59].
The current value of the feed-in tariff in Serbia is 0.2066 €/kWh for installed systems up to 30 kW. The average price of electricity purchased from the grid in Serbia is regulated with three tariffs (green, blue, and red) through the Electricity Tariff System: for green tariff (<350 kWh)—0.07 €/kWh; for blue tariff (351–1600 kWh)—0.106 €/kWh; and for red tariff (>1600 kWh)—0.212 €/kWh [
60].
In the end, the investment payback time is defined as the ratio of the value of the investment and financial profit:
2.6.2. Economic Analysis of GSHP
GSHP represents an environmentally sustainable and energy-efficient solution for heating and cooling. It can take advantage of the earth’s stable temperature, making it a reliable choice for thermal comfort and economy. For the economic evaluation of GSHP, it is very important to choose the optimally designed GSHP according to the required thermal load (heating and cooling). The economic analysis of GSHP includes initial and operating costs.
To determine the initial costs of GSHP, it is necessary to consider energy needs, the type of GSHP, and installation costs. In this investigation, conventional GSHP was chosen. Usually, installation costs include trenching (for horizontal loops) or drilling (for vertical loops) and connection of the ground loop to the heat pump (pipes, hydraulic system, automatic control system). Additional components, such as radiators or ducts, are often required. The detailed procedure for calculating the costs of the GSP is given in [
61]. In the Serbian market, several companies deal with the sale and installation of GSHP systems; the pump will be chosen based on the required heating/cooling load and the currently most favorable price on the market.
Operational costs of GSHP are influenced by various factors, such as local energy (electricity) price, system efficiency, maintenance costs, and pump and fun operational costs. Operational costs in this investigation are obtained by using the valid electricity price in Serbia and by the performance of installed GSHP.
3. Results
3.1. Energy Consumption of Modelled Solar Greenhouse
The referent case, a south-faced solar greenhouse (azimuth angle 0°, i.e., east-west orientation), is located in Kragujevac, Serbia, and is described in
Section 2.1. It has a GSHP and PV array with an area of 40 m
2, a slope angle of 37.5°, and a PV module efficiency of 20%. The operation of a solar greenhouse without and with photovoltaics and GSHP is simulated in EnergyPlus, and results for energy consumption are given in
Table 1 and
Figure 4 (without the distribution of generated energy).
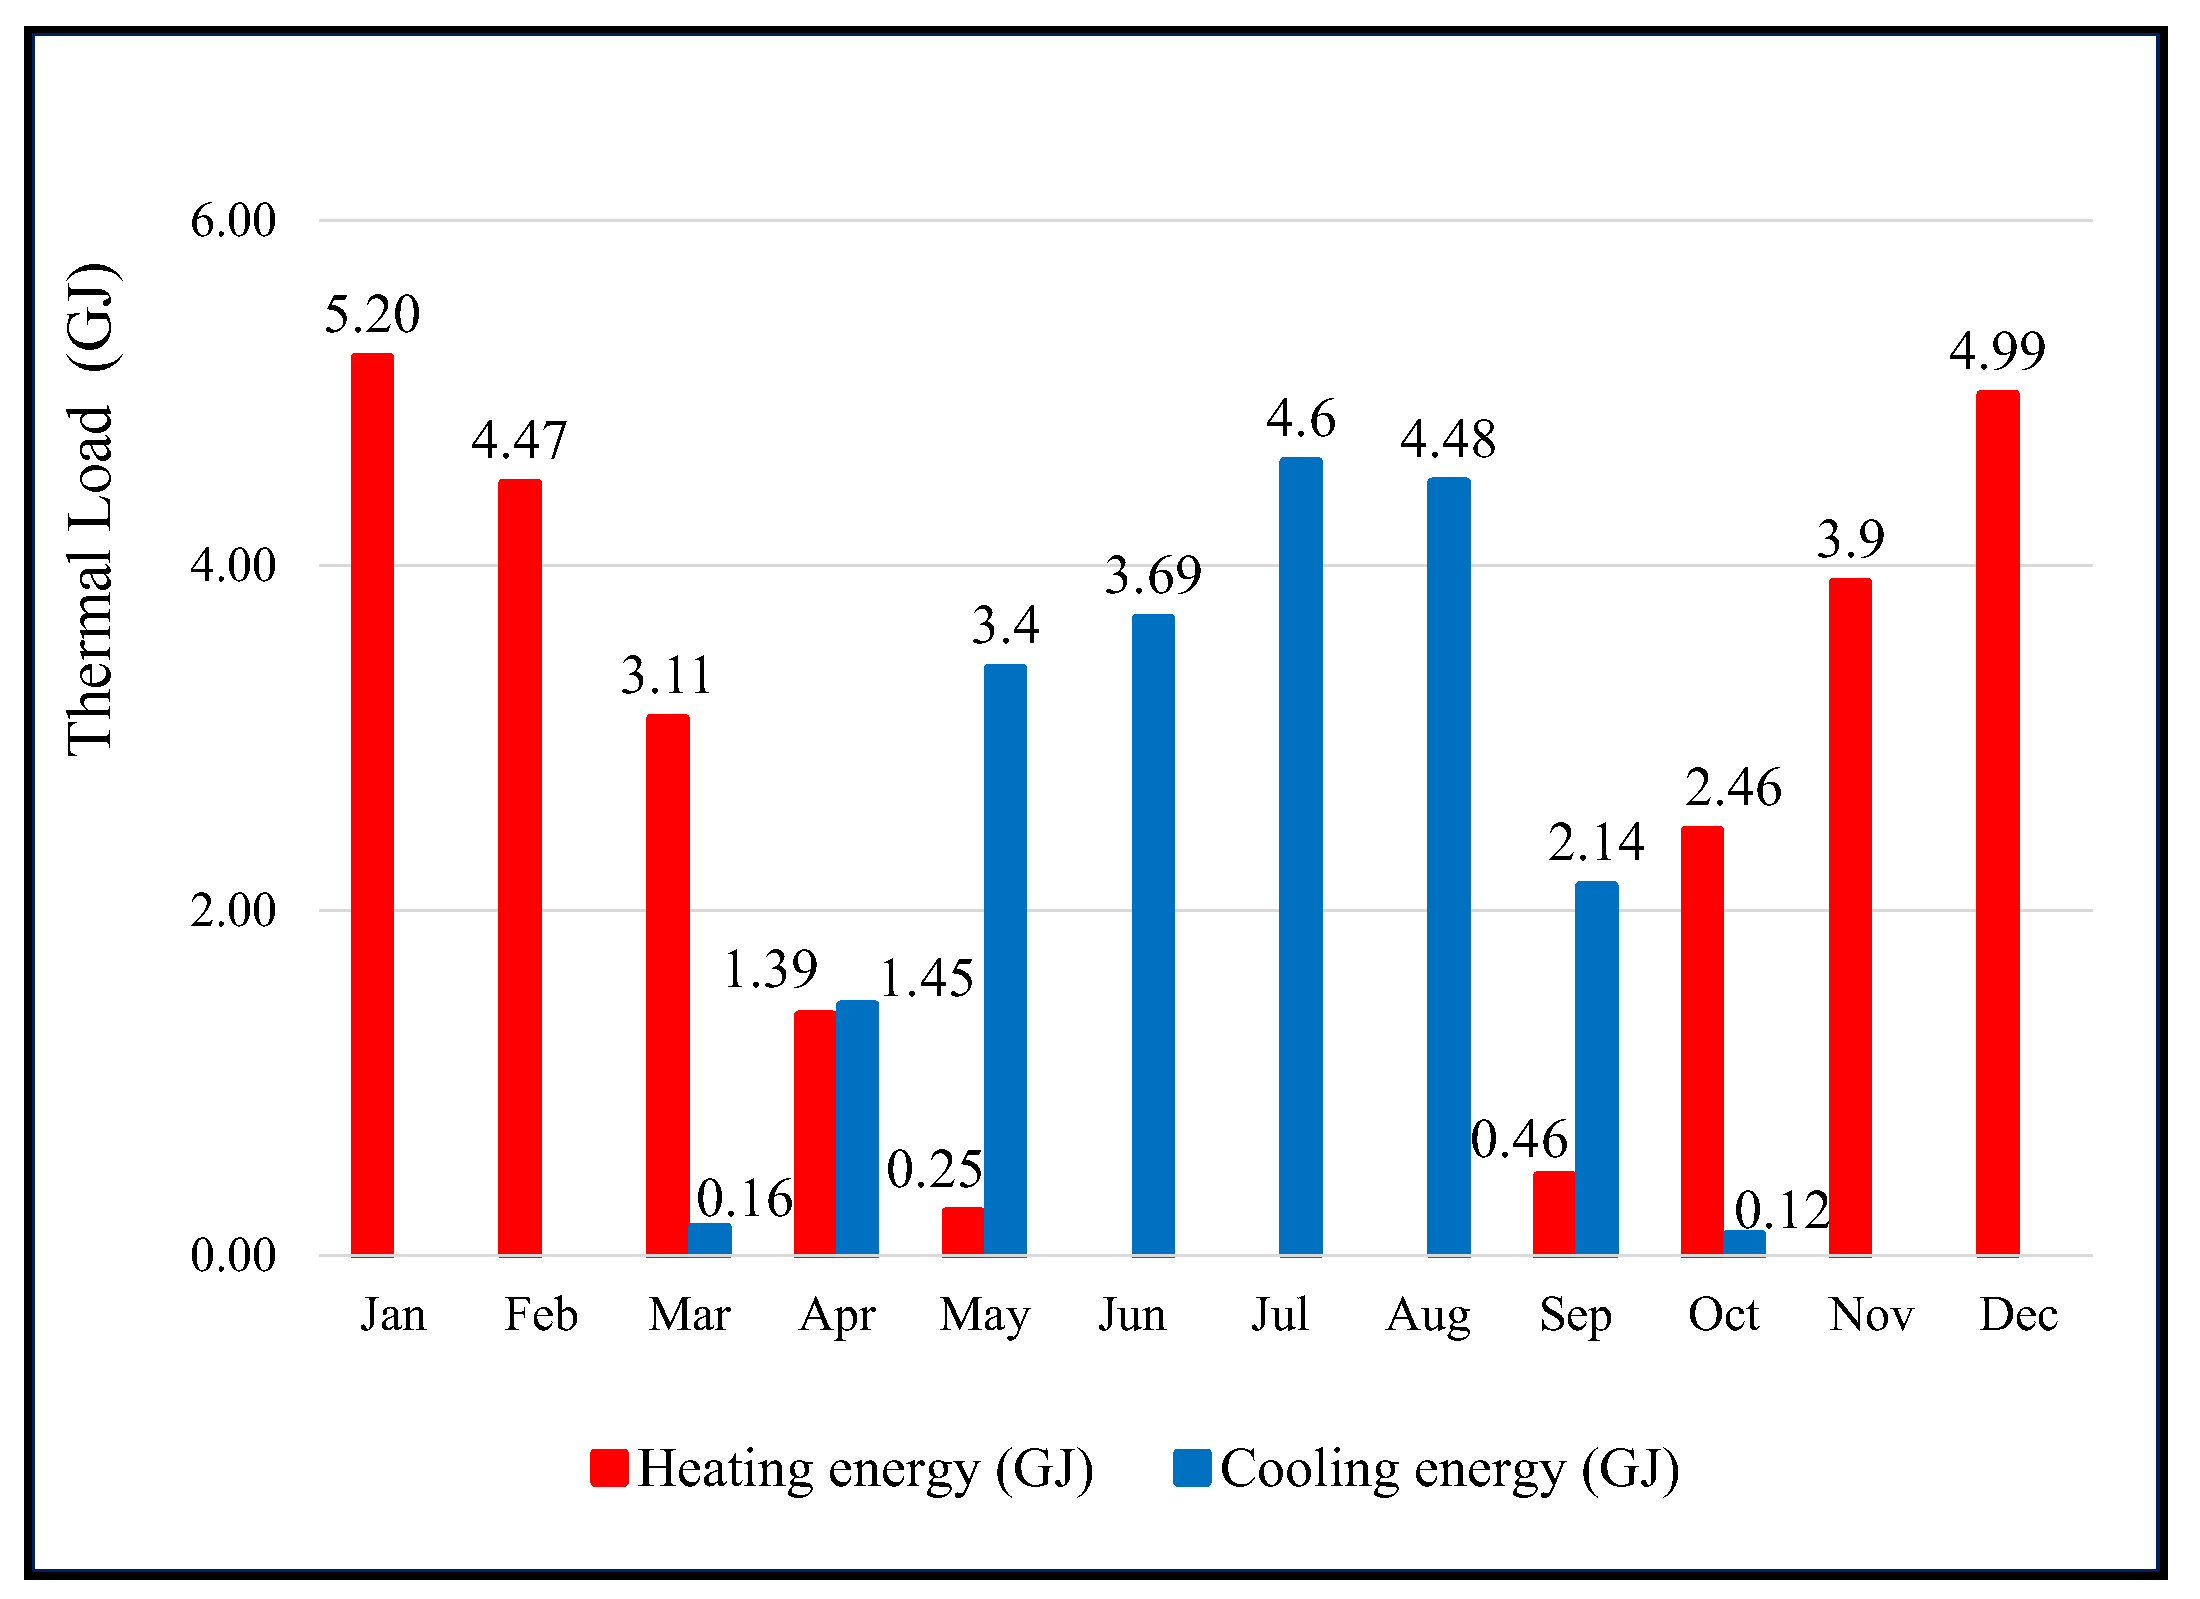
Figure 4 represents the monthly heating and cooling load of a solar greenhouse. The maximum values for thermal heating load are in January and December, 5.2 GJ and 4.99 GJ, respectively. In Serbia, these months are the coldest in the year, which is the reason for the highest heating load. The maximum values for thermal cooling load are in July and August (the hottest months in the year), 4.6 GJ and 4.48 GJ, respectively. In transition periods, during months such as March, April, May, September, and October, there is a need for both heating and cooling. The reason is that temperatures vary largely during the day; while it is cold at night, temperatures can reach higher values during the day.
The total yearly energy consumption in a solar greenhouse is 50.2 GJ. During the entire year, the energy required for greenhouse heating is 26.24 GJ, while the energy required for greenhouse cooling has a lower value, 20.04 GJ. The rest of the energy consumption of 3.92 GJ relates to the lighting, pumps, and fans (
Table 1). With the application of GSHP and PV array, the generated energy is 40.01 GJ; hence, the net energy consumption of a solar greenhouse is 10.19 GJ (
Table 1). If the distribution of generated energy is taken into account, as well as its current consumption at the moment of energy generation according to the energy needs of the greenhouse, then the referent solar greenhouse has yearly energy consumption, as shown in the second column of the
Table 1. The GSHP and PV array produced 40.01 GJ of energy; hence, the net energy consumption of the solar greenhouse is reduced to 10.19 GJ annually. The heating load of a solar greenhouse is 4.48 GJ annually, while the cooling load is 3.65 GJ annually. The set temperatures are achieved with ventilation systems.
The monthly distribution of generated energy, total energy consumption, and net energy consumption in the referent solar greenhouse with GSHP and PV array, with a cell efficiency of 20%, is presented in
Figure 5. Energy consumption has the highest values in the winter and in the summer (December, January, July, and August) because of the highest heating and cooling load in these months. The lower energy consumption is in transition months, such as April, September, and October. During sunny days, the greenhouse does not overheat too much, and natural ventilation is sufficient to cool it (cooling load has low values). On the other hand, the nights are not overly cold, and the heating needs are reduced. Overall, this results in low greenhouse energy consumption.
On the other side, generated energy is the highest in summer months, when PV arrays receive high solar radiation. The net energy consumption has peak values in the summer months (June and July), while in September, its value is negative, which means that the generated energy is higher than the total energy consumption.
Further investigations will show how solar greenhouse energy efficiency can be improved by optimizing different parameters, such as azimuth angle and PV module efficiency. The goal of the research is to show that a zero-net-energy solar greenhouse can be realized.
3.2. Optimization of Greenhouse Azimuth Angle
In these investigations, the azimuth angle is optimized (
Figure 6) to minimize greenhouse energy consumption and heating energy/cooling energy ratio. An azimuth angle of 0° refers to the south direction, the azimuth angles in the range of (−1°)–(−89°) refer to the south-east orientation (SE), while the azimuth angles in the range of 1–89° mean south-west orientation (SW) of the greenhouse. In this paper, energy optimization was carried out for the referent solar greenhouse (40 m
2 of PV array, optimal slope angle of 37.5°, PV module efficiency of 20%).
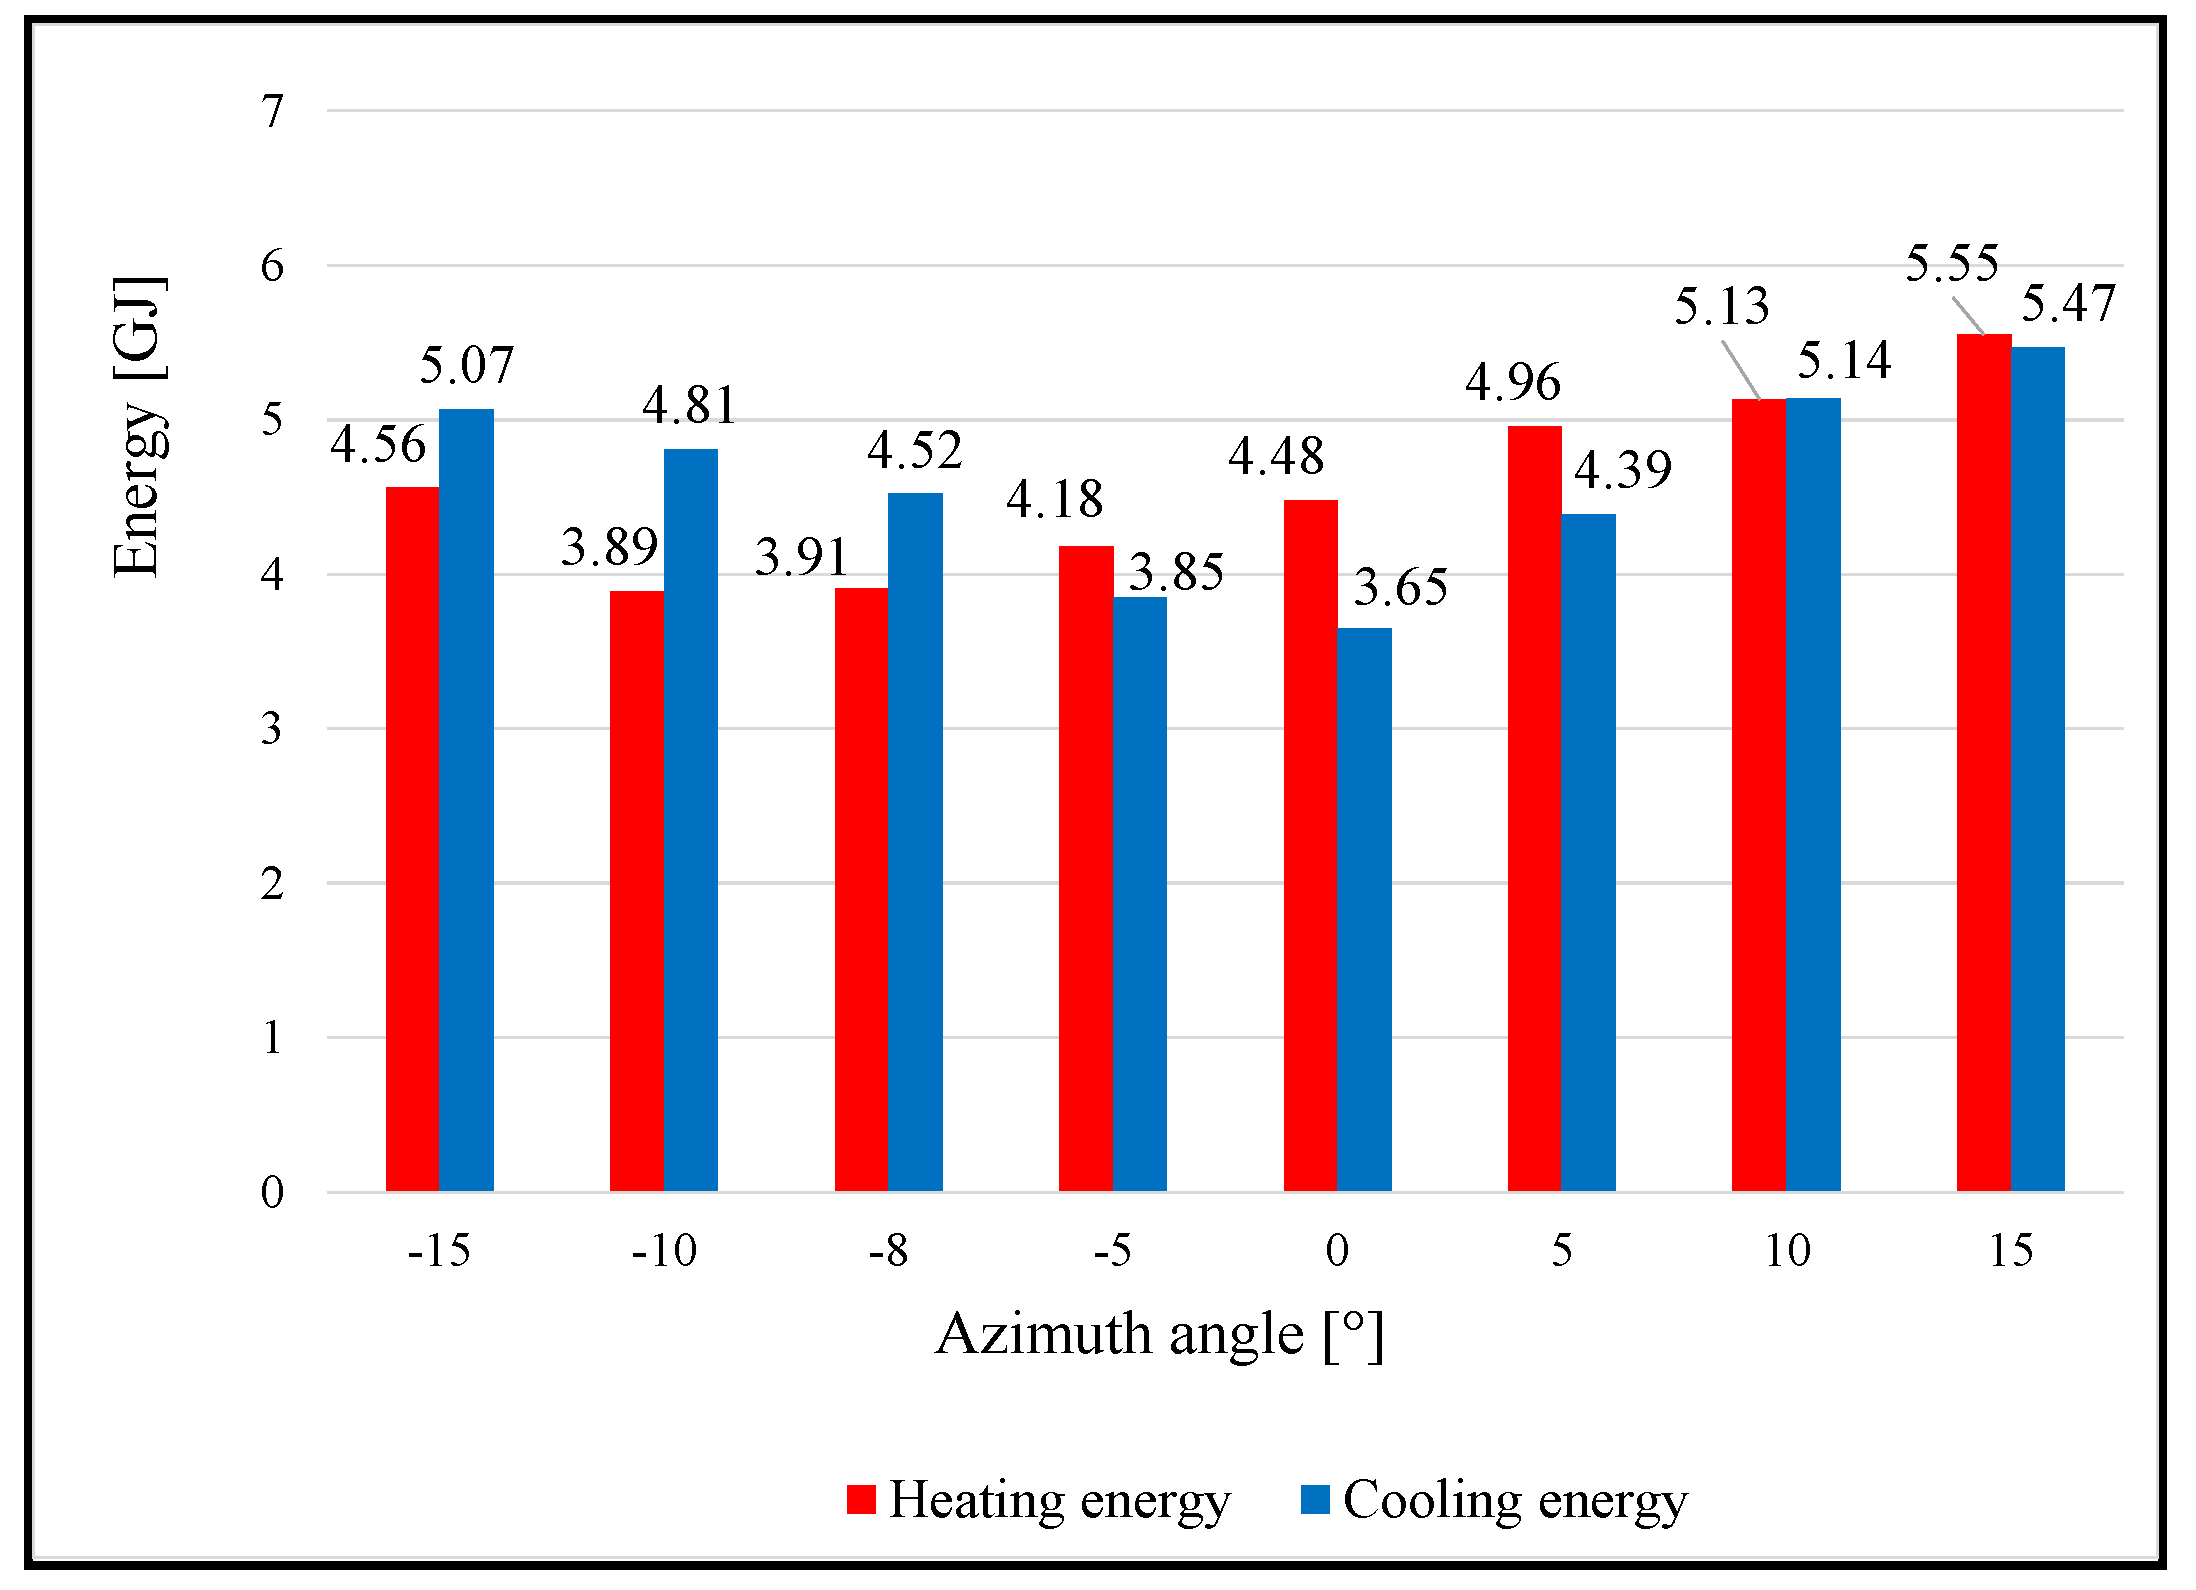
Table 2 presents the optimization and simulation results for different azimuth angles
A: −15°, −10°, −5°, 0° (referent case), 5°, 10°, and 15°. The optimization results show that the greenhouse’s total energy consumption, heating load, and cooling load change with the change in azimuth angle. According to the optimization routine, the optimal greenhouse azimuth angle is −8° (red box in the table), which is acceptable for the azimuth angle of the PV module orientation [
62]. That means the greenhouse is oriented 8° to the east.
When the azimuth angle increases from −15° to the optimal value of −8°, the heating load decreases from 4.56 GJ to 3.91 GJ. In that case, the greenhouse is open more to the east, and it receives more solar energy in the morning hours; hence, more cooling energy is needed (
Figure 7). Heating energy also decreases when azimuth increases from (−15°)–(−8°). These greenhouses have less solar gains during the afternoon hours, especially in the winter; hence, more energy is needed for heating (with a decreasing azimuth angle) (
Figure 8). Also, in the afternoon, the west wall creates a shadow that almost does not exist at the east-west orientation. The minimum heating load is for the optimal azimuth angle, 3.91 GJ. For azimuth angles higher than optimal azimuth (−8° < A < 15°), heating energy increases (from 4.18 GJ to 5.55 GJ), as shown in.
If the cooling load is discussed, from the data obtained by optimization (
Table 2), it can be concluded that with increases in the azimuth angle (−15°−0°, east orientation), cooling energy decreases from 5.07 GJ to 3.65 GJ. With further increases in the azimuth angle (0° < A < 15°, west orientation), cooling energy also increases. For these cases, in the afternoon hours, the solar greenhouse receives a greater amount of solar radiation, while in the morning, the east wall creates a small shadow inside the greenhouse, and the solar gains are reduced (
Figure 7).
Figure 7 shows a graphical presentation of cooling energy for 15 July. Analysis was conducted for three different azimuth angles: −10°, 0° and 10°. Simulation results confirmed the above statements. Compared with the referent greenhouse (0° azimuth angle), a greenhouse oriented to the east (azimuth angle of −10°) has more cooling need in the morning hours, while a greenhouse oriented to the west (azimuth angle of 10°) has more cooling need in the afternoon.
Figure 8 represents heating energy for 15 December in the greenhouses with different azimuth angles (−10°, 0°, and 10°). The east-oriented greenhouse has less heating load in the morning hours than the referent greenhouse, which is south-faced. However, in the afternoon hours, solar gains are reduced, and the west side wall creates a shadow; hence, this greenhouse needs more energy for heating. A west-oriented greenhouse has the highest heating load value (which is almost the same as the cooling load). In this greenhouse, the morning sun is blocked by the eastern side wall; hence, more energy is needed for heating in the morning. Since the winter days are short and the solar insolation is low, more energy is needed for heating in the afternoon and evening.
A referent solar greenhouse (azimuth angle of 0°) has the lowest value of cooling energy (3.65 GJ). This type of greenhouse is most open to receiving solar energy in the summer, while in the winter, solar gains reduce heating energy consumption. A greenhouse with an optimal azimuth angle of −8° has an optimal ratio of required heating/cooling energy (3.91 GJ/4.52 GJ). In this case, generated energy has the highest value of 40.92 GJ (
Figure 9 and
Figure 10) because it has the highest solar gains throughout the year.
Solar greenhouse with the highest azimuth angle of 15° consumes the most energy for heating and cooling (i.e., 5.55 GJ and 5.47 GJ, respectively) compared to the other analyzed cases of solar greenhouses. This type of greenhouse is most open to the west; it receives a large amount of solar energy, especially in the afternoon hours, and more cooling energy is needed.
The optimal-oriented greenhouse has the maximum value of generated energy (40.92 GJ). For the east-oriented greenhouses (azimuth angles in the range of −15°–(−8°)), PV-generated energy decreases with decreasing azimuth angles (from 40.92 GJ to 40.28 GJ). Generated energy also decreases for azimuth angles greater than −8°, from 40.92 GJ, to 39.48 GJ for an azimuth angle of 15°. A referent solar greenhouse with an azimuth angle of 0° generates 40.01 GJ of electricity (
Table 2,
Figure 10).
When the azimuth angle increases from −15° to 0° (referent case), the greenhouse’s total energy consumption decreases from 51.97. GJ to 50.2 GJ (azimuth angles < 0° mean east-oriented greenhouse). For azimuth angles larger than 0°, total greenhouse energy consumption increases, i.e., for west-oriented greenhouses, when the azimuth angle is 5°, 10°, and 15°, total energy consumption is 51.28 GJ, 52.02 GJ, and 52.56 GJ, respectively (
Figure 10). The east-west oriented solar greenhouse (referent case) has the lowest value of total energy consumption (50.2 GJ).
The net energy consumption of the solar greenhouse decreases when the azimuth angle increases from −15° to −8° (optimal orientation); hence, for an azimuth angle of −15° and −10°, net energy consumption is 11.69 GJ and 10.76 GJ, respectively. A greenhouse with an optimal azimuth angle of −8° has the lowest net energy consumption of 9.49 GJ. With a further increase in the azimuth angle from −5° to 15°, the net energy consumption also increases from 10.09 GJ (A = −5°) to 13.48 GJ (A = 150°), as shown in
Figure 8.
Avoided operative primary energy has the same trend as generated energy. It increases in the range of 120.36 GJ to 121.85 GJ when the azimuth angle increases from −15° to −8° (optimal case). A solar greenhouse with the optimal orientation has the maximum value of avoided operative primary energy of 121.85 GJ. With a further increase in the azimuth angle, avoided operative primary energy decreases from 120.78 GJ to 117.96 GJ (
Figure 10).
In further investigation, the optimal solar greenhouse will be analyzed to improve its energy efficiency (PV slope 37.5°, azimuth angle −8°).
3.3. Different PV Cell Efficiency and Zero-Net-Energy Solar Greenhouse
In this part of the investigation, the optimal solar greenhouse with variable cell efficiency of the PV module was optimized to achieve a zero-net-energy solar greenhouse.
Table 3 represents the results obtained for generated energy and energy consumption in the greenhouse with different values of PV efficiency (20%, 22%, and 24%) through the energy optimization routine. A comparison of the mentioned energy outputs with the referent solar greenhouse was made. Energy savings were also considered. Through the optimization procedure, it was established that it is necessary to install PV panels with a cell efficiency of 23.94% to realize the concept of zero-net-energy solar greenhouses.
According to
Table 3 and the obtained results, it can be concluded that the amount of generated energy increases significantly with the increase in PV module efficiency: with a PV cell efficiency of 22% and 24%, the annual generated energy is 45.76 GJ and 50.59 GJ, respectively. The net energy consumption of solar greenhouses with PV and GSHP is reduced to values of 4.65 GJ and −0.18 GJ, respectively. Negative net energy consumption means that the greenhouse has an annual energy surplus (
Figure 11). With the installation of the PV array with higher cell efficiency of 22% and 24% (on an optimally oriented greenhouse, compared to the referent case), it is possible to achieve annual final energy saving of 5.54 GJ or 54.37% and 10.37 GJ or 101.77%, respectively. Generated energy with PV cell efficiency of 22% and 24% meets 90.77% and 100.39% of solar greenhouse energy needs, respectively.
Simulation results obtained by Genopt, according to Equation (1), showed that the optimal value of PV module efficiency for achieving zero-net-energy solar greenhouses is 23.94%. A zero-net-energy solar greenhouse generates an amount of 50.41 GJ energy/year. With the installation of a PV array with a module efficiency of 24%, the generated energy is 50.59 GJ, the energy surplus is 0.18 GJ, and its energy production reaches 100.36% of total energy consumption.
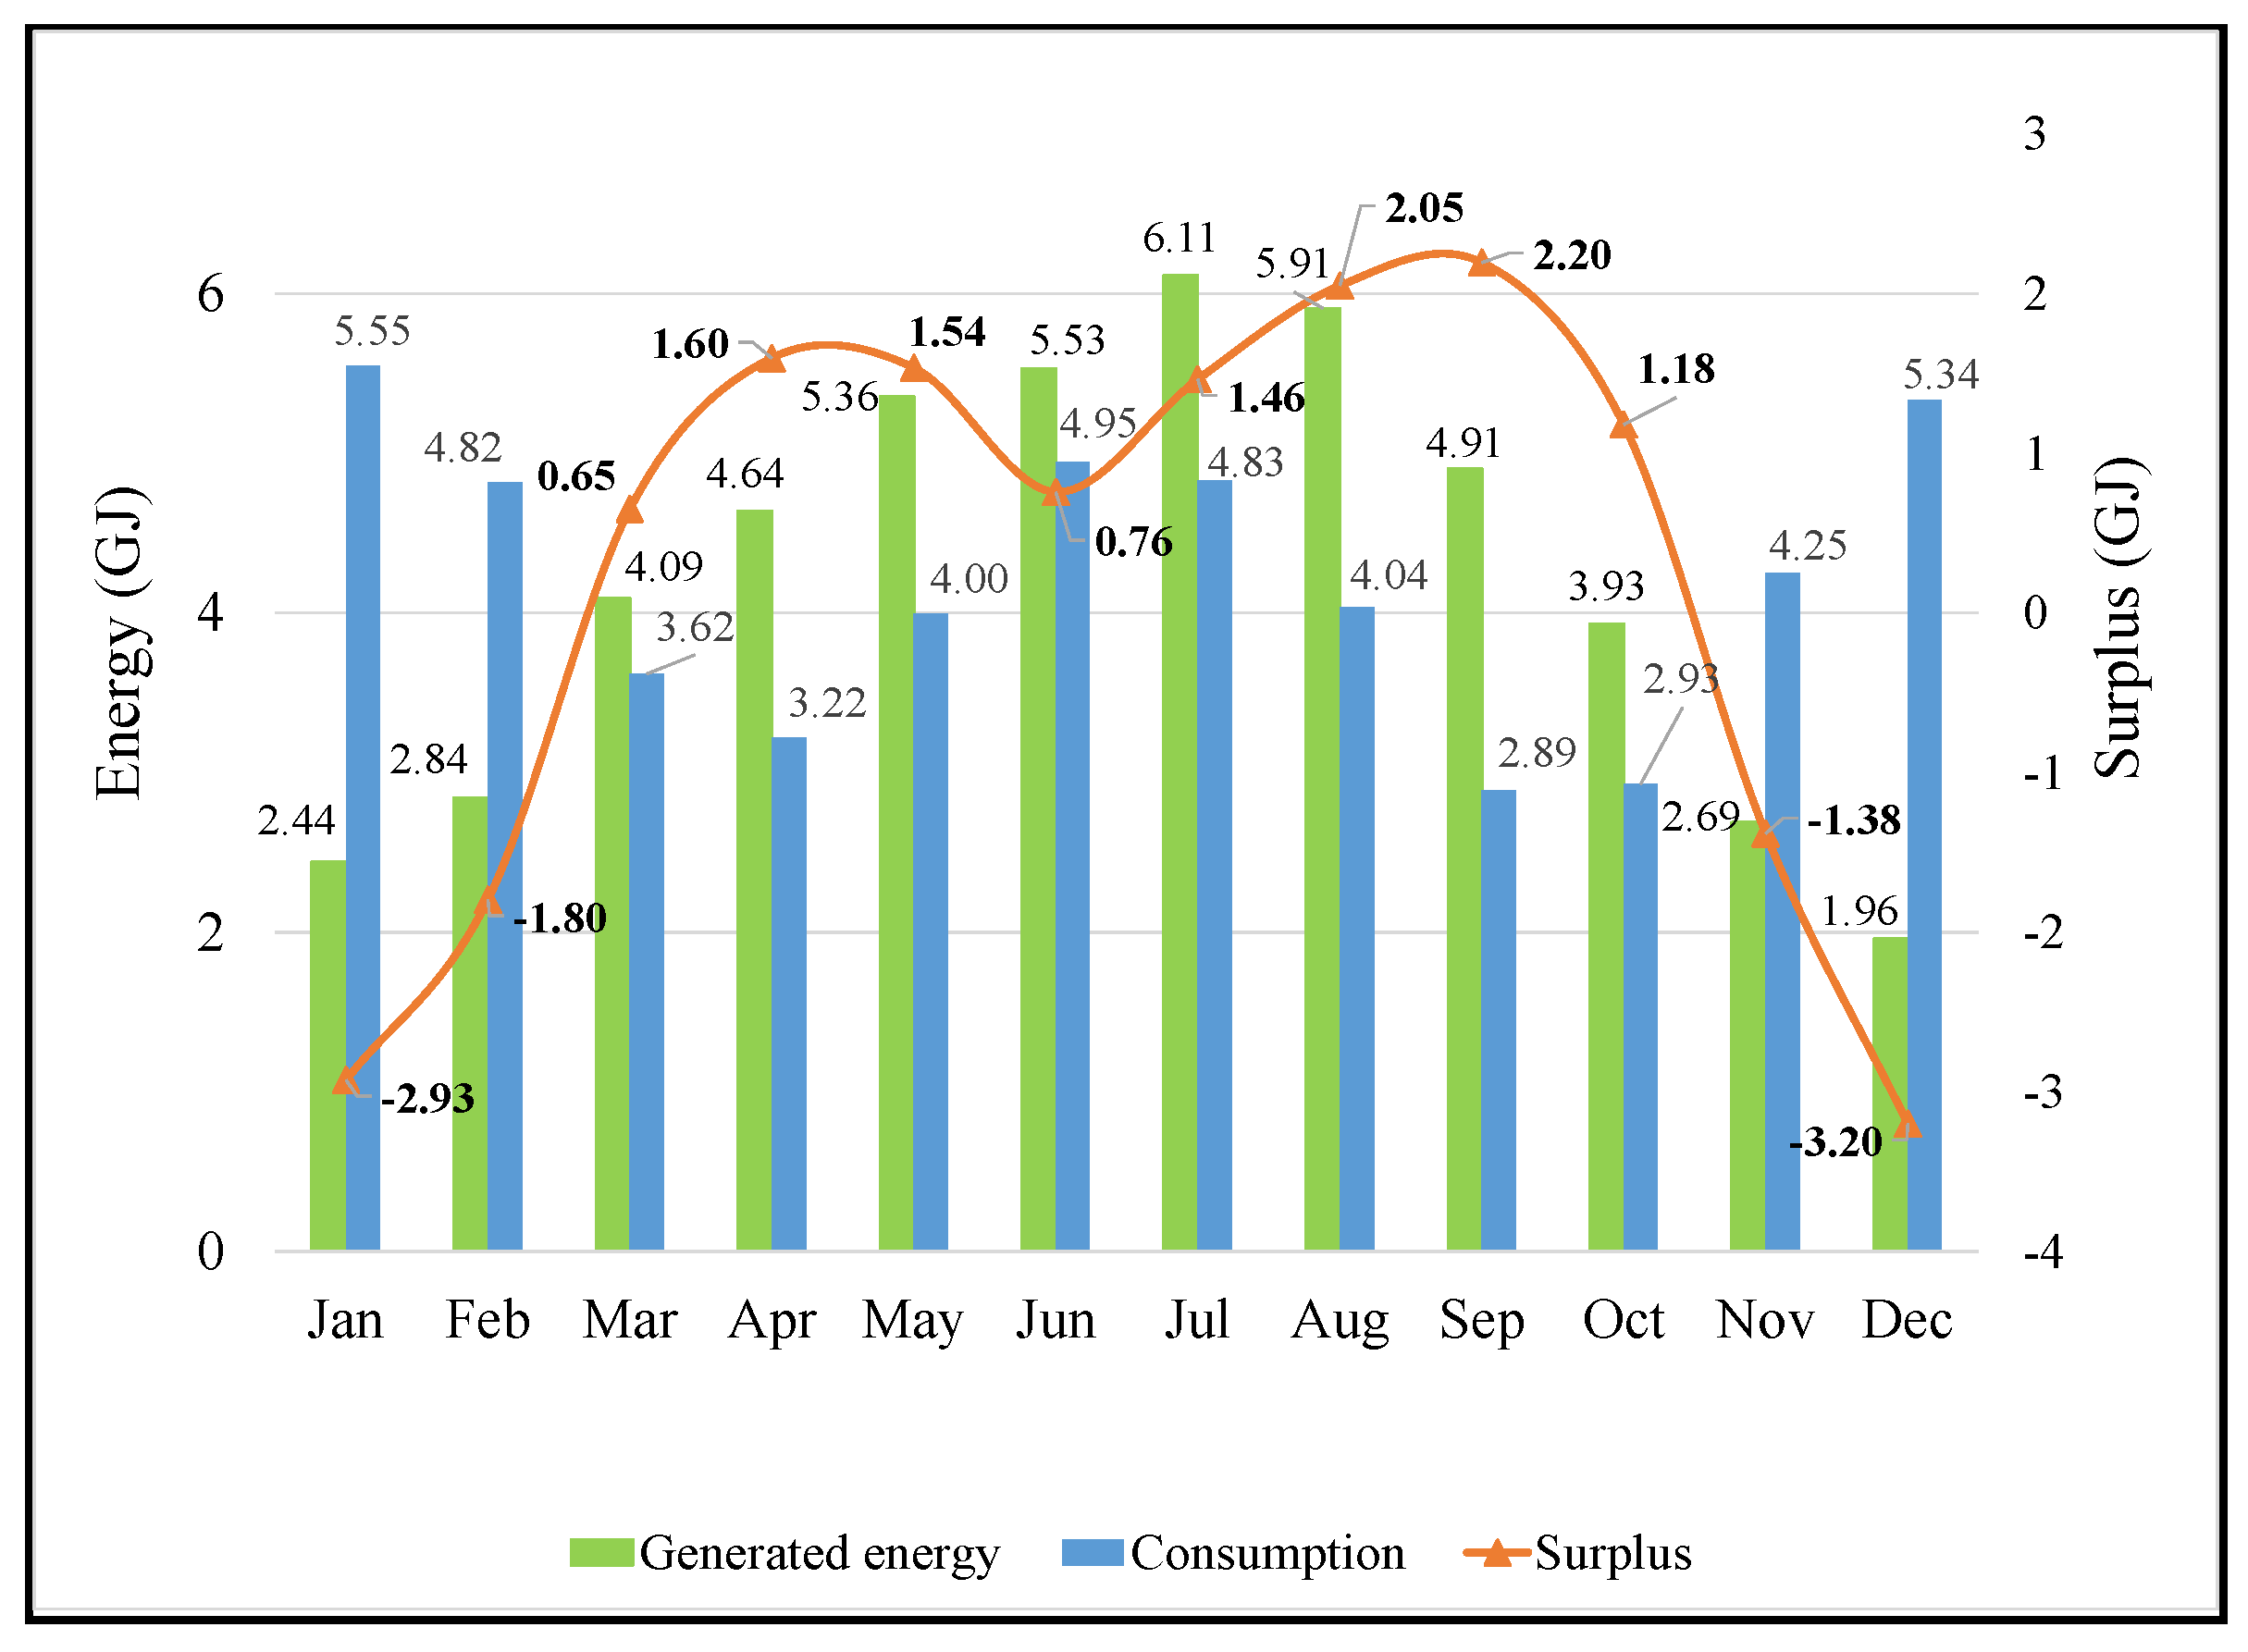
Figure 12 presents monthly energy consumption, generated energy, and surplus in the zero-net-energy greenhouse (optimal azimuth angle of −8°, optimal PV module efficiency of 23.94%).
During winter months, energy consumption is much higher than in other months. Its maximal values are from November to February, and they range from 4.25 to 5.55 GJ. For these months, the energy surplus is in the range of −3.20–(−1.38) GJ, i.e., energy needs are higher than generated energy. Therefore, the required energy is bought from the electricity distribution network. Generated energy from March to October increases (in the range of 4.09–6.11 GJ), and its values are significantly higher than energy consumption (2.69–4.95 GJ). This means that energy surplus has positive values (in the range of 0.65–2.20 GJ), and the generated energy in the zero-net-energy greenhouse meets its energy needs. Energy surplus is sold to the network. The minimum value on the surplus energy curve is interesting—during June, the generated energy has a high value (5.53 GJ), but the energy consumption also has a high value (4.95 GJ); thus, the surplus is very small (0.76 GJ). This surplus is smaller than the surplus in April, May, and in the period from July to October, when a significantly larger amount of energy is generated.
In the modern market today, there are PV panels with cell efficiencies of up to 24% [
47], which proves that the energy optimization procedure is justified. The implementation of photovoltaic panels with high cell efficiency in greenhouses can contribute to greater energy savings in the agricultural sector and be very beneficial for agricultural development.
3.4. Environmental Analysis of the Different Solar Greenhouses
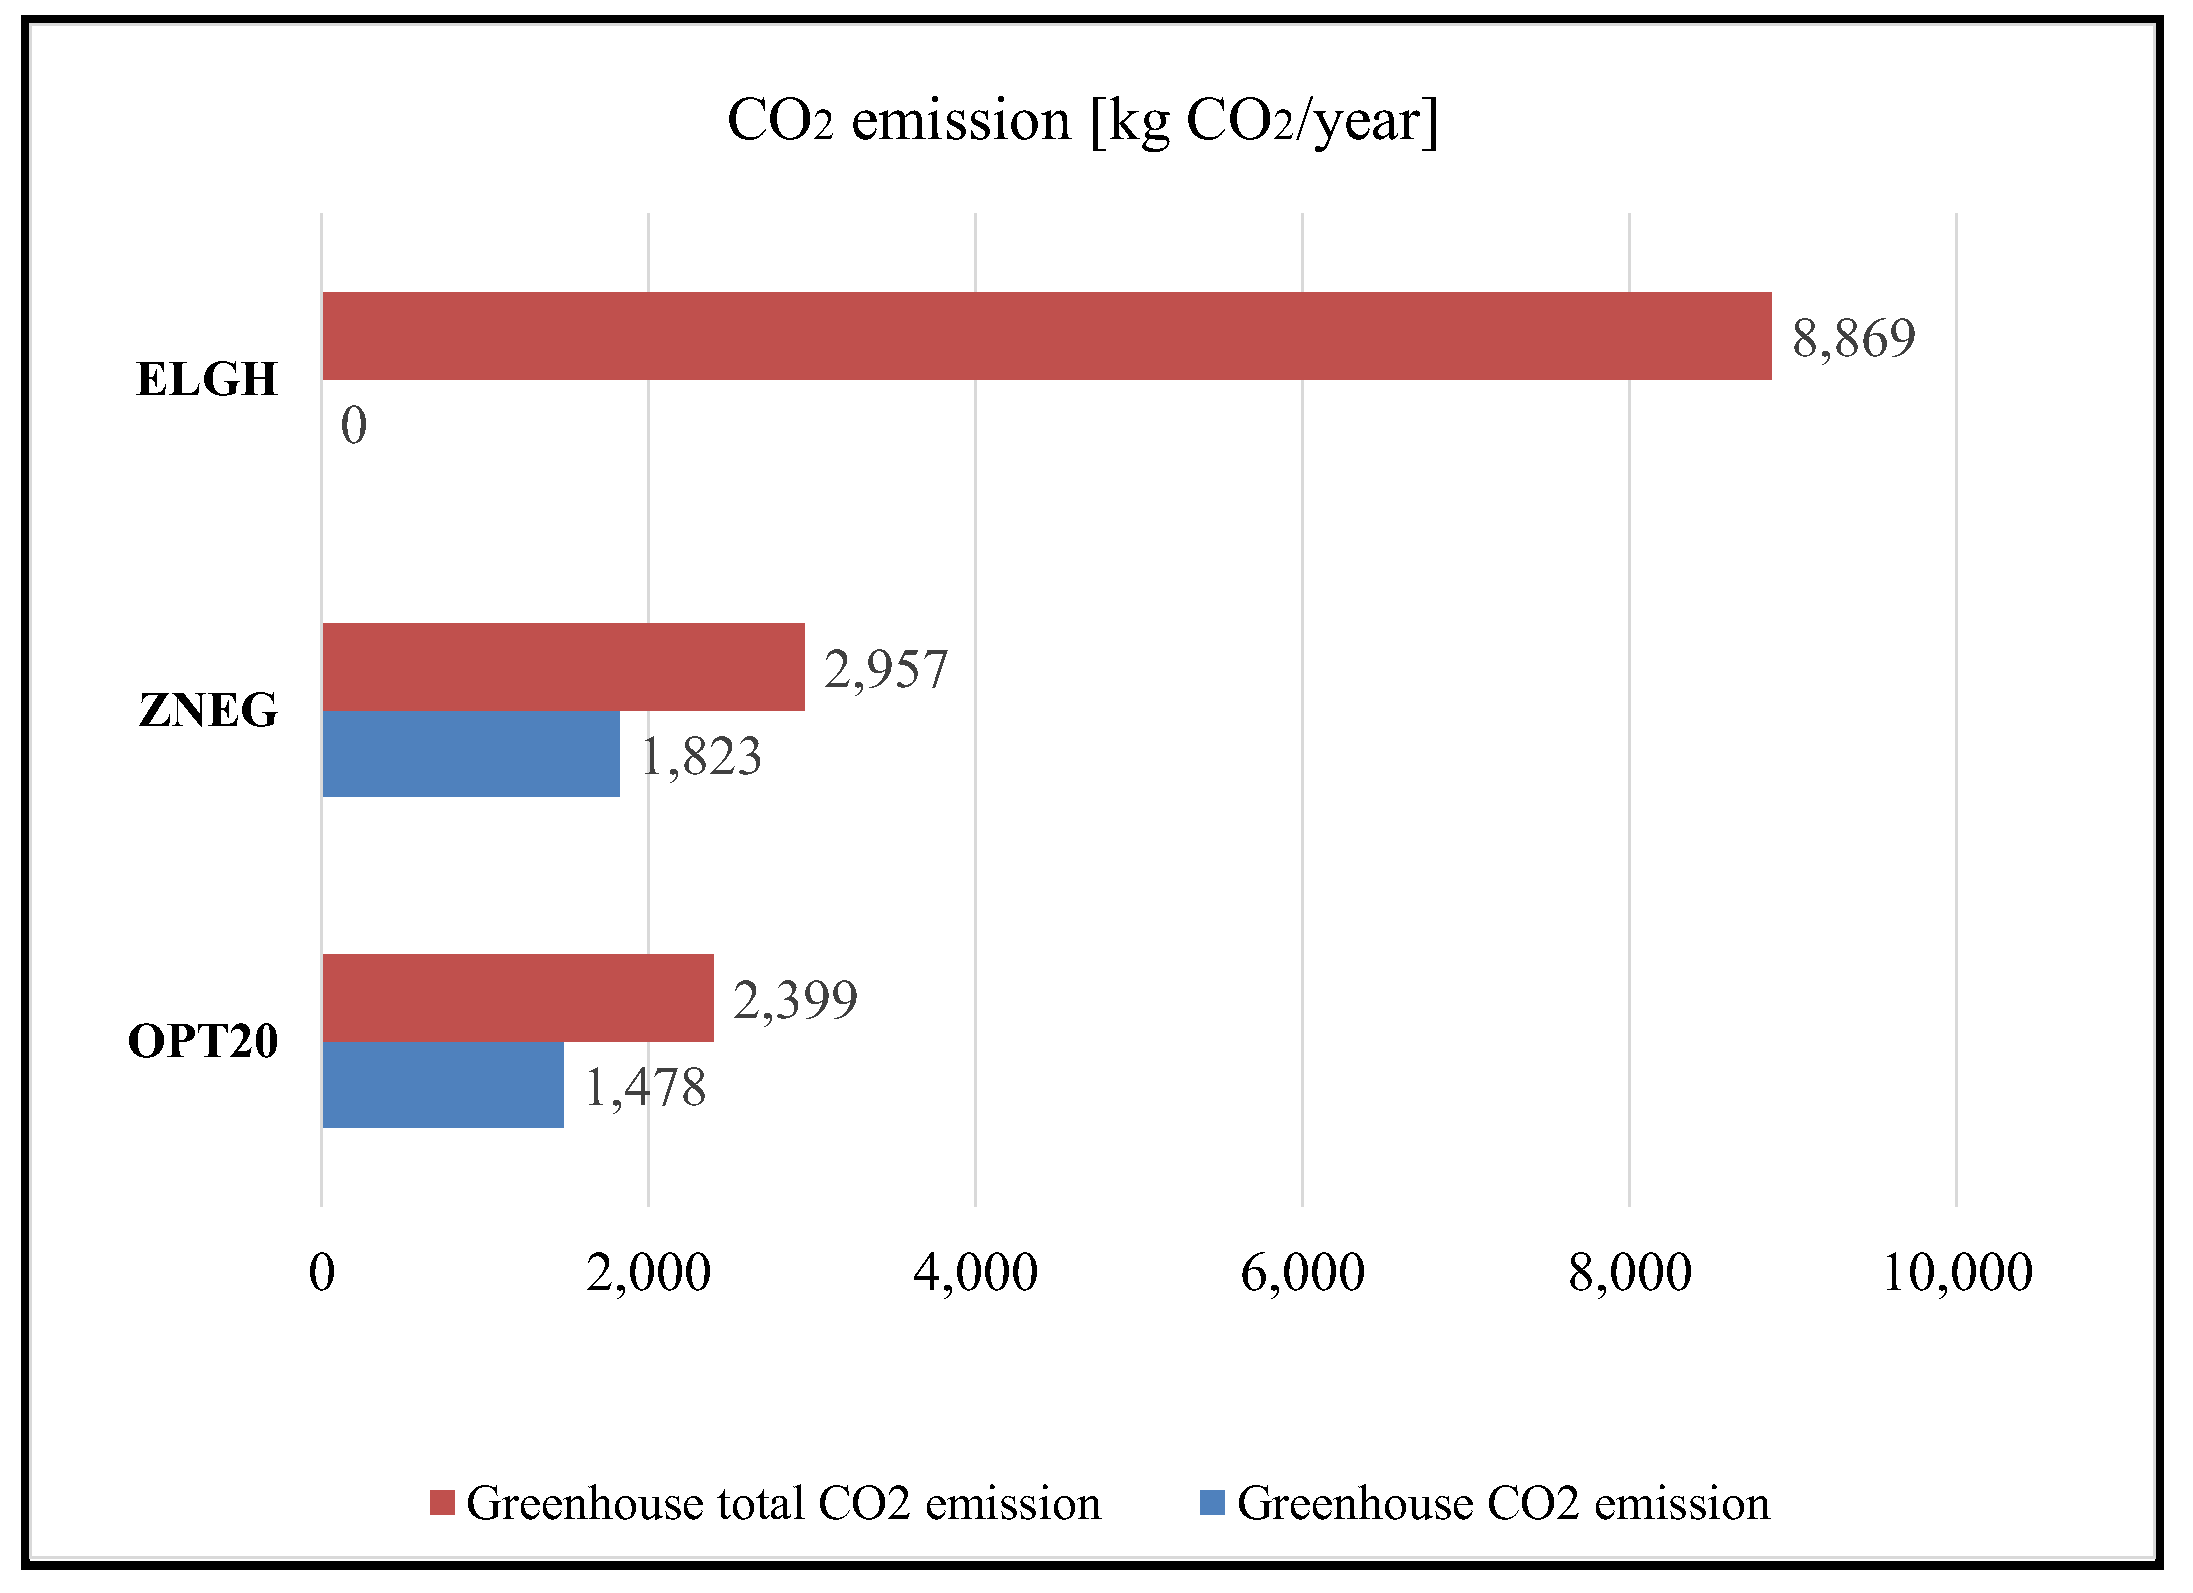
In this part of the investigation, the results of the environmental analyses are presented. Four different cases of greenhouses are considered (the area of PV panels at all greenhouses was 40 m2):
OPT20—optimal greenhouse with PV cell efficiency of 20%;
ZNEG—obtained zero-net-energy greenhouse;
ELGH—greenhouse with electricity used for heating and cooling.
Simulation results show that CO
2 emissions increase with increasing amounts of generated energy (
Table 4,
Figure 13). The CO
2 emission of installed renewable energy systems in OPT20 greenhouse is 341 kg CO
2/year from the PV array and 1137 kg CO
2/year from GSHP, while total CO
2 emission from PV and GSHP is 580 kg CO
2/year and 1819 kg CO
2/year, respectively. Therefore, OPT2 greenhouse emission of CO
2 is 1478 kg CO
2/year, and the total emission of CO
2 is 2399 kg CO
2/year.
For the ZNEG greenhouse, CO
2 emission from PV and GSHP is 421 kg CO
2/year and 1402 kg CO
2/year, respectively, while total CO
2 emission from PV and GSHP is 714 kg CO
2/year and 2243 kg CO
2/year, respectively. The ZNEG greenhouse’s emission of CO
2 is 1823 kg CO
2/year, and the total emission of CO
2 is 2957 kg CO
2/year (
Figure 13).
Compared to the ELGH case, where the analyzed greenhouses consume only electricity, the saved emission of CO
2 is 7391 kg CO
2/year in the OPT20 case and 6626 kg CO
2/year in the ZNEG case (without embedded emissions). When embedded emissions are taken into account, then the total saved emission of CO
2 is 64,701 kg CO
2/year in the OPT20 case and 5912 kg CO
2/year in the ZNEG case (
Figure 13).
The emission payback time in the different cases decreases with increasing PV cell efficiency. The reason is the larger amount of generated energy. In the cases of different greenhouses—OPT20 and ZNEG—the emission payback time for the PV array is 1.04 years and 0.87 years, respectively, while the emission payback time for GSHP decreases from 10.76 to 9.8 years in these analyzed cases.
3.5. Economic Analysis of the Different Solar Greenhouses
An economic analysis of different cases of solar greenhouses is performed to determine the economic viability of the installation of the GSHP and PV array.
As mentioned earlier, monocrystalline PV modules are chosen, such as the type FU 200 M Silk
® Pro (manufacturer FuturaSun, Cittadella, Italy) [
58]. The nominal power of the FU 200 M Silk
® Pro PV module is 200 Wp, the dimensions are 1580 × 808 × 35 mm, and the weight is 14 kg (a light weight is very important for installing on greenhouses). The Open Circuit Voltage is 45.98 V, and the current is 5.16 A; hence, the type FU 200 M Silk
® Pro module is suitable for a wide variety of installations. This module has a 25-year performance guarantee with a minimum annual reduction of 0.5% from the second year, starting at 97% in the first year.
Based on the required heating/cooling load and GSHPs that are available on the Serbian market, the NIBE S1256 ground-source heat pump is chosen (manufacturer NIBE Group, Markaryd, Sweden) [
63]. The heat exchanger in this GSHP system consists of two horizontal collectors. NIBE S1256 ground-source heat pump has a nominal heating output of 8 kW and an A+++ system efficiency class for heating. This product represents the most energy-efficient ground-source heat pump—the seasonal coefficient of performance is up to 6.2. During the simulations in this investigation, the average value of COP for heating and cooling was 5.6 and 4.35, respectively.
Two different cases were analyzed—OPT 20 and ZNEG (same as in
Section 3.4). The comparison was made with an ELGH solar greenhouse, which operates by using electricity. Data for energy consumption, generated energy, and financial investments of the GSHP and PV array are given in
Table 5. Financial savings and payback time are also calculated.
The total investment for the ground-source heat pump is 16,450 €. This investment is divided into two parts. The first part includes the initial cost for the GSHP, the cost for horizontal collector’s mounting, connection with the other elements of the system, and the installation of other system elements. The second part of the total investment cost refers to the GSHP yearly operation cost. This analysis was conducted with an initial cost of 8850 € for the GSHP [
63], while the remaining 7600 € relates to the collectors mounting, installation, and connections. This price is taken into consideration as the average price of ground-source heat pumps available on the Serbian market.
For OPT20 and ZNEG greenhouses, the calculated value of investment I
PV for PV modules is 2680 € and 2876 €, respectively; the yearly value of financial profit is 503 € and 584 €, and the yearly financial saving is 1924 € and 2240 €, respectively, based on the values for electricity consumption and generated energy. Based on these data, the total investment for OPT20 and ZNEG greenhouses is 19,130 € and 19,326 €. Compared to the electricity operating greenhouse ELGH, the payback period is calculated—for OPT20 greenhouse, it is 9.94 years, and for ZNEG, it is 8.63 years (
Figure 14).
Photovoltaic modules with higher efficiency require greater investment, but their generated electricity is higher, and financial savings for these modules are greater. The result is lower payback periods for higher PV efficiency.
Sensitivity Analysis
In the ZNEG case, the total investment for the PV array and GSHP is 19,326 € (
Table 5). In this price, the larger part relates to the GSHP (16,450 €) and the smaller part to the photovoltaics (2876 €). It is clear that the choice of heat pump has the greatest impact on the economic analysis and payback period. Next table (
Table 6) presents the results of the greenhouse economic analysis for ZNEG and two more cases: the first case is GSHP with the same characteristics but with a total investment of 14,950 € (GSHP with a price of 7350 €; other expenses are the same—7600 €), the second case is a cheaper GSHP with a total investment of 13,700 €. For the PV array, all data are the same as in the ZNEG case—the value of the investment is 2876 €, the financial profit is 584 €, and the yearly financial saving is 2240 €.
For Case 1 and Case 2, the total investment is 17,826 € and 16,576 €, respectively. The reduction in GSHP’s total investment costs has the effect of reducing the payback period. With a decrease in greenhouse total investment costs, the payback period also decreases. In Case 1, the payback period is 7.96 years, while in Case 2, the payback period is 7.4 years.
The second parameter that is important for economic sensitivity analysis is the value of the feed-in tariff. The feed-in tariff can significantly reduce the payback period. Data in
Table 1 are calculated for a feed-in tariff of 0.2066 €/kWh, which has been a valid tariff in Serbia in recent years. In the next investigations, different values of the feed-in tariff were considered, and results for the payback period for ZNEG, Case 1, and Case 2 are presented in
Figure 15.
For a feed-in tariff of 0.4 €/kWh, the payback period is 5.5–6.5 years, depending on the GSHP type. If the feed-in tariff has a value of 0.6 €/kWh, the payback period is 4.5–5.5 years, while for a feed-in tariff of 0.8 €/kWh, the payback period drops to 4.2–5 years. These data are very significant for greenhouse owners’ decision-making about investment in technologies of renewable energy sources.
3.6. Validation of the Obtained Results
Simulation and optimization results obtained by the EnergyPlus software certainly have a very high accuracy. As mentioned earlier in the paper, today, the EnergyPlus software is one of the most reliable software for simulating energy behavior and energy flows in the building sector. No matter how much we believe in the reliability of the obtained results, it is necessary to highlight their accuracy through comparison with the results obtained in other studies that dealt with the same or similar topics.
Table 7 presents the comparison and agreement of the results obtained in this study with similar investigations, which were conducted using EnergyPlus.
It should be noted that the GSHP’s payback period is not relevant because it depends on the price of the GSHP, its installation, and investment cost. The paper of Chahidi et al. [
37] in
Table 7 shows good agreement between simulation results obtained by EnergyPlus and appropriate experimental measurements, confirming the validity of EnergyPlus.
4. Conclusions
The main goal of the analysis presented in this paper was to determine the optimal orientation, i.e., the optimal azimuth angle of a solar greenhouse with GSHP and PV array, simulated in the EnergyPlus software. In the optimal position, PV panels generate the largest possible amount of electricity, and it is possible to achieve the concept of zero-net-energy greenhouses. The optimization routine in GenOpt gave the optimal azimuth angle of −8° for solar greenhouses (PV cell efficiency of 20% and area of 40 m2). Optimal solar greenhouses have a total energy consumption of 50.41 GJ and the lowest net energy consumption of 9.49 GJ annually. Its amount of generated energy is 40.92 GJ.
The next aim of the research was to achieve the concept of zero-net-energy greenhouses. Therefore, the PV module efficiency is optimized while retaining the other parameters (orientation, slope, and area of the PV array). Through the optimization routine, results for higher value of the PV cell efficiency were obtained, showing that with increasing module efficiency, generated energy increased significantly. With a PV efficiency of 23.94%, a zero-net-energy solar greenhouse is achieved.
An environmental analysis of different greenhouses was conducted, and CO2 emission and total CO2 emission were calculated. CO2 emission increases with the increase in PV module efficiency. For the zero-net-energy solar greenhouse, CO2 emission was 1823 kg CO2/year, total CO2 emission was 2957 kg CO2/year, and the emission savings were 6626 kg CO2/year and 5912 kg CO2/year (without and with embedded emission of CO2, compared with electricity usage).
In the end, an economic analysis of the installed renewable energy systems was performed. The total investment for these systems is very high (19,130 € for OPT20 greenhouse and 19,326 € for ZNEG greenhouse), but they are very cost-effective systems, with a payback period of 9.94 years for OPT20 greenhouse and 8.63 years for ZNEG. Sensitivity analysis shows that the choice of cheaper GSHP of the same characteristics can reduce the payback period to 7.4 years.
Results presented in the paper showed that there is a great possibility of saving energy in the agricultural sector. This is particularly important from the perspective of reducing fossil fuel use and greenhouse gas emissions. Energy and financial savings could be greater if a low-temperature heating system, such as panel floor heating, is applied in the greenhouse. When analyzing the environmental aspects, it is possible to investigate the installation of PV panels with higher module efficiency to maximize avoided operational primary energy and emission savings through optimization routines. Also, further investigations can be aimed at economic optimization to maximize financial profit. Solutions with lower investment costs can be considered to reduce the payback period.
The general trend in the field of renewable energy technologies is to reduce their cost and increase their efficiency. Therefore, the increasing application of RES in the field of agriculture is fully justified because these technologies enable better crop yields and their growth in controlled conditions.


 ,
, 


