
A Scenario-Based Simulation Study for Economic Viability and Widespread Impact Analysis of Consumption-Side Energy Storage Systems

Abstract
:1. Introduction
2. Comparison of Production-Side and Consumption-Side Energy Storage
3. Consumption-Side Energy Storage and Residential Energy Storage Systems (RESSs)

| Battery | Energy Density (Wh/kg) | Lifespan (Cycles) | Depth of Discharge (DoD) (%) | Safety | Environm. Concerns | Price | Energy Loss | Recycling |
|---|---|---|---|---|---|---|---|---|
| Li-Ion Batteries | 150–250 | 1500–2500 | 80–90 | Higher risk of overheating and thermal runaway | Toxic metals like cobalt can be harmful | Typically higher due to higher energy density | Moderate (due to heat generation) | Challenging; involves toxic materials such as cobalt |
| LiFePO4 Batteries | 90–150 | 2000–10,000 | 90–100 | Much safer; lower risk of thermal runaway | More environmentally friendly; no cobalt or nickel | Generally lower; more cost-effective over lifespan | Low (more efficient charge/discharge) | Easier; environmentally friendlier, with fewer toxic components |
4. Economic Analysis of the Applicability of RESSs
5. Simulation of Energy Storage in Residential Areas and Widespread Impact Analysis
5.1. Objective of the Simulation
5.2. General Data Used in the Simulation
5.2.1. General Information About Electric Consumer Accounts
5.2.2. Energy Prices, RESS Costs, and Economic Return Criteria
5.2.3. Determination of Load Capacity on Energy Transmission Lines and Future Projections
5.2.4. Scenarios and Calculations for Widespread Impact Analysis
5.2.5. Economic Data on Energy Production and Transmission Investments
5.3. Functions of Simulation Modules (Parts)
5.3.1. Part 1
5.3.2. Parts 2 and 3
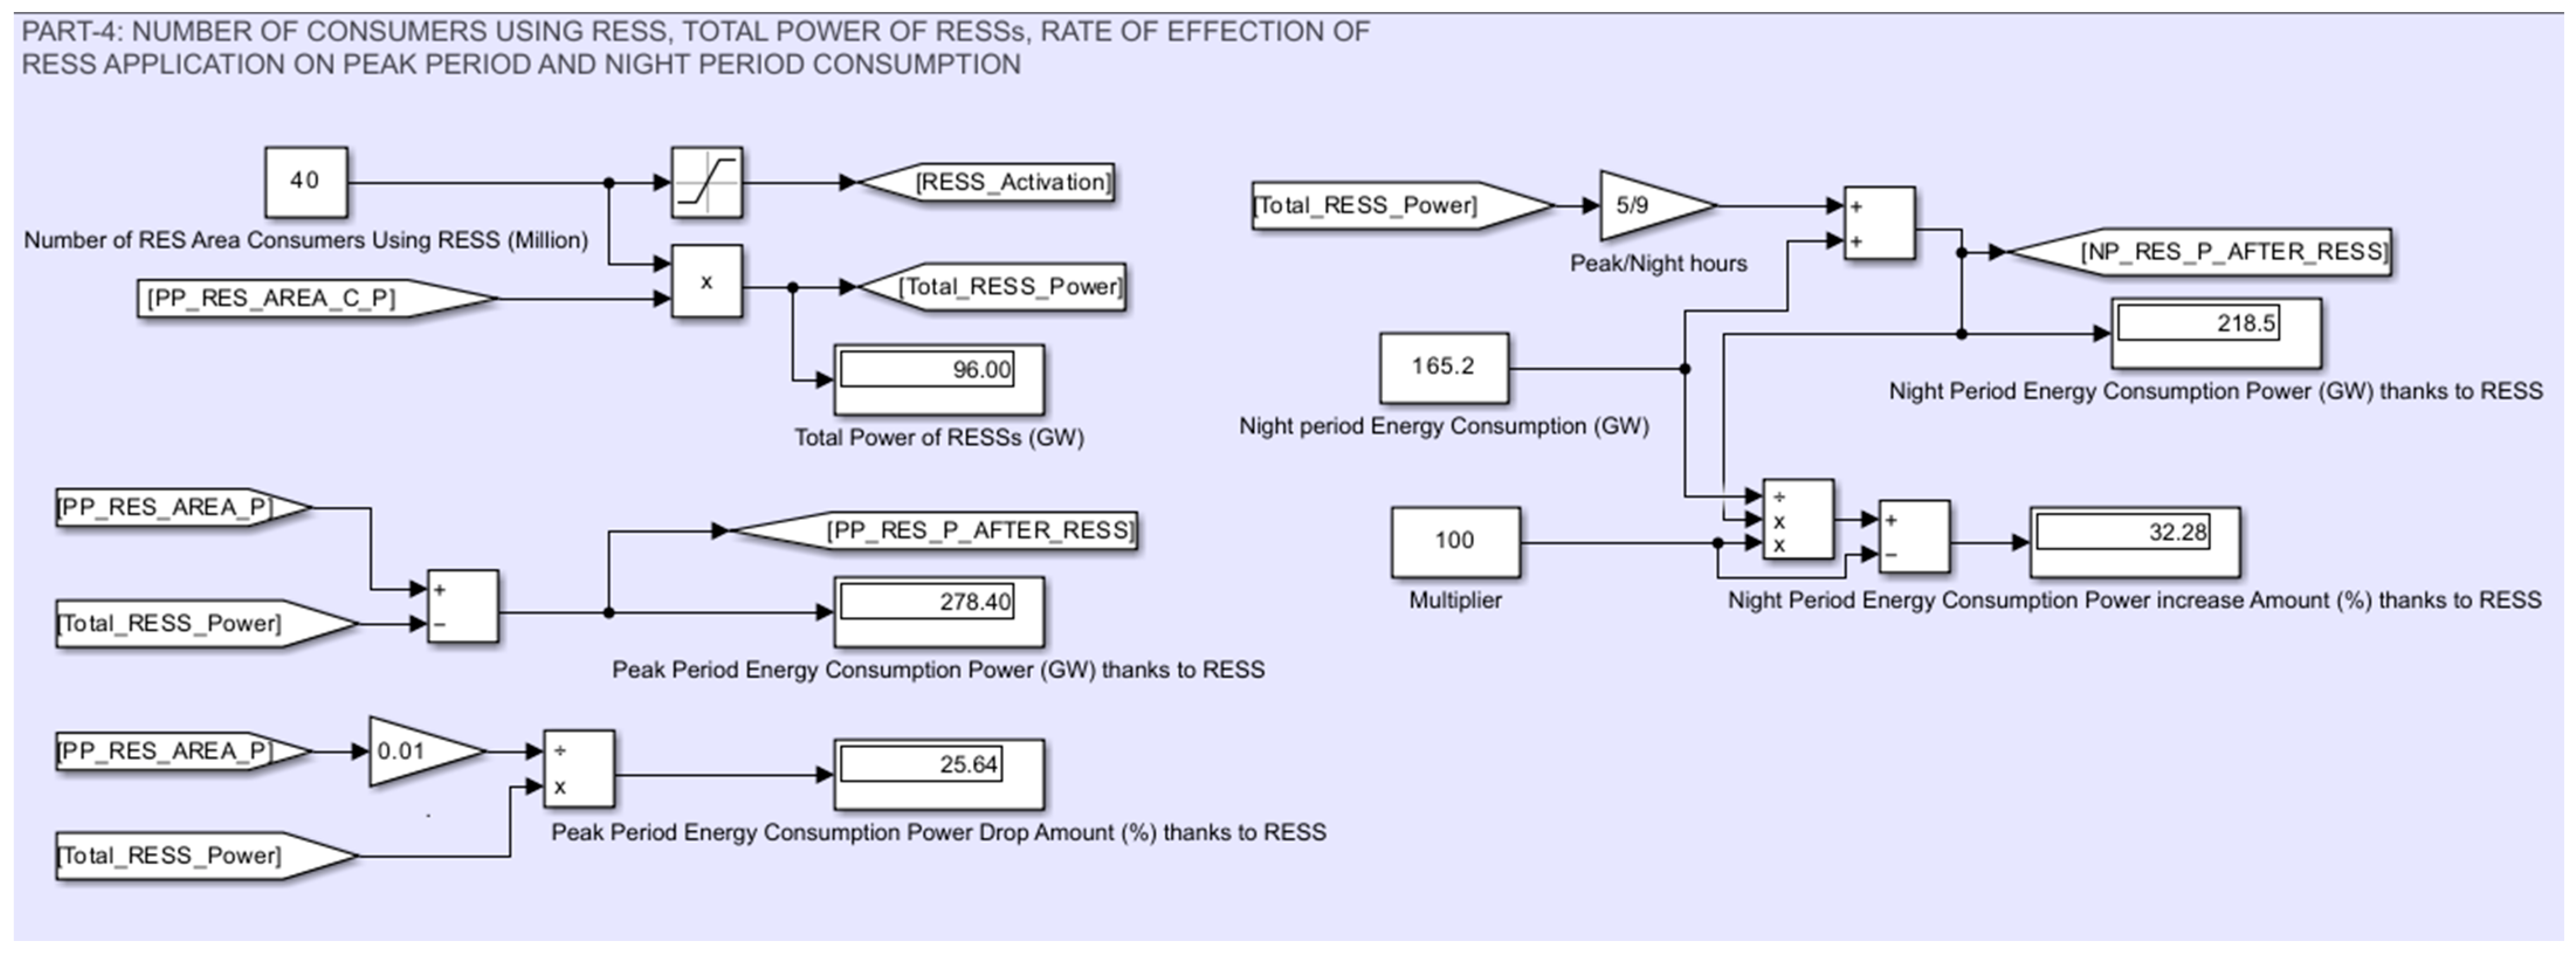
5.3.3. Part 4
5.3.4. Part 5
6. Analysis of Simulation Results
- →
- The peak period consumption power decreases by 30.77%, while the night period consumption increases by 32.28%. In other words, approximately 30% of the peak period consumption power in residential areas is shifted from the peak period to the night period.
- →
- This change causes the required energy production power in the peak period to gradually decrease from 715.6 GW to 616.8 MW.
- →
- This situation causes a total decrease of 13.8% in energy production and 12% in the loading of power lines.
- →
- It is estimated that the higher consumption amount of 20% mentioned in the simulation will be reached within 15–20 years.
- →
- The time required for the construction of the energy transmission lines needed in the simulation is found to be 19.75 years.
- →
- The budget required for the new energy transmission lines needed to handle the 98.77 GW consumption increase has been determined to be USD 29.63 billion.
- →
- Similarly, it is seen that a period of 9.88 years and a budget of USD 49.39 B are needed for energy production plants. (These calculations ignore the value that money will lose value over the years due to inflation).
- →
- In the third group of scenarios, the number of residential consumers using RESS is gradually increased to 5 M, 10 M, 20 M and 40 M, and it is seen that the need for new energy transmission lines and energy plants decreases at each stage, and accordingly, the costs to be spent decrease and the time required for installation also decreases. When it is assumed that 40 M residential area consumers use RESS, it is seen that a 20% increase in energy consumption can be absorbed.
7. Conclusions, Discussions and Planned Studies
- →
- Consumer-side energy storage offers significant advantages over production-side systems in terms of benefits.
- →
- Organizing consumer-side energy storage through energy providers, rather than individual consumers, is more feasible and sustainable, as shown by scenario-based simulations.
- →
- The study focuses on residential energy storage systems (RESS), emphasizing their role in consumer-side energy storage.
- →
- Simulation scenarios consider energy prices, battery costs, and organizational strategies, including potential government grants or subsidies, and quantify economic benefits for EPCs and RESS users.
- →
- Comparative analysis reveals that LiFePO4 batteries are more suitable for RESS applications than Li-Ion batteries, considering lifespan, affordability, safety, energy losses, environmental impacts, and recyclability.
- →
- Widespread impact analysis estimates RESS adoption effects for 5 M, 10 M, 20 M, and 40 M consumers, highlighting impacts on energy production, transmission loads, and associated costs.
- →
- Sensitivity analysis identifies energy and battery prices as key factors affecting RESS viability.
- →
- More specific conclusions obtained by analyzing the simulation results are listed below.
7.1. Conclusions Derived from the Simulation Results
- (a)
- Independent implementation of RESS by consumers is economically challenging but becomes viable and beneficial when managed by EPCs. Simulation results show that RESS applications provide economic advantages for both EPCs and consumers, making the systems both feasible and sustainable.
- (b)
- Beyond economic benefits, stored energy enhances living standards by minimizing grievances caused by power outages due to natural disasters, equipment failures, or overloads. This also benefits EPCs by improving customer satisfaction and reducing compensation liabilities.
- (c)
- If 30% of residential consumers (approximately 40 M) adopt RESS, 96 GW of peak hour power demand can shift to nighttime. This increases the economic utilization of renewable energy sources, such as hydroelectric, wind, and geothermal power during off-peak hours.
- (d)
- Integrating photovoltaic (PV) panels into RESSs transforms them into solar PV systems. This advantage can position RESS as an important facilitator in the transition to renewable energy. If well planned, RESS systems can even support microgrid and smart home concepts.
- (e)
- The simulation results show that shifting 96 GW of power from peak to nighttime reduces peak period energy generation capacity needs by 13.8% on average, easing transmission line loads. These shifts defer investments in new energy plants and transmission lines, potentially postponing USD 30 M in transmission costs and USD 50 B in energy generation investments.
7.2. Discussion
- →
- The fact that the period of the RESS contract between the EPC and the consumer is 10–12 years, depending on the life of the LiFeFO batteries and the average life of the inverters, is approximately the same creates an advantage for RESS systems. This synchronization offers a significant advantage for RESS systems, as it reduces the likelihood of component replacements during the contract period, thereby minimizing potential energy losses associated with component failure, replacement logistics, and distribution disruptions. Furthermore, the long-term feasibility and affordability of RESS could be further enhanced if a structured battery recycling process is established, allowing cost-effective, recycled batteries to be used in subsequent contract cycles.
- →
- While the widespread adoption of RESS has the potential to significantly reduce carbon emissions and land use for energy generation, it also raises concerns regarding resource extraction, battery disposal, and the environmental impact of large-scale battery implementation. However, LiFePO4 batteries, that are known for their extended lifespan, low environmental impact, and superior recyclability compared to other battery chemistries, help mitigate many of these challenges.
- →
- In countries with centralized energy management systems, RESS implementation can be relatively straightforward and rapid. Production and assembly could be tendered to selected energy companies, while various models of state grants and incentives could be employed to accelerate widespread adoption.
- →
- However, this level of simplicity cannot be assumed for the United States, due to its highly diverse energy management structures. Significant variations exist among grid regions concerning infrastructure, energy pricing models, and organizational frameworks. For example, while some regions are dominated by vertically integrated utilities, others operate under deregulated markets, municipal utilities, or cooperative models. Transmission line loading capacities also vary, influencing how and where future energy investments are prioritized. These structural differences, including whether certain projects have already been planned or tendered, can influence both the feasibility and the perception of RESS implementation. Therefore, a more realistic assessment of RESS applicability in the U.S. would require a detailed examination of grid regions, the collection of up-to-date data from energy authorities, and the simulation of these data to evaluate the impact of RESS in various energy contexts.
- →
- The adoption of consumption-side energy storage technologies like RESS is expected to follow a gradual implementation timeline, likely spanning 10–15 years. This extended period is necessary to allow for supporting research, pilot projects, and case studies that can validate the benefits, technical feasibility, and economic viability of these systems. Additionally, the production and deployment stages must be carefully planned, with regulatory bodies recognizing the strategic importance of RESS and making the necessary legal adjustments to facilitate its integration. Given RESS’s potential to support smart grids, microgrids, smart buildings, electric vehicles, and the broader transition to renewable energy, establishing clear, long-term objectives from the outset will be critical for ensuring its successful adoption.
7.3. Planned Studies
- →
- In this article, in order to maintain the integrity of the subject, the superiority of consumption-side energy storage over production-side energy storage has been emphasized, the applicability of energy-side energy storage has been attempted to be proven, and the dimensions of the economic gains that can be obtained when widespread effects occur have been attempted to be shown. Therefore, not all the details have been sufficiently covered in the article. It is planned to address these details in future studies.
- →
- Initially, the aim is to conduct a more detailed analysis of possible organizational scenarios for consumer-side energy storage and their economic dimensions. Although an RESS can be built with a smart inverter and a battery bank, it is necessary to develop a prototype system that can perform the same functions at a lower cost. An RESS device primarily consists of LiFePO4 batteries, an inverter/charger, switching systems, cooling fans, necessary measurement components, displays, and essential metal parts. If the goal is to enable RESS to be converted into a solar PV or microgrid system when needed, the inverter must be selected accordingly. This factor directly impacts the cost of the RESS. Considering all these aspects, it is intended to approach this subject as a laboratory study and subsequently as a research paper.
- →
- The economic analyses presented in this paper do not account for the depreciation of money over time due to inflation. Moreover, it is planned to explore in a separate study how the time required to achieve widespread adoption of RESS might affect the overall impact and the substantial savings that may be achieved from deferred investments.
- →
- A separate investigation is needed to analyze how RESS applications should be implemented in different grid regions. There are significant differences between U.S. grid regions in terms of energy management, the types of energy companies, and the characteristics of their transmission systems. Consequently, the extent to which each grid region is affected by overloads can vary. These factors also influence the amount of savings achieved from deferred investments. Hence, it is planned to address these details through a separate simulation study.
- →
- The availability of inexpensive nighttime energy is a crucial criterion for consumer-side energy storage. When widespread adoption of RESS is achieved, a significant increase in nighttime energy consumption is expected. The batteries of rapidly growing electric vehicle fleets are also typically charged during nighttime periods, benefiting from lower energy costs. Therefore, it is planned to analyze the impact of electric vehicles during the widespread adoption phase of RESS.
- →
- In addition to the short-term research goals outlined above, it is planned to investigate the long-term contributions of the consumer-side energy storage concept to smart grid developments. For instance, one of the smart grid goals is to benefit from the energy stored by electric vehicles during times when peak consumption increases very suddenly [95,96,97]. An RESS designed in accordance with the microgrid system and capable of transferring the energy in electric vehicles to the grid when necessary could provide significant support to the smart grid system in this regard.
Funding
Data Availability Statement
Conflicts of Interest
Abbreviations
| Abbreviation | Explanation |
| RESS | Residential Energy Storage Systems |
| EPC | Energy Provider Compony |
| LiFePO4 Battery | Lithium-Iron Phosphate Battery |
| RA-Consumers | Residential Area Consumers |
| CA-Consumers | Commercial Area Consumers |
| IA-Consumers | Industrial Area Consumers |
| T-Lines | Transmission Liens |
| Peak-Pd | Peak Period |
| Day-Pd | Daytime Period |
| Night-Pd | Night Period |
References
- Available online: https://www.energy.gov/sites/default/files/202312/National%20Transmission%20Needs%20Study%20-%20Final_2023.12.1.pdf (accessed on 2 January 2025).
- Nye, D.E. When the Lights Went Out: A History of Blackouts in America; Mit Press: Cambridge, MA, USA, 2010. [Google Scholar]
- U.S. Energy Information Administration (EIA). Electricity Use in Homes. Available online: https://www.eia.gov/energyexplained/use-of-energy/electricity-use-in-homes.php (accessed on 8 December 2024).
- U.S. Energy Information Administration (EIA). Hourly Electric Grid Monitor. Available online: https://www.eia.gov/electricity/gridmonitor/dashboard/electric_overview/US48/US48 (accessed on 8 December 2024).
- U.S. Energy Information Administration (EIA). Energy Consumption Ratios in the USA. Available online: https://www.eia.gov/energyexplained/electricity/use-of-electricity.php (accessed on 8 December 2024).
- Kiray, V. An Opinion on Minimizing the Need for Agricultural and Public Areas While Renewable Energy Production Capacity Is Increasing Rapidly. Front. Energy Res. 2023, 11, 1285190. [Google Scholar] [CrossRef]
- Zhai, Z.; Abarr, M.L.L.; Al-Saadi, S.N.J.; Yate, P. Energy storage technologies for residential buildings. J. Archit. Eng. 2014, 20, B4014004. [Google Scholar] [CrossRef]
- Barmayoon, M.H.; Fotuhi-Firuzabad, M.; Rajabi-Ghahnavieh, A.; Moeini-Aghtaie, M. Energy storage in renewable-based residential energy hubs. IET Gener. Transm. Distrib. 2020, 10, 3127–3134. [Google Scholar] [CrossRef]
- Demir, S.; Kiray, V. Analysis of Storage Energy Usage in Residential Areas With Regard to Smart Grids and National Economy. In Proceedings of the 2015 Twelve International Conference on Electronics, Computer and Computation (ICECCO), Abuja, Nigeria, 10–12 September 2015; pp. 1–4. [Google Scholar]
- Kampouris, K.P.; Drosou, V.; Karytsas, C.; Karagiorgas, M. Energy storage systems review and case study in the residential sector. IOP Conf. Ser. Earth Environ. Sci. 2020, 410, 012033. [Google Scholar] [CrossRef]
- U.S. Energy Information Administration (EIA). Electricity Explained: How Electricity Is Delivered to Consumers. U.S. Department of Energy; Last modified March 2023. Available online: https://www.eia.gov/energyexplained/electricity/delivery-to-consumers.php (accessed on 14 December 2024).
- Borenstein, S.; Bushnell, J. The U.S. Electricity Industry after 20 Years of Restructuring. Annu. Rev. Econ. 2015, 7, 437–463. [Google Scholar] [CrossRef]
- Michaels, R.J. Vertical integration and the restructuring of the US electricity industry. SSRN 2006. [Google Scholar] [CrossRef]
- MacKay, A.; Mercadal, I. Deregulation, Market Power, and Prices: Evidence from the Electricity Sector; MIT Center for Energy and Environmental Policy Research: Cambridge, MA, USA, 2022. [Google Scholar]
- Rana, M.M.; Uddin, M.; Sarkar, M.R.; Meraj, S.T.; Shafiullah, G.M.; Muyeen, S.M.; Islam, M.A.; Jamal, T. Applications of energy storage systems in power grids with and without renewable energy integration—A comprehensive review. J. Energy Storage 2023, 68, 107811. [Google Scholar] [CrossRef]
- Zakeri, B.; Syri, S. Electrical Energy Storage Systems: A Comparative Life Cycle Cost Analysis. Renew. Sustain. Energy Rev. 2015, 42, 569–596. [Google Scholar] [CrossRef]
- U.S. Grid-Scale Energy Storage Market Sets Record. Renewable Energy Magazine. Available online: https://www.woodmac.com/press-releases/q3-us-grid-scale-energy-storage-market-sets-new-record/ (accessed on 14 December 2024).
- National Renewable Energy Laboratory (NREL). Grid-Scale U.S. Storage Capacity Could Grow Five-Fold by 2050. Available online: https://www.nrel.gov/news/program/2021/grid-scale-storage-us-storage-capacity-could-grow-five-fold-by-2050.html (accessed on 14 December 2024).
- Fan, X.; Liu, B.; Liu, J.; Ding, J.; Han, X.; Deng, Y.; Lv, X.; Xie, Y.; Chen, B.; Hu, W. Battery technologies for grid-level large-scale electrical energy storage. Trans. Tianjin Univ. 2020, 26, 92–103. [Google Scholar] [CrossRef]
- Bakare, M.S.; Abdulkarim, A.; Zeeshan, M.; Shuaibu, A.N. A Comprehensive Overview on Demand Side Energy Management Towards Smart Grids: Challenges, Solutions, and Future Direction. Energy Inform. 2023, 6, 4. [Google Scholar] [CrossRef]
- Mulleriyawage, U.G.K.; Shen, W.X. Impact of Demand Side Management on Optimal Sizing of Residential Battery Energy Storage System. Renew. Energy 2021, 172, 1250–1266. [Google Scholar] [CrossRef]
- Elio, J.; Phelan, P.; Villalobos, R.; Milcarek, R.J. A Review of Energy Storage Technologies for Demand-Side Management in Industrial Facilities. J. Clean. Prod. 2021, 307, 127322. [Google Scholar] [CrossRef]
- Ding, Y.; Xu, Q.; Huang, Y. Optimal Sizing of User-Side Energy Storage Considering Demand Management and Scheduling Cycle. Electr. Power Syst. Res. 2020, 184, 106284. [Google Scholar] [CrossRef]
- Zhang, H.; Kang, L.; Cai, J. Optimal Configuration of User-Side Energy Storage Considering Load Response and Demand Management. In Proceedings of the 2021 IEEE 4th International Conference on Electronics Technology (ICET), Chengdu, China, 8–12 May 2021; pp. 1168–1177. [Google Scholar]
- NREL Blog. When Does Energy Storage Make Sense? Available online: https://www.nrel.gov/state-local-tribal/blog/posts/when-does-energy-storage-make-sense-it-depends.html (accessed on 14 December 2024).
- Kiray, V. A Research Study to Increase Usage of PVs in Residential Areas. Front. Energy Res. 2021, 9, 680304. [Google Scholar] [CrossRef]
- Kiray, V.; Topal, T.; Şağbanşua, L.; Atacak, İ. A Modelling Study of Renewable and Stored Energy Sharing and Pricing Management System Developed for Multi-Apartment Complexes. In Proceedings of the IEEE PES Innovative Smart Grid Technologies Europe, Istanbul, Turkey, 12–15 October 2014; pp. 1–6. [Google Scholar]
- Hartono, B.S.; Budiyanto, Y.; Setiabudy, R. Review of Microgrid Technology. In Proceedings of the 2013 International Conference on QiR, Yogyakarta, Indonesia, 25–28 June 2013; pp. 127–132. [Google Scholar]
- Mahmoud, M.S.; Ur Rahman, M.S.; AL-Sunni, F.M. Review of Microgrid Architectures—A System of Systems Perspective. IET Renew. Power Gener. 2015, 9, 1064–1078. [Google Scholar] [CrossRef]
- Zhou, X.; Guo, T.; Ma, Y. An Overview on Microgrid Technology. In Proceedings of the 2015 IEEE International Conference on Mechatronics and Automation (ICMA), Beijing, China, 2–5 August 2015; pp. 76–81. [Google Scholar]
- Garg, V.K.; Sharma, S. Overview on Microgrid System. In Proceedings of the 2018 Fifth International Conference on Parallel, Distributed and Grid Computing (PDGC), Solan, India, 20–22 December 2018; pp. 694–699. [Google Scholar]
- Viswanathan, V.; Mongird, K.; Franks, R.; Li, X.; Sprenkle, V.; Baxter, R. 2022 Grid Energy Storage Technology Cost and Performance Assessment. 2022. Available online: https://www.pnnl.gov/sites/default/files/media/file/ESGC%20Cost%20Performance%20Report%202022%20PNNL-33283.pdf (accessed on 14 December 2024).
- Gür, T.M. Review of Electrical Energy Storage Technologies, Materials, and Systems: Challenges and Prospects for Large-Scale Grid Storage. Energy Environ. Sci. 2018, 11, 2696–2767. [Google Scholar] [CrossRef]
- Hittinger, E.; Whitacre, J.F.; Apt, J. What Properties of Grid Energy Storage Are Most Valuable? J. Power Sources 2012, 206, 436–449. [Google Scholar] [CrossRef]
- Denholm, P.; Jorgenson, J.; Hummon, M.; Jenkin, T.; Palchak, D.; Kirby, B.; Ma, O.; O’Malley, M. The Value of Energy Storage for Grid Applications. NREL/TP-6A20-58465; 2013. Available online: https://www.nrel.gov/docs/fy13osti/58703.pdf (accessed on 14 December 2024).
- Castillo, A.; Gayme, D.F. Grid-Scale Energy Storage Applications in Renewable Energy Integration: A Survey. Energy Convers. Manag. 2014, 87, 885–894. [Google Scholar] [CrossRef]
- Gagliano, A.; Nocera, F. Analysis of the Performances of Electric Energy Storage in Residential Applications. Int. J. Heat Technol. 2017, 35, S41–S48. [Google Scholar] [CrossRef]
- Aznavi, S.; Fajri, P.; Sabzehgar, R.; Asrari, A. Optimal Management of Residential Energy Storage Systems in Presence of Intermittencies. J. Build. Eng. 2020, 29, 101149. [Google Scholar] [CrossRef]
- Walker, A.; Kwon, S. Analysis on Impact of Shared Energy Storage in Residential Community: Individual Versus Shared Energy Storage. Appl. Energy 2021, 282, 116172. [Google Scholar] [CrossRef]
- Olivieri, Z.T.; McConky, K. Optimization of residential battery energy storage system scheduling for cost and emissions reductions. Energy Build. 2020, 210, 109787. [Google Scholar] [CrossRef]
- Argyrou, M.C.; Christodoulides, P.; Kalogirou, S.A. Energy Storage for Electricity Generation and Related Processes: Technologies Appraisal and Grid Scale Applications. Renew. Sustain. Energy Rev. 2018, 94, 804–821. [Google Scholar] [CrossRef]
- Kyriakopoulos, G.L.; Arabatzis, G. Electrical Energy Storage Systems in Electricity Generation: Energy Policies, Innovative Technologies, and Regulatory Regimes. Renew. Sustain. Energy Rev. 2016, 56, 1044–1067. [Google Scholar] [CrossRef]
- Ho, W.S.; Macchietto, S.; Lim, J.S.; Hashim, H.; Muis, Z.A.; Liu, W.H. Optimal Scheduling of Energy Storage for Renewable Energy Distributed Energy Generation System. Renew. Sustain. Energy Rev. 2016, 58, 1100–1107. [Google Scholar] [CrossRef]
- Ghiassi-Farrokhfal, Y.; Kazhamiaka, F.; Rosenberg, C.; Keshav, S. Optimal Design of Solar PV Farms With Storage. IEEE Trans. Sustain. Energy 2015, 6, 1586–1593. [Google Scholar] [CrossRef]
- Lai, C.S.; Jia, Y.; Lai, L.L.; Xu, Z.; McCulloch, M.D.; Wong, K.P. A Comprehensive Review on Large-Scale Photovoltaic System With Applications of Electrical Energy Storage. Renew. Sustain. Energy Rev. 2017, 78, 439–451. [Google Scholar] [CrossRef]
- Akeyo, O.M.; Rallabandi, V.; Jewell, N.; Ionel, D.M. The Design and Analysis of Large Solar PV Farm Configurations With DC-Connected Battery Systems. IEEE Trans. Ind. Appl. 2020, 56, 2903–2912. [Google Scholar] [CrossRef]
- Atherton, J.; Sharma, R.; Salgado, J. Techno-Economic Analysis of Energy Storage Systems for Application in Wind Farms. Energy 2017, 135, 540–552. [Google Scholar] [CrossRef]
- Kong, J.; Kim, S.T.; Kang, B.O.; Jung, J. Determining the Size of Energy Storage System to Maximize the Economic Profit for Photovoltaic and Wind Turbine Generators in South Korea. Renew. Sustain. Energy Rev. 2019, 116, 109467. [Google Scholar] [CrossRef]
- Akrami, E.; Gholami, A.; Ameri, M.; Zandi, M. Integrated an Innovative Energy System Assessment by Assisting Solar Energy for Day and Night Time Power Generation: Exergetic and Exergo-Economic Investigation. Energy Convers. Manag. 2018, 175, 21–32. [Google Scholar] [CrossRef]
- Zhang, X.; Qin, C.C.; Loth, E.; Xu, Y.; Zhou, X.; Chen, H. Arbitrage Analysis for Different Energy Storage Technologies and Strategies. Energy Rep. 2021, 7, 8198–8206. [Google Scholar] [CrossRef]
- Pusceddu, E.; Zakeri, B.; Gissey, G.C. Synergies Between Energy Arbitrage and Fast Frequency Response for Battery Energy Storage Systems. Appl. Energy 2021, 283, 116274. [Google Scholar] [CrossRef]
- Núñez, F.; Canca, D.; Arcos-Vargas, Á. An Assessment of European Electricity Arbitrage Using Storage Systems. Energy 2022, 242, 122916. [Google Scholar] [CrossRef]
- Datta, U.; Kalam, A.; Shi, J. Battery Energy Storage System to Stabilize Transient Voltage and Frequency and Enhance Power Export Capability. IEEE Trans. Power Syst. 2018, 34, 1845–1857. [Google Scholar] [CrossRef]
- Datta, U.; Kalam, A.; Shi, J. Battery Energy Storage System Control for Mitigating PV Penetration Impact on Primary Frequency Control and State-of-Charge Recovery. IEEE Trans. Sustain. Energy 2019, 11, 746–757. [Google Scholar] [CrossRef]
- Sagara, M.; Furukakoi, M.; Senjyu, T.; Danish, M.S.S.; Funabashi, T. Voltage Stability Improvement to Power Systems With Energy Storage Systems. In Proceedings of the 2016 17th International Conference on Harmonics and Quality of Power (ICHQP), Belo Horizonte, Brazil, 16–19 October 2016; pp. 7–10. [Google Scholar]
- Zuo, H.; Teng, Y.; Cheng, S.; Sun, P.; Chen, Z. Distributed Multi-Energy Storage Cooperative Optimization Control Method for Power Grid Voltage Stability Enhancement. Electr. Power Syst. Res. 2023, 216, 109012. [Google Scholar] [CrossRef]
- Parra, D.; Norman, S.A.; Walker, G.S.; Gillott, M. Optimum Community Energy Storage System for Demand Load Shifting. Appl. Energy 2016, 174, 130–143. [Google Scholar] [CrossRef]
- Barzin, R.; Chen, J.J.J.; Young, B.R.; Farid, M.M. Peak Load Shifting With Energy Storage and Price-Based Control System. Energy 2015, 92, 505–514. [Google Scholar] [CrossRef]
- Zhao, Q.-f.; Zhang, S.-Q.; Hu, M.-Y.; Wang, C.; Jiang, G.-H. Recent Advances in LiFePO4 Cathode Materials for Lithium-Ion Batteries. Int. J. Electrochem. Sci. 2021, 16, 211226. [Google Scholar] [CrossRef]
- Sayfutdinov, T.; Vorobev, P. Optimal Utilization Strategy of the LiFePO4 Battery Storage. Appl. Energy 2022, 316, 119080. [Google Scholar] [CrossRef]
- Newton, G.N.; Johnson, L.R.; Walsh, D.A.; Hwang, B.J.; Han, H. Sustainability of Battery Technologies: Today and Tomorrow. ACS Sustain. Chem. Eng. 2021, 9, 6507–6509. [Google Scholar] [CrossRef]
- Zhu, S.; Huang, A.; Xu, Y. Improving Methods for Better Performance of Commercial LiFePO4/C Batteries. Int. J. Electrochem. Sci. 2021, 16, 210564. [Google Scholar] [CrossRef]
- Available online: https://www.evlithium.com/Blog/lithium-ion-vs-lifepo4-battery.html?utm_source (accessed on 27 December 2024).
- Available online: https://www.anker.com/blogs/others/lifepo4-vs-lithium-ion?utm_source (accessed on 27 December 2024).
- Available online: https://ecotreelithium.co.uk/news/lithium-nmc-vs-lifepo4/?utm_source (accessed on 27 December 2024).
- Available online: https://www.vatrerpower.com/blogs/news/lifepo4-vs-lithium-ion-a-comprehensive-comparison?srsltid=AfmBOoqCPA5cjuYo4qHpA66-xPXPh5Jjm4HTi1CwtlMzR2-HVGfcGh57&utm_source (accessed on 27 December 2024).
- Available online: https://greenly.earth/en-us/blog/ecology-news/the-harmful-effects-of-our-lithium-batteries?utm_source (accessed on 27 December 2024).
- U.S. Energy Information Administration (EIA). Electric Power Monthly. Available online: https://www.eia.gov/electricity/monthly/ (accessed on 21 November 2024).
- U.S. Energy Information Administration (EIA). Electricity Data Browser. Available online: https://www.eia.gov/electricity/data/browser/ (accessed on 14 December 2024).
- U.S. Energy Information Administration (EIA). Electric Sales, Revenue, and Average Price. Available online: https://www.eia.gov/electricity/sales_revenue_price/ (accessed on 12 December 2024).
- U.S. Energy Information Administration (EIA). Annual Sales to Ultimate Customers by State and Sector, 2010–2023. Available online: https://www.eia.gov/electricity/data/state/ (accessed on 12 December 2024).
- U.S. Energy Information Administration (EIA). Average Prices of Electricity to Ultimate Customers. Available online: https://www.eia.gov/totalenergy/data/annual/ (accessed on 12 December 2024).
- Reuters. Battery Cell Prices Fall to Record Low in September, Says Report. Available online: https://www.reuters.com/markets/commodities/battery-cell-prices-fall-record-low-september-says-report-2024-10-30/ (accessed on 12 December 2024).
- International Energy Agency (IEA). Trends in Electric Vehicle Batteries. Available online: https://www.iea.org/reports/global-ev-outlook-2024/trends-in-electric-vehicle-batteries (accessed on 12 December 2024).
- Fortune Business Insights. Lithium Iron Phosphate Battery Market Size, Share & Industry Analysis. Available online: https://www.fortunebusinessinsights.com/lithium-ion-li-ion-phosphate-batteries-market-102152 (accessed on 12 December 2024).
- U.S. Energy Information Administration (EIA). Energy Consumption: Residential, Commercial, and Industrial Sectors. Available online: https://www.eia.gov/totalenergy/data/monthly/ (accessed on 12 December 2024).
- U.S. Energy Information Administration (EIA). Residential Energy Consumption Survey (RECS). Available online: https://www.eia.gov/consumption/residential/ (accessed on 12 December 2024).
- Federal Energy Regulatory Commission (FERC). Electricity Markets and Reliability. Available online: https://www.ferc.gov/industries-data/electric (accessed on 14 December 2024).
- U.S. Grid Regions|US EPA. Available online: https://www.epa.gov/green-power-markets/us-grid-regions (accessed on 2 January 2025).
- National Transmissin Needs Study 2023. Available online: https://www.energy.gov/sites/default/files/2023-10/National_Transmission_Needs_Study_2023.pdf?utm_source=chatgpt.com (accessed on 2 January 2025).
- Henderson, M.I.; Novosel, D.; Crow, M.L. Electric Power Grid Modernization Trends, Challenges, and Opportunities. IEEE Trans. 2017. Corpus ID: 52243357. [Google Scholar]
- U.S. Energy Information Administration (EIA). Electricity Data. Available online: https://www.eia.gov/electricity/data.php (accessed on 12 December 2024).
- North American Electric Reliability Corporation (NERC). 2019 Long-Term Reliability Assessment. Available online: https://www.nerc.com/pa/RAPA/ra/Pages/default.aspx (accessed on 12 December 2024).
- International Energy Agency (IEA). Electricity Networks: Time to Accelerate Investment. Available online: https://www.iea.org/reports/investment-in-electricity-networks (accessed on 1 December 2024).
- U.S. Energy Information Administration (EIA). Electricity Explained: Data and Statistics. Available online: https://www.eia.gov/energyexplained/electricity/data-and-statistics.php (accessed on 1 December 2024).
- Department of Energy (DOE). Annual U.S. Transmission Data Review. Available online: https://www.energy.gov/oe/articles/annual-us-transmission-data-review-march-2018 (accessed on 14 December 2024).
- U.S. Energy Information Administration (EIA). Form EIA-411, Coordinated Bulk Power Supply and Demand Program Report. Available online: https://www.eia.gov/electricity/data/eia411/ (accessed on 14 December 2024).
- Power-Grid. Underground vs. Overhead: Power Line Installation-Cost Comparison and Mitigation. Available online: https://www.power-grid.com/td/underground-vs-overhead-power-line-installation-cost-comparison/ (accessed on 14 December 2024).
- Statista. Electricity Transmission Lines Under Construction in the United States as of September 2023, by Cost. Available online: https://www.statista.com/statistics/1413981/united-states-electricity-transmission-lines-under-construction-by-cost/ (accessed on 4 December 2024).
- Statista. Transmission and Distribution Operating Expenses for Major Investor-Owned Electric Utilities in the United States from 2006 to 2022. Available online: https://www.statista.com/statistics/619905/transmission-and-distribution-operating-expenses-for-major-electric-utilities-in-the-us/ (accessed on 14 December 2024).
- Transmission Agency of North Carolina (TANC). Understanding Transmission. Available online: https://www.tanc.us/understanding-transmission/transmission-qanda/ (accessed on 4 December 2024).
- Giron, R. Struggles on the Path to Renewable Energy: Lessons from SunZia. Nat. Resour. J. 2014, 54, 81–106. [Google Scholar]
- MISO Energy. Transmission Cost Estimation Guide for MTEP22. Available online: https://cdn.misoenergy.org/20220208%20PSC%20Item%2005c%20Transmission%20Cost%20Estimation%20Guide%20for%20MTEP22_Draft622733.pdf (accessed on 14 December 2024).
- U.S. Energy Information Administration (EIA). Electricity Demand and Growth Projections. Available online: https://search.usa.gov/search?utf8=%E2%9C%93&affiliate=eia.doe.gov&query=Electricity+Demand+and+Growth+Projections&search= (accessed on 14 December 2024).
- Sultan, V.; Aryal, A.; Chang, H.; Kral, J. Integration of EVs into the Smart Grid: A Systematic Literature Review. Energy Inform. 2022, 5, 65. [Google Scholar] [CrossRef]
- Sharma, S. A Comprehensive Review of Demand-Side Management in Smart Grid With Electric Vehicles. Electr. Eng. 2024, 106, 6495–6514. [Google Scholar]
- National Renewable Energy Laboratory. Electric Vehicles Play a Surprising Role in Supporting Grid Resiliency. NREL News. 2023. Available online: https://www.nrel.gov/news/program/2023/evs-play-surprising-role-in-supporting-grid-resiliency.html (accessed on 14 December 2024).


| Period | Wholesale Price | Retail Price | Average Profit | |
|---|---|---|---|---|
| Current Application | Daytime | USD cents 0.2–0.4/kWh | USD cents 10–15/kWh | USD cents 5–10/kWh |
| Peak | USD cents 5–15/kWh | USD cents 15–30/kWh | USD cents 10–15/kWh | |
| Night | USD cents 1.5–3/kWh | USD cents 8–12/kWh | USD cents 5–8/kWh | |
| RESS Application | Peak | - | USD cents 15–30/kWh | USD cents 20.25/kWh |
| Night | USD cents 1.5–3/kWh | - |
| Application Type | Economic Profit Rates of EPCs | Daily | 12 Years (4380 Days) |
|---|---|---|---|
| Normal Operations | The daily and 12-year amount a residential consumer pays to an EPC | USD 2.65 | USD 11.62 |
| The income that an EPC receives from a residential consumer on a daily basis and over a 12-year period | USD 1.47 | USD 6.46 | |
| RESS Operations | The income that an EPC receives from a residential consumer on a daily basis and over a 12-year period. | USD 2.39 | USD 10.46 |
| Total amount of extra income earned by an EPC daily and for 12 years | USD 10.46–USD 6.46 = USD 4006 (accepted as USD 4000) | ||
| RESS Components | Total Price (USD) | Explanation |
|---|---|---|
| LiFePO4 battery | 920 | for 13.11 kWh |
| Inverter/charger | 800 | for 5 kW |
| Other components: Switching system, cooling fans, necessary measuring components and displays, necessary metal parts and installation | 700 | |
| Total price (USD) | 2420 |
| Consumer Type | Number of Consumers |
|---|---|
| Residential area | 130 M |
| Commercial area | 22 M |
| Industrial area | 814,000 |
| Total number of consumers | 152.8 M |
| Generation Power (GW) | General (GW) | WECC (GW) | MRO (GW) | ERCOT (GW) | SERC (GW) | RF (GW) | NPCC (GW) |
|---|---|---|---|---|---|---|---|
| Daytime period | 670 | 150 | 95 | 80 | 120 | 140 | 85 |
| Peak period | 730 | 170 | 100 | 90 | 130 | 150 | 90 |
| Nighttime period | 590 | 110 | 90 | 75 | 110 | 130 | 75 |
| Consumption power (GW) | |||||||
| Daytime (Total): | 667.5 | ||||||
| Residential: | 260 | 57.5 | 37.5 | 32.5 | 47.5 | 52.5 | 32.5 |
| Commercial: | 240 | 57.5 | 32.5 | 27.5 | 42.5 | 47.5 | 32.5 |
| Industrial: | 167.5 | 35 | 27.5 | 22.5 | 27.5 | 37.5 | 17.5 |
| Peak period (Total): | 730 | ||||||
| Residential: | 290 | 60 | 40 | 40 | 55 | 60 | 35 |
| Commercial: | 270 | 55 | 35 | 35 | 50 | 55 | 35 |
| Industrial: | 170 | 40 | 27 | 22.5 | 30 | 40 | 17 |
| Nighttime (Total): | 440.2 | ||||||
| Residential: | 165.2 | 27.7 | 22.5 | 22.5 | 32.5 | 37.5 | 22.5 |
| Commercial: | 155 | 27.5 | 22.5 | 17.5 | 32.5 | 32.5 | 22.5 |
| Industrial: | 120 | 22.5 | 17.5 | 17.5 | 22.5 | 27.5 | 12.5 |
| Scenario | Cost Coverage Ratio for EPC (%) | Cost Coverage Ratio for Consumer (%) | External Sponsor | Increase Ratio at EPC Profit (%) | Discount Ratio at Consumer’s Bill (%) | |
|---|---|---|---|---|---|---|
| Contribution Ration (%) | Grant/Interest Ratio (%) | |||||
| 1 | 0 | 0 | 100 | 100 Grant | 60 | 13.78 |
| 2 | 0 | 0 | 100 | 50 Grant | 42.09 | 9.66 |
| 3 | 0 | 0 | 100 | 0 Grant | 24.17 | 5.55 |
| 4 | 0 | 0 | 100 | (−10) Interest | 20.59 | 4.72 |
| 5 | 20 | 60 | 40 | 0 | 22.56 | 8.88 |
| 6 | 25 | 25 | 50 | 50 | 33.13 | 7.60 |
| 7 | 100 | 0 | 0 | 0 | 40.29 | 0 |
| 8 | 70 | 30 | 0 | 0 | 30.62 | 3.33 |
| 9 | 0 | 100 | 0 | 0 | 8.05 | 11.1 |
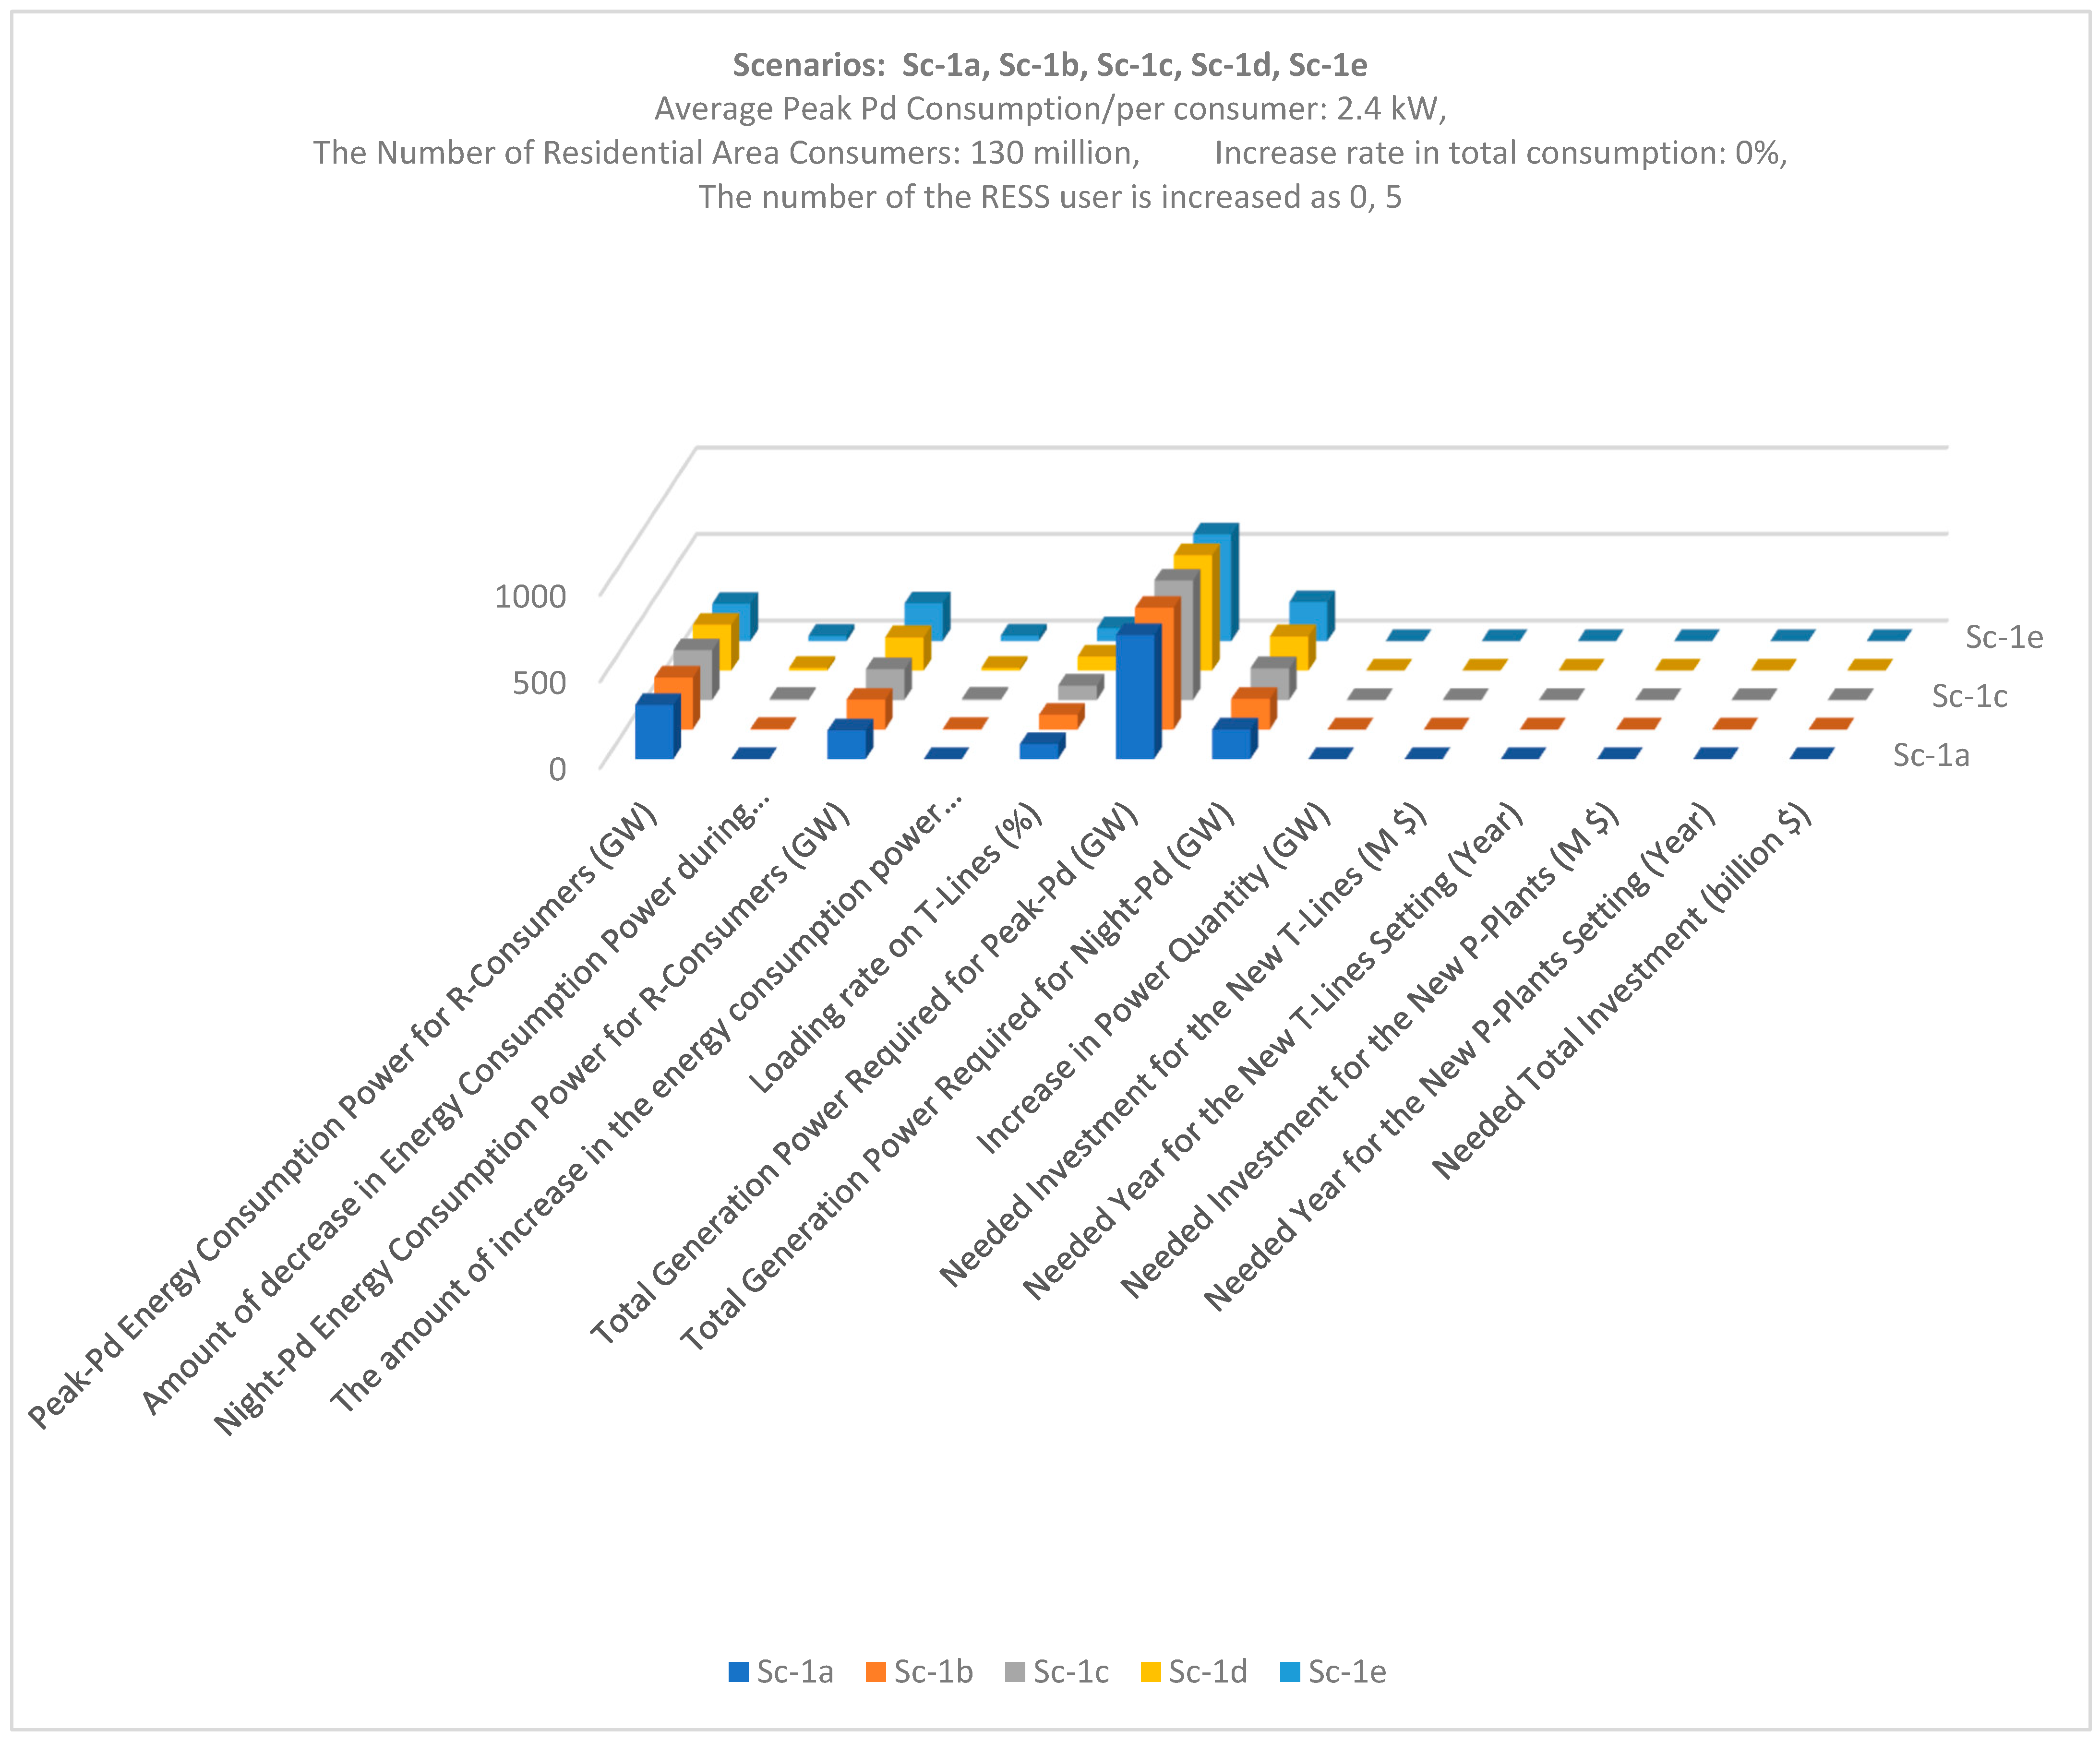
| Scenarios: Sc-1a, Sc-1b, Sc-1c, Sc-1d, Sc-1e Average peak period consumption/per consumer: 2.4 kW, number of residential area consumers: 130 M Increase rate in total consumption: 0%, number of RESS users is increased as follows: 0 M, 5 M, 10 M, 20 M, 40 M | |||||
| Power Values (GW) and Ratios (%) | Sc-1a | Sc-1b | Sc-1c | Sc-1d | Sc-1e |
| Peak period energy consumption power for residential consumers | 312.00 | 300.00 | 288.00 | 264.00 | 216.00 |
| Amount of decrease in energy consumption power during peak period for residential consumers (%) | 0.00 | 3.86 | 7.692 | 15.38 | 30.77 |
| Night period energy consumption power for residential consumers (GW) | 165.20 | 171.90 | 178.50 | 191.90 | 218.50 |
| Amount of increase in energy consumption power during the night period for residential consumers (%) | 0.00 | 4.04 | 8.07 | 16.14 | 32.28 |
| loading rate on energy lines (%) | 86.85 | 85.35 | 83.85 | 80.85 | 74.85 |
| Total generation power required for peak period (GW) | 715.60 | 703.30 | 690.90 | 666.20 | 616.8 |
| Total generation power required for night period (GW) | 170.20 | 177.00 | 183.90 | 197.60 | 225.10 |
| Increase in power quantity (GW) | 0.00 | 0.00 | 0.00 | 0.00 | 0.00 |
| Investment needed for new transmission lines (USD M) | 0.00 | 0.00 | 0.00 | 0.00 | 0.00 |
| Time required for the construction of new transmission lines (Years) | 0.00 | 0.00 | 0.00 | 0.00 | 0.00 |
| Investment needed for new power plants (USD M) | 0.00 | 0.00 | 0.00 | 0.00 | 0.00 |
| Time required for the construction of new power plants (Years) | 0.00 | 0.00 | 0.00 | 0.00 | 0.00 |
| Total investment needed (USD M) | 0.00 | 0.00 | 0.00 | 0.00 | 0.00 |
| Scenarios: Sc-2a, Sc-2b, Sc-2c, Sc-2d, Sc-2e Average peak period consumption/per consumer: 2.4 kW, number of residential area consumers: 130 M Increase rate in total consumption: 0%, The increase rate in total consumption is increased as follows: 0%, 5% 10%, 15%, 20% | |||||
| Power Values (GW) and Ratios (%) | Sc-2a | Sc-2b | Sc-2c | Sc-2d | Sc-2e |
| Peak period energy consumption power for residential consumers (GW) | 312.00 | 327.60 | 343.20 | 358.80 | 374.40 |
| Amount of decrease in energy consumption power during peak period for residential consumers (%) | 0.00 | 0.00 | 0.00 | 0.00 | 0.00 |
| Night period energy consumption power for residential consumers (GW) | 165.20 | 165.20 | 165.20 | 165.20 | 165.20 |
| Amount of increase in energy consumption power during the night period for residential consumers (%) | 0.00 | 0.00 | 0.00 | 0.00 | 0.00 |
| Loading rate on energy lines (%) | 86.85 | 91.19 | 95.53 | 99.88 | 104.20 |
| Total generation power required for peak period (GW) | 715.60 | 751.4 | 787.2 | 823 | 858.8 |
| Total generation power required for night period (GW) | 170.20 | 170.20 | 170.20 | 170.20 | 170.20 |
| Increase in power quantity (GW) | 0.00 | 0.00 | 27.21 | 62.99 | 98.77 |
| Investment needed for new transmission lines (USD B) | 0.00 | 0.00 | 8.16 | 18.90 | 29.63 |
| Needed per year for new transmission lines setting (Year) | 0.00 | 0.00 | 5.44 | 12.60 | 19.75 |
| Investment needed for new power plants (USD B) | 0.00 | 0.00 | 13.60 | 31.50 | 49.39 |
| Needed per year for new power plants setting (Year) | 0.00 | 0.00 | 2.72 | 6.30 | 9.88 |
| Total investment needed (USD B) | 0.00 | 0.00 | 21.77 | 50.39 | 79.02 |
| Scenarios: Sc-3a, Sc-3b, Sc-3c, Sc-3d, Sc-3e Average peak period consumtpion/per consumer: 2.4 kW, umber of residential area consumers: 130 M Increase rate in total consumption: 20%, number of RESS users is increased as follows: 0–5 M–10 M–20 M–40 M | |||||
| Power Values (GW) and Ratios (%) | Sc-3a | Sc-3b | Sc-3c | Sc-3d | Sc-3e |
| Peak period energy consumption power for residential consumers (GW) | 374.40 | 362.40 | 350.40 | 326.40 | 278.40 |
| Amount of decrease in energy consumption power during peak period for residential consumers (%) | 0.00 | 3.205 | 6.41 | 12.82 | 25.64 |
| Night period energy consumption power for residential consumers (GW) | 165.20 | 171.90 | 178.50 | 191.90 | 218.50 |
| Amount of increase in energy consumption power during the night period for residential consumers (%) | 0.00 | 4.04 | 8.07 | 16.14 | 32.28 |
| Loading rate on energy lines (%) | 104.20 | 102.70 | 101.20 | 98.22 | 92.22 |
| Total generation power required for peak period (GW) | 858.80 | 846.40 | 834.10 | 809.30 | 759.90 |
| Total generation power required for night period (GW) | 170.2 | 177.00 | 183.9 | 197.6 | 225.1 |
| Increase in power quantity (GW) | 98.77 | 86.41 | 74.05 | 49.33 | 0.00 |
| Investment needed for new transmission lines (USD B) | 29.63 | 25.92 | 22.22 | 14.80 | 0.00 |
| Needed per year for new transmission lines setting (Year) | 19.75 | 17.28 | 14.81 | 9.87 | 0.00 |
| Investment needed for new power plants (USD B) | 49.39 | 43.21 | 37.03 | 24.67 | 0.00 |
| Needed per year for new power plants setting (Year) | 9.88 | 6.64 | 7.41 | 4.93 | 0.00 |
| Total investment needed (USD Billion) | 79.02 | 69.13 | 59.24 | 39.47 | 0.00 |
Disclaimer/Publisher’s Note: The statements, opinions and data contained in all publications are solely those of the individual author(s) and contributor(s) and not of MDPI and/or the editor(s). MDPI and/or the editor(s) disclaim responsibility for any injury to people or property resulting from any ideas, methods, instructions or products referred to in the content. |
© 2025 by the author. Licensee MDPI, Basel, Switzerland. This article is an open access article distributed under the terms and conditions of the Creative Commons Attribution (CC BY) license (https://creativecommons.org/licenses/by/4.0/).
Share and Cite
Kiray, V. A Scenario-Based Simulation Study for Economic Viability and Widespread Impact Analysis of Consumption-Side Energy Storage Systems. Energies 2025, 18, 347. https://doi.org/10.3390/en18020347
Kiray V. A Scenario-Based Simulation Study for Economic Viability and Widespread Impact Analysis of Consumption-Side Energy Storage Systems. Energies. 2025; 18(2):347. https://doi.org/10.3390/en18020347
Chicago/Turabian StyleKiray, Vedat. 2025. "A Scenario-Based Simulation Study for Economic Viability and Widespread Impact Analysis of Consumption-Side Energy Storage Systems" Energies 18, no. 2: 347. https://doi.org/10.3390/en18020347
APA StyleKiray, V. (2025). A Scenario-Based Simulation Study for Economic Viability and Widespread Impact Analysis of Consumption-Side Energy Storage Systems. Energies, 18(2), 347. https://doi.org/10.3390/en18020347