3.1. Calm Water Resistance: Experiments
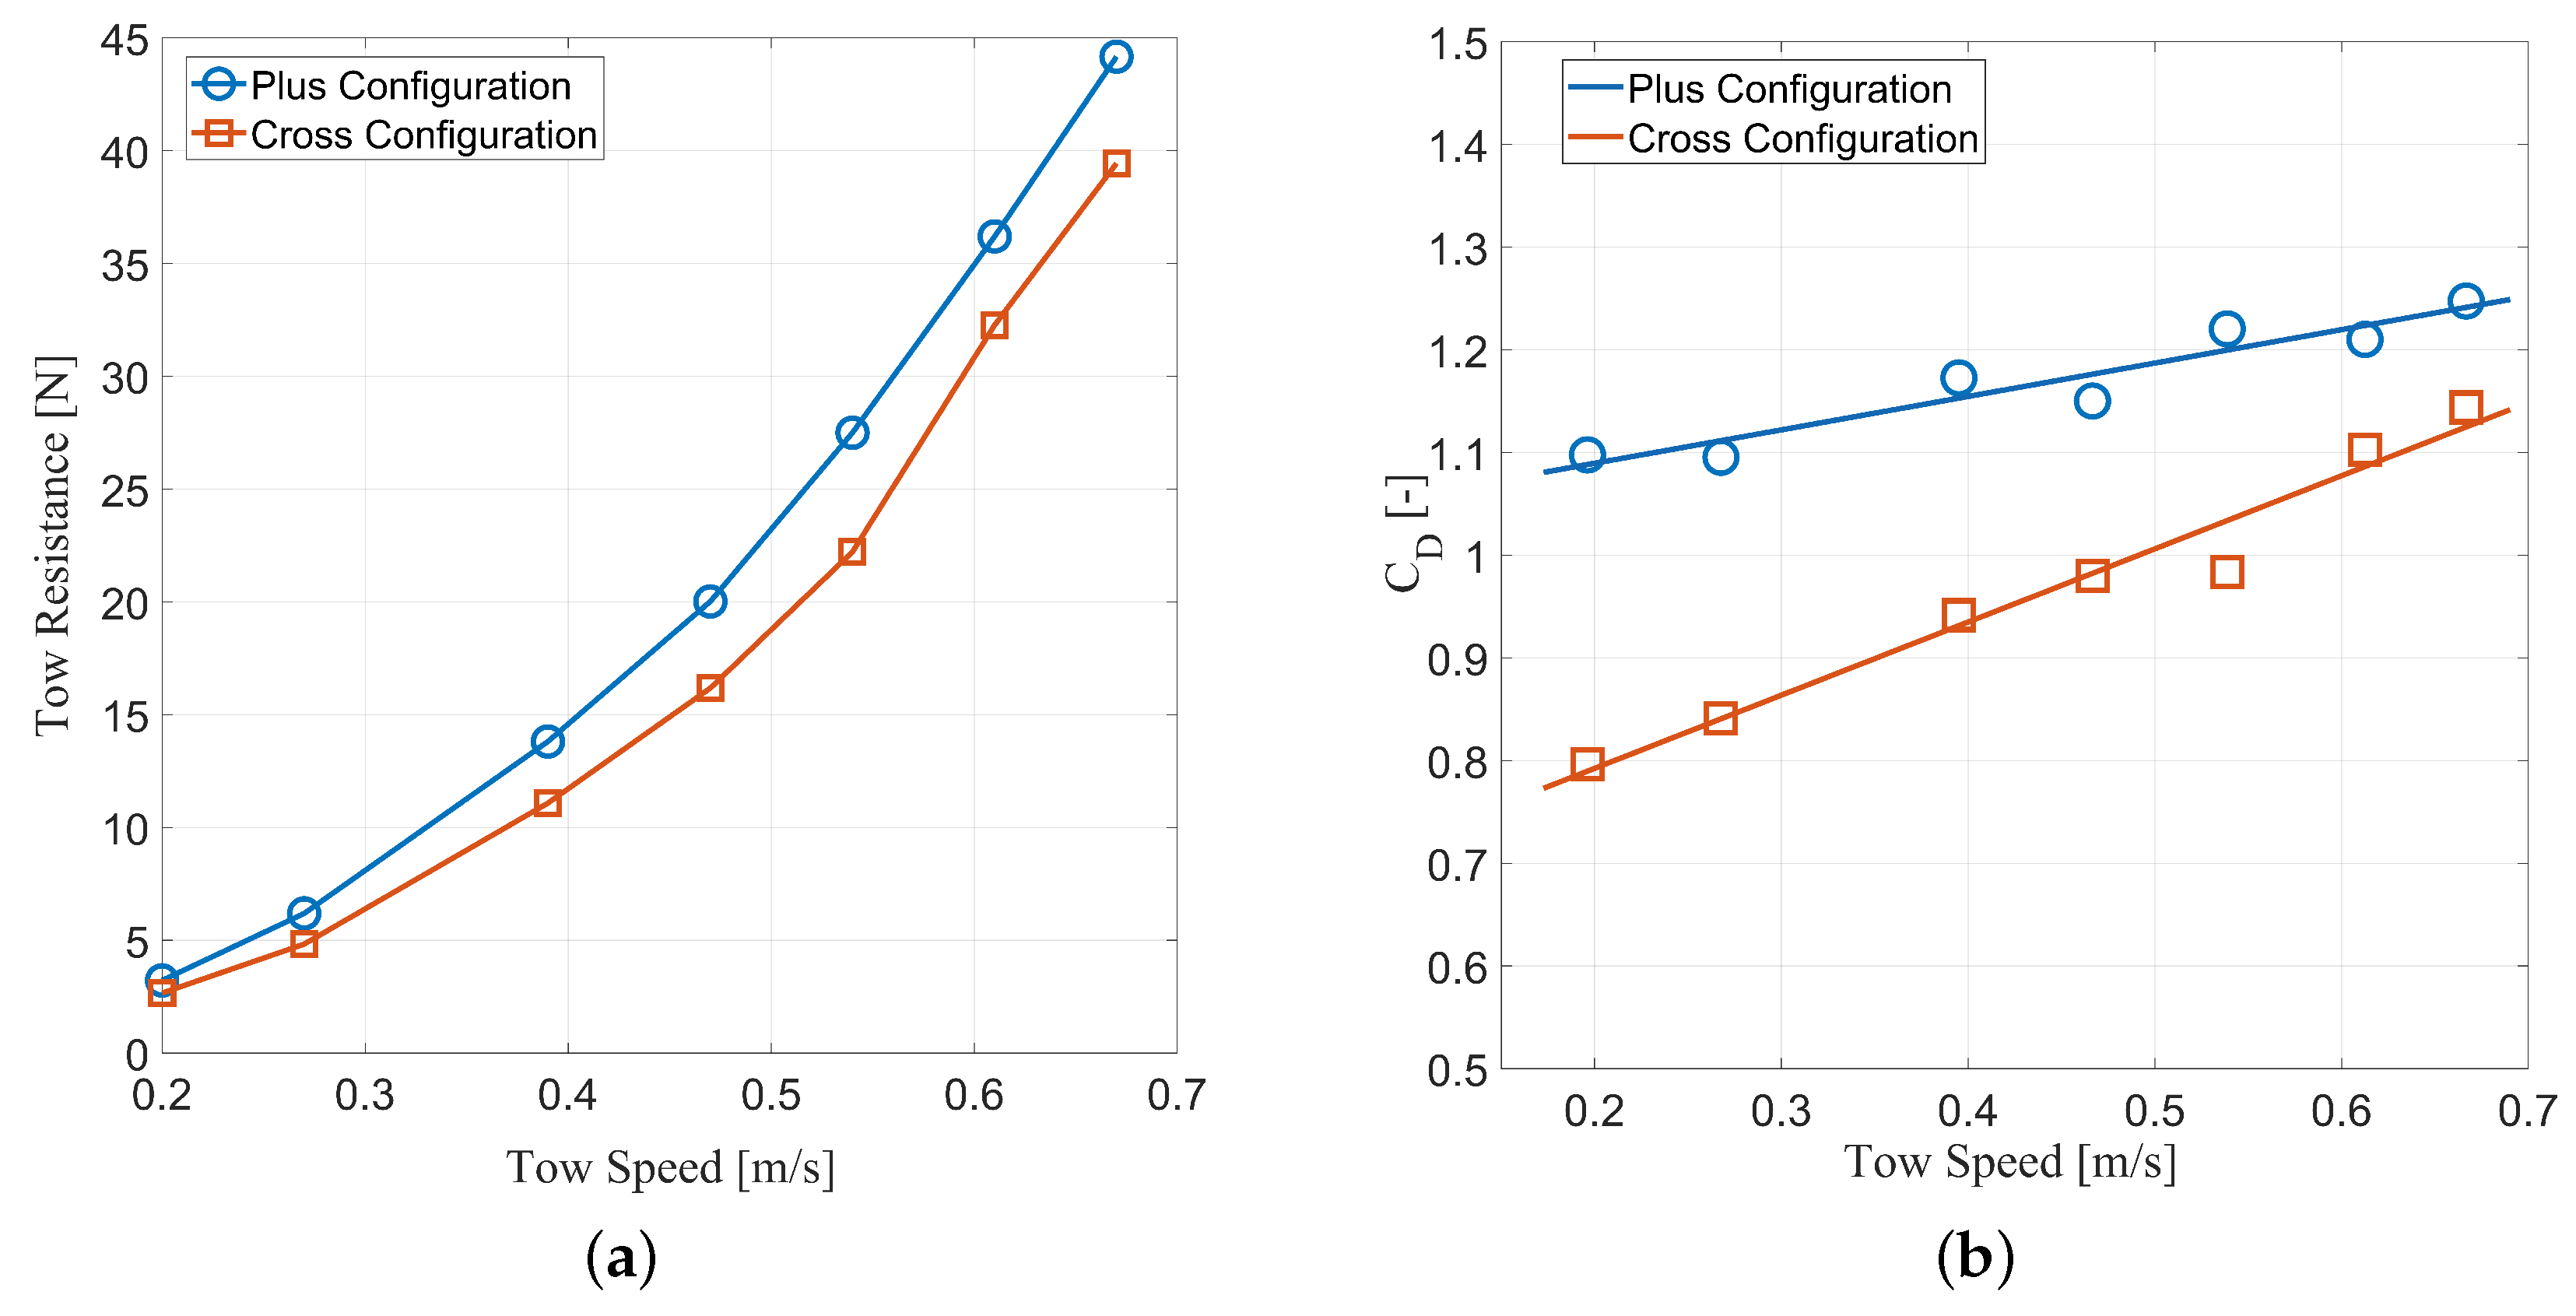
The calm water tow resistance of the FOWT at each tow speed was determined by averaging the measured towline tension for each run. The time series measurements for each run included areas of transient tow speeds at the start, when the model was accelerating up to speed, and at the end, when the model was slowing down. These areas were removed from the time series averaging to only capture areas at a steady tow speed. Each time series was visually inspected and manually trimmed to retain only the steady-state tow speed sections, identified as the regions where the velocity signal remained qualitatively constant. The tow resistances in both configurations are plotted at the range of tested tow speeds, as shown in
Figure 8a.
The drag coefficients of the FOWT at each tow speed were calculated using the average tow resistances. The drag equation was used to calculate the drag coefficients in both configurations using the same reference area, tow speed, and water density. The drag coefficients in both configurations are plotted at the range of tested tow speeds in
Figure 8b.
The tow resistance tests revealed that the plus configuration exhibited an average of 20% greater tow resistance than the plus configuration across the tow speeds. Consequently, the calculated drag coefficients were greater for the plus configuration. The cross configuration exhibited smaller tow resistances and drag coefficients for all tow speeds. These differences indicate that the orientation of the cruciform shape played a significant role in the drag behavior of the two configurations.
The drag coefficient values calculated for both configurations revealed an interesting trend related to the tow speed. For both configurations, the experimental drag coefficients exhibit a positive trend with increasing tow speed. The plus configuration drag coefficient increased from about 1.10 to 1.25 as the tow speed increased. The cross configuration’s drag coefficient range was found to be 0.80 to 1.15.
Similar behavior was exhibited in the towing tests performed by Mas-Soler et al. [
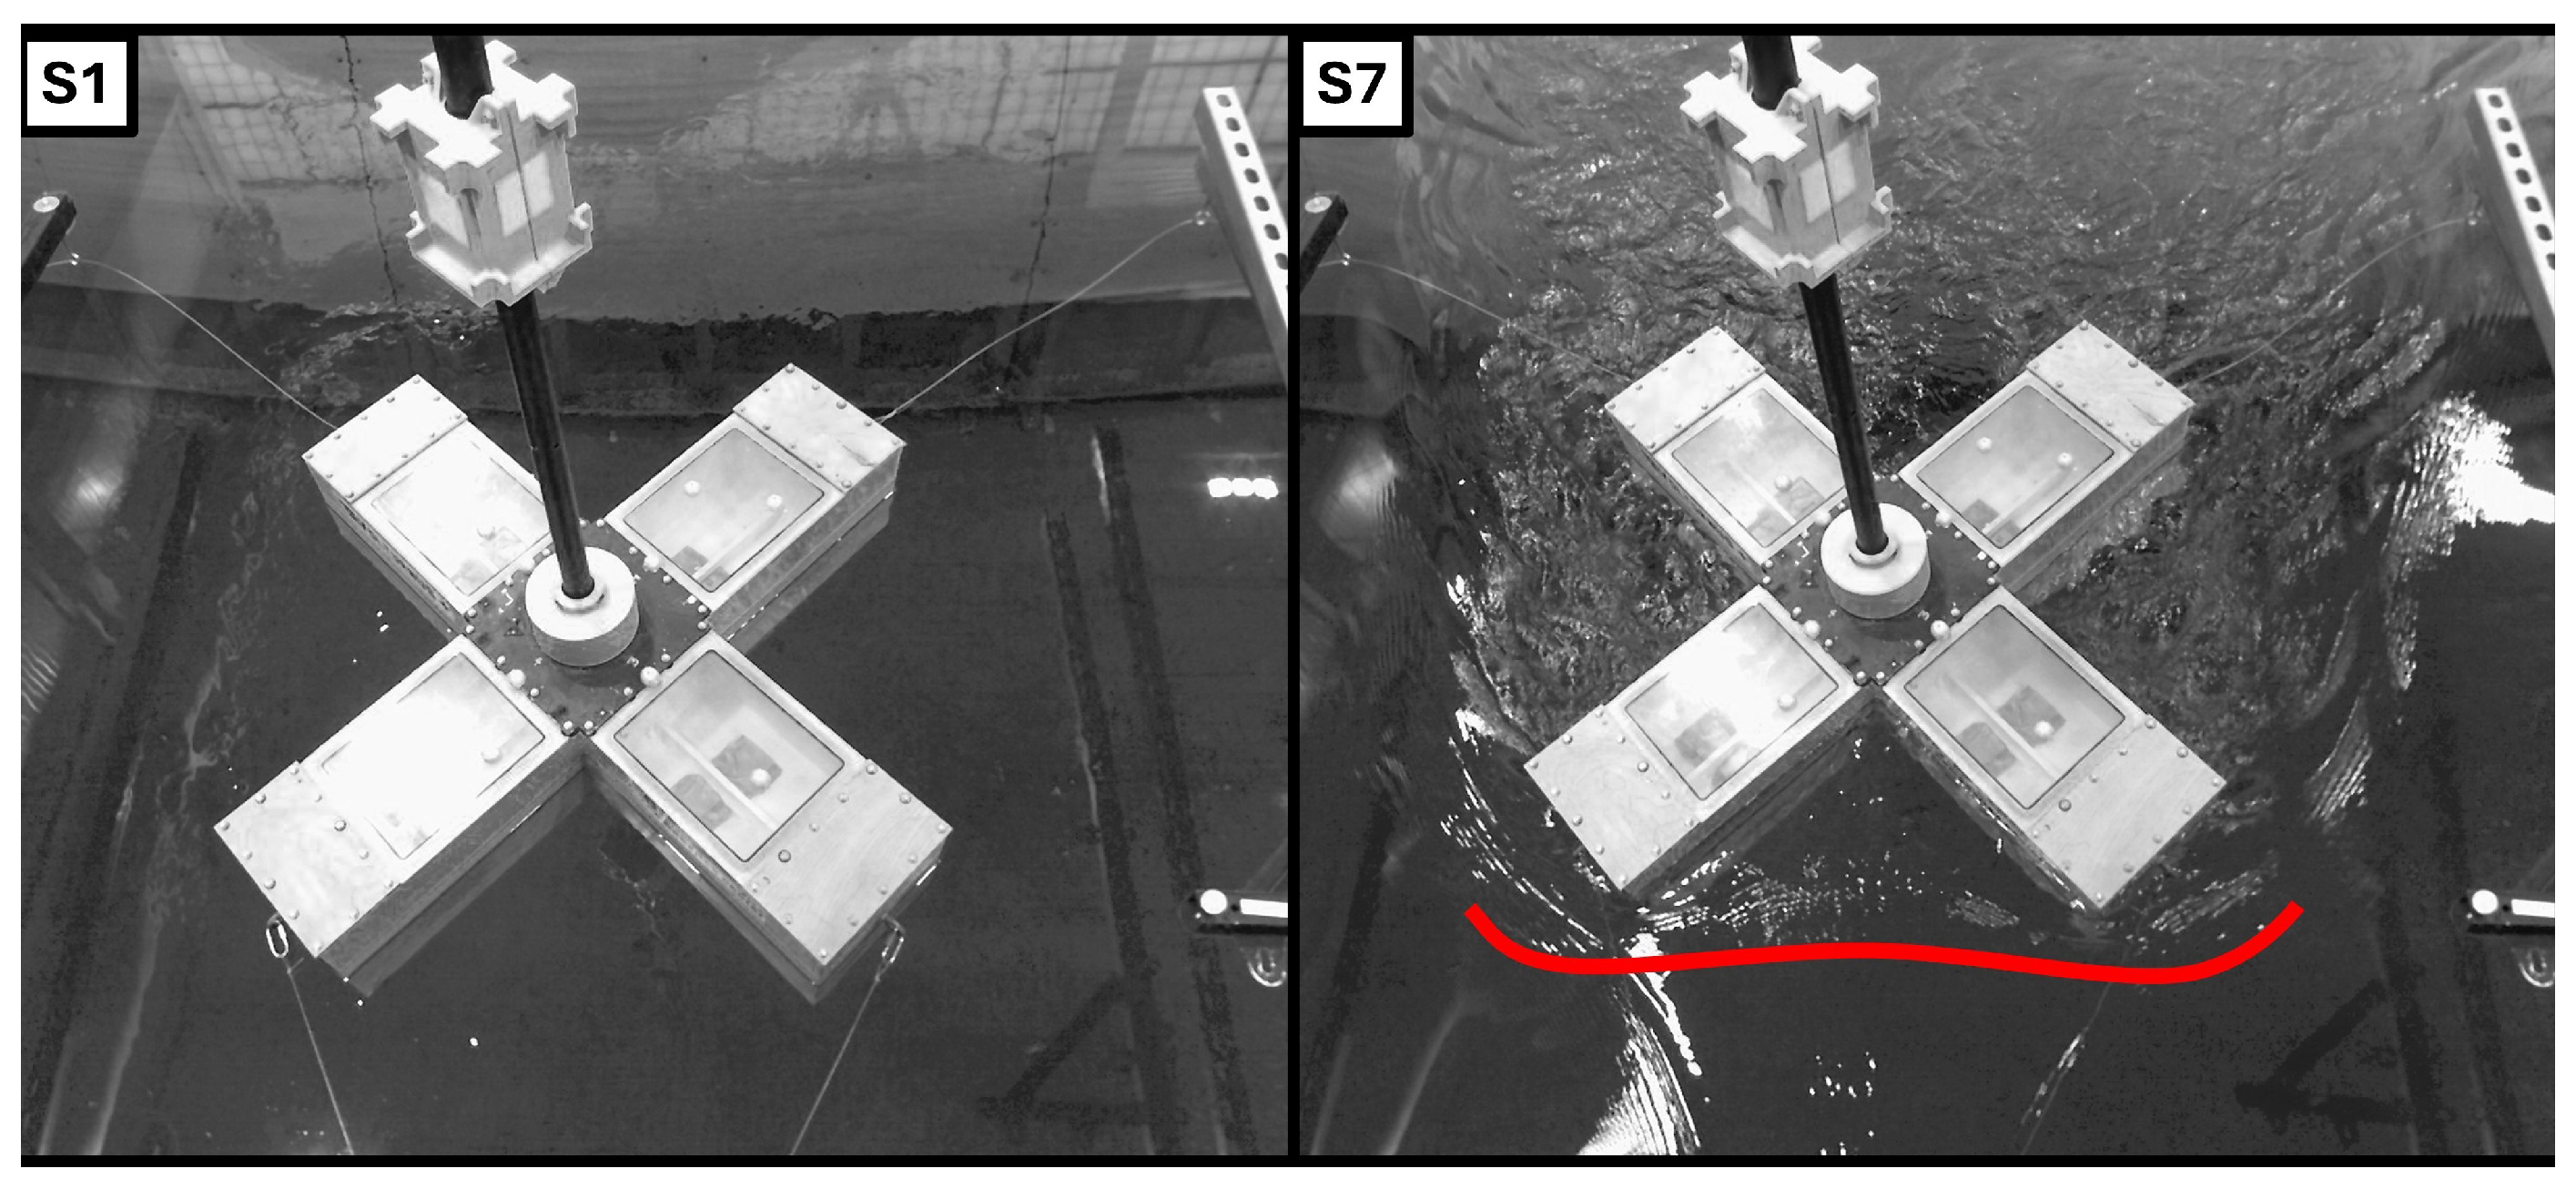
9] where a bow wave was observed to form during the towing tests, resulting in an additional contribution to the resistance at greater tow speeds. The increase in calculated drag coefficient as the tow speed increases may be explained by the formation of a bow wave in front of the FOWT, resulting in an additional contribution to the tow resistance. A visualization of the bow wave formation in the
cross configuration is shown in
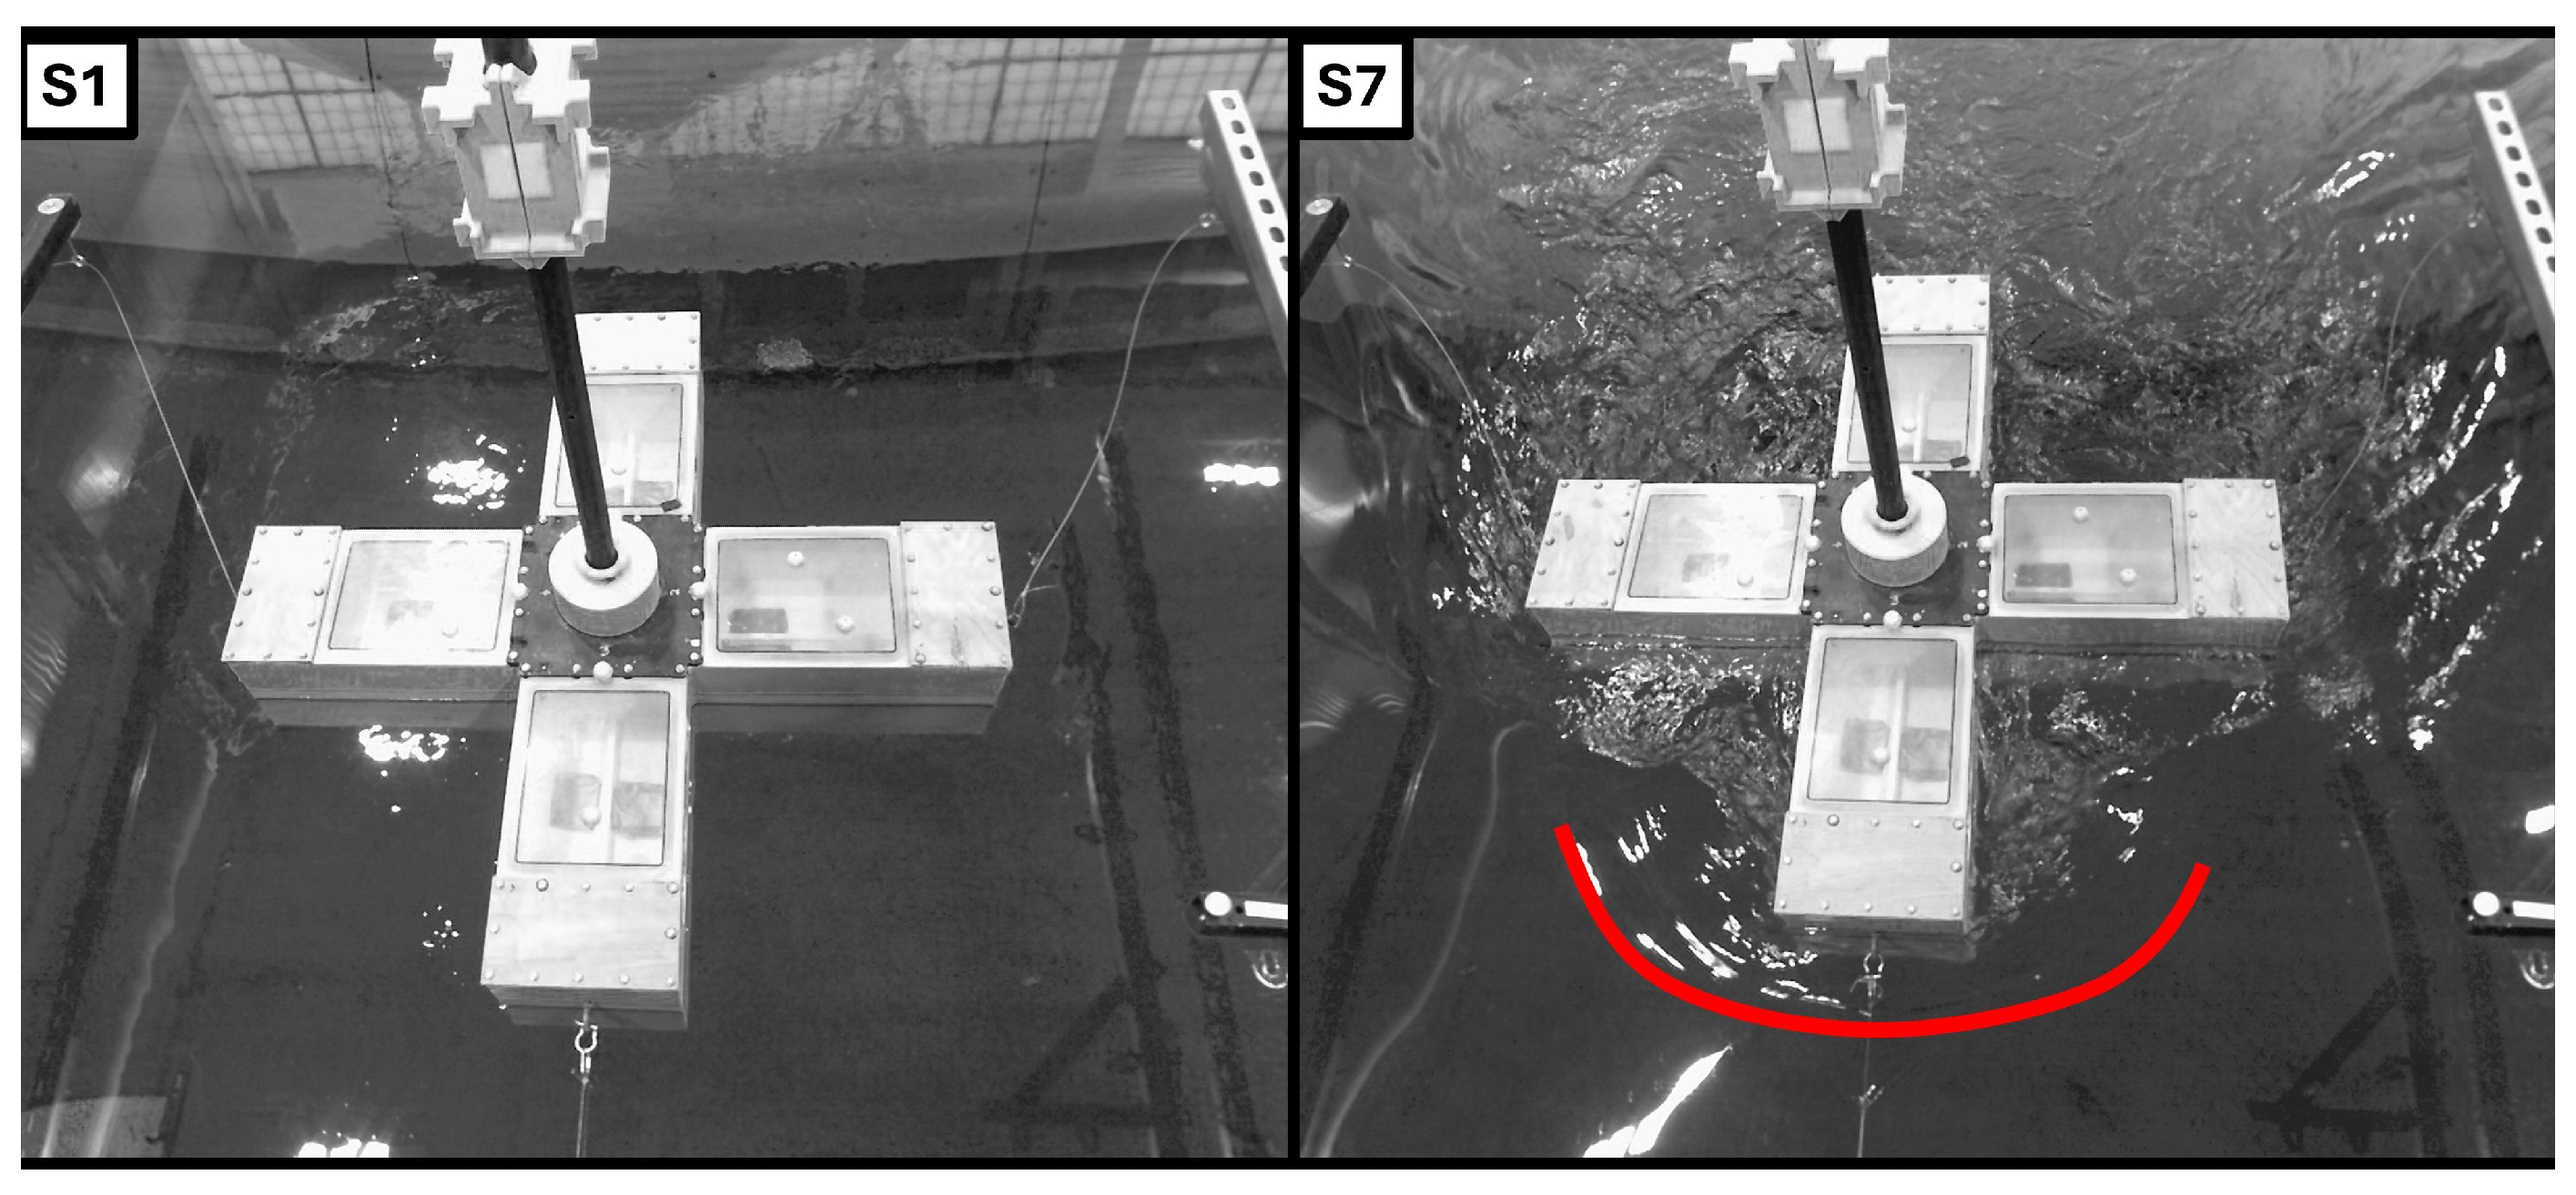
Figure 9. For comparison, the
plus configuration appeared to produce a smaller bow wave with less impact on the model, as shown in
Figure 10. The larger range of the drag coefficients in the
cross configuration may be explained by the different geometry representing the “bow” of the FOWT, meaning that in this orientation of the shape, the bow wave has a greater effect on the tow resistance.
3.2. Calm Water Motions
The calm water pitch motion responses for the
plus and
cross configurations are shown in
Figure 11a,b, respectively. The maximum, mean, and minimum pitch angles are exhibited for each tow speed. The maximum, mean, and minimum values represent the average of the parameters across all the trials at each tow speed. A positive pitch angle represents an angle towards the front of the structure where the towline is connected.
In both configurations, the average pitch angle increased as the tow speed increased. This is expected due to the hydrodynamic force acting on the model increasing with tow speed, resulting in a greater moment on the structure, which induces a greater pitch angle. The
cross configuration exhibited a greater average pitch angle for all tow speeds. This may be explained by the effects due to the collection of water between the legs of the model, as the formation of a larger and more focused bow wave in the
cross configuration may induce a greater pitch angle on the structure. The collection of water at the bow of the
cross configuration can be observed between the model and the red line in
Figure 9.
The cross configuration has smaller magnitude pitch deviations to the maximum and minimum until the fastest two tow speeds. For the cross configuration, the trend of the maximum pitch angle continually moves further from the mean with the increased tow speed, while in the plus configuration, the maximum pitch angle appears to converge to a relatively constant offset from the mean, even decreasing between the last two tow speeds.
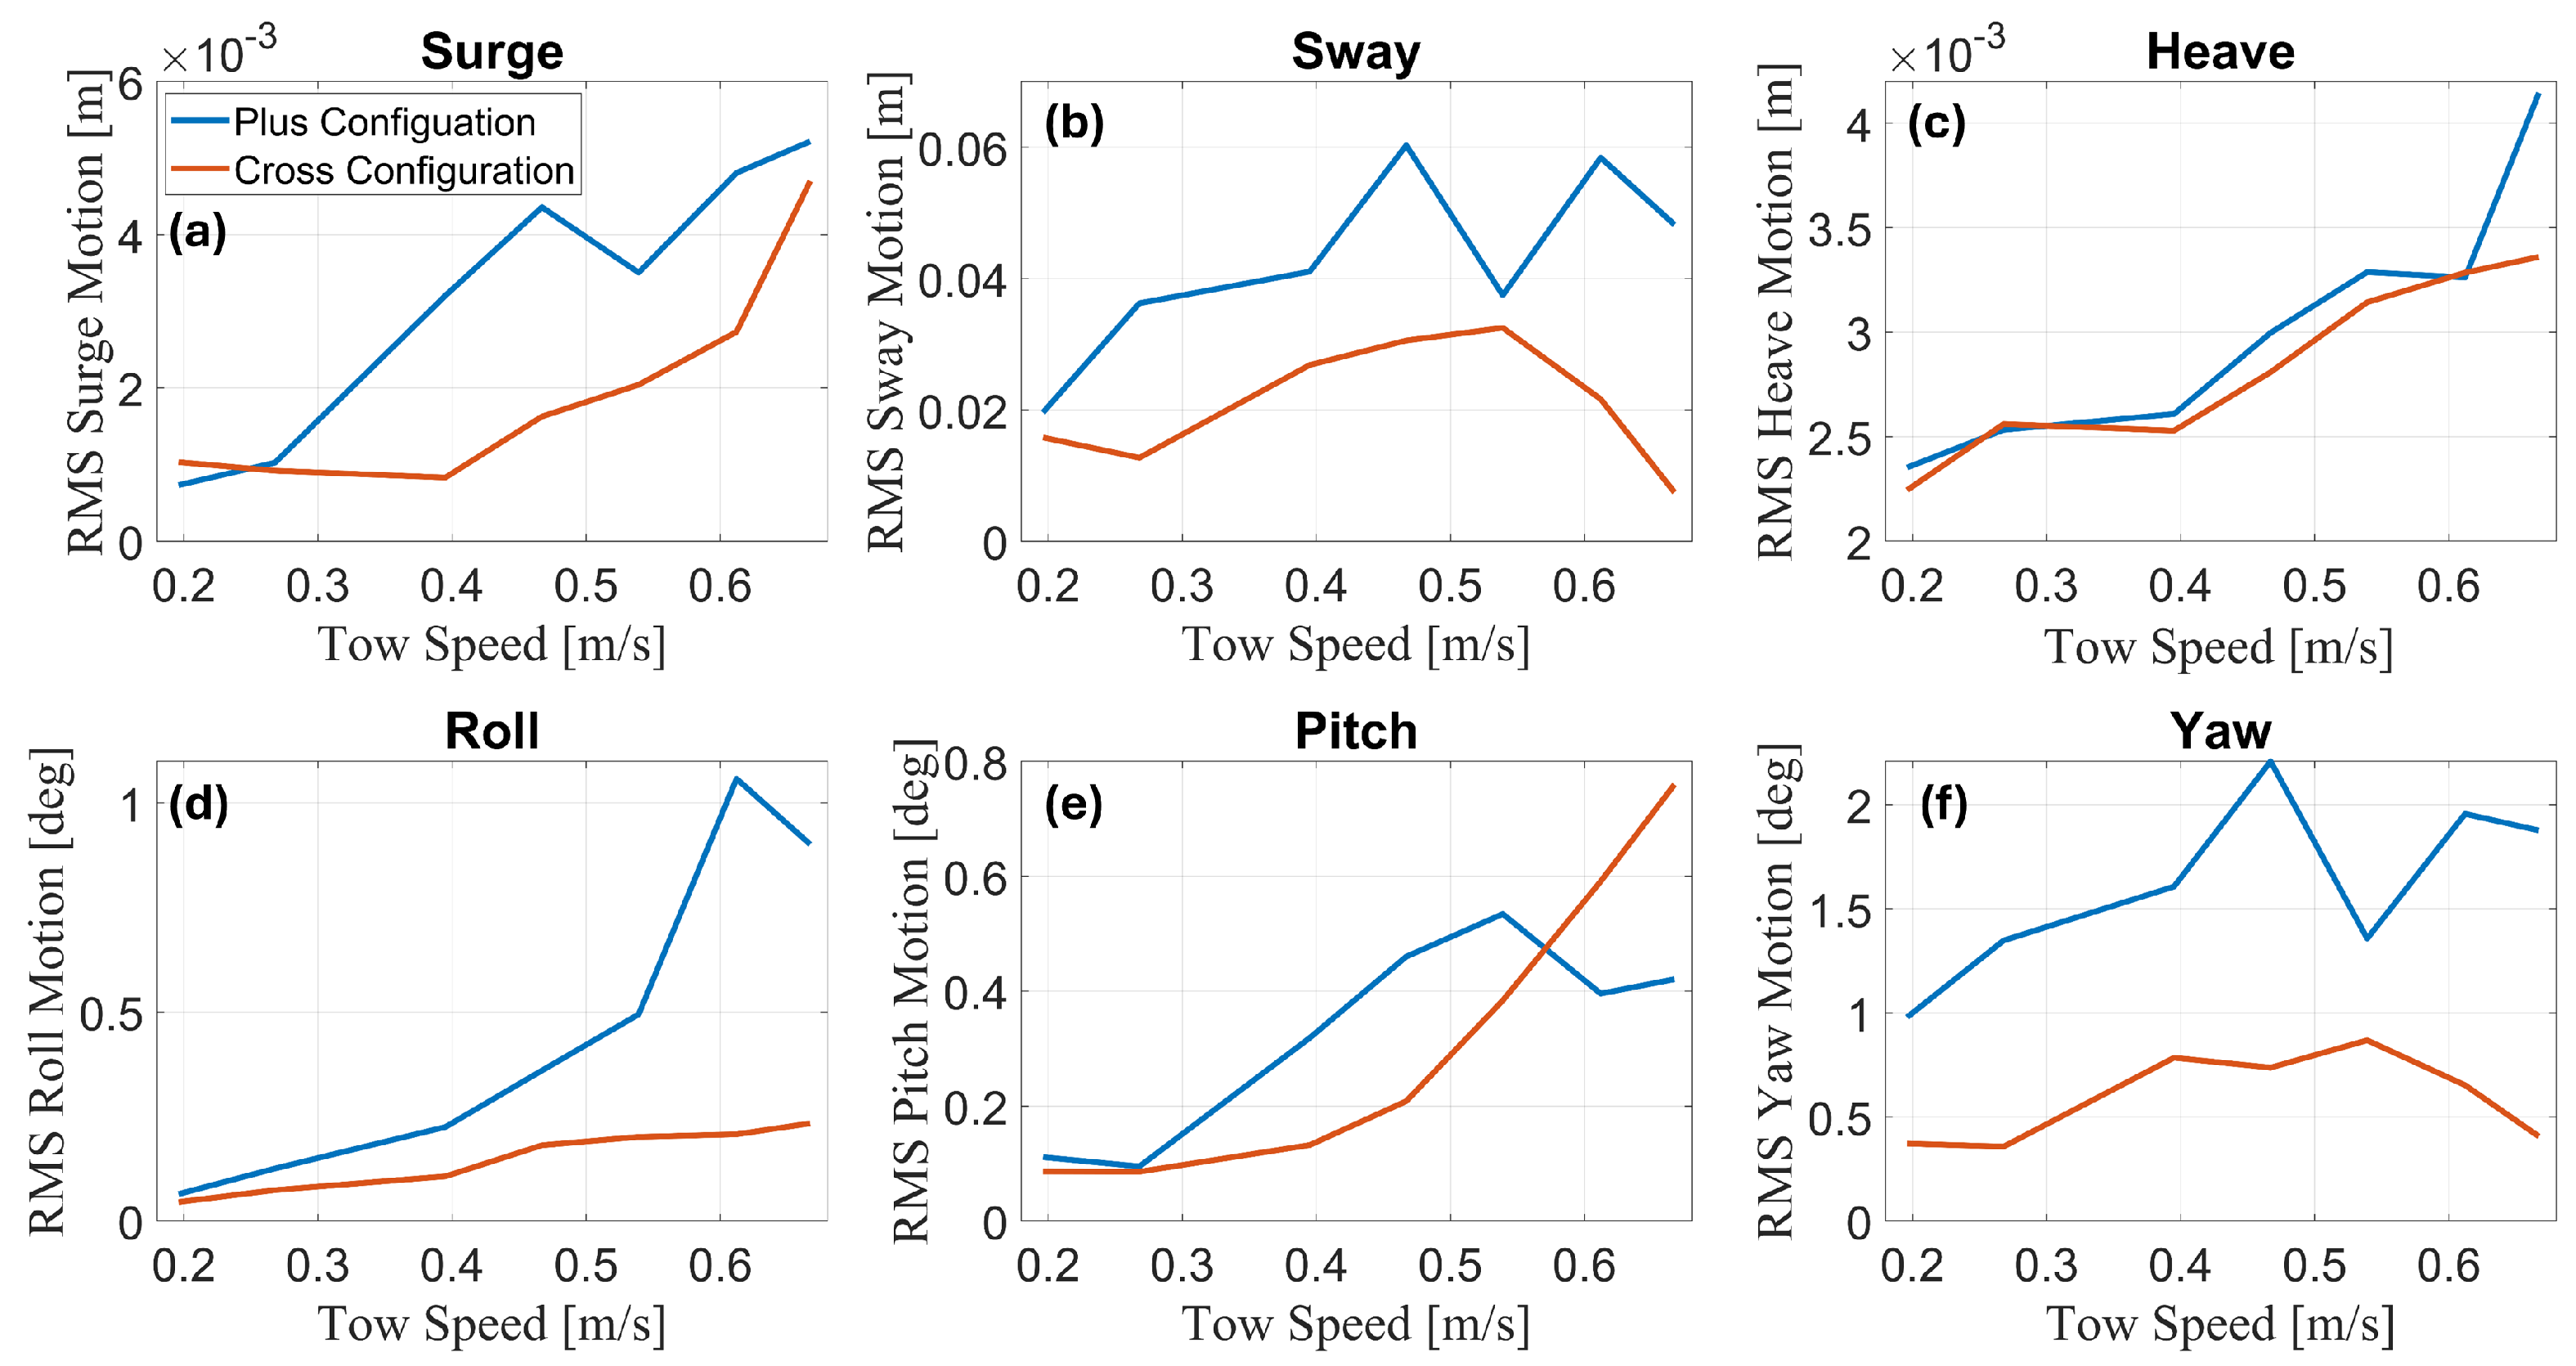
To compare the platform motions across different sea conditions and towing configurations, the root mean square (RMS) of the motion time series was used. The RMS provides a representative value for the amplitude of the motions that can easily be used for comparison. Each time series was mean-subtracted to isolate the fluctuating components, and the RMS of these deviations was calculated. As a result, only oscillatory behavior is captured in the RMS values, and steady offsets, such as a mean pitch angle, are not captured in the comparison. The calm water RMS motion responses are shown in
Figure 12. For all degrees of freedom, the values shown represent the RMS of the deviating components of the motion data.
The RMS surge motions in calm water are small for both configurations, as shown in
Figure 12a, only reaching a maximum of 5 mm at the fastest tow speed. The
plus configuration consistently had slightly higher RMS motions, but the difference was only 2 mm at most.
Figure 12c shows that the heave motions were small and of similar magnitudes for both configurations, although the
plus configuration had a slightly higher RMS heave at the largest tow speed.
The sway motion of the
plus configuration was larger than that of the
cross configuration at all tow speeds, as seen in
Figure 12b. The inclusion of the towline bridle lines in the
cross configuration may contribute to the reduced sway motions. The sway motion observed during the tow trials had long periods, some of which may not have been fully resolved periods due to the size constraints of the basin. Ramachandran et al. [
14] observed that during the calm water towing tests, oscillatory motion induced by the flow was observed. In their study, the towing configuration with a bridle exhibited reduced FIM. This is the same trend that is observed in this study and indicates that the increased sway motion may be FIM. A more detailed comparison of individual sway time series is given in the following section involving CFD.
The yaw motion of the
plus configuration was consistently much larger than the motion in the
cross configuration at all tow speeds, as seen in
Figure 12f. The reduced yaw motion in the
cross configuration is clearly seen in the experimental data, where the
cross had a 0.5–1.0° reduction in sway motion when compared to the
plus. Any difference due to the orientation of the FOWT shape on the yaw motion would require further testing with identical towline setups for both orientations. In the tow test conducted by Yin et al. [
21], the roll and yaw motions were also observed to be much smaller in the configuration with a towline bridle, indicating that the bridle contributes to increased rotational stiffness, stabilizing the motions in these degrees of freedom. The sway and yaw motions were also observed to be coupled in their study, which is consistent with the sway and yaw trends observed in this study.
Figure 12d shows the RMS roll motions of the model. In the
plus configuration, the roll angles increased significantly with increased tow speed, reaching a larger RMS value than the
cross configuration at all tow speeds. While the towline differences should not directly affect the roll stiffness in the two configurations, the increased motions in other degrees of freedom and other hydrodynamic effects may result in the larger roll angles for the
plus configuration. The
cross configuration remained stable for all tow speeds, with the largest RMS roll angle reaching about 0.25°.
Following the analysis of the maximum, mean, and minimum pitch angles in both configurations, the RMS motions reveal more insight into the pitch behavior of the FOWT. The RMS pitch motions, as shown in
Figure 12e, are similar at the lowest tow speeds, and as tow speed increases, the pitch motion of the
plus becomes larger than the
cross. The RMS pitch motion for the
plus reaches a maximum of 0.5° at a tow speed of 0.54 m/s and then decreases for the next two tow speeds. The
cross RMS pitch motion continues to increase as the tow speed increases, eventually exceeding the
plus.
3.3. Calm Water CFD Comparison
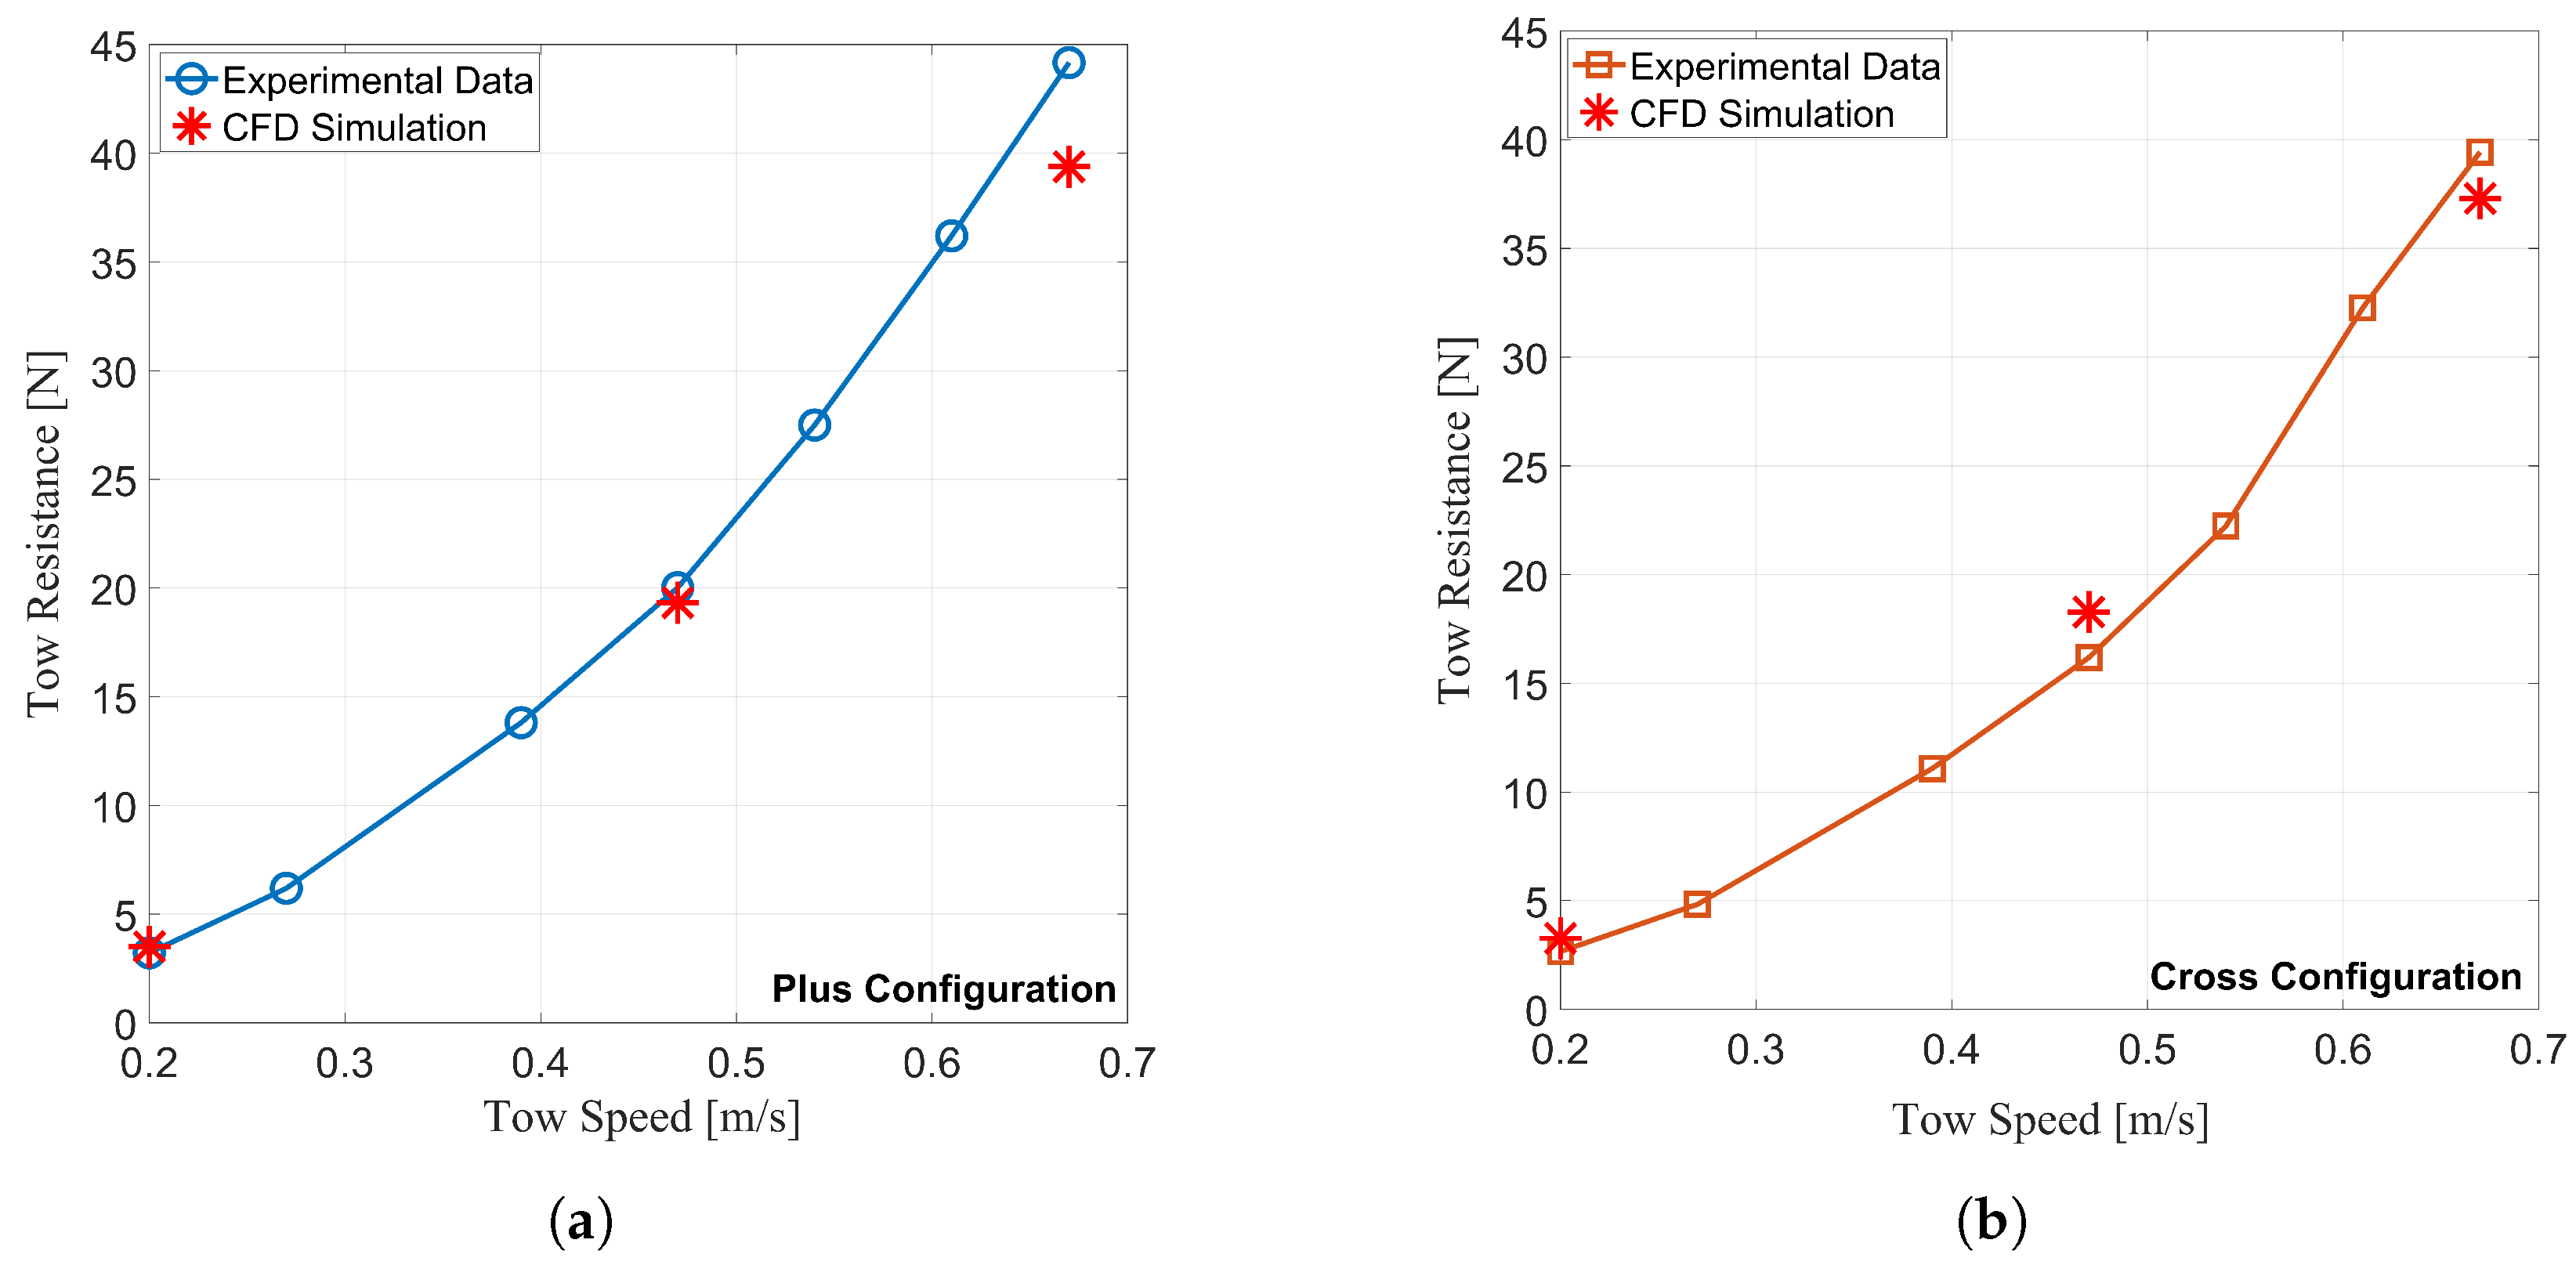
The experimental tow resistances for the
plus and
cross configurations are shown in
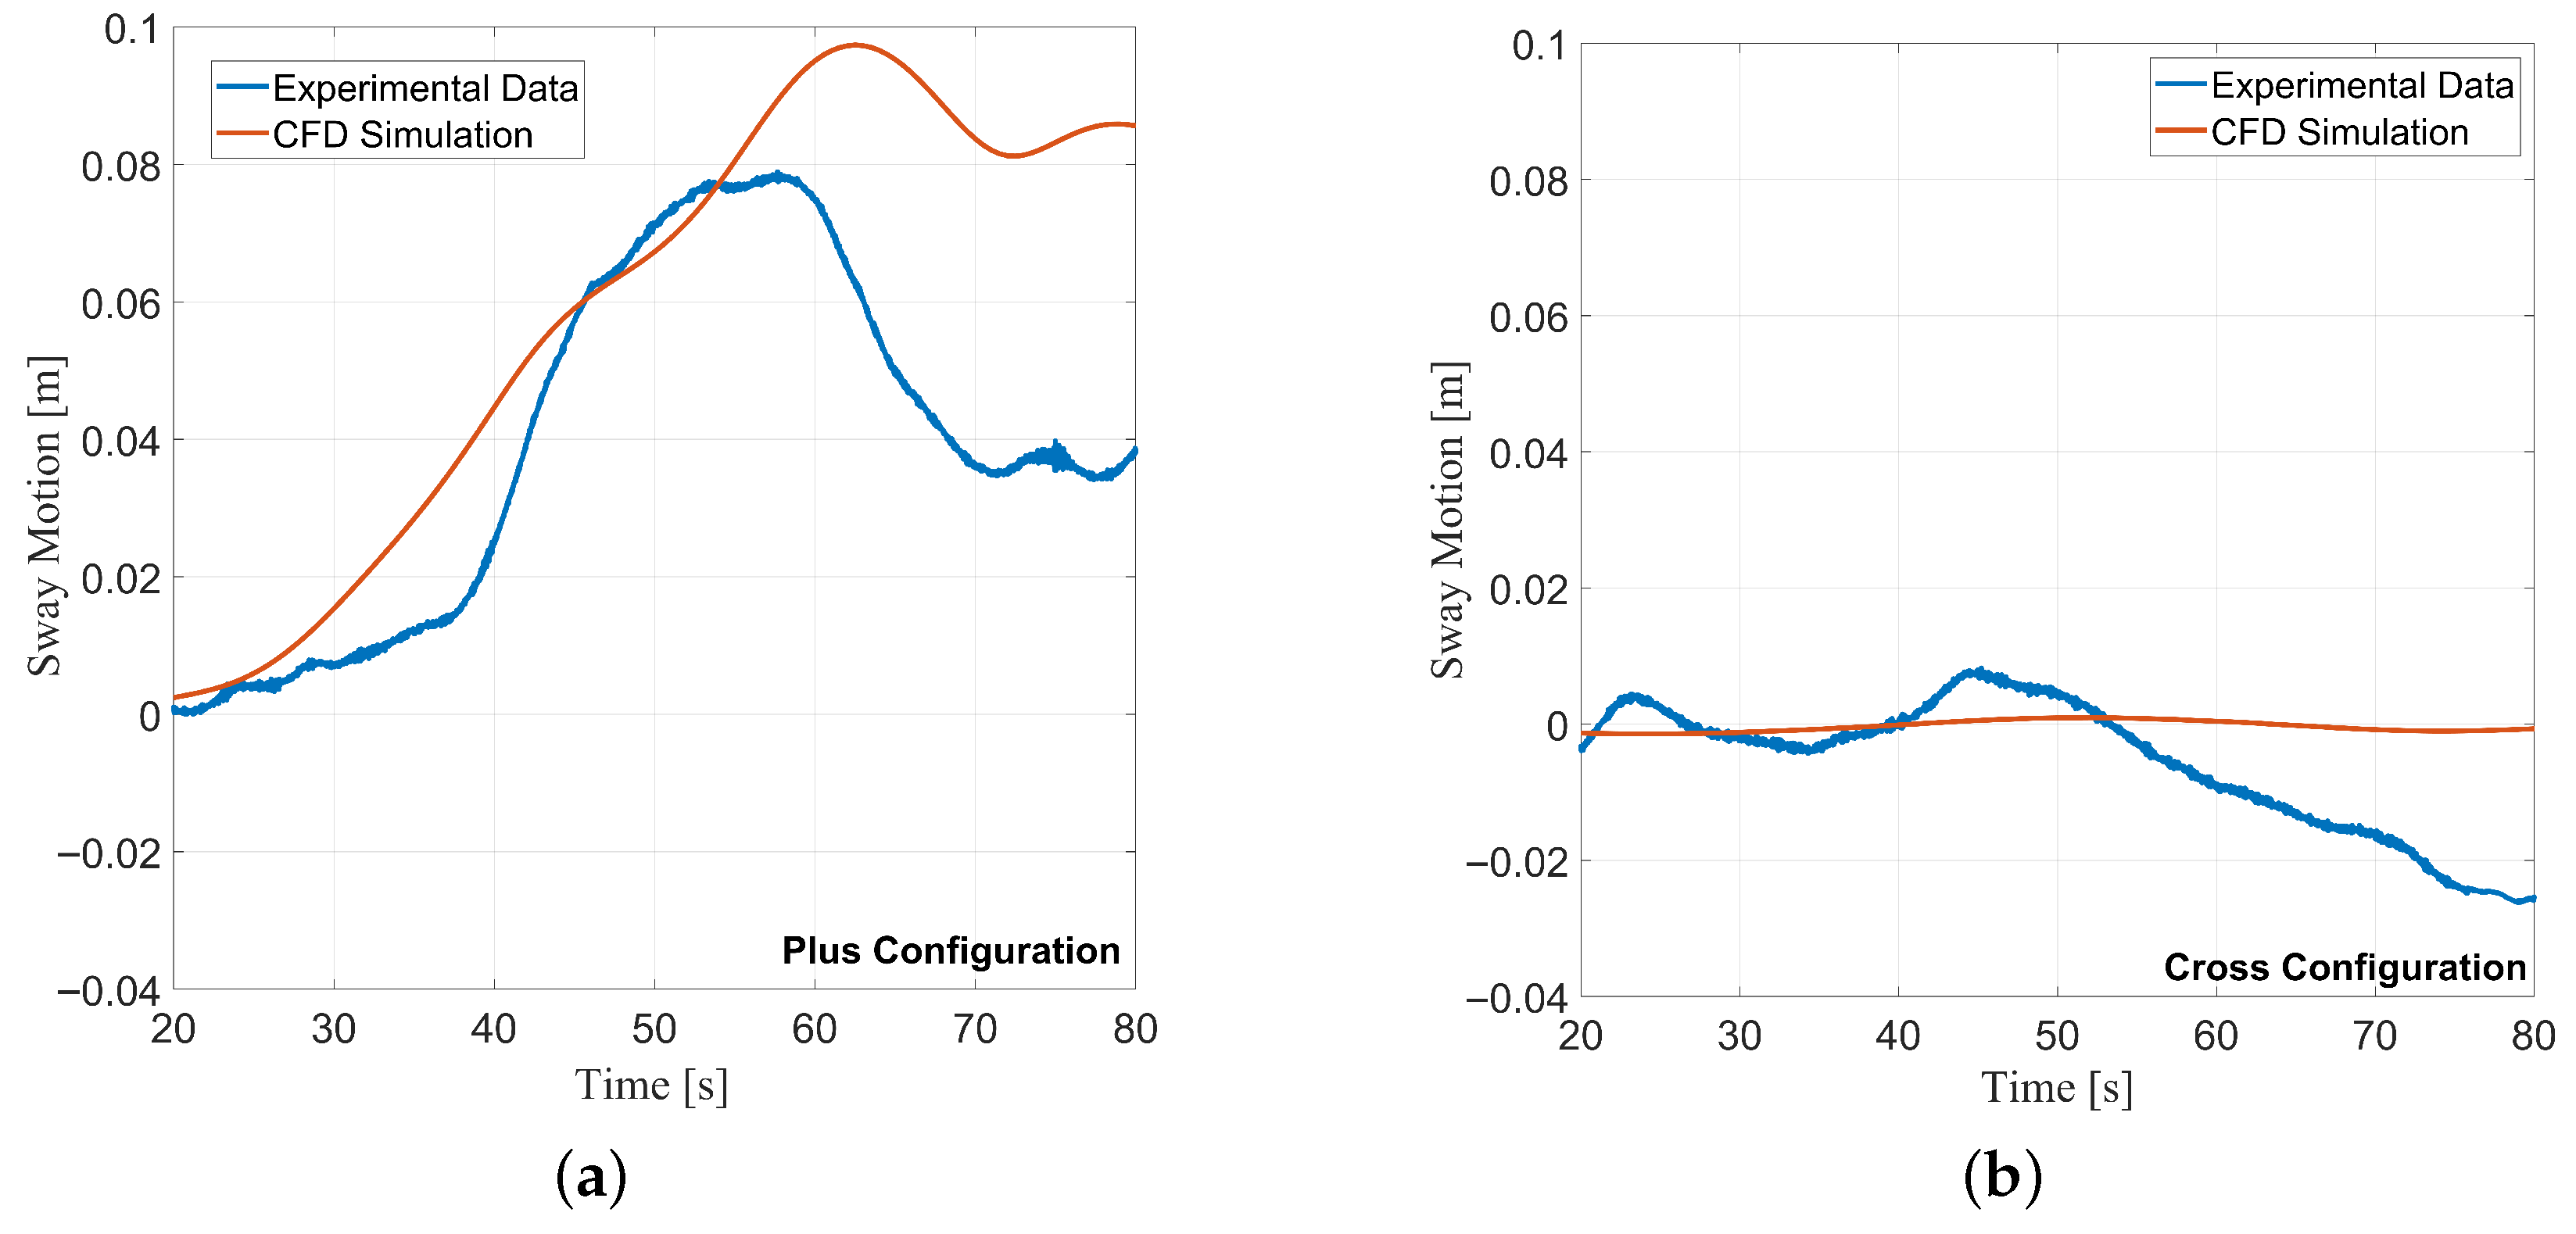
Figure 13a,b, respectively, with three points representing tow speeds at which CFD simulations were conducted. The tow resistance value from the CFD tests is determined by the calculated force on the CFD body in the flow direction (x-direction).
The CFD showed good agreement with the experimental tests for both configurations, within the limitations of the modeling approach without a free surface. In both configurations, the CFD simulation over-predicted the tow resistance at the lowest tow speed and under-predicted the resistance at the highest tow speed. The trend shown by the differences between the experimental and CFD resistance values may support the claim that the formation of a bow wave is contributing to larger tow resistances at higher tow speeds. The formation of a bow wave cannot occur in the CFD model used for this study, as there is no free surface modeling, so any added resistance due to this phenomenon would not be captured.
During the experimental testing of the
plus configuration, large sway motions were observed at multiple tow speeds. The structure would begin moving in sway and continually drift in the same direction, resulting in large sway offsets. The sway motion was of low frequency, with the sway motion appearing as drifting motion rather than oscillations, but this could be attributed to the limited towing distance during the tests. The same behavior was not observed during the
cross configuration trials. The magnitudes of sway offsets were significantly smaller and were not visually noticeable. The time series data showed that the sway motion in the
cross configuration was small and oscillatory rather than the large drifting motion observed in the
plus configuration. Increased sway motions can lead to greater towing resistance, as described by Yin et al. in their experiments [
21]. Large sway offsets can also lead to side-loading on the towline attachment points, leading to structural damage and unsafe motions during towing.
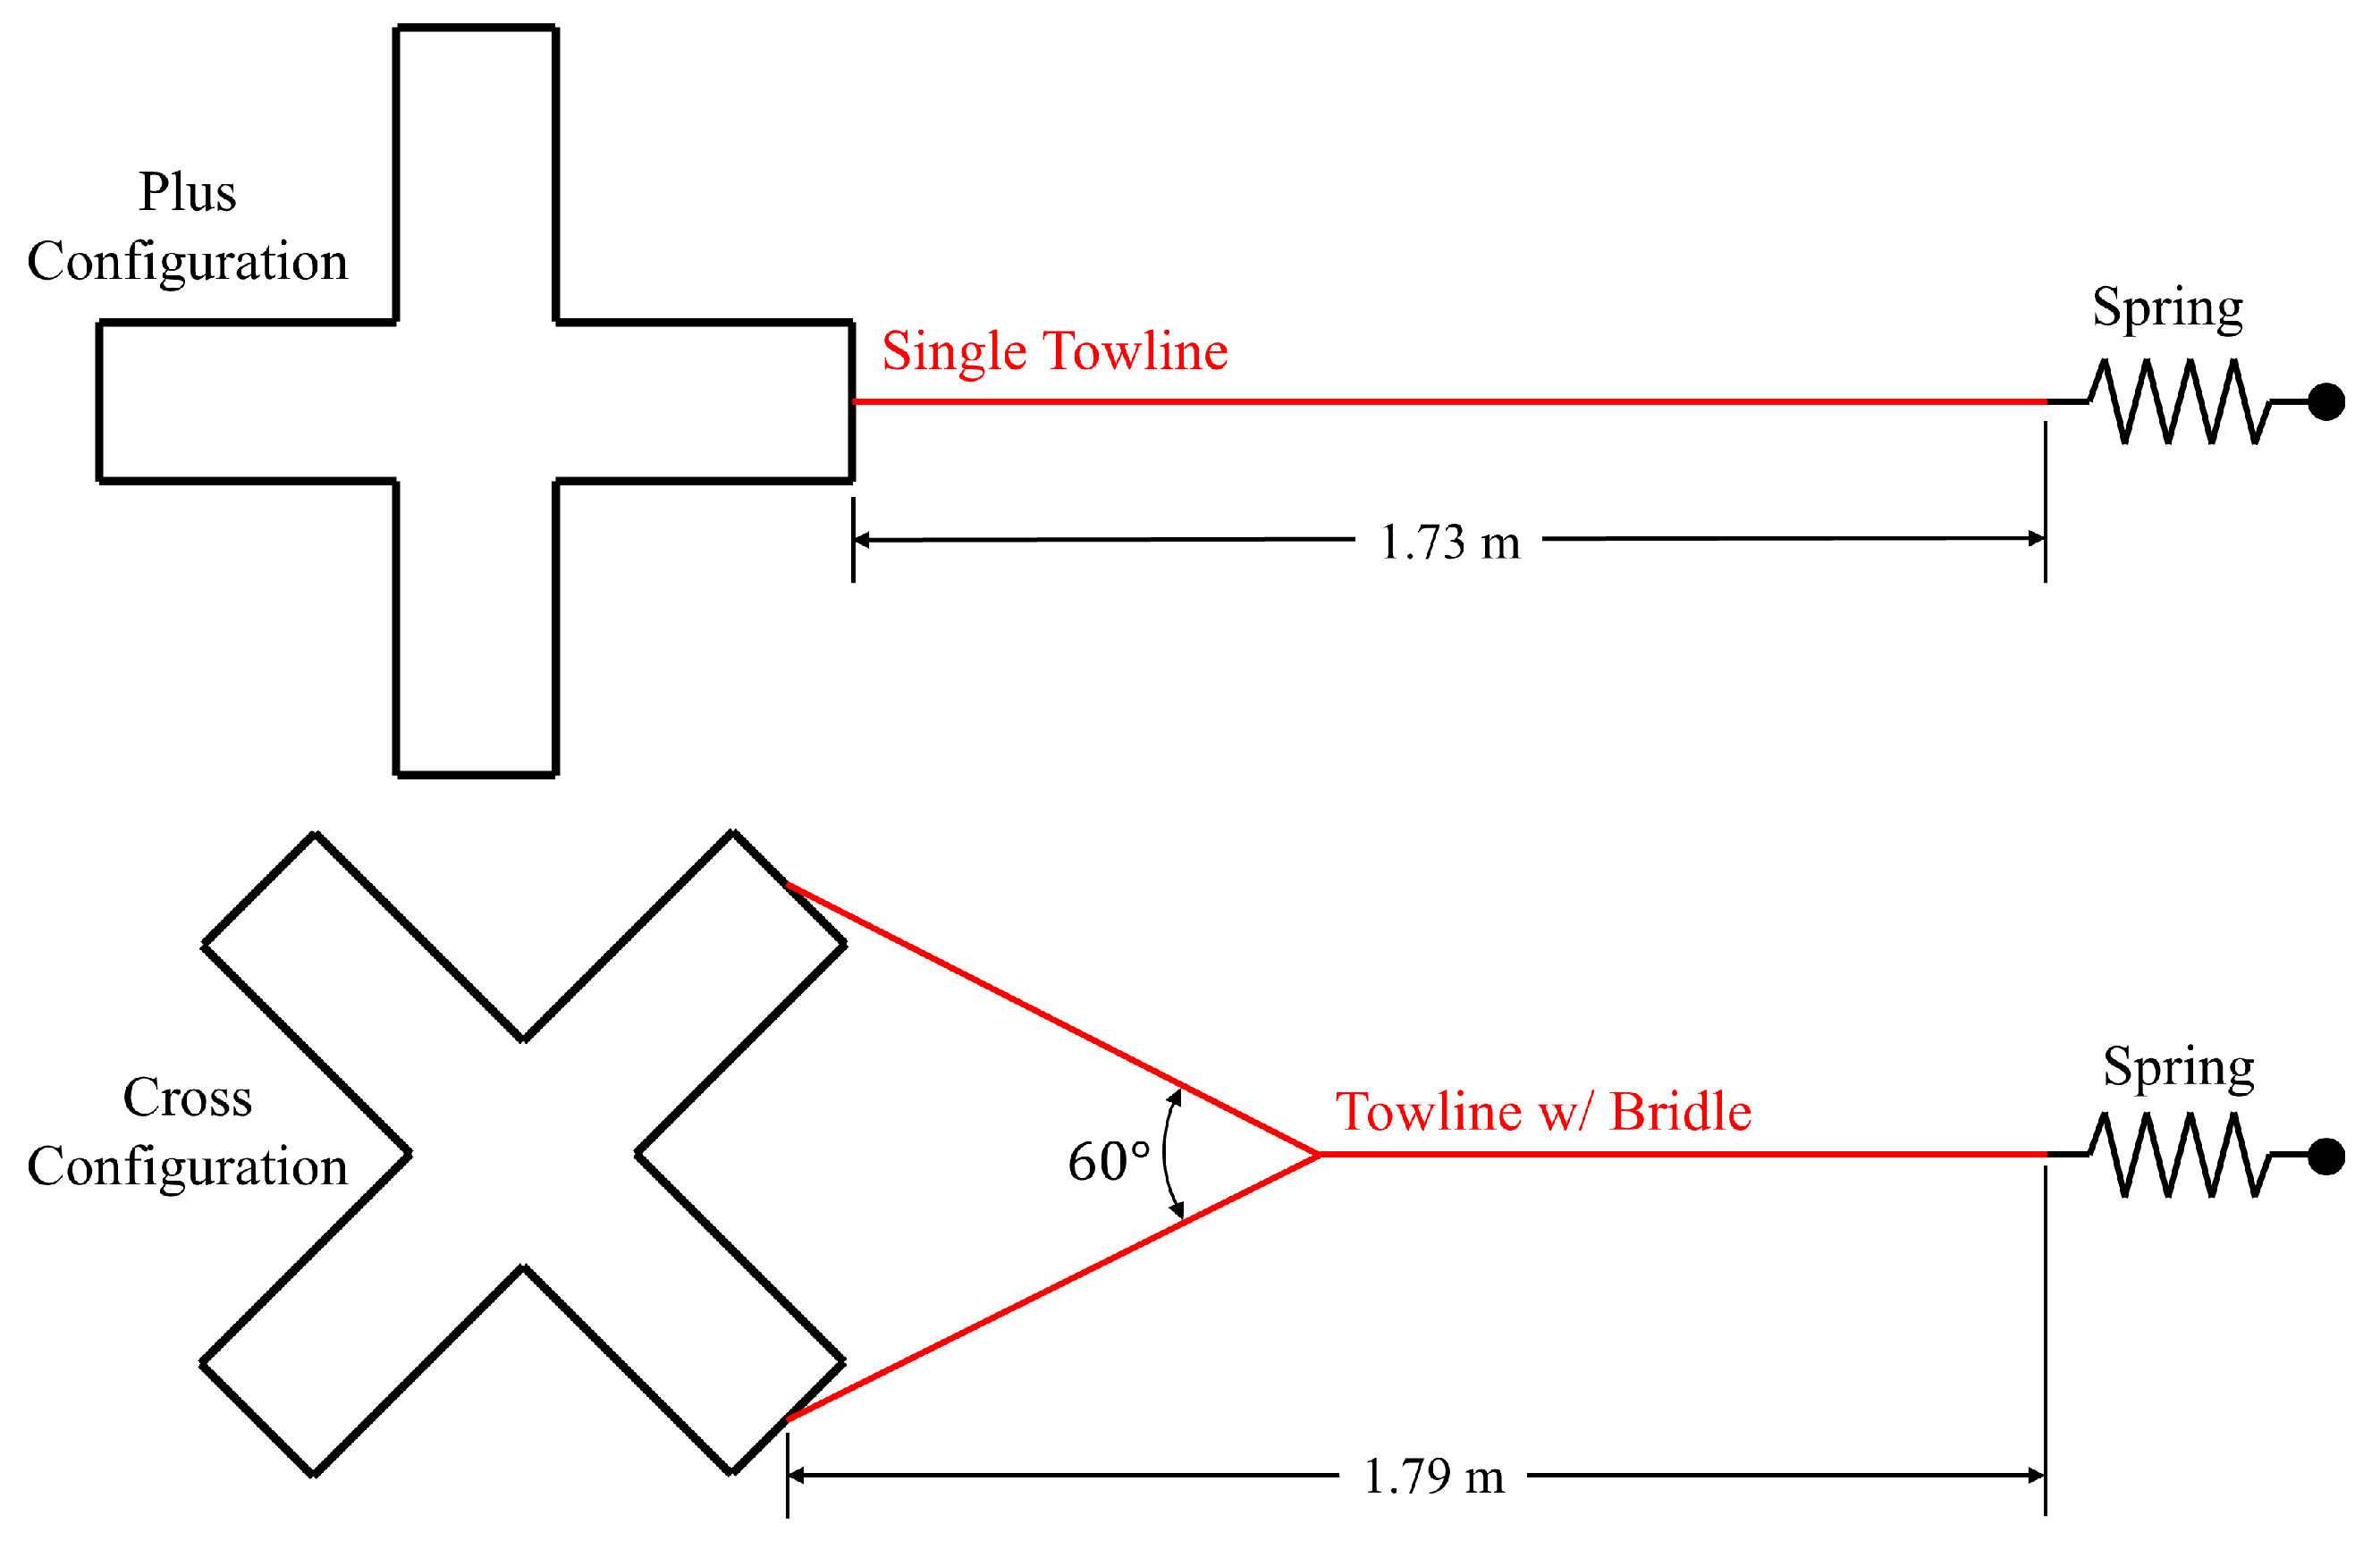
In the CFD simulations of the FOWT, the body motion was limited to only sway motion. All other body degrees of freedom were fixed. In the sway direction, the body had a stiffness value equivalent to the sway stiffness provided by the towline in both configurations.
Figure 14a,b provide time series comparisons of the CFD with experimental data in the
plus and
cross configurations, respectively.
The position of the body calculated in the CFD simulations revealed similar drifting sway motion in the
plus configuration. The trend and shape of the sway motion time series from CFD simulation are long-period oscillations, similar to the time series measurements from the drifting events during experimental testing. The
cross configuration sway motions in CFD were low-magnitude offsets and oscillatory about zero, matching the behavior seen in experimental testing. The similarities observed indicate that the drifting sway motion may be due to flow effects captured by the CFD model.
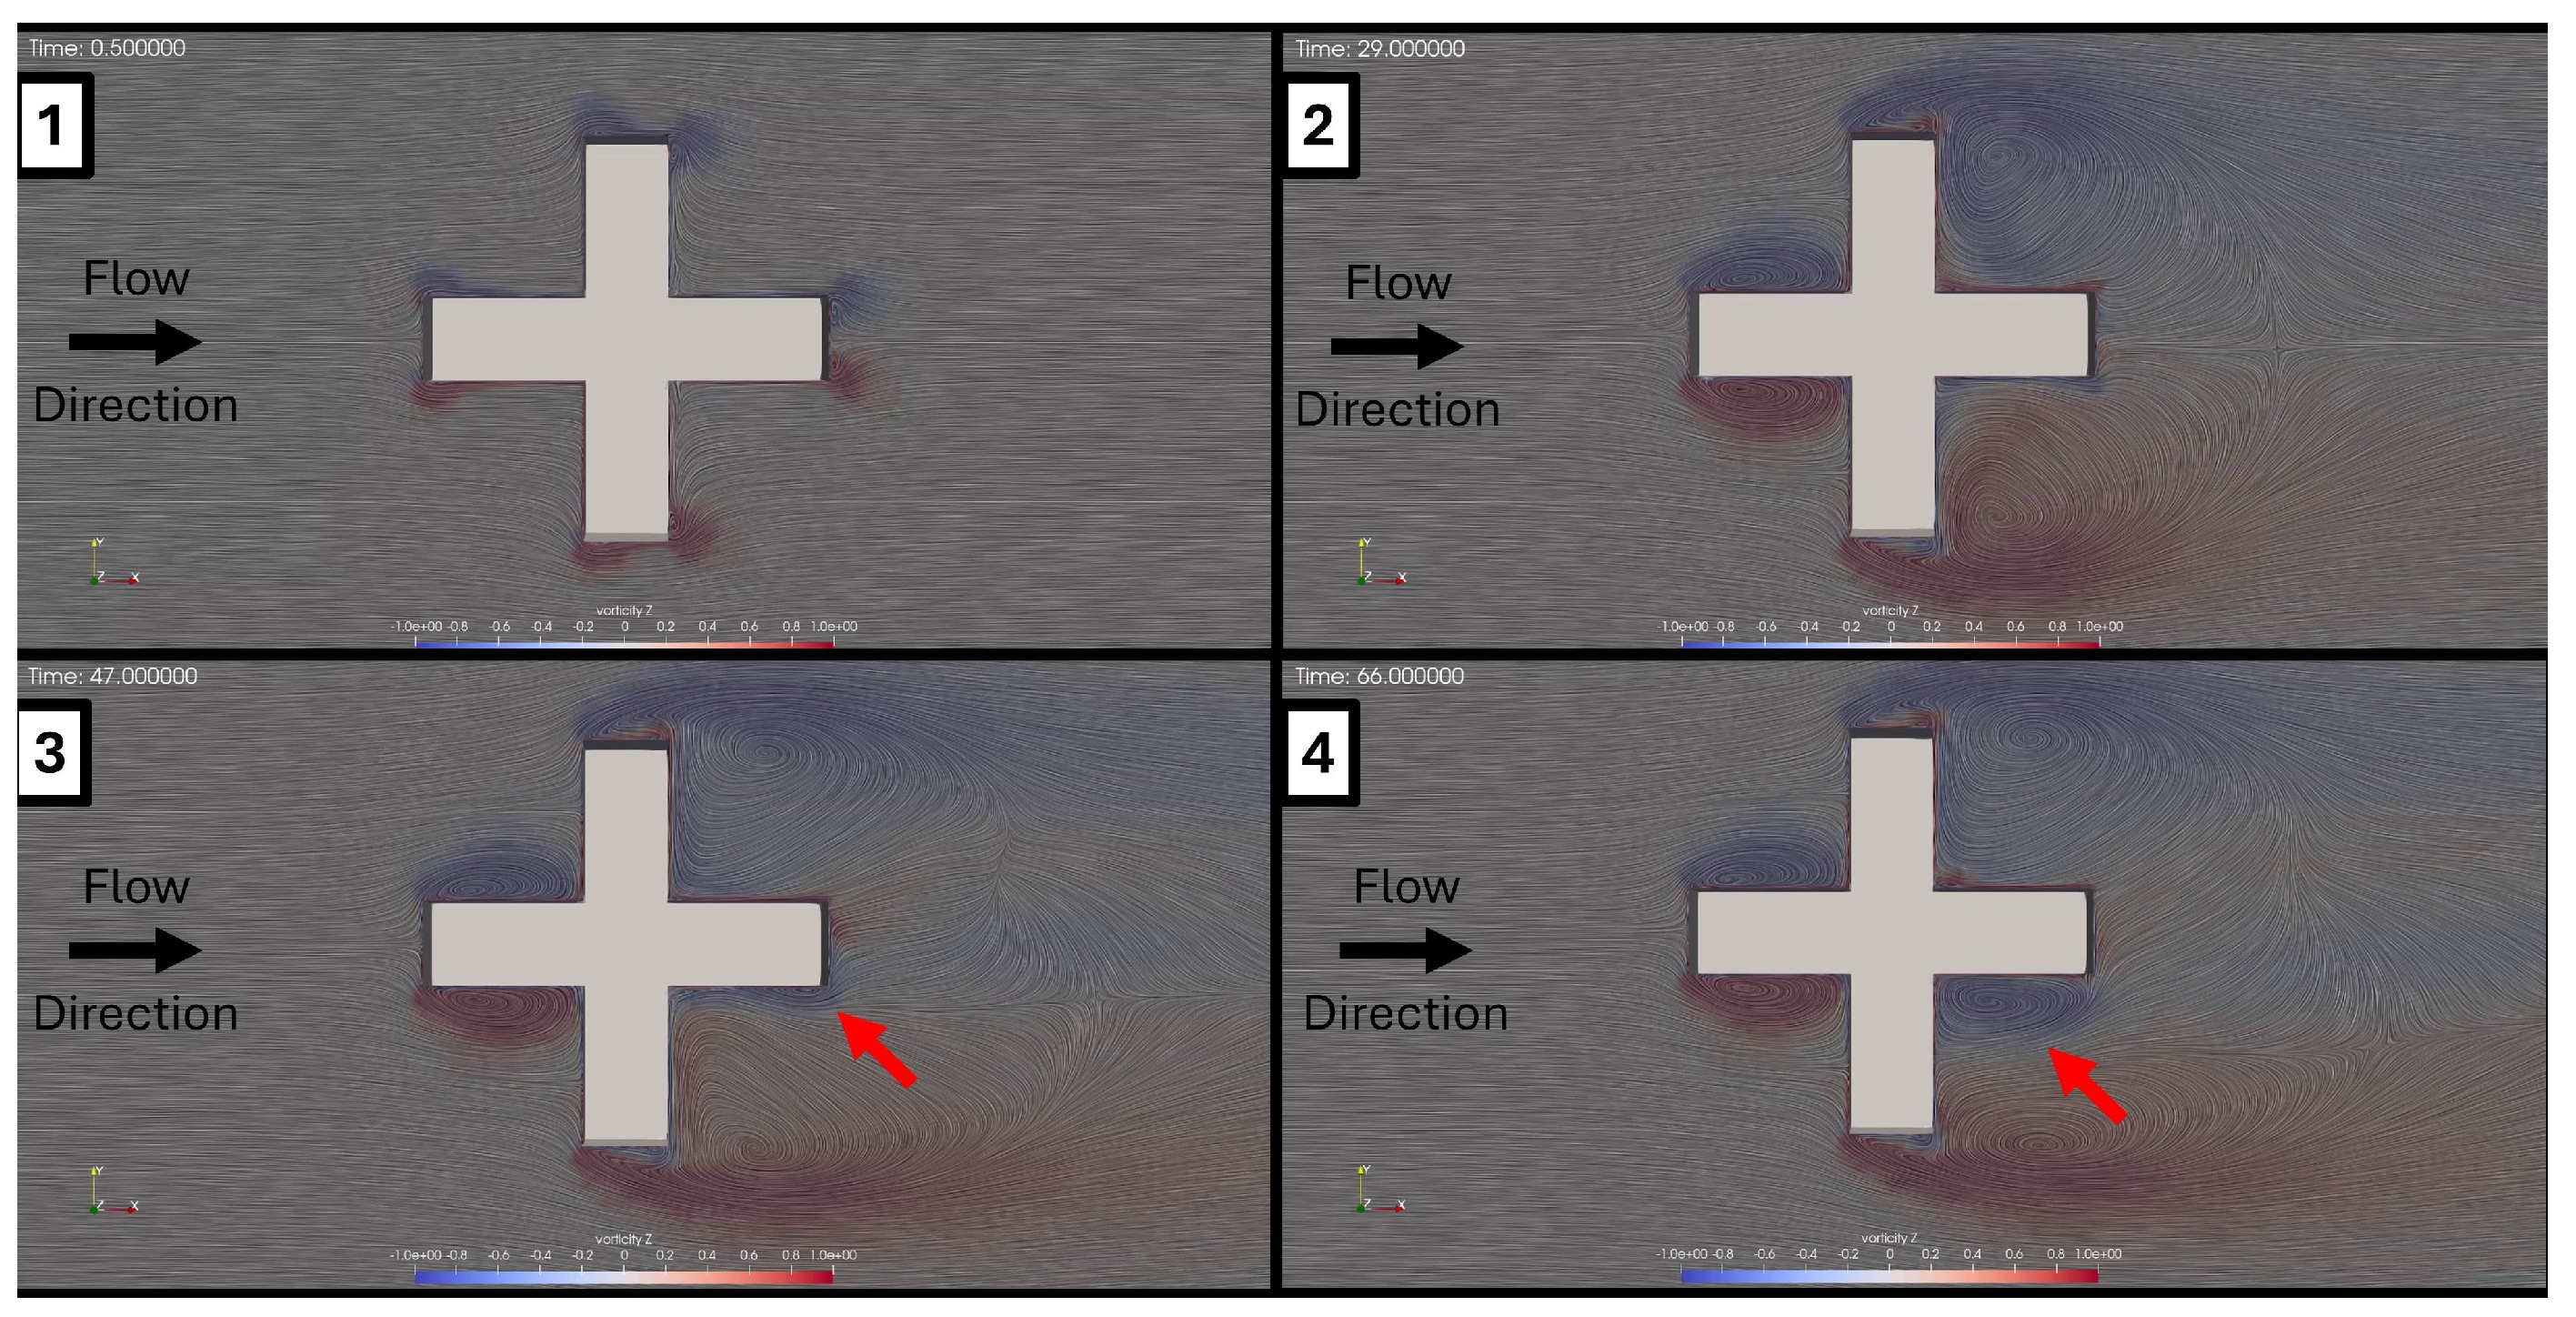
Figure 15 shows how, during the
plus configuration simulations, an asymmetric vorticity formation appears in frames 3 and 4, which are related to the drifting sway behavior of the model. These asymmetric vorticity features were not present in the simulations in the
cross configuration.
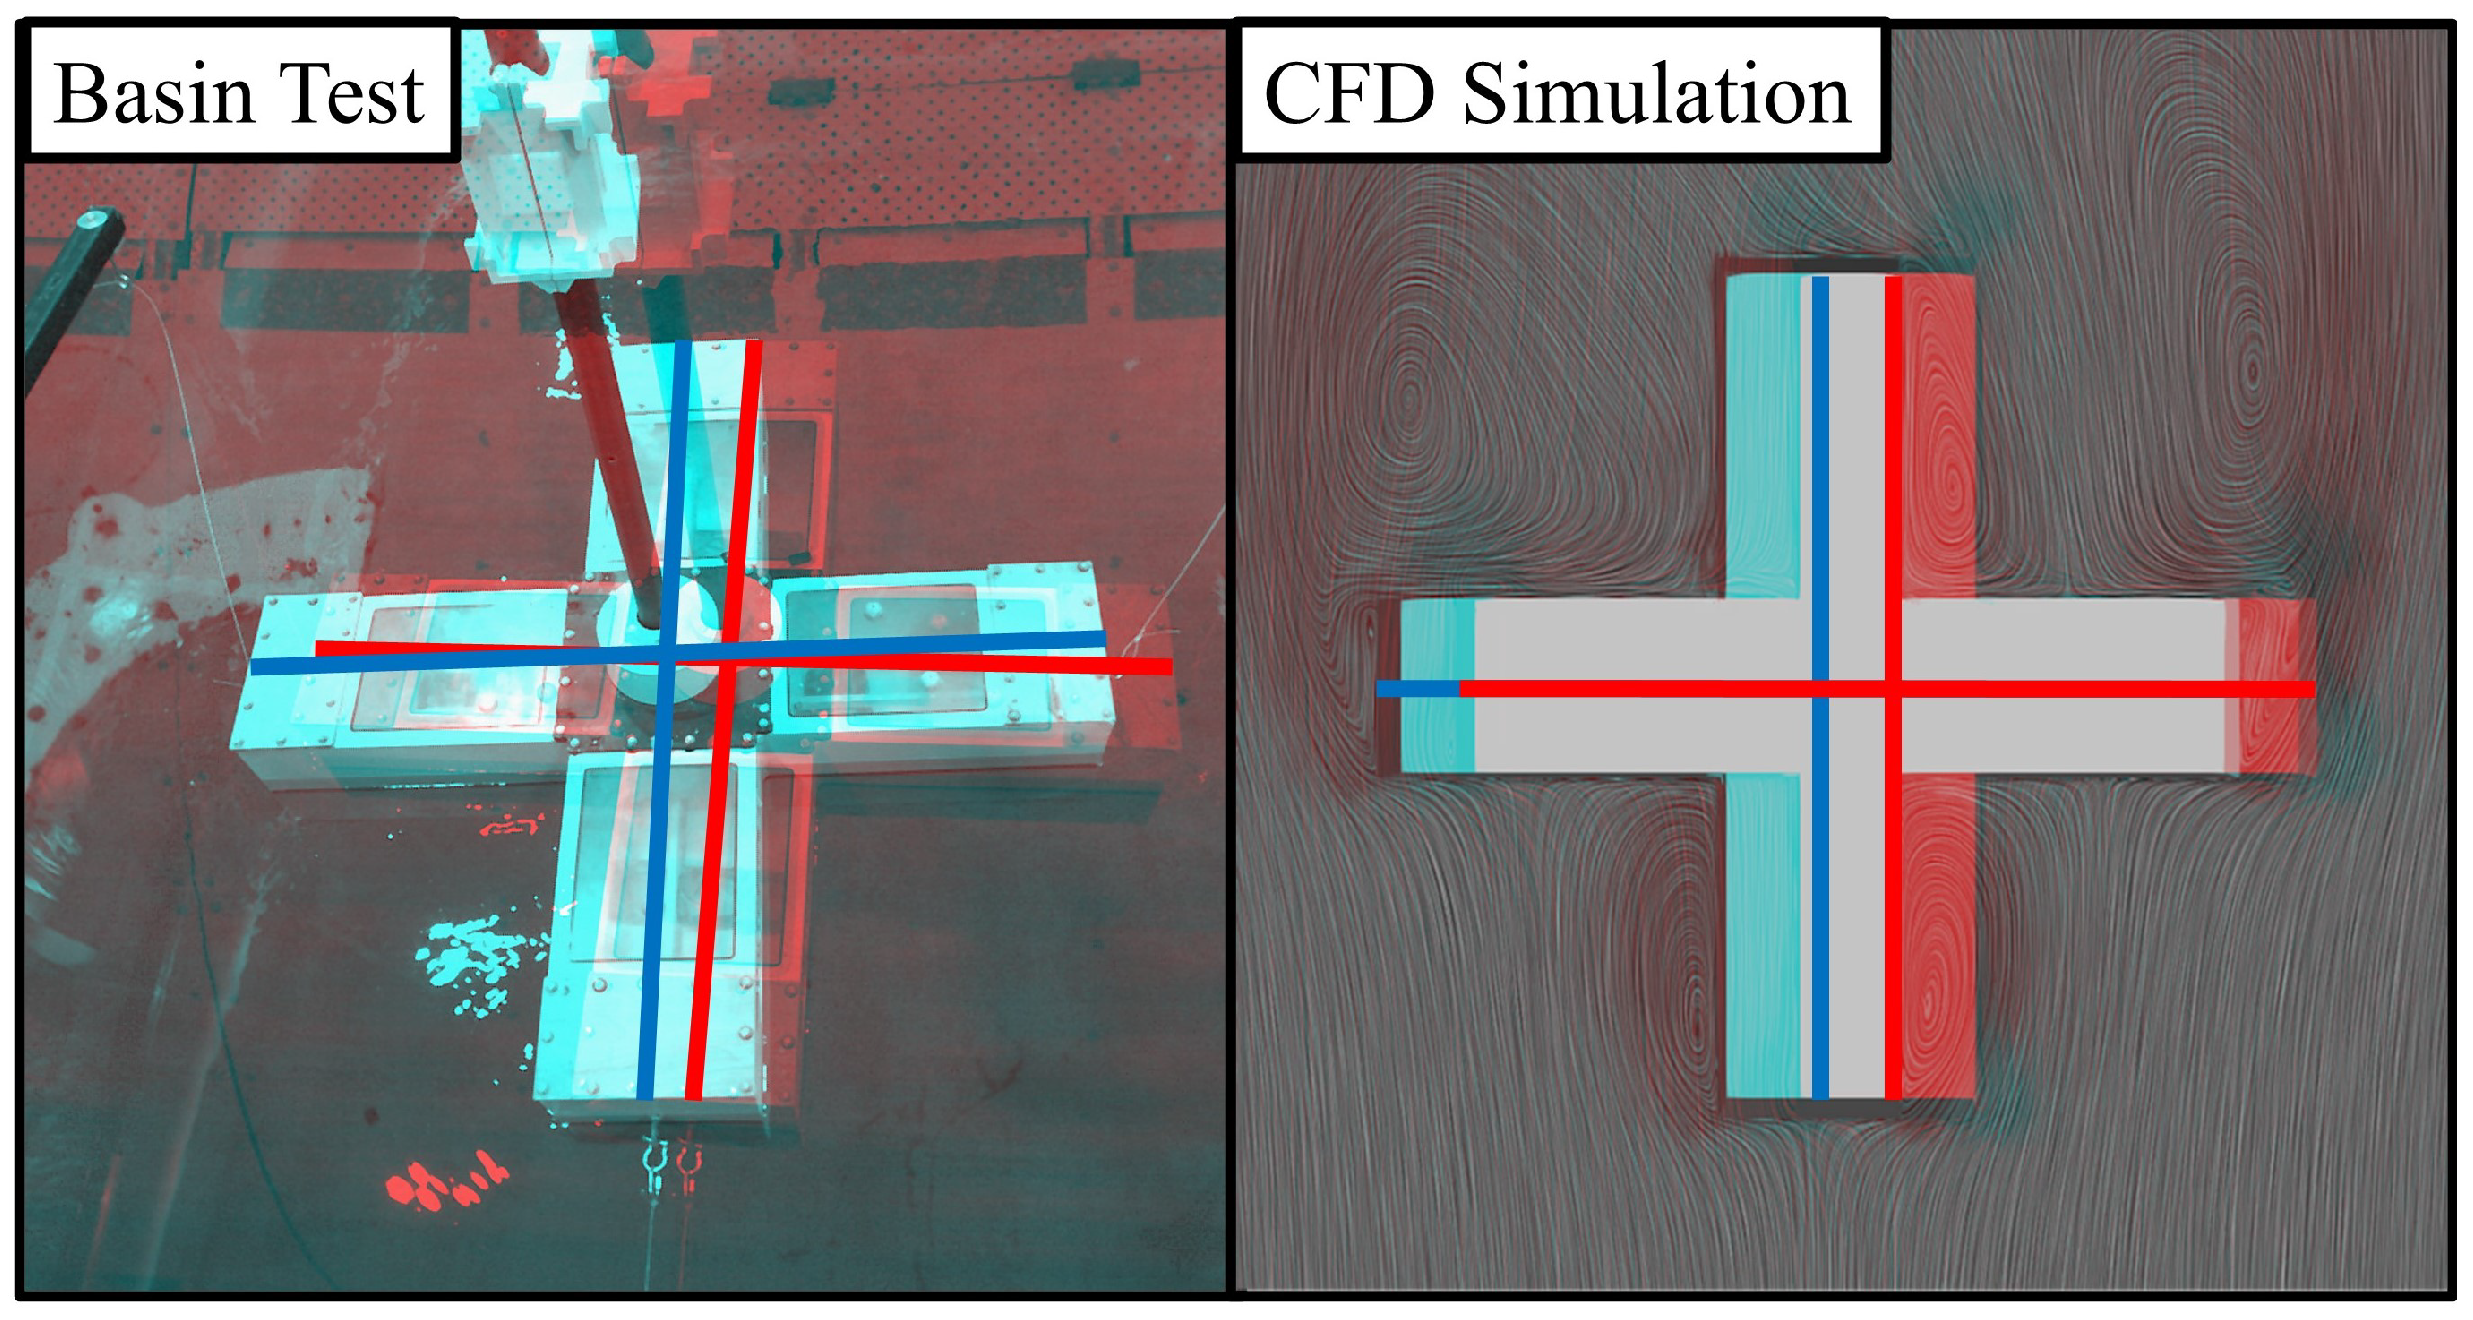
To assist in visualizing the sway motions observed in both the basin experiments and the CFD simulations,
Figure 16 overlays the initial position of the platform (red) with the peak sway offset (blue) in the
plus configuration. The red and blue crosses on each image represent the centerline of the platform legs.
3.4. Added Resistance from Regular Waves
To determine the added resistance from waves two trials were performed at a range of regular wave cases with defined wave heights and periods. Trials at two different tow speeds were performed for each regular and irregular wave case. The towline tension was recorded for each trial, and each individual time series was trimmed to exclude the transient periods at the beginning and end of the trials. The towline tension was averaged for each trial, and then averages were calculated for each wave case at each tow speed to represent the average wave resistance. The added resistance in waves was calculated by subtracting the calm water resistance from the average wave resistance.
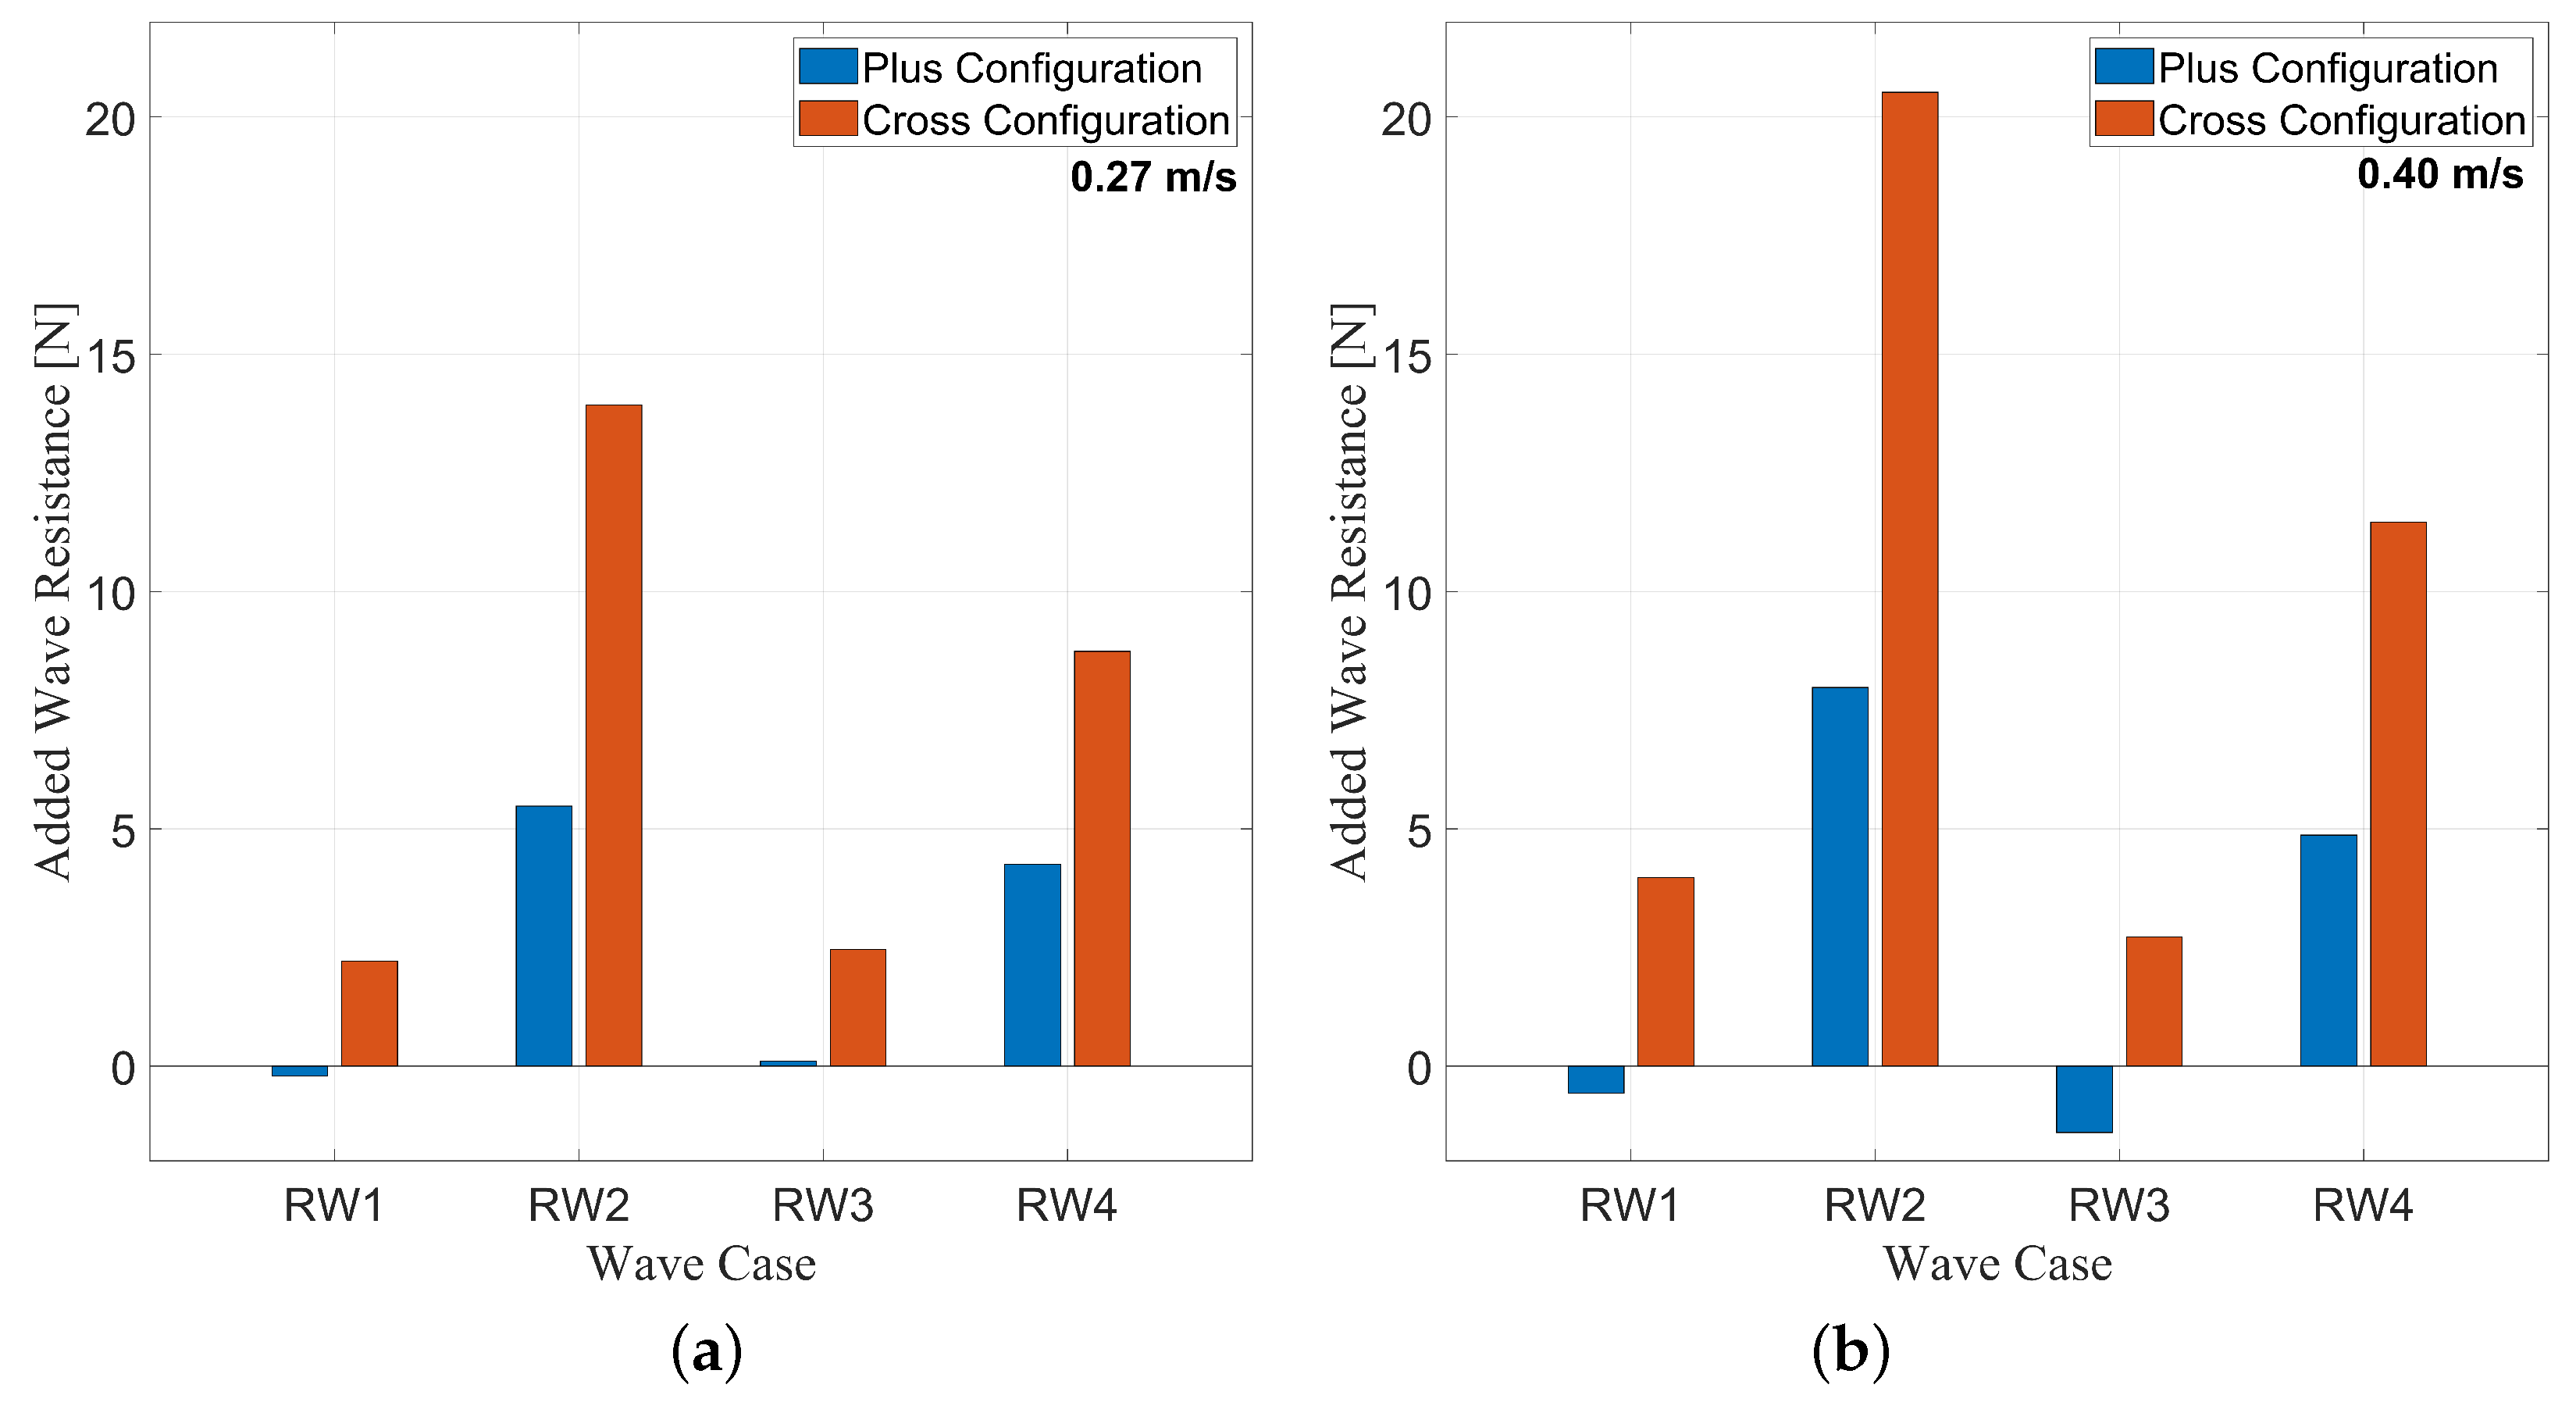
Figure 17a,b provide the added resistance in regular wave cases at tow speeds of 0.27 m/s and 0.40 m/s, respectively.
Regular wave cases RW1 and RW3 show relatively small added resistance in waves as compared to cases RW2 and RW4. Cases RW2 and RW4 represent the cases with the higher wave height. The results indicate that wave height had a more significant impact on added wave resistance than the wave period in these cases.
In the regular wave cases, the cross configuration exhibited greater total wave resistances in all cases. The calm water resistance in the cross configuration was less than that in the plus configuration, so the added resistance in waves is higher in the cross configuration in all cases. In cases RW2 and RW4, the cross configuration exhibited significantly greater added wave resistance than the plus configuration, indicating that greater wave heights may amplify the effects, causing greater wave resistance in the cross configuration.
Hyland et al. [
8] observed that a bow wave system formed in the towing configuration with a greater added resistance in one of the wave cases, leading to the conclusion that the bow wave interaction with the regular waves may be a cause of greater towing resistance. The results of this study indicate that the
cross orientation may form a more significant bow wave, leading to more complex flow and wave interactions and causing the increased added resistance in waves.
In multiple cases, the
plus configuration exhibited lower total wave resistances than the calm water resistance, meaning there was negative added wave resistance. A similar phenomenon was observed by Mas-Soler et al. [
9], where the experiments showed a negative added resistance in some of the wave tests. The authors hypothesized that the negative added resistance is due to the fact that, at certain encounter frequencies, the harmonic pressure field from the waves reduces flow separation, therefore reducing the resistance of the platform. In this study, the phenomenon was only observed in the
plus configuration, further indicating that it may be a flow-related effect that is dependent on the shape of the structure. Further investigation of this phenomenon is needed in the future.
3.5. Regular Waves Motions
The mean-subtracted RMS values of the platform motions are presented for each wave case.
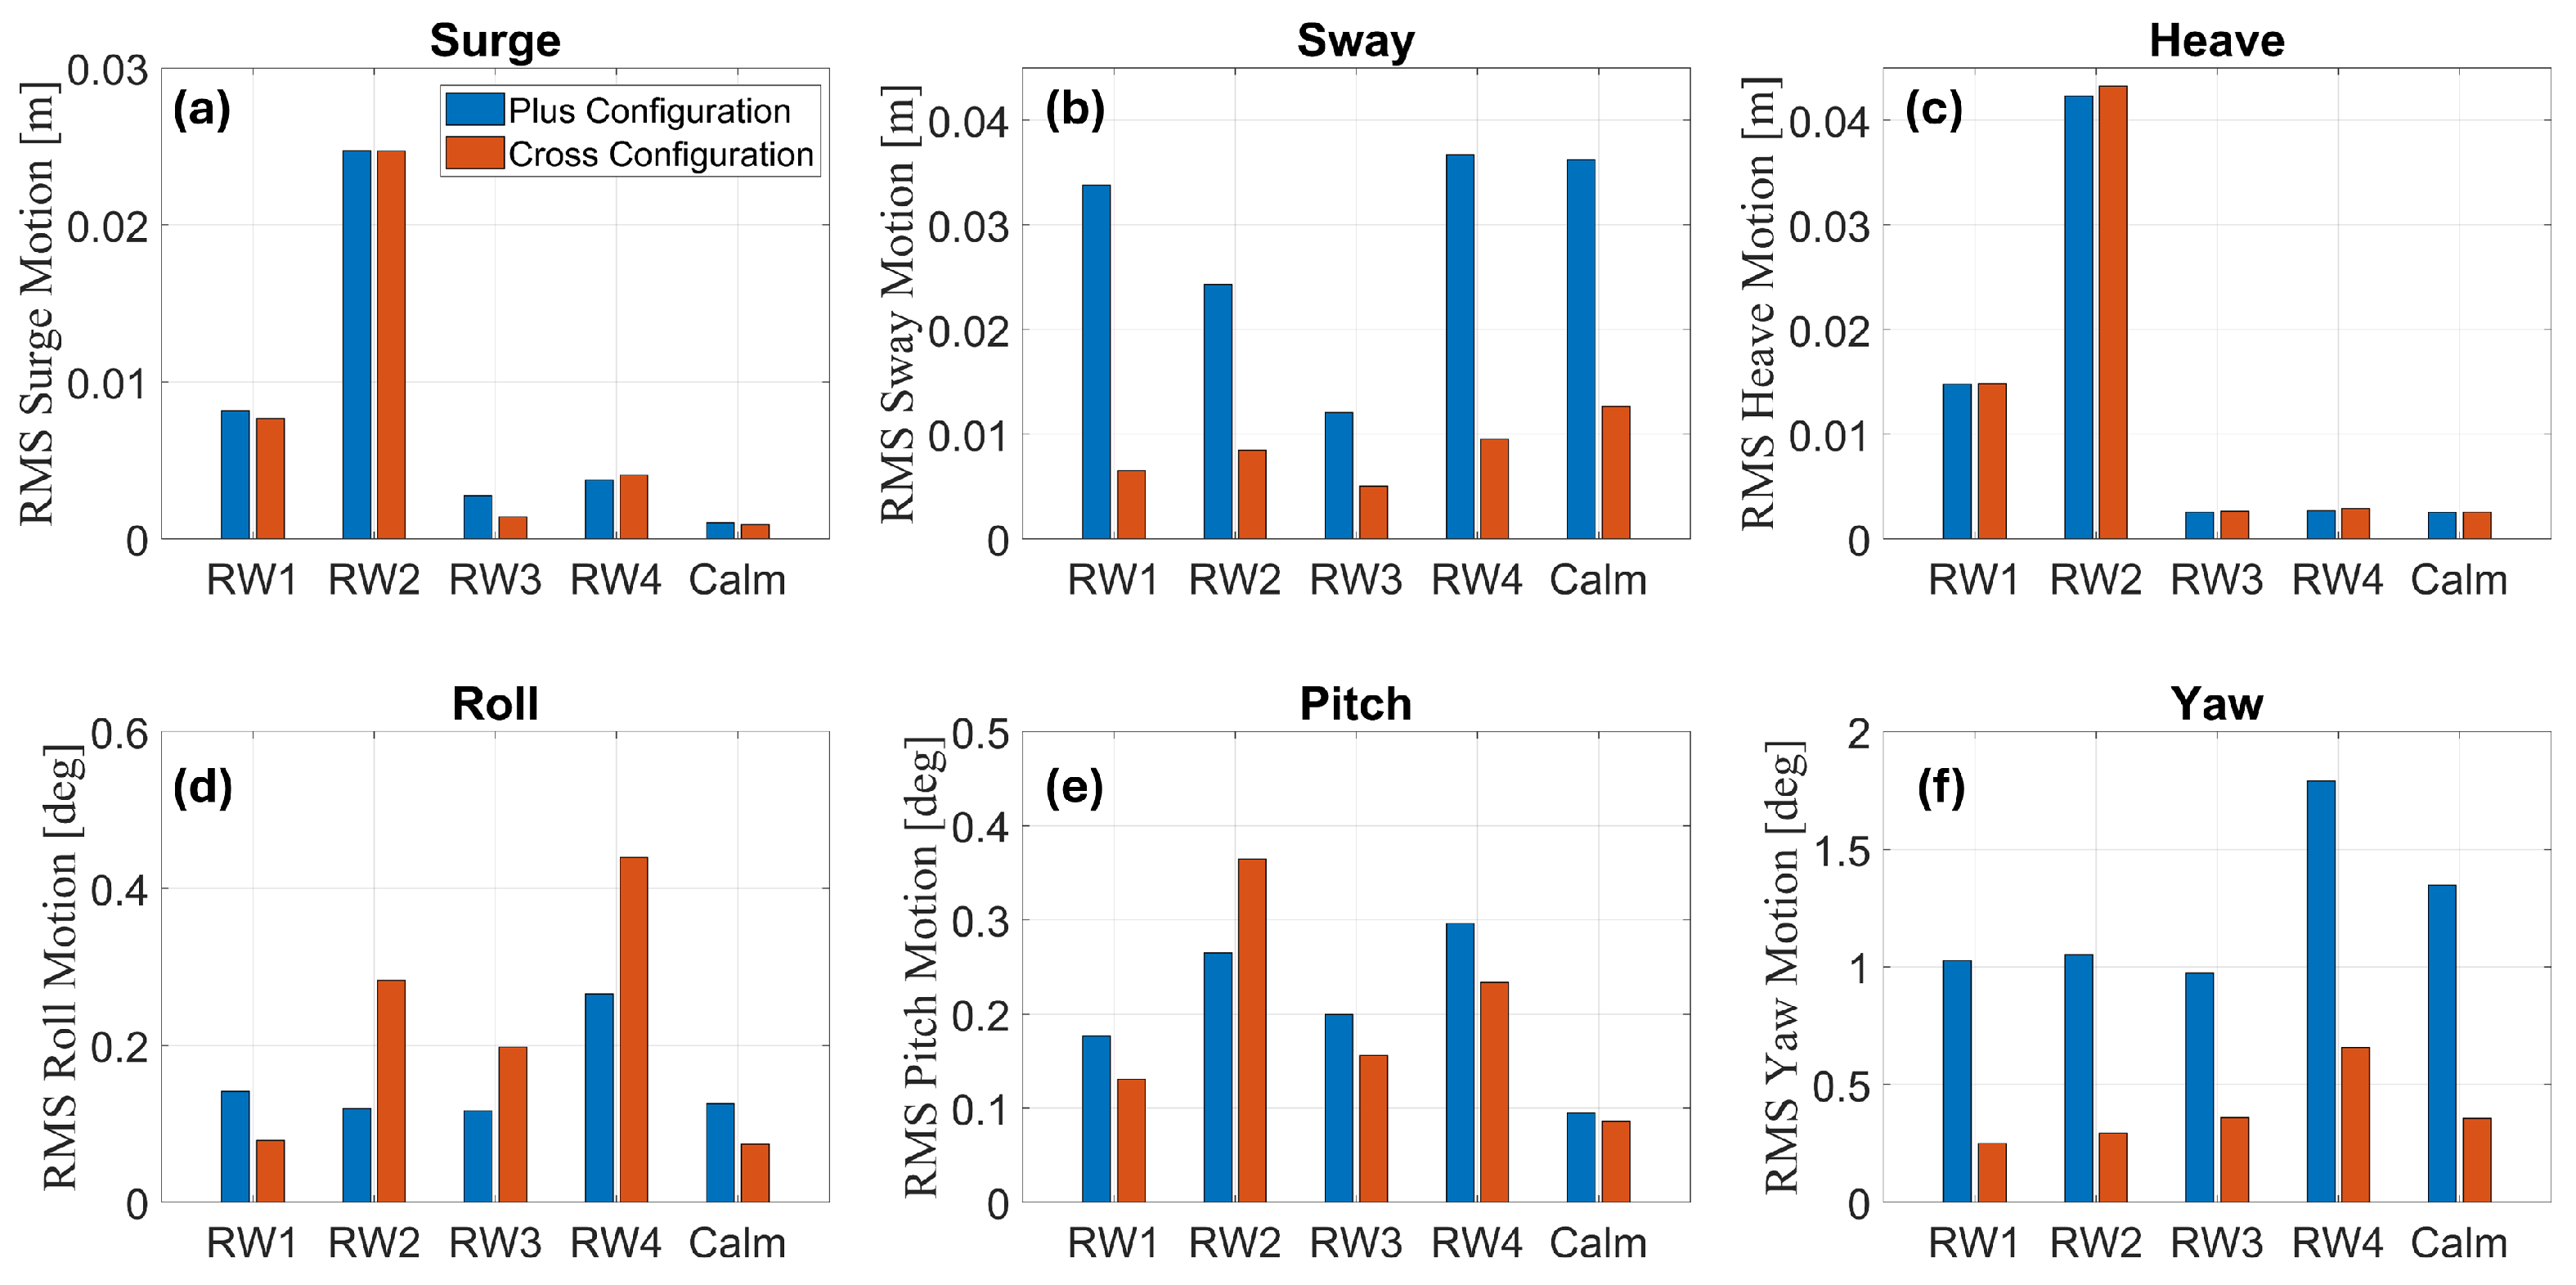
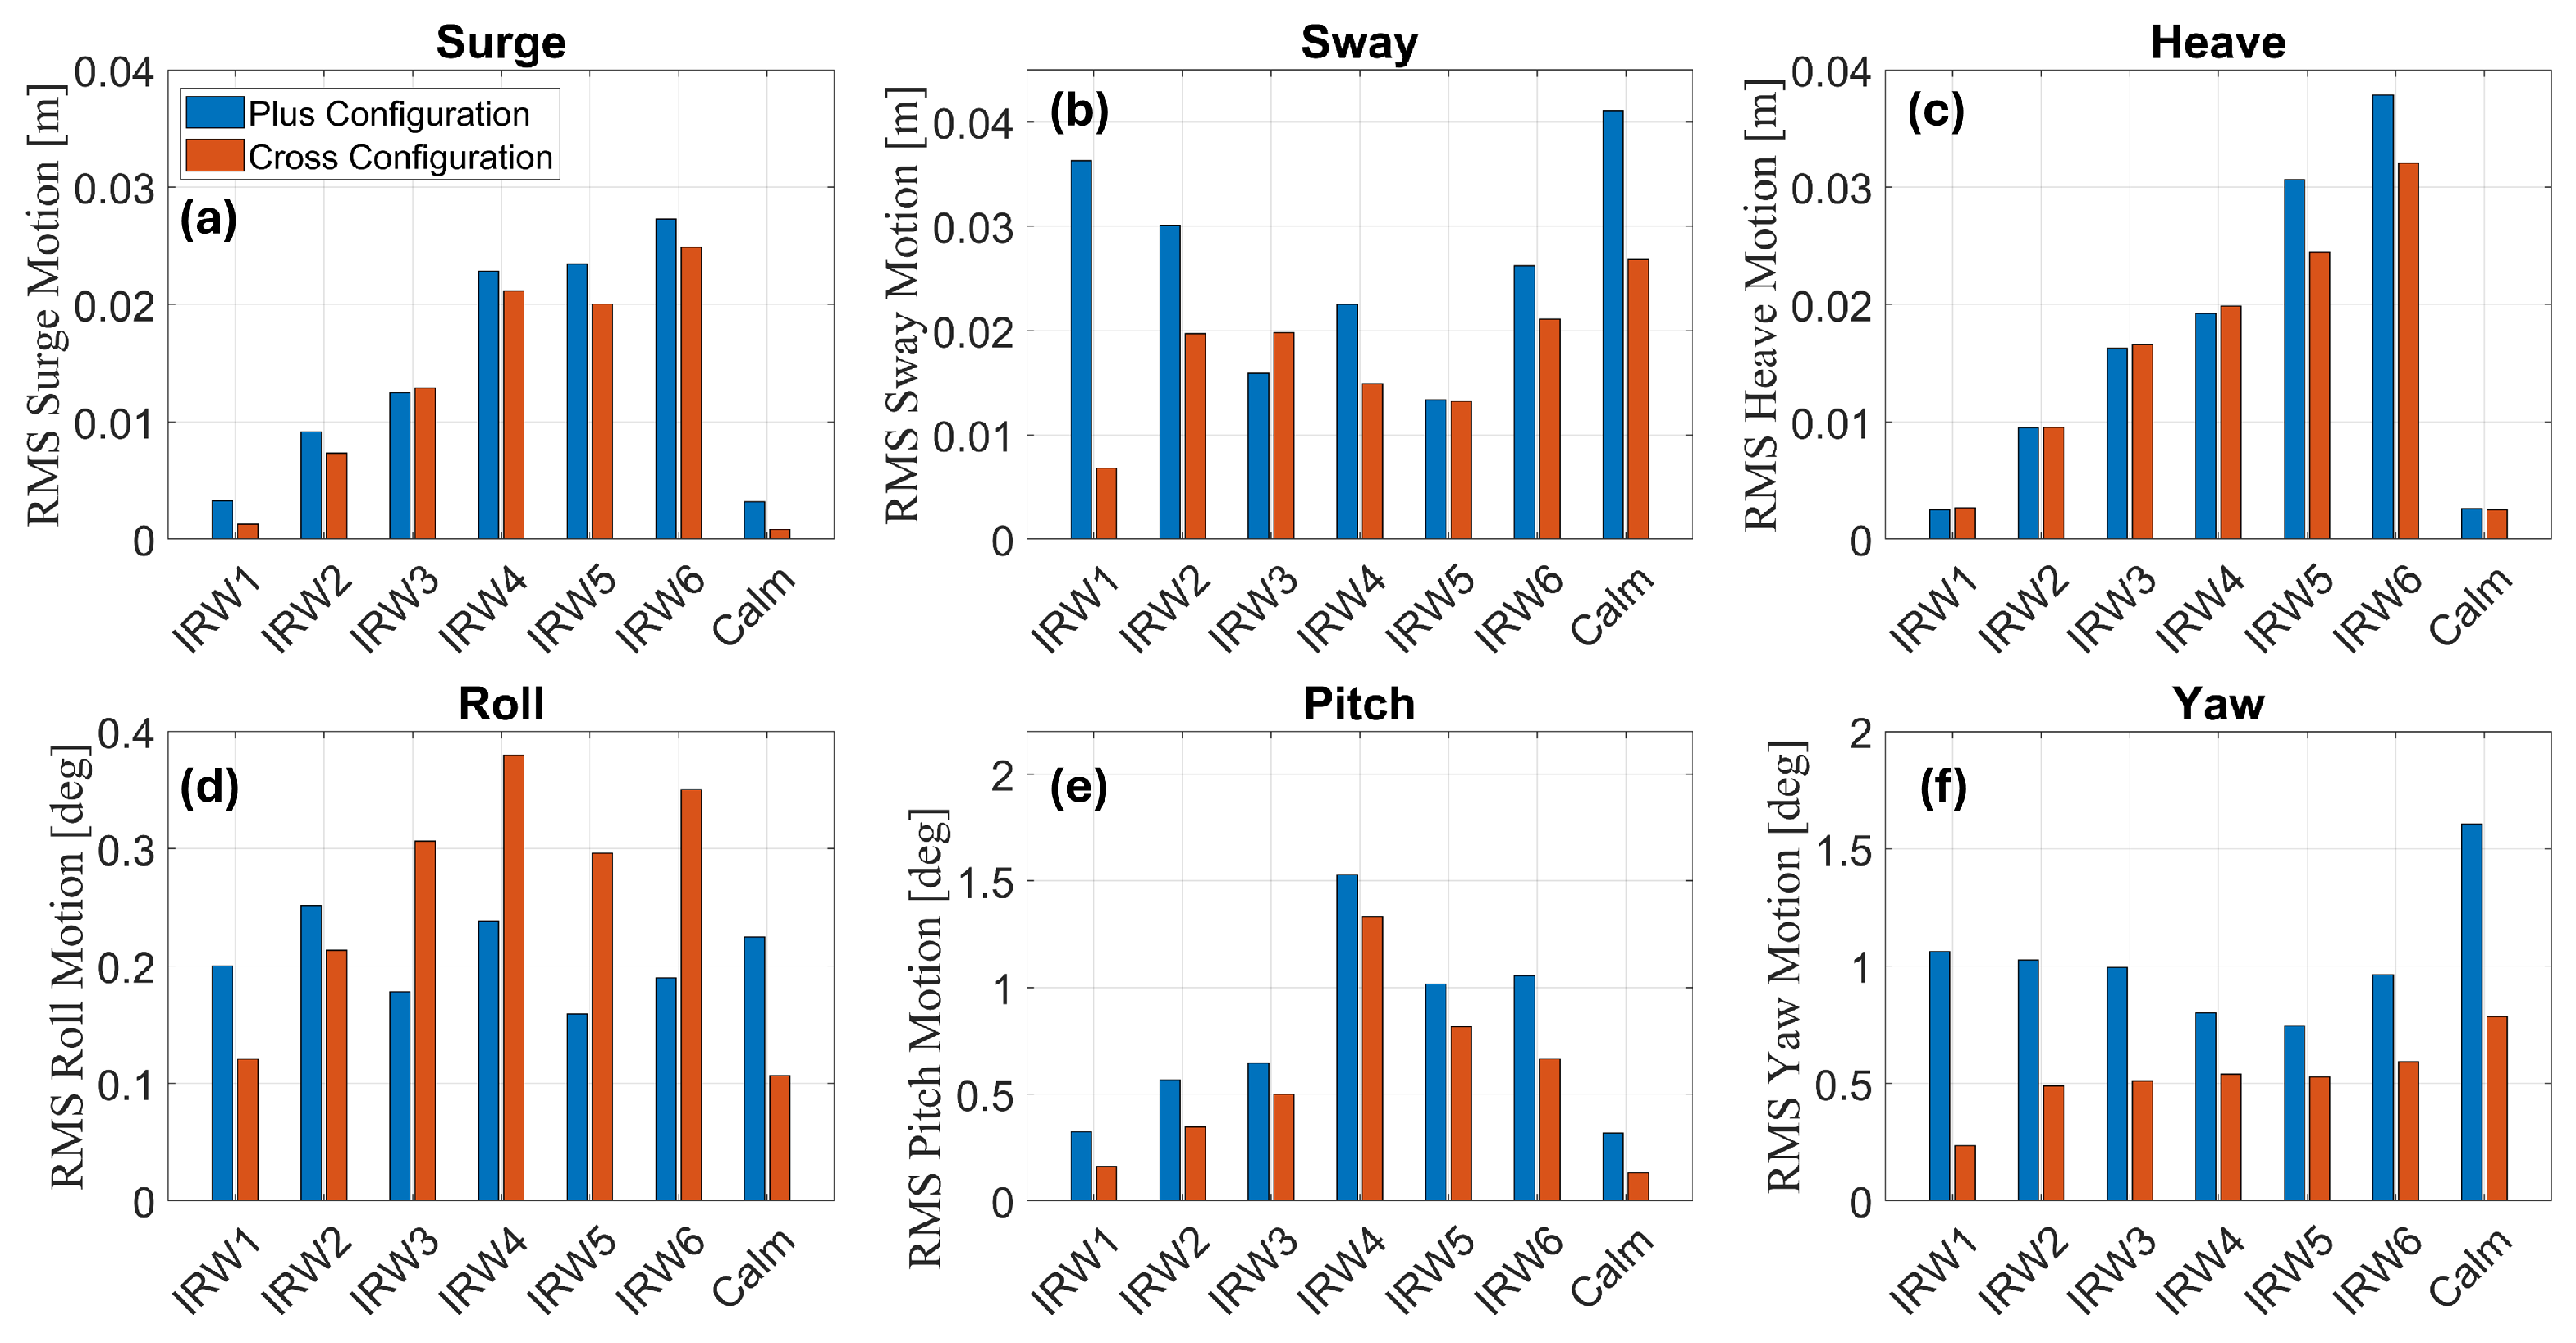
Figure 18 provides the motions in all degrees of freedom at a tow speed of 0.27 m/s, while
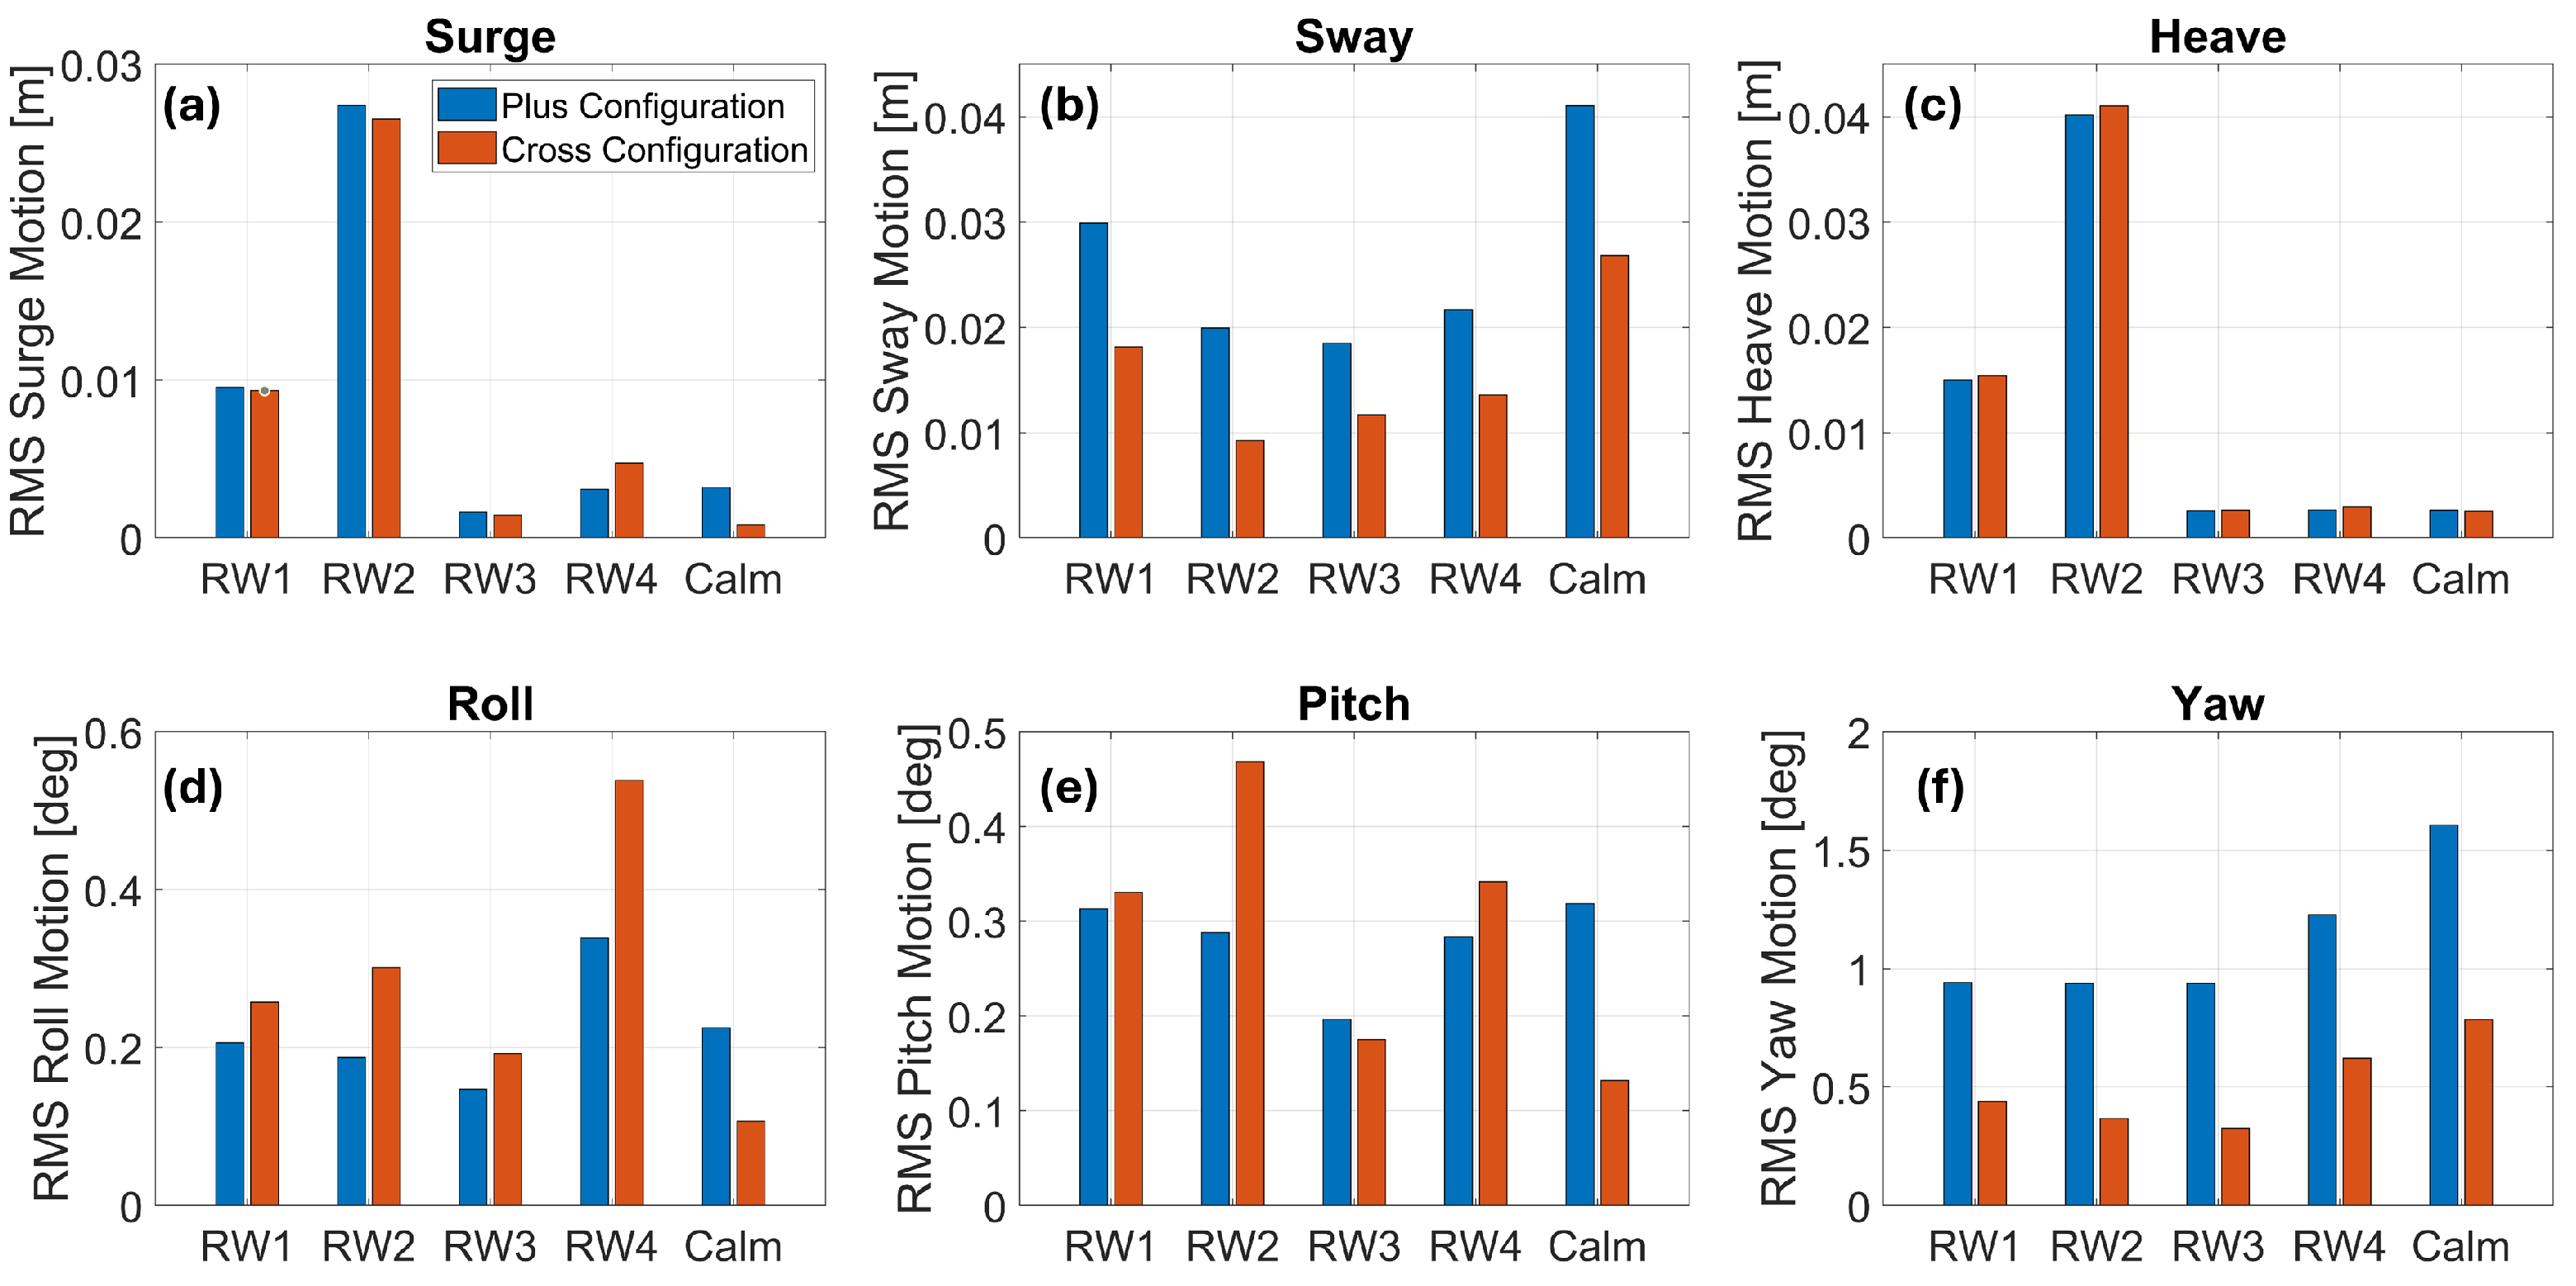
Figure 19 provides the same motions at a tow speed of 0.40 m/s.
Surge: The RMS surge motion is similar between the
plus and
cross configurations for all regular wave cases, as seen in
Figure 18a and
Figure 19a. The surge motions were the greatest in RW2, featuring the largest wave heights and longest wave periods. Increasing the tow speed slightly increased the surge motions for both configurations. The surge motions in waves were significantly larger than the motions observed during the calm water trials.
Sway: Sway motions of the model are shown in
Figure 18b and
Figure 19b. The sway motion of the
plus configuration was larger than that of the
cross configuration and similar to the calm water tests. The RMS sway motion decreased in some of the regular wave cases compared to the calm trials. The decrease is most significant in regular wave cases, RW3, at the lower speed of 0.27 m/s. At the faster tow speed of 0.40 m/s, all the regular wave cases showed notably smaller sway motions than the calm water trials. Hyland et al. [
8] observed that in the calm water tests, oscillating sway motions were observed to be generated by unsteady flow attachment at the cylindrical bodies. In the regular wave tests, the VIMs were no longer significant, likely because the waves disrupted the periodic flow separation that drives VIMs. The harmonic pressure field reduced flow separation, which in turn mitigated the sway motion, similar to the negative added resistance effect.
Heave: The heave motions of the FOWT were in similar magnitudes between the two configurations in all regular wave cases, as seen in
Figure 18c and
Figure 19c. Regular wave cases RW1 and RW2 showed the largest responses, as the encounter periods of these wave cases (1.16 s, 1.10 s) were near the natural period of the model in heave (1.20 s). The RMS response showed a linear increase with wave height between wave cases RW1 and RW2. The heave responses were not significantly greater than the calm water response in regular wave cases RW3 and RW4.
Roll and Pitch: The roll and pitch motions were relatively small in the regular wave cases for both configurations, generally only slightly increasing from the calm water values in magnitude. As shown in
Figure 18d and
Figure 19d, the largest roll motions occurred in the regular wave case RW4 at both tow speeds. The
cross configuration exhibited slightly higher roll responses in each case, with the exception of the regular wave case RW1 and the slower tow speed. This trend is opposite to what was observed in the calm water trials. Pitch motions are shown in
Figure 18e and
Figure 19e. The larger pitch responses were mixed between the two configurations but were the greatest in the regular wave case RW2 in the
cross configuration at both tow speeds. The pitch responses were slightly higher at the lower tow speed. Neither of the wave periods in the regular wave cases was near the roll and pitch natural frequencies, resulting in the small responses.
Yaw: Yaw motions are shown in
Figure 18f and
Figure 19f. As with the calm water trials, the yaw motion of the
cross configuration was significantly smaller in all regular wave cases due to the towline bridle. In many of the regular wave cases, especially at the faster tow speed, the yaw motion was reduced from what was observed during the calm water test. The reduced motion may once again be explained by the harmonic pressure field from the waves mitigating FIM.
3.6. Added Resistance from Irregular Waves
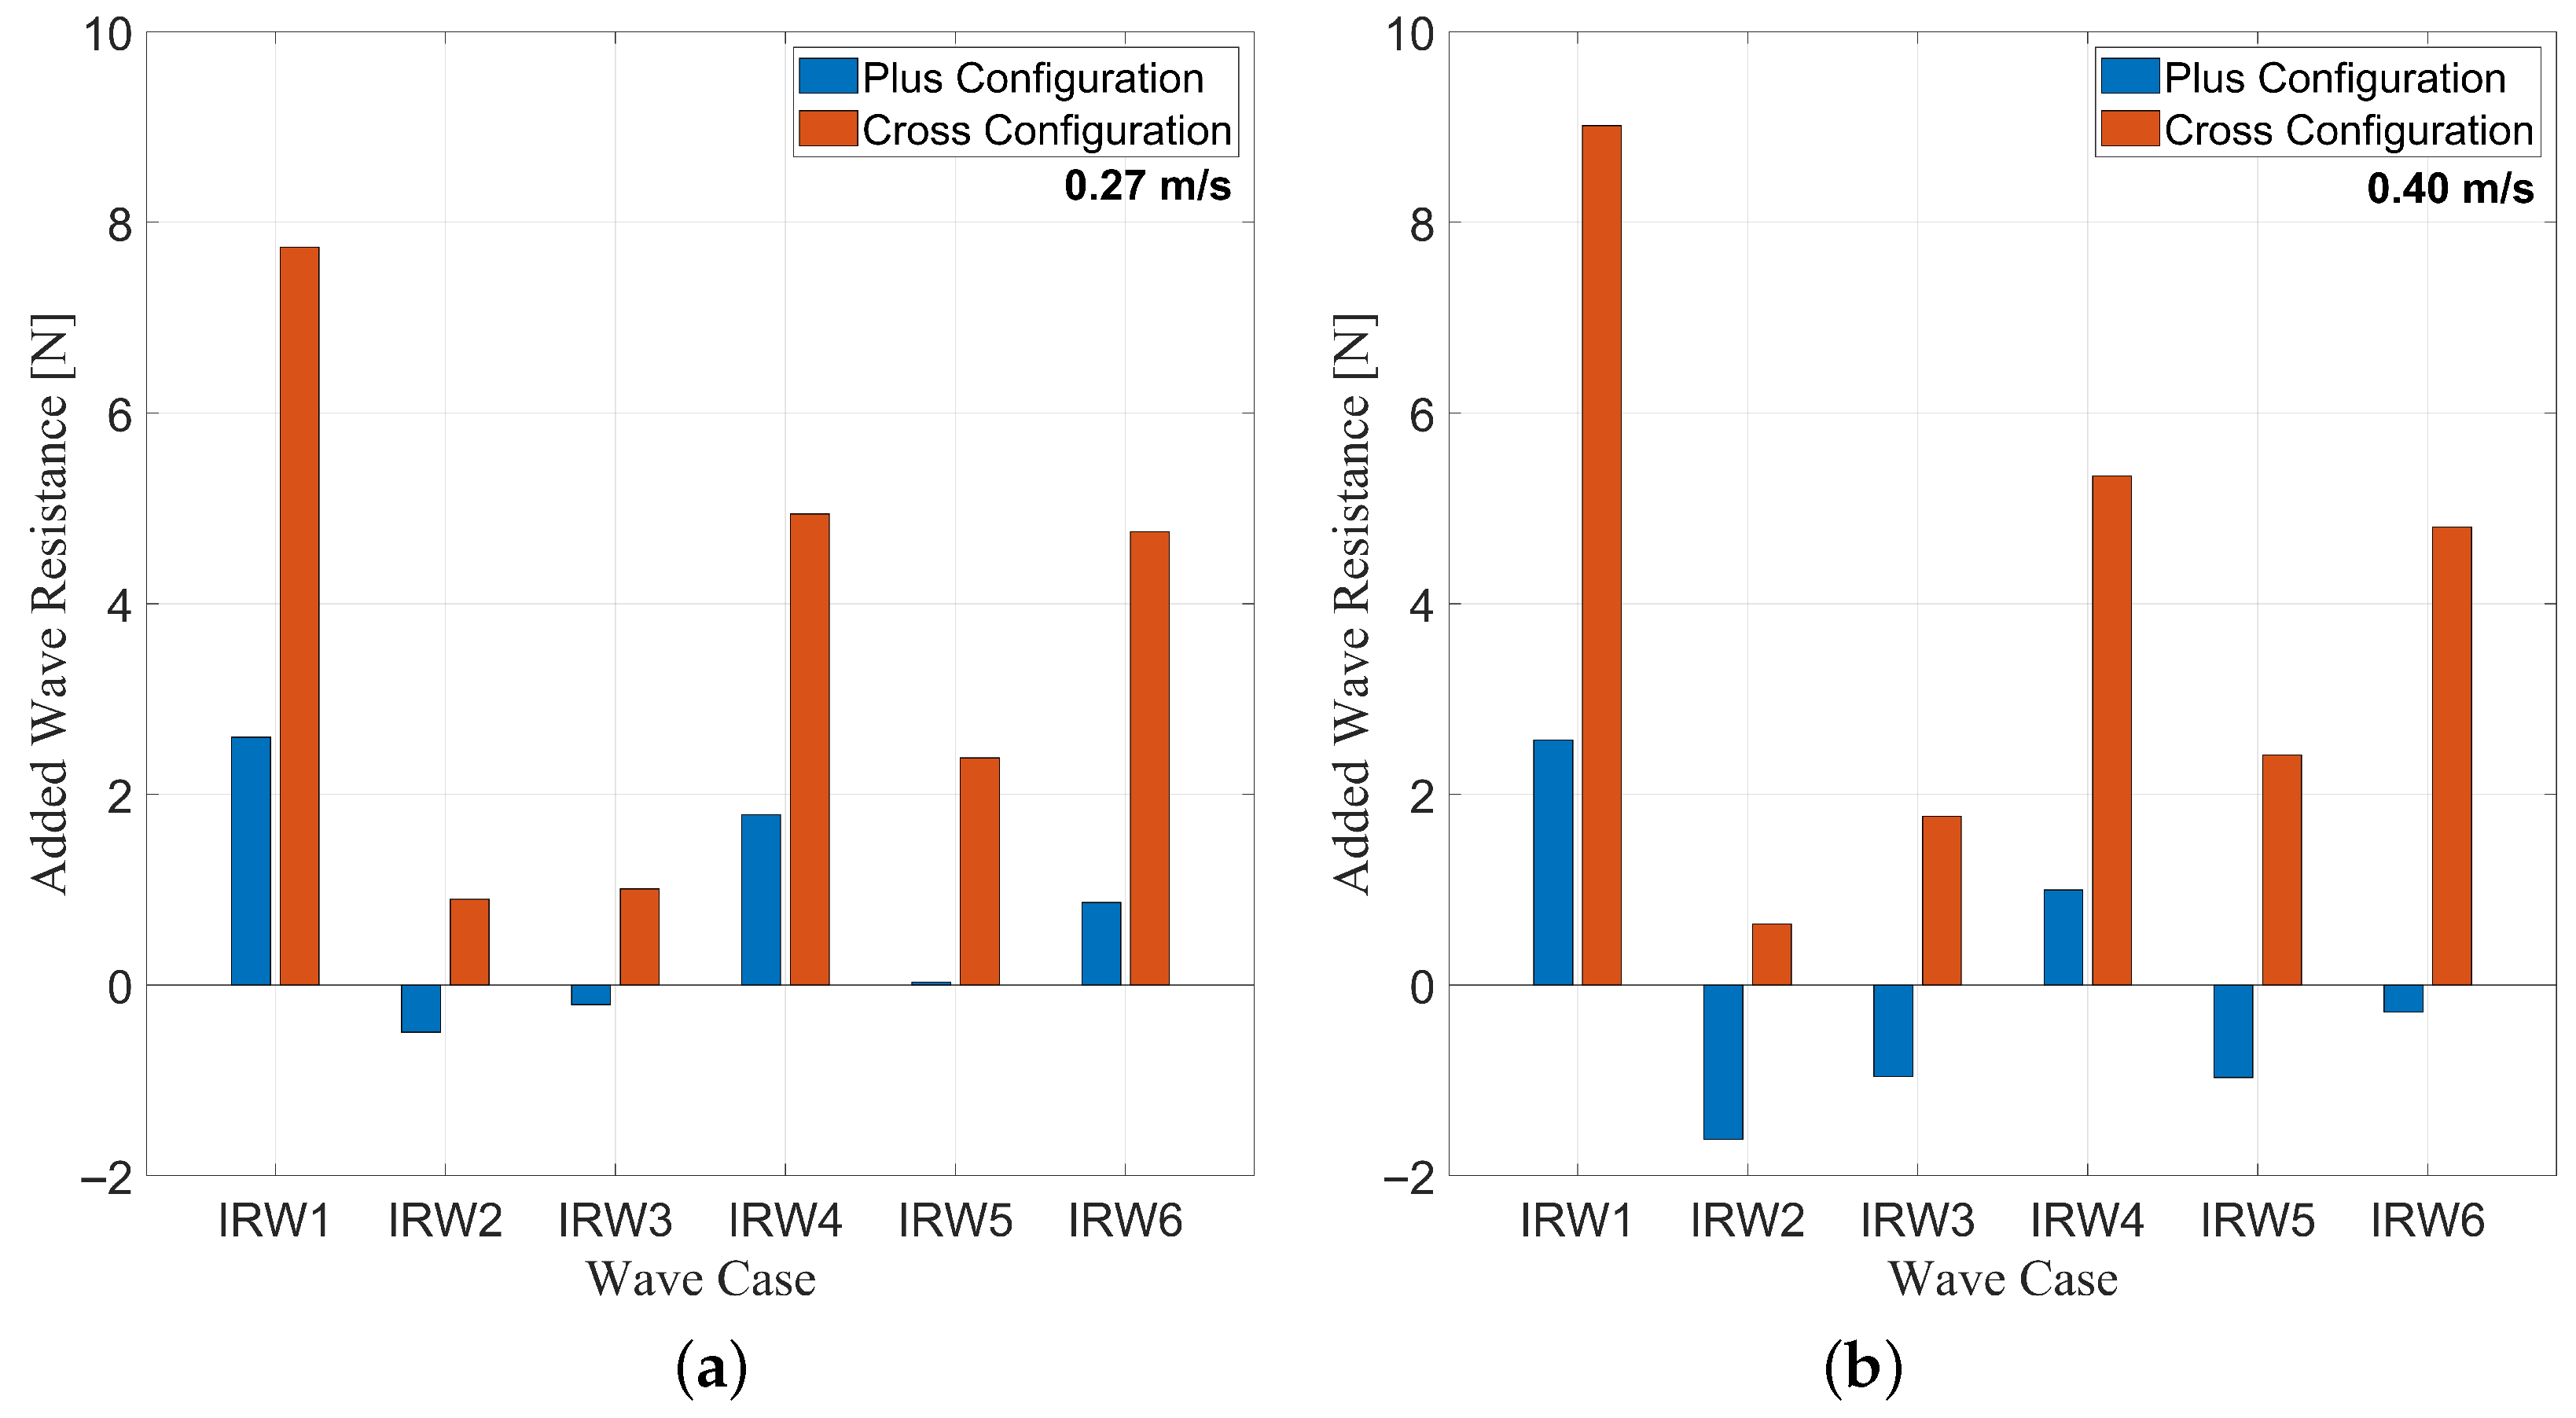
For the irregular wave cases, the added resistance is once again calculated. The added resistances in the
plus and
cross configurations are provided in
Figure 20a and
Figure 20b, respectively.
In the irregular wave cases, the cross configuration exhibited greater added resistance in waves for all cases, as compared to the plus configuration. In cases IRW1 and IRW2 at both tow speeds, the total wave resistance was relatively similar for both orientations. In cases IRW3-IRW6, the cross orientation exhibited greater total wave resistance at both tow speeds.
Added wave resistance in irregular waves generally trended positively with increased significant wave height. The exception to this trend was between case IRW3 and case IRW5. The added resistance was smaller in case IRW5 than in case IRW3 in both orientations and at both speeds, meaning that the difference in peak wave period between the two cases was more significant. The effect of changing peak wave period can also be observed between case IRW3 and case IRW4. In both orientations and at both tow speeds, the added resistance in case IRW3 was greater than that in case IRW4, with case IRW3 having a smaller peak wave period.
The negative added resistance phenomenon was once again observed in the irregular wave cases. The phenomenon occurred in cases IRW1, IRW2, and IRW4 in the plus configuration at both tow speeds. Once again, this only occurred in plus configuration trials.
The added resistance values, especially in the cross configuration, show that there was relatively little change in added resistance between the tow speeds. This result indicates that the dependence on tow speed for added wave resistance is small in the cross configuration for irregular waves. Tow speed has a more significant effect on added wave resistance in the plus configuration.
3.7. Irregular Waves Motions
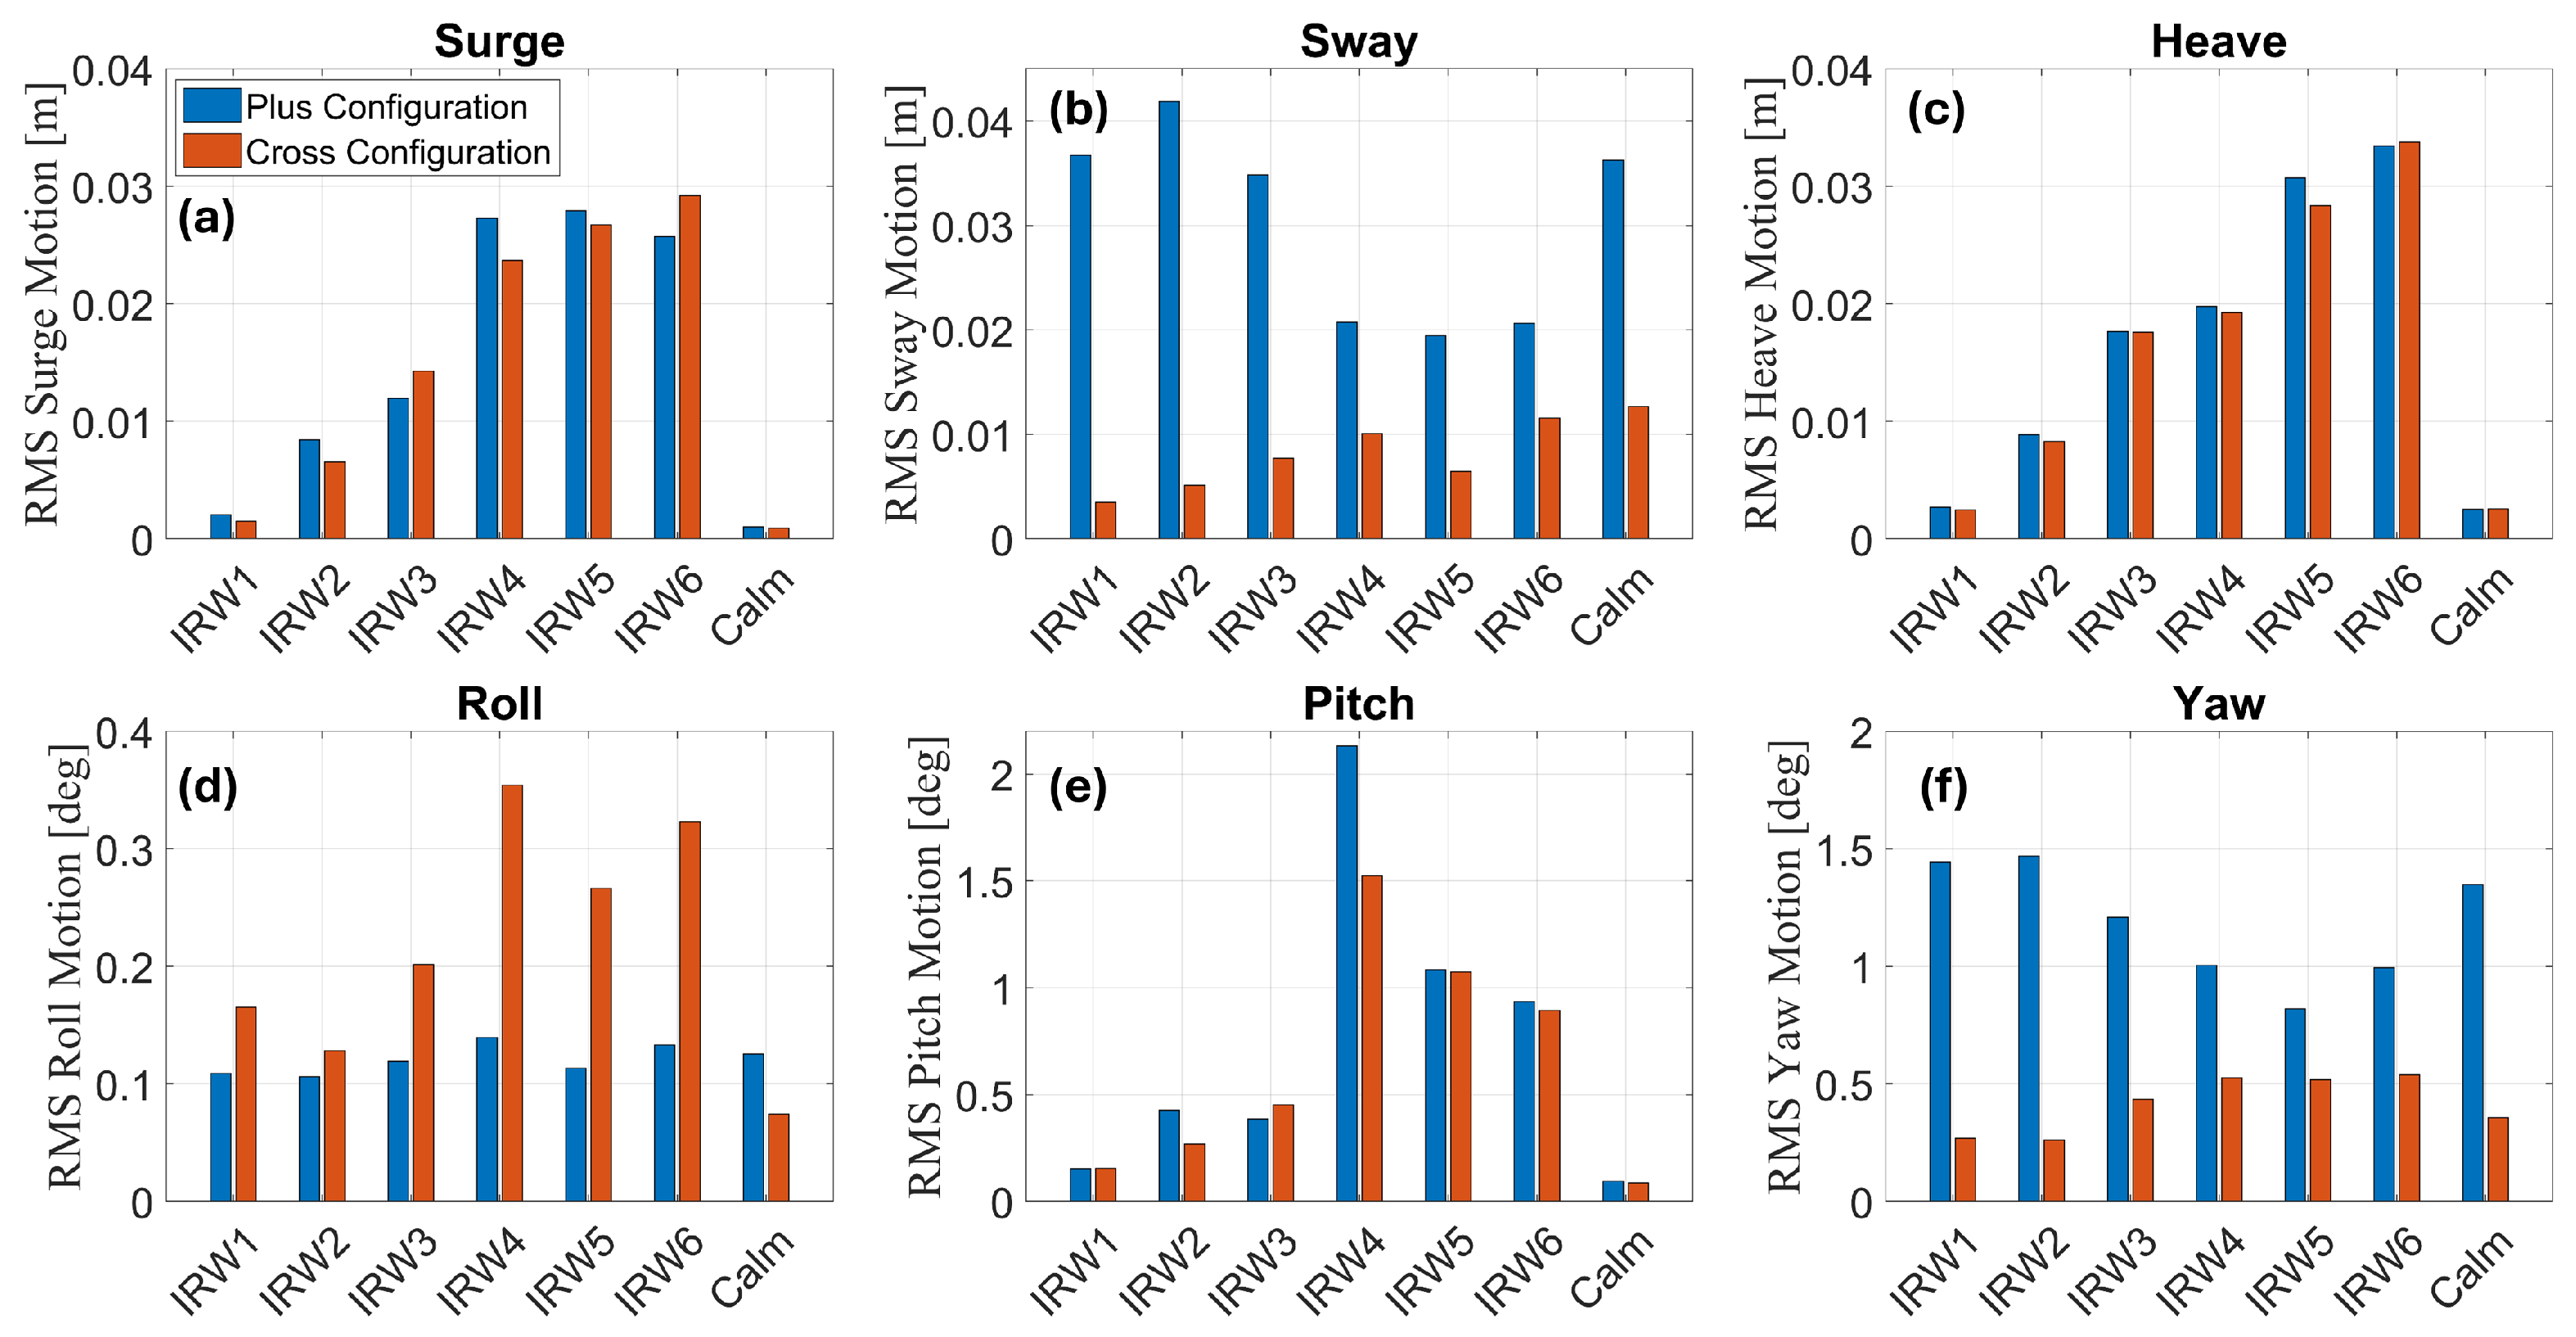
The mean-subtracted RMS motions are presented again for the irregular wave cases. The motions at a 0.27 m/s tow speed are shown in
Figure 21 and at a 0.40 m/s tow speed in
Figure 22.
Surge: The surge response trended positively with both significant wave height and peak wave period, as shown in
Figure 21a and
Figure 22a. The trend with wave height can be seen most clearly between IRW2 and IRW3. Between these two cases, the significant wave height increases and the peak wave period decreases, while the surge motion response increases. The trend with peak wave period can be seen between IRW3 and IRW4, where the significant wave height remains the same and the peak wave period increases, resulting in the surge motion increasing.
Sway and Yaw:Figure 21b and
Figure 22b show that sway motions were generally larger in the
plus configuration in the irregular wave cases. Yaw motions were once again much larger for the
plus configuration in all irregular wave cases due to no towline bridle, as shown in
Figure 21f and
Figure 22f. The sway and yaw motions appear to be coupled for the irregular wave cases. As with the regular waves, the sway and yaw motions decreased from the calm water values in some of the irregular wave cases, indicating wave interaction with FIM.
Heave: As with the regular waves, the heave responses are similar in magnitude for the two configurations, as shown in
Figure 21c and
Figure 22c. There are two observed exceptions in IRW5 and IRW6, where the
plus configuration had slightly larger heave motions than the cross. The magnitude of the RMS heave motion tends to increase roughly linearly with significant wave height. There does not appear to be significant resonant motion on the heave response, which would be expected to occur in IRW3 due to the encounter peak wave period being near the heave natural period.
Roll and Pitch: The roll and pitch motions in both configurations exhibit resonance during IRW4, which has peak wave encounter periods of 2.19 s at the lower tow speed and 2.12 s at the higher tow speed. These encounter periods are near the roll and pitch natural periods of 2.42 s and 2.46 s, respectively.
Figure 21d and
Figure 22d show that the roll responses were once again generally larger in the
cross configuration than the
plus configuration, opposite to the behavior of the configurations in calm water. The pitch responses shown in
Figure 21e and
Figure 22e were generally similar between the configurations, with the
plus exhibiting slightly larger angles in most cases. The roll angles were larger at the higher speed, while the pitch angles were higher at the lower speed. The RMS pitch angle reached a maximum of just above 2° during IRW4 in the
plus configuration.
