Article

Experimental Investigation of Partial Flue Gas Recirculation During Load Changes in a 1 MWth SRF-Fired CFB Combustor

Department of Mechanical Engineering, Institute for Energy Systems and Technology, Technical University of Darmstadt, Otto-Berndt-Str. 2, 64287 Darmstadt, Germany
*
Authors to whom correspondence should be addressed.
Energies 2025, 18(19), 5227; https://doi.org/10.3390/en18195227
Submission received: 24 August 2025 / Revised: 24 September 2025 / Accepted: 29 September 2025 / Published: 1 October 2025
(This article belongs to the Special Issue Biomass Power Generation and Gasification Technology)

Abstract

The increasing share of renewable energy sources in power grids demands greater load flexibility from thermal power plants. Circulating Fluidized Bed (CFB) combustion systems, while offering fuel flexibility and high thermal inertia, face challenges in maintaining hydrodynamic and thermal stability during load transitions. This study investigates partial flue gas recirculation (FGR) as a strategy to enhance short-term load flexibility in a 1 MWth CFB pilot plant fired exclusively with solid recovered fuel. Two experimental test series were conducted. Under conventional operation, where fuel and fluidization air are reduced proportionally, load reductions to 86% and 80% led to operating regime shift. Particle entrainment from the riser to the freeboard and loop seal decreased, circulation weakened, and the temperature difference between bed and freeboard zone increased by 71 K. Grace diagram analysis confirmed that the system approached the boundary of the circulating regime. In contrast, the partial FGR strategy maintained total fluidization rates by replacing part of the combustion air with recirculated flue gas. This stabilized pressure conditions, sustained particle circulation, and limited the increase in the temperature difference to just 7 K. Heat extraction in the freeboard remained constant or improved, despite slightly lower flue gas temperatures. While partial FGR introduces a minor efficiency loss due to the reheating of recirculated gases, it significantly enhances combustion stability and enables low-load operation without compromising fluidization quality. These findings demonstrate the potential of partial FGR as a control strategy for flexible, waste-fueled CFB systems and supports its application in future low-carbon energy systems.

1. Introduction

Circulating fluidized bed (CFB) combustion is a key technology in global power generation, particularly in China, which operates the world’s largest CFB boiler fleet. With over 3500 units accounting for more than 80% of global capacity [1], Chinas installed CFB capacity exceeds 100,000 MWel, contributing approximately 10% of the nation’s total electricity production [1]. Despite ongoing efforts to decarbonize the energy sector, coal-fired power generation still accounted for approximately 34.3% of global electricity production in 2024 [2]. In parallel, wind and solar power have expanded from negligible levels in 2000 to 15.0% of global generation in 2024, coinciding with a doubling of total electricity production in the same period [2]. This development is consistent with the net-zero commitments announced by more than 145 countries, mostly targeting carbon neutrality between 2050 and 2070 [3]. As part of this transition, substituting coal with lower-carbon fuels such as biomass or solid waste, especially in combination with carbon capture and storage (CCS), provides opportunities to significantly reduce or even reverse CO2 emissions [4].
Conventional thermal power plants, however, are expected to remain essential for balancing the growing variability introduced by intermittent renewables, ensuring system reliability and grid stability for the foreseeable future [5]. Until large-scale deployment of energy storage and flexible infrastructure is achieved, the ability of thermal power plants to respond to dynamic load conditions remains critical. For example, limited peak-shaving capacity in regions such as China continues to present operational challenges [6], amplified by the inherent variability of wind and solar resources [7,8,9]. CFB boilers are particularly well-suited for supporting this transition. Compared to conventional grate or pulverized fuel combustion systems, they offer higher fuel flexibility, enhanced combustion efficiency, and inherently low emissions of sulfur dioxide (SO2) and nitrogen oxides (NOx) [10,11,12,13]. These characteristics make CFB technology a promising platform for integrating low-carbon and waste-derived fuels into modern power systems. Comprehensive information on combustion in CFB boilers can be found, e.g., in the work of Kunii and Levenspiel [14,15], Nowak et al. [16] or Oka [17].
Flue gas recirculation (FGR) involves returning a portion of the flue gas, combined with fresh air, to the fluidization medium [18]. One of the first research studies applying FGR to CFB combustion was conducted in the early 1990s to investigate its influence on nitrous oxide formation in CFB boilers [19]. Since then, research has explored its use in pressurized oxyfuel combustion [20] and for temperature control and heat transfer within CFB combustion processes [1,21]. FGR thus represents a promising approach to enhancing combustion stability, particularly under variable conditions.
Although flexible load adaptation was already discussed in early patents such as Kullendorff et al. in 1982 [22], most CFB power plants were originally designed for base-load operation. As a result, flexible operation only gained significant attention within the last decade, driven by the rapid growth of renewable energy sources. CFB boilers, in particular, face considerable challenges in adapting to flexible operation due to their high thermal inertia. This is primarily caused by the large inventory of bed material, including ash, unburned char, unreacted calcium-based desulfurizer, and make-up sand. This bed inventory acts as a thermal buffer, which significantly influences load-following capabilities and makes rapid and stable load adjustments challenging.
While modifications to bed material composition, as proposed by Kullendorff et al. [22], can help shift the operational regime in the Grace diagram, these changes are slow and not suitable for short-term load variations. The operational flexibility of CFB boilers has lately been the subject of extensive research, primarily focusing on process control strategies [23,24,25,26,27] and, to a lesser extent, modifications to commercial-scale units [25]. Previous studies have explored various approaches to enhance load adaptability, including reducing bed particle size, optimizing air distribution, and modifying separator efficiency [22,25,28,29,30]. However, achieving stable operation at reduced loads without additional process control strategies has proven difficult. Low-load operation is associated with reduced furnace outlet temperatures and pressure, as well as localized heat accumulation in the lower furnace [25]. Prolonged operation under these conditions can lead to severe damage to heating surfaces, raising safety concerns [25]. Moreover, such operation presents additional technical challenges including instability in fluidization, fluctuations in bed temperatures, formation of bed agglomerates, and the risk of flame extinction [31].
While most studies have focused on coal as primary fuel [23,24,25,26,31,32,33], investigations into load transitions at 1 MWth pilot scale have also been conducted for co-firing lignite with biomass and waste, with their shares reaching up to 23% and 22% by weight, respectively [30,34,35]. Alobaid et al. [35] showed that co-combustion of lignite and straw leads to a stable bed temperature with decreasing freeboard temperatures, while lignite with waste-derived fuel causes more pronounced simultaneous temperature fluctuations in both regions.
However, limited research has been performed on load change behavior in CFB systems operating exclusively on fuels with high shares of volatile content, such as biomass or solid recovered fuel (SRF). Even though SRF is a standardized form of Refuse Derived Fuel (RDF), as defined by the European norm EN ISO 21640:2021 [36,37], its composition and physical properties can be subject to fluctuations due to the large variation in source streams [38]. SRF is mostly produced from municipal solid waste (MSW) and commercial and industrial waste (CIW) and contains biogenic components like paper, cardboard, and wood or fossil-based components like plastic and rubber [36], with the biogenic content typically ranging between 40% and 80% [39]. The high biogenic content of SRF makes it a suitable substitute fuel for conventional fuels, as a combination with carbon capture and storage allows for zero or even negative CO2 emissions [40,41,42,43,44]. Nevertheless, the transition to SRF alters the feedstocks composition with higher shares of chlorine, calcium or organically bound carbon [45]. This can lead to increased corrosion [46] or even tar formation, in cases where the increased volatile share leads to incomplete combustion inside the CFB boiler [47,48]. Trace elements, such as As, Cd, Cr, Pb, Sb, and Zn were additionally found to be increased when SRF is implemented as a feedstock [49]. The lower ash fraction of SRF compared to conventional fuels like coal has additionally been shown to lead to a reduction in the amount of bed material in the CFB boiler, necessitating a revision of the material extraction frequency while simultaneously avoiding the build-up of agglomerates [47]. The transition to SRF additionally alters the feedstocks elemental composition, leading to a reduction in carbon inventory in the dense bed zone. A lower carbon content is expected to reduce thermal energy storage within the bed, while the higher volatile content and faster reaction kinetics of SRF can intensify hydrodynamic and thermodynamic fluctuations during load transition. Previous research suggests that a transition to SRF also leads to an upward shift of the combustion zone within the reactor and a decrease in bed homogeneity [47]. Despite the challenges in the combustion process, SRF is an important feedstock for reducing CO2 emissions in CFB power plants.
Prior studies have demonstrated that when the fuel input is reduced, a proportional reduction in total fluidization air can significantly affect hydrodynamic conditions [30,33]. Specifically, a decrease in air supply lowers particle entrainment from the bed zone to the lean zone, leading to increased bed temperatures and simultaneous cooling of the freeboard region in the CFB combustor [30,33]. Furthermore, a substantial reduction in primary air is hypothesized to induce a transition from CFB to bubbling fluidized bed (BFB) operation [33], although experimental validation of this transition remains limited. Stefanitsis et al. [28] confirmed such transitions using a 1-D Apros simulation of a 300 MWth CFB unit, showing that the system behaves as a BFB at 60% load and reverts to CFB mode at 100% load. The same study reveals an enhanced ramp rate of up to 6.2%/min through extraction of 20–40% of the bed material. Even though this value exceeds the maximum reported load change rate for CFB plants of 4%/min and of pulverized coal combustion (5%/min) [11], such strategies are not applicable for short-term load adjustments as investigated in this study.
Alternative load response enhancements have been tested in coal-fired systems. Liu et al. [50] showed that feeding pulverized coal into the secondary air zone of a 240 t/day CFB boiler improves load response with only minor NOx increases, regulatable by standard emission systems. Similarly, Song et al. [51] demonstrated that blending granular and pulverized coal significantly improves ramp rates and reduces NOx emissions in a 2 MWth CFB unit. However, these approaches are not transferable to SRF combustion, as waste-derived fuels cannot be pulverized as easily as coal.
Moreover, system-level effects of load transitions have been reported by Tang et al. [52], who observed reduced upper reactor temperatures, lower pressure differentials indicating reduced particle circulation, and a decline in combustion efficiency under partial load. All of this supports the hypothesis that thermal and hydrodynamic instability increases under reduced loads. Neshumayev et al. [53], although focused on pulverized oil-shale boilers, showed that cyclic load changes (100%–50%–100%) increased fuel consumption by 4%, indicating an efficiency penalty common to thermal systems under dynamic operation.
Recent studies have also proposed hybrid system configurations to improve load flexibility. Zhu et al. [54] suggested using the CFB combustor solely for preheating, with full combustion occurring in a separate pulverized coal (PC) boiler. Hui et al. [55] introduced a concept where a CFB unit is placed before a PC boiler to gasify the fuel, producing gas and char, which are subsequently combusted in the PC boiler. Tang et al. [56] expanded on this idea, using two CFBs in series. The first operating under sub-stoichiometric conditions (lambda ~ 0.3−0.4) to produce coal gas and reactive char, and the second performing complete combustion. While these methods demonstrate improved load response times, they inherently require additional boilers and subsystems, increasing capital expenditures (CAPEX), operational expenditures (OPEX), e.g., in the form of the amount of fluidization medium, and system complexity. Therefore, although such hybrid configurations are promising for fossil fuels, their applicability to SRF is limited due to fuel heterogeneity, high ash content, and incompatibility with staged or gasification-based combustion modes. These constraints make the proposed methods unsuitable for waste-derived fuel combustion in CFB units.
The literature review shows a broad basis for load step tests in CFBS based on simulations as well as with conventional feedstocks such as coal. This study, in contrast, presents the first experimental investigation of load transitions in a pilot scale CFB combustor (1 MWth) fueled exclusively by 100% SRF. To investigate the challenges associated with SRF utilization, this study examines the role of partial Flue Gas Recirculation (FGR) in stabilizing hydrodynamic and thermodynamic conditions during load transitions. In contrast to conventional strategies, where the fluidization air is reduced in direct proportion to the fuel input, partial FGR introduces an alternative operational approach. By maintaining total fluidization rates at levels comparable to 100% load conditions while replacing a proportion of fresh air with recirculated flue gas, partial FGR is expected to mitigate hydrodynamic instability and improve temperature control. This study aims to enhance short-term operational stability at reduced loads, offering new insights into the dynamic behavior of CFB combustion systems fueled entirely by waste-derived fuel.

2. Experimental Section

2.1. Layout of 1 MWth Pilot Plant

The 1 MWth CFB pilot facility used in this study is schematically depicted in Figure 1. The vertically oriented reactor is fully lined with refractory material, measuring 8.6 m in height and 590 mm in internal diameter. Fuel and bed material are introduced through dedicated feeding systems situated above the return leg, which connects the loop seal to the lower reactor section. A propane burner is available for startup and heating but is shut off during load step investigations. The system permits flexible operation of the fluidization medium, allowing both primary and secondary fluidization lines, which are introduced 2.54 and 6.00 m above the nozzle gid, to be electrically preheated and operated with either fresh air, recirculated flue gas, or a mixture of both. Multiple measurement points along the plant continuously monitor gas composition (see Table 1). Oxygen (O2) concentrations in the primary and secondary fluidization medium are recorded using paramagnetic sensors, and carbon dioxide (CO2) is measured using nondispersive infrared (NDIR) technology. Volumetric flow rates are captured by venturi flow meters and orifice plates. Downstream, the flue gas stream is further analyzed for O2, CO2, CO, NO, and SO2 using paramagnetic and NDIR sensor. Water vapor content is determined behind the induced draft (ID) fan.
Critical process variables, including temperature distribution, pressure drop across the bed, and fluidization characteristics, are monitored using a network of thermocouples, differential pressure sensors, and gas analyzers. The thermocouples operate according to the Seebeck effect and maintain a maximum relative uncertainty of ±0.4% of the temperature reading [34]. Pressure measurements are based on the piezoresistive sensors with an uncertainty margin of ±0.5% of the measured pressure [34].
To influence axial temperature profiles, up to five cooling lances can be inserted into the reactor from the top, extending as deep as 6.5 m. Additional information regarding the pilot facility’s technical specification can be found in publications from Alobaid et al. [33,35], Kuhn et al. [47,57,58], and Peters et al. [30,32,34].

2.2. Materials

Quartz sand was employed as the bed material, with a bulk density of 1375 kg/m3 and a mean particle size of 199 µm (10th percentile = 138 µm, 90th percentile = 291 µm). The initial system inventory was set at 400 kg. During subsequent operation, the sand addition rate was set to 27 kg/h to maintain a reactor pressure drop of roughly 50 mbar [30]. Concurrently, excess bed material was removed to avoid obstructions from SRF deposits (metal, ceramics, glass) and potential agglomeration. This removal strategy was also applied during load step tests to maintain approximate balance between sand input and extraction at each operating condition (see Table 2).
The fuel used was a commercially sourced SRF with a lower heating value of 20.9 MJ/kg. It consists of a mixture of MSW and ICW from a metropolitan area in central Germany. Properties such as proximate and ultimate composition, as well as energy content, were characterized based on samples collected over the full campaign. For the present SRF, no inductively coupled plasma or combustion ion chromatography was performed, as the focus of this work is not on investigating the influence of tar, ash or trace elements. While data specific to the load step intervals were unavailable, average values for the entire 10-day test duration are used as representative in Table 3.

2.3. Operating Conditions

The experimental campaign, including the load step tests, was conducted over a continuous 10-day period, operating in three shifts to enable uninterrupted 24-h/day testing. Before initiating the load step sequences, the system underwent a conditioning phase, during which co-combustion tests using varying shares of coal and SRF were performed [47]. To ensure stable combustion dynamics, the plant transitioned to 100% SRF firing approximately 30 h before commencing the load step experiments.

2.4. Load Step Methodology

The load step tests began following stabilization of the reactor at full-load (100%) operation. In total, five sequential load transitions were executed to compare two operational strategies: conventional air-based control and operation incorporating partial FGR. Average values of key reactor parameters for each steady-state condition are provided in Table 2.
Initially, the thermal load was reduced from 100% to 86%, and then to 80%, with the total fluidization rate proportionally adjusted to the fuel input. This conventional method served as a baseline for evaluating impacts on combustion dynamics and fluidization stability.
In the third test, the load was returned to 86%, but with FGR implemented to maintain full-load fluidization conditions. The adjustment was carried out by:
  • Calculating the oxygen demand for the reduced load based on the full-load equivalence ratio (λ)
  • Adjusting the air supply composition to maintain the same λ value
  • Replacing a proportion of the fresh air with recirculated flue gas while keeping the total volumetric fluidization rate equivalent to that at 100% load
To ensure consistent initial conditions for each trial, the system was restored to 100% load before conducting additional steps. In the fourth step, the load was again reduced to 80%, this time with partial FGR applied, preserving the total fluidization rate and λ. This allowed assessment of whether FGR can mitigate fluidization disturbances during load reductions. The final step involved returning the reactor to full-load conditions.
Before each load change, the system was allowed to reach a steady state. Throughout the tests, key variables such as gas concentrations (O2, CO2, CO, NO, SO2), temperature distributions, and pressure profiles were continuously recorded. These measurements enabled evaluation of the comparative performance of the two operational strategies in terms of combustion stability and hydrodynamic behavior during transient operation.

3. Results and Discussion

The evaluation of the load step tests is organized into two groups, separated by an intermediate heating phase. The first group comprised two load reductions to 86% and 80% of full load without FGR, followed by a subsequent return to 100% load under partial FGR conditions. The second group begins with the intermediate heating phase, after which the load is reduced to 80% with FGR, and subsequently increased back to 100%.

3.1. Load Step Test Period 1

The results of the load step tests 1−3 are presented in Figure 2, Figure 3, Figure 4, Figure 5 and Figure 6. The time periods highlighted in grey in Figure 2 and Figure 3 denote the stable operating phases corresponding to each load condition. Figure 4, Figure 5 and Figure 6 display average values of the stable operating phases.
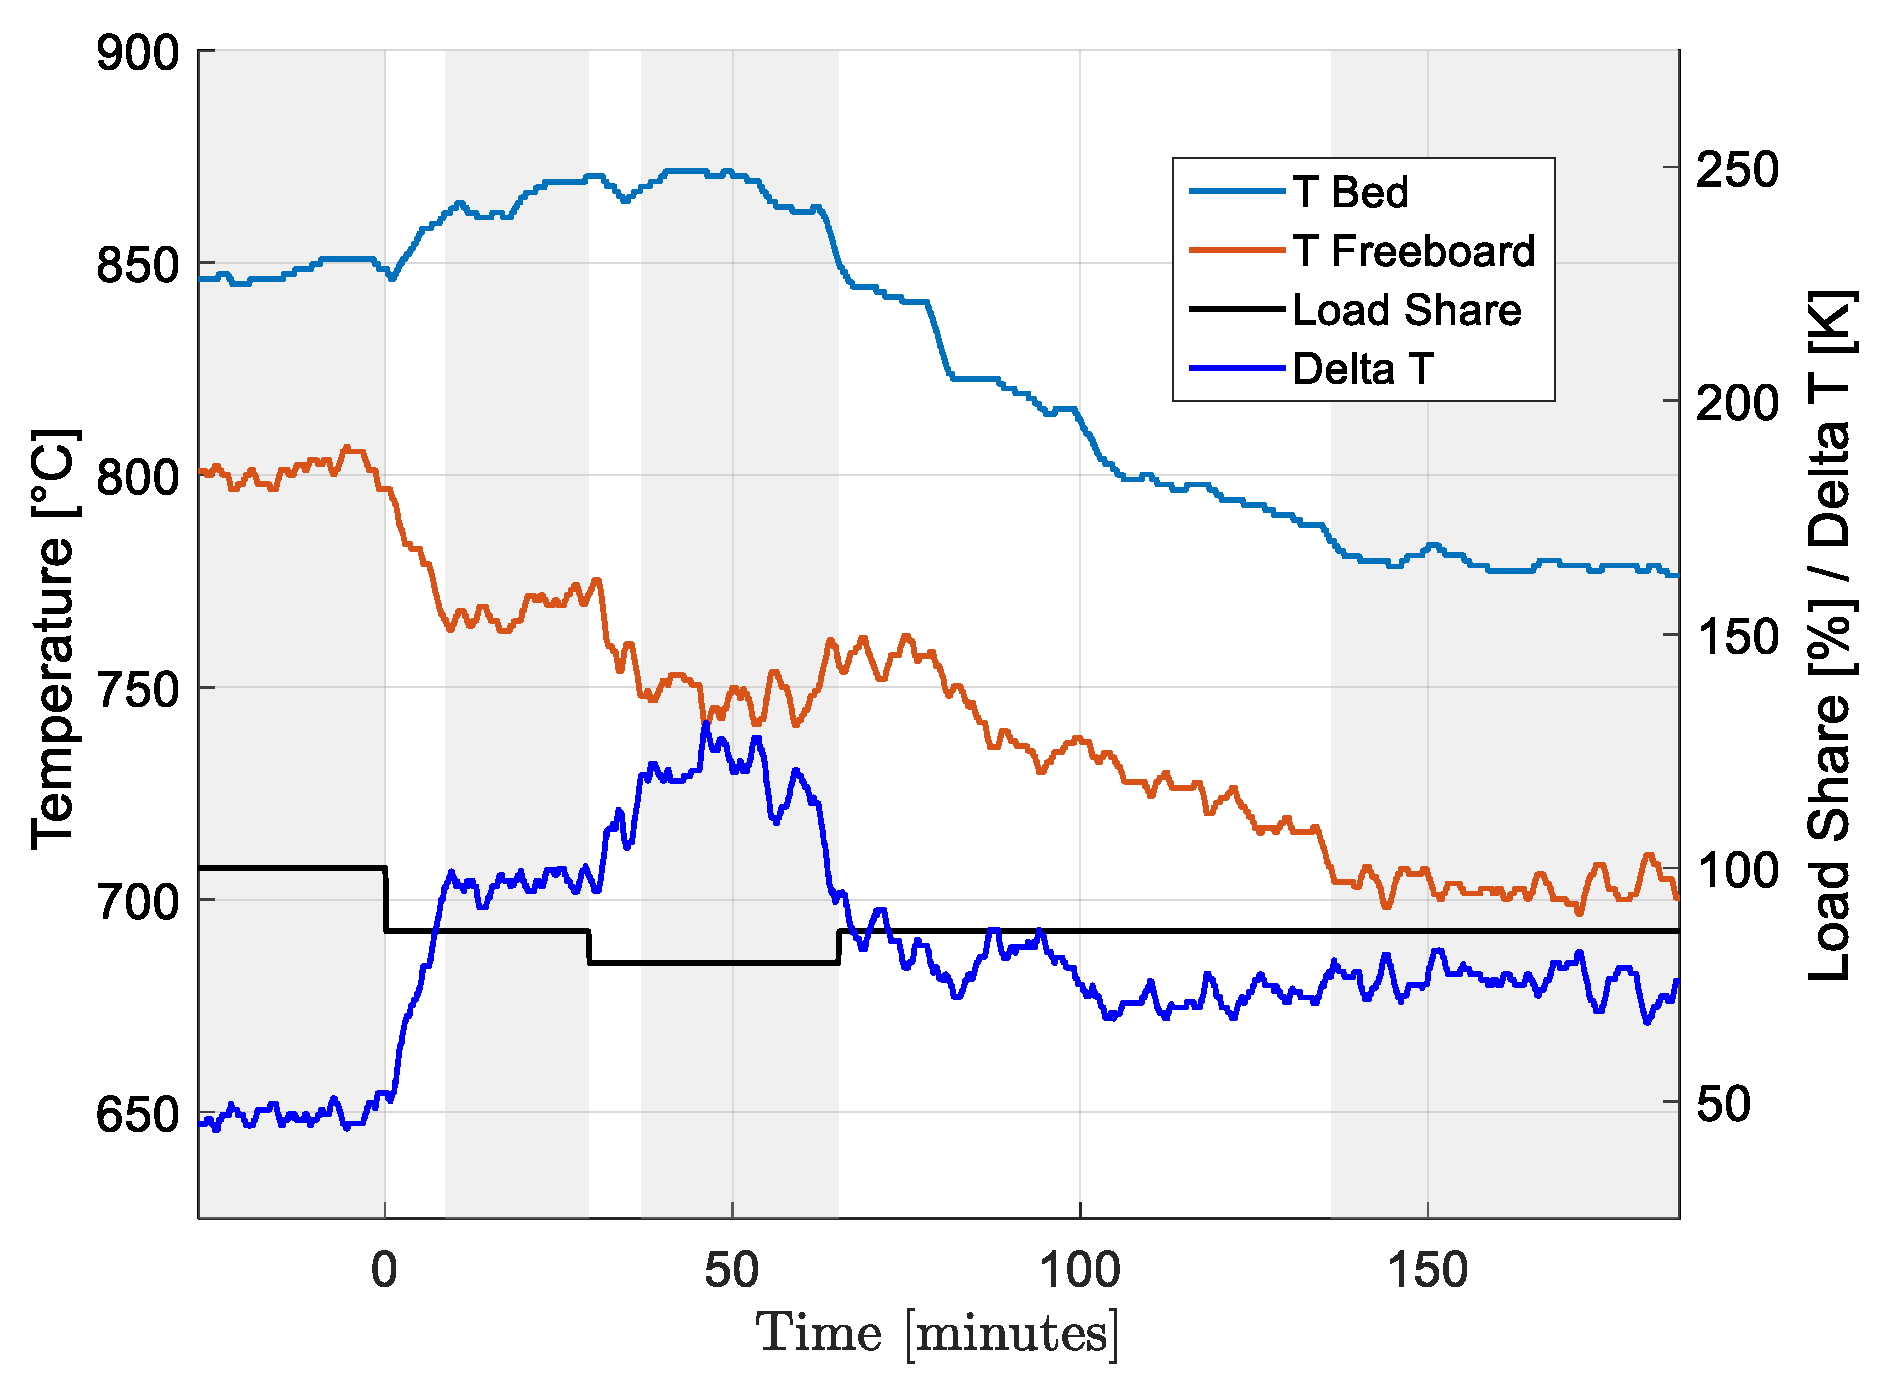
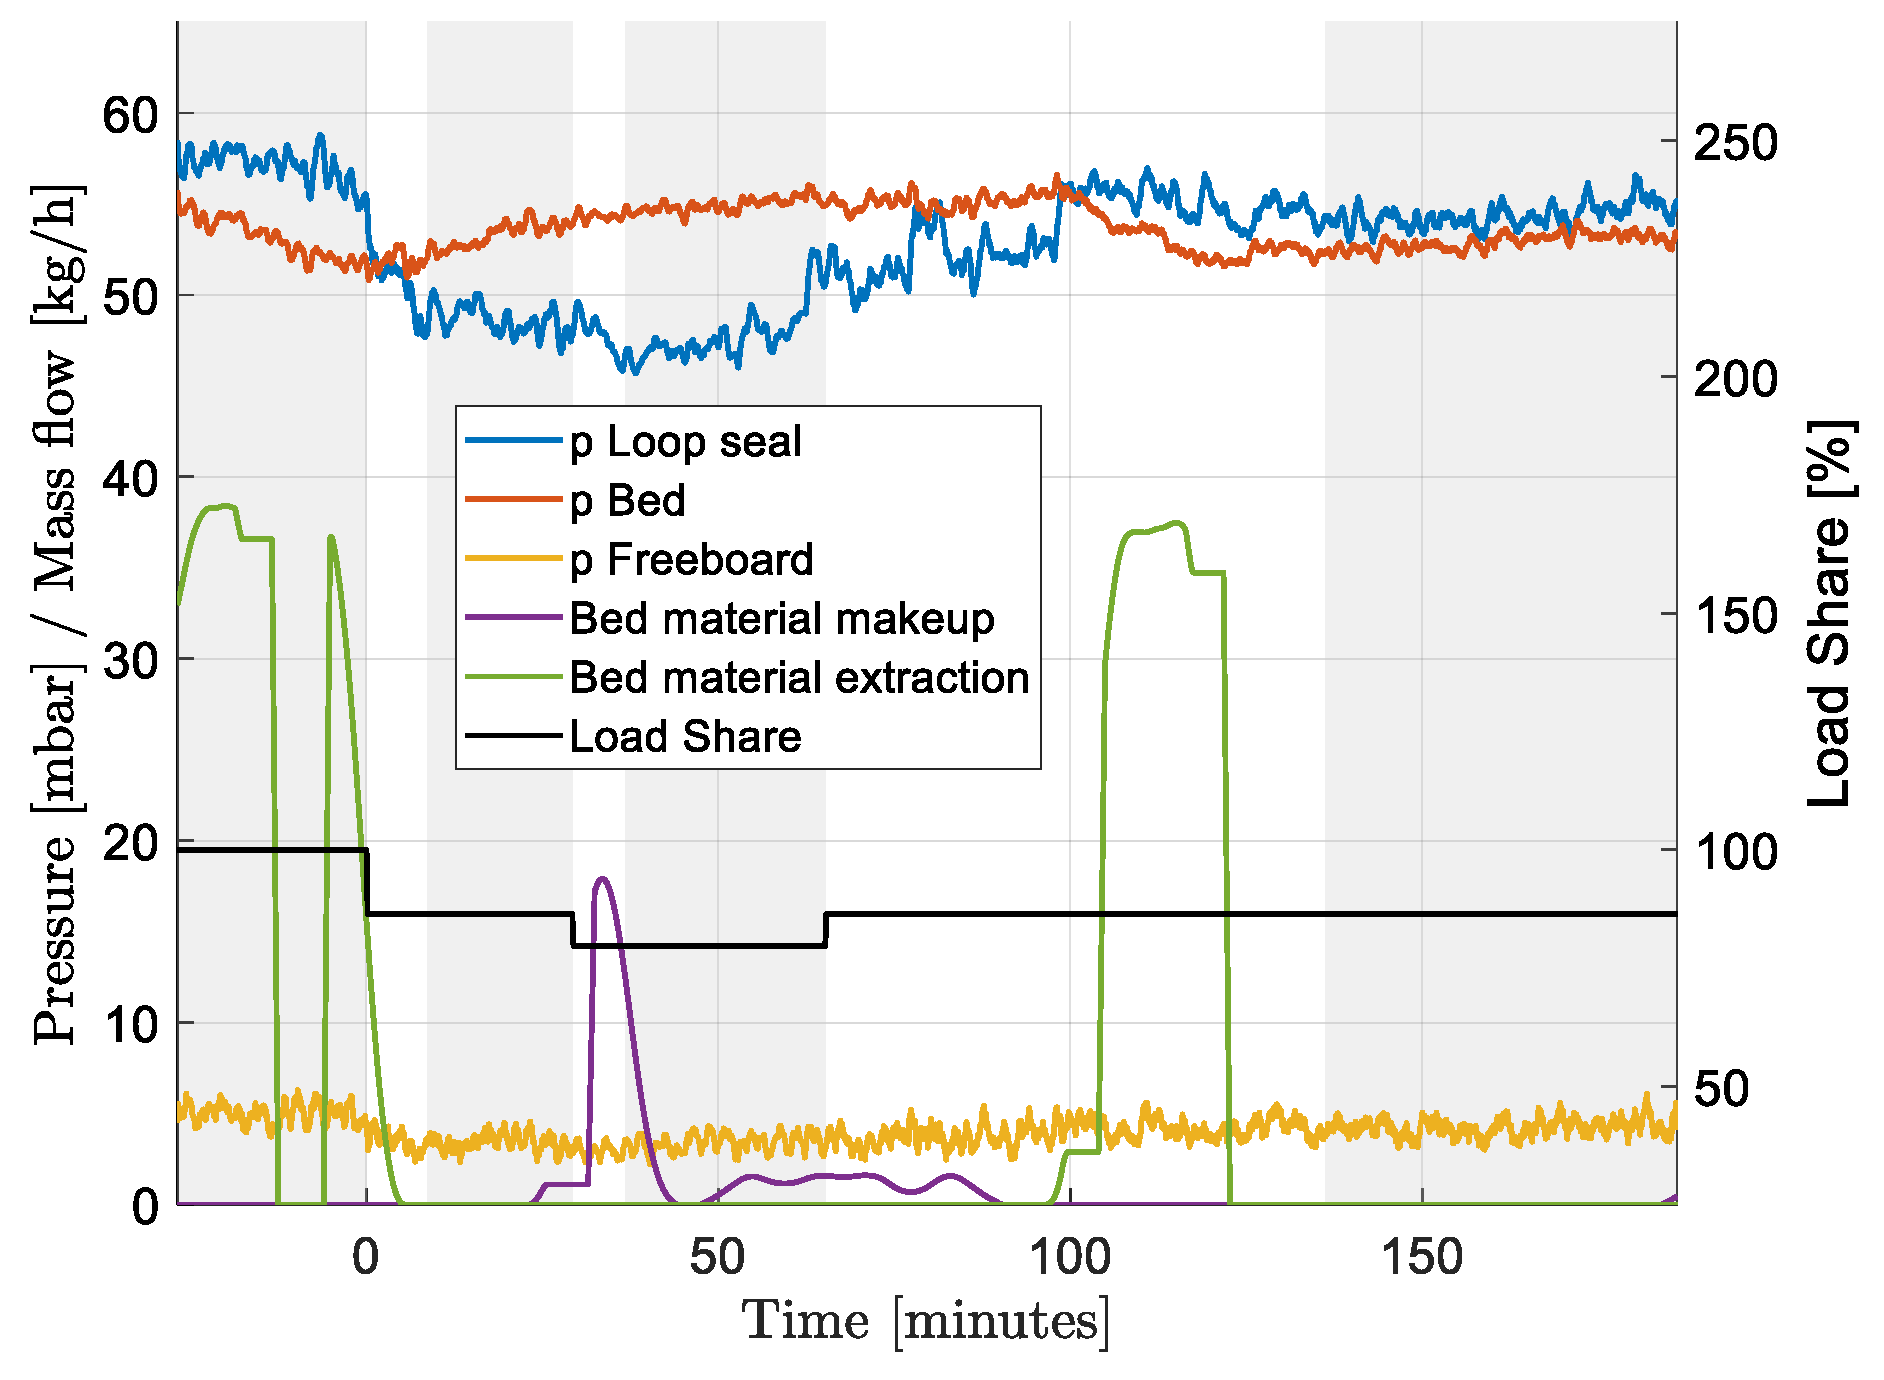
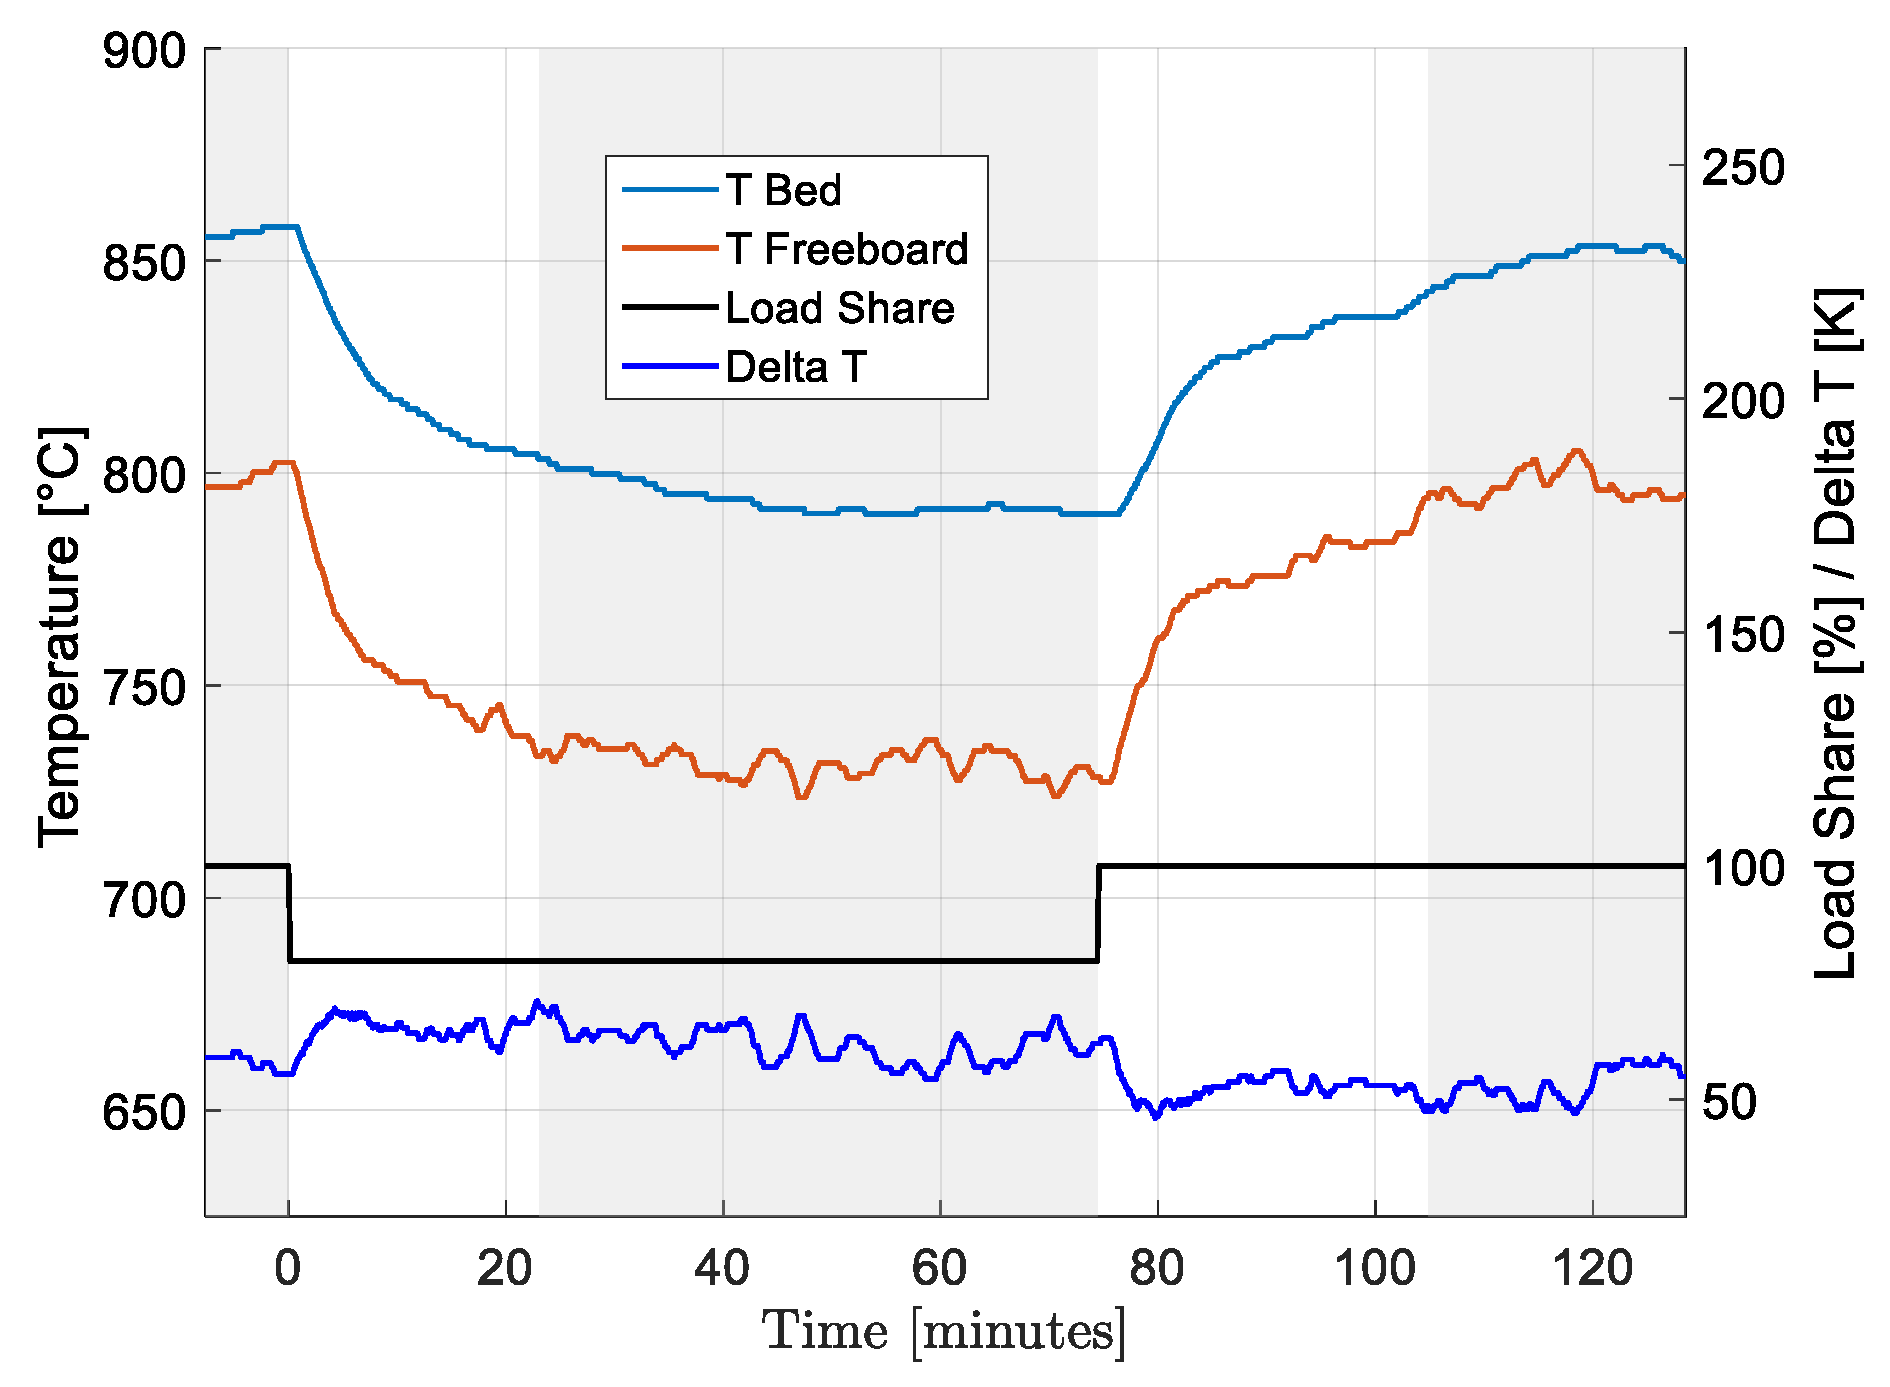
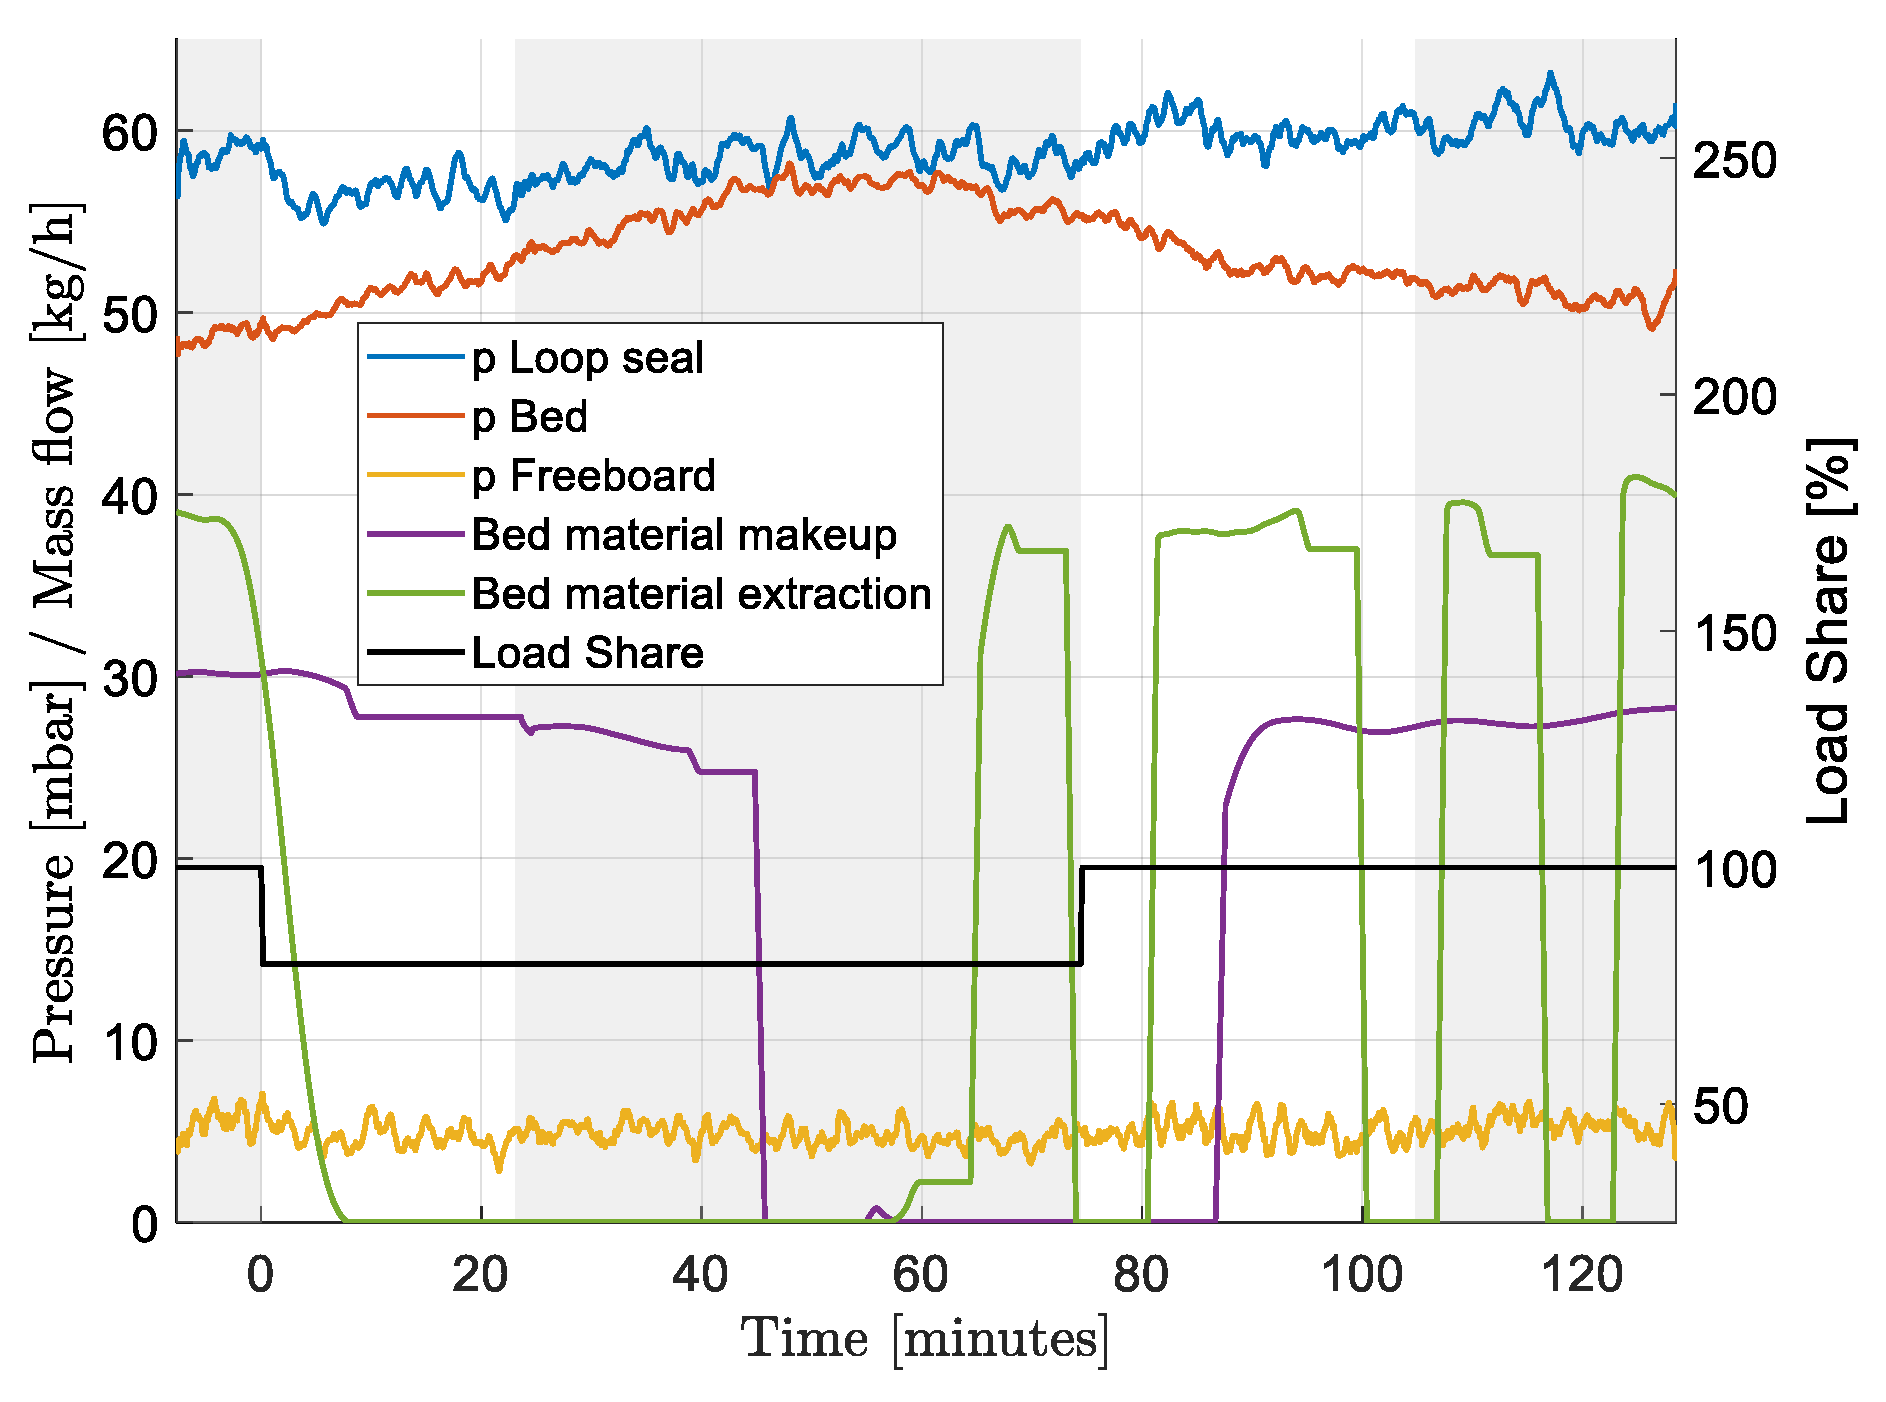
Figure 2 illustrates the temperature profiles in both the bed and freeboard zone (left y-axis), as well as the load share and the corresponding temperature difference between the two zones (right y-axis). Figure 3 presents the load share (right y-axis) alongside pressure measurements recorded in the loop seal, bed area, and the freeboard zone, as well as the feed rate of make-up sand and the extraction rate of bed material (all plotted on the left y-axis).
Prior to the first load step test, the system operated under stable conditions, with average temperatures of 848 °C in the bed zone and 801 °C in the freeboard. The observed temperature difference is attributed to the cooling lances, which are introduced from the top of the reactor and do not extend into the bed zone. During this initial phase, pressures in the bed area and loop seal exhibited a slight decline due to ongoing bed material extraction, while pressure in the freeboard zone remained stable. The extraction process was haltered prior to the first load reduction.
At t = 0, the first load step is initiated, reducing the load from 100% to 86%, accompanied by a proportional reduction in the fluidization medium. This transition induces a distinct thermal response where the bed temperature increases while the freeboard temperature declines, resulting in an approximate doubling of the temperature difference to ~ 100 K. These observations are consistent with previously reported findings [25,30,33]. Simultaneously, a shift in the pressure profiles is observed. The pressure measurements in the loop seal and freeboard zones decrease, whereas the ones in the bed zone increase. This behavior reflects a hydrodynamic transition within the combustion system, driven by reduced particle entrainment from the bed into the freeboard due to decreased primary (PA) and secondary air (SA) flows. As a result, fewer particles reach the upper reactor zone and subsequently the loop seal. Despite this, fluidization at the loop seal remains constant, allowing continued particle transport from the loop seal back to the bed. It is important to note that pressure changes within the bed or freeboard zones do not necessarily correspond to proportional changes in the loop seal, due to differences in geometry and flow dynamics across these regions.
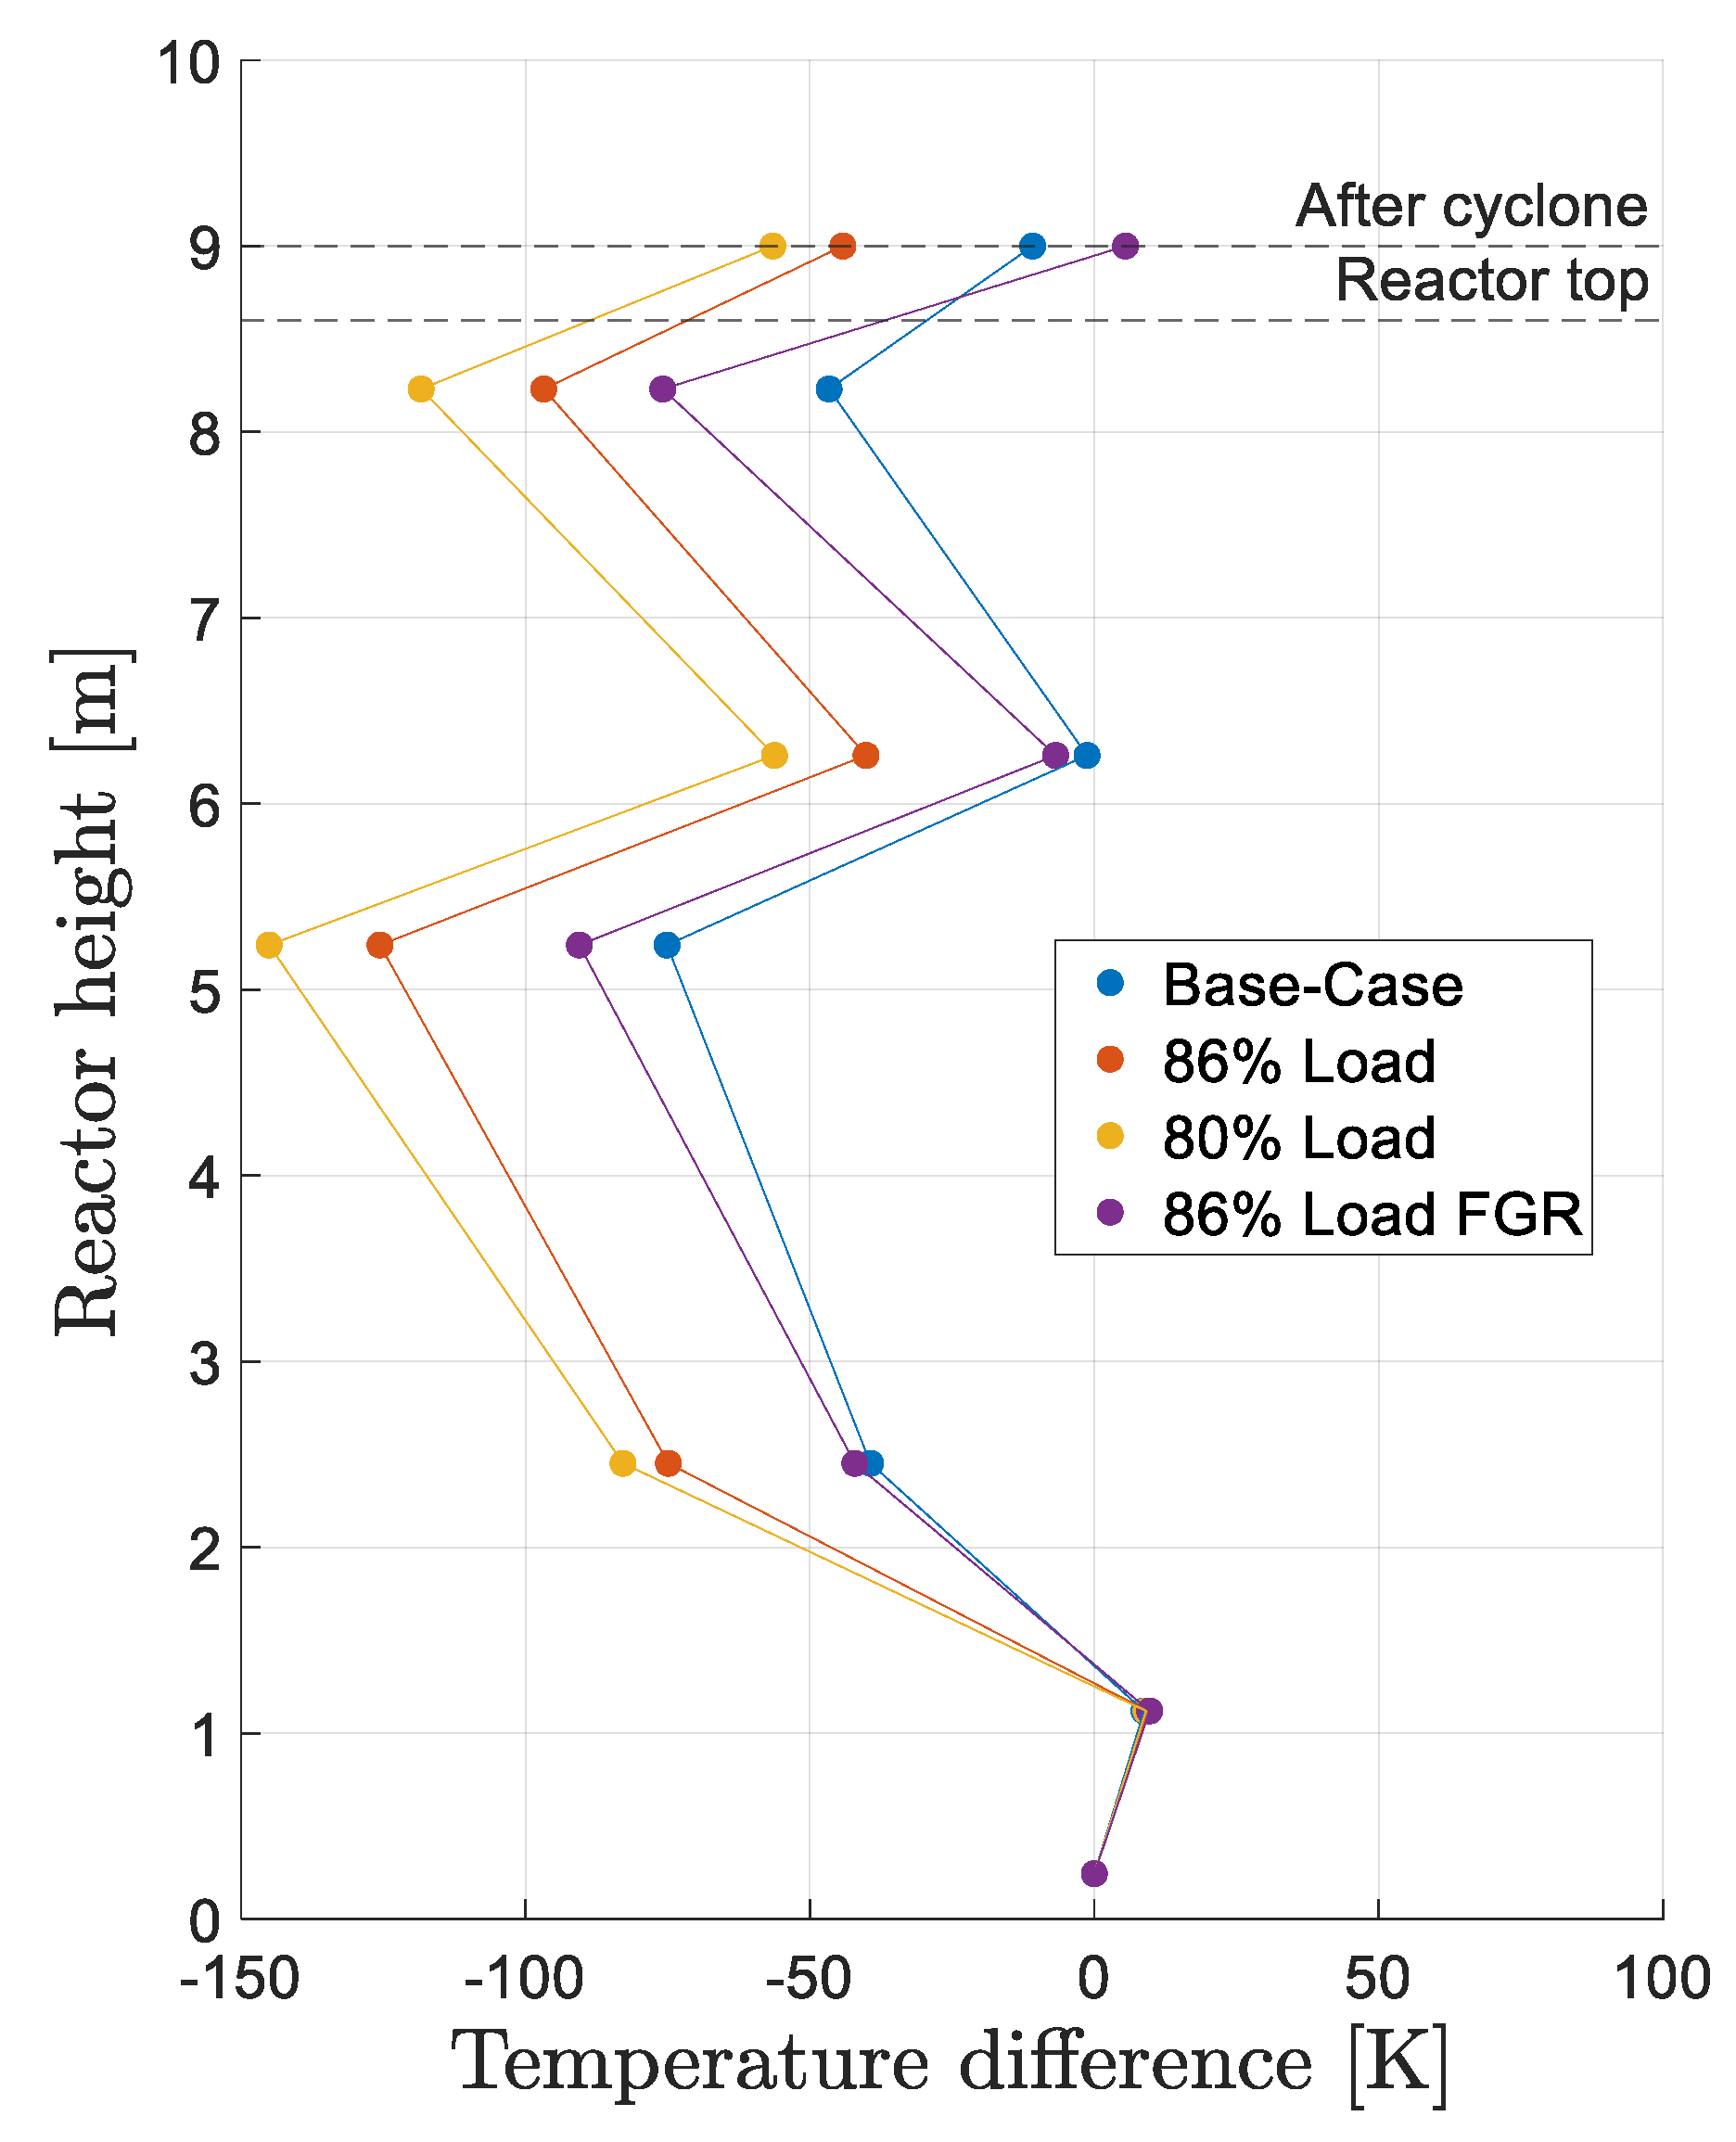
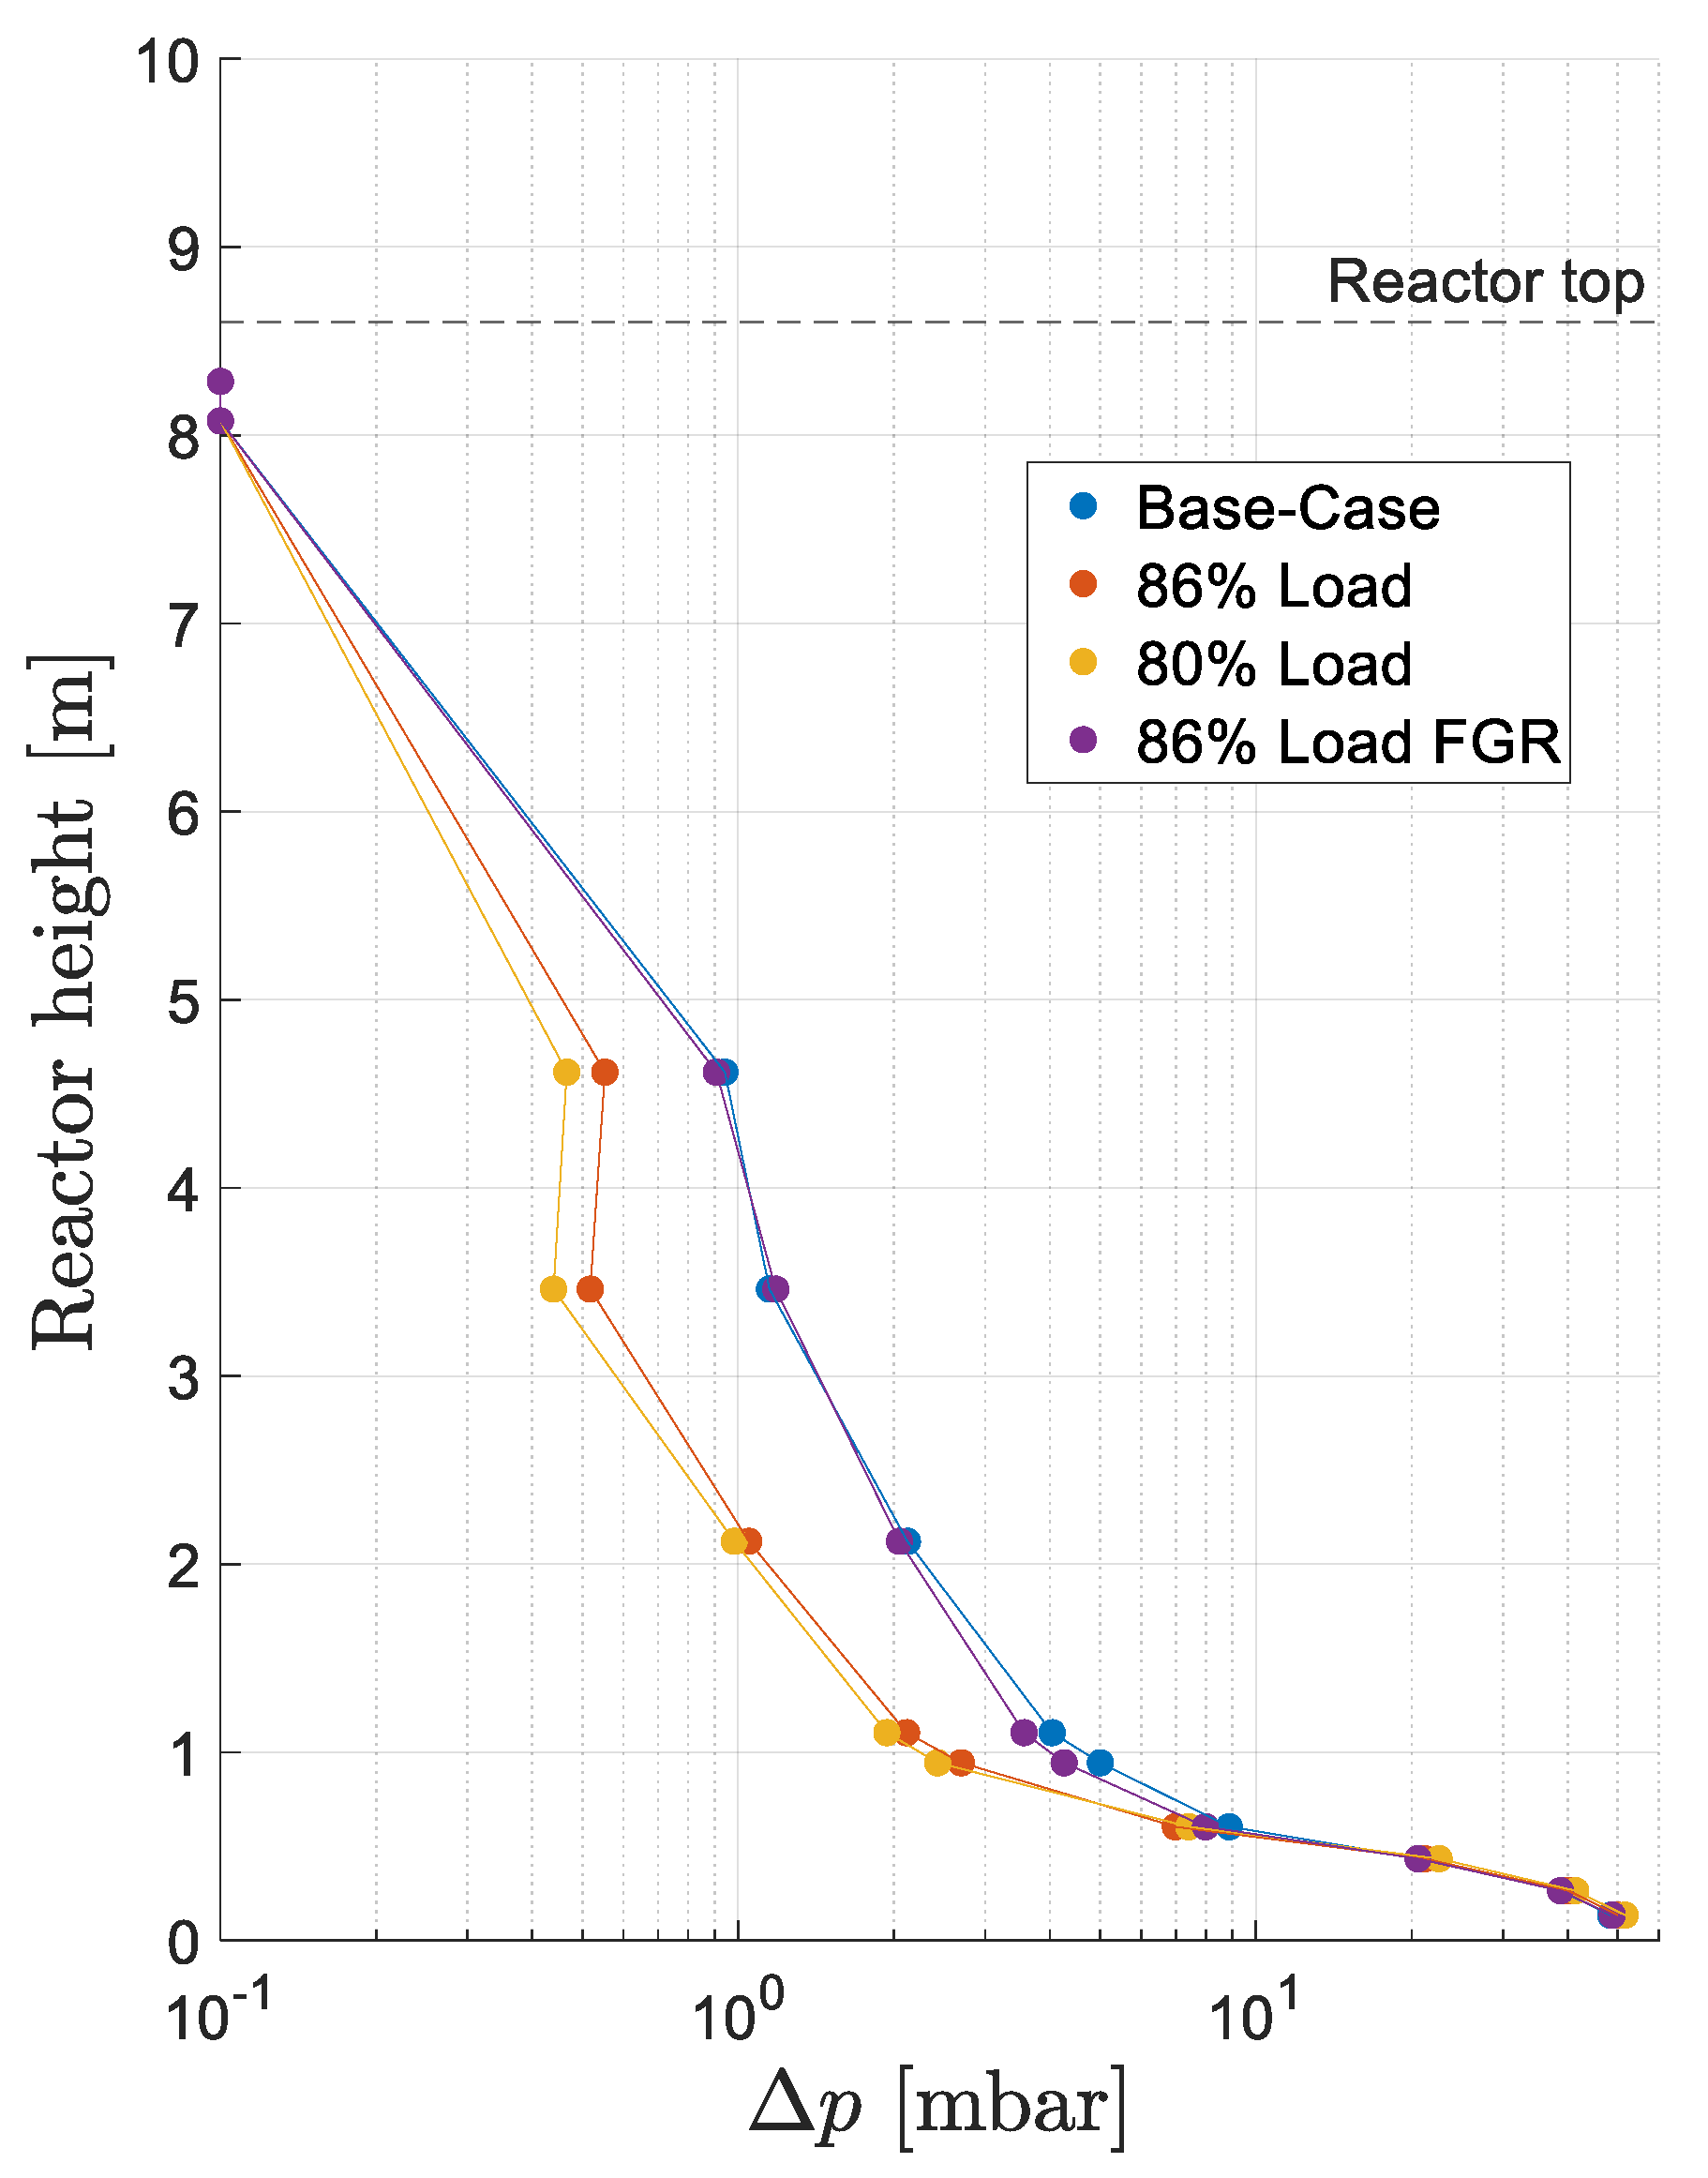
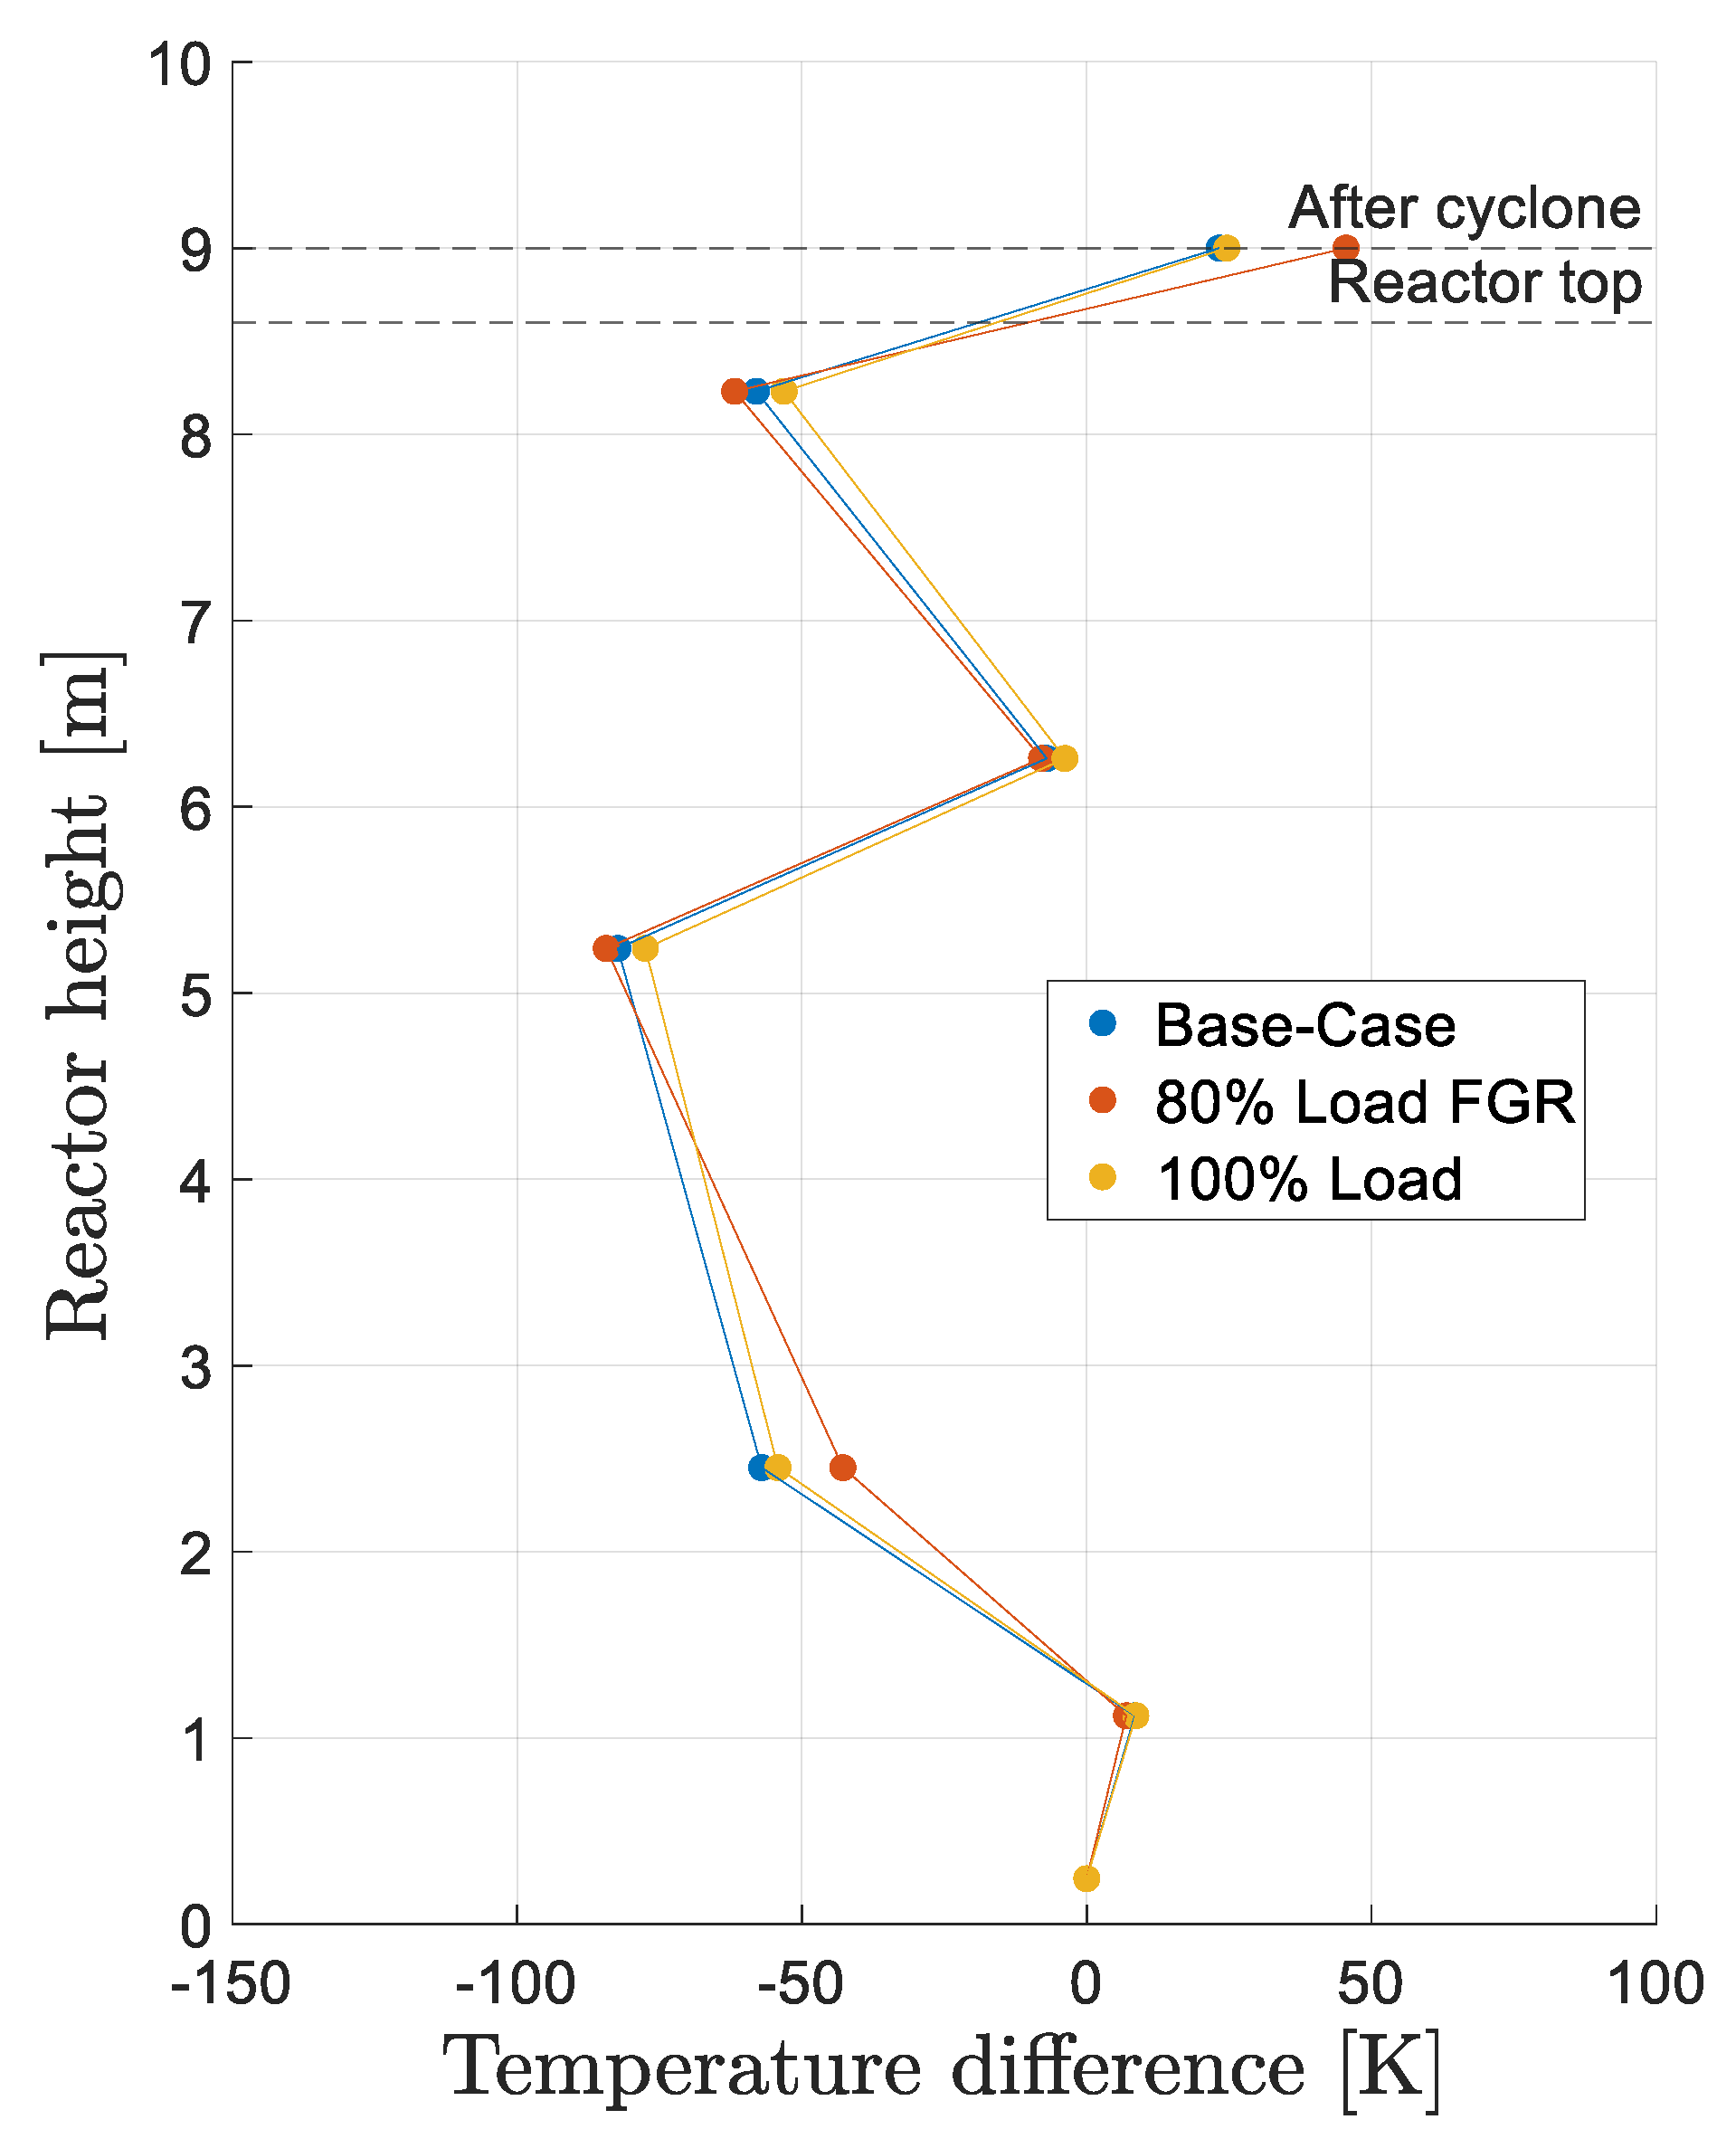
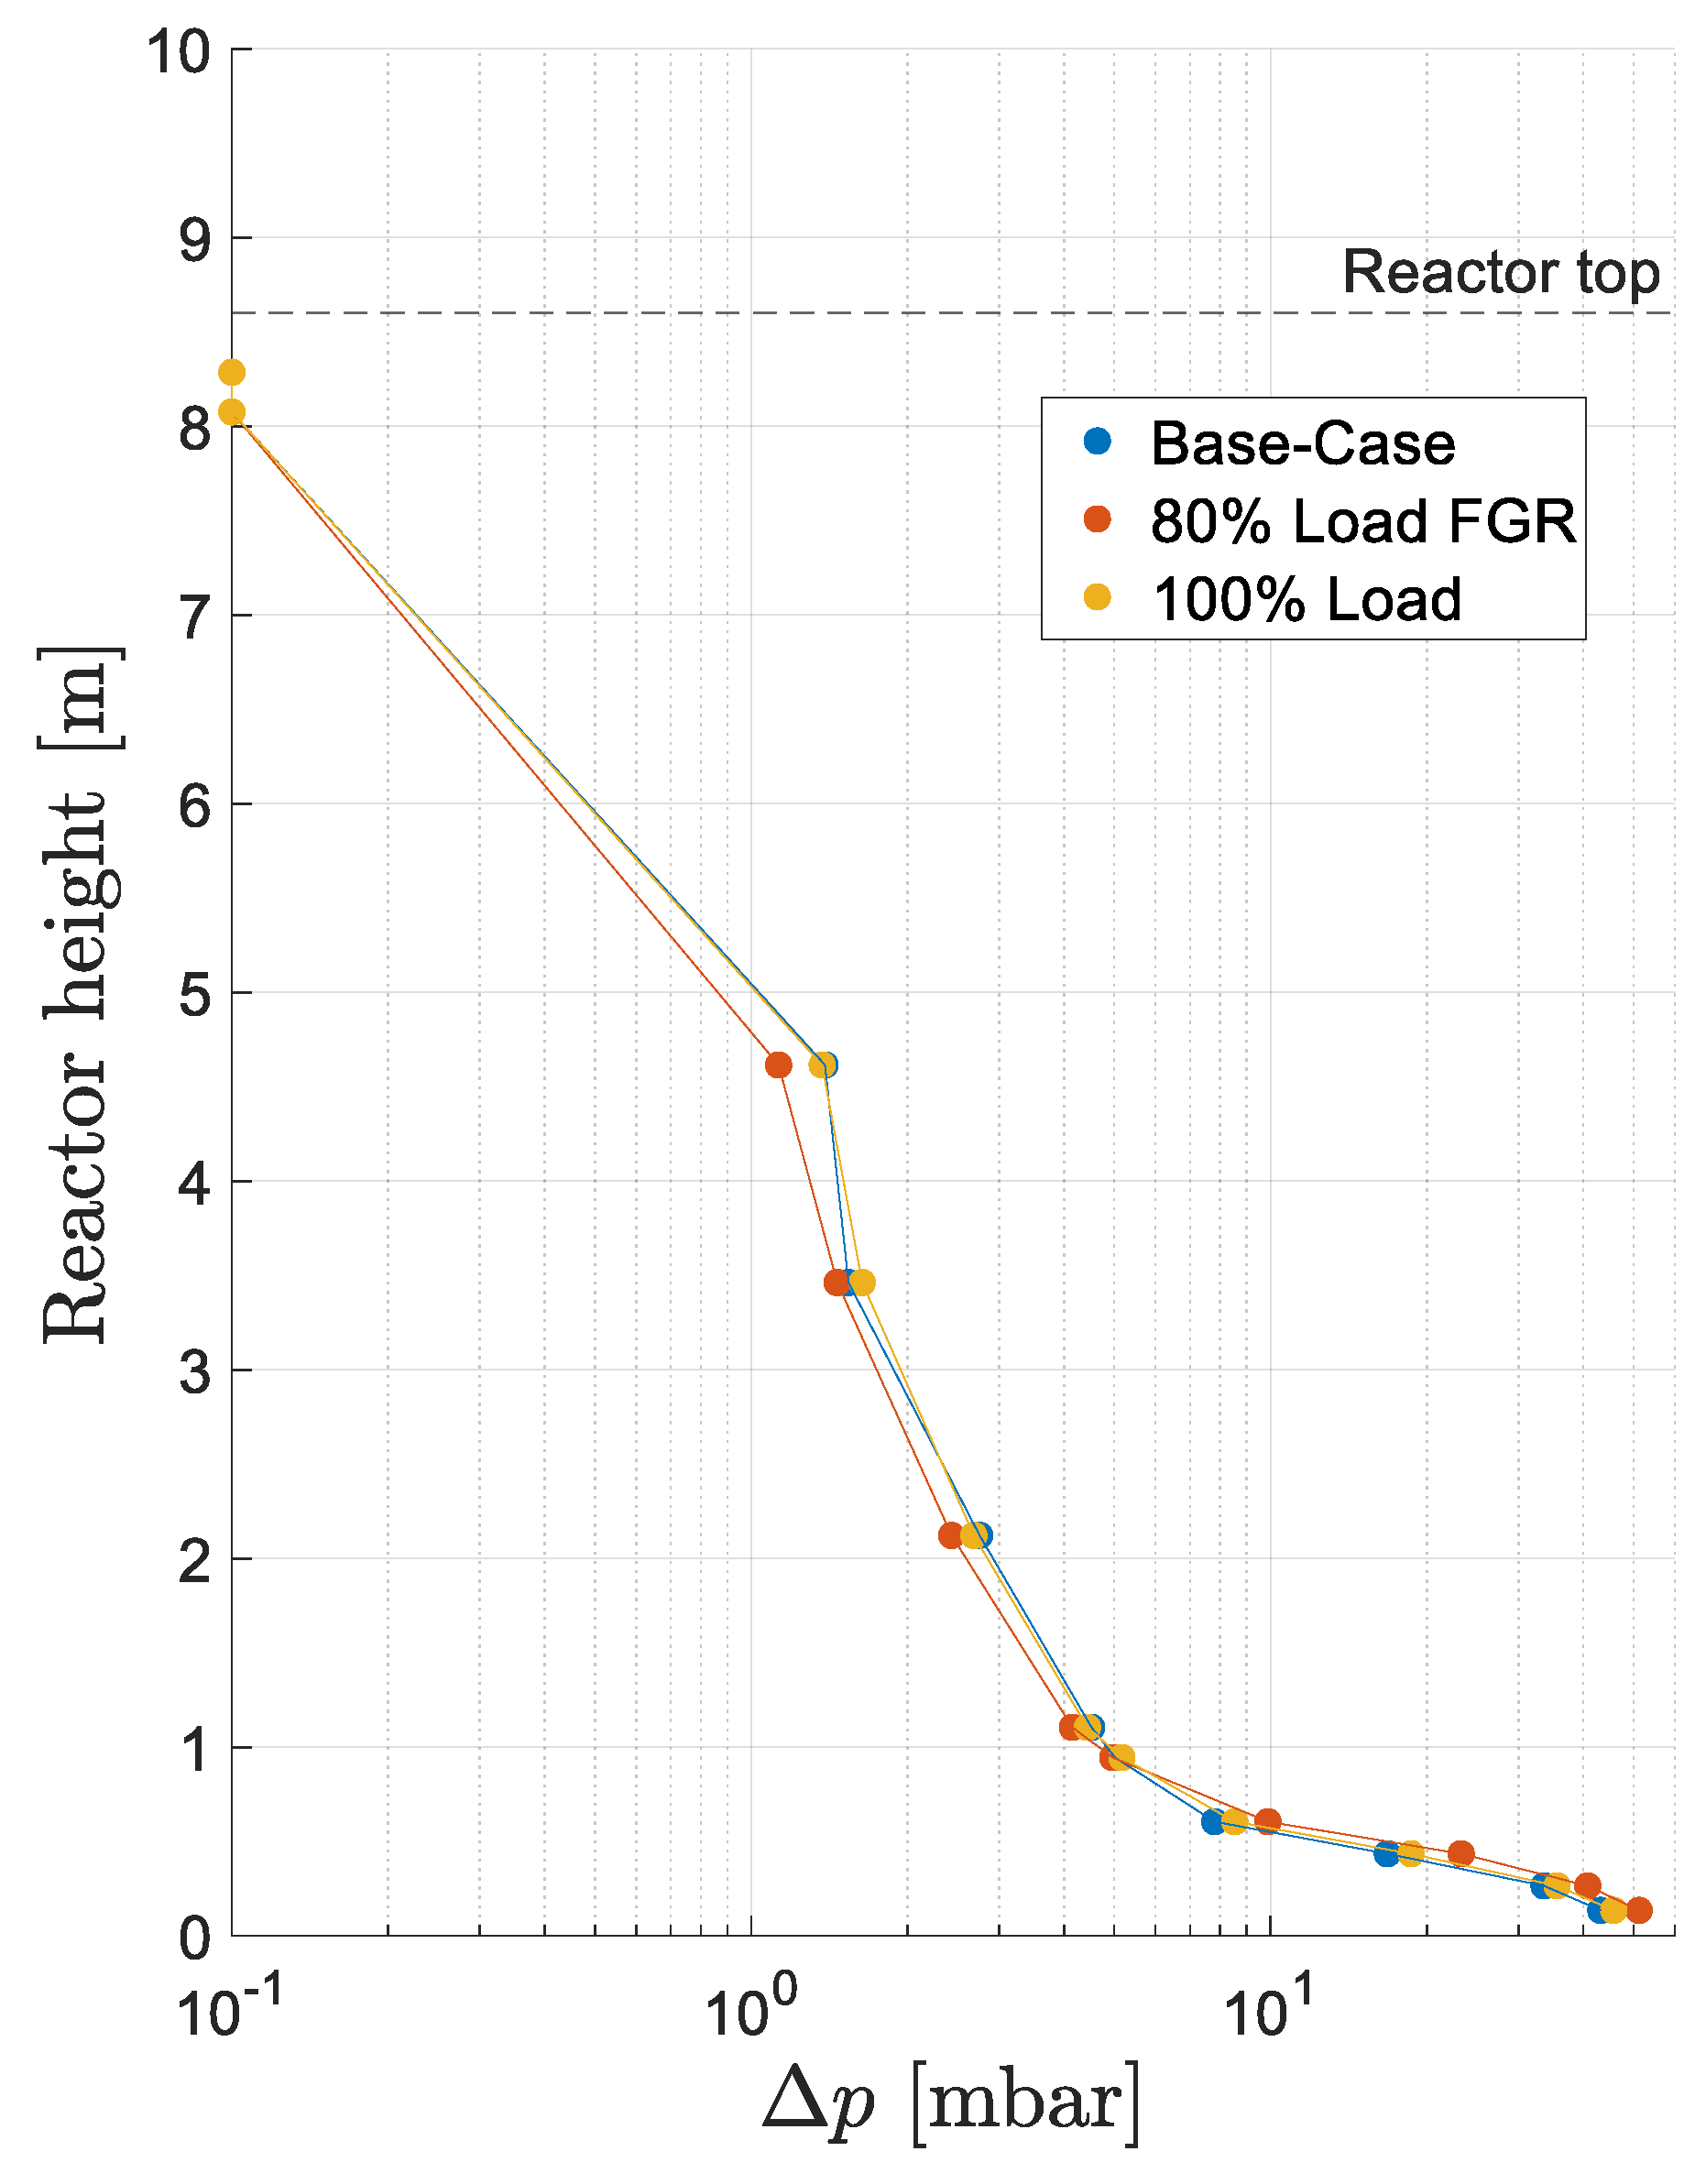
The thermal and hydrodynamic shifts are further illustrated in Figure 4 and Figure 5. The temperature difference shown in Figure 4 was obtained by subtraction the lowest temperature measurement of each load step from all temperature measurements. Using temperature differences instead of absolute values enables a direct comparison of temperature profiles along the reactor height, independent of the applied thermal load. This method is of high importance for evaluating the heat extraction potential along the reactor height for different load cases. The differential pressure profiles presented in Figure 5 was calculated in an analogous manner. Absolute pressure values, recorded at 11 positions along the reactor height relative to ambient air, were normalized by subtracting the measurement at the reactor outlet (highest position). This approach permits the analysis of pressure distributions without interference from the ID fan. Both analytical approaches align with methodologies used in previous co-combustion and oxyfuel combustion tests conducted at the same pilot facility [47,57]. Comparing the base case and the 86% load condition, Figure 4 demonstrates that the absolute value of the temperature difference is larger for the 86% load case compared to base case along the entire freeboard zone. This is an indication of less heat being transferred to this region. The decrease in particle accumulation in the freeboard is indirectly evidenced in Figure 5, as the differential pressure serves as a proxy for particle density. It decreases in the freeboard zone while simultaneously increasing in the bed area (up to approximately 0.5 m). This indicates enhanced particle accumulation in the bed zone, reduced particle entrainment to the freeboard, and consequently an overall reduction in particle circulation.
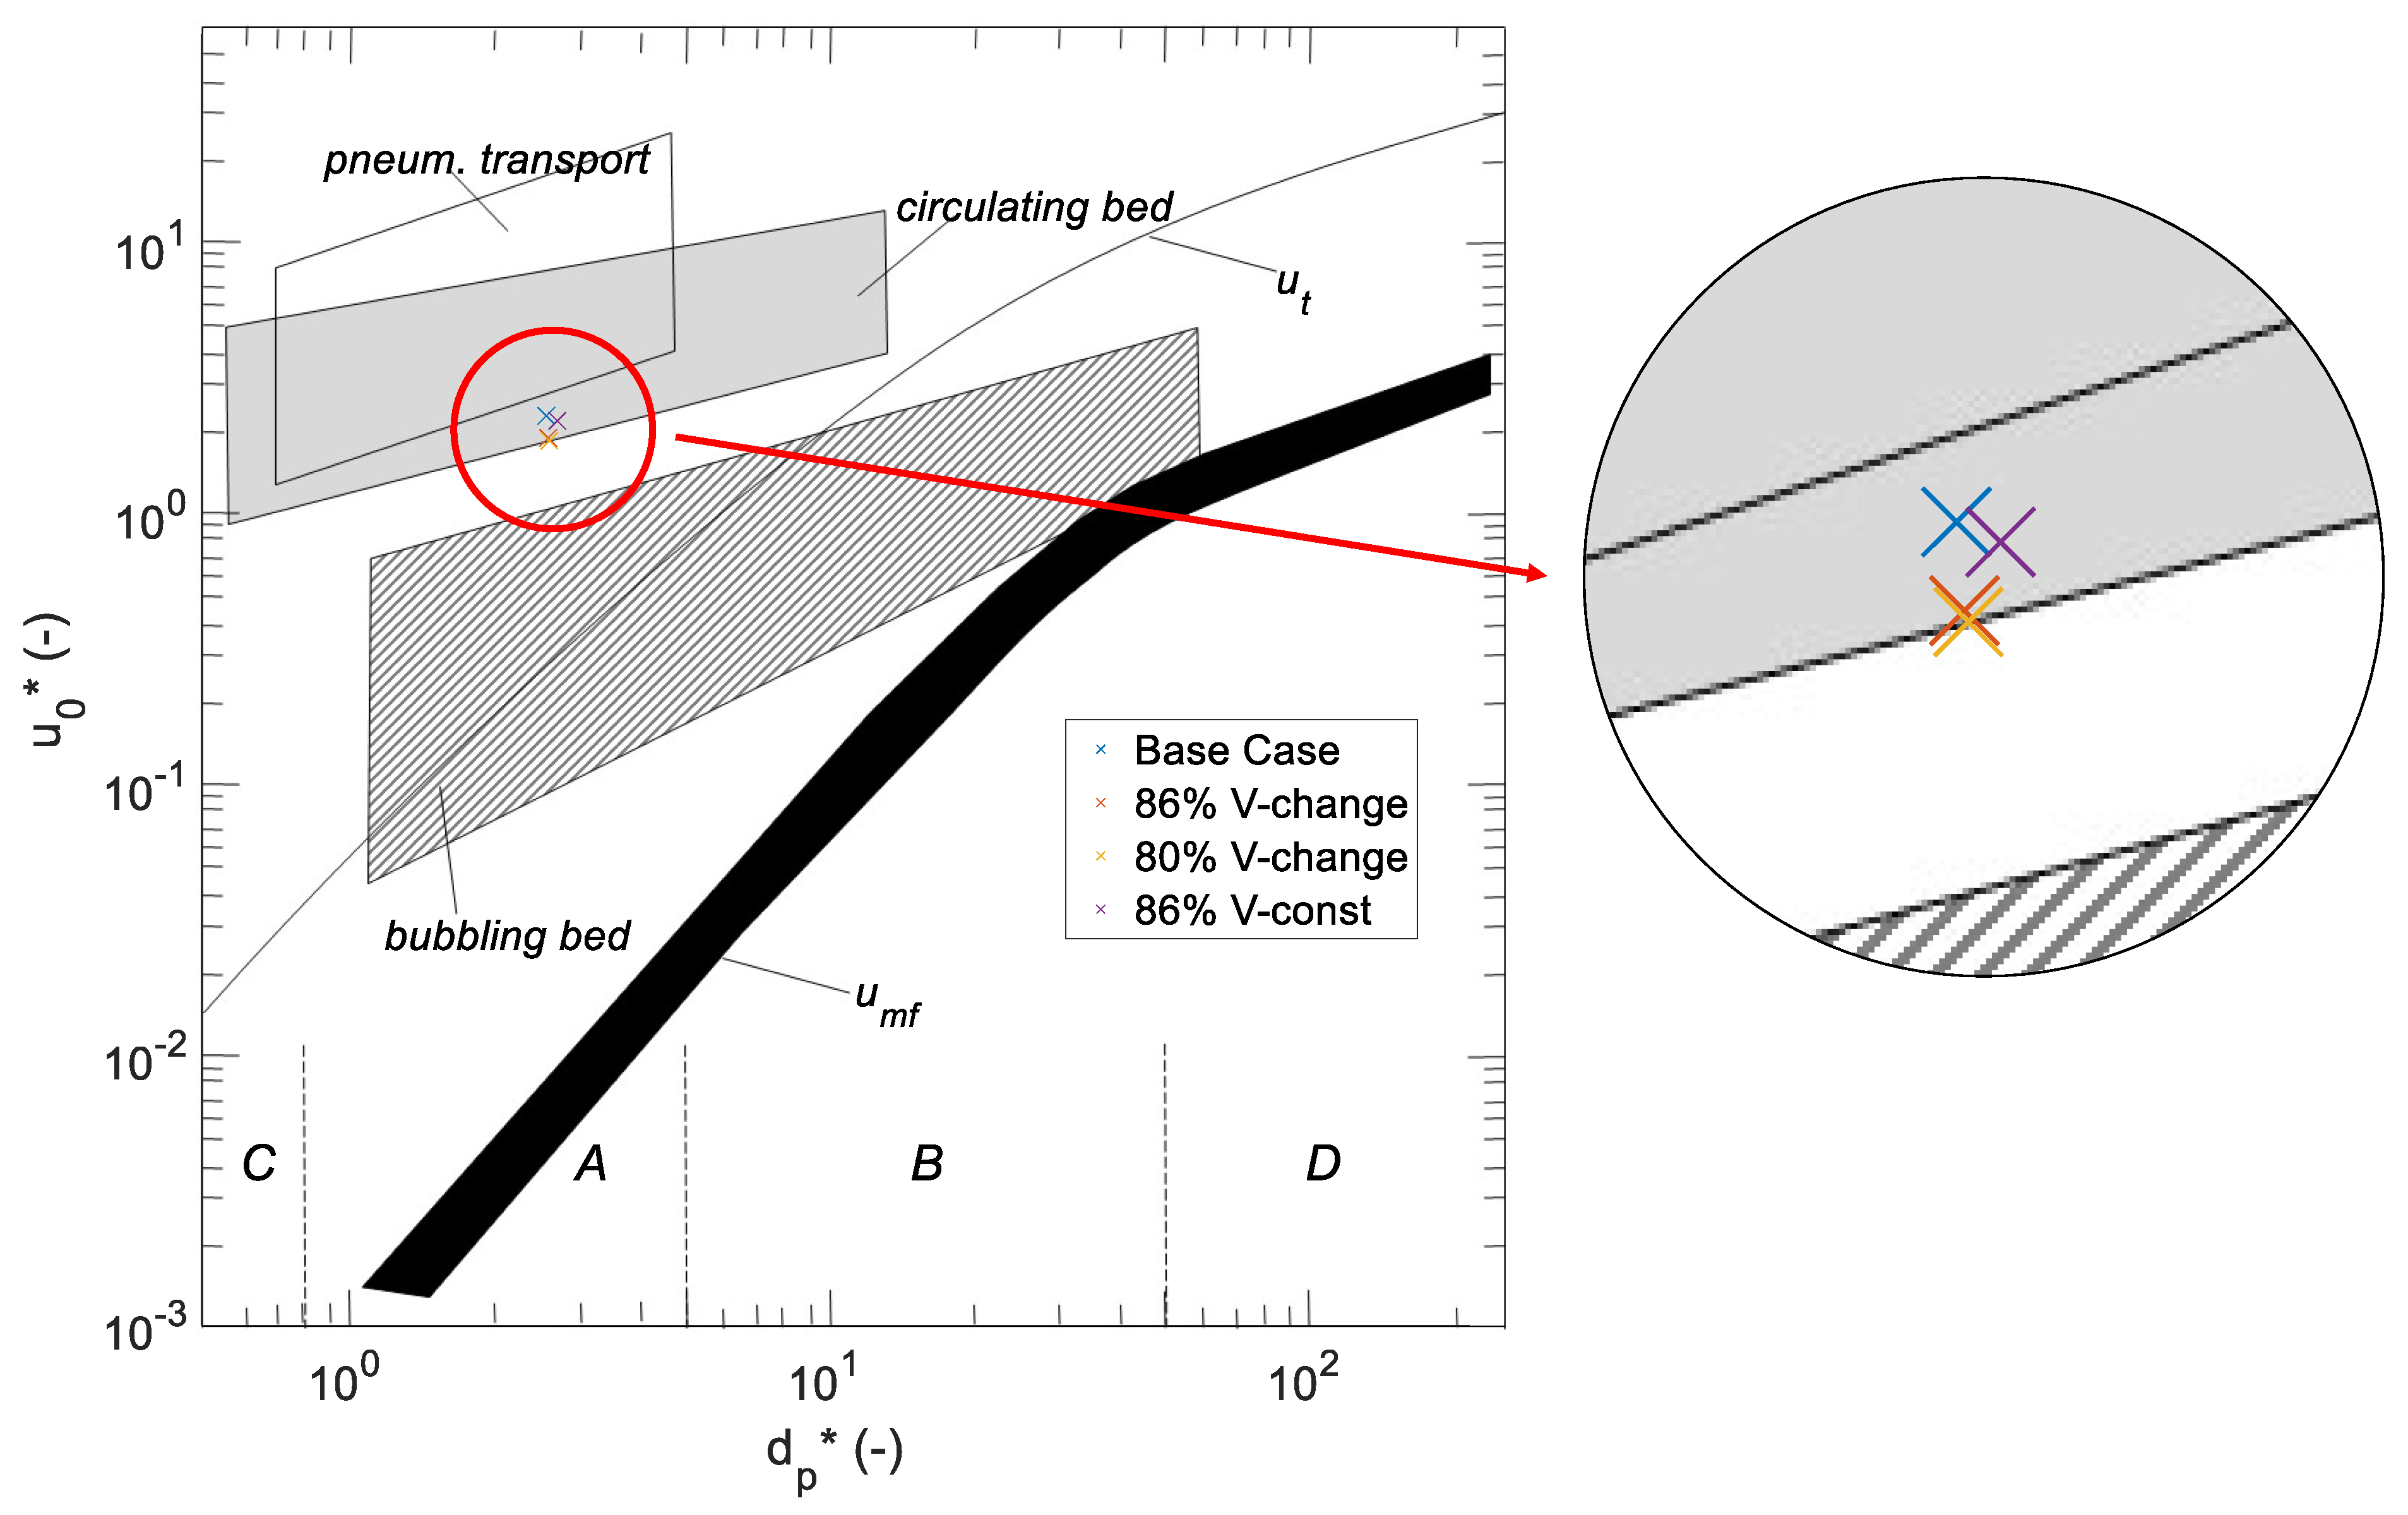
This decline in particle circulation is further corroborated by the Grace-Diagram (Figure 6), which shows that reduced fluidization leads to a notable drop in the superficial gas velocity u 0 . This positions the 86% load case close to the lower boundary of the circulating fluidized bed regime. Thermal changes observed in the freeboard are primarily attributed to the reduced upward transport of hot particles, while cooling lance positions remain unchanged. Concurrently, the bed temperature increases due to two main factors. First, fewer hot particles are carried away into the freeboard zone, and secondly, the recirculation of cooler particles form the loop seal is diminished.
The second load reduction, lowering the thermal input to 80% of full load, further accentuates the previously observed trends. The temperature difference between the bed and the freeboard zone increases to approximately 118 K. Concurrently, pressure in the loop seal and the freeboard continues to decline, while pressure in the bed zone rises further. This trend reflects an intensification of hydrodynamic imbalance within the system. The Grace diagram (Figure 6) confirms this development, showing that the 80% load case shifts even closer to the boundary of the circulating bed regime, indicating that deeper load reductions push the system toward the operational limits of stable circulation.
In response to the increasing thermal and hydrodynamic instability, partial FGR was introduced during the third load step to counteract the rising temperature gradient and stabilize fluidization. In this step, the thermal load was increased to 86% of the base case, while the total fluidization rate was restored to the level used at 100% load. As a result, the oxygen concentration in the PA and SA was reduced to approximately 18 vol% (dry) through the controlled admixture of recirculated gas. Following the implementation of partial FGR, a reduction in temperature was observed in both the bed and freeboard zone. This effect is consistent with expectations, as the increased fluidization rate leads to enhanced heat transfer and lower average flue gas temperatures. The cooling effect was more pronounced in the bed zone (see Figure 4), leading to a noticeable decrease in the temperature difference between the two regions, which is a key indicator of improved thermal homogeneity. While the freeboard pressure remained relatively stable during this phase, a rise in loop seal pressure was recorded, accompanied by a gradual decrease in bed pressure. These changes indicate improved particle circulation throughout the reactor, supported by the differential pressure profile and the Grace diagram. Figure 5 shows a differential pressure profile nearly identical to the base case, while Figure 6 shows an increase in the dimensionless superficial gas velocity u 0 , signaling a return toward the initial mark of the base case in the circulating bed regime. A slight pressure drop in the bed zone between 100 and 120 min corresponds to a controlled extraction of bed material. This operation was necessary to remove metallic and ceramic contaminants introduced by the SRF. Following the extraction, pressure levels in the bed zone stabilized at a slightly lower value, completing the transition to a more balanced and thermodynamically stable state under partial FGR conditions.

3.2. Load Step Test Period 2–Partial FGR

Following the first successful application of partial FGR, an intermediate phase at 100% base load was introduced to re-establish hydrodynamic and thermodynamic conditions comparable to the initial base case. During this phase, simultaneous extraction of bed material and addition of fresh sand was carried out to further remove metallic and ceramic contaminants introduced by the SRF. Because the minimum extraction rate exceeded the target feed rate of 30 kg/h, the addition of make-up sand remained active even after extraction ceased, which had previously been halted during the initial load reduction. The time periods highlighted in grey in Figure 7 and Figure 8, denote the stable operating phases corresponding to each load condition. Figure 9, Figure 10 and Figure 11 display average values of the stable operating phases.
Once the system stabilized at temperature levels comparable to the first base case, now reaching 857 °C in the bed zone and 799 °C in the freeboard zone, the third load reduction was initiated. This step involved a decrease to 80% of the base load, while maintaining the total fluidization volume constant. The oxygen concentration in both PA and SA was lowered to approximately 17 vol% (dry) through continued implementation of partial FGR. As anticipated, the reduced fuel input led to a decrease in temperatures within the bed and freeboard zones, given that the fluidization volume flows and cooling lances positions remained unchanged. Importantly, the temperature difference inside the reactor increased only marginally—from 58 K during the base case to 65 K at 80% load, as shown in Figure 7 and Figure 9. This 7 K increase represents a substantial improvement compared to the 71 K rise observed during previous tests without FGR, highlighting the stabilizing influence on thermal stratification. This finding is further underlined in Figure 9, where no distinct discrepancy of the temperature difference along the reactor height can be noticed for the different load cases. The potential cooling effect of the fresh sand feed can be excluded, as no subsequent increase in bed temperature was observed after make-up feeding was stopped at t = 45 min.
During the load reduction to 80% base load with partial FGR, no significant variation was observed in the freeboard pressure, indicating a stable upper reactor zone (see Figure 8 and Figure 10). In contrast, the bed pressure exhibited a continuous increase during the first 45 min, which is attributed to the addition of fresh quartz sand. This resulted in a slightly elevated pressure in the bed region in Figure 10, compared to the base-case. The loop seal pressure initially decreased by approximately 2 mbar during the load reduction but gradually returned to its previous level. The 2 mbar pressure drop is attributed to reduced amounts of flue gas, resulting from the fuel input being reduced by around 20%. This pressure drop is notably smaller than the more than 10 mbar reduction observed in previous load reduction tests conducted without FGR. The diminished pressure variation can additionally be observed in Figure 10, where in contrast to Figure 5, no striking difference between the base-case and the 80% load case can be observed. This highlights the stabilizing influence of FGR on the hydrodynamic behavior of the system. This stabilization is further supported by the Grace diagram (Figure 11), which shows that the marker for the 80% load case with FGR remains close to the base load condition and does not approach the boundary of the circulating bed regime, as was the case in tests without FGR. The initial rise in bed pressure up to t = 45 min is consistent with the increasing reactor inventory due to ongoing sand addition. Following this period, a slight decline in bed pressure was recorded starting at t = 60 min, which correlates with continued extraction of bed material without corresponding addition of fresh sand (see Figure 8).
In the final phase of the test sequence, the thermal load was increased back to 100%, resulting in a uniform temperature rise throughout the reactor. The freeboard zone exhibited a more rapid temperature increase than the bed zone in Figure 7, temporarily reducing the temperature difference between the two regions to approximately 50–55 K. As the system approached steady-state conditions, this gradient stabilized at around 58 K, consistent with the value observed under initial base load conditions. Final temperature values of approximately 850 °C in the bed zone and 795 °C in the freeboard, alongside the differential temperature profile in Figure 9, confirm that the reactor returned to near-identical thermodynamic conditions as observed in the base case, proving the possibility for multiple sequential load changes. This observation underscores that fast flexible operation, including both load reduction and re-increase, is thermodynamically viable when supported by appropriate control strategies such as partial FGR.
The corresponding pressure response reinforces this conclusion. An increase of approximately 2 mbar was observed in the loop seal pressure during the load ramp-up, slightly exceeding the initial base load level. This slightly exceeding base load level is attributed to the elevated total bed inventory accumulated during previous test phases. A notable pressure drop in the bed zone occurred immediately after the load increase (t = 74 min), likely resulting from redistribution of solids toward the loop seal in response to the concurrent rise in its pressure. Between t = 80 and t = 100 min, the extraction of bed material exceeded the addition of fresh sand (which resumed at t = 86 min), leading to a continued decline in bed pressure. This was followed by a switch to a time-controlled material handling regime, which successfully stabilized the bed pressure through 10 min of extraction followed by 6 min of pause. Simultaneously, this strategy enabled continued removal of residual metallic and ceramic components introduced by the SRF, while minimizing the risk of agglomeration.
Although partial FGR proved highly effective in mitigating hydrodynamic disturbances during load reductions, it introduced a reduction in reactor temperature, which corresponds to a minor loss in thermal efficiency. This trade-off is attributed to the need to heat a larger volumetric gas flow under reduced oxygen conditions to maintain constant fluidization. Nevertheless, the experimental results clearly demonstrate that partial FGR enables short-term hydrodynamic stability and effective temperature control during dynamic load changes, even under 100% waste-fueled conditions. As such, the approach supports the technical feasibility of flexible load operation in CFB systems without compromising operational reliability.

3.3. Investigation of Heat Extraction

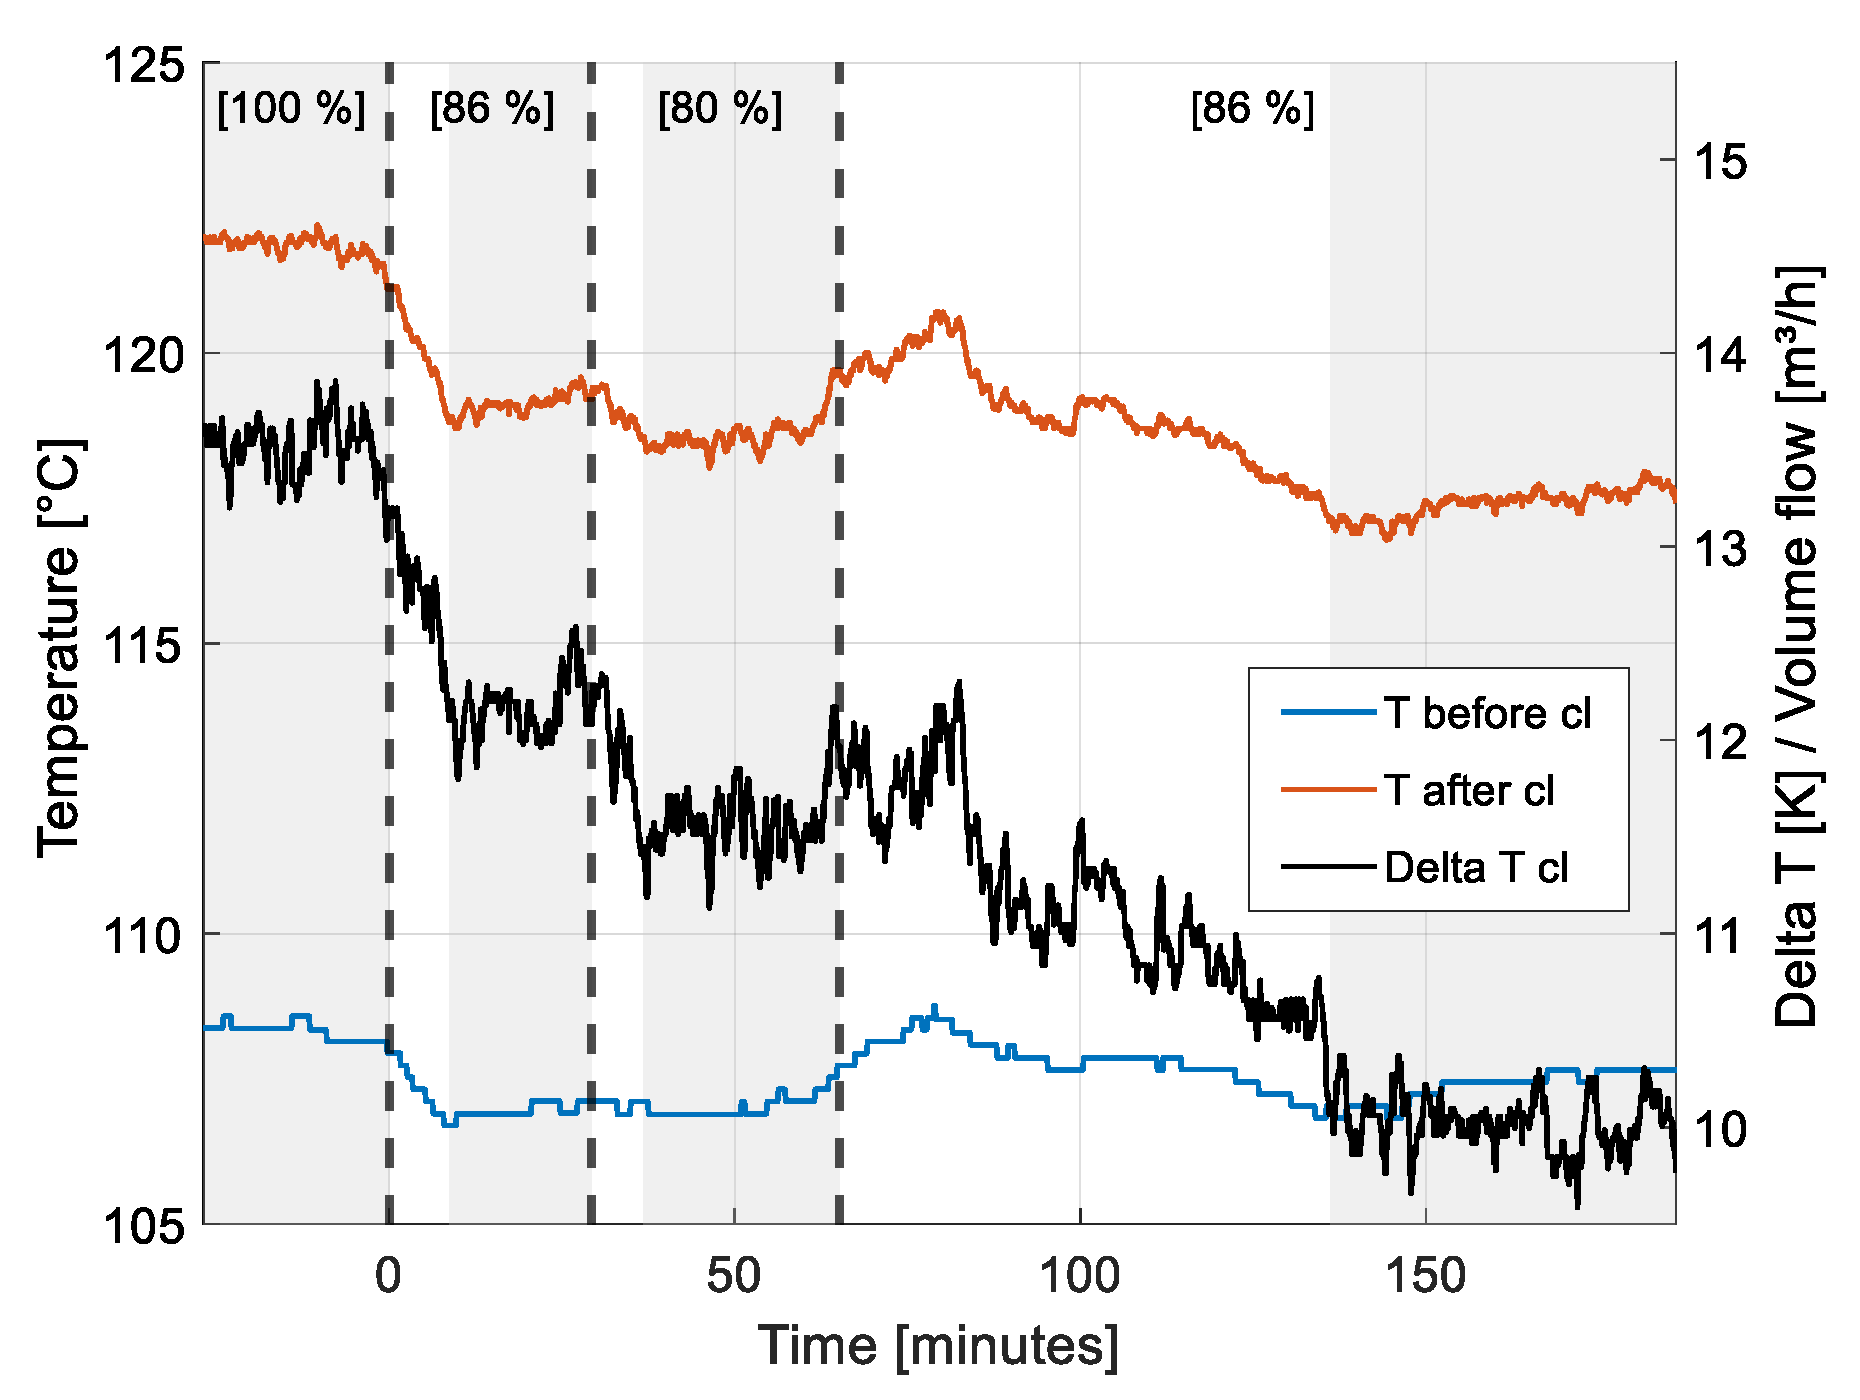
Figure 12 and Figure 13 present the measured temperatures of the cooling medium at the inlet and outlet of the cooling lances, along with the calculated temperature difference and the corresponding volumetric flow rate of the cooling medium. The time periods highlighted in grey denote the stable operating phases corresponding to each load condition. These data correspond to the two test periods, covering five individual load step tests (see Table 2). Although the 1 MWth pilot facility does not include a complete water-steam system with a turbine stage [30,32,34], the heat extraction in the cooling lances serves as a proxy to assess the impact of fire-side load changes on the heat extraction process. As their position and the volume flow rate of the cooling medium have not been altered during the load step investigation, the investigation of the temperature profiles presented below allows for indirect evaluation of how load variations might influence the steam cycle performance in a full-scale commercial plant.
In both figures, the vertical dashed lines indicate the moments when load changes were implemented. Specifically, these occur at 0, 29, and 65 min in Figure 12, and at 0 and 74 min in Figure 13, corresponding to the load step transitions listed in Table 2. Additionally, the relative load shares for each period, normalized to the two base load cases, are annotated at the top of each figure to contextualize the operating conditions. The shaded areas in both figures highlight the time intervals during which stable operation was maintained for each respective load condition, as has been implemented in the figures in Section 3.1 and Section 3.2.
The measured inlet temperature of the cooling medium, presented in Figure 12 and Figure 13, remained consistently regulated between approximately 106.5 °C and 108.5 °C. Consequently, the temperature of the cooling medium after the cooling lances has a greater influence on the observed temperature difference, thereby reflecting the fire-side thermal dynamic and serving as a proxy for evaluating the thermal load transfer to the cooling system.
Figure 12 presents a base-case temperature difference across the cooling lances, averaging 13.5 K between the inlet and outlet of the cooling medium. When the load is reduced to 86% of the base case, this difference decreases to approximately 12.2 K, corresponding to 90% of the initial heat transfer. At a further reduced load of 80%, the temperature difference remains at around 11.6 K, representing roughly 86% of the original heat transfer rate. Upon returning to 86% load with partial FGR, a transient increase in temperature is observed, followed by a gradual decline until a new steady state is reached after approximately 105 min. In this stabilized phase, the temperature difference settles at approximately 10 K, which is below the base-case level, and corresponds to only 74% of the initial heat transfer. This reduction is primarily attributed to a ~4.5 K drop in the cooling medium outlet temperature, indicating a lower overall heat transfer rate. The decline likely results from reduced bed temperatures (see Figure 2) and altered particle circulation dynamics (see Figure 3), as previously discussed in Section 3.1.
Figure 13 exhibits a comparable trend. The initial base-case temperature difference is approximately 13.8 K, which is slightly higher than in Figure 12, but within the range of experimental variation. Following the reduction to 80% load, the temperature difference declines sharply to around 11 K, where it stabilizes, corresponding to 80% of the initial heat transfer rate. A minor reduction from 11.5 K to 10.8 K at the end of this period is linked to an increase in the cooling medium inlet temperature. Upon restoring full load, a sharp rise in temperature difference to approximately 13 K is observed. This coincides with an increase in loop seal pressure (see Figure 8) and freeboard temperature (see Figure 7), indicating enhanced particle circulation and improved heat transfer. As the reactor stabilizes, the temperature difference further increases to an average of 13.7 K during the steady-state phase, effectively matching the original base-case value. This corresponds to 99% of the initial heat transfer and suggests that, from both thermal and hydrodynamic perspectives, the reactor returned to conditions closely resembling the initial steady state. Importantly, no lasting negative impact on heat transfer behavior was observed as a result of the load transfer.
A comparison between the load step tests with and without partial FGR reveals several notable differences. At 80% load, both test conditions result in similar outlet temperatures of the cooling medium leaving the cooling lances (~118 °C). However, the temperature difference in Figure 13 is approximately 0.5 K lower in the FGR case. This small deviation is also reflected in the relative heat transfer rates compared to the base-case conditions. Without FGR, heat transfer does not scale proportionally with the load reduction. Instead, it remains at 86% of the base-case value despite an 80% fuel input, indicating a deviation of 6%. In contrast, with partial FGR implemented, the ratio of extracted heat to fuel feed aligns at 80%, demonstrating improved load-following behavior of the heat extractions system. This alignment is particularly significant from an operational standpoint, as a direct correlation between fuel input and extracted heat facilitates more accurate and responsive process control.
When restoring to 100% load, a key divergence merges between the two operating strategies. Without FGR, the cooling medium temperature behind the cooling lances and the temperature difference increases only briefly following the load increase to 100% and then gradually declines, mirroring the downward trend observed in bed and freeboard temperatures (see Figure 2). The system fails to recover pre-load-change values. In contrast, the 100% load investigation with prior FGR demonstrates a rapid and sustained rise in both the outlet temperature of the cooling medium and the corresponding temperature difference, reaching values nearly identical to those recorded during the initial base-case operation. This behavior confirms that, following load transitions with partial FGR, the thermal characteristics of the water side recover to baseline conditions, which is consistent with the hydrodynamic and thermodynamic recovery observed in Section 3.2. Overall, these findings indicate that partial FGR not only stabilizes combustion-side dynamics during transient operation but also preserves the integrity and responsiveness of the heat extraction system under fluctuating load conditions.

4. Conclusions

This study investigates the potential of partial FGR as a control strategy to enhance load flexibility in a CFB pilot plant operating exclusively with SRF. This first of its kind experimental investigation makes an important contribution to reducing CO2 emissions from CFB power plants through 100% SRF utilization while simultaneously adapting them to dynamic power generation. The experimental comparison between conventional load reduction, where fuel and fluidization air decrease proportionally, and a novel partial FGR strategy reveals several key insights.
Under conventional operation, even moderate load reduction to 86% and 80% induce significant hydrodynamic instabilities. These include reduced particle entrainment from the bed into the freeboard and loop seal, which leads to diminished particle circulation and altered pressure profiles. Grace diagram analysis confirms that the operating point shifts toward the lower limit of the circulating bed regime. These instabilities coincide with a significant increase in the absolute temperature difference in the freeboard area, indicating deteriorated mixing and heat distribution.
In contrast, the partial FGR strategy, which maintains the total fluidization rate through substituting a fraction of combustion air with recirculated flue gas, preserves particle transport and stabilizes both hydrodynamic and thermal behavior during load reductions to 80%. The increase in the temperature difference between the bed and freeboard zone remains minimal (ΔT = 7 K), compared to 71 K increase without FGR, and heat extraction in the upper regions of the reactor remains stable or even improves. While this approach introduces a modest efficiency penalty due to reheating of recirculated gases, it ensures stable operation at reduced loads, which is an essential requirement for flexible, renewable-compatible power generation.
Overall, the results indicate that partial FGR is a viable operational strategy for stabilizing waste-fueled CFB systems under transient or low-load conditions. The method appears particularly promising for modern thermal power plants that aim to complement intermittent renewable energy sources. As this concept has been applied for the first time at a minimum load of 80%, further studies with larger load steps and lower minimum loads are required to confirm these findings. Future work should also address dynamic control integration, long-term performance under variable loads, and scaling effects, to further establish partial FGR as a robust solution for next-generation, low-carbon energy systems.

Author Contributions

A.K.: Conceptualization, Data Curation, Investigation, Methodology, Visualization, Writing—Original Draft, Writing—Review and Editing. J.S.: Funding Acquisition, Project Administration, Supervision, Writing—Review and Editing. B.E.: Funding acquisition, Resources. All authors have read and agreed to the published version of the manuscript.

Funding

This work has received funding from the European Union, Research Fund for Coal and Steel, under grant agreement number 101034024 (Retrofitting Fluidized Bed Power Plants for Waste-Derived Fuels and CO2 Capture; REBECCA). The content of this work reflects only the author’s view, and the European Commission is not responsible for any use that may be made of the information it contains.

Data Availability Statement

Data will be made available on request.

Acknowledgments

The authors would like to thank Meinhardt Städtereinigung GmbH & Co. KG for providing the commercially available SRF.

Conflicts of Interest

The authors declare no conflicts of interest.

References

  1. Zhang, H.; Lyu, J.; Yue, G. A review on research and development of CFB combustion technology in China. Powder Technol. 2023, 414, 118090. [Google Scholar] [CrossRef]
  2. Ember. Electricity Data Explorer. Available online: https://ember-energy.org/data/electricity-data-explorer/ (accessed on 18 June 2025).
  3. Climate Action Tracker. CAT Net Zero Target Evaluations. Available online: https://climateactiontracker.org/global/cat-net-zero-target-evaluations/ (accessed on 26 June 2025).
  4. IPCC. 2023: Climate Change 2023: Synthesis Report. Contribution of Working Groups I, II and III to the Sixth Assessment Report of the Intergovernmental Panel on Climate Change; Core Writing Team, Lee, H., Romero, J., Eds.; IPCC: Geneva, Switzerland; 184p. [CrossRef]
  5. Kubik, M.L.; Coker, P.J.; Barlow, J.F. Increasing thermal plant flexibility in a high renewables power system. Appl. Energy 2015, 154, 102–111. [Google Scholar] [CrossRef]
  6. Pan, E.; Yu, J.; Zhang, S.; Nie, Y.; Li, Q. Retrospective Analysis of the Effect of Hering’s Law on Outcomes of Surgical Correction of Ptosis. Ann. Plast. Surg. 2018, 80, 242–244. [Google Scholar] [CrossRef]
  7. Liu, G.; Zhu, Y.; Huang, Z. Dynamic Economic Dispatch with Wind Power Penetration Based on Non-Parametric Kernel Density Estimation. Electr. Power Compon. Syst. 2020, 48, 333–352. [Google Scholar] [CrossRef]
  8. Li, W.; Ren, H.; Chen, P.; Wang, Y.; Qi, H. Key Operational Issues on the Integration of Large-Scale Solar Power Generation—A Literature Review. Energies 2020, 13, 5951. [Google Scholar] [CrossRef]
  9. Li, S.; Ma, Z.; Zhang, X.; Wang, K.; Zhou, Q.; Zhang, J.; Chen, W. Analysis and evaluation of short-term wind power interval forecast error based on K-means clustering. J. Phys. Conf. Ser. 2021, 1983, 12091. [Google Scholar] [CrossRef]
  10. Basu, P. Combustion of coal in circulating fluidized-bed boilers: A review. Chem. Eng. Sci. 1999, 54, 5547–5557. [Google Scholar] [CrossRef]
  11. Lockwood, T. Techno-economic analysis of PC versus CFB combustion technology. IEA Clean Coal Cent. 2013. [Google Scholar]
  12. Miller, B.G. Clean Coal Engineering Technology [Recurso Electrónico]; Butterworth-Heinemann: Waltham, MA, USA, 2011. [Google Scholar]
  13. Suraniti, S.L.; Nsakala, N.y.; Darling, S.L. Alstom oxyfuel CFB boilers: A promising option for CO2 capture. Energy Procedia 2009, 1, 543–548. [Google Scholar] [CrossRef]
  14. Kunii, D.; Levenspiel, O. Circulating fluidized-bed reactors. Chem. Eng. Sci. 1997, 52, 2471–2482. [Google Scholar] [CrossRef]
  15. Kunii, D.; Levenspiel, O. Fluidization Engineering; Butterworth-Heinemann: Boston, MA, USA, 1991. [Google Scholar]
  16. Nowak, W.; Mirek, P. Circulating fluidized bed combustion (CFBC). In Fluidized Bed Technologies for Near-Zero Emission Combustion and Gasification; Elsevier: Amsterdam, The Netherlands, 2013; pp. 701–764. [Google Scholar]
  17. Oka, S. Fluidized Bed Combustion; CRC Press: Boca Raton, FL, USA, 2003. [Google Scholar]
  18. Lecomte, T.; de La Fuente, J.; Neuwahl, F.; Canova, M.; Pinasseau, A.; Jankov, I.; Brinkmann, T.; Roudier, S.; Delgado, S.L. Best Available Techniques (BAT) Reference Document for Large Combustion Plants: Industrial Emissions Directive 2010/75/EU; Publications Office of the European Union: Luxembourg, 2017.
  19. Aamand, L.E.; Leckner, B.; Andersson, S. Formation of nitrous oxide in circulating fluidized-bed boilers. Energy Fuels 1991, 5, 815–823. [Google Scholar] [CrossRef]
  20. Andries, J.; Becht, J.; Hoppesteyn, P. Pressurized fluidized bed combustion and gasification of coal using flue gas recirculation and oxygen injection. ENERGY Convers. Manag. 1997, 38, S117–S122. [Google Scholar] [CrossRef]
  21. Błaszczuk, A. Effect of flue gas recirculation on heat transfer in a supercritical circulating fluidized bed combustor. Arch. Thermodyn. 2015, 36, 61–83. [Google Scholar] [CrossRef]
  22. Kullendorff, A.N.; Jansson, B.G.; Olofsson, J.I. Controlling Thermal Transmission Rate at a Fast Fluidized Bed Reactor. US4,813,381 (A), 21 March 1989. [Google Scholar]
  23. Gao, M.; Hong, F.; Liu, J. Investigation on energy storage and quick load change control of subcritical circulating fluidized bed boiler units. Appl. Energy 2017, 185, 463–471. [Google Scholar] [CrossRef]
  24. Gao, M.; Hong, F.; Liu, J.; Chen, F. Investigation on the energy conversion and load control of supercritical circulating fluidized bed boiler units. J. Process Control. 2018, 68, 14–22. [Google Scholar] [CrossRef]
  25. Hong, F.; Chen, J.; Wang, R.; Long, D.; Yu, H.; Gao, M. Realization and performance evaluation for long-term low-load operation of a CFB boiler unit. Energy 2021, 214, 118877. [Google Scholar] [CrossRef]
  26. Zhang, F.; Xue, Y.; Li, D.; Wu, Z.; He, T. On the Flexible Operation of Supercritical Circulating Fluidized Bed: Burning Carbon Based Decentralized Active Disturbance Rejection Control. Energies 2019, 12, 1132. [Google Scholar] [CrossRef]
  27. Hong, F.; Wang, R.; Song, J.; Gao, M.; Liu, J.; Long, D. A performance evaluation framework for deep peak shaving of the CFB boiler unit based on the DBN-LSSVM algorithm. Energy 2022, 238, 121659. [Google Scholar] [CrossRef]
  28. Stefanitsis, D.; Nesiadis, A.; Nikolopoulos, A.; Nikolopoulos, N. Simulation of a circulating fluidized bed power plant integrated with a thermal energy storage system during transient operation. J. Energy Storage 2021, 43, 103239. [Google Scholar] [CrossRef]
  29. Hu, X.; Zhou, T.; Li, C.; Zhang, M.; Zhu, S.; Yang, H. Investigation on the dynamic characteristics under load regulation in CFB boiler with whole loop model. Chem. Eng. Sci. 2024, 287, 119784. [Google Scholar] [CrossRef]
  30. Peters, J.; Langner, E.; Ströhle, J.; Epple, B. Acceleration of Load Changes by Controlling the Operating Parameters in CFB Co-Combustion. Front. Energy Res. 2021, 9, 677950. [Google Scholar] [CrossRef]
  31. Hong, F.; Chen, J.; Zhang, Z.; Wang, R.; Gao, M. Time Series Risk Prediction Based on LSTM and a Variant DTW Algorithm: Application of Bed Inventory Overturn Prevention in a Pant-Leg CFB Boiler. IEEE Access 2020, 8, 156634–156644. [Google Scholar] [CrossRef]
  32. Peters, J.; Alobaid, F.; Epple, B. Operational Flexibility of a CFB Furnace during Fast Load Change—Experimental Measurements and Dynamic Model. Appl. Sci. 2020, 10, 5972. [Google Scholar] [CrossRef]
  33. Alobaid, F.; Peters, J.; Epple, B. Experimental measurements for Polish lignite combustion in a 1 MWth circulating fluidized bed during load changes. Energy 2021, 228, 120585. [Google Scholar] [CrossRef]
  34. Peters, J.; May, J.; Ströhle, J.; Epple, B. Flexibility of CFB Combustion: An Investigation of Co-Combustion with Biomass and RDF at Part Load in Pilot Scale. Energies 2020, 13, 4665. [Google Scholar] [CrossRef]
  35. Alobaid, F.; Kuhn, A.; Nguyen, N.M.; Johnen, B.; Peters, J.; Epple, B. Numerical and experimental study of co-combustion of refuse-derived fuels in a circulating fluidized bed during load change. Front. Energy Res. 2022, 10, 969780. [Google Scholar] [CrossRef]
  36. European Investment Bank. Managing Refuse-Derived and Solid Recovered Fuels: Best Practice Options for EU Countries; European Investment Bank: Luxembourg, 2024. [Google Scholar]
  37. ISO 21640:2021; Solid Recovered Fuels—Specification and Classes. CEN (European Committee for Standardization): Brussels, Belgium, 2021.
  38. Bajić, B.Ž.; Dodić, S.N.; Vučurović, D.G.; Dodić, J.M.; Grahovac, J.A. Waste-to-energy status in Serbia. Renew. Sustain. Energy Rev. 2015, 50, 1437–1444. [Google Scholar] [CrossRef]
  39. Luz, F.C.; Rocha, M.H.; Lora, E.E.S.; Venturini, O.J.; Andrade, R.V.; Leme, M.M.V.; del Olmo, O.A. Techno-economic analysis of municipal solid waste gasification for electricity generation in Brazil. ENERGY Convers. Manag. 2015, 103, 321–337. [Google Scholar] [CrossRef]
  40. Bui, M.; Fajardy, M.; Dowell, N.M. Thermodynamic Evaluation of Carbon Negative Power Generation: Bio-energy CCS (BECCS). Energy Procedia 2017, 114, 6010–6020. [Google Scholar] [CrossRef]
  41. Wienchol, P.; Szlęk, A.; Ditaranto, M. Waste-to-energy technology integrated with carbon capture—Challenges and opportunities. Energy 2020, 198, 117352. [Google Scholar] [CrossRef]
  42. Mishra, A.; Kumar, M.; Medhi, K.; Thakur, I.S. Biomass energy with carbon capture and storage (BECCS). In Current Developments in Biotechnology and Bioengineering: Chapter 17–Biomass Energy with Carbon Capture and Storage (BECCS); Elsevier: Amsterdam, The Netherlands, 2020; pp. 399–427. [Google Scholar]
  43. Gough, C.; Upham, P. Biomass energy with carbon capture and storage (BECCS or Bio-CCS). Greenh. Gases 2011, 1, 324–334. [Google Scholar] [CrossRef]
  44. Ling, J.L.J.; Yang, W.; Park, H.S.; Lee, H.E.; Lee, S.H. A comparative review on advanced biomass oxygen fuel combustion technologies for carbon capture and storage. Energy 2023, 284, 128566. [Google Scholar] [CrossRef]
  45. Wagland, S.T.; Kilgallon, P.; Coveney, R.; Garg, A.; Smith, R.; Longhurst, P.J.; Pollard, S.J.T.; Simms, N. Comparison of coal/solid recovered fuel (SRF) with coal/refuse derived fuel (RDF) in a fluidized bed reactor. Waste Manag. 2011, 31, 1176–1183. [Google Scholar] [CrossRef] [PubMed]
  46. Maj, I.; Kalisz, S.; Wejkowski, R.; Pronobis, M.; Gołombek, K. High-temperature corrosion in a multifuel circulating fluidized bed (CFB) boiler co-firing refuse derived fuel (RDF) and hard coal. Fuel 2022, 324, 124749. [Google Scholar] [CrossRef]
  47. Kuhn, A.; Langner, E.; Hülsbruch, D.; Barišić, V.; Ströhle, J.; Epple, B. Experimental investigation of fuel conversion characteristics during co-combustion of solid recovered fuel and coal in a 1 MWth circulating fluidized bed reactor. Fuel 2024, 385, 133828. [Google Scholar] [CrossRef]
  48. Jayanarasimhan, A.; Pathak, R.M.; Shivapuji, A.M.; Rao, L. Tar Formation in Gasification Systems: A Holistic Review of Remediation Approaches and Removal Methods. ACS Omega 2024, 9, 2060–2079. [Google Scholar] [CrossRef]
  49. Wu, H.; Glarborg, P.; Frandsen, F.J.; Dam-Johansen, K.; Jensen, P.A.; Sander, B. Trace elements in co-combustion of solid recovered fuel and coal. Fuel Process. Technol. 2013, 105, 212–221. [Google Scholar] [CrossRef]
  50. Liu, Z.; Ma, S.; Pan, X.; Chen, J. Experimental study on the load response rate under the dynamic combined combustion of PC coal and CFB coal in a CFB boiler. Fuel 2019, 236, 445–451. [Google Scholar] [CrossRef]
  51. Song, W.; Tang, Z.; Song, G.; Zhu, J.; Liu, J.; Wang, H.; Zhang, Y. Experimental study on variable load regulation of circulating fluidized bed with high temperature preheated activated fuel. Particuology 2024, 95, 178–188. [Google Scholar] [CrossRef]
  52. Tang, Z.; Song, G.; Yang, X.; Ji, Z. Research on combustion and emission characteristics of circulating fluidized bed during load changes. J. Energy Inst. 2022, 105, 334–341. [Google Scholar] [CrossRef]
  53. Neshumayev, D.; Rummel, L.; Konist, A.; Ots, A.; Parve, T. Power plant fuel consumption rate during load cycling. Appl. Energy 2018, 224, 124–135. [Google Scholar] [CrossRef]
  54. Zhu, S.; Hui, J.; Lyu, Q.; Ouyang, Z.; Liu, J.; Zhu, J.; Zeng, X.; Zhang, X.; Ding, H.; Liu, Y.; et al. Experimental study on pulverized coal combustion preheated by a circulating fluidized bed: Preheating characteristics for peak shaving. Fuel 2022, 324, 124684. [Google Scholar] [CrossRef]
  55. Hui, J.; Zhu, S.; Zhang, X.; Liu, Y.; Lin, J.; Ding, H.; Su, K.; Cao, X.; Lyu, Q. Experimental study of deep and flexible load adjustment on pulverized coal combustion preheated by a circulating fluidized bed. J. Clean. Prod. 2023, 418, 138040. [Google Scholar] [CrossRef]
  56. Tang, Z.; Song, G.; Song, W.; Sun, L.; Ji, Z.; Ji, Y.; Zhang, Y. Experimental study on variation characteristics of combustion heat load in circulating fluidized bed under fuel high-temperature preheating modification. J. Energy Inst. 2024, 114, 101610. [Google Scholar] [CrossRef]
  57. Kuhn, A.; Graf, C.; Ströhle, J.; Epple, B. Experimental Study on Oxyfuel-Combustion of Solid Recovered Fuel using Ilmenite as Bed Material in a 1 MWth Fluidized Bed Reactor. Carbon Capture Sci. Technol. 2025, 15, 100436. [Google Scholar] [CrossRef]
  58. Kuhn, A.; Graf, C.; Hülsbruch, D.; Ströhle, J.; Epple, B. Oxygen Carrier Aided Combustion (OCAC) of Solid Recovered Fuel (SRF) and coal in a 1 MWth CFB pilot plant using Ilmenite. Appl. Therm. Eng. 2025, 274, 126692. [Google Scholar] [CrossRef]
Figure 1. Experimental setup of the 1 MWth pilot plant for load step tests.
Energies 18 05227 g001
Figure 2. Temperature curves during load steps 1–3.
Energies 18 05227 g002
Figure 3. Pressure curves during load steps 1–3.
Energies 18 05227 g003
Figure 4. Temperature difference profile over reactor height during load steps 1–3.
Energies 18 05227 g004
Figure 5. Differential pressure profile over reactor height during load steps 1–3.
Energies 18 05227 g005
Figure 6. Grace-Diagram for test period 1.
Energies 18 05227 g006
Figure 7. Temperature curves during load steps 4 & 5.
Energies 18 05227 g007
Figure 8. Pressure curves during load steps 4 & 5.
Energies 18 05227 g008
Figure 9. Temperature difference profile over reactor height during load steps 4 & 5.
Energies 18 05227 g009
Figure 10. Differential pressure profile over reactor height during load steps 4 & 5.
Energies 18 05227 g010
Figure 11. Grace-Diagram for test period 2.
Energies 18 05227 g011
Figure 12. Temperature before and after, temperature difference and volume flow of the cooling lances during load steps 1–3.
Energies 18 05227 g012
Figure 13. Temperature before and after, temperature difference and volume flow of the cooling lances during load steps 4 & 5.
Energies 18 05227 g013
Table 1. List of gas analysis equipment [57].
PositionEquipmentMeasurement PrincipleComponentRangeUncertaintyUnit
Primary fluidization lineMagnos 206ParamagneticO20 to 250.9Vol.%
Uras 26NDIRCO20 to 1001.8Vol.%
Secondary fluidization lineMagnos 206ParamagneticO20 to 250.9Vol.%
Uras 26NDIRCO20 to 1001.8Vol.%
Flue gas before HXMagnos 206ParamagneticO20 to 250.9Vol.%
Uras 26NDIRCO20 to 903.0Vol.%
Uras 26NDIRCO0 to 50.15Vol.%
Uras 26NDIRNO0 to 1000≤25ppm
Uras 26NDIRSO20 to 4000≤100ppm
Flue gas after ID fanHygrophil H4320PsychrometricH2O2 to 1000.9Vol.%
Table 2. Load step test matrix.
Operating PointLoad ChangeLoad Share [%]Total Fluidization [%]FGRT bed [°C]T Freeboard [°C] Δ T [K]Bed Feed [kg/h]Bed Extr. [kg/h]Duration [min]
Base Case 1-100100No848801470.025.727
Load Step 1Decrease8686No865768970.30.020
Load Step 2Decrease8080No8677491181.80.028
Load Step 3Increase86100Yes779703760.00.050
Base Case 2-100100No8577995830.237.68
Load Step 4Decrease80100Yes7947326211.46.451
Load Step 5Increase100100No8507975327.724.024
Table 3. Mean values and standard deviation (std) for proximate analysis, ultimate analysis, and lower heating value of SRF.
MeanStd
Proximate analysisMoisture [wt% a.r.]22.05.1
Ash [wt%, dry]6.60.6
Volatiles [wt%, dry]85.20.8
Fixed Carbon [wt%, dry]
(calculated: 100%—Rest)
8.20.2
Ultimate analysisC [wt%, dry]61.70.7
H [wt%, dry]8.50.1
N [wt%, dry]1.00.02
O [wt%, dry]21.20.1
S [wt%, dry]0.10.03
Cl [wt%, dry]1.00.2
LHV (lower heating value)[MJ/kg, a.r.]20.91.3
Disclaimer/Publisher’s Note: The statements, opinions and data contained in all publications are solely those of the individual author(s) and contributor(s) and not of MDPI and/or the editor(s). MDPI and/or the editor(s) disclaim responsibility for any injury to people or property resulting from any ideas, methods, instructions or products referred to in the content.