Unraveling the Surrounding Drivers of Interprovincial Trade Embodied Energy Flow Based on the MRIO Model: A Case Study in China
Abstract
1. Introduction
2. Literature Review
2.1. Identifying the Key Regions of Energy Consumption
2.2. Energy Flow
2.3. Coal Flow
3. Methodology
3.1. Case Study
3.2. Method
3.2.1. Consumption-Based Embodied Energy
3.2.2. Income-Based Embodied Energy
3.2.3. Embodied Coal
3.3. Data and Data Processing
4. Results and Discussion
4.1. Identifying Critical Energy Consumption Province
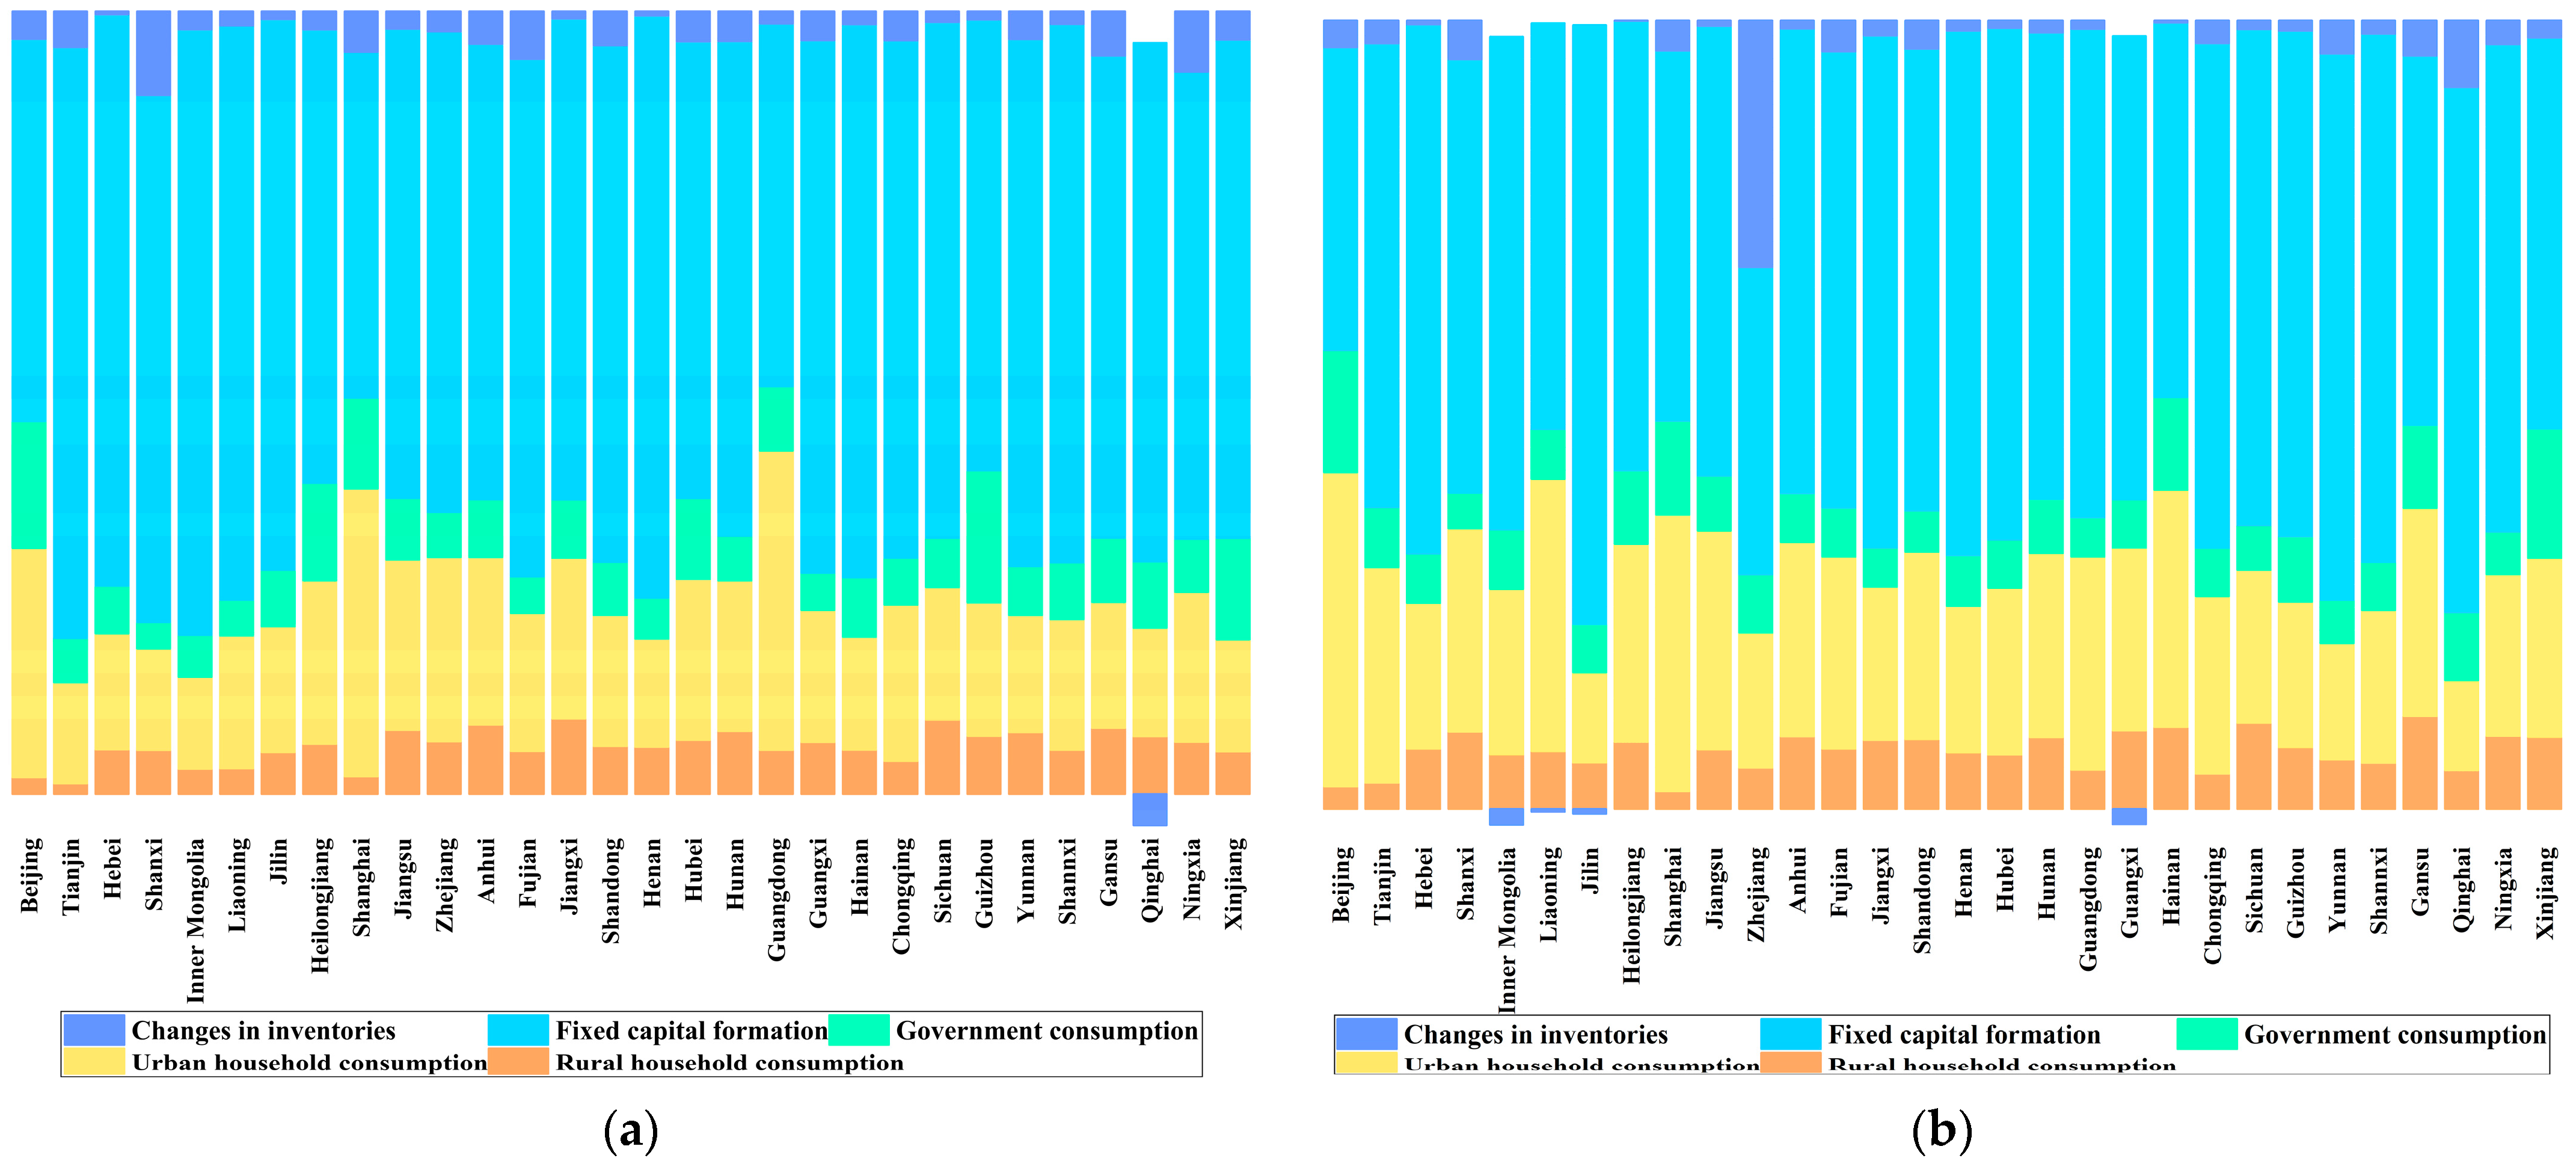
4.1.1. Total Embodied Energy Consumption
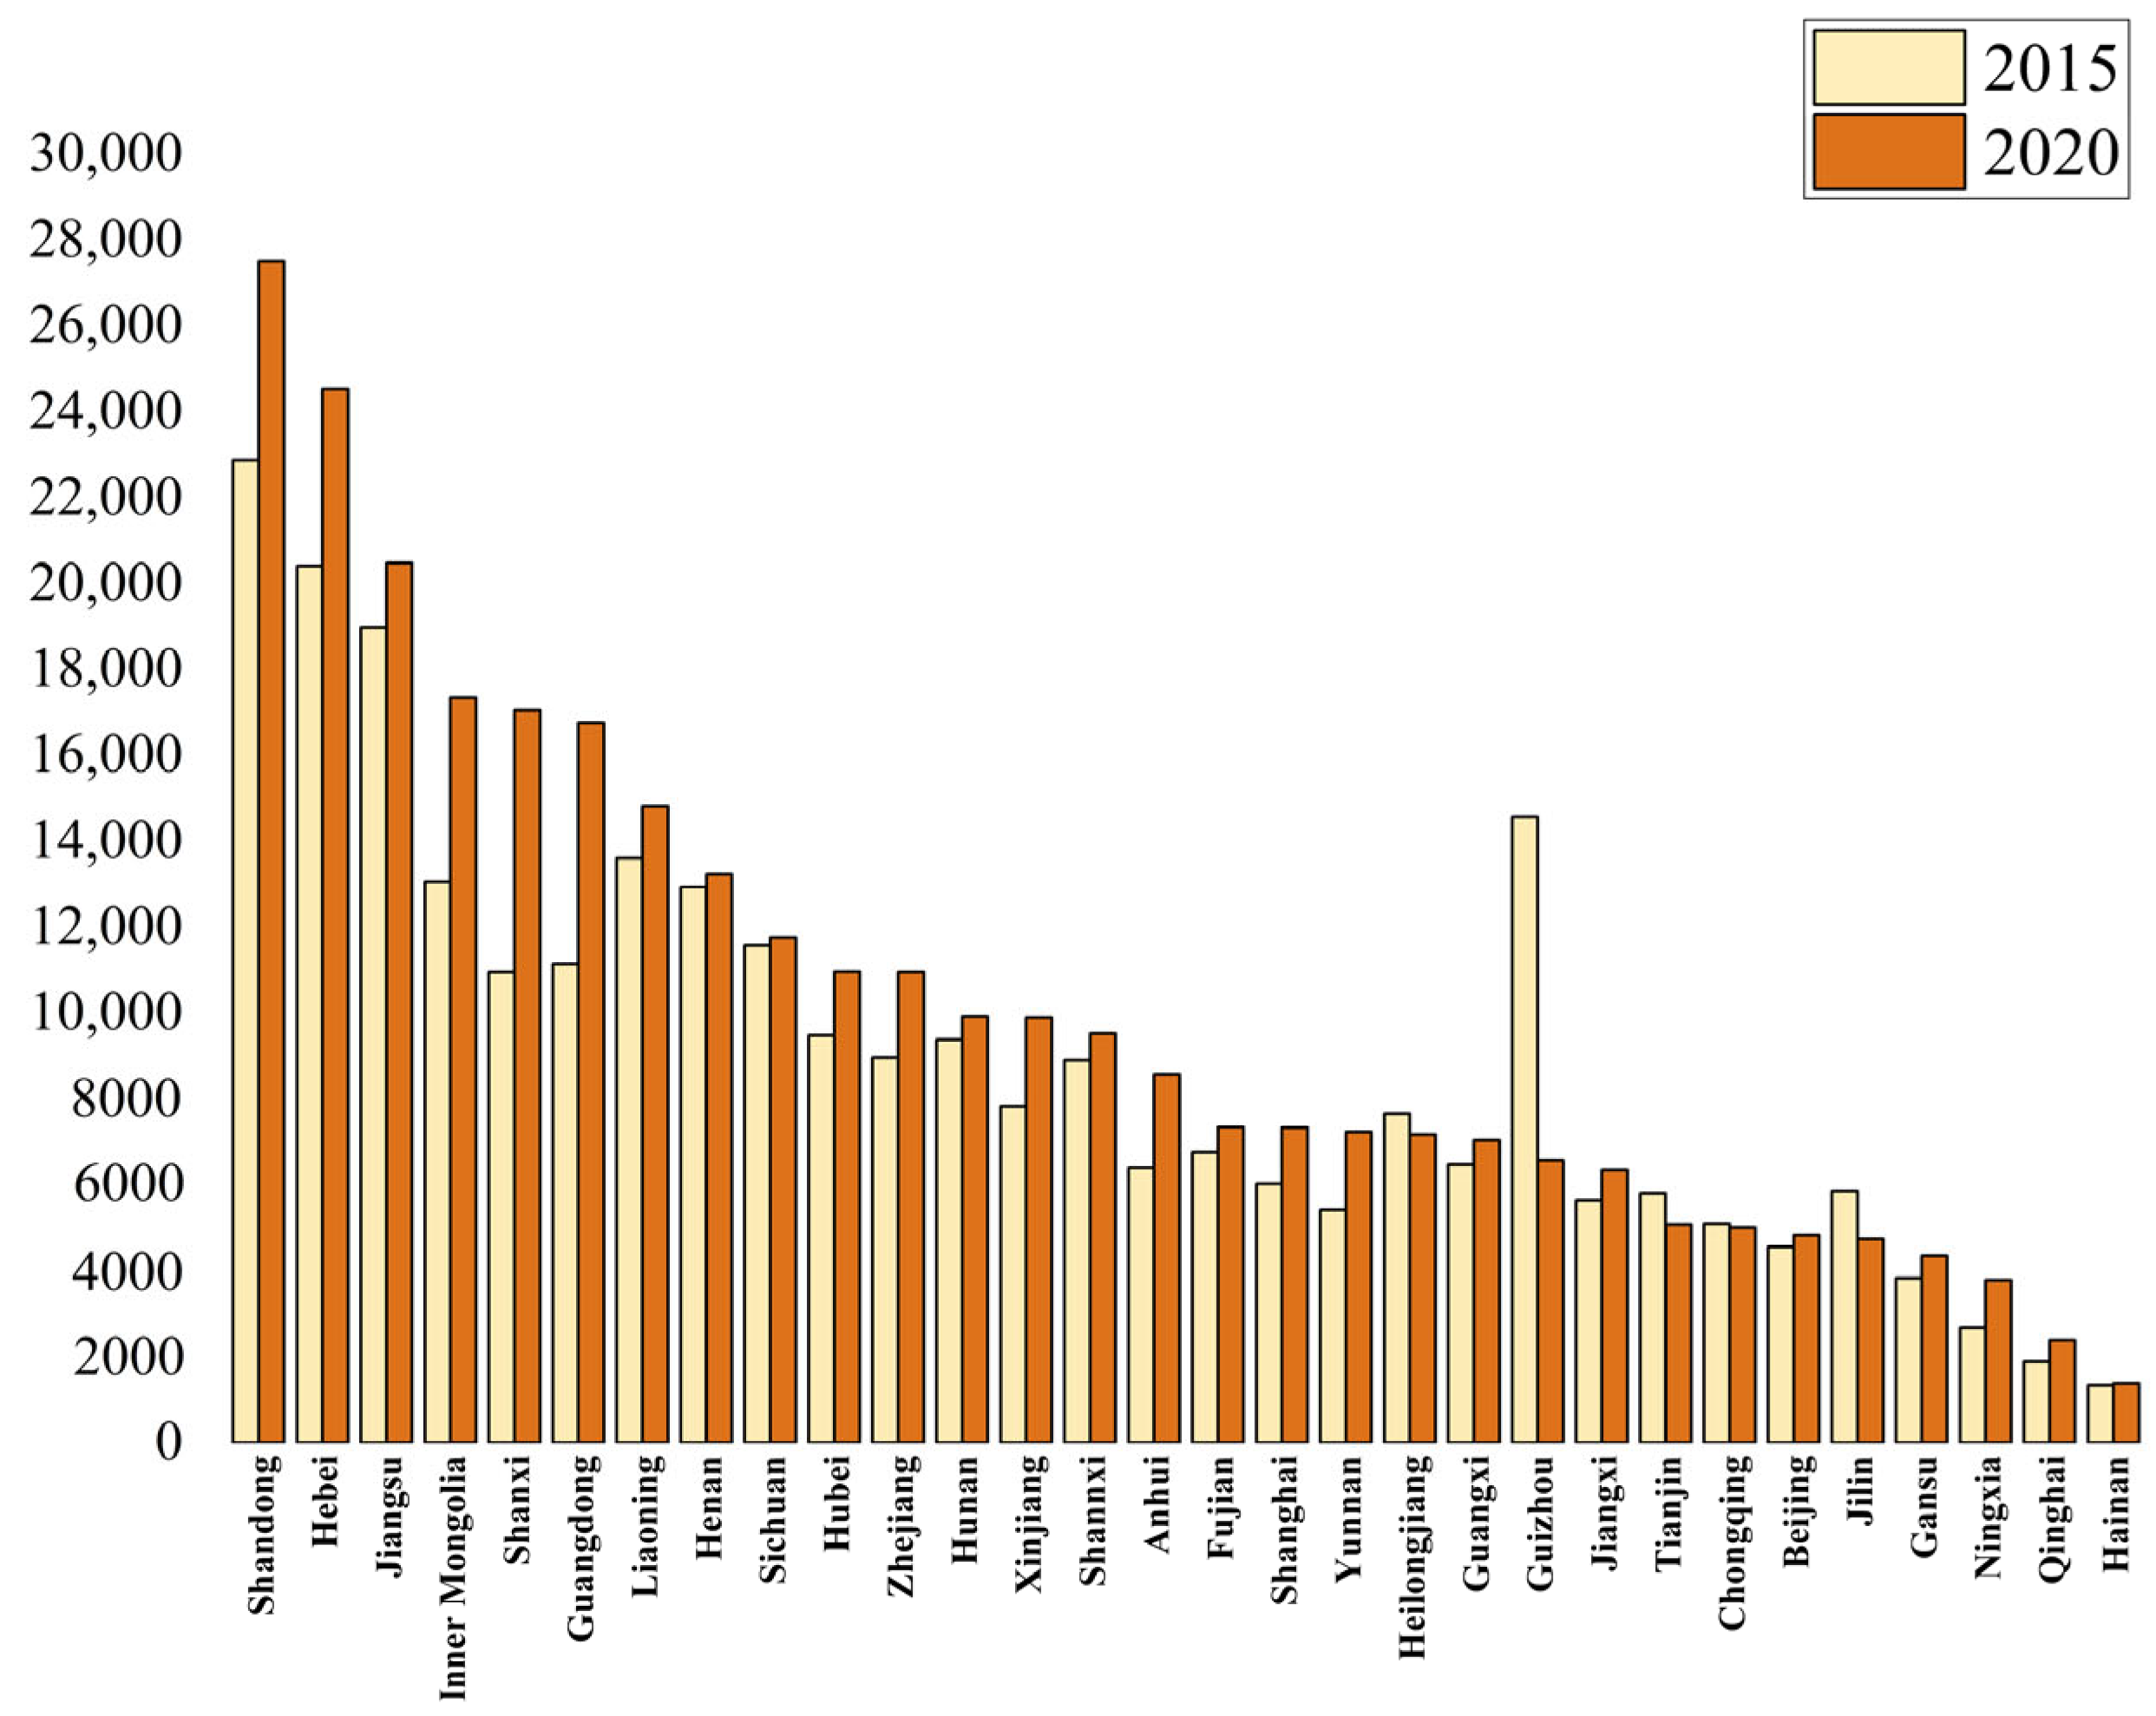
4.1.2. Energy Flow Embodied in Inter-Provincial Trade
4.2. Embodied Energy Flow in Critical Provinces
4.2.1. Inter-Provincial Consumption-Side Embodied Energy Flow
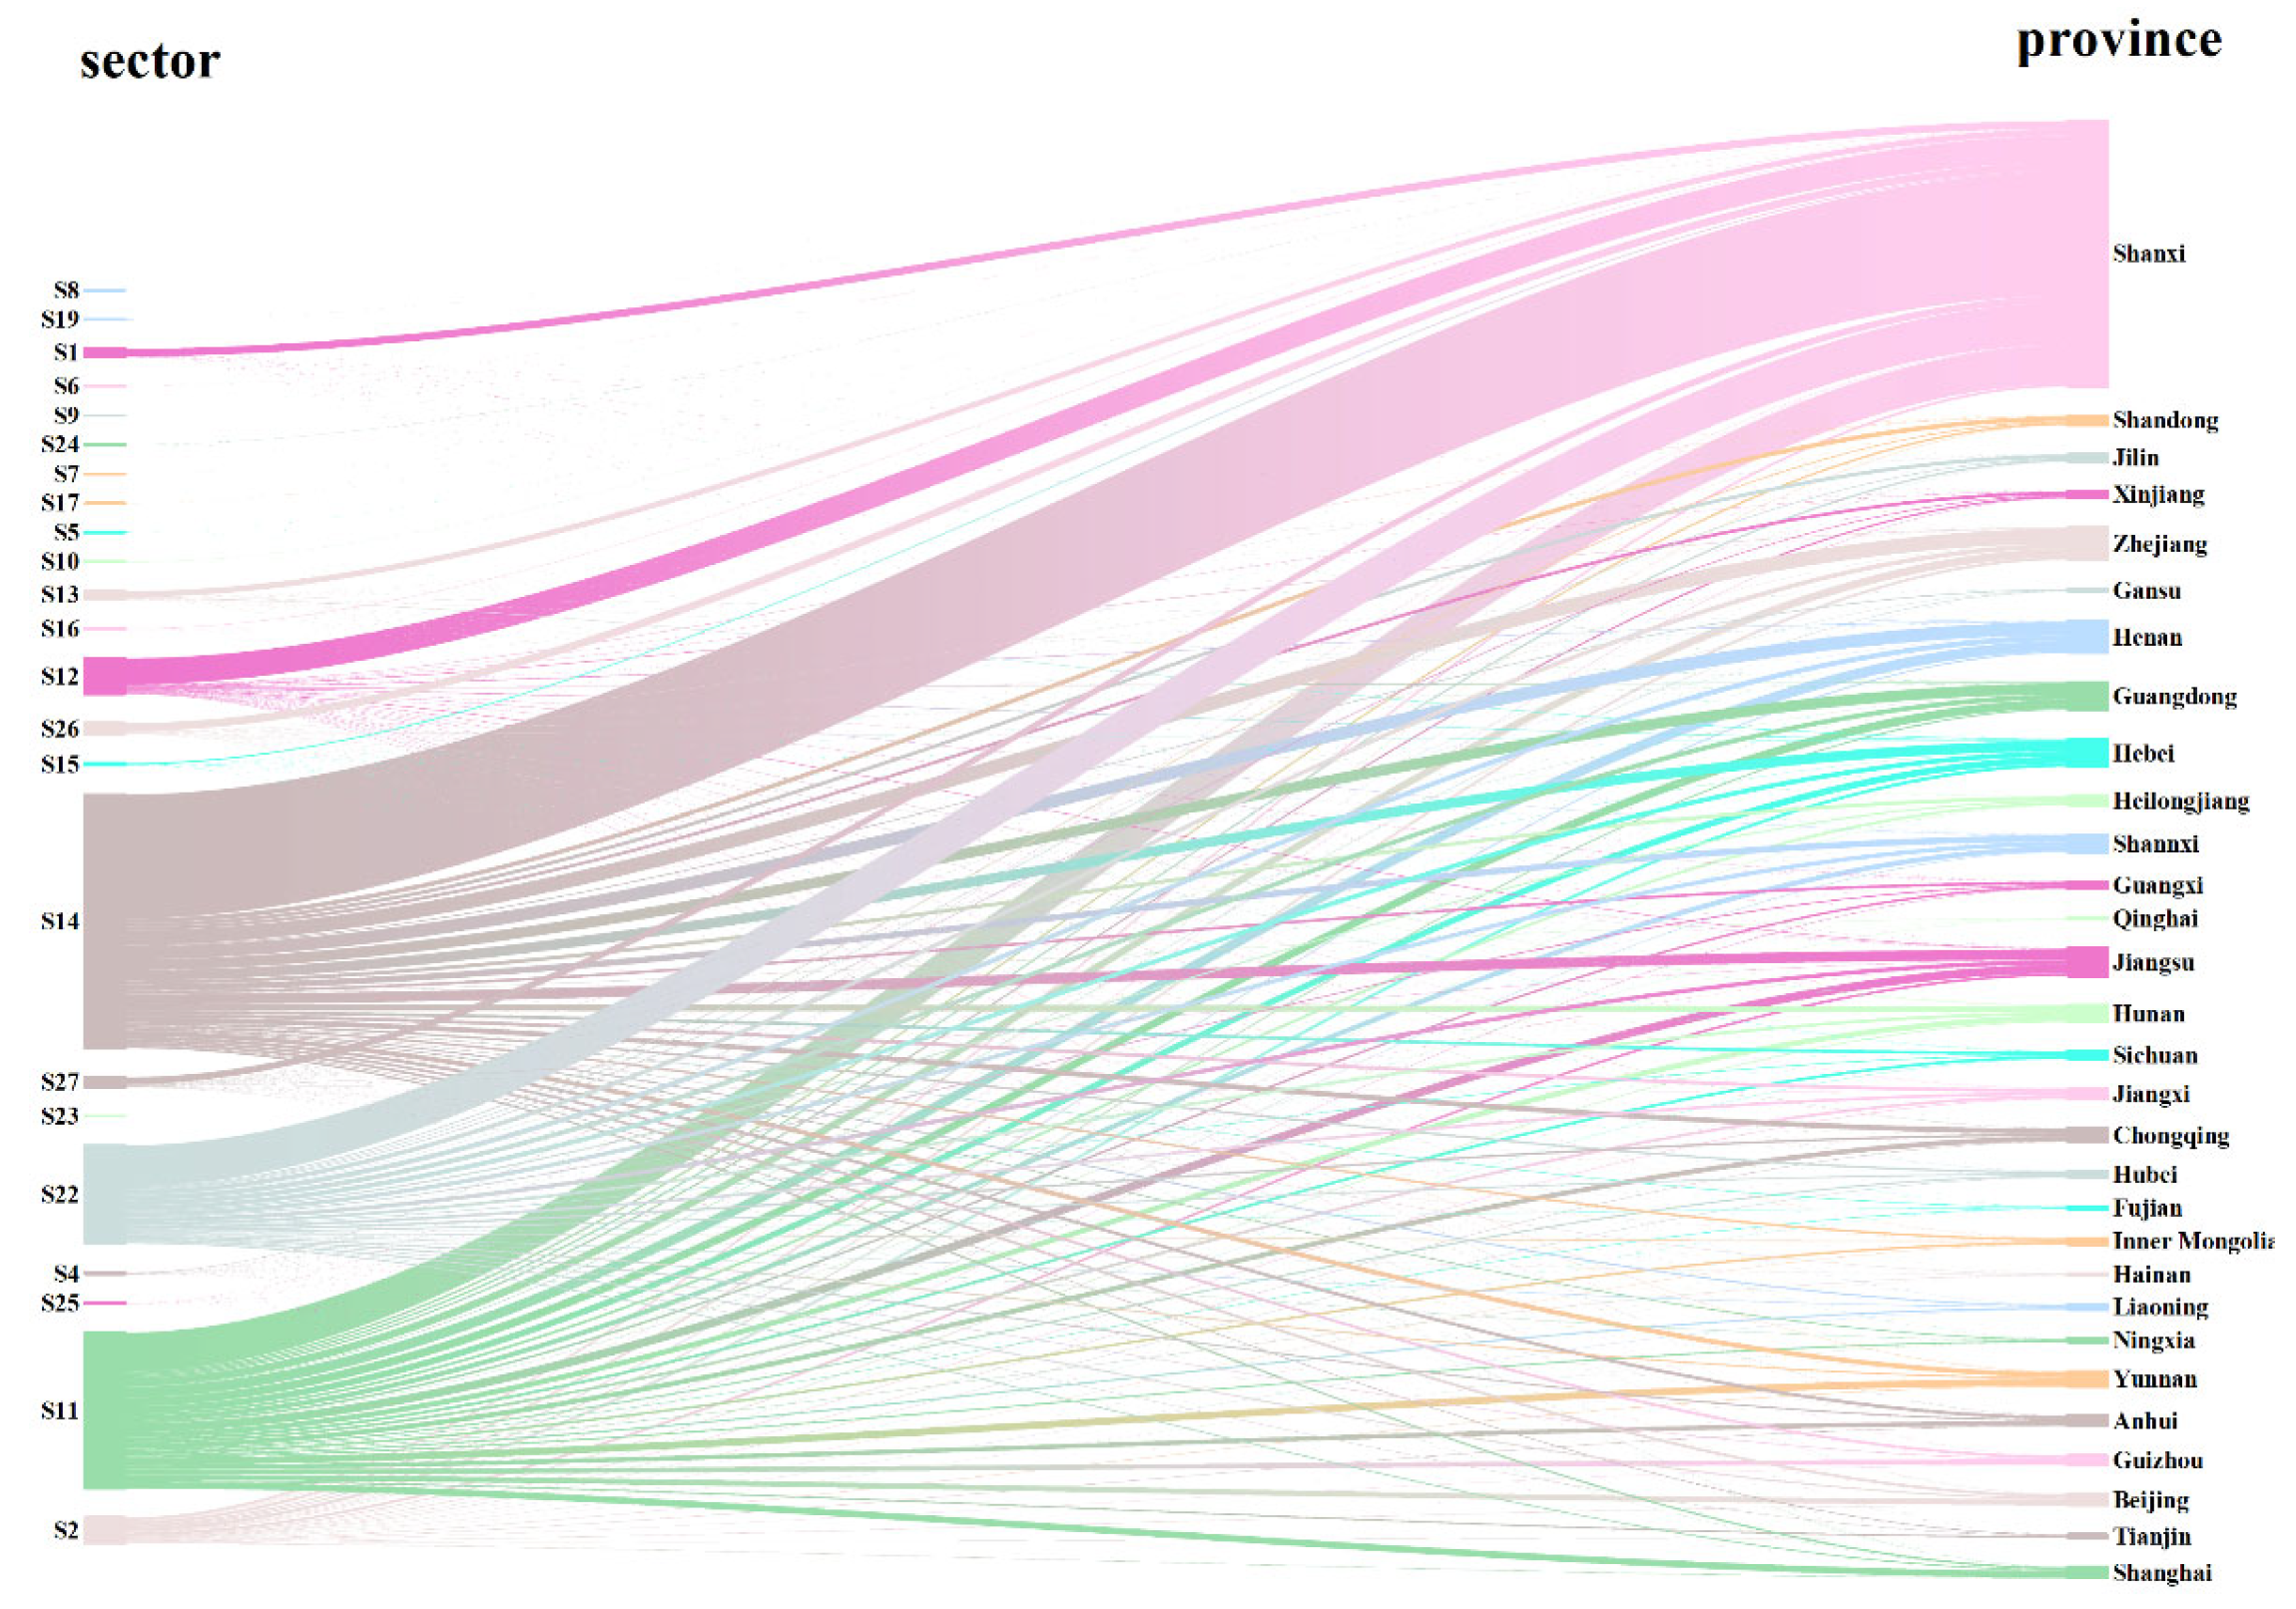
4.2.2. Inter-Sectoral Consumption-Based Embodied Energy Flow
4.3. Embodied Coal Flow
4.3.1. Total Embodied Coal Consumption
4.3.2. Coal Flow Embodied in Inter-Provincial Trade
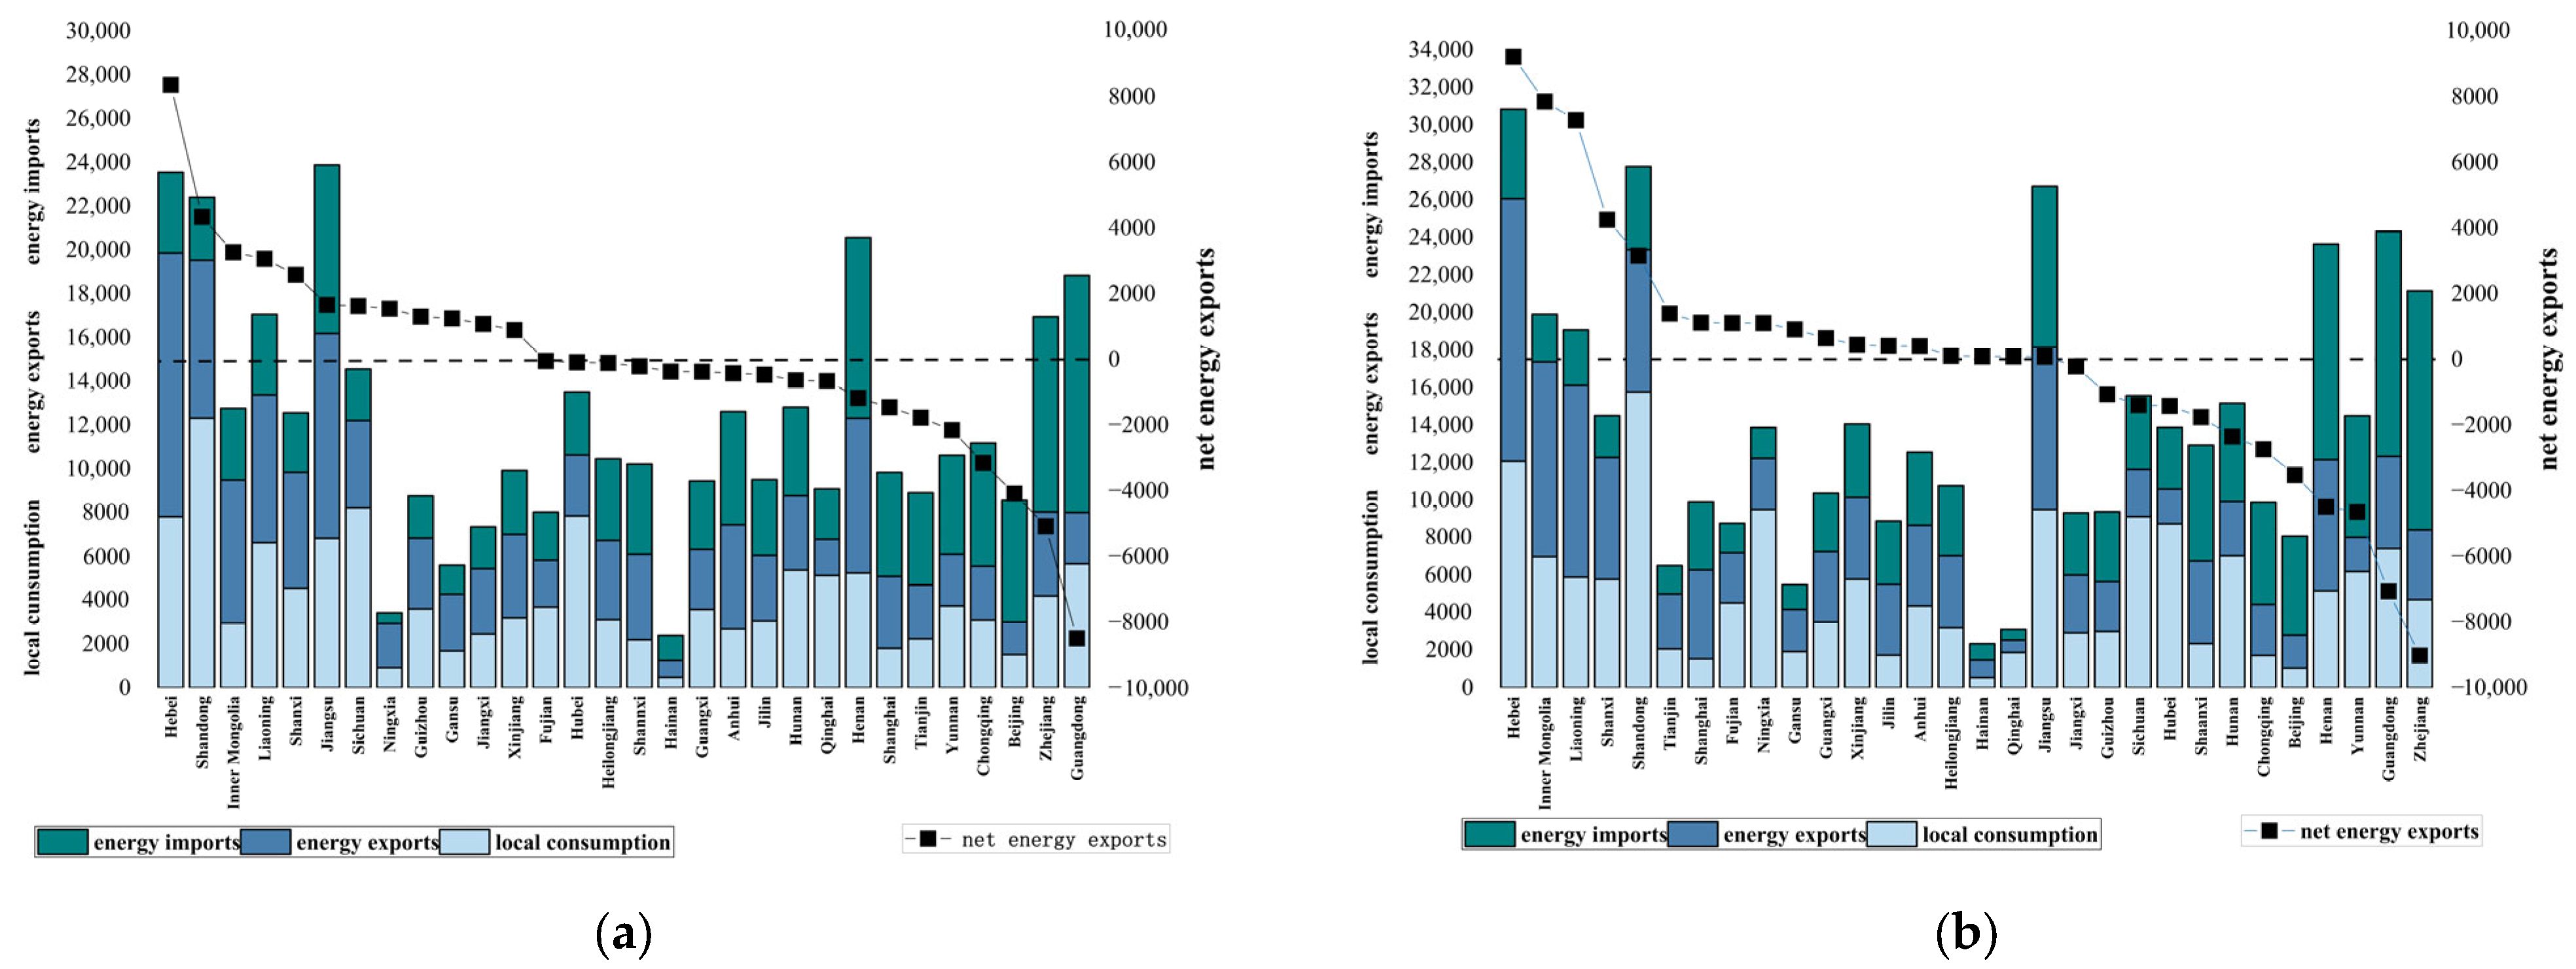
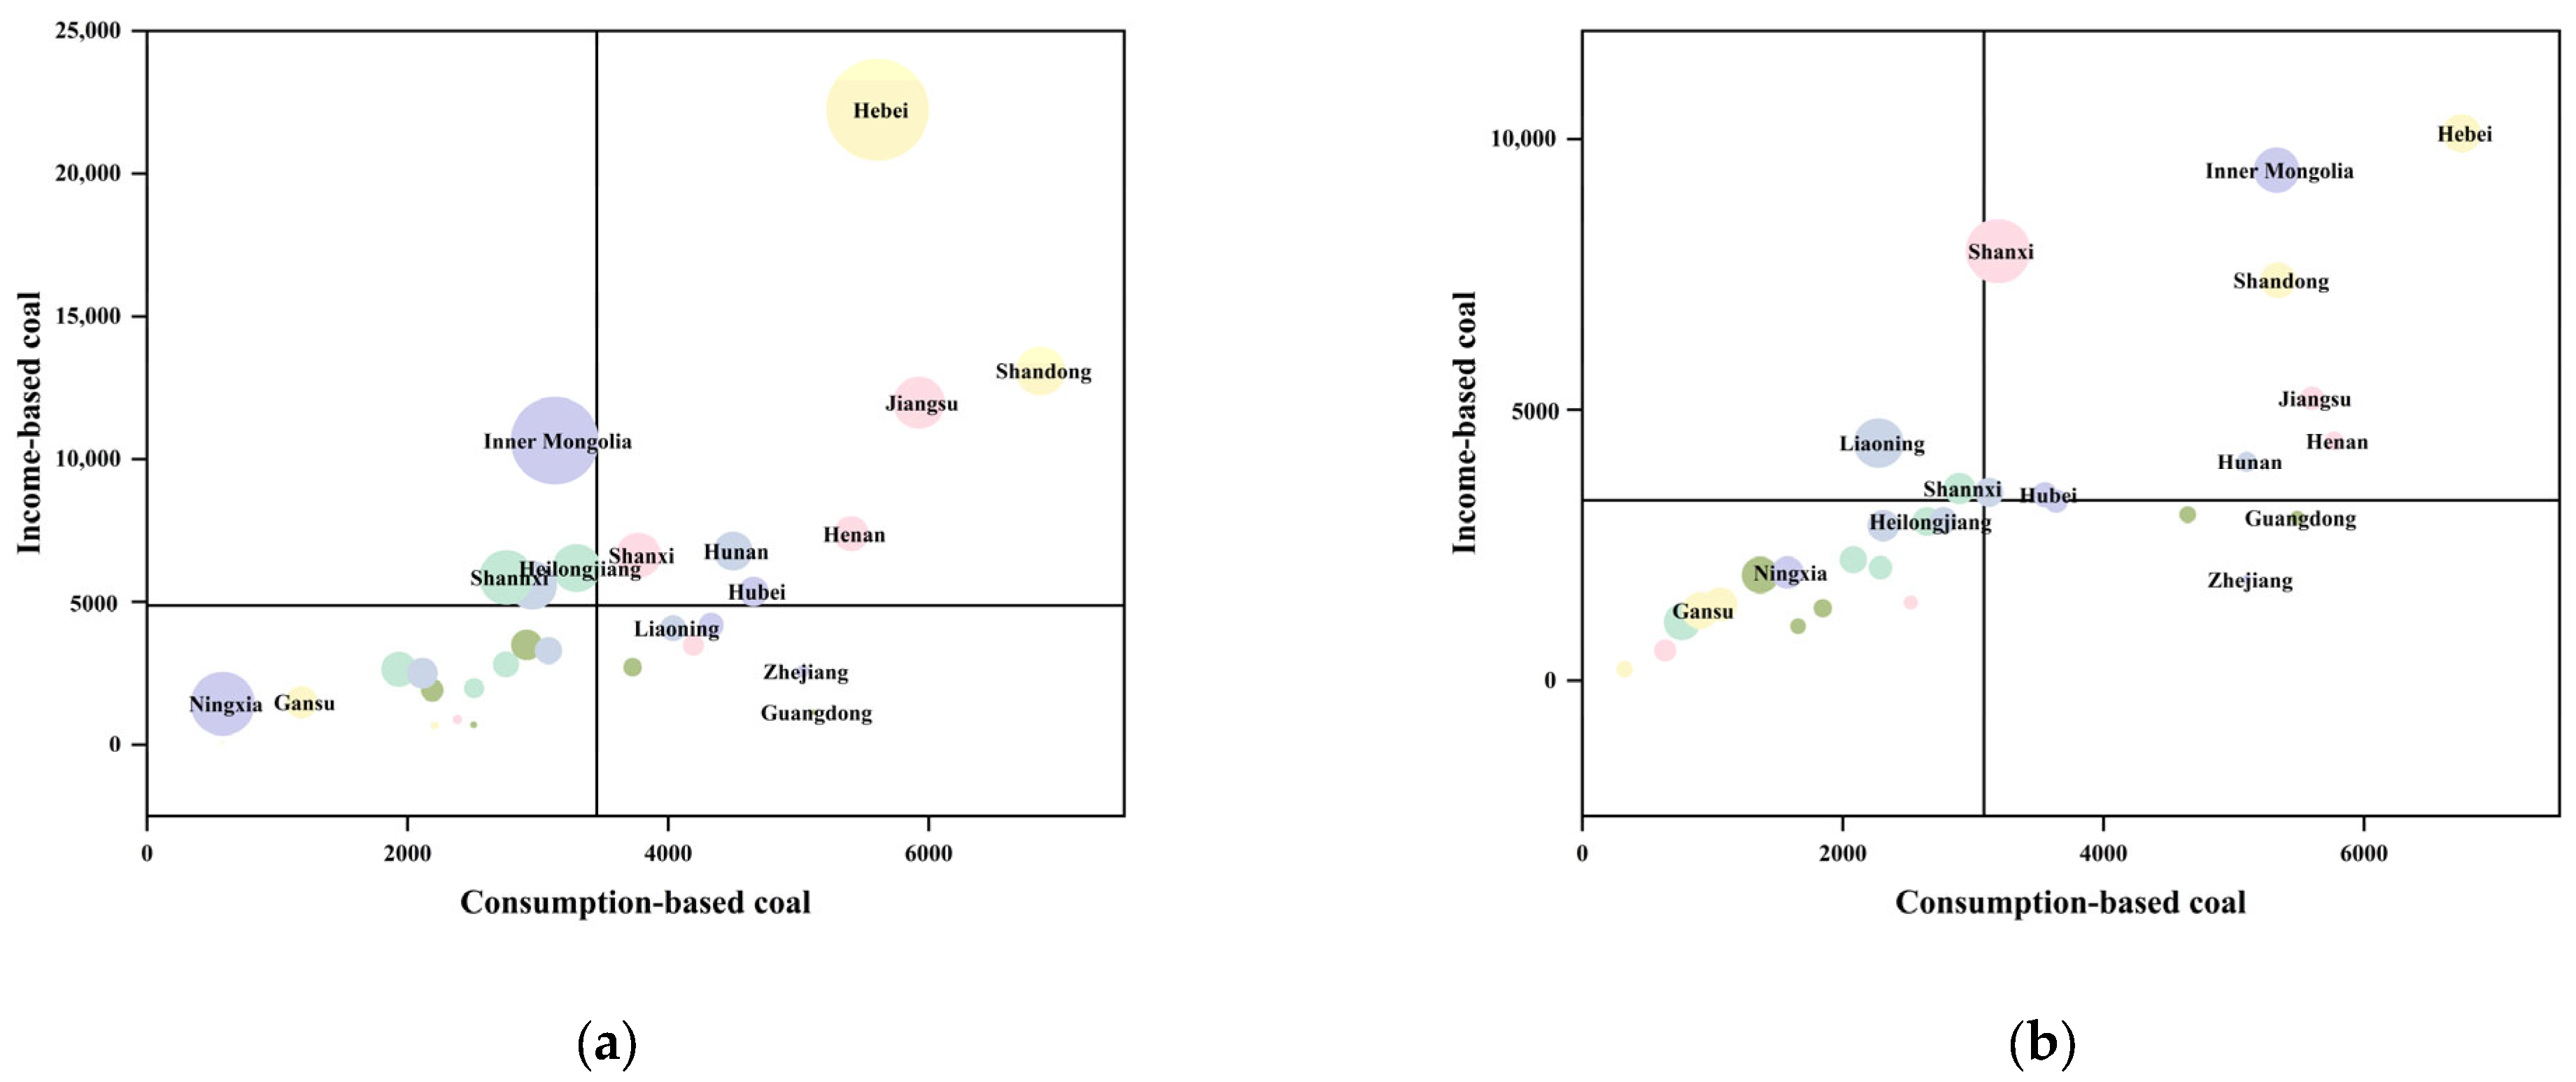
4.4. Synthesis of Consumption-Based and Income-Based Accounting
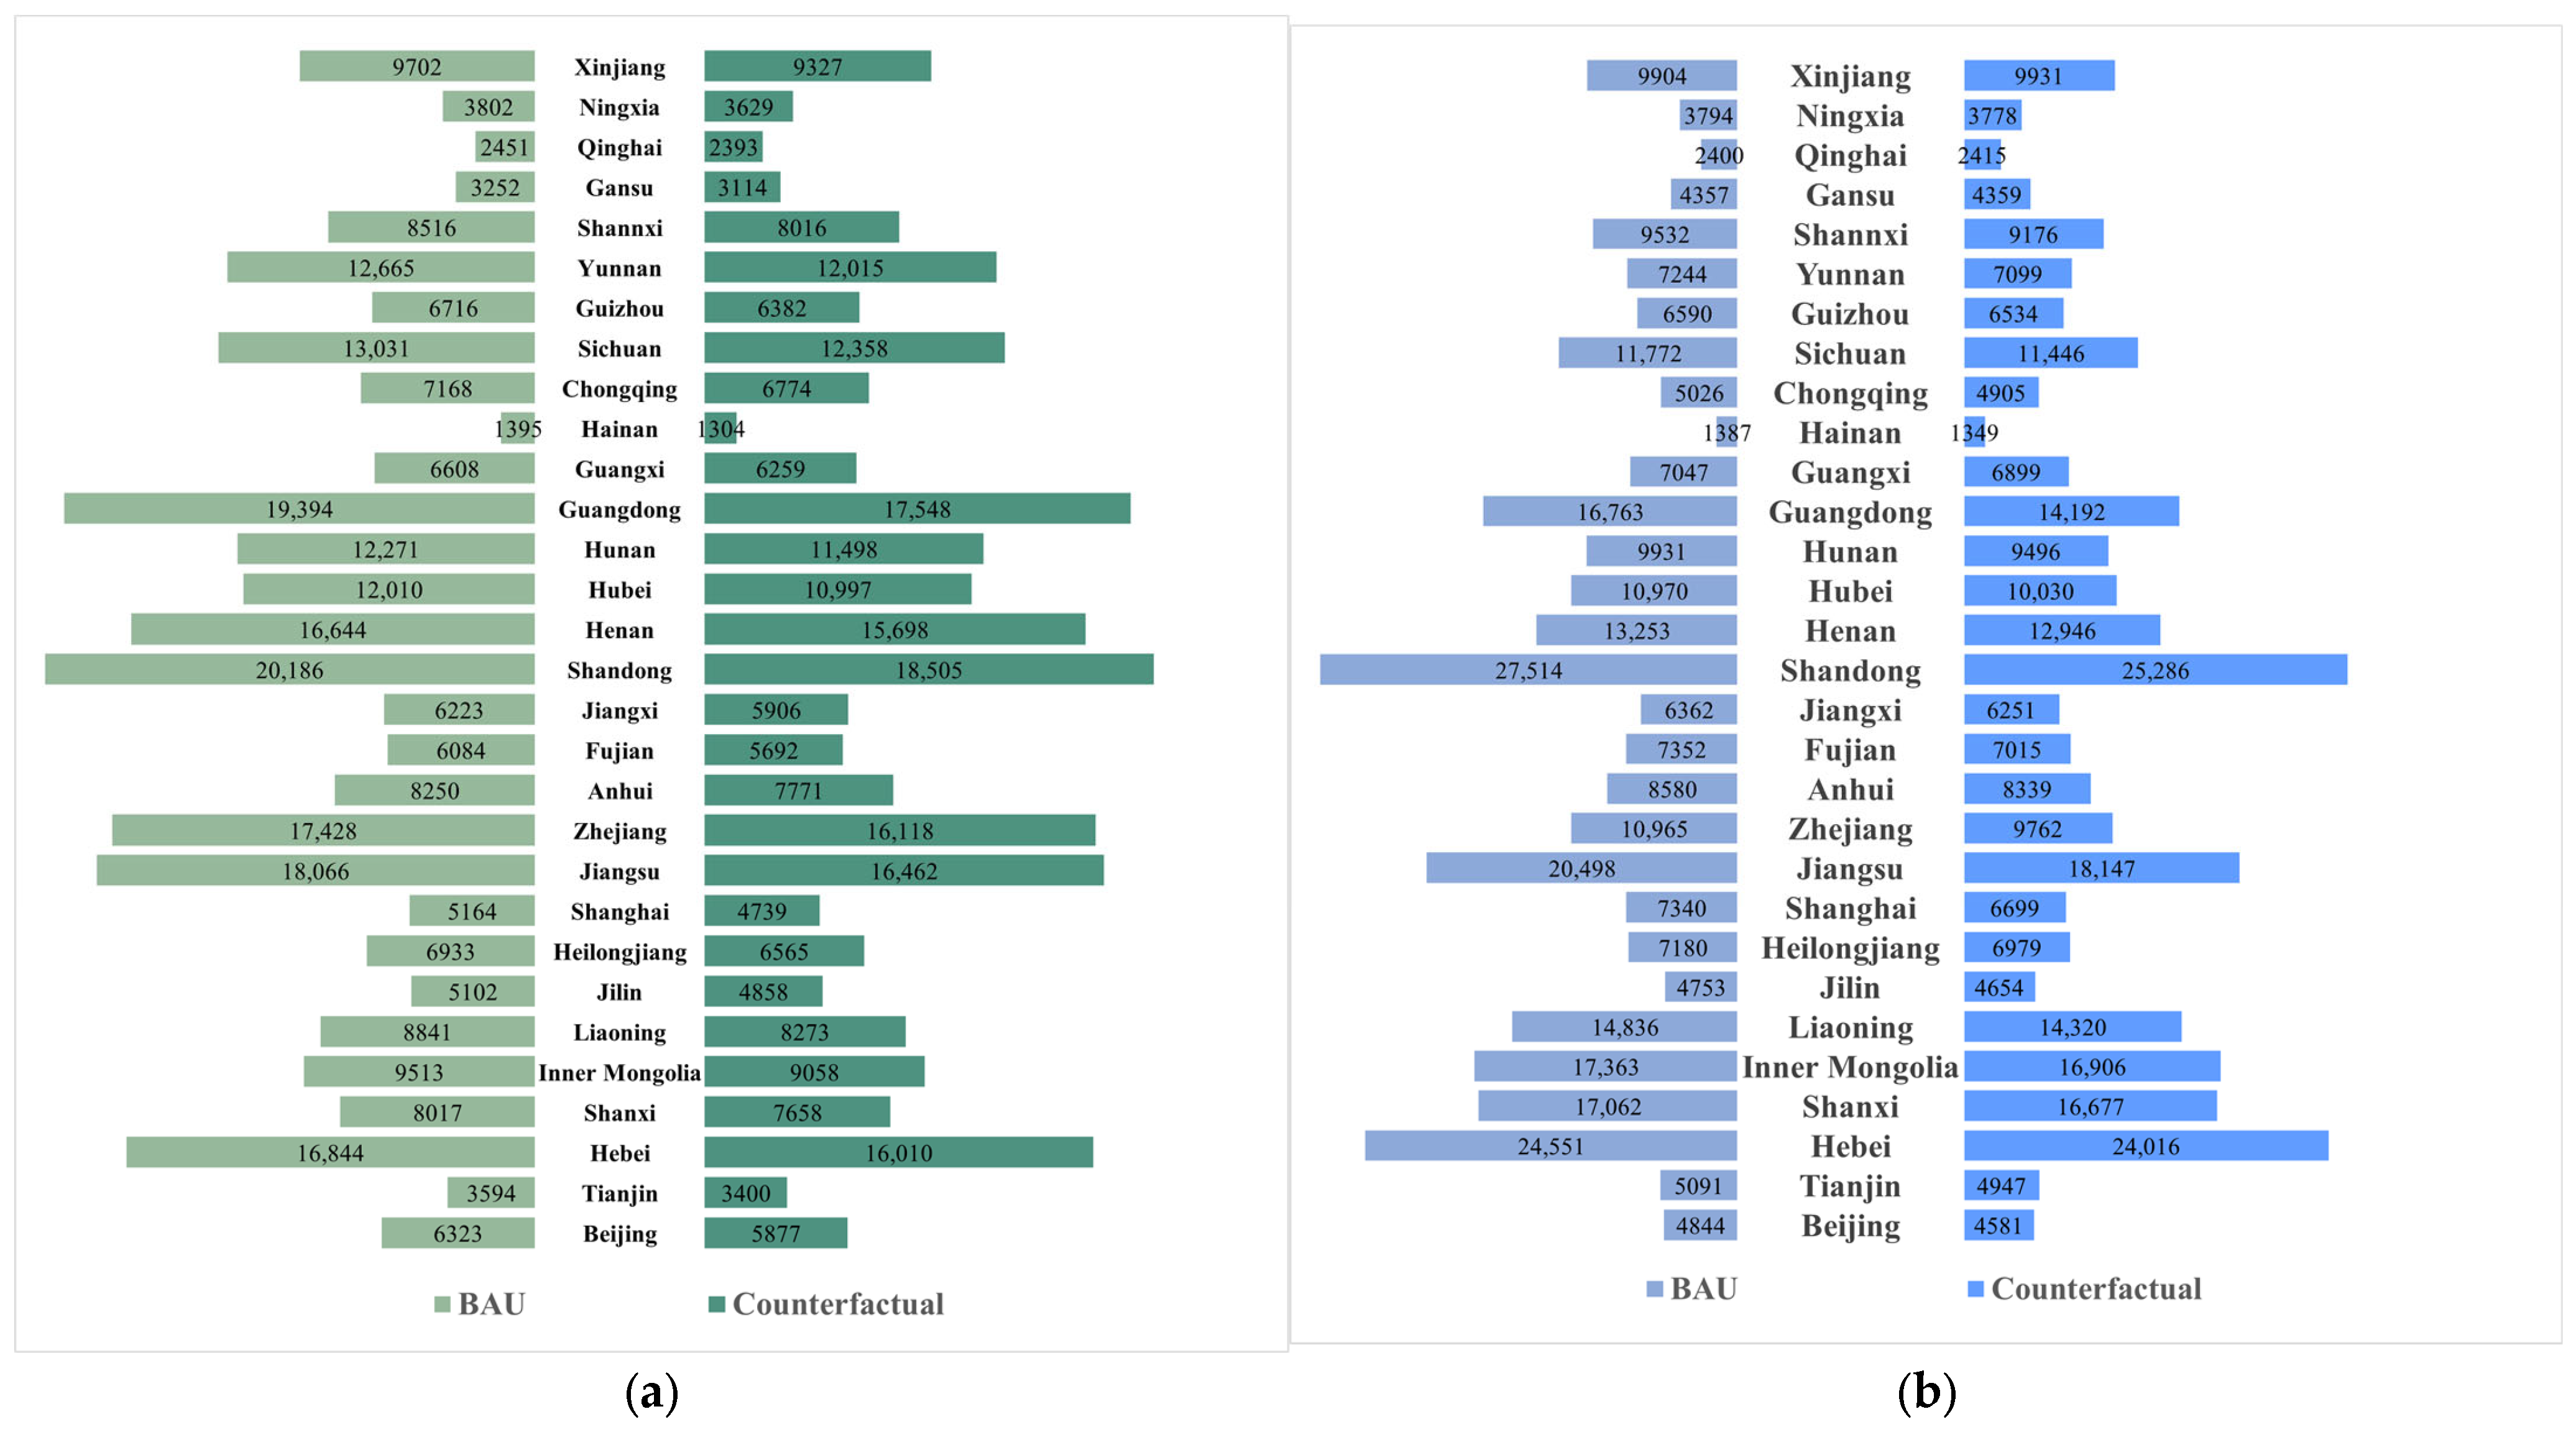
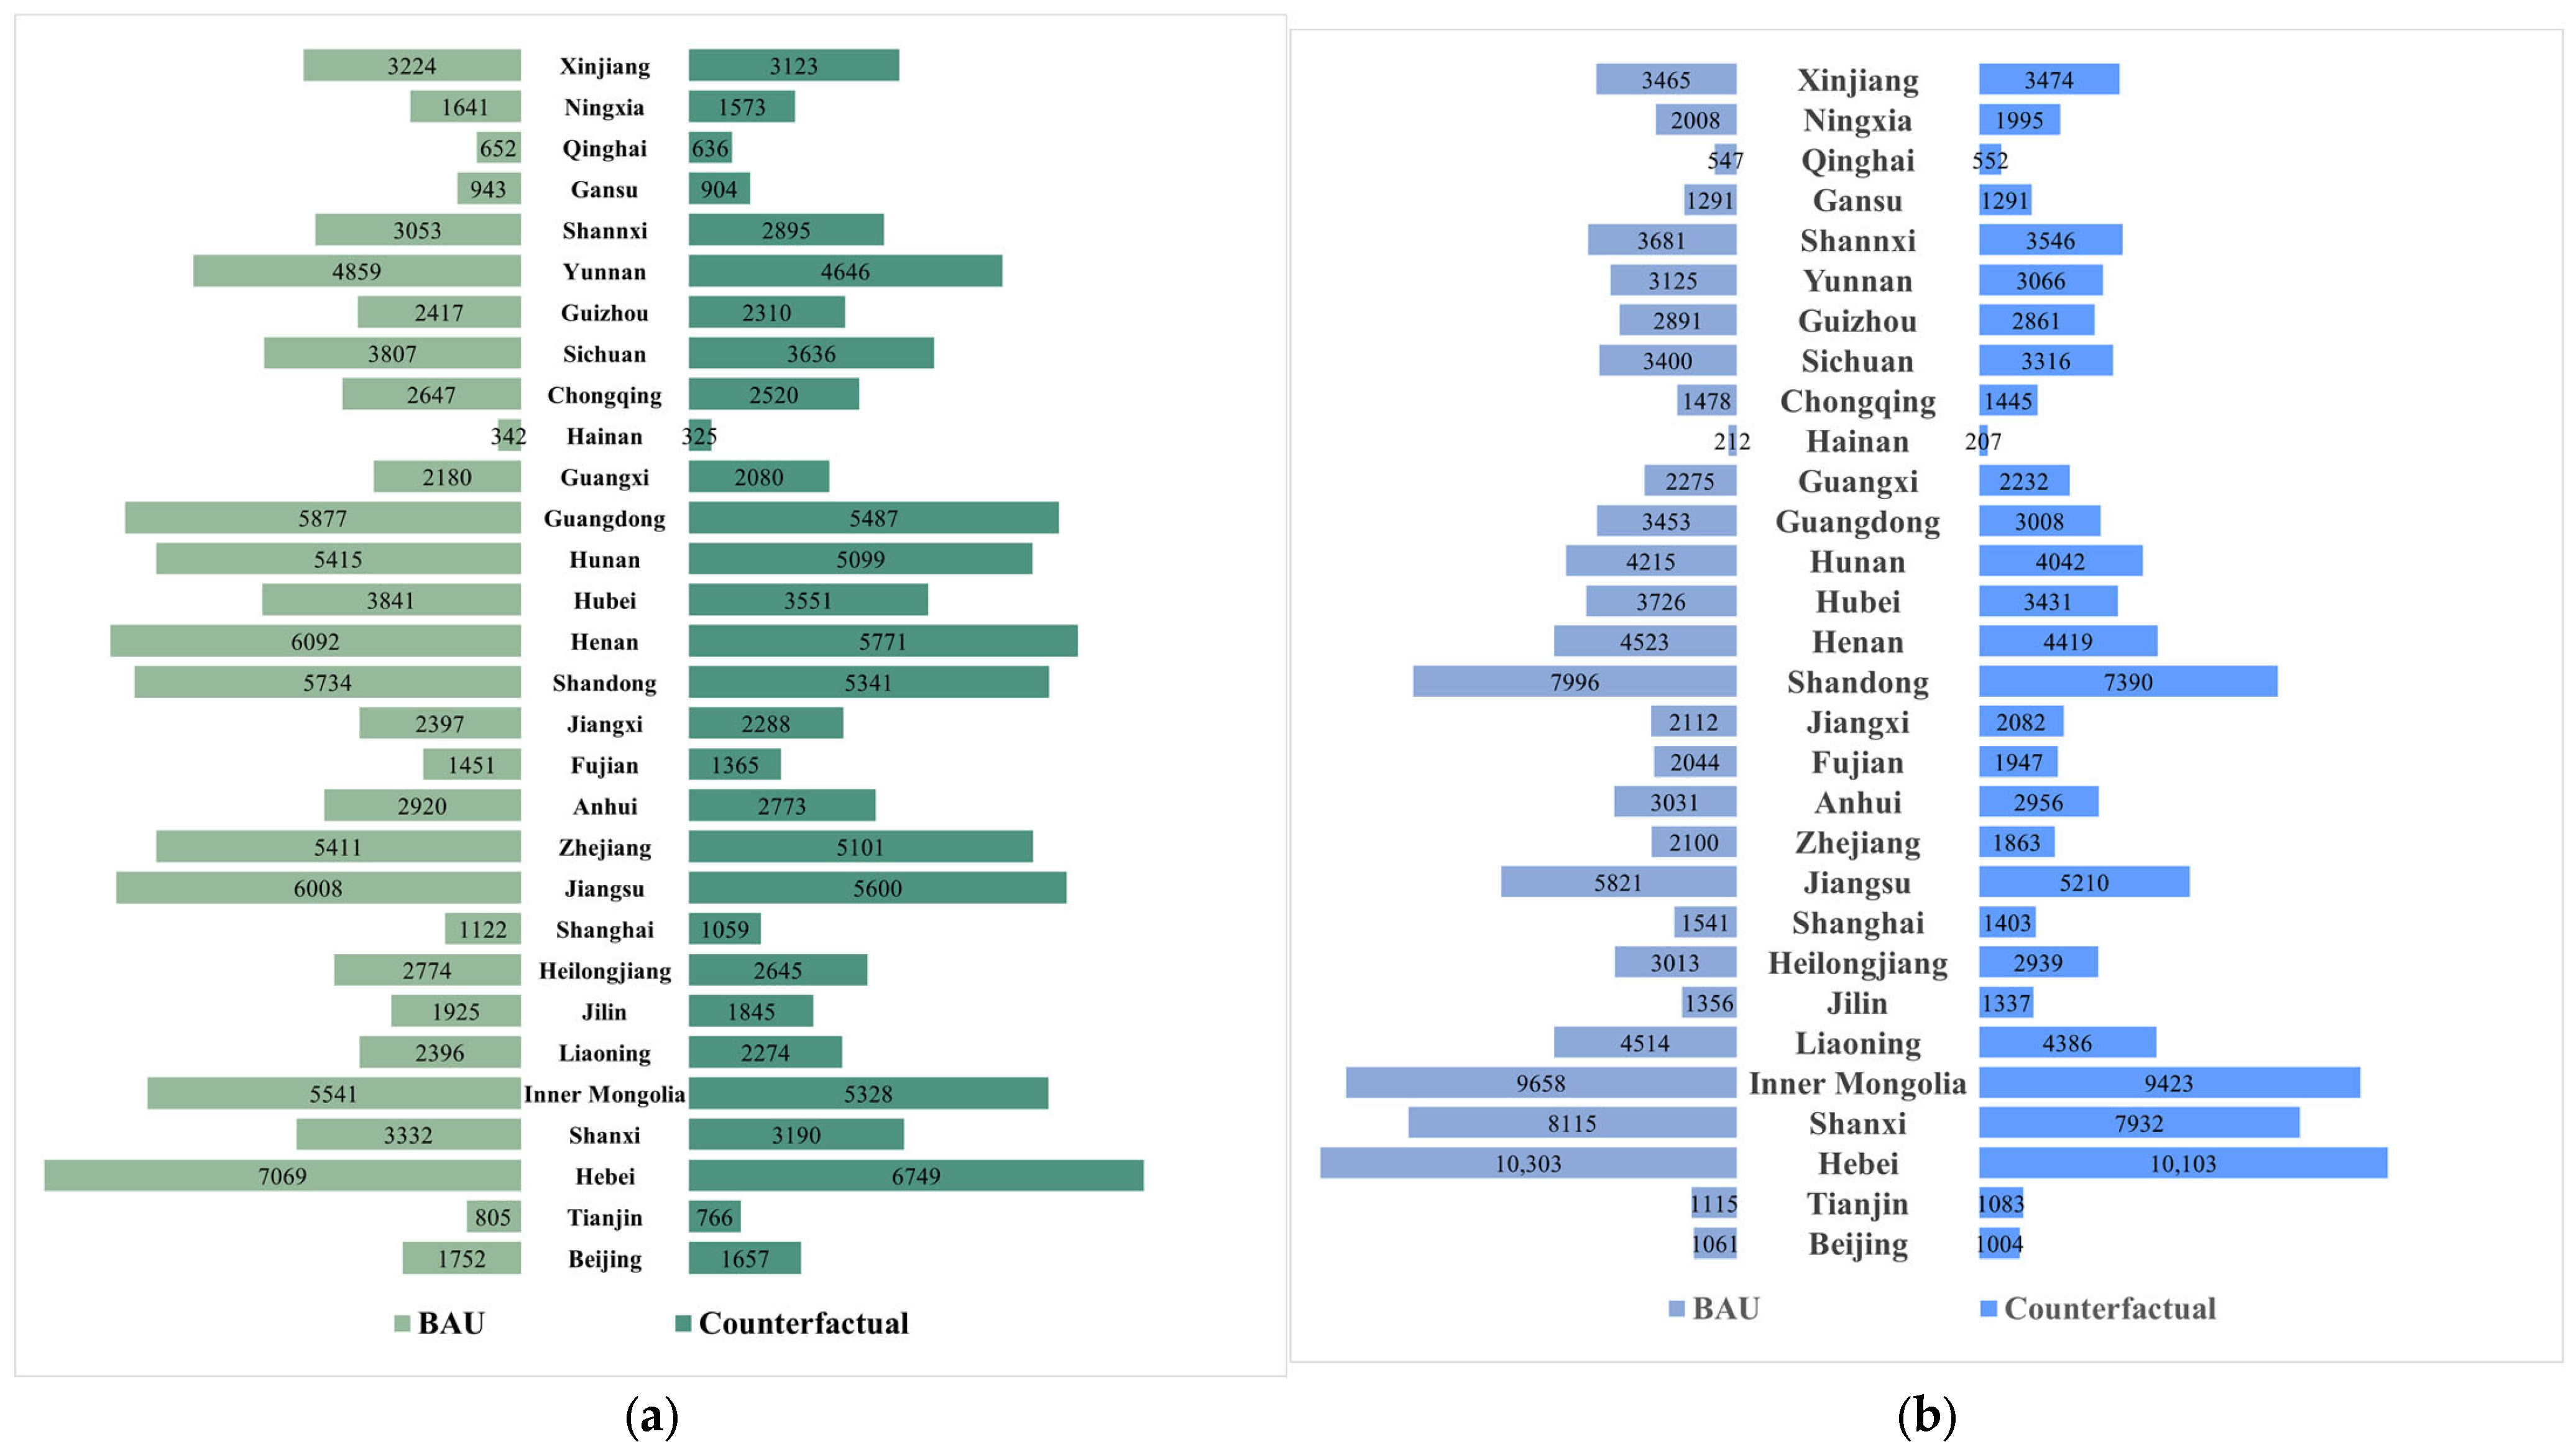
4.5. Counterfactual Analysis
5. Conclusions and Suggestions
5.1. Conclusions
5.2. Policy Suggestions
5.3. Shortcomings
Author Contributions
Funding
Data Availability Statement
Conflicts of Interest
Abbreviations
| CBA | consumption-based accounting |
| IBA | income-based accounting |
| EE-MRIO | Environmentally extended multi-regional input–output |
| PP | Petroleum processing, coking, and nuclear fuel processing |
| PE | Production and supply of electricity and heat |
| CM | Coal mining and pressing |
| SM | Smelting and pressing of ferrous and nonferrous metals |
| CH | Chemical industry |
| NM | Nonmetal mineral products |
| FF | Farming, Forestry, Animal Husbandry, Fishing, and Water conservation |
| TS | Transportation and storage |
| WR | Wholesale and Retail trade services |
| MM | Metals mining and pressing |
Appendix A. The Administrative Regions Analyzed in the Research
| NO. | Administrative Regions | NO. | Administrative Regions |
|---|---|---|---|
| P1 | Beijing | P16 | Henan |
| P2 | Tianjin | P17 | Hubei |
| P3 | Hebei | P18 | Hunan |
| P4 | Shanxi | P19 | Guangdong |
| P5 | Inner Mongolia | P20 | Guangxi |
| P6 | Liaoning | P21 | Hainan |
| P7 | Jilin | P22 | Chongqing |
| P8 | Heilongjiang | P23 | Sichuan |
| P9 | Shanghai | P24 | Guizhou |
| P10 | Jiangsu | P25 | Yunnan |
| P11 | Zhejiang | P26 | Shaanxi |
| P12 | Anhui | P27 | Gansu |
| P13 | Fujian | P28 | Qinghai |
| P14 | Jiangxi | P29 | Ningxia |
| P15 | Shandong | P30 | Xinjiang |
Appendix B. Details of Merged Sectors
| Symbol | Merged 27 Sectors | The 45 Sectors of the Provincial Energy List | 42-Sector Data (MRIO Tables) |
|---|---|---|---|
| S1 | Farming, Forestry, Animal Husbandry, Fishing, and Water conservation | Farming, Forestry, Animal Husbandry, Fishery and Water Conservancy | Agriculture, Forestry, Animal Husbandry, and Fishery |
| S2 | Coal mining and pressing | Coal Mining and Dressing | Mining and washing of coal |
| S3 | Petroleum and Natural gas extraction | Petroleum and Natural Gas Extraction | Extraction of petroleum and natural gas |
| S4 | Metals mining and pressing | Ferrous Metals Mining and Dressing | Mining and processing of metal ores |
| Nonferrous Metals Mining and Dressing | |||
| S5 | Nonferrous metals and other minerals mining and pressing | Nonmetal Minerals Mining and Dressing | Mining and processing of nonmetal and other ores |
| Other Minerals Mining and Dressing | |||
| S6 | Food manufacturing and Tobacco processing | Food Processing | Food and tobacco processing |
| Food Production | |||
| Beverage Production | |||
| Tobacco Processing | |||
| S7 | Textile Industry | Textile Industry | Textile industry |
| S8 | Textile, Clothing, Shoes, Hats, Leather, Feather, and Down products | Garments and Other Fiber Products | Manufacture of leather, fur, feather, and related products |
| Leather, Furs, Down, and Related Products | |||
| S9 | Wood processing and Furniture manufacturing | Logging and Transport of Wood and Bamboo | Processing of timber and furniture |
| Timber Processing, Bamboo, Cane, Palm and Straw Products | |||
| Furniture Manufacturing | |||
| S10 | Paper printing, Stationery, Sports goods manufacturing | Paper Making and Paper Products | Manufacture of paper, printing, and articles for culture, education, and sports activities |
| Printing and Record Medium Reproduction | |||
| Cultural, Educational, and Sports Articles | |||
| S11 | Petroleum processing, coking, and nuclear fuel processing | Petroleum Processing and Coking | Processing of petroleum, coking, and processing of nuclear fuel |
| S12 | Chemical industry | Raw Chemical Materials and Chemical Products | Manufacture of chemical products |
| Medical and Pharmaceutical Products | |||
| Chemical Fiber | |||
| Rubber Products | |||
| Plastic Products | |||
| S13 | Nonmetal mineral products | Nonmetal Mineral Products | Manuf. of non-metallic mineral products |
| S14 | Smelting and pressing of ferrous and nonferrous metals | Smelting and Pressing of Ferrous Metals | Smelting and processing of metals |
| Smelting and Pressing of Nonferrous Metals | |||
| S15 | Metal products | Metal Products | Manufacture of metal products |
| S16 | General and special equipment manufacturing | Ordinary Machinery | Manufacture of general-purpose machinery |
| Equipment for Special Purpose | Manufacture of special-purpose machinery | ||
| S17 | Transportation equipment manufacturing industry | Transportation Equipment | Manufacture of transport equipment |
| S18 | Electrical equipment and machinery | Electric Equipment and Machinery | Manufacture of electrical machinery and equipment |
| S19 | Communications equipment, computers, and other electronic equipment | Electronic and Telecommunications Equipment | Manufacture of communication equipment, computers, and other electronic equipment |
| S20 | Instruments, Meters, Cultural and Office machinery | Instruments, Meters, Cultural and Office Machinery | Manufacture of measuring instruments |
| S21 | Other manufacturing industries | Other Manufacturing Industry | Other manufacturing and waste resources |
| Scrap and waste | Repair of metal products, machinery, and equipment | ||
| S22 | Production and supply of electricity and heat | Electric Power, Steam, and Hot Water Production and Supply | Production and distribution of electric power and heat power |
| S23 | Production and supply of gas and water | Gas Production and Supply | Production and distribution of gas |
| Tap Water Production and Supply | Production and distribution of tap water | ||
| S24 | Construction | Construction | Construction |
| S25 | Transportation and storage | Transport, Storage, Postal, and Telecommunications Services | Wholesale and retail trades |
| Accommodation and catering | |||
| S26 | Wholesale and Retail trade services | Wholesale, Retail Trade, and Catering Service | Transport, storage, and postal services |
| Information transfer, software, and information technology services | |||
| S27 | Accommodations and catering | Other | Finance |
| Real estate | |||
| Leasing and commercial services | |||
| Scientific research | |||
| Polytechnic services | |||
| Administration of water, environment, and public facilities | |||
| Resident, repair, and other services | |||
| Education | |||
| Health care and social work | |||
| Culture, sports, and entertainment | |||
| Public administration, social insurance, and social organizations |
Appendix C. Conversion Factors from Physical Units to Coal Equivalent
| Energy | Conversion Factor | Energy | Conversion Factor |
|---|---|---|---|
| Raw Coal | 0.7143 Kgce/kg | Kerosene | 1.4714 Kgce/kg |
| Cleaned Coal | 0.9 Kgce/kg | Diesel | 1.4571 Kgce/kg |
| Other Washed Coal | 0.2857 Kgce/kg | Fuel Oil | 1.4286 Kgce/kg |
| Briquette | 0.4286 Kgce/kg | Liquefied Petroleum Gas | 1.7143 Kgce/kg |
| Coke | 0.9714 Kgce/kg | Refinery Gas | 1.5714 Kgce/kg |
| Coke Oven Gas | 0.6143 Kgce/m3 | Other petroleum products | 1.4286 Kgce/kg |
| Other Natural Gas | 0.3571 Kgce/m3 | Natural Gas | 1.33 Kgce/m3 |
| Other coal coking product | 1.1429 Kgce/kg | Heat | 0.0341 Kgce/kj |
| Crude Oil | 1.4286 Kgce/kg | Electricity | 0.1229 Kgce/10,000 kwh |
| Gasoline | 1.4714 Kgce/kg |
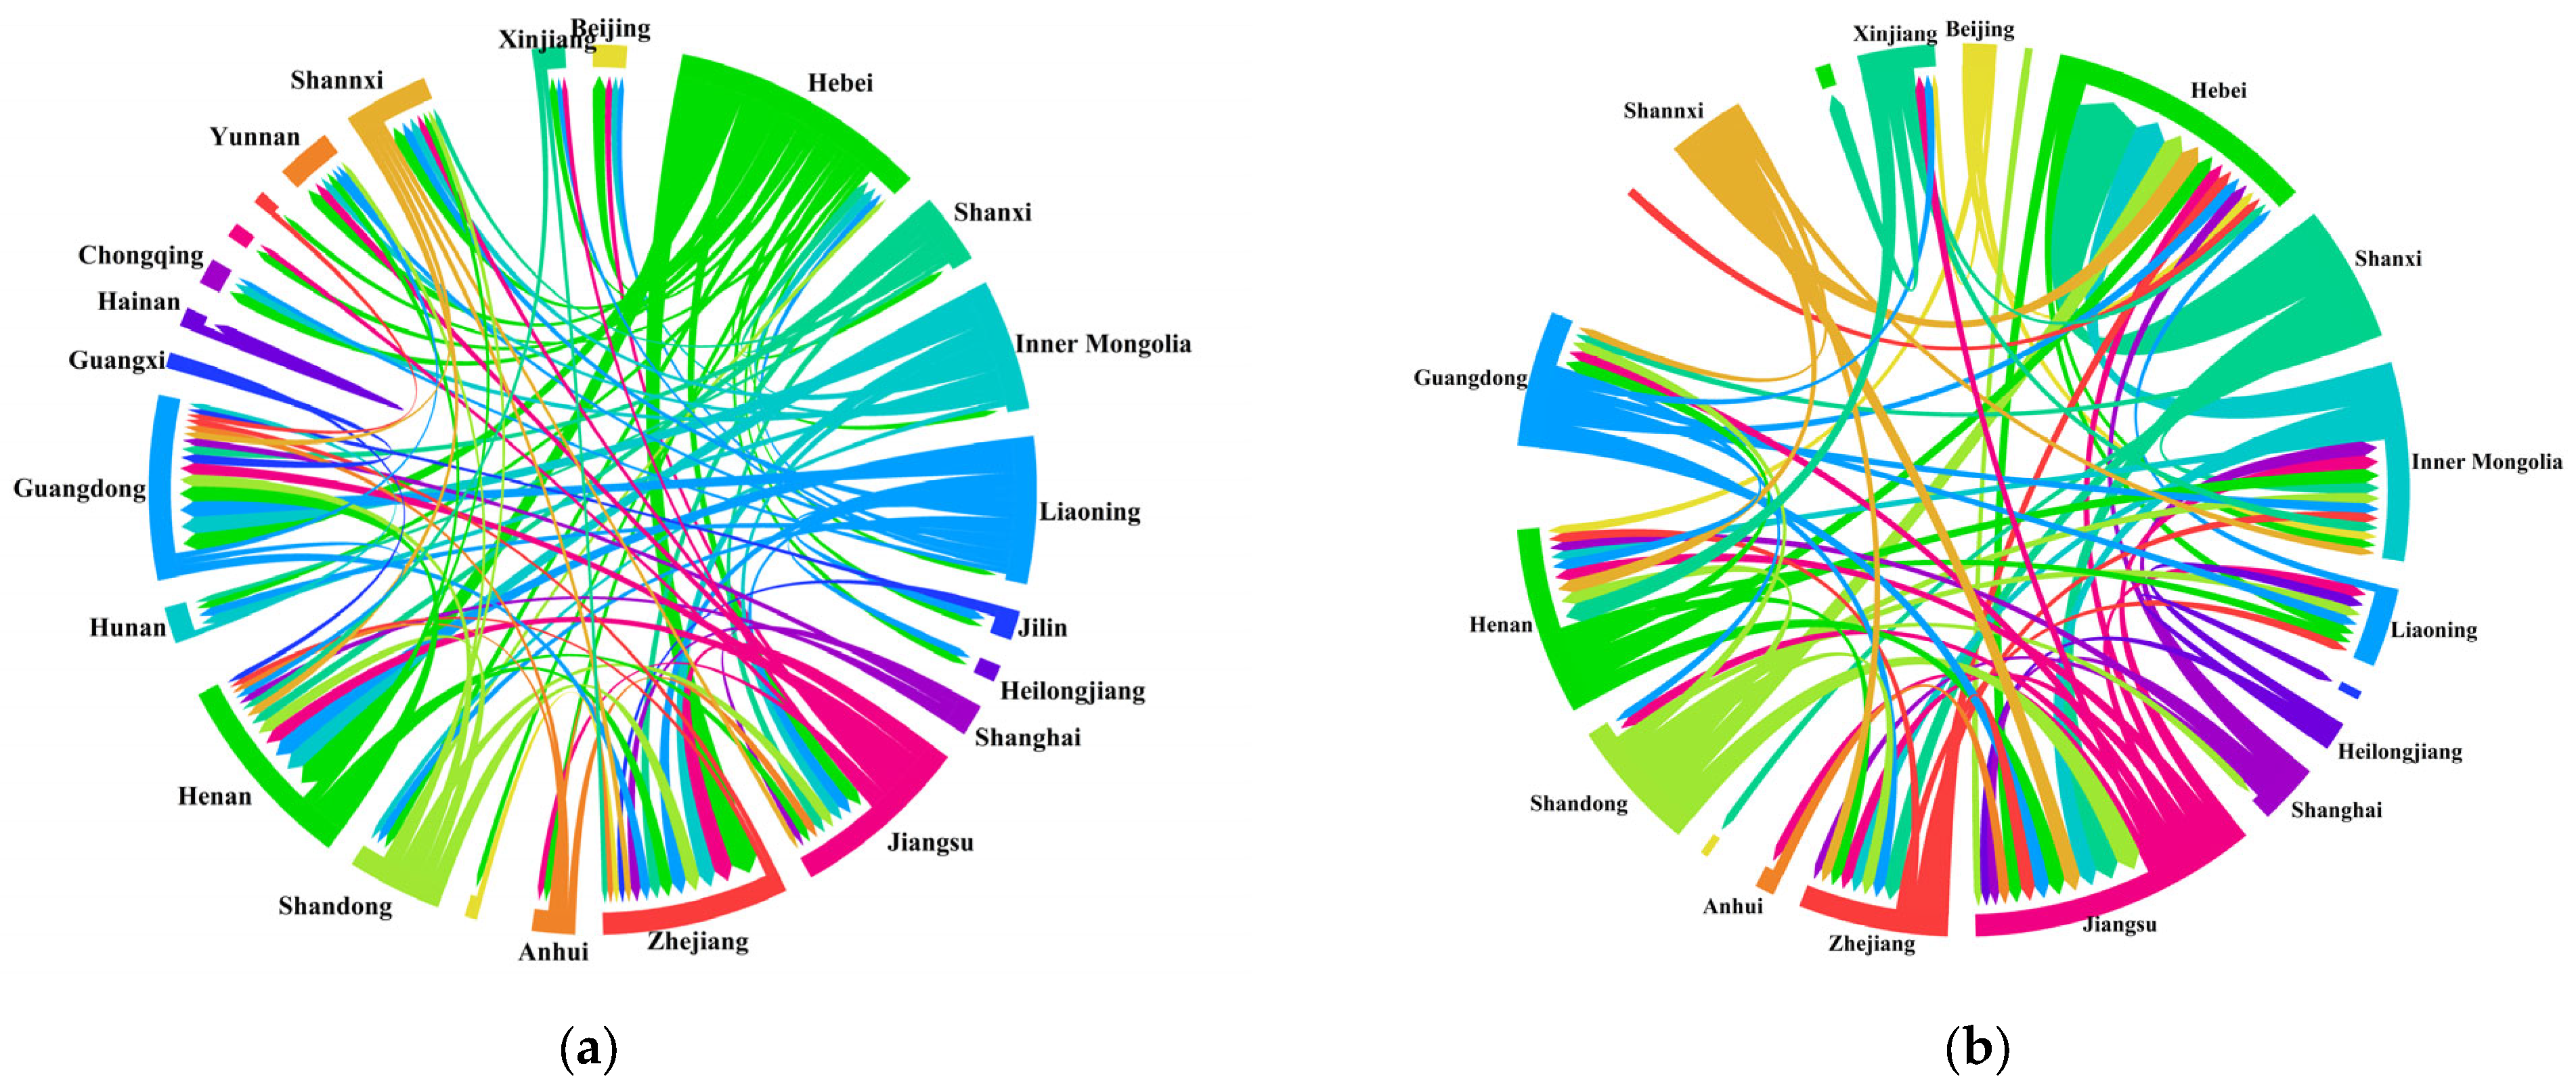
Appendix D. Chord Charts of Inter-Provincial Embodied Energy Flows
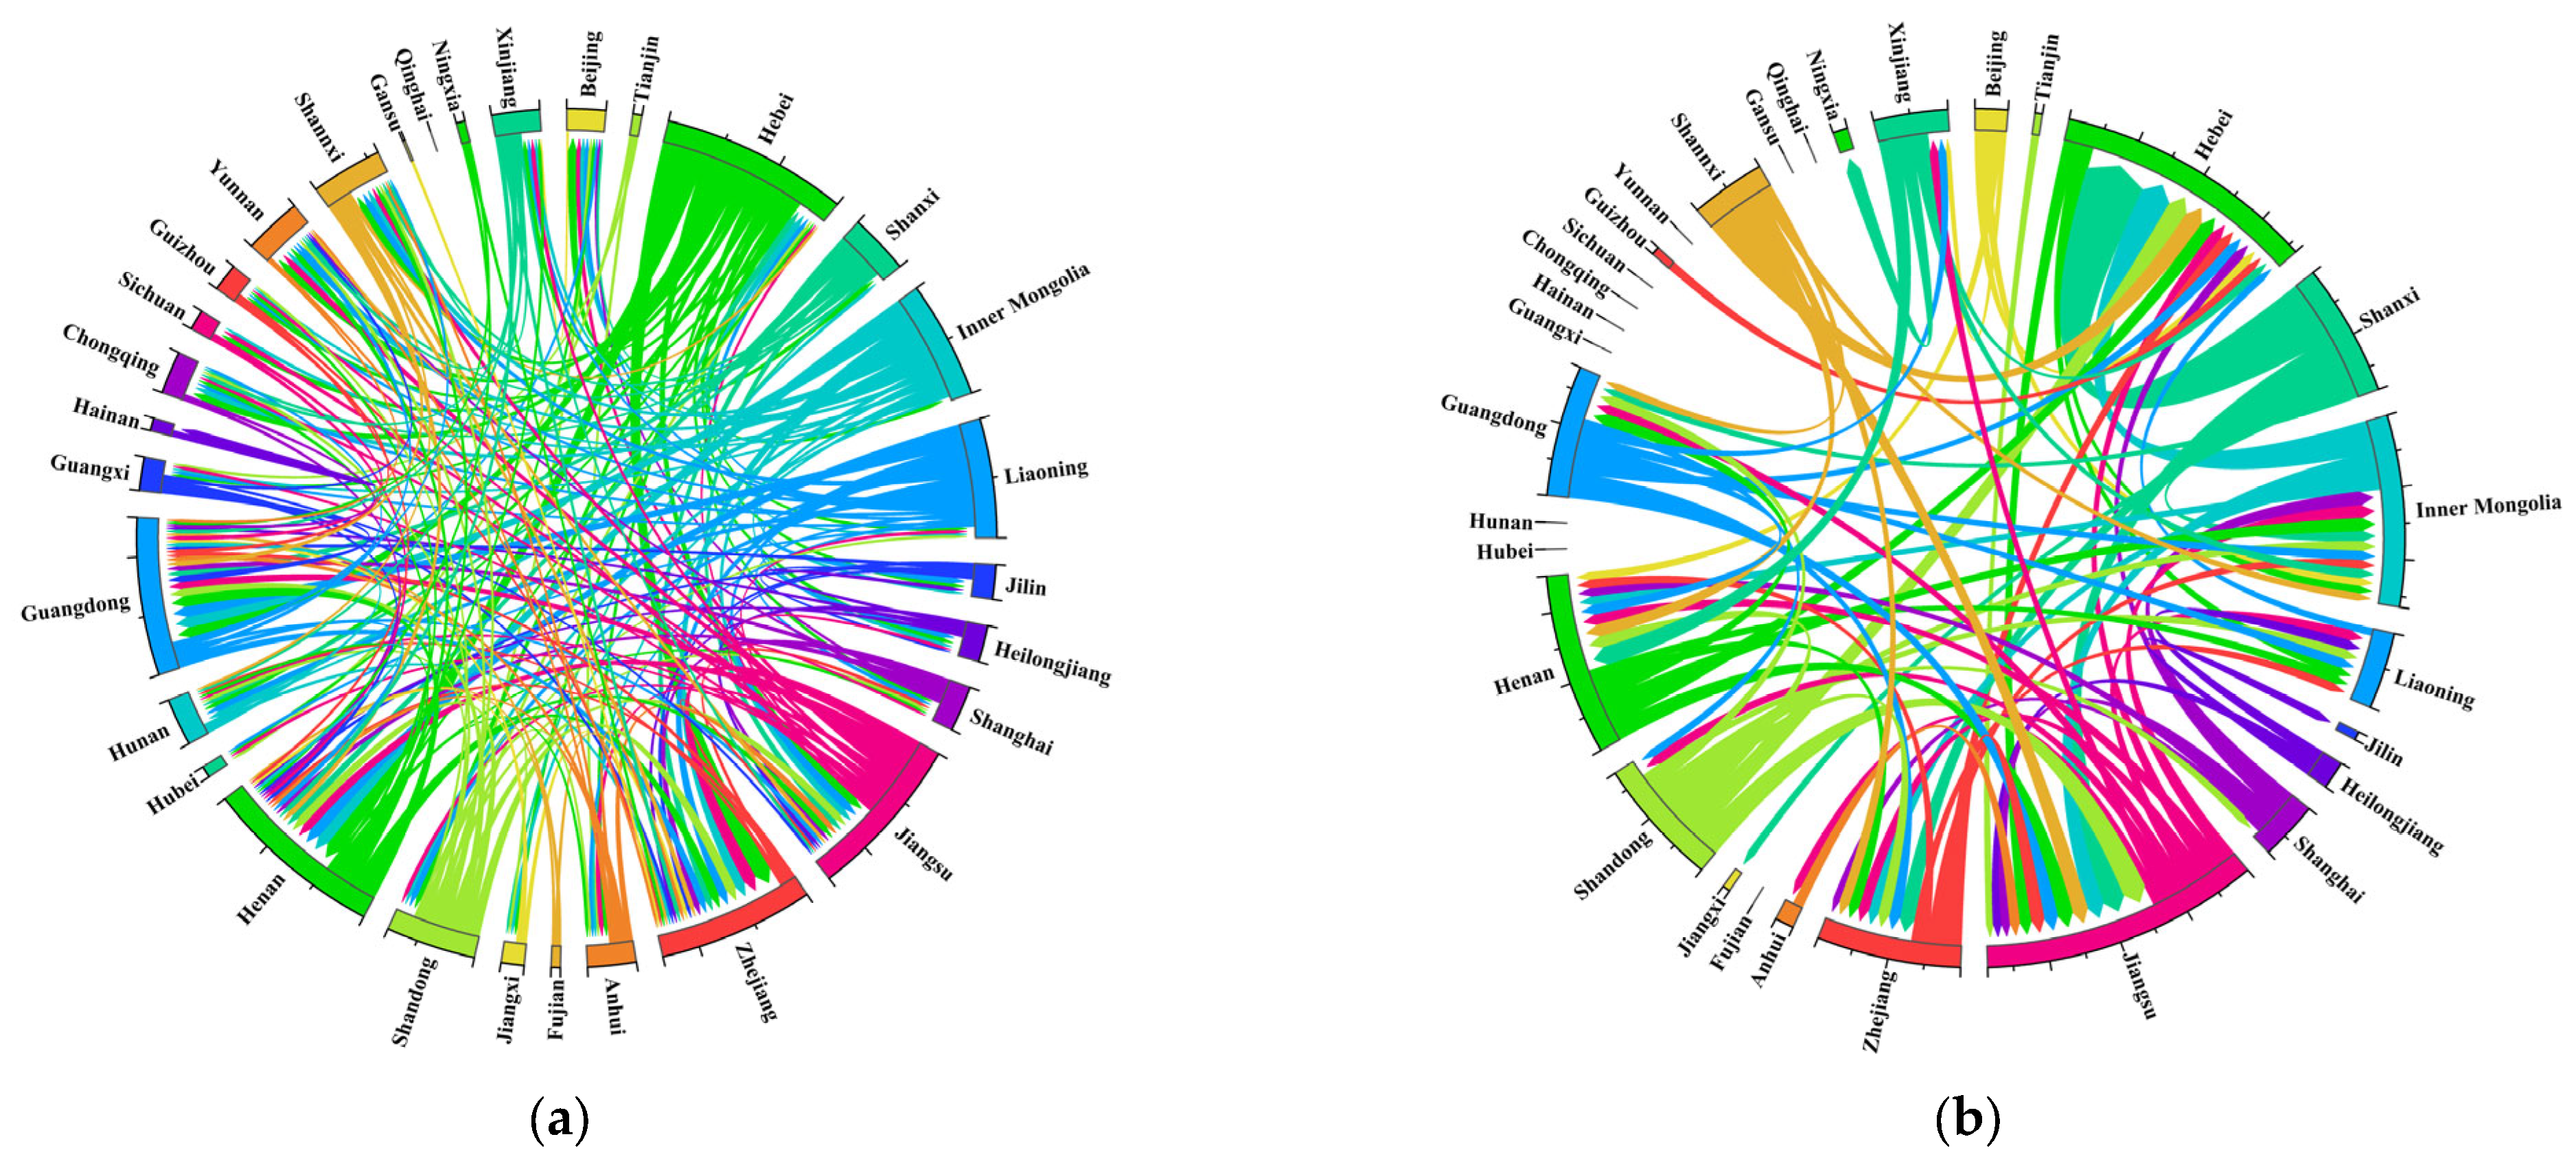
Appendix E. 2015 Results of RAS Data and CEADS Data
| Province | RAS Method | CEADS Database | ||||||
|---|---|---|---|---|---|---|---|---|
| Energy | Coal | Energy | Coal | |||||
| Consumption-Based | Income-Based | Consumption-Based | Income-Based | Consumption-Based | Income-Based | Consumption-Based | Income-Based | |
| Beijing | 7082.76 | 4557.91 | 2506.87 | 690.59 | 6352.15 | 4732.54 | 2180.07 | 1272.48 |
| Tianjin | 6459.11 | 5815.98 | 2510.17 | 1968.64 | 6457.64 | 5997.27 | 2484.13 | 1991.9 |
| Hebei | 11,493.37 | 20,420.85 | 5606.41 | 22,227.85 | 12,340.90 | 20,292.38 | 6031.48 | 10,371.79 |
| Shanxi | 7261.21 | 10,959.80 | 3771.21 | 6631.99 | 7407.82 | 11,273.22 | 3847.18 | 6516.53 |
| Inner Mongolia | 6224.08 | 13,070.62 | 3129.23 | 10,642.39 | 6361.53 | 13,428.54 | 3188.03 | 7236.05 |
| Liaoning | 10,305.95 | 13,612.04 | 4037.70 | 4075.30 | 10,595.65 | 13,224.72 | 4132.64 | 4794.60 |
| Jilin | 6510.82 | 5866.71 | 2913.82 | 3497.32 | 6846.75 | 5978.05 | 3044.37 | 2569.44 |
| Heilongjiang | 6839.13 | 7666.18 | 3296.60 | 6181.59 | 7060.41 | 7318.36 | 3382.91 | 3195.67 |
| Shanghai | 6547.30 | 6035.70 | 2209.31 | 671.52 | 5518.54 | 6539.00 | 1744.26 | 1690.31 |
| Jiangsu | 14,520.28 | 18,994.97 | 5923.74 | 11,968.05 | 14,856.48 | 19,861.72 | 6013.51 | 7461.33 |
| Zhejiang | 13,107.83 | 8974.97 | 5030.70 | 2570.23 | 13,694.84 | 9019.23 | 5242.01 | 2384.22 |
| Anhui | 7861.05 | 6418.55 | 3081.67 | 3289.51 | 8445.75 | 6541.03 | 3293.19 | 2876.87 |
| Fujian | 5872.08 | 6764.22 | 2189.78 | 1908.40 | 5335.31 | 6777.21 | 3293.19 | 2322.10 |
| Jiangxi | 4362.72 | 5653.65 | 1932.91 | 2635.01 | 4770.40 | 5743.42 | 2115.93 | 2573.25 |
| Shandong | 15,186.65 | 22,888.24 | 6856.64 | 13,091.13 | 16,068.43 | 22,446.68 | 7276.92 | 9534.40 |
| Henan | 13,491.45 | 12,936.75 | 5404.25 | 7376.36 | 14,245.84 | 13,234.23 | 5666.84 | 5493.05 |
| Hubei | 10,720.10 | 9490.59 | 4654.62 | 5361.08 | 11,760.00 | 9464.42 | 5171.00 | 4008.01 |
| Hunan | 9413.17 | 9395.38 | 4497.97 | 6775.69 | 10,295.95 | 9498.64 | 4896.51 | 4649.46 |
| Guangdong | 16,494.85 | 11,148.62 | 5112.54 | 1138.14 | 14,572.88 | 11,790.02 | 4240.23 | 2156.16 |
| Guangxi | 6694.49 | 6490.27 | 2754.66 | 2808.35 | 6800.77 | 6270.54 | 2788.37 | 2472.30 |
| Hainan | 1615.73 | 1341.04 | 578.10 | 70.45 | 1666.72 | 1347.25 | 590.02 | 289.89 |
| Chongqing | 8710.71 | 5111.72 | 4193.08 | 3476.64 | 9262.69 | 5204.91 | 4426.49 | 2594.93 |
| Sichuan | 10,574.81 | 11,585.36 | 4330.04 | 4187.49 | 11,613.89 | 11,896.80 | 4753.22 | 4690.76 |
| Guizhou | 5531.76 | 14,582.05 | 2957.30 | 5577.31 | 4853.67 | 6604.17 | 2478.71 | 3889.55 |
| Yunnan | 8252.56 | 5425.74 | 3726.46 | 2709.03 | 8649.17 | 5424.99 | 3887.29 | 2540.78 |
| Shannxi | 6309.53 | 8914.43 | 2757.70 | 5853.57 | 6612.70 | 9080.09 | 2883.33 | 4247.70 |
| Gansu | 3017.83 | 3839.29 | 1186.11 | 1483.65 | 3263.60 | 3909.72 | 1280.29 | 1504.19 |
| Qinghai | 7439.10 | 1895.24 | 2381.49 | 875.15 | 1623.22 | 1952.71 | 557.78 | 672.40 |
| Ningxia | 1395.20 | 2680.44 | 580.39 | 1434.15 | 1523.81 | 2774.47 | 639.92 | 1440.70 |
| Xinjiang | 6109.28 | 7846.81 | 2114.34 | 2495.32 | 6314.60 | 7677.71 | 2178.32 | 2259.32 |
References
- The United Nations. Sustainable Development Goals. Available online: https://sdgs.un.org/goals/goal7 (accessed on 24 August 2025).
- Chen, Q.; Xu, C.; Wang, Q. Critical contributors and transmission paths of energy consumption in China’s supply chains network. Energy Policy 2025, 198, 114481. [Google Scholar] [CrossRef]
- National Bureau of Statistics of China. China Statistical Yearbook 2024; National Bureau of Statistics of China: Beijing, China, 2024.
- Tang, X.; Jin, Y.; McLellan, B.C.; Wang, J.; Li, S. China’s coal consumption declining—Impermanent or permanent? Resour. Conserv. Recycl. 2018, 129, 307–313. [Google Scholar] [CrossRef]
- Song, M.; Mangla, S.K.; Wang, J.; Zhao, J.; An, J. Asymmetric information, “coal-to-gas” transition and coal reduction potential: An analysis using the nonparametric production frontier method. Energy Econ. 2022, 114, 106311. [Google Scholar] [CrossRef]
- Yang, X.; Feng, K.; Su, B.; Zhang, W.; Huang, S. Environmental efficiency and equality embodied in China’s inter-regional trade. Sci. Total Environ. 2019, 672, 150–161. [Google Scholar] [CrossRef] [PubMed]
- Du, J.; Zhang, X.; Huang, T.; Li, M.; Ga, Z.; Ge, H.; Wang, Z.; Gao, H.; Ma, J. Trade-driven black carbon climate forcing and environmental equality under China’s west-east energy transmission. J. Clean. Prod. 2021, 313, 127896. [Google Scholar] [CrossRef]
- Wei, W.; Hao, S.; Yao, M.; Chen, W.; Wang, S.; Wang, Z.; Wang, Y.; Zhang, P. Unbalanced economic benefits and the electricity-related carbon emissions embodied in China’s interprovincial trade. J. Environ. Manag. 2020, 263, 110390. [Google Scholar] [CrossRef]
- Zuo, Q.; Zhang, Z.; Wu, Q.; Ji, Y.; Ma, J. Revealing environmental inequality based on three-dimensional extended input-output analysis: An integrated perspective of embodied water consumption, fossil energy use and carbon emissions. Energy 2025, 330, 136898. [Google Scholar] [CrossRef]
- Pang, Q.; Liu, X.; Zhang, L.; Chiu, Y.-h. Temporal-spatial evolution of environmental inequality of embodied energy transfer within inter-provincial trade of China. Energy 2024, 299, 131476. [Google Scholar] [CrossRef]
- Sun, Y.; Liu, B.; Sun, Z.; Yang, R. Inter-regional cooperation in the transfers of energy-intensive industry: An evolutionary game approach. Energy 2023, 282, 128313. [Google Scholar] [CrossRef]
- Hu, Y.-J.; Wang, B.; Dong, X. A burden-sharing model shaping the embodied carbon emission and considering regions’ efforts to reduce emissions in China’s power sector. J. Environ. Manag. 2025, 373, 123440. [Google Scholar] [CrossRef]
- Kainiemi, L.; Laukkanen, M.; Levänen, J. Multi-sectoral interactions in energy transition: Unveiling tensions between sustainability and justice. Appl. Energy 2025, 384, 125437. [Google Scholar] [CrossRef]
- Zhang, S.; Yang, D.; Ji, Y.; Meng, H.; Zhou, T.; Zhang, J.; Yang, H. Spatio-temporal patterns and cascading risks of embodied energy flows in China. Energy 2024, 298, 131309. [Google Scholar] [CrossRef]
- Mi, Z.; Zhang, Y.; Guan, D.; Shan, Y.; Liu, Z.; Cong, R.; Yuan, X.-C.; Wei, Y.-M. Consumption-based emission accounting for Chinese cities. Appl. Energy 2016, 184, 1073–1081. [Google Scholar] [CrossRef]
- Zhang, R.; Wu, K.; Cao, Y.; Sun, H. Digital inclusive finance and consumption-based embodied carbon emissions: A dual perspective of consumption and industry upgrading. J. Environ. Manag. 2023, 325, 116632. [Google Scholar] [CrossRef] [PubMed]
- Bastianoni, S.; Pulselli, F.M.; Tiezzi, E. The problem of assigning responsibility for greenhouse gas emissions. Ecol. Econ. 2004, 49, 253–257. [Google Scholar] [CrossRef]
- Pottier, A.; Treut, G. Quantifying GHG emissions enabled by capital and labor: Economic and gender inequalities in France. J. Ind. Ecol. 2023, 27, 624–636. [Google Scholar] [CrossRef]
- Xie, R.; Hu, G.; Zhang, Y.; Liu, Y. Provincial transfers of enabled carbon emissions in China: A supply-side perspective. Energy Policy 2017, 107, 688–697. [Google Scholar] [CrossRef]
- Jiang, L.; He, S.; Tian, X.; Zhang, B.; Zhou, H. Energy use embodied in international trade of 39 countries: Spatial transfer patterns and driving factors. Energy 2020, 195, 116988. [Google Scholar] [CrossRef]
- Li, M.; Gao, Y.; Meng, B.; Meng, J. Tracing embodied energy use through global value chains: Channel decomposition and analysis of influential factors. Ecol. Econ. 2023, 208, 107766. [Google Scholar] [CrossRef]
- Pan, A.; Xiao, T.; Dai, L.; Shi, X. Global transfer of embodied energy: From source to sink through global value chains. Sustain. Prod. Consum. 2022, 31, 39–51. [Google Scholar] [CrossRef]
- Song, X.; Li, R. Tracing and excavating critical paths and sectors for embodied energy consumption in global supply chains: A case study of China. Energy 2023, 284, 129244. [Google Scholar] [CrossRef]
- Wang, Z.; Zhang, H.; Li, H.; Wang, S.; Wang, Z. Identifying the key factors to China’s unsustainable external circulation through the accounting of the flow of embodied energy and virtual water. Renew. Sustain. Energy Rev. 2023, 173, 113115. [Google Scholar] [CrossRef]
- Xia, Q.; Han, M.; Guan, S.; Wu, X.; Zhang, B. Tracking embodied energy flows of China’s megacities via multi-scale supply chains. Energy 2022, 260, 125043. [Google Scholar] [CrossRef]
- Wang, L.; Shao, J. How does regional integration policy affect urban energy efficiency? A quasi-natural experiment based on policy of national urban agglomeration. Energy 2025, 319, 135003. [Google Scholar] [CrossRef]
- Li, M.; Pan, X.; Yuan, S. Do the national industrial relocation demonstration zones have higher regional energy efficiency? Appl. Energy 2022, 306, 117914. [Google Scholar] [CrossRef]
- Shi, J.; Li, H.; Guan, J.; Sun, X.; Guan, Q.; Liu, X. Evolutionary features of global embodied energy flow between sectors: A complex network approach. Energy 2017, 140, 395–405. [Google Scholar] [CrossRef]
- Liu, X.; Peng, R.; Li, J.; Wang, S.; Li, X.; Guo, P.; Li, H. Energy and water embodied in China–US trade: Regional disparities and drivers. J. Clean. Prod. 2021, 328, 129460. [Google Scholar] [CrossRef]
- Liu, B.; Zhang, L.; Sun, J.; Wang, D.; Liu, C.; Luther, M.; Xu, Y. Composition of energy outflows embodied in the gross exports of the construction sector. J. Clean. Prod. 2020, 248, 119296. [Google Scholar] [CrossRef]
- Guo, S.; Li, Y.; Hu, Y.; Xue, F.; Chen, B.; Chen, Z.-M. Embodied energy in service industry in global cities: A study of six Asian cities. Land Use Policy 2020, 91, 104264. [Google Scholar] [CrossRef]
- Guidetti, E.; Ferrara, M. Embodied energy in existing buildings as a tool for sustainable intervention on urban heritage. Sustain. Cities Soc. 2023, 88, 104284. [Google Scholar] [CrossRef]
- Zhu, W.; Huang, B.; Zhao, J.; Chen, X.; Sun, C. Impacts on the embodied carbon emissions in China’s building sector and its related energy-intensive industries from energy-saving technologies perspective: A dynamic CGE analysis. Energy Build. 2023, 287, 112926. [Google Scholar] [CrossRef]
- Shi, J.; Li, C.; Li, H. Energy consumption in China’s ICT sectors: From the embodied energy perspective. Renew. Sustain. Energy Rev. 2022, 160, 112313. [Google Scholar] [CrossRef]
- IEA. Coal 2022. Available online: https://www.iea.org/reports/coal-2022 (accessed on 24 August 2025).
- Kumar, S.; Madlener, R. CO2 emission reduction potential assessment using renewable energy in India. Energy 2016, 97, 273–282. [Google Scholar] [CrossRef]
- Wang, Q.; Ge, S. Uncovering the effects of external demand on China’s coal consumption: A global input–output analysis. J. Clean. Prod. 2020, 245, 118877. [Google Scholar] [CrossRef]
- Wu, X.F.; Chen, G.Q. Coal use embodied in globalized world economy: From source to sink through supply chain. Renew. Sustain. Energy Rev. 2018, 81, 978–993. [Google Scholar] [CrossRef]
- Wang, Q.; Song, X. How UK farewell to coal—Insight from multi-regional input-output and logarithmic mean divisia index analysis. Energy 2021, 229, 120655. [Google Scholar] [CrossRef]
- Energy Administration of Shanxi Province. The Shanxi Coal Industry Association Issued a Proposal to Shanxi Coal Enterprises to Stabilize Coal Prices and Ensure Supply. Available online: http://www.fenxi.gov.cn/zfxxgk/zcwj/szfwj/202208/P020220822434626740970.pdf (accessed on 24 August 2025).
- The People’s Government of Shanxi Province. The Opinions of the People’s Government of Shanxi Province on Orderly Promoting the Continuous Allocation of Coal Resources to Ensure Stable Production and Supply of Coal Mines. Available online: https://www.shanxi.gov.cn/zfxxgk/zfxxgkzl/fdzdgknr/lzyj/szfwj/202205/t20220513_5976556.shtml (accessed on 24 August 2025).
- The CPC Shanxi Provincial Committee. The CPC Shanxi Provincial Committee and the Shanxi Provincial People’s Government on the Complete, Accurate and Comprehensive Implementation of the New Development Concept, and Earnestly Do a Good Job in Carbon Peaking and Carbon Neutrality. Available online: https://www.shanxi.gov.cn/zfxxgk/zfxxgkzl/fdzdgknr/lzyj/swygwj/swygwj1/202301/t20230116_7810650.shtml (accessed on 24 August 2025).
- Li, G.; Xu, D.; Wang, Q.; Jia, Z.; Li, W.; Su, B. Contributors and drivers of Shanxi’s aggregate embodied carbon intensity (2002–2017) based on input–output and multiplicative structure decomposition analysis. Sustain. Energy Technol. Assess. 2022, 53, 102536. [Google Scholar] [CrossRef]
- Guan, Y.; Huang, G.; Liu, L.; Zhai, M.; Xu, X. Measurement of air-pollution inequality through a three-perspective accounting model. Sci. Total Environ. 2019, 696, 133937. [Google Scholar] [CrossRef]
- Li, J.; Huang, G.; Li, Y.; Liu, L.; Zheng, B. Decoupling degrees of China’s economic growth from three-perspective carbon emissions. J. Clean. Prod. 2022, 368, 133209. [Google Scholar] [CrossRef]
- Leontief, W.W. Quantitative Input and Output Relations in the Economic Systems of the United States. Rev. Econ. Stat. 1936, 18, 105. [Google Scholar] [CrossRef]
- Dietzenbacher, E. In Vindication of the Ghosh Model: A Reinterpretation as a Price Model. J. Reg. Sci. 1997, 37, 629–651. [Google Scholar] [CrossRef]
- Chen, W.; Lei, Y.; Feng, K.; Wu, S.; Li, L. Provincial emission accounting for CO2 mitigation in China: Insights from production, consumption and income perspectives. Appl. Energy 2019, 255, 113754. [Google Scholar] [CrossRef]
- Yue, W.; Li, Y.; Su, M.; Chen, Q.; Rong, Q. Carbon emissions accounting and prediction in urban agglomerations from multiple perspectives of production, consumption and income. Appl. Energy 2023, 348, 121445. [Google Scholar] [CrossRef]
- Yang, Y.; Yu, H.; Su, M.; Chen, Q.; Wen, J.; Hu, Y. Urban water resources accounting based on industrial interaction perspective: Data preparation, accounting framework, and case study. J. Environ. Manag. 2024, 349, 119532. [Google Scholar] [CrossRef] [PubMed]
- Toh, M.-H. The RAS Approach in Updating Input–Output Matrices: An Instrumental Variable Interpretation and Analysis of Structural Change. Econ. Syst. Res. 1998, 10, 63–78. [Google Scholar] [CrossRef]
- CEADs. Available online: https://www.ceads.net.cn/data/ (accessed on 24 August 2025).
- National Bureau of Statistics of China. China Energy Statistical Yearbook 2021. Available online: https://www.zgtjnj.org/navibooklist-n3022013309-1.html (accessed on 24 August 2025).
- Zhang, L.; Liu, B.; Du, J.; Liu, C.; Li, H.; Wang, S. Internationalization trends of carbon emission linkages: A case study on the construction sector. J. Clean. Prod. 2020, 270, 122433. [Google Scholar] [CrossRef]
- Jiang, S.; Lin, X.; Qi, L.; Zhang, Y.; Sharp, B. The macro-economic and CO2 emissions impacts of COVID-19 and recovery policies in China. Econ. Anal. Policy 2022, 76, 981–996. [Google Scholar] [CrossRef]
- Wang, W.; Wang, W.; Xie, P.; Zhao, D. Spatial and temporal disparities of carbon emissions and interregional carbon compensation in major function-oriented zones: A case study of Guangdong province. J. Clean. Prod. 2020, 245, 118873. [Google Scholar] [CrossRef]
- Yang, Y.; Zhao, X.; Yu, T.; Li, X.; Lan, H.; Xia, F.; Xie, Y. A new framework for making carbon compensation standards considering regional differences at different scales in China. J. Environ. Manag. 2025, 373, 123431. [Google Scholar] [CrossRef]
- Xia, M.; Chuai, X.; Xu, H.; Cai, H.H.; Xiang, A.; Lu, J.; Zhang, F.; Li, M. Carbon deficit checks in high resolution and compensation under regional inequity. J. Environ. Manag. 2023, 328, 116986. [Google Scholar] [CrossRef]
- Zhang, X.; Su, B.; Yang, J.; Cong, J. Analysis of Shanxi Province’s energy consumption and intensity using input-output framework (2002–2017). Energy 2022, 250, 123786. [Google Scholar] [CrossRef]
- Hong, J.; Shen, Q.; Xue, F. A multi-regional structural path analysis of the energy supply chain in China’s construction industry. Energy Policy 2016, 92, 56–68. [Google Scholar] [CrossRef]


Disclaimer/Publisher’s Note: The statements, opinions and data contained in all publications are solely those of the individual author(s) and contributor(s) and not of MDPI and/or the editor(s). MDPI and/or the editor(s) disclaim responsibility for any injury to people or property resulting from any ideas, methods, instructions or products referred to in the content. |
© 2025 by the authors. Licensee MDPI, Basel, Switzerland. This article is an open access article distributed under the terms and conditions of the Creative Commons Attribution (CC BY) license (https://creativecommons.org/licenses/by/4.0/).
Share and Cite
Wen, W.; He, Y.; Zhang, Y.; Song, W.; Fang, Y. Unraveling the Surrounding Drivers of Interprovincial Trade Embodied Energy Flow Based on the MRIO Model: A Case Study in China. Energies 2025, 18, 5222. https://doi.org/10.3390/en18195222
Wen W, He Y, Zhang Y, Song W, Fang Y. Unraveling the Surrounding Drivers of Interprovincial Trade Embodied Energy Flow Based on the MRIO Model: A Case Study in China. Energies. 2025; 18(19):5222. https://doi.org/10.3390/en18195222
Chicago/Turabian StyleWen, Wen, Yijing He, Yang Zhang, Weize Song, and Yujuan Fang. 2025. "Unraveling the Surrounding Drivers of Interprovincial Trade Embodied Energy Flow Based on the MRIO Model: A Case Study in China" Energies 18, no. 19: 5222. https://doi.org/10.3390/en18195222
APA StyleWen, W., He, Y., Zhang, Y., Song, W., & Fang, Y. (2025). Unraveling the Surrounding Drivers of Interprovincial Trade Embodied Energy Flow Based on the MRIO Model: A Case Study in China. Energies, 18(19), 5222. https://doi.org/10.3390/en18195222


