Article

Sustainability Analysis of the Global Hydrogen Trade Network from a Resilience Perspective: A Risk Propagation Model Based on Complex Networks

1
School of Management, Xi’an University of Science and Technology, Xi’an 710054, China
2
Energy Economy and Management Research Center, Xi’an University of Science and Technology, Xi’an 710054, China
*
Author to whom correspondence should be addressed.
Energies 2025, 18(15), 3944; https://doi.org/10.3390/en18153944
Submission received: 4 July 2025 / Revised: 19 July 2025 / Accepted: 22 July 2025 / Published: 24 July 2025

Abstract

Hydrogen is being increasingly integrated into the international trade system as a clean and flexible energy carrier, motivated by the global energy transition and carbon neutrality objectives. The rapid expansion of the global hydrogen trade network has simultaneously exposed several sustainability challenges, including a centralized structure, overdependence on key countries, and limited resilience to external disruptions. Based on this, we develop a risk propagation model that incorporates the absorption capacity of nodes to simulate the propagation of supply shortage risks within the global hydrogen trade network. Furthermore, we propose a composite sustainability index constructed from structural, economic, and environmental resilience indicators, enabling a systematic assessment of the network’s sustainable development capacity under external shock scenarios. Findings indicate the following: (1) The global hydrogen trade network is undergoing a structural shift from a Western Europe-dominated unipolar configuration to a more polycentric pattern. Countries such as China and Singapore are emerging as key hubs linking Eurasian regions, with trade relationships among nations becoming increasingly dense and diversified. (2) Although supply shortage shocks trigger structural disturbances, economic losses, and risks of carbon rebound, their impacts are largely concentrated in a limited number of hub countries, with relatively limited disruption to the overall sustainability of the system. (3) Countries exhibit significant heterogeneity in structural, economic, and environmental resilience. Risk propagation demonstrates an uneven pattern characterized by hub-induced disruptions, chain-like transmission, and localized clustering. Accordingly, policy recommendations are proposed, including the establishment of a polycentric coordination mechanism, the enhancement of regional emergency coordination mechanisms, and the advancement of differentiated capacity-building efforts.

1. Introduction

Driven by the imperatives of global climate governance and sustainable development, hydrogen energy has been widely regarded as one of the key pathways to drive the deep decarbonization of the energy system and the green transformation of terminal energy, due to its zero carbon emissions, cross-sectoral applicability, and storable and transportable characteristics [1]. Research suggests that the industrial and transportation sectors are major contributors to CO2 emissions [2], and hydrogen is anticipated to achieve large-scale deployment in these areas by 2025, serving as a central pillar in the pursuit of carbon neutrality [3]. Meanwhile, with continuous breakthroughs in key technologies, such as green hydrogen production, storage, and transportation, the global hydrogen energy industry chain and trade network are rapidly taking shape [4]. More than 30 countries and regions have released or formulated national hydrogen energy strategies (including import and export plans), and cross-border hydrogen energy cooperation and trade have grown significantly [5]. For example, Saudi Arabia’s 1.2 Mt/year green ammonia export project has entered the final investment decision stage, and India is advancing its 1 Mt/year green ammonia project. Some projections forecast that clean hydrogen will increase 500-fold by 2050 and account for 11% of the cumulative emissions reductions required to stay well below 2 °C of warming [6]. It is evident that the Global Hydrogen Trade Network (GHTN) is gradually evolving from a regional energy supplement to an emerging pillar of the global energy system.
However, structural risks and system vulnerabilities have increasingly emerged as the hydrogen trade system undergoes rapid development. As one example, the GHTN exhibits highly centralized characteristics, with a few hub countries performing critical supply and transit functions. Should any of these nodes experience supply disruptions, it could trigger a chain reaction, threatening the global hydrogen supply–demand balance [7]. Additionally, hydrogen energy, as an emerging industry, still faces challenges, such as immature global production and transportation systems, policy barriers, limited pathways, and insufficient redundancy [8]. The hydrogen energy industry chain is also a typical complex system, where the behavior of complex systems is unpredictable, as disturbances at one node can spread throughout the system [9]. Amid increasingly complex international dynamics and the rising frequency of extreme climate events, the GHTN is highly vulnerable to external disruptions. Therefore, it is essential to develop a research framework that can capture the system’s dynamic evolution, based on its overall risk absorption and adaptive capacity.
Despite the large body of research that has quantified the sustainability of hydrogen systems using lifecycle carbon footprints, energy efficiency indicators, and other methods, these approaches are primarily based on static perspectives, making it difficult to reveal the dynamic characteristics of network propagation and system evolution under risk shocks [4]. Resilience theory, as a process-oriented framework, emphasizes a system’s capacity to absorb, adapt to, and recover from uncertain disturbances, offering a new theoretical perspective for analyzing the sustainability of complex energy systems [10,11]. In recent years, resilience research has been widely applied in fields such as urban infrastructure, power systems, and disaster management, but it remains a gap in the context of transnational hydrogen trade networks [12]. The resilience perspective offers a comprehensive understanding of system dynamics and risk pathways under disruptions, providing adaptive and forward-looking insights for sustainable governance.
Building on the preceding analysis, a GHTN was constructed using UN Comtrade data. A risk propagation model that incorporates node-level absorption capacity was employed to simulate the propagation of supply shocks within the network. Based on the simulation results, a composite sustainability index was developed. This index integrates structural resilience, economic resilience, and environmental resilience to dynamically assess the overall stability and adaptive capacity of the system under supply disruption scenarios.
This study is distinguished from previous research by the following contributions: (1) Resilience theory is incorporated into the sustainability assessment of the hydrogen trade system through the development of an integrated evaluation framework that combines risk propagation dynamics with multi-dimensional resilience metrics. This framework contributes to the theoretical advancement of sustainability analysis in green energy networks. (2) A complex network-based risk propagation model is developed, accounting for node heterogeneity and risk absorption capacity, to simulate the dynamic evolution of trade network indicators under hydrogen supply disruption scenarios. This model serves as a resilience analytical tool for capturing nonlinear system responses and identifying potential instability pathways. (3) The multi-dimensional resilience of the GHTN is quantitatively evaluated, enabling the identification of critical vulnerable nodes and fragile links. The analysis highlights key sustainability challenges arising from structural centralization, economic dependence, and carbon rebound volume, and puts forward risk-informed policy recommendations to enhance international hydrogen governance.
The remainder of this paper is organized as follows. Section 2 reviews the relevant literature. Section 3 presents the modeling framework and methodological indicators. Section 4 provides the simulation results and corresponding analysis. Section 5 concludes the study and proposes policy recommendations.

2. Literature Review

2.1. Research on GHTN

Hydrogen energy, as a clean and efficient secondary energy source, is regarded as a crucial pillar for the global energy transition toward sustainability. Research indicates that the potential range of global hydrogen demand is increasing, ranging from 73 to 568 Mt in 2050 [13], with approximately one-quarter of this being achieved through transnational trade, suggesting that the global hydrogen trade network is rapidly evolving. The IEA also points out that, over the past three years, hydrogen export projects have significantly increased, with Australia and the Middle East emerging as potential major exporters [14]. Therefore, studying the GHTN is of critical importance for energy security and sustainable development.
Current research on energy trade networks primarily focuses on oil and natural gas, as Xue et al. pointed out, “Academia and industry have long focused on global energy markets, particularly the crude oil and natural gas markets” [15]. In contrast, Zhang et al. argued that “existing research has not yet explored the impacts of global hydrogen trade in depth” [16], highlighting that the GHTN, as an emerging field, remains underexplored in the literature. Currently, only a few studies focus on this field, but with increased national investments in hydrogen energy strategies and technological advancements, related research is rapidly expanding [17,18].
The existing literature on the GHTN primarily uses static network indicators to depict structural evolution. For instance, Zhang et al. applied complex network methods to analyze the global hydrogen trade dependency network, identifying structural features such as “small-world” and “rich club” [19]. These studies mainly focus on static topological relationships and lack a comprehensive analytical framework that integrates network dynamic evolution and systemic risk assessment.

2.2. Sustainability Assessment of Energy Systems

The sustainability assessment of energy systems has always been a key focus of energy research, with studies commonly adopting a multi-indicator comprehensive evaluation system to quantify the development level of energy systems across environmental, economic, and social dimensions [20]. In recent years, multi-criteria decision analysis (MCDA) methods, such as AHP, fuzzy AHP, and TOPSIS, have been widely used for weight determination and alternative ranking. A review by Wang et al. demonstrated that multi-indicator systems combined with MCDA have become key instruments for energy sustainability evaluation [21].
Similar methods have also been widely applied in the field of hydrogen energy. Most studies focus on constructing multi-dimensional indicator systems to evaluate the environmental, economic, and social impacts of hydrogen energy throughout its entire lifecycle or in specific stages. Abdel-Basset et al. pointed out that systematic evaluations of hydrogen production schemes across environmental, economic, and social dimensions are still insufficient. Therefore, they adopted AHP and COPRAS to construct a comprehensive evaluation framework [22]. Many scholars have also introduced other MCDA techniques to enhance the objectivity and accuracy of evaluations. Li et al. proposed a new hydrogen sustainability assessment framework, incorporating grey relational analysis (GRA) combined with the DEMATEL method to objectively assign indicator weights in the assessment of nine hydrogen production technologies. This method calculates the grey comprehensive correlation degree of each alternative relative to the ideal solution for ranking, effectively reducing subjective bias [23]. Ransikarbum et al. focused on the sustainability of hydrogen supply chain decisions, developing an evaluation model that integrates AHP, fuzzy AHP, and DEA data envelopment analysis. They selected key indicators from five aspects—political, economic, social, resource, and environmental—for group decision analysis [24]. Overall, the evaluation of hydrogen sustainability has primarily relied on multi-indicator systems integrated with MCDA methods.
However, while traditional energy evaluation indicator systems can reflect the efficiency and development level of a system during stable operations, they struggle to capture the system’s dynamic response capability in the face of unexpected shocks, thus lacking a resilience perspective. A truly sustainable system must maintain its functionality when subjected to disturbances; otherwise, it cannot be considered genuinely sustainable [10]. Traditional indicators often overlook this aspect, especially in the context of an increasingly complex global energy market and tighter supply chain interconnections. Energy systems must not only maintain efficiency and environmental sustainability under normal conditions but also possess the ability to respond to external shocks and recover rapidly. Moreover, studies have indicated that resilience building should complement risk management. By designing systems capable of absorbing shocks and recovering quickly, various unknown disturbances can be addressed, thus providing insights for developing more targeted risk management strategies [25].

2.3. Integration of Resilience Theory and Sustainability Assessment

The concept of resilience initially originated in natural sciences and is used to describe the compressive strength of materials, such as wood or steel [26]. As social sciences have increasingly focused on resilience, the concept of “resilience” has evolved from engineering resilience to ecological resilience, and finally, to evolutionary resilience [27]. The resilience of energy systems, as a subfield of energy security research, has emerged as a growing topic of interest in recent years [28].
In recent years, the frequent occurrence of extreme climate events, natural disasters, and geopolitical conflicts has led resilience to become an important focus in energy system research [10]. Traditional efficiency-oriented research struggles to comprehensively assess a system’s risk resilience, while the resilience perspective provides a system analysis approach from disturbance to response, particularly suitable for energy trade systems with multi-coupled, complex network structures. Therefore, resilience theory has been gradually introduced into fields such as electricity, natural gas, and renewable energy. In practice, research on the resilience of power systems is relatively advanced, focusing on how to resist natural disasters and rapidly restore power supply [29]. Research on the resilience of natural gas and oil supply chains has also been increasing, focusing on the stability of multi-node networks under emergency conditions [28]. Resilience evaluation methods have been continuously enriched, with the 4R framework being widely applied [30]. Despite this, research on energy resilience still predominantly focuses on traditional energy systems, with relatively few studies on the resilience of emerging energy systems, like hydrogen, particularly lacking quantitative analyses of systemic resilience at the global trade level.
Resilience is closely related to sustainability, but they emphasize different aspects. Sustainability focuses more on stability and efficiency, while resilience emphasizes a system’s capacity to adapt to and recover from shocks, including impact resistance, recovery speed, and transformation ability [31]. An increasing number of researchers point out that “sustainability without resilience is fragile,” with resilience being considered a prerequisite or safeguarding mechanism for achieving sustainability [11]. In emerging fields, such as hydrogen trade, systems remain unstable and face multiple uncertainties. Traditional static indicator systems are insufficient to capture the dynamic sustainability characteristics, necessitating the integration of a resilience framework for supplementation [32].
To summarize, current research has made significant progress in applying complex network approaches to model the structure of the hydrogen trade system and to identify the strategic roles of key countries. These studies have laid the groundwork for understanding hydrogen’s role in the global clean energy transition. Nevertheless, these studies still suffer from the following limitations: (1) Current research on hydrogen trade networks predominantly adopts a static structural perspective, focusing on topological characteristics and the identification of key nodes. However, it has yet to sufficiently capture the dynamic propagation mechanisms and structural evolution of the system under disruptions, such as node failures and pathway interruptions. (2) While resilience theory has been widely applied to energy infrastructure systems, its systematic integration into transnational hydrogen trade networks remains underexplored. Existing research lacks a comprehensive resilience assessment framework that concurrently incorporates structural, economic, and environmental dimensions. (3) Existing approaches to quantifying the sustainability of energy systems largely rely on static indicator frameworks, offering limited insight into the system’s dynamic response to external shocks. Specifically, there is a lack of dynamic sustainability assessment methods that integrate resilience curves and risk propagation pathways.

3. Methodology and Modeling Framework

3.1. Hydrogen Trade Network Construction

The GHTN data used in this study were sourced from the United Nations Comtrade Database, specifically focusing on hydrogen trade volumes classified under the Harmonized System (HS) code 280410 from 2017, 2019, 2021, and 2023. This database provides the most authoritative and comprehensive international trade statistics globally. In international trade statistics, discrepancies between export and import data are frequently observed. As noted in previous studies, customs inspection and clearance procedures are typically conducted more rigorously for imports than for exports. Accordingly, the GHTN in this study is constructed using import declaration data to ensure consistency and reliability. Specifically, the GHTN is modeled as a directed and weighted graph G = V , E , where nodes V represent countries, and edges E represent hydrogen trade relationships between countries. The trade volume between countries is used as the weight of the edges. Let V i , V j directed edge from node V i to node V j . As shown in Equation (1), if V i , V j E , it indicates the existence of a trade link between the two nodes, and the adjacency matrix element α i j = 1 ; otherwise, if V i , V j E , it indicates no direct trade link, and α i j = 0 .
α = 1 , i f V i , V j E 0 , o t h e r w i s e

3.2. Modeling of Risk Propagation

To simulate the dynamic response of the GHTN under supply shortage shocks, a risk propagation model incorporating node-specific load and risk absorption capacity has been developed in this study. In this model, hydrogen trade flows between countries serve as the pathways for risk transmission, capturing the process by which disruptions originate from initial nodes and gradually propagate downstream. Node heterogeneity is incorporated to regulate the intensity of propagation and determine termination conditions, thereby constructing a risk propagation model with stronger real-world grounding. each node i in the network is assigned three core attributes. The initial import load of node is defined as the total volume of hydrogen imported from all upstream countries, as expressed by Equation (2).
L i = j p ( i ) W i j ,
where p ( i ) denotes the set of upstream countries with directed links to node i , and W j i represents the edge weight from node j to node i . The initial export load of a node is defined as the total volume of hydrogen exported to all its downstream countries, as given by Equation (3).
E i = k m ( i ) W i k ,
where m ( i ) denotes the set of downstream neighbors of node i . The risk absorption capacity of each node, denoted as C i , is positively correlated with its import load, as shown in Equation (4).
C i = β L i
where the parameter β ( 0 , 1 ) reflects the node’s capacity to absorb risk.
When a given node s is designated as the initial risk source, its export capacity is subject to an external shock at a proportion of α , and the resulting supply reduction is calculated as shown in Equation (5).
Δ E s = α E s
The supply shortage shock is propagated along all outbound edges from the source node. For each downstream node i , the amount of supply reduction it receives is calculated proportionally based on the edge weights, as shown in Equation (6).
D L i = Δ E s w s i E
It should be noted that if a node experiences repeated impacts over multiple propagation rounds of propagation, the reduction in its import load should be accumulated cumulatively. The calculation is shown in Equation (7).
A D L i = A D L i + D L i
The state of each node is determined by comparing its current accumulated decrease in import load ( A D L i ) with its risk absorption capacity (Ci). If A D L i C i , the node remains in a normal state and the risk terminates at that node. However, if A D L i > C i , the node enters a risk state and continues to propagate the risk to its downstream neighbors. The amount of propagated risk is calculated as the difference between the node’s remaining export capacity and the unabsorbed portion of the risk, as shown in Equation (8).
Δ E i  next = min ( A D L i C i , E i )
The propagated risk is again distributed to all downstream countries of node i in proportion to the corresponding edge weights. As the risk continues to spread through multiple rounds within the network, the system eventually reaches a steady state, in which the accumulated decrease at every node falls below its risk absorption capacity and the propagation process is considered terminated.

3.3. Three-Dimensional Resilience Indicators

To comprehensively evaluate the sustainability performance of the GHTN from a resilience perspective, resilience is categorized into three dimensions: structural resilience, economic resilience, and environmental resilience. The specific definitions and corresponding calculation formulas are presented below.
(1)
Structural resilience refers to the ability of the network structure to maintain its original configuration under risk shocks. In this study, it is measured by the avalanche size.
R s = 1 A i N
where R s denotes structural resilience, A i represents the avalanche size triggered by node i , and N is the total number of nodes in the network.
(2)
Economic resilience refers to the ability of the trade system to maintain its original trade value under the impact of risk shocks. In this study, it is measured by comparing the total trade value before and after the risk shocks.
R e = 1 T p o s t T p r e
where R e denotes economic resilience, and Tpre and Tpost represent the total global hydrogen trade value before and after the risk shock, respectively.
(3)
Environmental resilience refers to the ability of the global hydrogen system to maintain its original level of carbon emissions under risk shocks. In this study, it is measured by comparing the carbon rebound levels before and after the shock.
R e n v = 1 C r e b o u n d C b a s e l i n e
where R e n v denotes environmental resilience, and C r e b o u n d refers to the amount of carbon rebound, and C b a s e l i n e represents the potential carbon emission reduction achievable in the pre-shock scenario.
The indicator name, data source, and interpretations of the three resilience dimensions are synthesized in Table 1, establishing a consistent metric framework through which structural, economic, and environmental dynamic responses can be analyzed in subsequent investigations.

3.4. Composite Sustainability Index

Based on the three resilience dimensions described above, a Composite Sustainability Index was constructed to quantify the overall stability and sustainable development capacity of the GHTN under supply shortage shocks.
C S I = W s R s + W e R e + W e n v R e n v
where C S I denotes the Composite Sustainability Index, and W s , W e , and W e n v represent the weights assigned to structural, economic, and environmental resilience, respectively. An equal-weighting approach is adopted in this study to ensure balanced representation of structural, economic, and environmental resilience, given their comparable importance in energy system sustainability. It has been demonstrated that equal weighting often produces results similar to those of optimized weighting schemes. As a simple and transparent method, it is widely applied in multi-indicator evaluations, offering strong comparability and reproducibility [21]. To assess the robustness of this approach, a sensitivity analysis is conducted in Section 4.5 under alternative weighting scenarios.

4. Results and Discussion

4.1. Evolution of the GHTN Topological Structure

As an emerging component of the global energy trade system, the evolution of the hydrogen trade network is shaped by shifts in energy strategies, technological advances, and geopolitical dynamics. To visualize changes in network participation, trade density, and spatial patterns, global hydrogen trade networks for 2017, 2019, 2021, and 2023 are depicted in Figure 1. For more accurate comparison of key topological parameter changes in the GHTN from 2017 to 2023, the node, edge, average degree, density, average path length, and average clustering coefficient are summarized and presented in Table 2.
The GHTN underwent significant expansion and evolution from 2017 to 2023, as illustrated in Figure 1 and Table 2. In 2017, the GHTN was limited in size, with a relatively small number of participating countries, and trade relationships primarily concentrated in European countries, such as the Netherlands, Germany, the United Kingdom, and France, while countries in Asia and the Americas were positioned at the periphery, resulting in an overall decentralized network. In 2019, global interest in hydrogen trade rose, accompanied by an increase in the number of trading countries, with notably more active participation and stronger network connections in Asian countries, such as China. Europe remained at the center, while the United States became significantly more connected to Asia, and global hydrogen trade began to diversify. The size of the network remained stable in 2021, but the number of edges increased further, with more frequent trade links established between countries. In addition, connectivity between different regions increased that year, and the structure of the network became more polycentric, with Asian countries, such as China and Singapore, gaining further ground. In 2023, although the number of participating countries decreased slightly, the network as a whole became tighter and more efficient, possibly due to the global economic situation or policy changes. The number of edges decreased slightly, but the average degree reached its highest, implying that trade became more concentrated among the core countries, with European countries continuing to dominate global hydrogen trade. Meanwhile, the United States continues to maintain a high level of activity, while Asia, particularly China and Singapore, has emerged as an important player that cannot be overlooked and has grown increasingly influential in global hydrogen trade.
In summary, over the past few years, the GHTN has gradually evolved from its initial dominance in Western Europe and decentralization at the periphery to a multi-centered and closely interconnected global hydrogen energy trade network. Hydrogen energy, as a clean energy source, is gaining prominence in international trade, and the GHTN is expected to expand and deepen further in the future as global demand for green energy grows.

4.2. Structure Resilience of the GHTN

4.2.1. Avalanche Size Parameter

Avalanche size is defined as the total number of countries that fail due to the initial risk source, serving as a measure of the risk propagation scope within the network. The magnitude of avalanche size depends on the ratio k = α / β . When k is too large, the failure of any single country can trigger widespread cascading failures across the network. In contrast, when k is too small, the failure of a country does not lead to the collapse of others, resulting in ineffective risk propagation.
The distribution of avalanche sizes in the GOTN is illustrated in Figure 2. When the cumulative count distribution of avalanche sizes is observed to follow a power-law pattern, the network is considered to be in a critical state, and the corresponding value of k is regarded as the optimal parameter setting.
As k increases, the distribution curve becomes convex; when k decreases, it turns concave, both deviating from the typical long-tailed power-law shape and indicating a departure from the critical state. The optimal propagation parameter k is identified as 5, where the avalanche size distribution exhibits a power-law pattern.

4.2.2. Structural Resilience of the GHTN Based on Avalanche Size

To evaluate structural resilience, each country is set as the initial risk source to simulate and record avalanche size, avalanche rate, and propagation rounds. Results are summarized in Table 1. Simulation results indicate that only 45 countries trigger non-zero avalanche sizes, suggesting that most initial shocks fail to spread and the network possesses inherent fault tolerance. Further analysis shows that the average avalanche size of the GHTN is 2.736, accounting for approximately 0.02% of all nodes, indicating that risk propagation is effectively contained in most cases.
However, a few critical nodes exist in the network, where a reduction in their export volumes leads to widespread risk across many countries. Among the top 10 risk source countries shown in Table 3, Belgium triggers the largest avalanche size, affecting 38 countries—approximately 30.4% of all trade participants—followed by the United States and the Netherlands, with 25 and 16 affected countries, respectively. These countries typically combine high export intensity with central hub positions, making their failure likely to disrupt multiple importers and generate cumulative effects during subsequent propagation. The network displays a progressive propagation pattern, with most large-scale avalanches expanding sharply in the second round, reflecting high sensitivity to early disturbances. Overall, the GHTN exhibits global robustness but local fragility: while the system remains broadly resilient, the failure of a few key countries can trigger systemic disruptions.
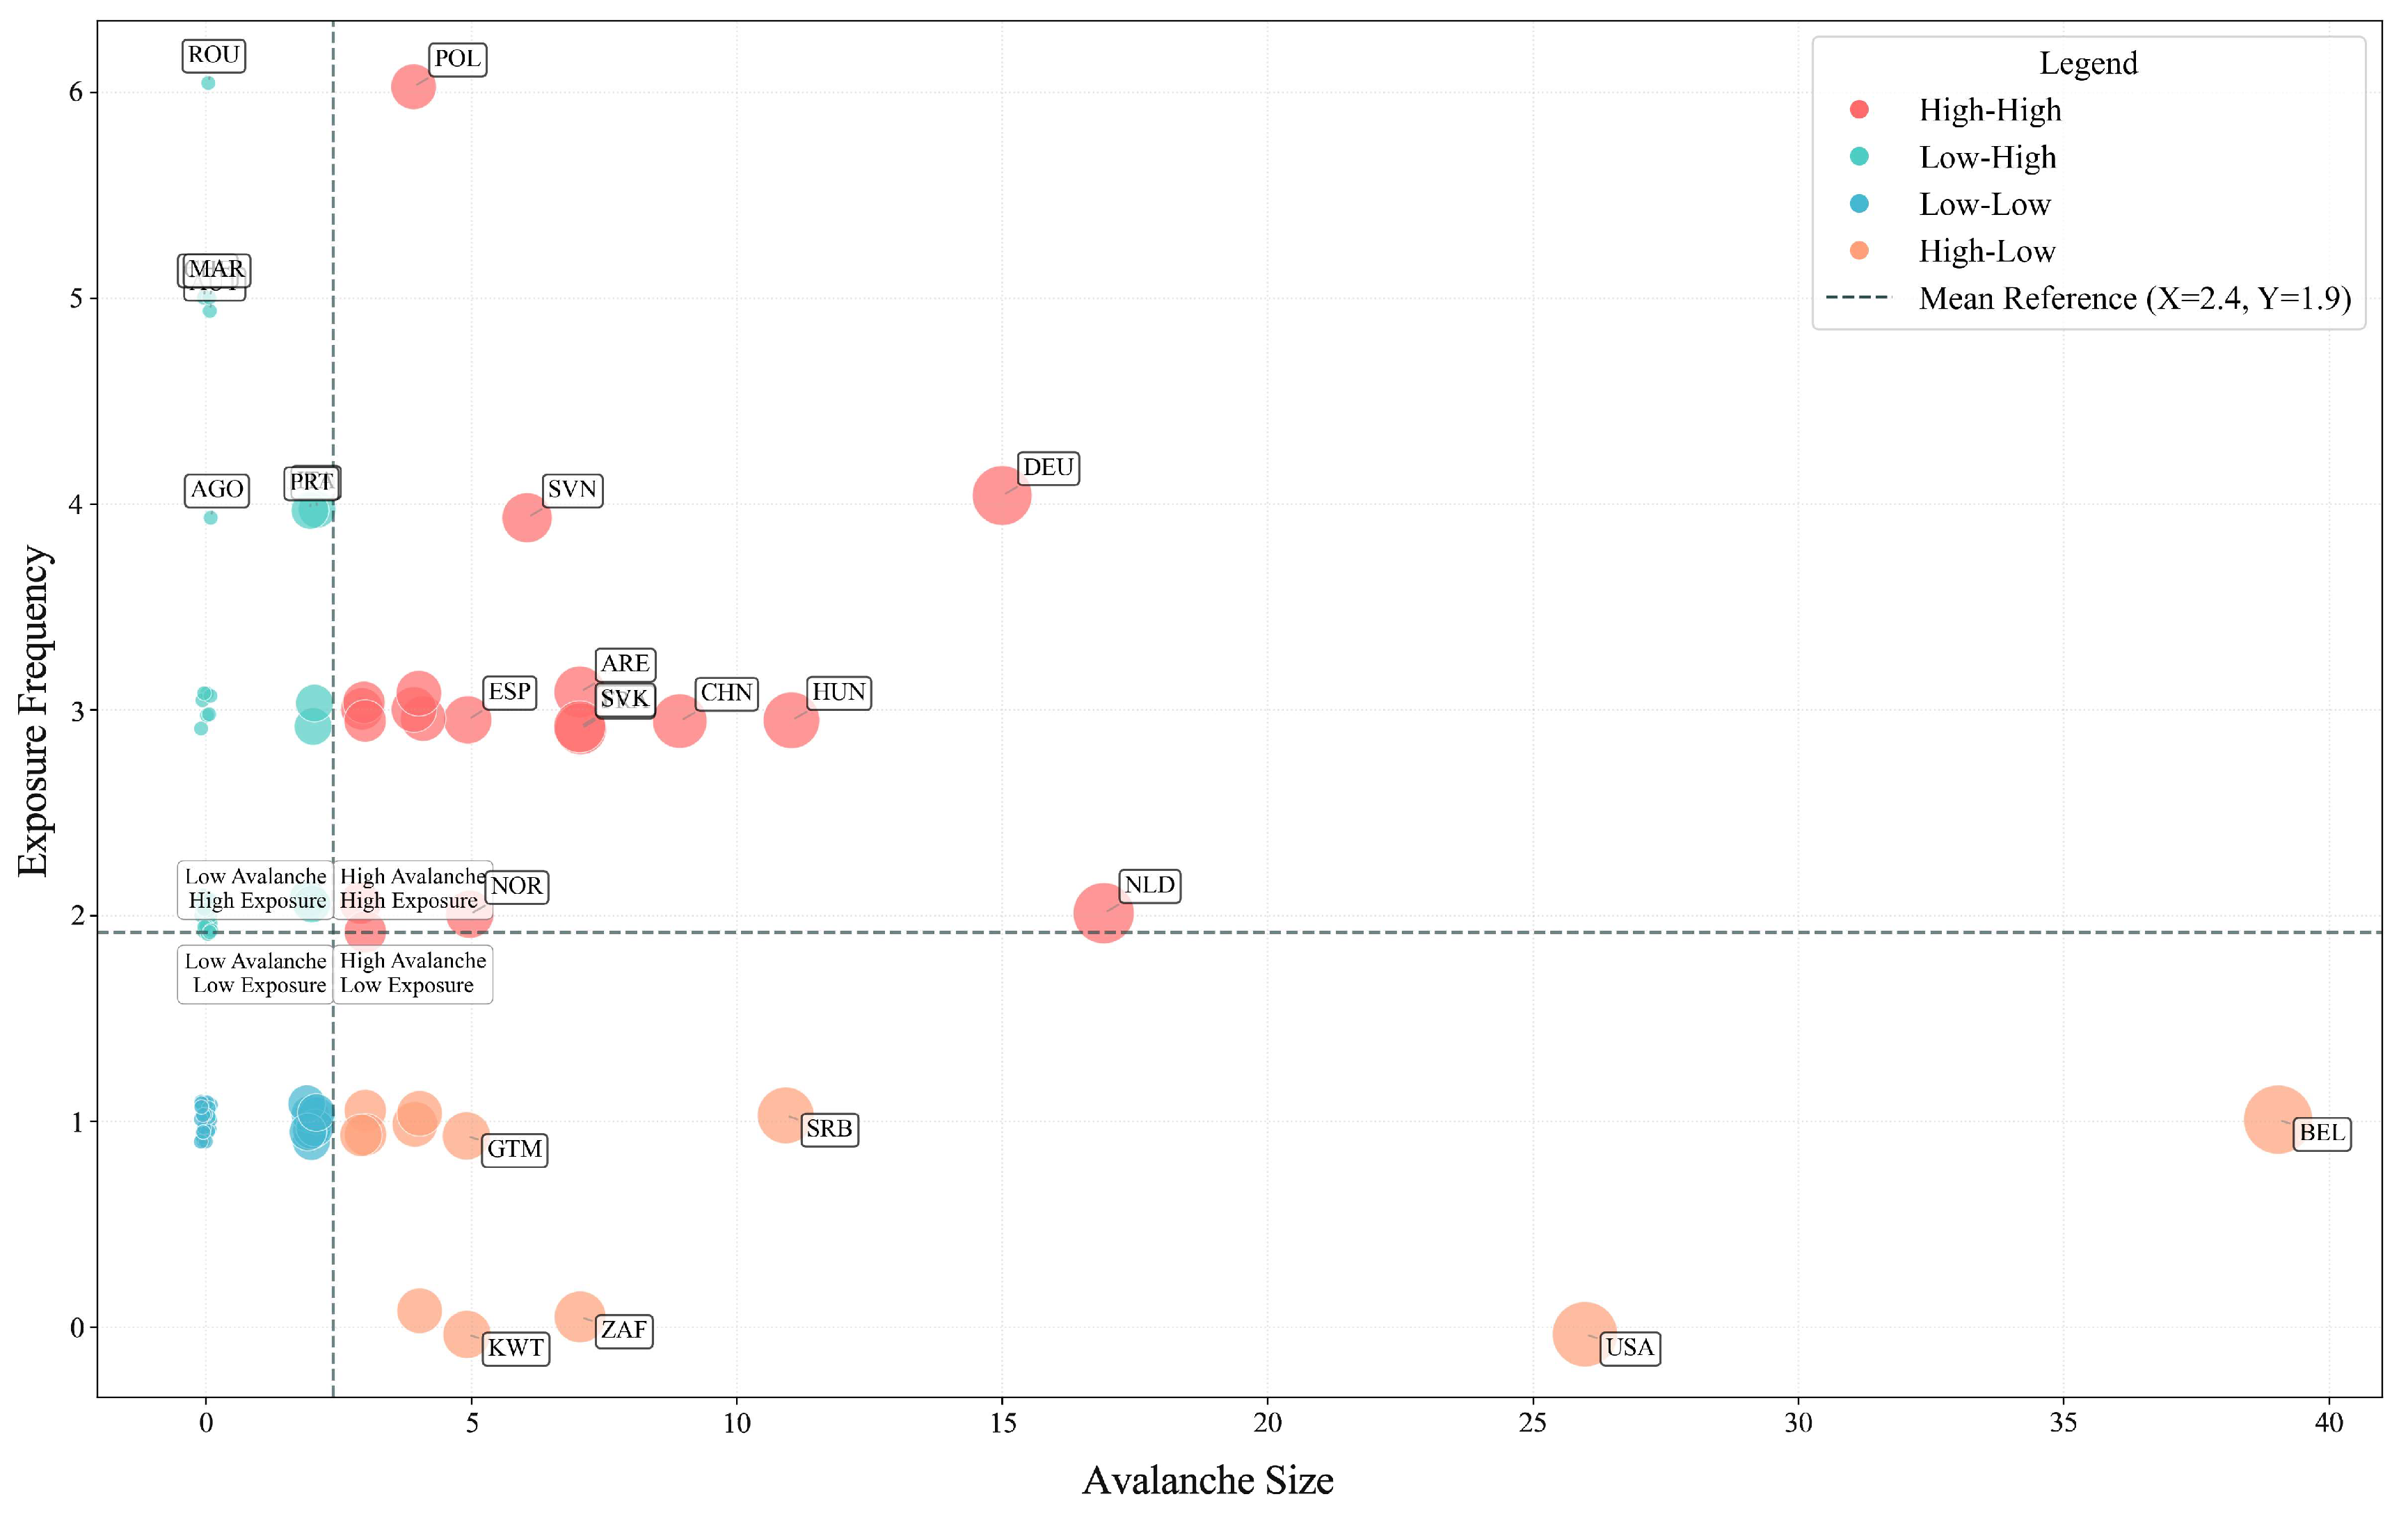
To further examine structural resilience at the country level, specifically the frequency with which each country is affected under different initial risk scenarios, a four-quadrant positioning map was constructed based on avalanche size and exposure frequency (Figure 3). The x-axis represents the avalanche size triggered when a country serves as the initial risk source, and the y-axis indicates how frequently it is passively affected by shocks. Bubble size corresponds to the country’s avalanche size. Different structural roles can be identified from the figure. The first quadrant (upper right, high avalanche–high exposure) represents “critical intermediary” countries that both trigger large avalanches and are highly exposed to failures from others. For example, Germany and Poland not only serve as important bridging nodes in the network but also exhibit relatively high vulnerability. The second quadrant (lower right, low avalanche–high exposure) corresponds to “vulnerable receivers,” referring to countries with limited capacity to propagate risk but high sensitivity to external shocks. Examples include Romania and Morocco, which may require greater import diversification to reduce systemic dependence. The third quadrant (lower left, low avalanche–low exposure) represents “peripheral robust” countries, which are typically located at the margins of the network. These countries are neither likely to trigger risks nor easily affected by others. Examples include Guatemala and Kuwait. The fourth quadrant (upper left, high avalanche–low exposure) represents “latent triggers,” such as Belgium and the United States, which possess strong risk propagation capacity while remaining relatively unaffected themselves. Supply disruptions from these countries are highly likely to trigger large-scale avalanches, making them critical risk sources that warrant close monitoring within the hydrogen trade system.

4.3. Economic Resilience of the GOTN

To assess the economic resilience of the GHTN, the impact of a supply disruption originating from Belgium on global hydrogen trade value is simulated in this section. Simulation results estimate a total global trade loss of USD 59.61 million, with an average of USD 0.48 million per country and a 15.4% decline in overall trade value. While a few countries incur substantial losses, most are only marginally affected, suggesting that the GHTN maintains economic resilience under localized disruptions.
In absolute terms, as shown in Table 4, excluding the risk source Belgium, the most significantly affected countries are the Netherlands, Germany, the United Kingdom, and Ireland, with estimated losses of approximately USD 25.99 million, 1.87 million, and 1.7 million, respectively. These countries experience direct economic shocks due to their strong hydrogen trade linkages with Belgium, underscoring the structural vulnerability associated with high network dependency. In relative terms (as a share of GDP), small economies, such as Luxembourg, and Namibia, rank low in absolute losses but high in relative impact. Their modest trade losses account for a significant portion of GDP, indicating weak economic resilience under disruptions from Belgium due to their small size and high hydrogen dependency.
Overall, the economic impacts of risk shocks within the GHTN exhibit significant heterogeneity. On one hand, advanced economies incur greater absolute losses due to their high network centrality and extensive trade with the risk source. On the other hand, smaller economies, despite lower trade volumes, may experience severe relative losses due to dependence on a single market. These findings suggest that enhancing economic resilience requires not only greater redundancy among key nodes but also improved trade diversification for peripheral countries, thereby strengthening the network’s overall economic resilience.

4.4. Environmental Resilience of the GHTN

To evaluate the environmental resilience of the GHTN under supply shortage shocks, the carbon rebound volume was employed as the primary indicator. It is defined as the additional greenhouse gas emissions generated by a shift to more carbon-intensive alternative energy sources following a decline in hydrogen imports, reflecting the passive emission risk induced by reduced trade volumes.
From a systemic perspective, a simulation with Belgium (BEL) as the initial risk source indicates that its supply disruption would lead to a global carbon rebound of approximately 5393 tons of CO2, with a rebound rate of 11.55%. This suggests that the current GOTN exhibits a degree of environmental vulnerability when exposed to supply shocks from key nodes. Once green hydrogen supply chains are disrupted, countries are often unable to rapidly transition to low-carbon alternatives, resulting in widespread carbon rebound and heightened environmental instability.
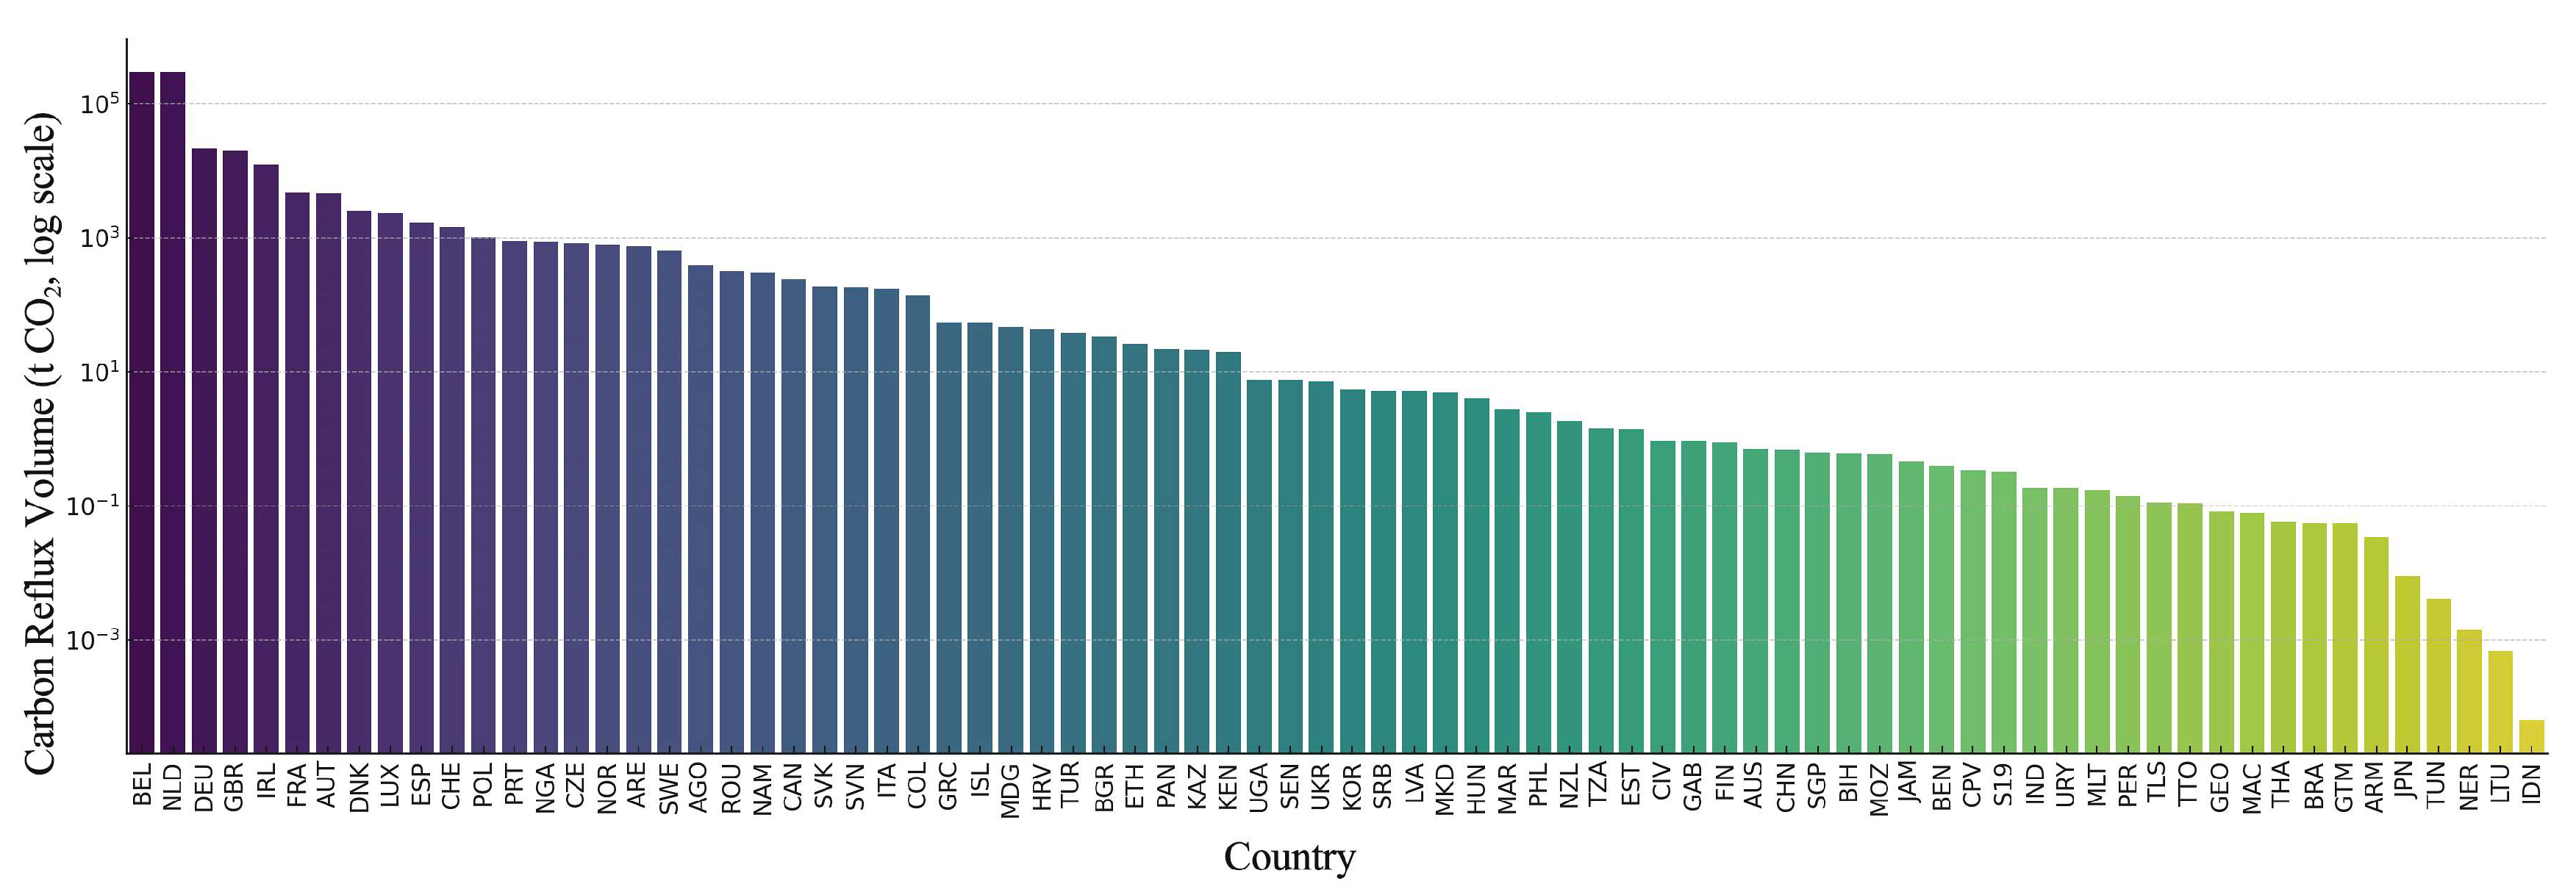
The distribution of carbon rebound volumes across countries is presented in Figure 4. To improve readability and facilitate comparison across different magnitudes, a logarithmic scale (log10) was applied. The results reveal a clear core concentration pattern, with a small number of countries accounting for the majority of system-wide emission increases. Specifically, countries such as Germany, the Netherlands, France, and the United Kingdom exhibit the highest carbon rebound volumes, due to their large-scale hydrogen imports, concentrated supply chains, and partial reliance on carbon-intensive sources. Disruptions in key exporters lead to sharp emission increases, exposing weak environmental resilience. These countries should enhance their green hydrogen portfolios by diversifying supply routes and building structural redundancy. In contrast, countries with lower carbon rebound volumes such as Finland, Slovenia, and New Zealand demonstrate greater environmental stability. This is attributed to their relatively small import volumes, more diversified trade routes, or reliance on lower-carbon supply sources. As a result, their carbon input structures remain less volatile under supply shocks, reflecting stronger environmental resilience. These countries function as a green buffer zone within the GHTN.
The GHTN displays environmental resilience marked by localized vulnerability and peripheral stability. Without low-carbon transitions or diversified supply in key countries, supply disruptions may induce widespread rebound emissions. Strengthening green resilience is, therefore, essential, particularly by enhancing redundancy and decarbonization in central nodes of the system. It should be noted that the modeling of the carbon rebound volume in this study is simplified and only provides an approximate estimate of the environmental resilience of the GHTN. Complex country-level substitution mechanisms are not considered. Future studies could enhance this component by incorporating more detailed and heterogeneous substitution pathways.

4.5. Sustainability of the GHTN

The sustainability of the GHTN under supply shocks is evaluated using a system-level framework comprising structural, economic, and environmental resilience. All three dimensions are standardized on a [0, 1] scale, with higher values indicating greater resilience. By averaging the normalized scores, a composite sustainability index of approximately 0.809 is obtained. The results indicate that, despite the persistence of structural vulnerabilities associated with a few critical nodes, the GHTN exhibits considerable buffering and adaptive capacity in both economic and environmental dimensions, reflecting a moderately high level of overall sustainability. However, underlying challenges remain, including the concentration of trade flows and the limited diversification of green supply routes. To enhance the long-term sustainability of the system, global hydrogen cooperation should be advanced in parallel across three pillars: security, equity, and environmental integrity.
To verify the robustness of the CSI under varying weight schemes, a sensitivity analysis was conducted with three alternative scenarios that respectively emphasize structural, economic, and environmental resilience using weight ratios of 2:1:1, 1:2:1, and 1:1:2. The results show that while CSI values fluctuate slightly (ranging from 0.78 to 0.83), the overall sustainability assessment remains largely unchanged, indicating that the proposed evaluation framework is relatively robust to weight perturbations.

5. Conclusions and Policy Implications

In the context of the global carbon neutrality transition, hydrogen has been increasingly recognized as a strategic clean energy source and acts as a key enabler in reshaping the international energy system through transnational trade. In this study, a complex network approach combined with a risk propagation model was employed to systematically evaluate the sustainability of the GOTN under supply shocks from structural, economic, and environmental perspectives. The main conclusions are as follows: (1) The structural evolution of the GHTN reveals a shift from a unipolar configuration toward a more polycentric architecture. Countries such as China and Singapore have progressively emerged as key interregional bridging nodes, facilitating connectivity across trade communities in Europe and Asia, thereby strengthening the structural cohesion of the network. (2) From a system-wide perspective, the GHTN exhibits multiple disturbance responses under supply shortage shocks, including risk propagation, economic losses, and increases in carbon rebound. However, these effects remain concentrated in a few core regions, such as Germany, the Netherlands, and the United Kingdom, which maintain strong trade dependencies on the disrupted source. In contrast, most peripheral countries experience only limited spillover effects. Consequently, the network’s overall sustainability remains within a manageable and resilient range. (3) A country-level assessment revealed marked heterogeneity in the resilience performance of the hydrogen trade network across structural, economic, and environmental dimensions. In terms of structural resilience, supply shortages in countries, such as Belgium, the United States, and the Netherlands, are highly susceptible to initiating large-scale avalanches within the network, whereas countries such as Romania and Morocco exhibit greater vulnerability to secondary transmission effects. In terms of economic resilience, countries with large hydrogen trade volumes, such as the Netherlands, Germany, and the United Kingdom, experience significant absolute economic losses, while smaller economies, including Luxembourg, Ireland, and Namibia, rank higher in terms of relative losses. In terms of environmental resilience, the carbon rebound volume is also more pronounced in countries such as the Netherlands, Germany, and the United Kingdom. These heterogeneous manifestations suggest that risk in the GHTN does not spread uniformly, but rather exhibits distinct characteristics of hub-triggered initiation, chain-like transmission, and localized concentration.
Based on the above analysis, the following policy recommendations are proposed. (1) Strengthen polycentric cooperation mechanisms to enhance the structural sustainability of the hydrogen trade network. It is recommended to advance the development of cross-regional strategic cooperation platforms for hydrogen, and to promote the formation of hydrogen corridors and supply chain node alliances jointly led by multicenter hub countries and other emerging economies. By diversifying trade routes and coordinating infrastructure investments, the connectivity and hierarchical structure of the network can be optimized, thereby mitigating the systemic impact of supply shortages in any single country and improving the overall resilience and sustainability of the global hydrogen trade system. (2) Establish regional emergency coordination mechanisms to enhance the GHTN’s sustainable response capacity in economic and environmental dimensions. It is recommended that regional frameworks, such as the European Union and the Asia–Pacific, develop hydrogen trade disruption contingency mechanisms encompassing risk monitoring, alternative dispatching, and temporary supply functions. Countries should be encouraged to incorporate green hydrogen reserves into their national energy security strategies to improve their ability to respond to high-carbon fallback scenarios. At the international level, the establishment of hydrogen import agreements based on a green-first principle should be promoted to reduce the environmental sustainability risks associated with carbon rebound volume. (3) Advance differentiated capacity building for key hubs and vulnerable countries to foster an inclusive and resilient global hydrogen governance framework. The significant national heterogeneity observed across the GHTN’s multidimensional resilience highlights the necessity of globally coordinated yet tailored governance. For structurally critical countries, trade route redundancy should be strengthened to prevent systemic risks from single-point failures. Vulnerable countries should be prioritized within international hydrogen cooperation initiatives, with support for developing localized hydrogen reception and conversion infrastructure and diversifying import sources. For countries highly exposed to carbon rebound risks, the promotion of green hydrogen procurement agreements and responsibility-sharing mechanisms under the United Nations’ sustainable energy platforms is recommended to enhance environmental governance capacity. By combining differentiated strategies with global coordination, an equitable, well-structured, and sustainable hydrogen trade network can be realized.

Author Contributions

Conceptualization, Methodology, Software, Writing—Original Draft Preparation, Writing—Review and Editing, Funding Acquisition, S.C.; Writing—Original Draft Preparation, Writing—Review and Editing, Y.T. All authors have read and agreed to the published version of the manuscript.

Funding

This work was founded by the National Natural Science Foundation of China, grant number 72304225. The Innovation Capability Support Plan (soft science research program) project of Shaanxi Province in 2024, grant number 2024ZC-YBXM-128, the 2024 Annual Project of the Social Science Fund of Shaanxi Province, grant number 2024R062, and the General Special Project of Scientific Research Program of the Shaanxi Provincial Department of Education, grant number 24JK0143.

Data Availability Statement

The data presented in this study are available upon request from the corresponding author.

Conflicts of Interest

The authors declare no conflicts of interest.

References

  1. Rosen, M.A.; Koohi-Fayegh, S. The prospects for hydrogen as an energy carrier: An overview of hydrogen energy and hydrogen energy systems. Energy Ecol. Environ. 2016, 1, 10–29. [Google Scholar] [CrossRef]
  2. Jia, J.; Xin, L.; Lu, C.; Wu, B.; Zhong, Y. China’s CO2 emissions: A systematical decomposition concurrently from multi-sectors and multi-stages since 1980 by an extended logarithmic mean divisia index. Energy Strateg. Rev. 2023, 49, 101141. [Google Scholar] [CrossRef]
  3. Van de Graaf, T. Hydrogen’s decade. Finance Dev. 2022, 59, 21–23. [Google Scholar]
  4. Min, M.; Yoon, C.; Yoo, N.; Kim, J.; Yoon, Y.; Jung, S. Hydrogen risk assessment studies: A review toward environmental sustainability. Energies 2025, 18, 229. [Google Scholar] [CrossRef]
  5. Chen, P.S.L.; Fan, H.; Enshaei, H.; Zhang, W.; Shi, W.; Abdussamie, N.; Yang, Z. A review on ports’ readiness to facilitate international hydrogen trade. Int. J. Hydrogen Energy 2023, 48, 17351–17369. [Google Scholar] [CrossRef]
  6. Johnson, N.; Liebreich, M.; Kammen, D.M.; Ekins, P.; McKenna, R.; Staffell, I. Realistic roles for hydrogen in the future energy transition. Nat. Rev. Clean Technol. 2025, 1, 351–371. [Google Scholar] [CrossRef]
  7. Alanazi, K.; Mittal, S.; Hawkes, A.; Shah, N. Renewable hydrogen trade in a global decarbonised energy system. Int. J. Hydrog. Energy 2025, 101, 712–730. [Google Scholar] [CrossRef]
  8. Kumar, P.; Singh, J.; Singh, G. Renewable hydrogen opportunities and challenges. Renew. Hydrog. 2024, 193–220. [Google Scholar] [CrossRef]
  9. Kong, L.; Koh, S.L.; Sena, V.; Robinson, D.; Wood, M. Towards a resilience evaluation framework for hydrogen supply chains: A systematic literature review and future research agenda. Int. J. Hydrogen Energy 2025, 99, 589–606. [Google Scholar] [CrossRef]
  10. Jesse, B.J.; Heinrichs, H.U.; Kuckshinrichs, W. Adapting the theory of resilience to energy systems: A review and outlook. Energy Sustain. Soc. 2019, 9, 1–19. [Google Scholar] [CrossRef]
  11. Perrings, C. Resilience and sustainable development. Environ. Dev. Econ. 2006, 11, 417–427. [Google Scholar] [CrossRef]
  12. Lingua, C.; Crespi, G.; Becchio, C.; Corgnati, S.P. Designing IAQ-resilient post-pandemic buildings. Sustainability 2023, 15, 2187. [Google Scholar] [CrossRef]
  13. Yusaf, T.; Laimon, M.; Alrefae, W.; Kadirgama, K.; Dhahad, H.A.; Ramasamy, D.; Yousif, B. Hydrogen energy demand growth prediction and assessment (2021–2050) using a system thinking and system dynamics approach. Appl. Sci. 2022, 12, 781. [Google Scholar] [CrossRef]
  14. Noyan, O.F.; Hasan, M.M.; Pala, N. A global review of the hydrogen energy eco-system. Energies 2023, 16, 1484. [Google Scholar] [CrossRef]
  15. Xue, L.; Chen, F.; Fu, G.; Xia, Q.; Du, L. Stability analysis of the world energy trade structure by multiscale embedding. Front. Energy Res. 2021, 9, 729690. [Google Scholar] [CrossRef]
  16. Zhang, Q.; Wang, L.; Chen, W.; Zhang, C. Assessing the impact of hydrogen trade towards low-carbon energy transition. Appl. Energ. 2024, 376, 124233. [Google Scholar] [CrossRef]
  17. Zou, C.; Li, J.; Zhang, X.; Jin, X.; Xiong, B.; Yu, H.; Pan, S. Industrial status, technological progress, challenges, and prospects of hydrogen energy. Nat. Gas Ind. B. 2022, 9, 427–447. [Google Scholar] [CrossRef]
  18. Van de Graaf, T.; Overland, I.; Scholten, D.; Westphal, K. The new oil? The geopolitics and international governance of hydrogen. Energ. Res. Soc. Sci. 2020, 70, 101667. [Google Scholar] [CrossRef]
  19. Zhang, Y.; Kang, Y. Research on the evolution and endogenous mechanism of global hydrogen trade dependence network. Sustain. Energy Technol. Assess. 2024, 70, 103959. [Google Scholar] [CrossRef]
  20. Lemence, A.L.G.; Cravioto, J.; McLellan, B.C. Review of social sustainability assessments of electricity generating systems. Energies 2024, 17, 6058. [Google Scholar] [CrossRef]
  21. Wang, J.J.; Jing, Y.Y.; Zhang, C.F.; Zhao, J.H. Review on multi-criteria decision analysis aid in sustainable energy decision-making. Renew. Sustain. Energy Rev. 2009, 13, 2263–2278. [Google Scholar] [CrossRef]
  22. Abdel-Basset, M.; Gamal, A.; Chakrabortty, R.K.; Ryan, M.J. Evaluation of sustainable hydrogen production options using an advanced hybrid MCDM approach: A case study. Int. J. Hydrogen Energy 2021, 46, 4567–4591. [Google Scholar] [CrossRef]
  23. Li, W.; Ren, X.; Ding, S.; Dong, L. A multi-criterion decision making for sustainability assessment of hydrogen production technologies based on objective grey relational analysis. Int. J. Hydrogen Energy 2020, 45, 34385–34395. [Google Scholar] [CrossRef]
  24. Ransikarbum, K.; Chanthakhot, W.; Glimm, T.; Janmontree, J. Evaluation of sourcing decision for hydrogen supply chain using an integrated multi-criteria decision analysis (MCDA) tool. Resources 2023, 12, 48. [Google Scholar] [CrossRef]
  25. Gößling-Reisemann, S. Resilience–preparing energy systems for the unexpected. In An Edited Collection of Authored Pieces Comparing, Contrasting, and Integrating Risk and Resilience with an Emphasis on Ways to Measure Resilience; EPFL International Risk Governance Center (IRGC): Lausanne, Switzerland, 2016; p. 73. [Google Scholar]
  26. Davoudi, S.; Brooks, E.; Mehmood, A. Evolutionary resilience and strategies for climate adaptation. Plan. Pract. Res. 2013, 28, 307–322. [Google Scholar] [CrossRef]
  27. Wears, R.L. Resilience engineering: Concepts and precepts. BMJ Qual. Saf. 2006, 15, 447–448. [Google Scholar] [CrossRef]
  28. Jasiūnas, J.; Lund, P.D.; Mikkola, J. Energy system resilience–A review. Renew. Sustain. Energy Rev. 2021, 150, 111476. [Google Scholar] [CrossRef]
  29. Panteli, M.; Mancarella, P.; Trakas, D.N.; Kyriakides, E.; Hatziargyriou, N.D. Metrics and quantification of operational and infrastructure resilience in power systems. IEEE Trans. Power Syst. 2017, 32, 4732–4742. [Google Scholar] [CrossRef]
  30. Francis, R.; Bekera, B. A metric and frameworks for resilience analysis of engineered and infrastructure systems. Reliab. Eng. Syst. Safe. 2014, 121, 90–103. [Google Scholar] [CrossRef]
  31. Kurnia, W.I.; Harits, D.; Cahyo, W.N. The analysis of the digitalization role on towards supply chain resilience and sustainable (Case study: MSME in Balikpapan city). Spektrum Industri. 2025, 23, 86–105. [Google Scholar] [CrossRef]
  32. Roege, P.E.; Collier, Z.A.; Mancillas, J.; McDonagh, J.A.; Linkov, I. Metrics for energy resilience. Energy Policy 2014, 72, 249–256. [Google Scholar] [CrossRef]
Figure 1. GHTN in 2017, 2019, 2021, and 2023.
Energies 18 03944 g001
Figure 2. Log–log distributions of avalanche size distributions of the GHTN under different k.
Energies 18 03944 g002
Figure 3. Classification of countries by avalanche size and exposure frequency.
Energies 18 03944 g003
Figure 4. Carbon rebound volume across countries under risk source BEL (log scale).
Energies 18 03944 g004
Table 1. Three-dimensional resilience indicator system.
DimensionIndicator NameData SourceInterpretation
Structural ResilienceAvalanche SizeRisk propagation modelReflects network structural stability
Economic ResilienceTrade Loss RateTrade volume dataMeasures economic shock resistance
Environmental ResilienceCarbon Rebound VolumeCarbon emission dataIndicates environmental sustainability
Table 2. Evolution of GHTN topological structure from 2017 to 2023.
YearNodesEdgesAverage DegreeDensityAverage Path LengthAverage Clustering
20171284296.70313.03030.02640.2744
20191414406.24113.14620.02230.3101
20211414916.96452.84960.02490.3373
20231254597.34402.77660.02960.3215
Table 3. Top 10 countries ranked by triggered avalanche size.
RankCountryAvalancheProportionT1T2T3T4T5
1BEL380.30612303738
2USA250.202025
3NLD160.13716
4DEU140.1181214
5HUN100.08610
7SRB100.085910
8CHN80.068
9ARE60.0542
10FRA40.0361
T1–T5 indicate the number of countries affected in the first to fifth propagation rounds.
Table 4. Rankings of absolute and relative trade losses.
RankISOAbsolute LossISORelative Loss%
1BEL2670.26BEL4.62 × 10−5
2NLD2599.74NLD2.62 × 10−5
3DEU188.56LUX2.61 × 10−6
4GBR169.64IRL2.05 × 10−6
5IRL108.48NAM1.94 × 10−6
6FRA41.56AUT8.66 × 10−7
7AUT40.84DNK5.72 × 10−7
8DNK22.63GBR5.52 × 10−7
9LUX21.45DEU4.63 × 10−7
10ESP14.67PRT3.16 × 10−7
The unit of absolute loss is USD 10,000, and the unit of relative loss is percentage (%). In the calculation of relative loss, the GDP values were measured in millions of USD.
Disclaimer/Publisher’s Note: The statements, opinions and data contained in all publications are solely those of the individual author(s) and contributor(s) and not of MDPI and/or the editor(s). MDPI and/or the editor(s) disclaim responsibility for any injury to people or property resulting from any ideas, methods, instructions or products referred to in the content.

