Article

Modelling of Selected Algorithms for Maximum Power Point Tracking in Photovoltaic Panels

by
Grzegorz Trzmiel
1,
Jarosław Jajczyk
1,
Jan Szulta
1,
Norbert Chamier-Gliszczynski
2,* and
Waldemar Woźniak
3
1
Faculty of Control, Robotics and Electrical Engineering, Poznan University of Technology, 60-965 Poznan, Poland
2
Faculty of Economics Sciences, Koszalin University of Technology, 75-453 Koszalin, Poland
3
Faculty of Mechanical Engineering, University of Zielona Gora, 65-001 Zielona Gora, Poland
*
Author to whom correspondence should be addressed.
Energies 2025, 18(19), 5223; https://doi.org/10.3390/en18195223
Submission received: 28 July 2025 / Revised: 22 September 2025 / Accepted: 26 September 2025 / Published: 1 October 2025
(This article belongs to the Special Issue New Advances in Material, Performance and Design of Solar Cells)

Abstract

The main focus of this article is the simulation and analysis of the operating principles of selected maximum power point tracking (MPPT) algorithms for photovoltaic panels, as well as a comparison of various techniques used to address this challenge. The article discusses the underlying rationale for the necessity of identifying the operating point at which a photovoltaic panel delivers maximum power. In addition to the theoretical description, the algorithms were classified, and in the simulation section, the most popular and widely used MPPT algorithms were implemented and compared in the MATLAB 24.11 (R2024a) environment. The application of appropriate solutions among the modelled and tested algorithms enables improved efficiency of photovoltaic cells within panels or larger photovoltaic systems.

1. Introduction

In recent years, the total annual installed capacity of photovoltaic systems has exhibited a consistent upward trend. According to projections by the European Commission, renewable energy sources are expected to provide around 90% of electricity generation within the European Union by 2040 [1].
The development of photovoltaic cells is associated not only with an increasing share of solar energy in the power system. Numerous studies have also explored the integration of photovoltaic cells with electric propulsion vehicles and highlight their essential role in space applications [2,3]. Furthermore, the incorporation of photovoltaic cells into buildings is becoming an increasingly prominent topic in academic research [4].
Such large figures and the potential for growth indicate a significant increase in the importance and advancement of photovoltaic technologies in the near future. The efficiency of solar cells remains relatively low, reaching just over 20% in most commercially available products [5,6]. To address this limitation, various systems have been implemented to enhance the power output of solar panels and ensure their optimal performance [6,7].
A key factor in maximising the power output of a photovoltaic installation is the implementation of a maximum power point tracking (MPPT) algorithm [6,8]. Numerous studies in the literature propose increasingly innovative and advanced algorithms [9,10,11,12]. Nevertheless, even basic solutions provide significant benefits to the overall performance of the entire installation [10,11,12].
This article focuses on explaining the necessity of employing maximum power point tracking (MPPT) algorithms, as well as reviewing and simulating the most frequently applied methods that enhance the energy output of operating installations, thereby improving the performance of photovoltaic panels and their integrated PV cells. In addition to a theoretical review, the authors decided to model, simulate, and compare the performance of the most popular and most commonly used MPPT algorithms.

1.1. Electrical Diagram and Mathematical Model of a Photovoltaic Cell

An individual photovoltaic cell is capable of conducting a current on the order of several amperes and operating at a voltage of a few tenths of a volt, which results in a relatively modest power output of several watts [5]. To increase the electrical power generated by a photovoltaic cell, multiple cells are interconnected in series or parallel configurations, thereby increasing the output voltage or current, respectively [5]. Such an interconnected arrangement of cells is referred to as a photovoltaic module, which can then be combined with additional modules to form a photovoltaic panel [8].
Figure 1 shows the two-diode equivalent circuit of a photovoltaic (PV) cell [5]. The circuit consists of a current source representing the photocurrent I f , generated by electromagnetic radiation, two semiconductor diodes through which currents I 1 and I 2 flow, a series resistance R S , and a shunt resistance R b . The current I represents the electric current at the output of the cell, while U denotes the voltage across the photovoltaic cell.
According to the equivalent circuit shown in Figure 1, the output current I of the cell under the influence of electromagnetic radiation is given by the following equation [5]:
I = I f I 1 I 2 U + R S · I R b
where I f —photocurrent generated by the photovoltaic cell as a result of solar radiation [A], I 1 —dark diffusion current [A],   I 2 —dark generation and recombination current [A], R b —shunt resistance [Ω], R S —series resistance [Ω], U —cell voltage [V].
The most significant factor affecting the current I is the photocurrent I f , which is generated by the cell as a result of incident solar radiation. The value of this current is given by the formula [5]:
  I f = I S C G 1000 + α 0 T T 0
where I f —photocurrent generated by the photovoltaic cell as a result of solar radiation [A], I S C —short-circuit current of the cell [A], G —solar irradiance [W/m2], α 0 —temperature coefficient of the cell [A/K], and T —temperature [K], T 0 —reference temperature [K].
The next two components are the diffusion dark current I 1 and the generation-recombination dark current I 2 [5]:
I 1 = I S 1 e x p q U + R S I α 1 k T 1
I 2 = I S 2 e x p q U + R S I α 2 k T 1
where I S 1 —saturation current of the diffusion component of the dark current [A], I S 2 —saturation current of the generation-recombination component of the dark current [A], q —elementary charge [C], k —Boltzmann constant, and α 1 , α 2 —ideality (quality) of the diodes.
By substituting Equations (2)–(4) into Equation (1), the following expression for the cell current I is obtained:
I = I S C G 1000 + α 0 T T 0   I S 1 e x p q U + R S I α 1 k T 1   I S 2 e x p q U + R S I α 2 k T 1 U + R S   ·   I R b
Formulas based on the two-diode equivalent circuit provide a more accurate representation of the characteristics of photovoltaic panels compared to the single-diode model [6]. However, they require numerous parameters for calculation, many of which are often unavailable in manufacturers’ datasheets [13]. Consequently, these parameters must be determined either computationally or analytically through measurements on an actual module, or by adopting certain simplifying assumptions.

1.2. Photovoltaic Panel Performance Characteristics

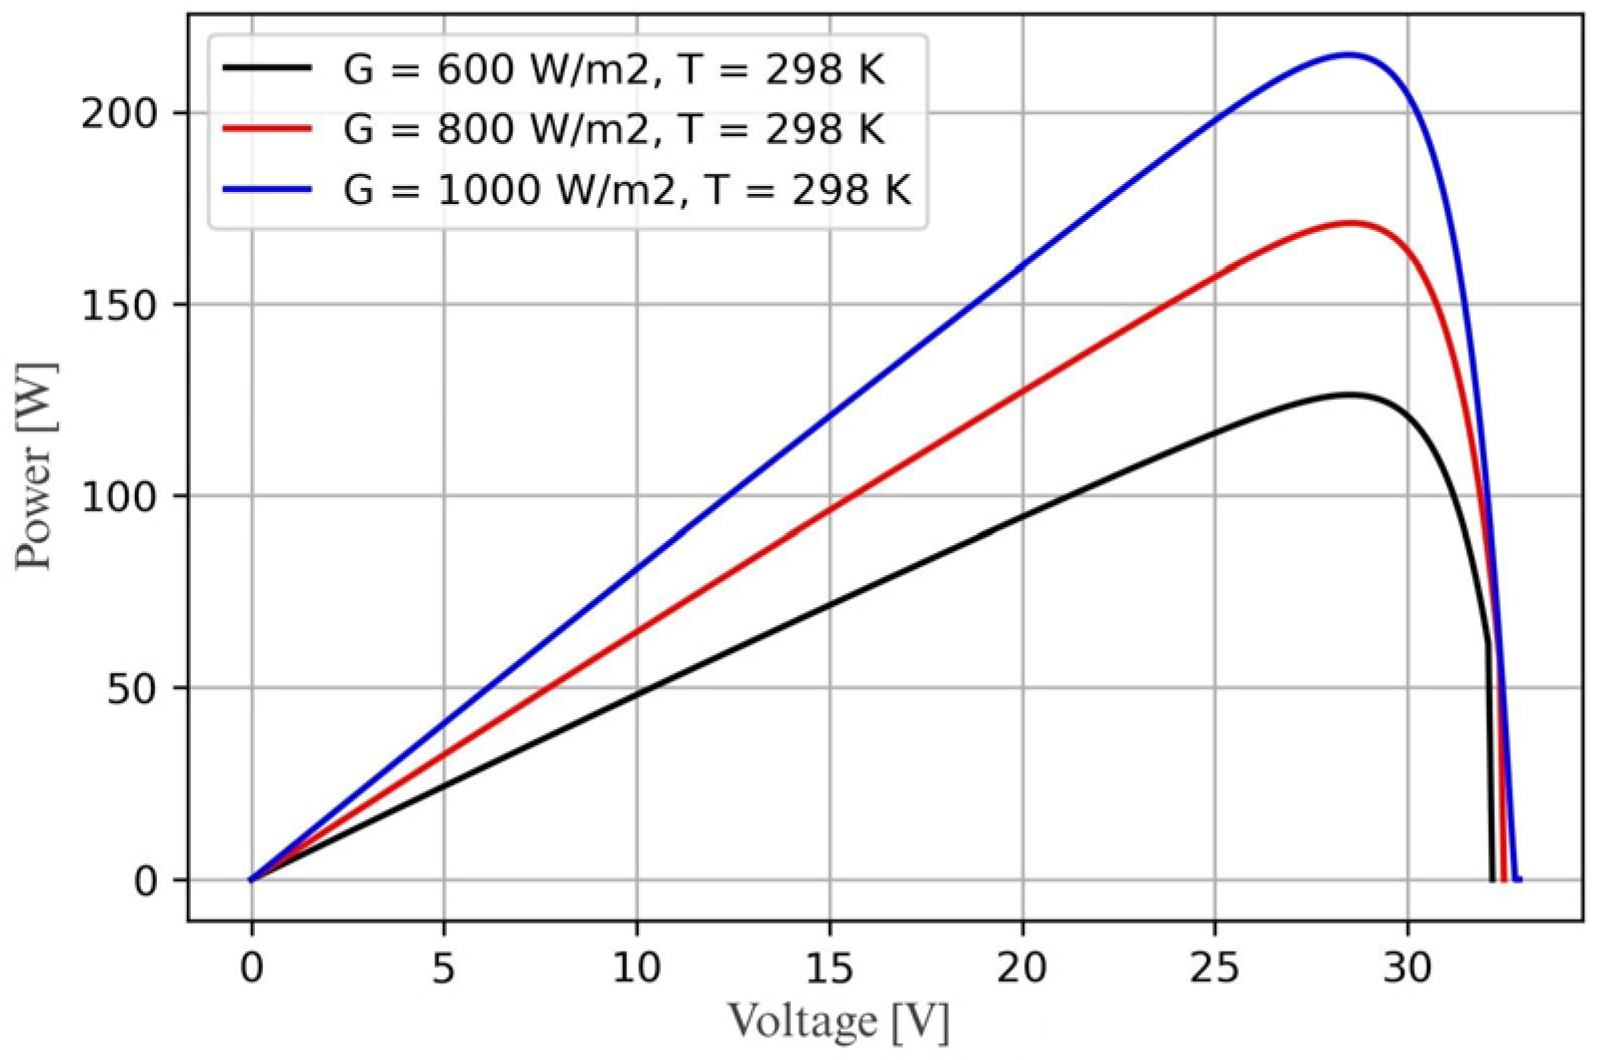
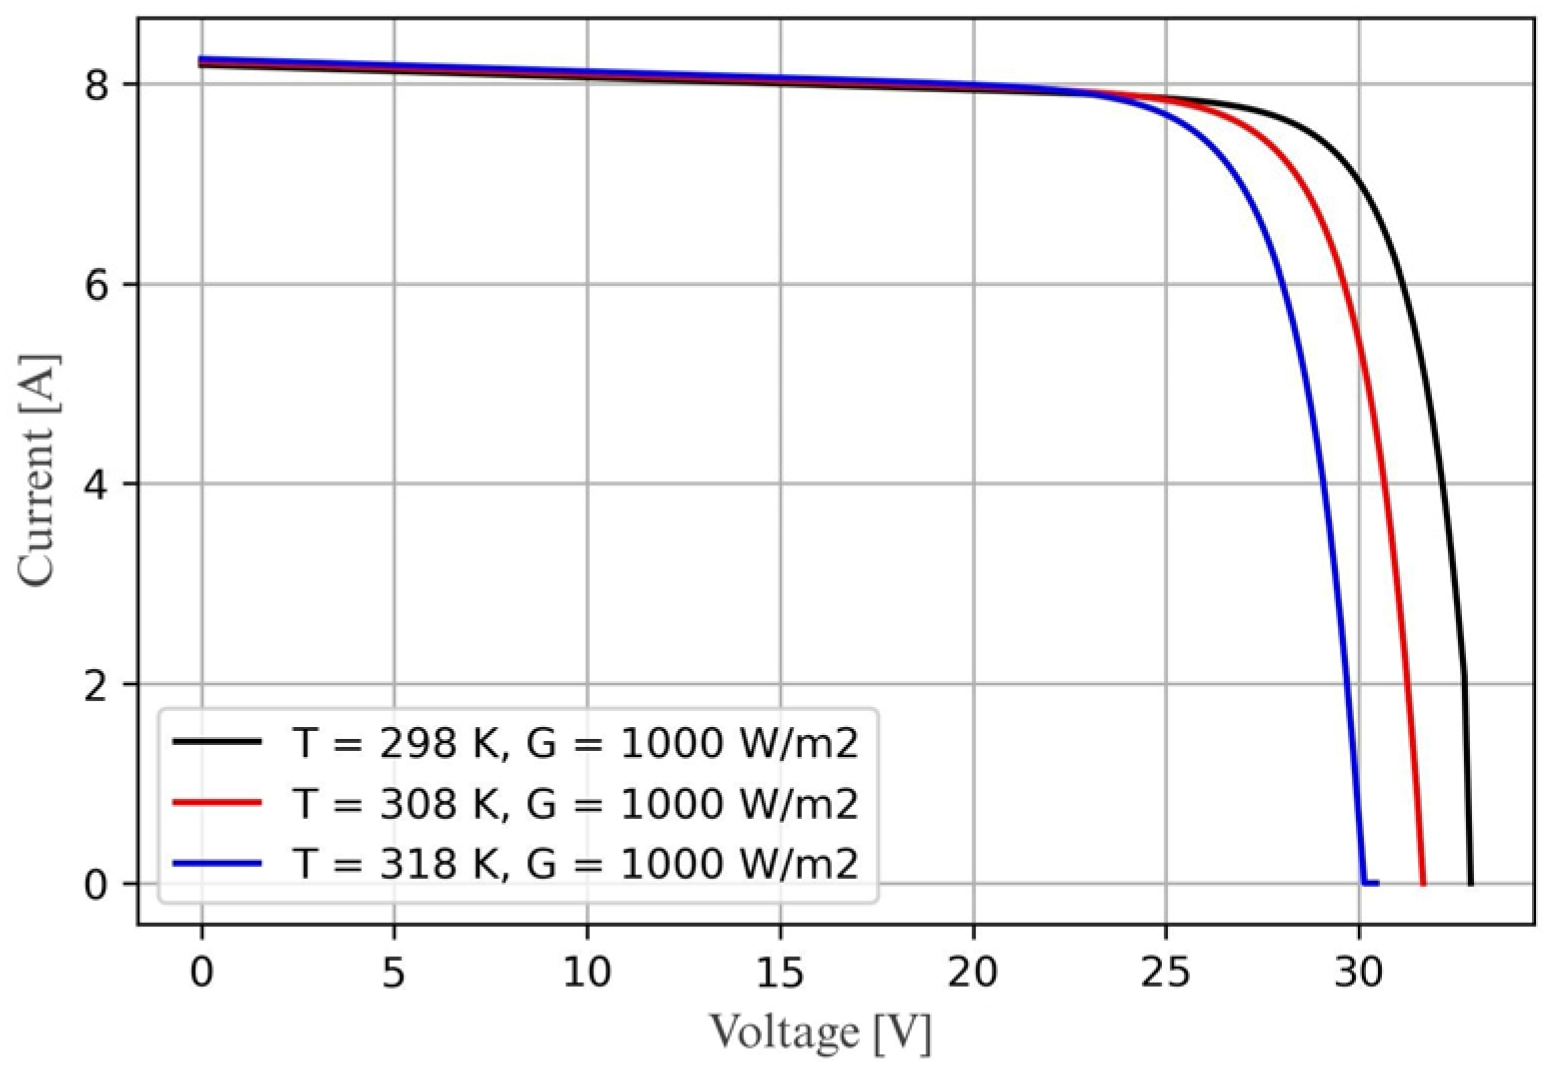
Based on Equation (5), a mathematical model of the photovoltaic panel was developed using the Python 3.10.9 programming language and the Spyder 5.4.1 software environment. After running the programme, the current-voltage and power-voltage characteristics of the panel were plotted, illustrating the influence of irradiance (Figure 2 and Figure 3) as well as the effect of cell temperature (Figure 4 and Figure 5) on the electrical parameters of a selected commercially available photovoltaic panel [14].
The characteristics illustrate the key dependencies of the electrical parameters of the photovoltaic panel and the influence of environmental conditions. A decrease in solar irradiance results in a reduction in the electric current I, and consequently, a decrease in power output (Figure 2 and Figure 3). In contrast, an increase in temperature causes a drop in the open-circuit voltage ( U O C , the point where the curve intersects the x-axis), which also leads to a reduction in power output (Figure 4 and Figure 5). The characteristics are highly nonlinear: as the panel voltage increases, the power rises approximately linearly until the maximum power point is reached, after which it drops sharply. In contrast, the electric current remains approximately constant with increasing voltage, but it also decreases abruptly after reaching the maximum power point.

1.3. Maximum Power Point Tracking of Photovoltaic Panels

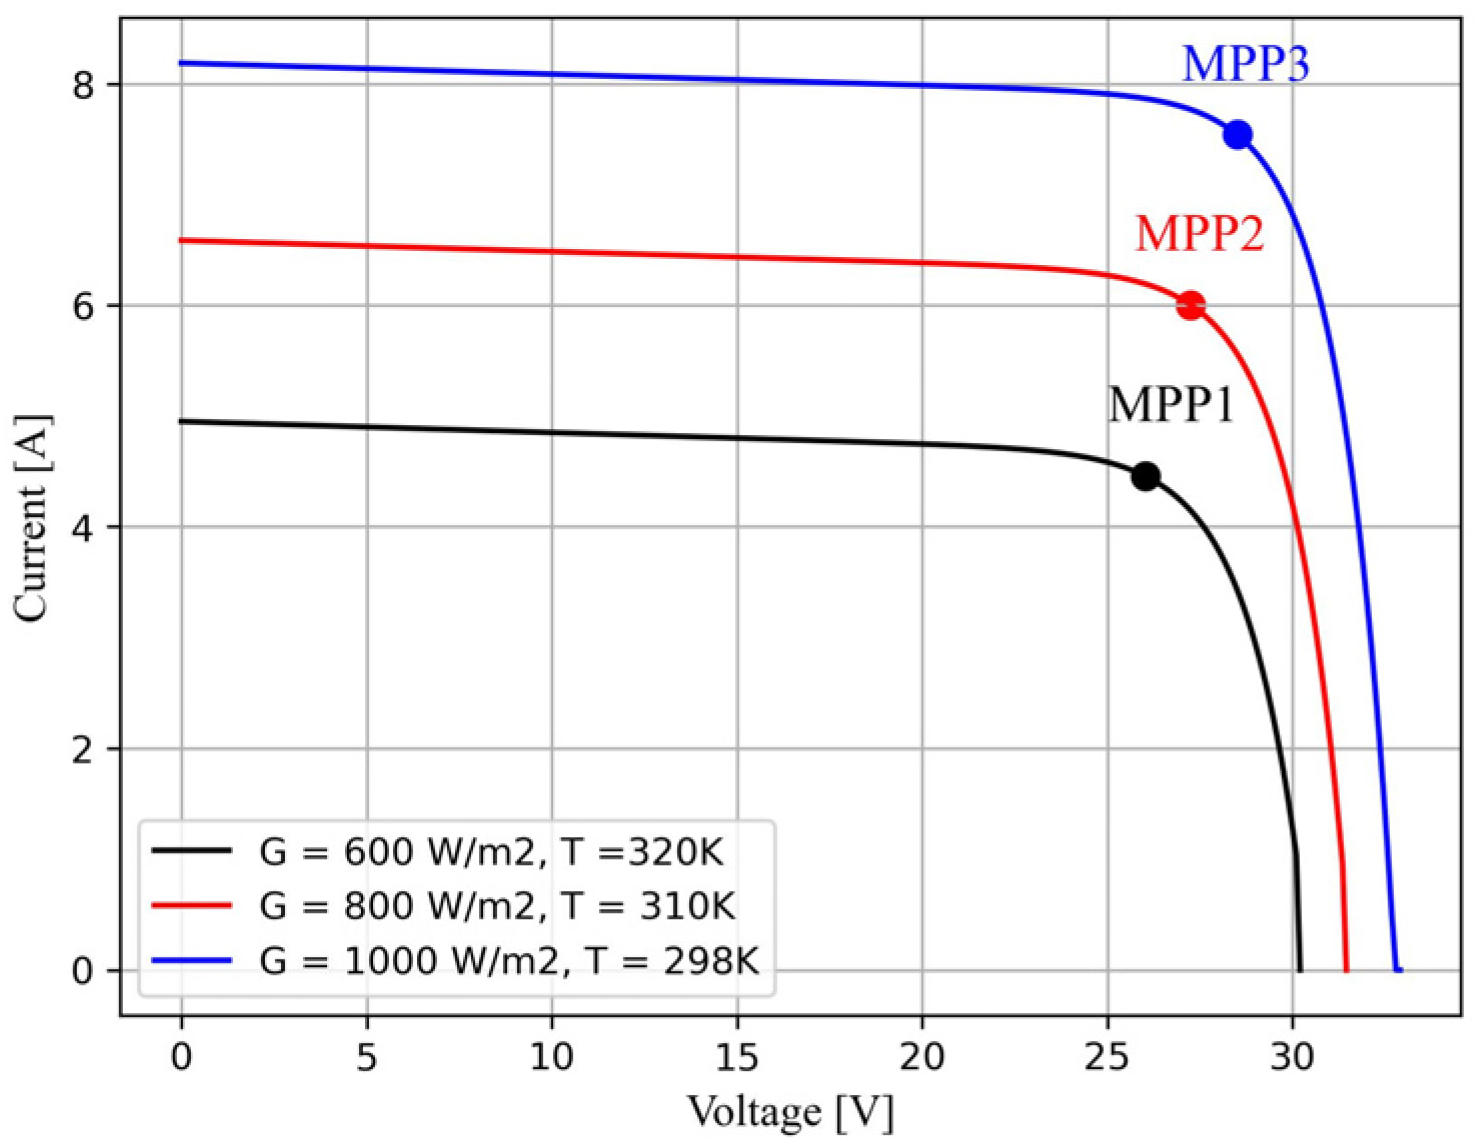
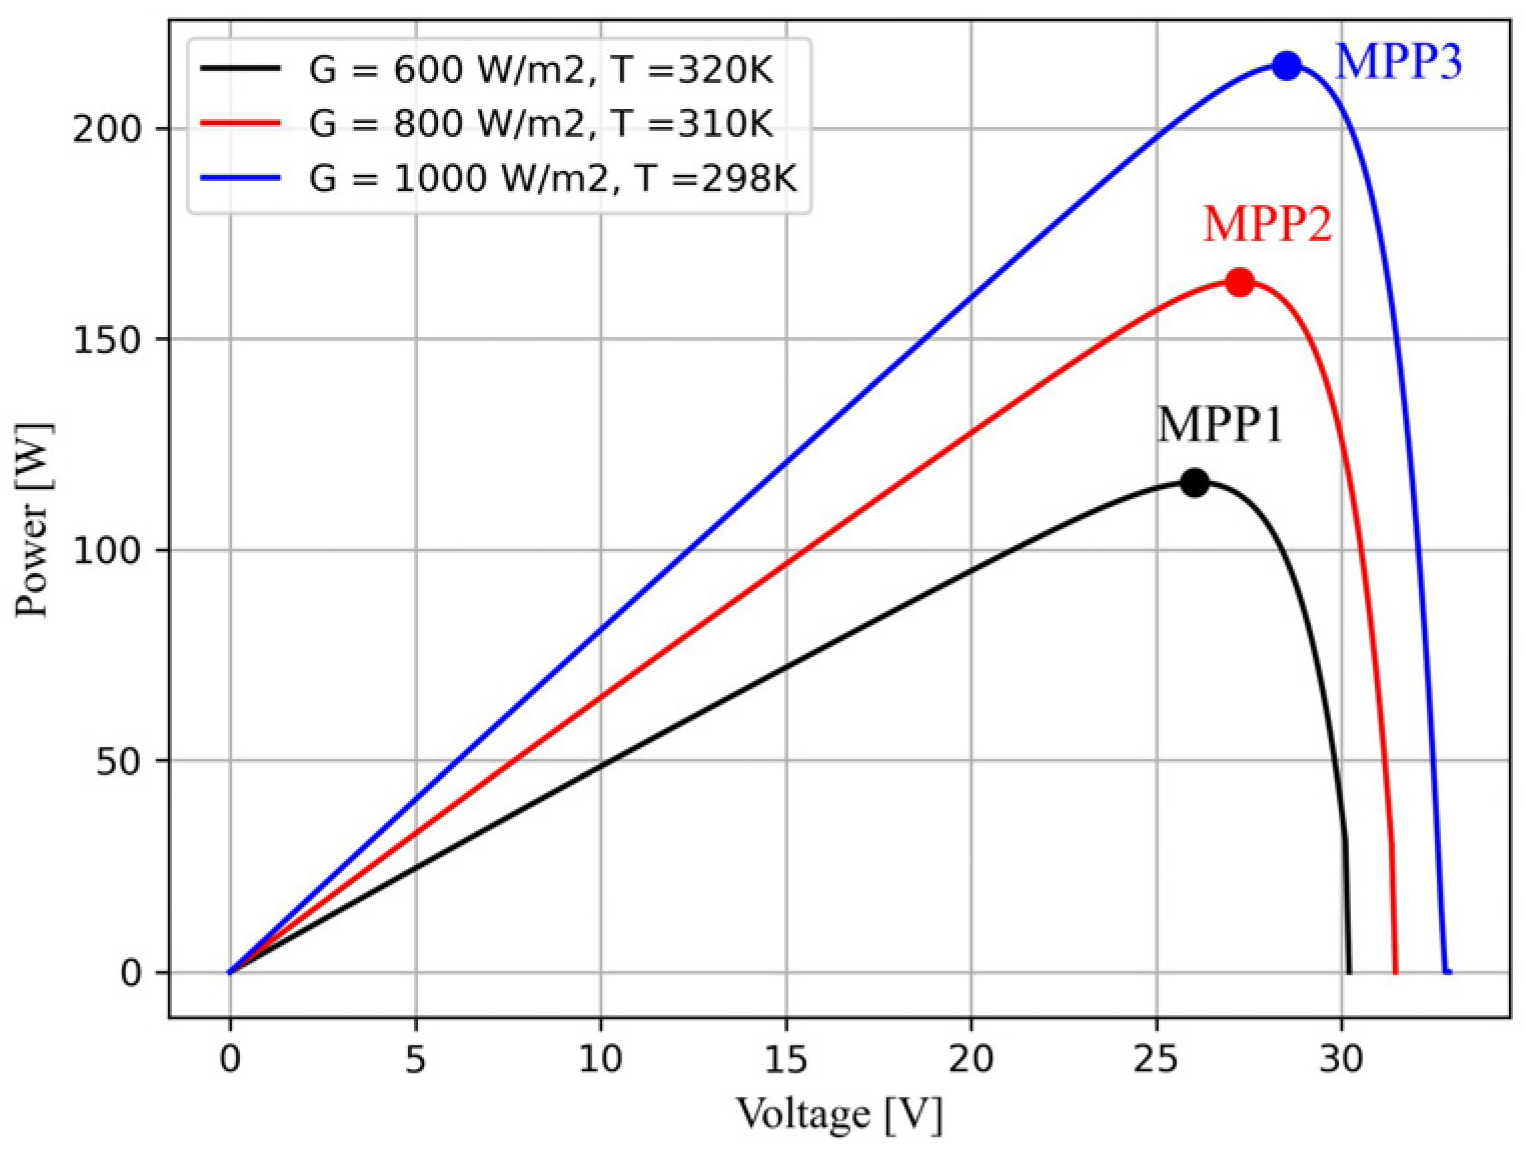
Electric power is the product of current and voltage. In the case of a photovoltaic panel, both current and voltage are strongly influenced by irradiance and temperature [7]. Figure 6 and Figure 7 show the panel characteristics for various temperature and irradiance levels, derived from Equation (5) and generated in the Spyder environment through the implementation of the panel’s mathematical model. The maximum power point (MPP) is also indicated on each of the characteristics presented.
The presented characteristics clearly show that the maximum power point (MPP) shifts its position along both the x and y axes as the operating conditions change. An increase in temperature results in a decrease in the voltage at the maximum power point, while a reduction in irradiance leads to a decrease in the current at the maximum power point. The significant variability of these parameters throughout the day and across seasons makes the power output of a photovoltaic panel extremely difficult to predict. Furthermore, both irradiance and temperature are strongly influenced by partially random factors, such as sudden gusts of wind that lower the panel surface temperature [6], partial shading, and an increased in temperature caused by panel soiling [15].
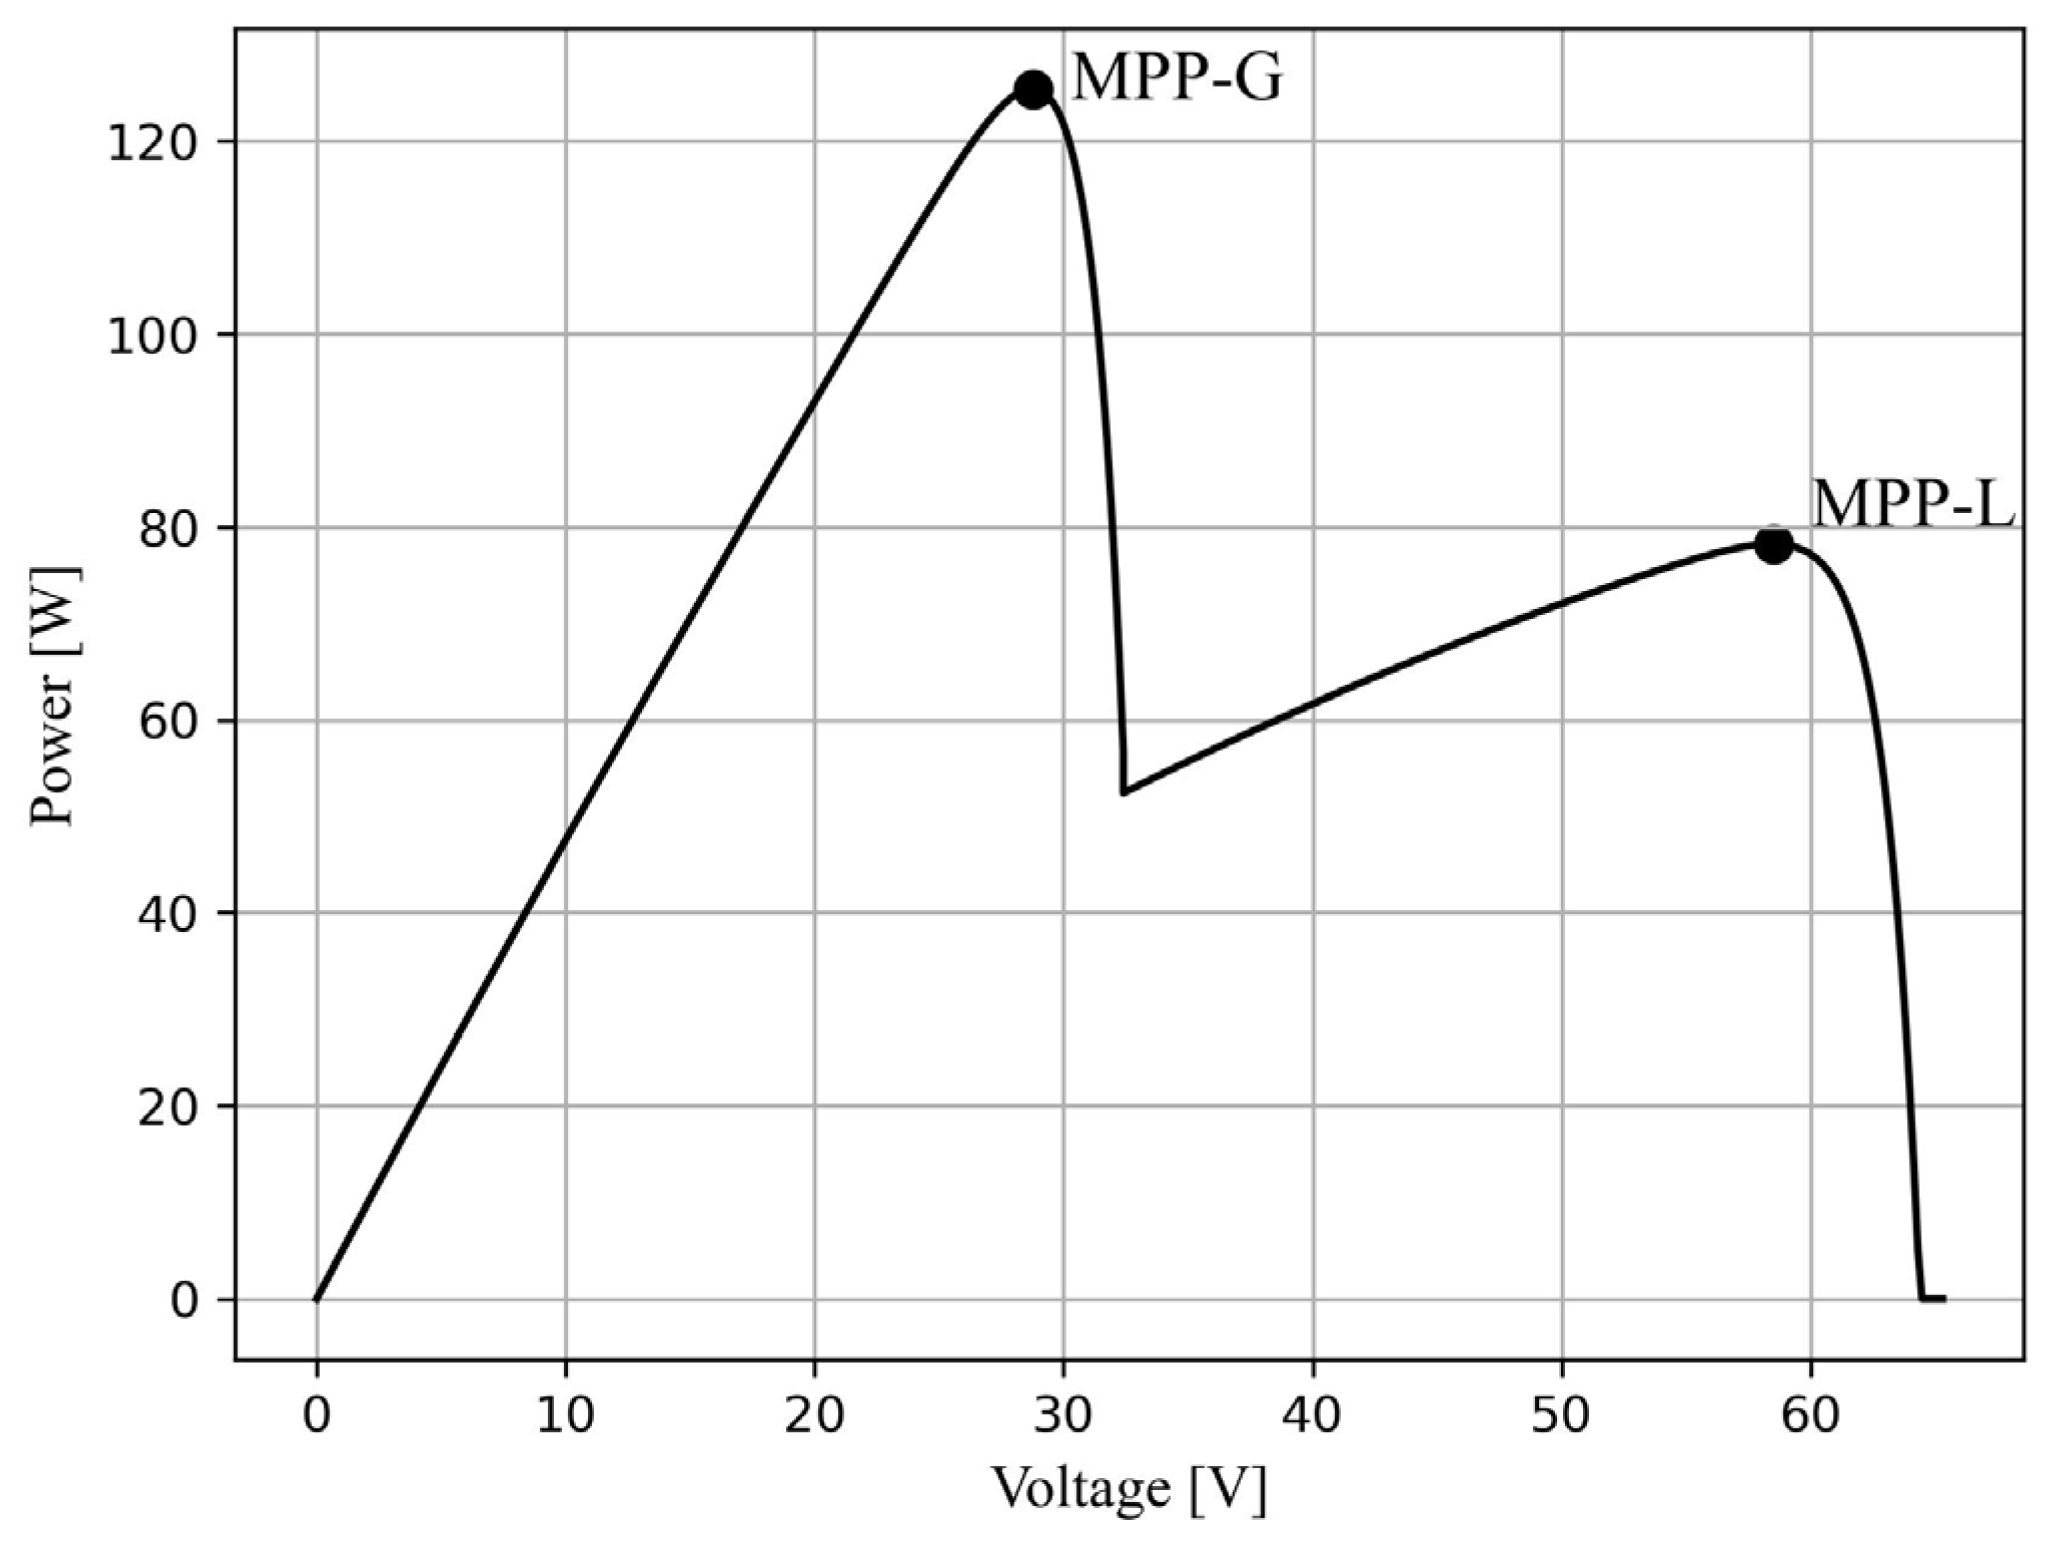
Shading of a photovoltaic panel is an exceptionally detrimental phenomenon from the perspective of power generation. Bypass diodes allow current to flow around the shaded panel, which otherwise behaves as an open circuit [6]. Partial shading of photovoltaic cells and the activation of bypass diodes lead to pronounced nonlinearities in the current–voltage characteristic and cause the appearance of local maxima on the power output curve [16,17]. Figure 8 presents the characteristics of a photovoltaic installation equipped with bypass diodes, consisting of two panels connected in series [14]. The incident solar irradiance differs significantly between the two panels, simulating the case of partial shading of the system. The global maximum power point, denoted as MPP-G, and the local maximum power point, denoted as MPP-L, are marked on the graph.
The characteristics shown in Figure 8 depict the power-voltage relationship of the installation. The solar irradiance incident on the first panel is 600 W/m2, while for the second panel it is 200 W/m2. The difference in irradiance levels between the two panels equipped with by-pass diodes results in the formation of a local maximum power point, denoted as MPP-L in Figure 8, and a global maximum power point, denoted as MPP-G, with an approximate power difference 47 W between them.
The characteristics shown in Figure 6, Figure 7 and Figure 8 illustrate the challenges in estimating the maximum power output of a photovoltaic panel, as well as the significant impact of environmental parameters on its performance. For this reason, it is necessary to employ various techniques to improve the energy efficiency of photovoltaic installations and ensure that the panel or system operates at its optimal operating point, namely the maximum power point (MPP).
One of the most widely used methods for improving photovoltaic panel performance is the implementation of a controller that employs a maximum power point tracking (MPPT) algorithm. The purpose of this algorithm is to maximise the power output under prevailing conditions by locating the global maximum on the characteristic curve.
Depending on the overall system configuration, the controller is typically integrated within the DC-DC converter [18] or, alternatively, within the inverter that operates together with the photovoltaic panel as a single unit [6]. In low-power applications, manufacturers usually employ only buck or boost converters, in which the MPPT algorithm is implemented [19]. In contrast, photovoltaic installations connected to grid-tied equipment (so-called on-grid applications) require the use of an inverter [19]. Typically, a DC-DC converter is also placed between the inverter and the photovoltaic panel [20]. Additionally buck-boost, SEPIC, and Zeta converters are employed to provide higher efficiency and voltage stabilisation [21,22].
The controller, equipped with a maximum power point tracking algorithm, regulates the duty cycle applied to the transistor controlling the operation of the converter. As the duty cycle changes, the switching elements’ on-time varies accordingly, thereby altering the load perceived from the panel side, whose output voltage depends directly on this load [6,23]. In this way, by regulating the duty cycle of the converter’s control signal, both the voltage value and the power output are controlled [24]. Controllers equipped with feedback loops or current and voltage sensors use an algorithm to identify the operating point at which power reaches its maximum under given conditions. When these conditions change, the controller’s task is to relocate the maximum power point [24].
It should be emphasised that the implementation of the MPPT algorithm cannot guarantee stable output conditions from the converter; therefore, additional converters or controllers are employed to regulate the converter’s output voltage and current [22,24]. Particularly in on-grid applications or battery charging systems commonly use two converters connected in series [22,25]. The first converter is controlled by the MPPT algorithm, while the second is responsible for regulating the output voltage of the photovoltaic installation.
The presented characteristics and description of the photovoltaic system structure highlight the challenge of maximum power point tracking. To address this, various methods with different operating modes are employed, all aimed at maximising the output power of the installation.

1.4. Classification of Maximum Power Point Tracking Algorithms

There are numerous maximum power point tracking methods that vary in complexity and effectiveness, employing different algorithms to maximise power generation. The most common classification distinguishes between indirect and direct methods [11]. Indirect MPPT methods are simple and easy to implement, but they rely on predefined data and do not account for changes in panel parameters due to ageing. Direct methods, in contrast, aim to determine the optimal operating point based on real-time measurements.
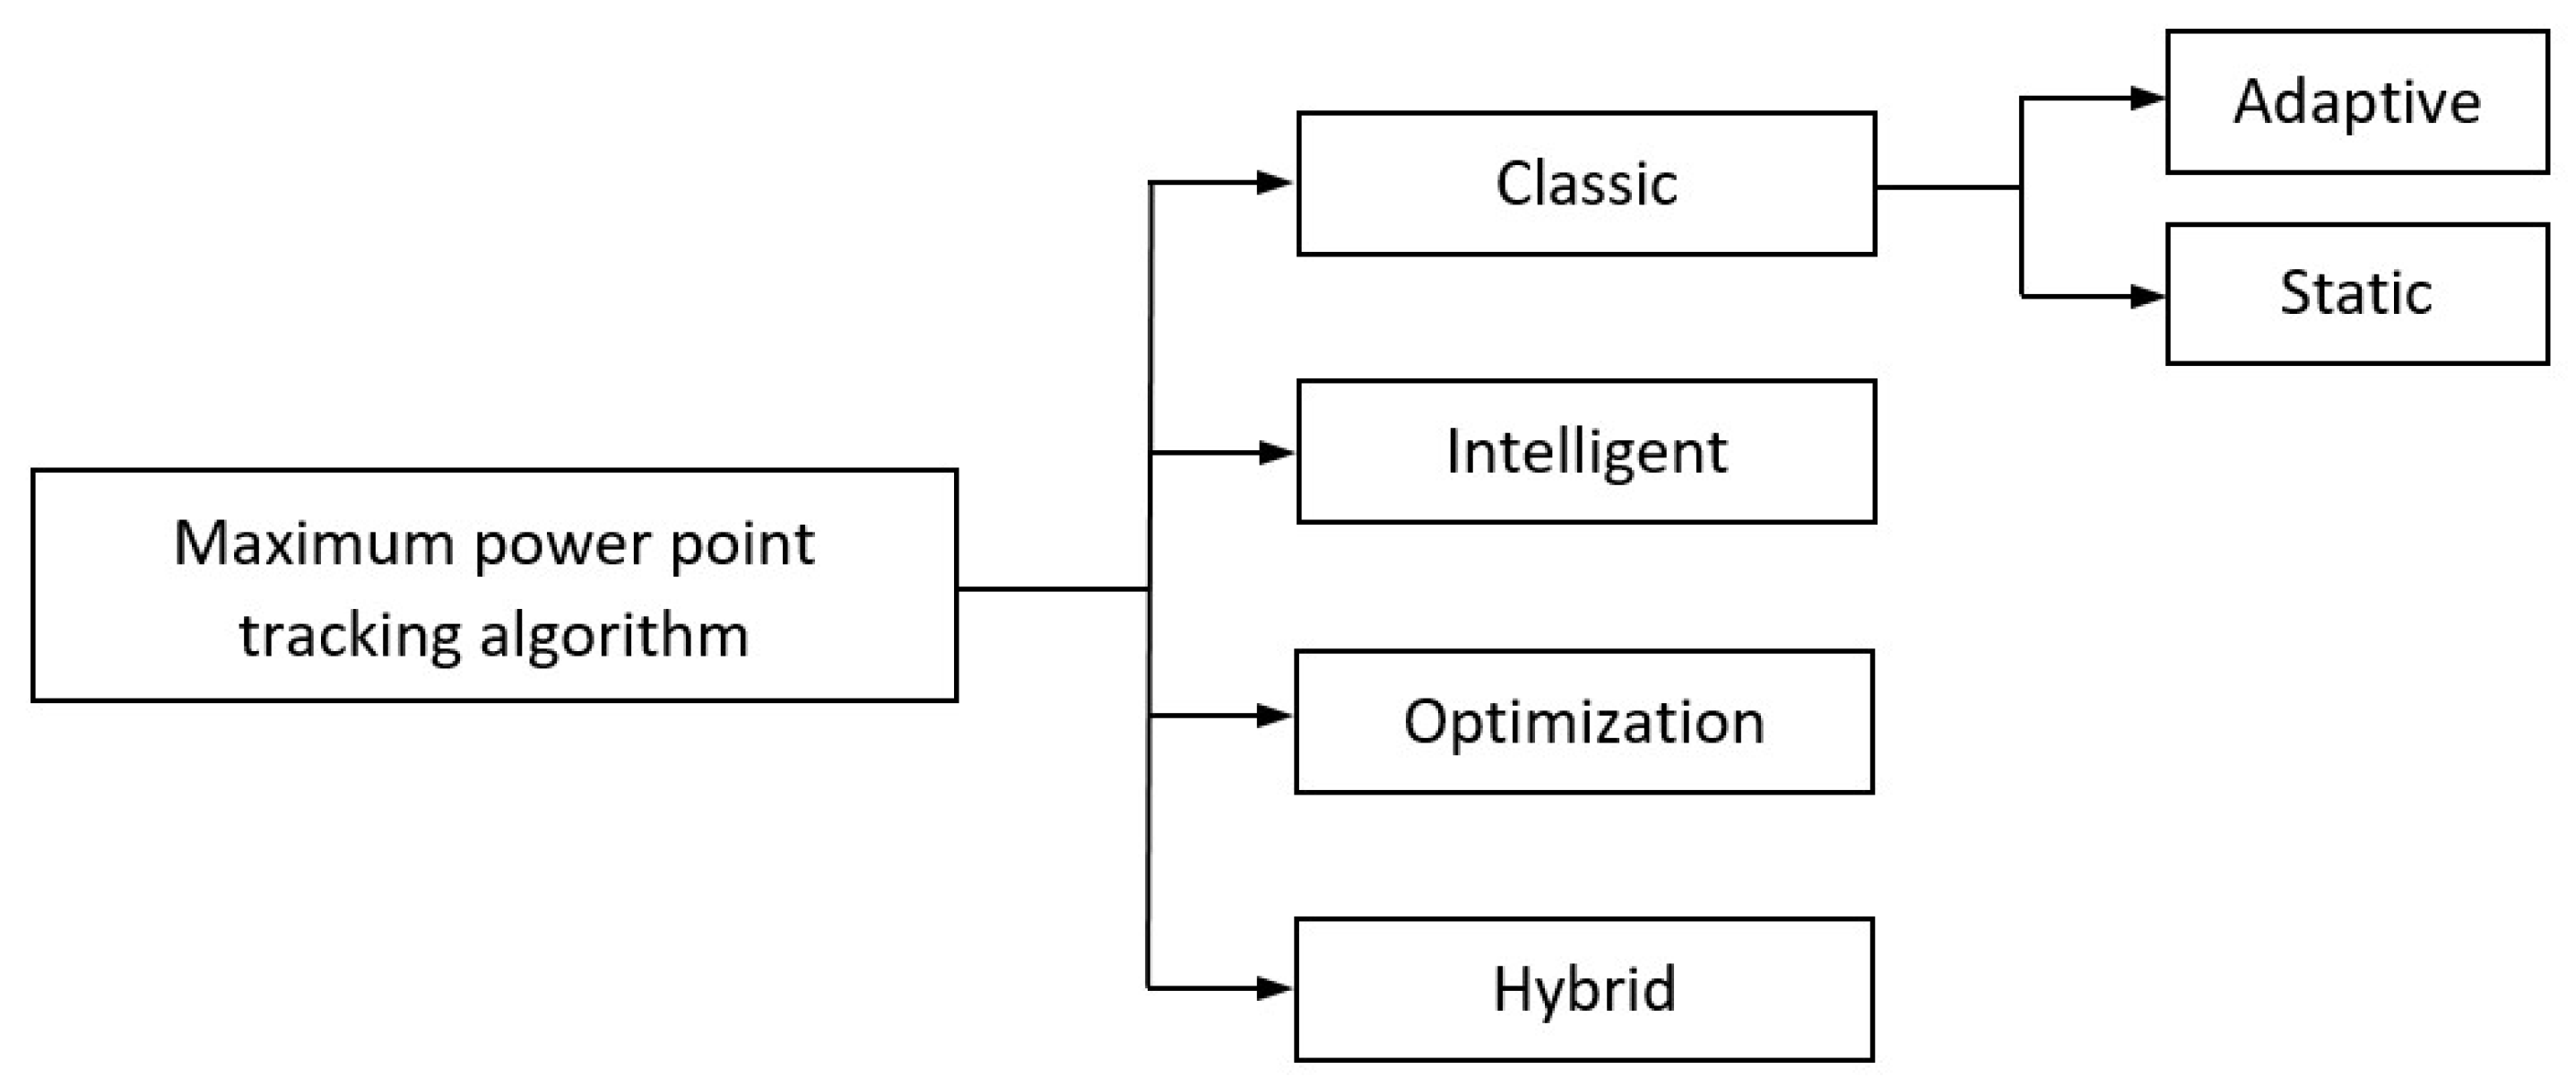
With the advancement of photovoltaic technology, an increasing number of solutions to the maximum power point tracking problem have been proposed. Due to the large variety of algorithms and their variations, a broader classification has been introduced in the literature. Figure 9 presents a diagram illustrating a commonly used classification into four main groups [26]: classical algorithms (which can be further divided into static and adaptive types), intelligent, optimisation-based, and hybrid algorithms.
The presented classification serves to systematise the available algorithm. Various methods and their modifications are discussed extensively in the literature [9,26,27,28,29]. The following section highlights selected methods that enable an effective analysis of MPPT algorithm performance.

2. Materials and Methods

The first group in the proposed classification consists of classical algorithms. These are the most commonly used algorithms, characterised by low to moderate level of complexity and providing a basic improvement in panel efficiency. Classical algorithms are further divided into two types: static algorithms, which assume a fixed maximum power point and do not adapt to changing environmental conditions, and adaptive algorithms, which use real-time measurements to adjust to current conditions.
A notable limitation of classical algorithms is their tendency to track only a local maximum power point under partial shading, whereas the global maximum power point can provide a significantly higher power output [10].
The next group consists of intelligent algorithms, which provide high speed and accuracy in tracking the maximum power point, even under rapidly changing conditions. This category includes algorithms based on artificial intelligence. However, it should be noted that such algorithms are highly complex and require significant computational resources to operate [9].
A compromise between intelligent and classical algorithms is offered by optimisation-based algorithms. These methods perform very well under partial shading conditions and can successfully identify the global maximum power point [30]. Nevertheless, compared to the intelligent group, optimisation-based methods tend to be less dynamic and less precise [9].
The final group includes hybrid algorithms, which integrate features of multiple approaches within a single system. Typically, the hybrid method first estimates the maximum power point using one algorithm, and then fine-tunes the operating point using another algorithm, combining the strengths of both approaches [9].

2.1. Classical Algorithms

2.1.1. Methods Based on Open-Circuit Voltage Measurement

The simplest control methods that enable a photovoltaic panel to operate close to its maximum power point include constant voltage methods [31] or, more specifically, methods based on open-circuit voltage measurement [11]. These approaches rely on the approximately linear relationship between the open-circuit voltage and the voltage at the maximum power point [31]:
U M P P U O C = c o n s t .
where U M P P —voltage at the maximum power point [V], U O C —open circuit voltage [V].
In most applications, the coefficient describing the relationship between these voltages is approximately equal to k = 0.75 [31]. Although the method itself is very simple, a significant drawback lies in the necessity of interrupting panel operation in order to measure the open-circuit voltage, which—when multiplied by coefficient k—serves to determine the reference voltage [10]. However, since the ratio of the maximum power point voltage to the open-circuit voltage varies with environmental conditions, module ageing, and partial shading, the resulting reference voltage may differ significantly from the actual voltage at the maximum power point [11].
Analogous methods are also employed; however, unlike those base on open-circuit voltage, they rely on the short-circuit current to estimate the approximate maximum power point [11].
There are numerous modifications of the constant voltage method. One example is the pilot cell method [31], which follows a similar approach. In this case, however, the open-circuit voltage is measured from a pilot cell (i.e., a single cell or module) and then multiplied by the number of cells constituting the entire installation or panel. This approach avoids the power losses typically incurred when panel operation is interrupted for voltage measurement [31].

2.1.2. Table Lookup Method

The look-up table method is commonly recognised in the literature as a typical intermediate method [11]. After measuring the voltage and current, the values obtained are compared with those stored in the database [10]. Then, the operating voltage corresponding to the maximum power point is selected [10]. An advantage of this method is its rapid response to changing conditions and reduced oscillations around the MPP [32].
Similar are also employed, but in these cases, the determination of the optimal operating point is based on measured irradiance and temperature, which can offer greater accuracy [32]. However, under real-world conditions, these measurements may be subject to greater errors than current and voltage measurements. Moreover, the database must accommodate a broader range of operating conditions, which significantly complicates the use of environmental parameters for MPP determination [32].
Although look-up table methods are relatively simple to implement, they have several drawbacks. They do not account for all environmental conditions. They do not account for all environmental variables or for changes in system characteristics caused by module ageing [11]. Furthermore, they require the storage of large datasets, which must be tailored to each photovoltaic installation [10].

2.1.3. Curve Fitting Method

Another method based on previously established relationships, classified as an indirect method, is the curve fitting method [10,11]. This approach estimates the maximum power point using Equation (2)., which defines the relationship between panel’s power and voltage, along with the experimentally determined parameters a , b , c and d [10,11]. From Equation (7), Equation (8) is subsequently derived, expressing the voltage at the maximum power point as a function of the same parameters a , b , c and d   [10,11]:
P =   a U 3 + b U 2 + c U + d
U M P P = b b 2 3 a c 3 a
where a , b , c , d —parameters determined experimentally, P —power [W], U —panel voltage [V], U M P P —panel voltage at the maximum power point [V].
The accuracy of the curve-fitting method depends primarily on the frequency of voltage measurements used to update the values, and on the precision with which the parameters a , b , c and d are determined [10,33]. This method is not widely used because it requires complex calculations and may be inefficient under unpredictable or rapidly changing conditions [10,34].

2.1.4. Perturb and Observe Algorithm (P&O Algorithm)

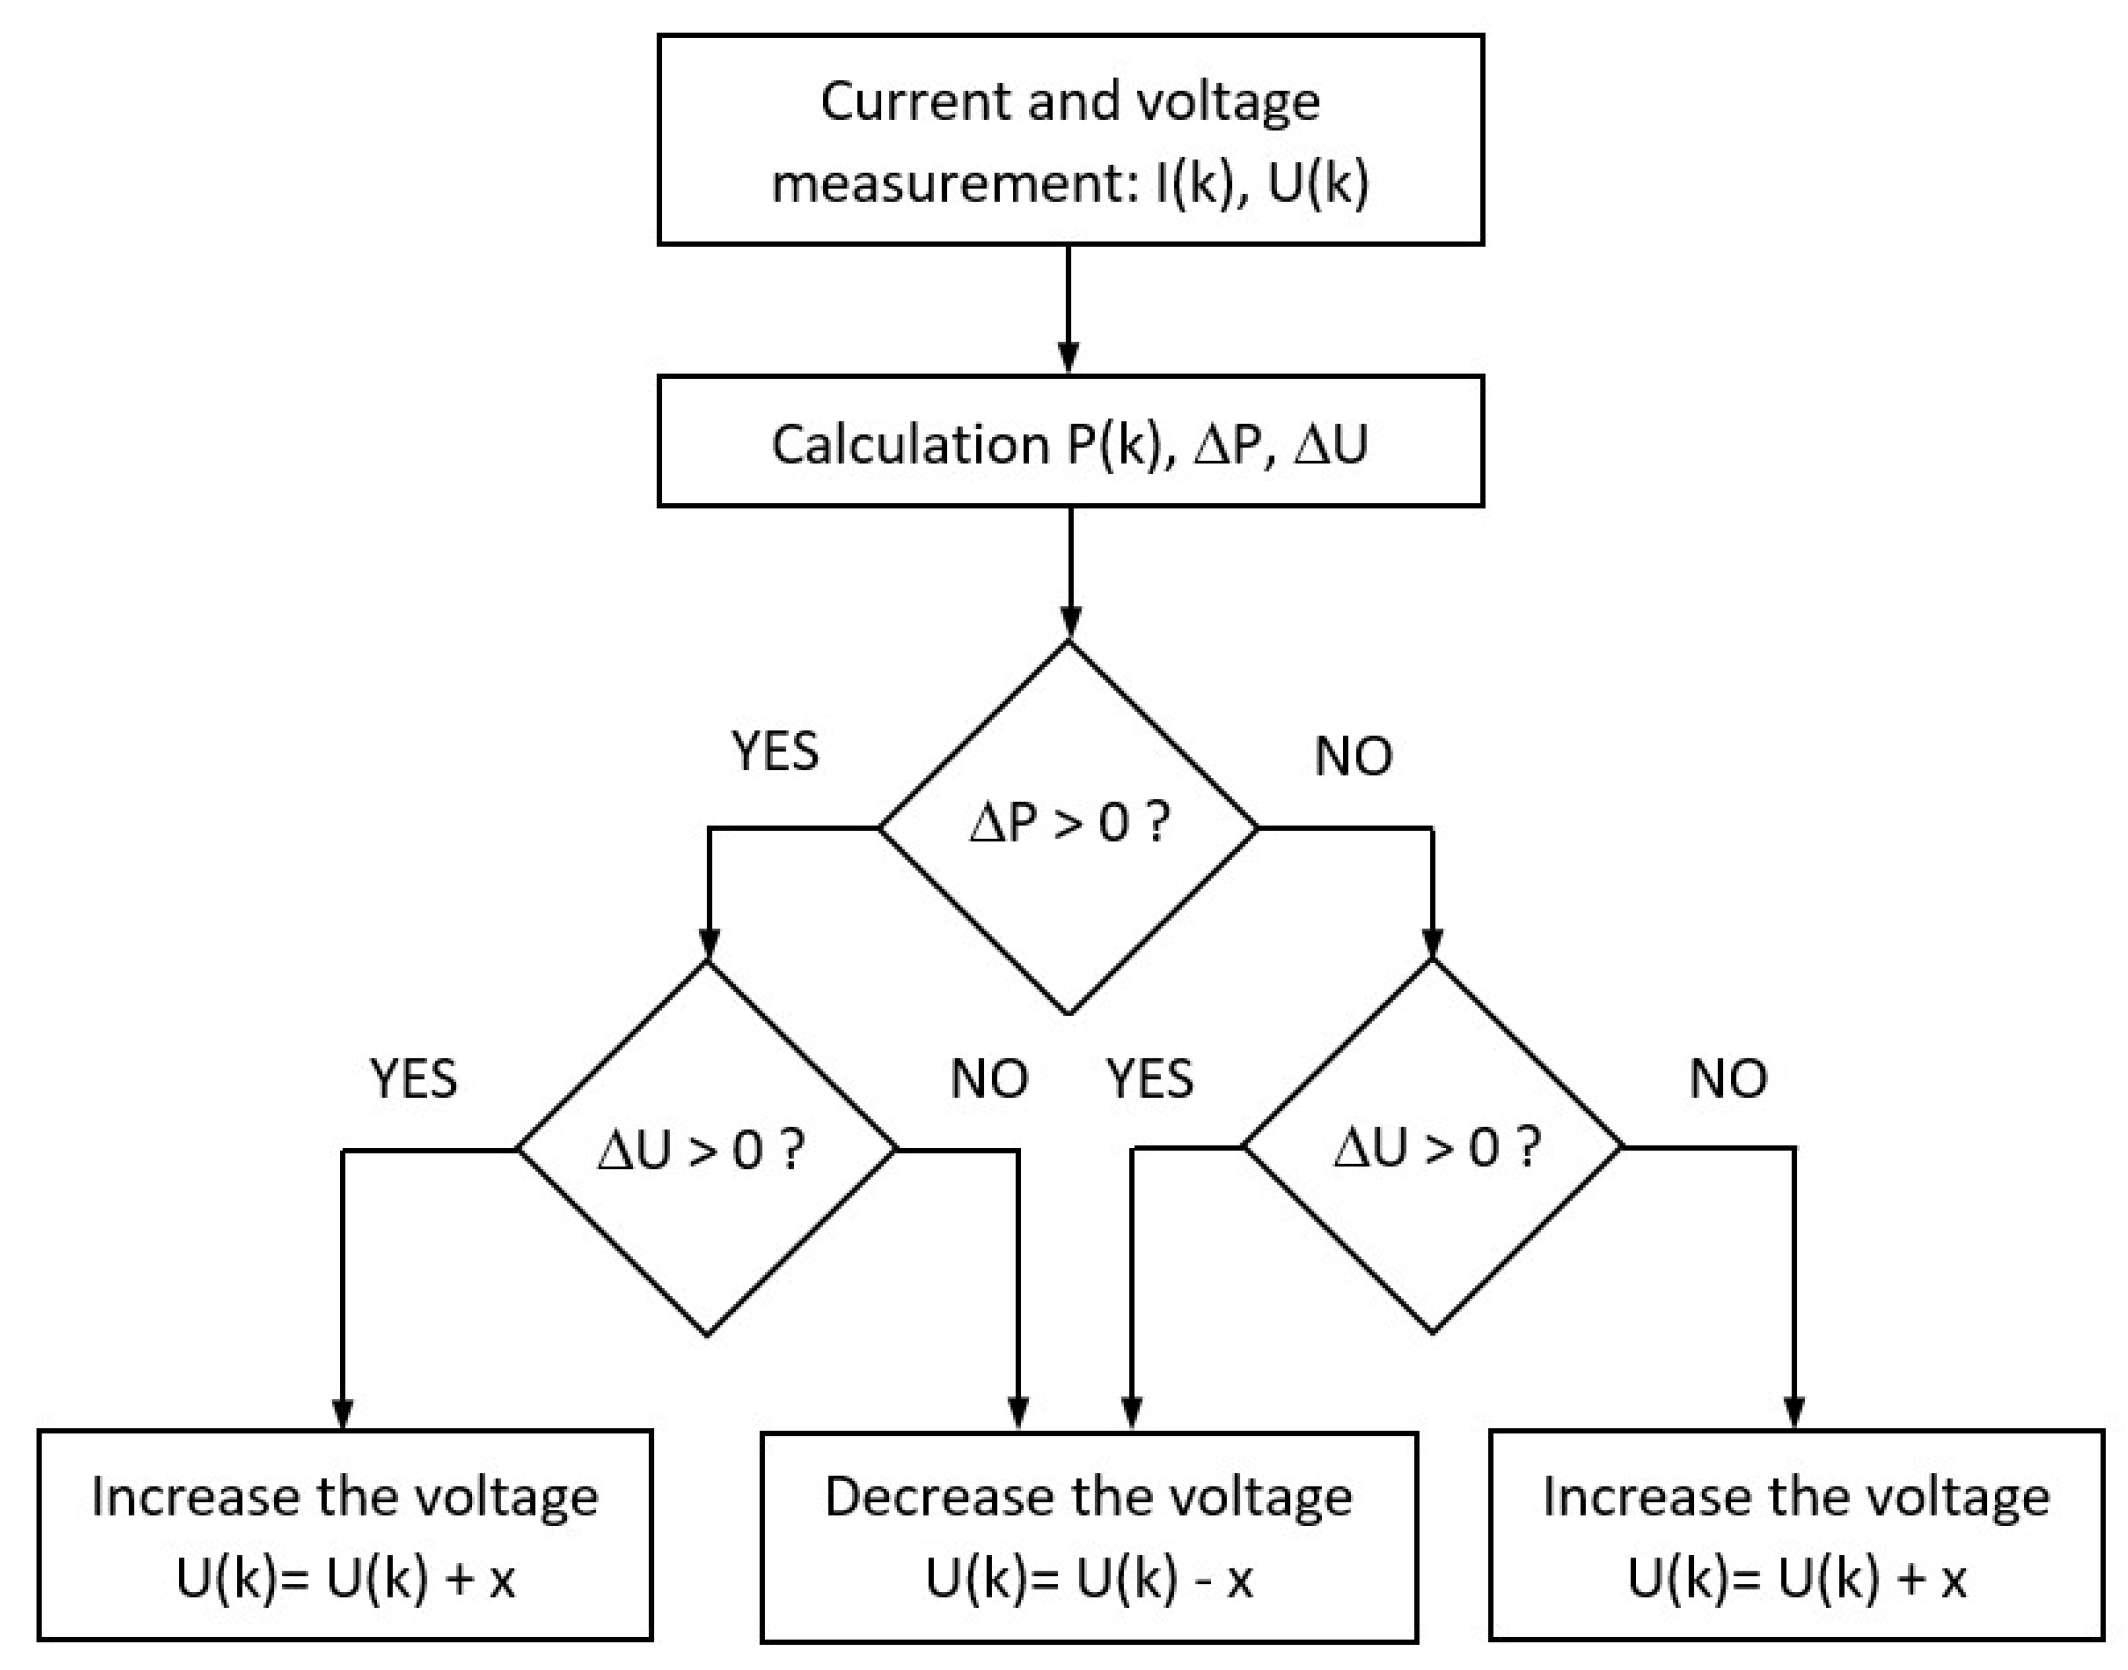
One of the most commonly encountered classical maximum power point tracking algorithms in the literature is the perturb and observe algorithm (abbreviated as P&O) [6]. Figure 10 presents a block diagram illustrating one iteration of the algorithm [31].
The principle of this algorithm is based on regulating the panel voltage by changing the load (perturbation), followed by measuring the resulting power (observation) and comparing the values of these two parameters: power and voltage. Depending on whether the changes in voltage and power are positive or negative, the panel voltage is either decreased or increased by adjusting the duty cycle of the control signal driving the converter, in which the MPPT algorithm is implemented.
A key element of the perturb and observe (P&O) algorithm is the perturbation parameter, which determines the magnitude by which the voltage (or duty cycle) will be decreased or increased in subsequent iterations.
Unlike the previously discussed methods, the P&O algorithm is a direct method, which makes it more efficient than the basic methods described earlier. Although the algorithm is widely used due to its simplicity, it also has several drawbacks that limit its overall effectiveness, such as oscillations around the maximum power point and relatively slow response to rapidly changing operating conditions [11].

2.1.5. Method of Incremental Conductance

The incremental conductance method (INC), an algorithm with efficiency comparable to that of the P&O method, and widely discussed in the literature, is another classical approach [9,26]. It determines whether to increase, decrease, or maintain the operating voltage by evaluating differential calculations and comparing the result to zero [10,11].
This method responds considerably better to dynamic changes in conditions than other classical approaches and results in reduced oscillations around the MPP [11]. However, the effective use of the INC also requires highly accurate measurement of the panel’s current and voltage [11].

2.2. Optimisation Algorithms

2.2.1. PSO Algorithm

The Particle Swarm Optimisation (PSO) algorithm is widely used optimisation method [26]. Its operating principle is based on “scattering” particles within the solution search space, i.e., selecting a set of initial, often random positions and subsequently evaluating each of them [30].
When PSO is applied to maximum power point tracking algorithm, the evaluation corresponds to the generated power, while the position represents the duty cycle of the control signal. This signal is adjusted by the controller governing the switching of transistors and thus the panel’s operating voltage [35].
The best solution and its corresponding position are then selected. These two parameters strongly influence the direction of movement of the remaining particles [30]. Random coefficients (described in Equation (9)), combined with each particle’s own best-known solution, ensure diversity in particle movement across successive iterations [30].
The change in position is referred to as velocity, and its value is determined by the following equation [35]:
V i k = w   ·   V i k 1 +   c 1 r 1 P i m a x x i   +   c 2 r 2 P g m a x x i
where i —molecule number, k —iteration number (sample), V i k —new velocity of the molecule (change in position), V i k 1 —previous velocity, w —weight, c 1 —position change factor based on the best solution of the molecule, c 2 —position change factor based on the best global solution, r 1 and r 2 —random coefficients with values between 0 and 1, P i m a x —best solution (evaluation) of the ith molecule, P g m a x —best global solution (evaluation of the best molecule), x i —position of the i -th molecule.
After updating the velocity in accordance with Equation (9), the algorithm adjusts the positions of all particles and re-evaluates them based on the updated positions. This iterative process continues, continuously updating the best evaluation values and their corresponding positions [35].
The PSO algorithm causes significant fluctuations in voltage and electric current during the initial phase of operation [30]. These fluctuations result from the need to disperse the particles across the entire search space, which causes the operating parameters of the panel to vary as each particle is evaluated. This drawback is offset by a significant advantage: the algorithm’s robustness in avoiding local maxima and converging to the global maximum power point, provided that a sufficiently large number of particles is employed [36]. Moreover, the method of locating the maximum power point is independent of the photovoltaic installation’s structure [19], requiring no modification regardless of the system in which it is applied.

2.2.2. The Grey Wolf Optimisation (GWO) Algorithm

Another widely discussed optimisation algorithm is the Grey Wolf Optimisation (GWO) algorithm [36], inspired by the hunting behaviour of a grey wolf pack. The algorithm classifies wolves into four groups: α (alpha), β (beta), δ (delta)—representing the wolves with the best, second-best, and third-best solutions, respectively—while the fourth group, ω (omega), comprises the remaining wolves [36]. In MPPT, the hunting target of the wolf pack corresponds to the maximum power point of the photovoltaic panel [36].
The search for the MPP proceeds as follows: each wolf represents a candidate solution, i.e., a possible value for the duty cycle of the control signal [36]. The algorithm evaluates each “wolf” by measuring the corresponding power output and ranks the top three solutions [37]. In the next step, the distance of each remaining “wolf” to the positions of the α, β, and δ wolves is calculated. New positions are then determined as the arithmetic mean of the distances to the three best wolves [37]. Certain random coefficients representing the individual behaviours of each wolf are incorporated during distance calculations. These coefficients increase diversity in the search space, allowing the algorithm to effectively handle complex, nonlinear problems [38].

2.3. Intelligent Algorithms

2.3.1. An Algorithm Employing Fuzzy Logic

Fuzzy logic-based algorithms have gained significant popularity in the past decade due to their capability to effectively address nonlinear problems [39]. The operation of an MPPT controller based on fuzzy logic, commonly referred to as an FLC (fuzzy logic controller), is divided into three main stages.
The first stage, known as fuzzification, involves measuring the voltage and power of the photovoltaic panel, and subsequently calculating the error value, E, along with the change in this error over time, ∆E [40]:
E ( k ) =   P k   P k 1 V k   V ( k 1 )
E k = E k E ( k 1 )
where k—iteration number (sample), P—power [W], V—voltage [V], E—error [-], ∆E—difference in error value [-].
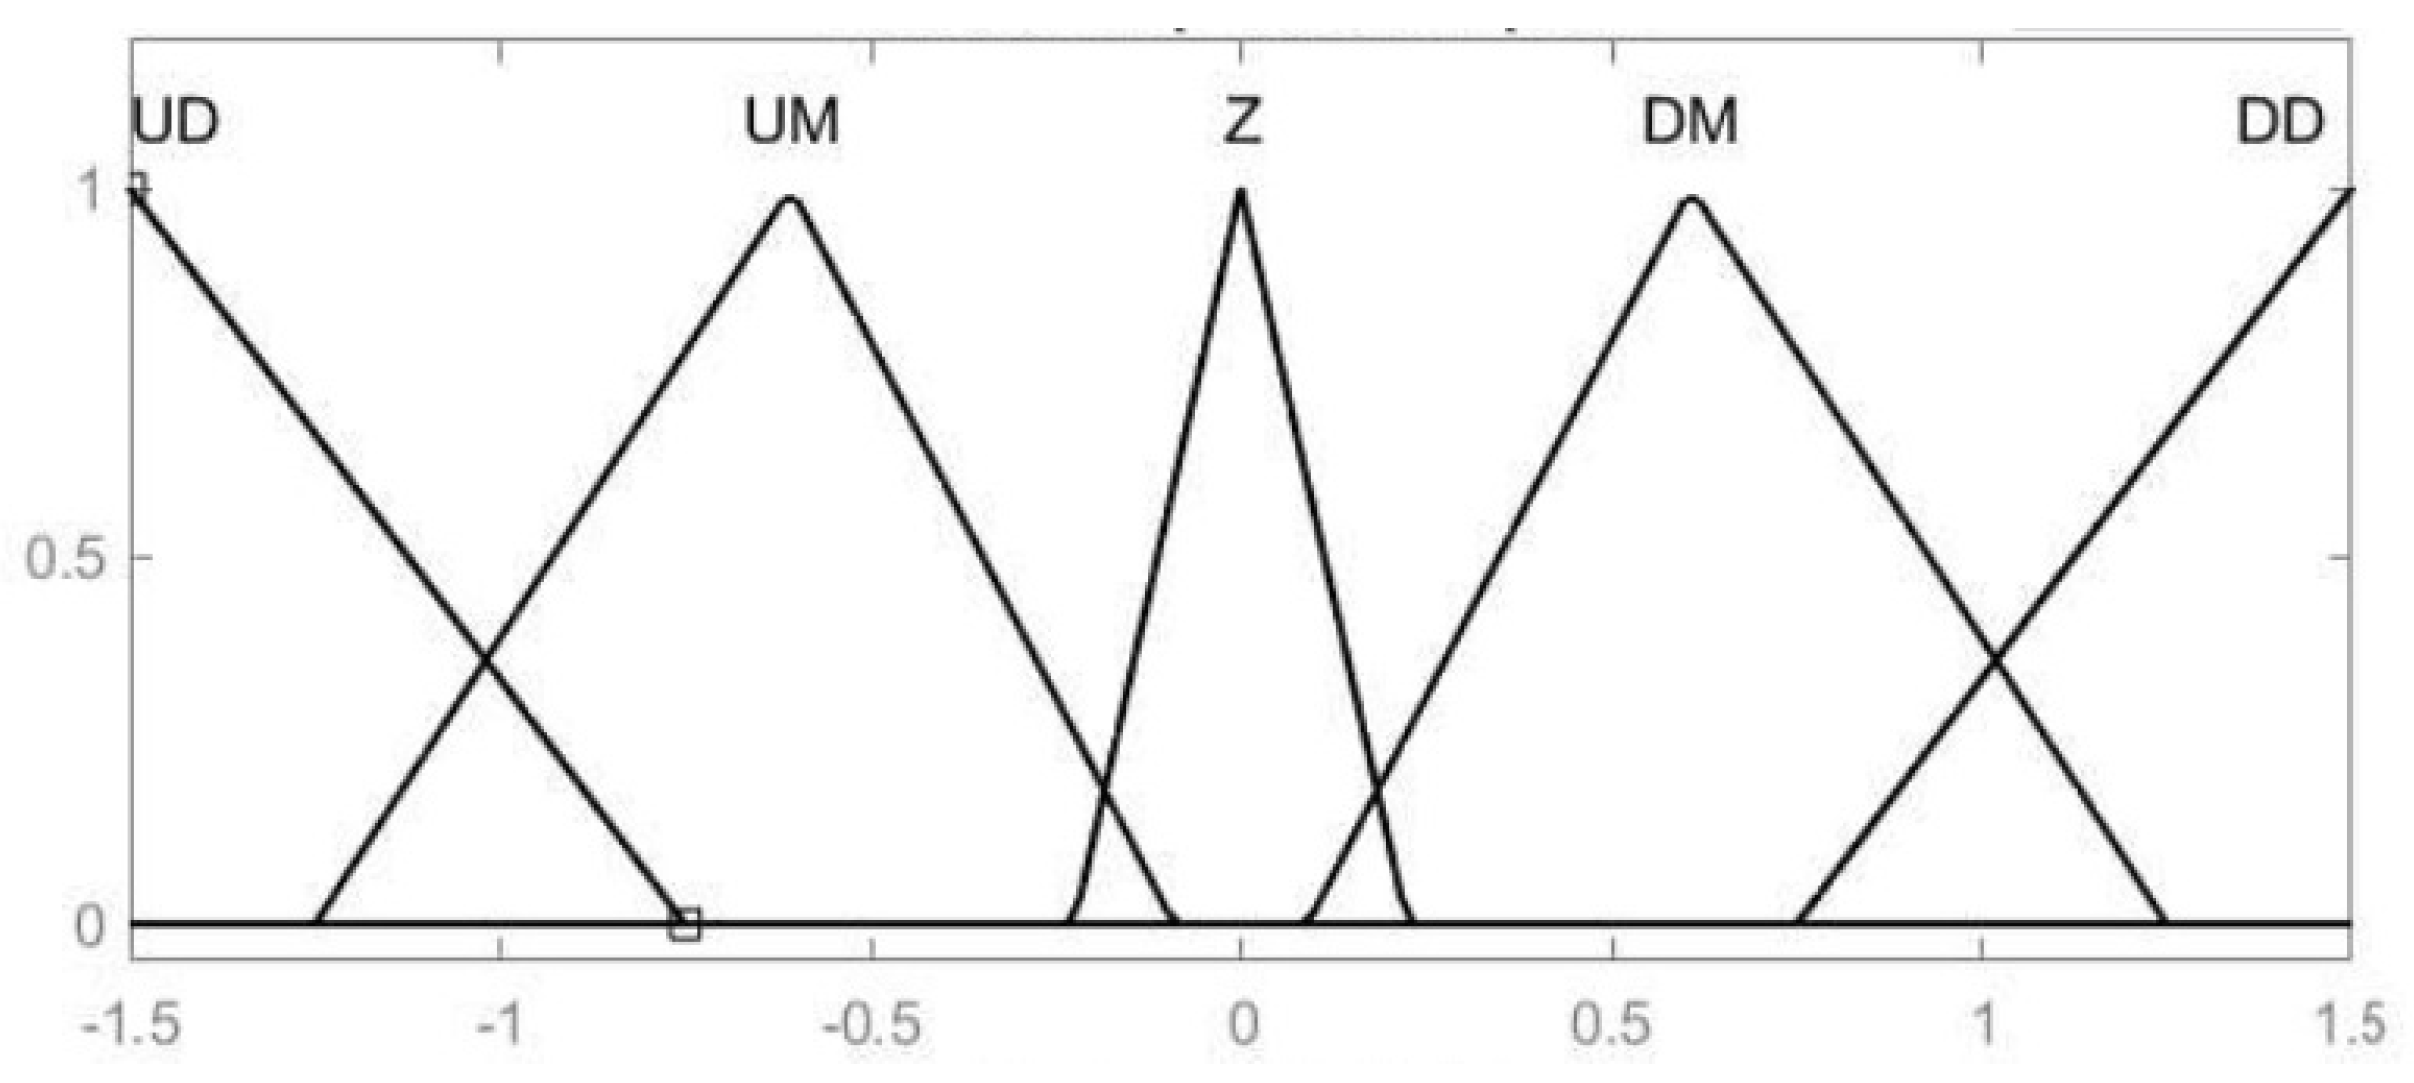
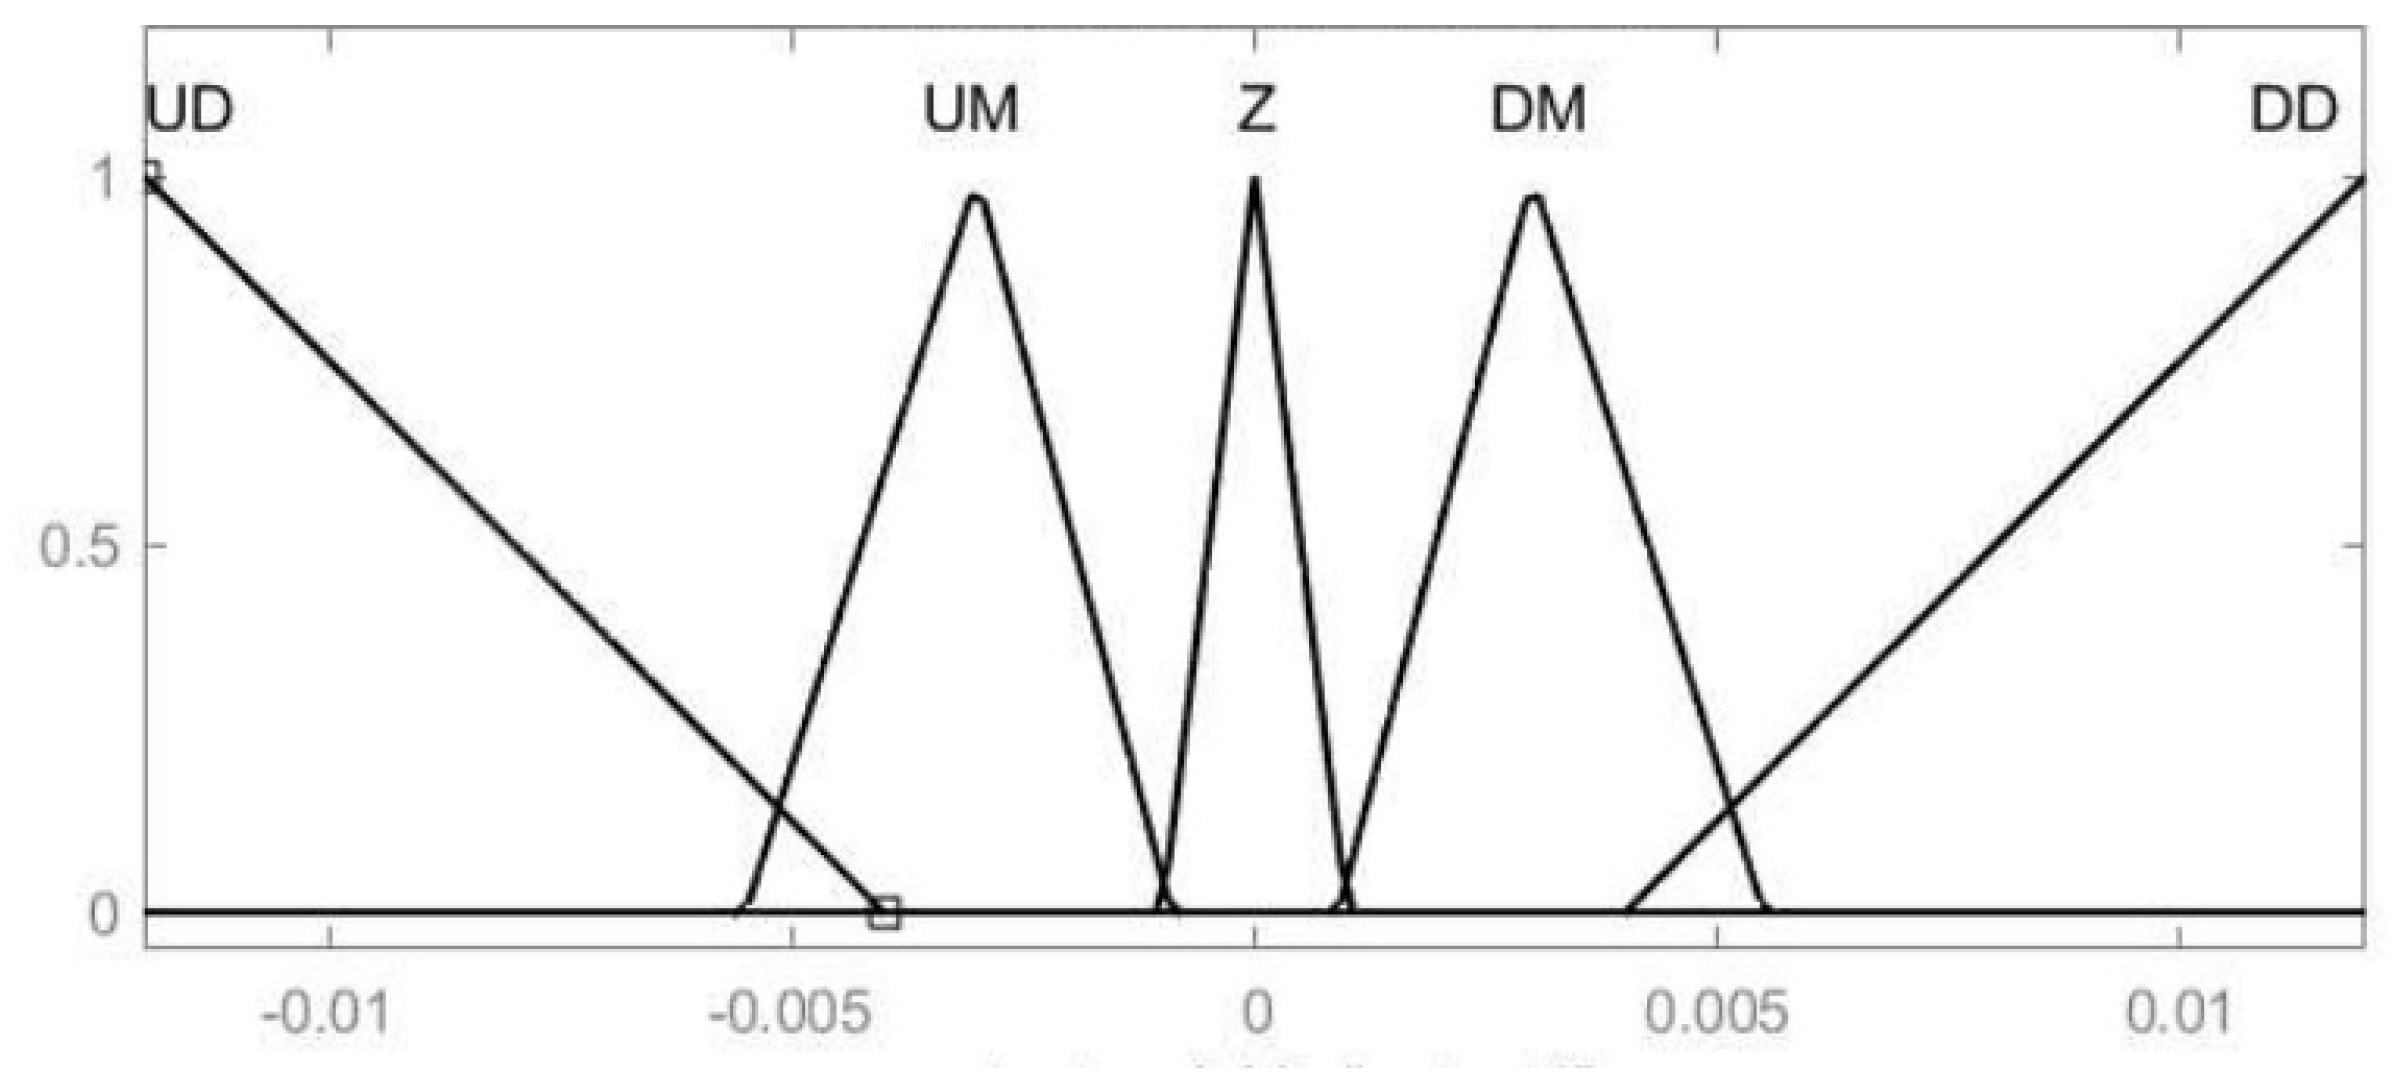
In the subsequent step (second stage—rule evaluation), the controller classifies the calculated parameters E and ∆E into appropriate sets based on predefined membership functions [40]. In the final stage (defuzzification), the controller determines the appropriate output signal—the duty cycle of the converter control signal—using a selected method, such as the centroid technique [41]. The use of the centroid method helps to minimise sudden variations in the controller’s output signal [41].
The fuzzy logic-based algorithm demonstrates the capability to quickly locate the MPP, however, its implementation is relatively complex and time-consuming [40]. Each FLC system requires the careful design of appropriate membership functions and may demand relatively high computational power as well as precise voltage and power measurements, which significantly complicates its practical application [40].

2.3.2. Algorithms Using Artificial Intelligence

Artificial intelligence (AI)-based algorithms have also been applied in maximum power point tracking (MPPT) systems for photovoltaic panels. These models are trained using collected data on solar irradiance and temperature, along with the corresponding voltage or current values at the maximum power point for a given photovoltaic installation [42]. With a sufficient amount of data, the AI-based algorithms can determine the maximum power point with high accuracy in a relatively short time compared to other methods [42].
However, achieving high efficiency with this approach is complex and costly [9]. Implementing AI-based MPPT algorithms may also require additional components, such as filters to eliminate disturbances [42]. Moreover, in regions experiencing significant seasonal temperature variations, very large training datasets are required [42]. It should also be noted that photovoltaic panel parameters degrade over time, which can reduce the accuracy of models trained on historical data [31].

2.4. Hybrid Algorithms

Hybrid maximum power point tracking methods combine features of two or more algorithms. Typically, different methods are employed during the initial phase of operation—such as system start-up or rapid changes in conditions—rather than during later stages of operation [9]. Common combinations involve optimisation algorithms used alongside classical or intelligent algorithms [9].
An example of a hybrid MPP tracking method is the PSO + P&O algorithm, which mitigates the drawbacks of each individual technique by applying them in sequence [29,43]. At system startup, the PSO algorithm evaluates all particles to locate a point on the current-voltage characteristic curve that approximates the maximum power point, assuming a sufficiently large particle population [9]. The position of the best particle is passed to the P&O algorithm as its starting point, with the P&O algorithm remaining active until significant changes in system parameters occur [43]. This combination allows the system to locate the global maximum power output, which cannot be achieved using the P&O algorithm alone, while the later-stage use of P&O shortens the stabilisation time of system parameters compared to the conventional PSO algorithm [43].

3. Results and Discussion—Simulation and Comparative Analysis of Selected Algorithms

3.1. Diagram of the System Used in the Simulation

Simulating the operation of selected maximum power point tracking (MPPT) algorithms requires prior modelling of the system whose operation will be controlled by the implemented algorithm. A DC-DC Zeta converter is a commonly chosen configuration for such analyses [44,45], as it offers a wide input voltage range and responds efficiently to dynamic algorithms that require short stabilisation times following changes in operating conditions [45]. Moreover, compared to other DC–DC converters, the Zeta converter demonstrates very high efficiency when operating with the analysed algorithms [46]. The MSX60 photovoltaic panel selected for the simulation is characterised by relatively low power output. Under standard test conditions (STC), i.e., with solar irradiance of 1000 W/m2 and a temperature of 25 °C, the open-circuit voltage is U O C = 21.1 V and the short-circuit current is I S C = 3.8 A, corresponding to a maximum power point output of 61.25 W.
To ensure the simulations closely reflect real-world conditions, a 0.01 s delay was introduced in the “Rate Transition” block between adjustments to the transistor’s 20 kHz duty cycle and the measurement of the algorithm’s new input values (current and voltage). This delay also allows the system to stabilise before the next algorithm iteration. The accuracy of the simulation is further enhanced by a 0.5 μs sampling rate, enabling precise evaluation of the algorithm’s performance.
A model of the Zeta converter powered by the photovoltaic panel was developed in Matlab and Simulink, based on a design that enables integration with an MPPT control system [47]. A pre-existing model from the Matlab 24.1 (R2024a) and Simulink 24.1 (R2024a) library was employed, as its results closely matched those obtained with the author-developed Python 3.10.9/Spyder 5.4.1 model presented in Section 1.2 and Section 1.3. The corresponding schematic is presented in Figure 11.
To enable effective comparison of individual MPPT methods, the converter shown in Figure 11 was used with each of the implemented algorithms. The implementation and simulation of the MPPT algorithms were also carried out in Matlab 24.1&Simulink 24.1 and are discussed in detail in the subsequent sections of this chapter.

3.2. Simulation of the Operation of the Constant Voltage Algorithm

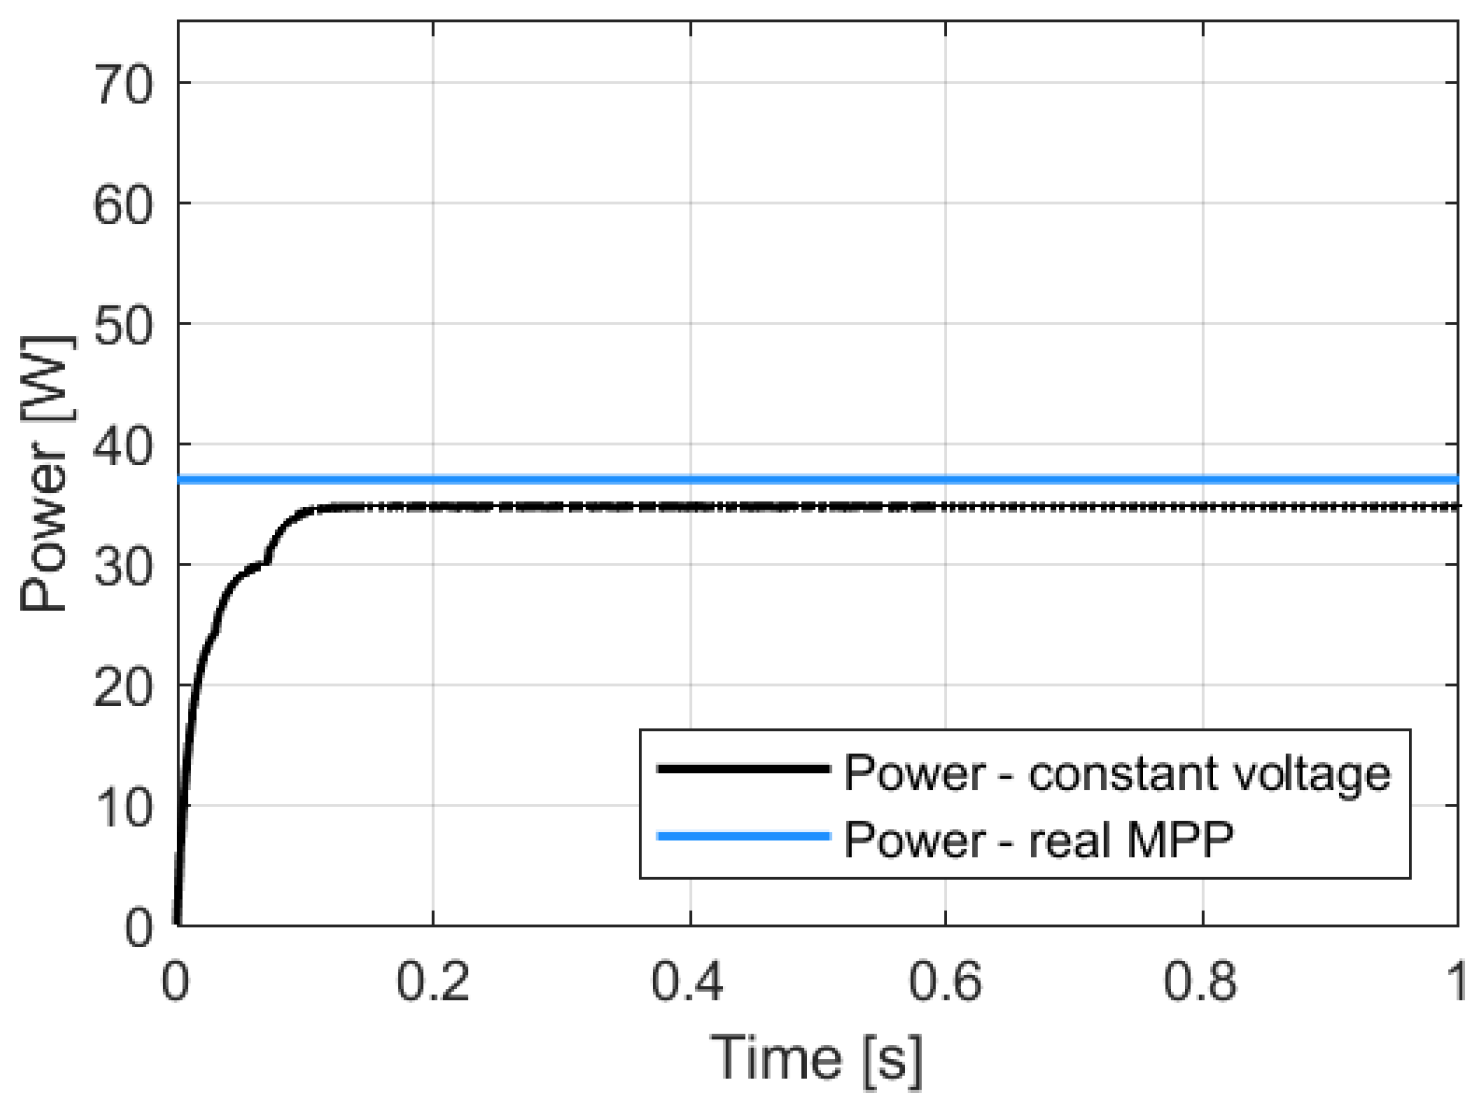
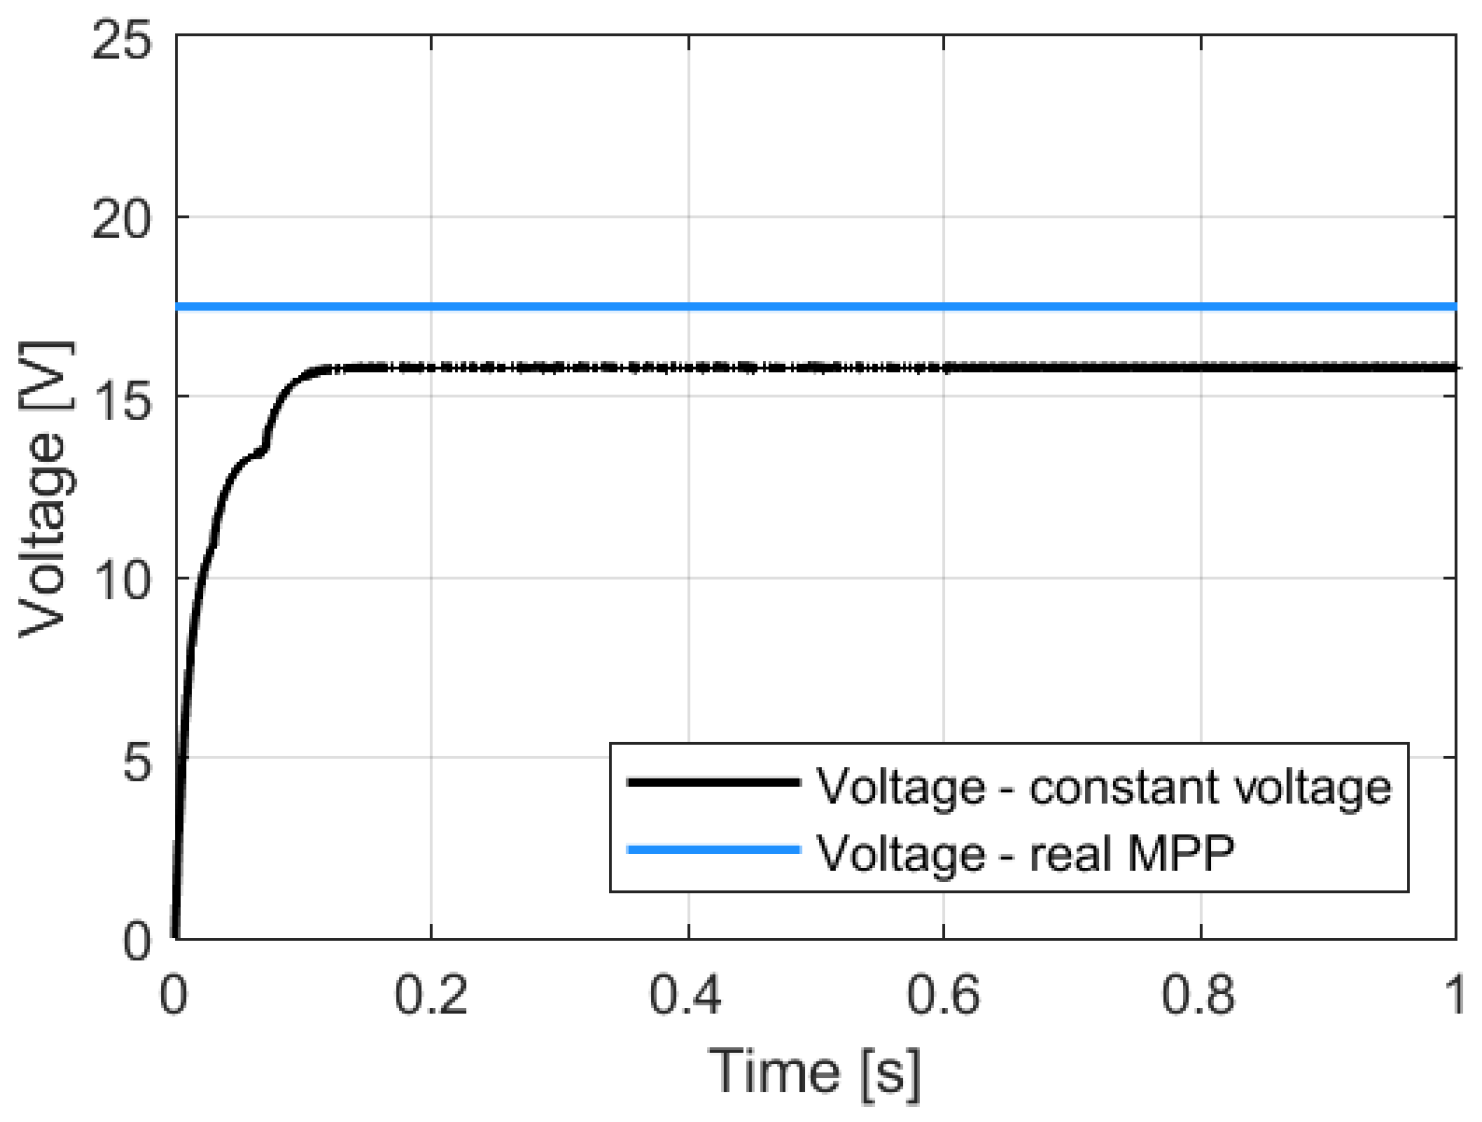
Initially, the simulation of the simplest method was carried out. The algorithm multiplies the open-circuit voltage ( U O C ) by an empirically determined coefficient to obtain a reference voltage, which serves as an approximation of the maximum power point (MPP) voltage. A coefficient of k = 0.8 was adopted, providing satisfactory accuracy even with this simple approach, especially under standard test conditions (STC). The results are shown in Figure 12, Figure 13, Figure 14 and Figure 15 for solar irradiance G of 1000 and 600 W/m2 (the time required for measuring U O C was not considered).

3.3. Simulation of the Perturb and Observe MPPT Algorithm (P&O)

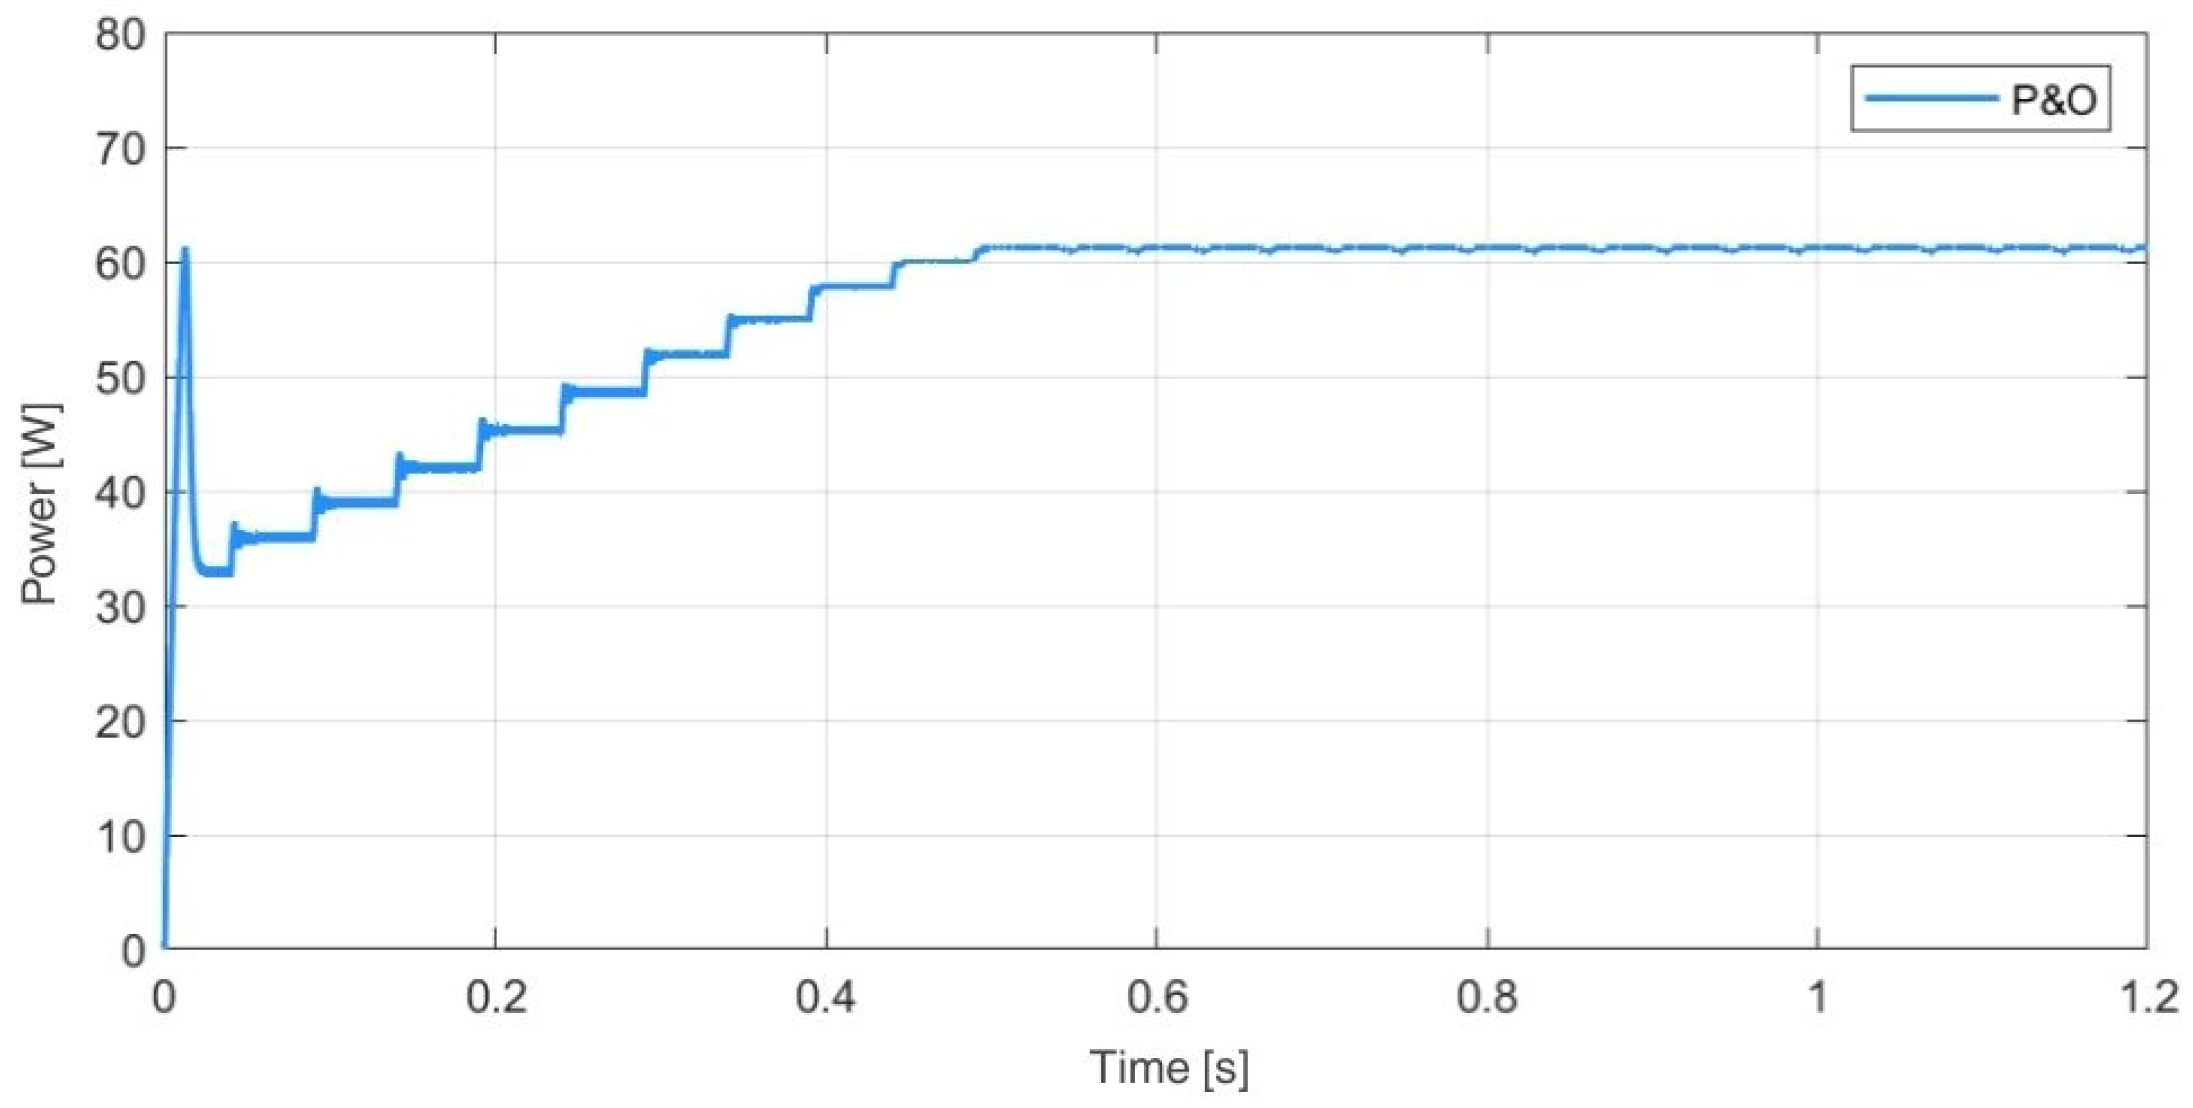
The implemented algorithm is the classical and widely used Perturb and Observe (P&O) method, commonly applied in maximum power point tracking (MPPT) systems. Figure 16 presents the output power profile of the photovoltaic panel under solar irradiance of 1000 W/m2 and a temperature of 25 °C.
As shown in the plot, the algorithm gradually increases the duty cycle from its initial default value of 0.3 to approximately 0.4, where the maximum power point is attained. This gradual increase results in a relatively long time required for the algorithm to reach the maximum power point. Increasing the parameter that controls the step size of the duty cycle adjustment in each iteration can reduce the time. However, this also amplifies the current and voltage oscillations inherent to the algorithm, which arise from its method of comparing successive power and voltage values. Under real operating conditions, measurement errors and fluctuations in irradiance and temperature further exacerbate these oscillations.
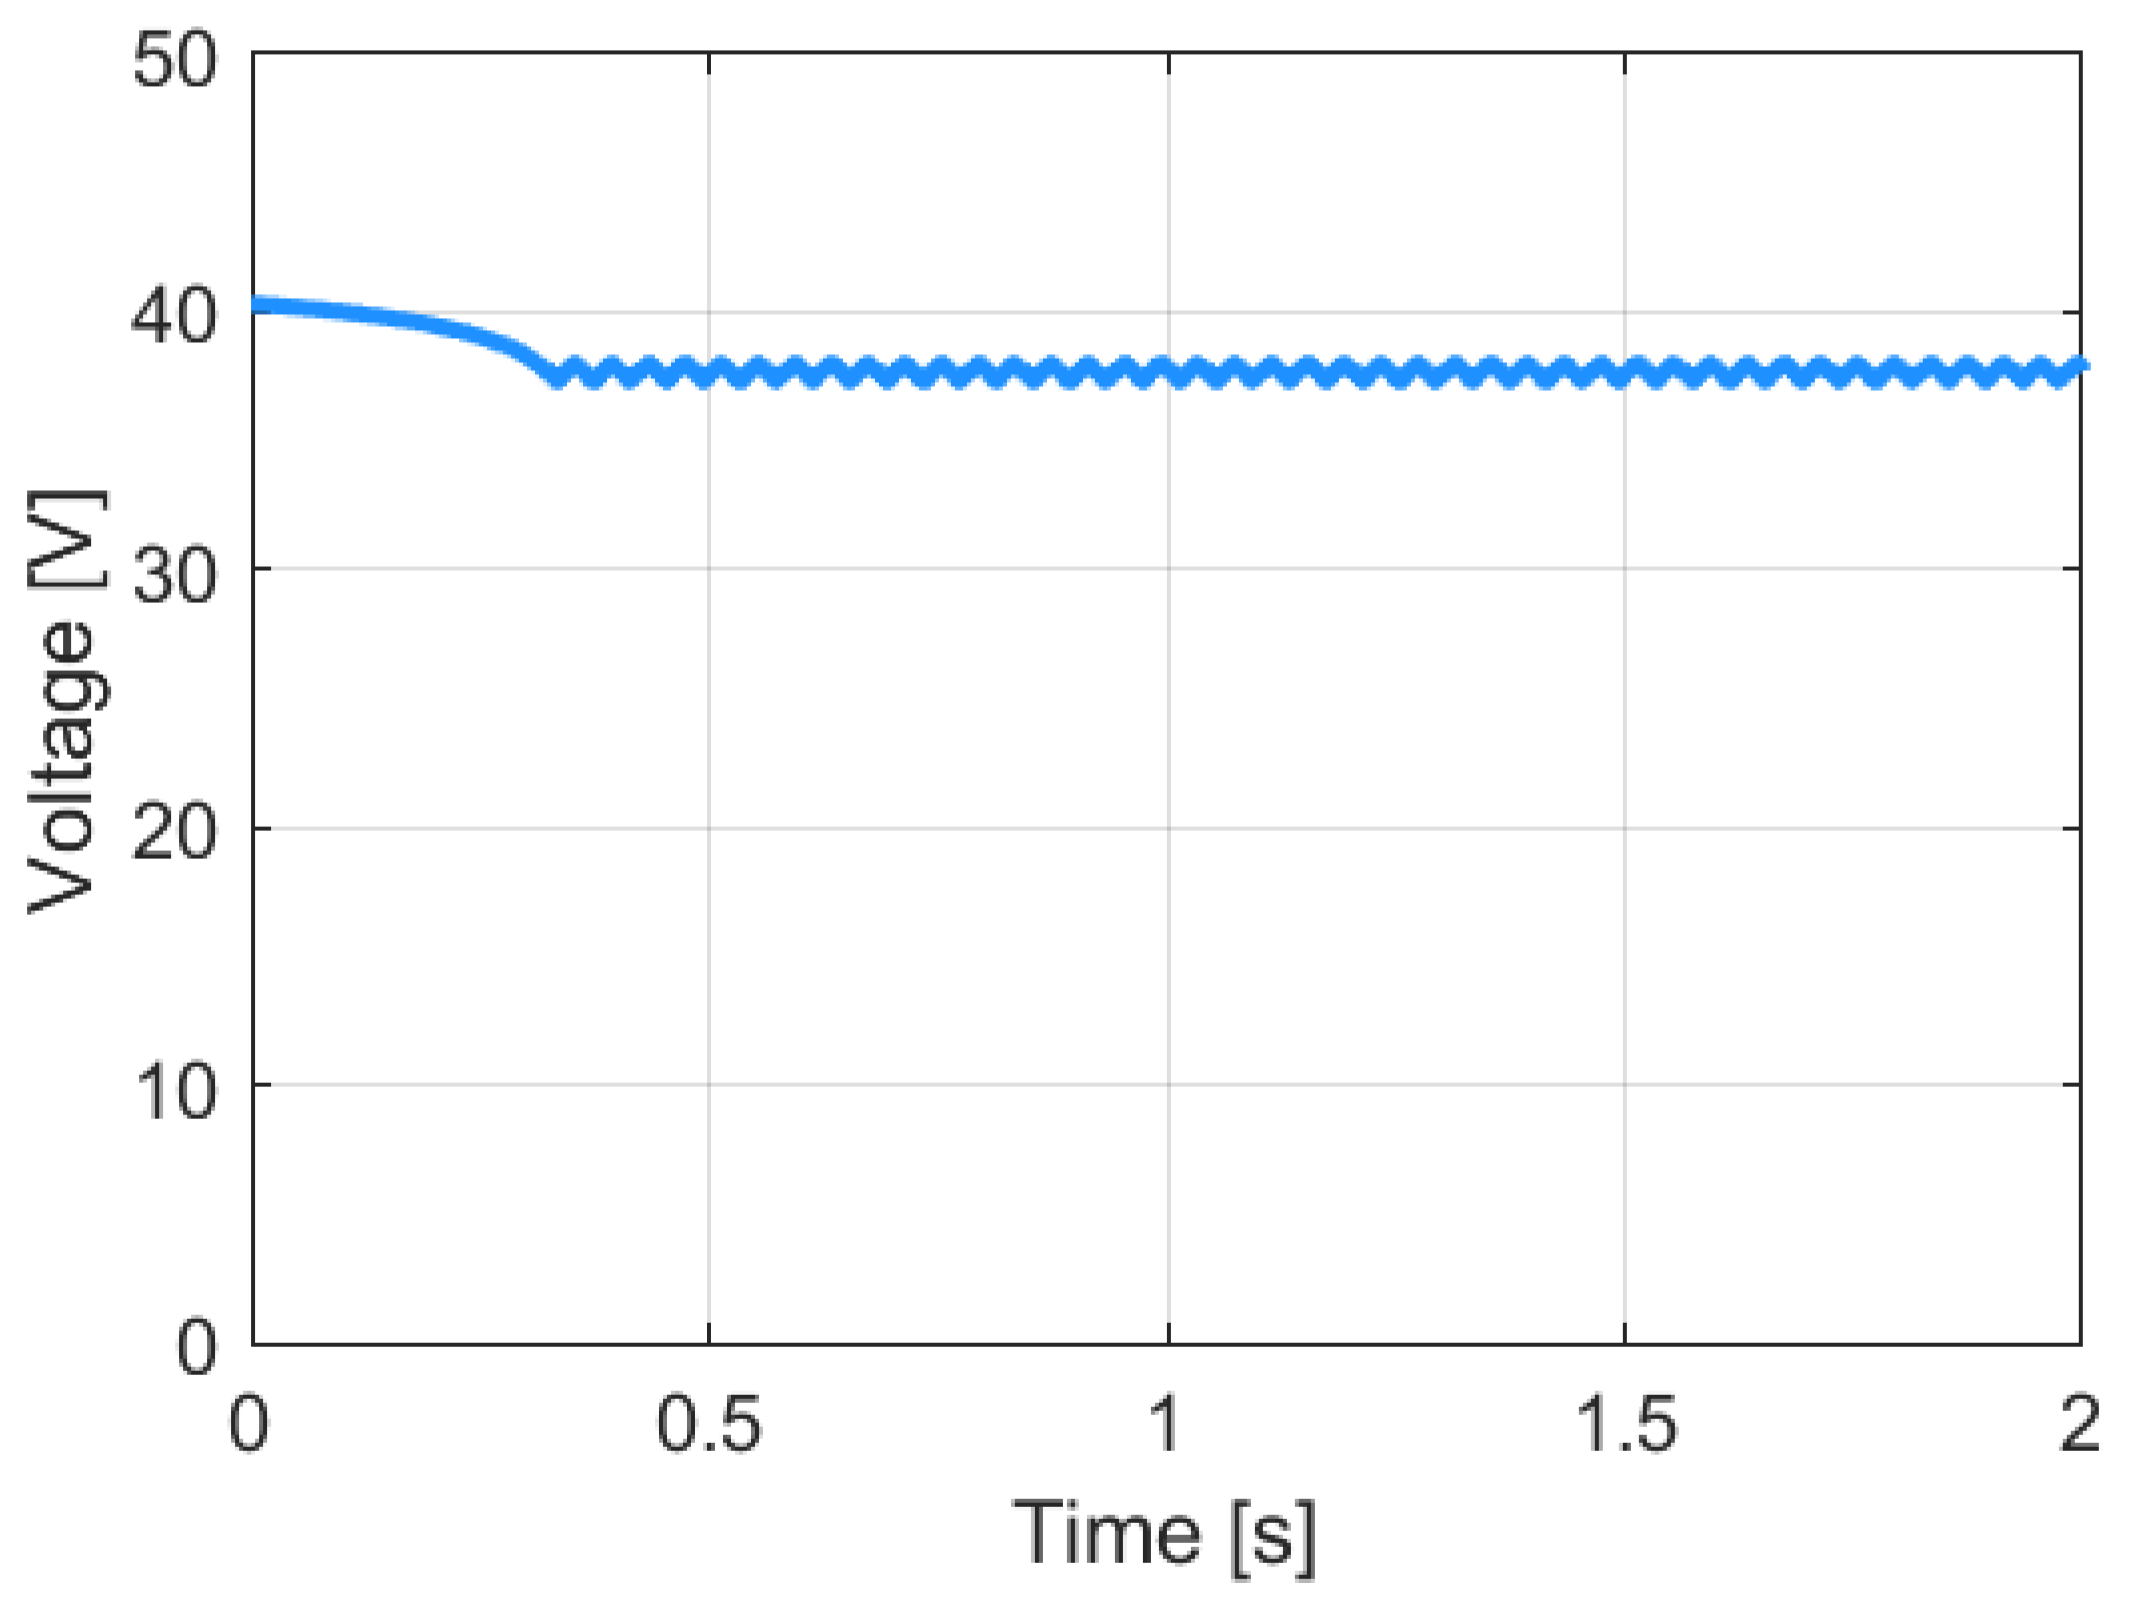
Figure 17 and Figure 18, as well as Figure 19 and Figure 20, illustrate the voltage waveforms of the photovoltaic panel before and after a fourfold increase in parameter x, whose role is described in Section 2.1.1. To simulate real-world operating conditions, a 5% measurement error was introduced for both current and voltage, along with 5% fluctuations in temperature and irradiance.
An increase in the parameter x approximately doubled the magnitude of oscillations. If the parameter value is too high, it can prolong the system’s settling time, requiring a longer delay before the algorithm initiates the next iteration. To mitigate oscillations, an adaptive P&O algorithm can be employed; this approach partially addresses the oscillation issue but significantly increases system complexity [48].

3.4. Simulation of the Performance of a Fuzzy Logic-Based Algorithm

The implementation of the maximum power point tracking algorithm based on fuzzy logic began with the definition of the membership functions and the associated rules, which are presented in Figure 21, Figure 22 and Figure 23 [47] and in Table 1 [47].
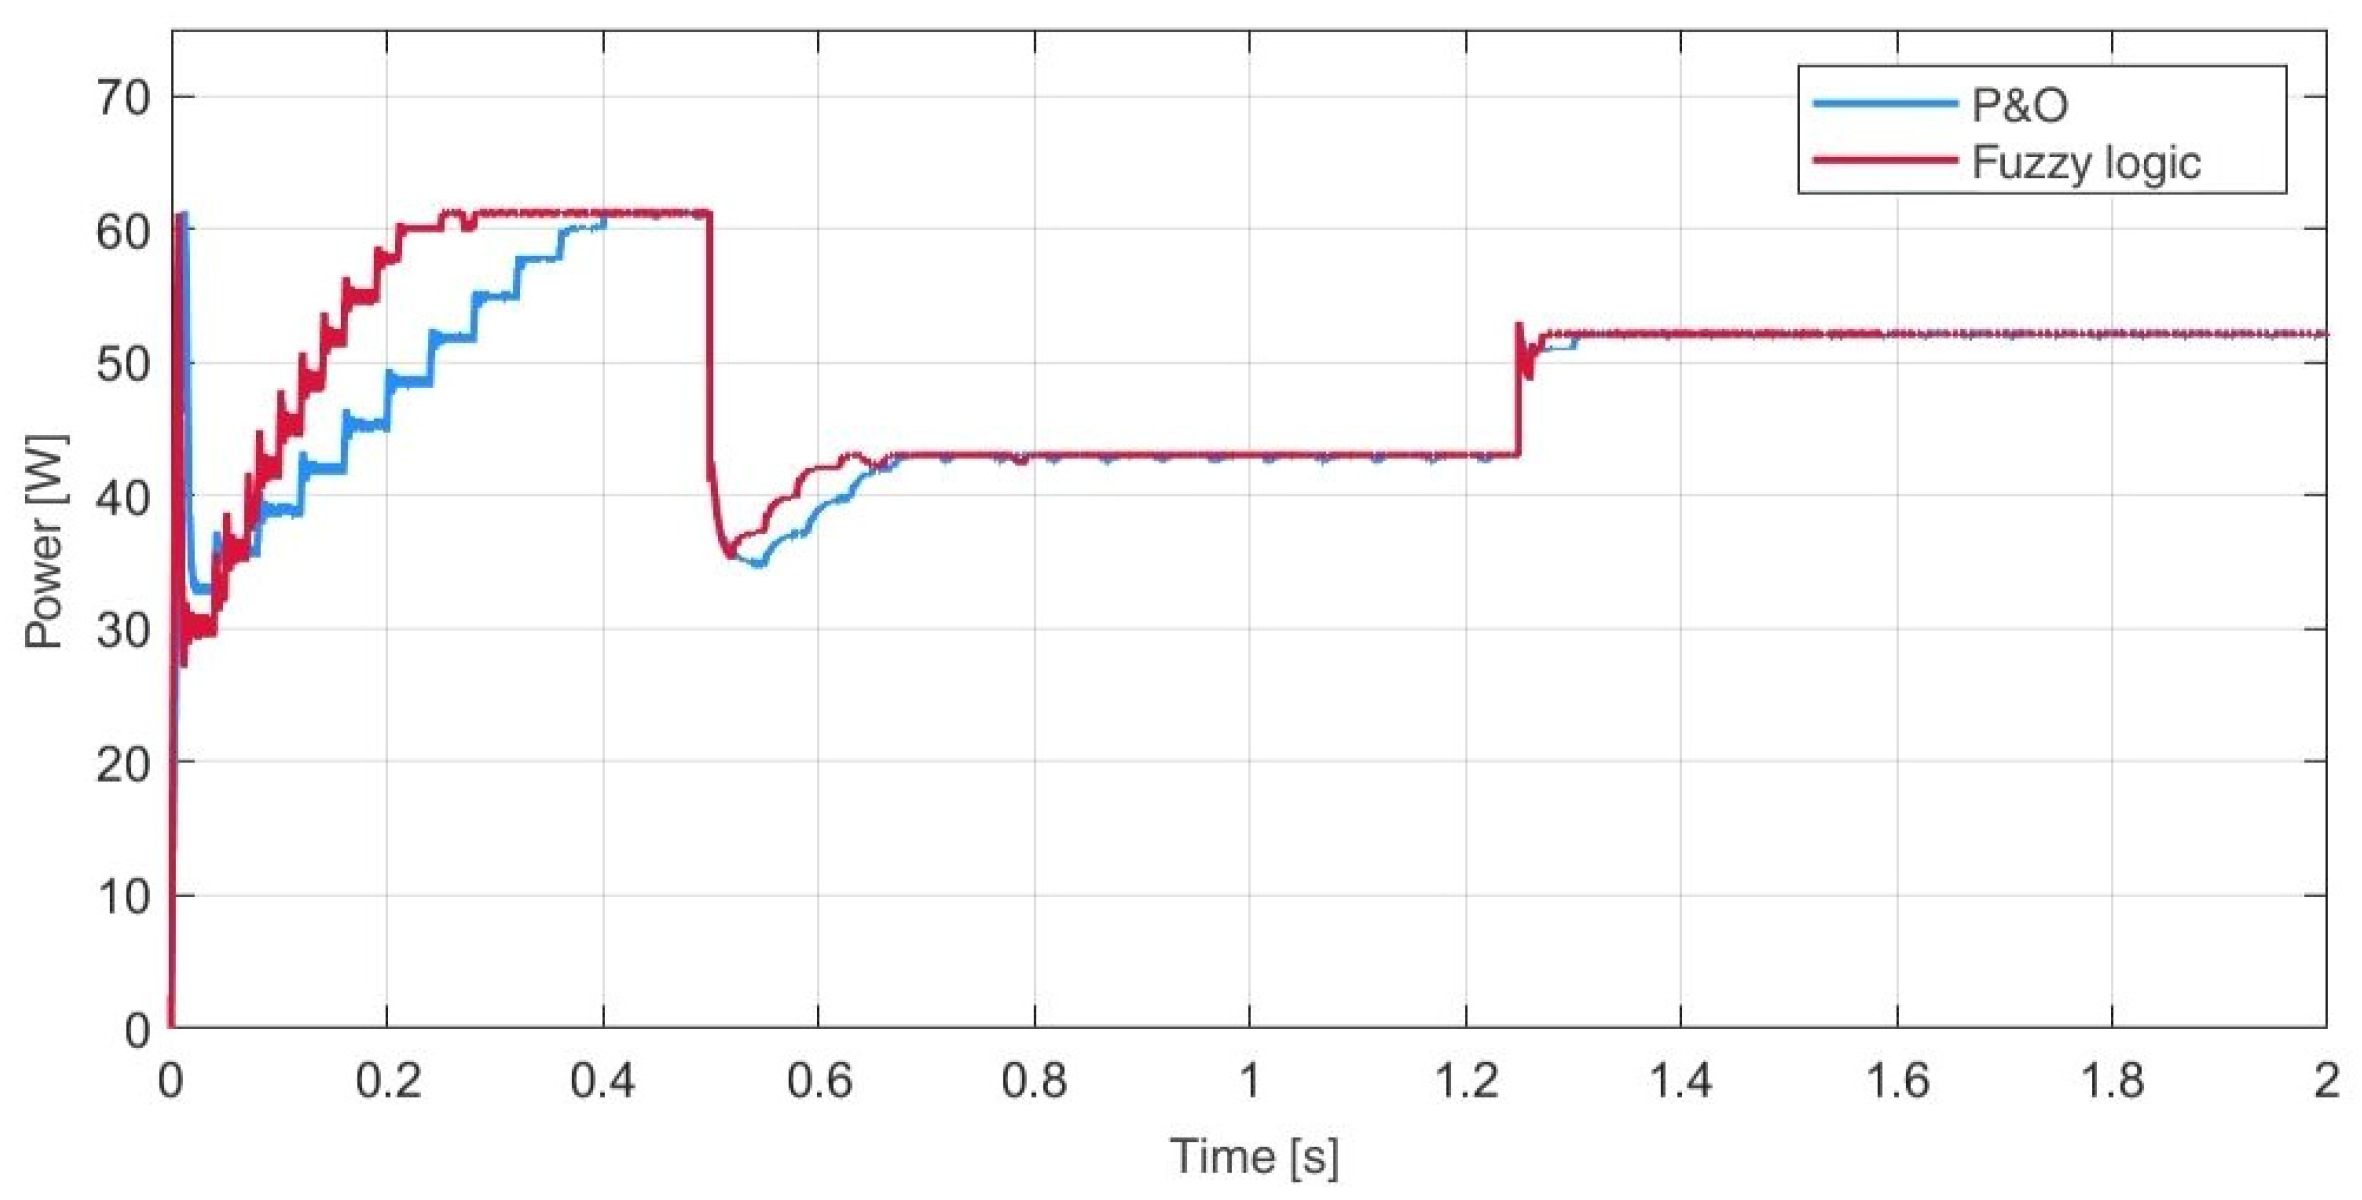
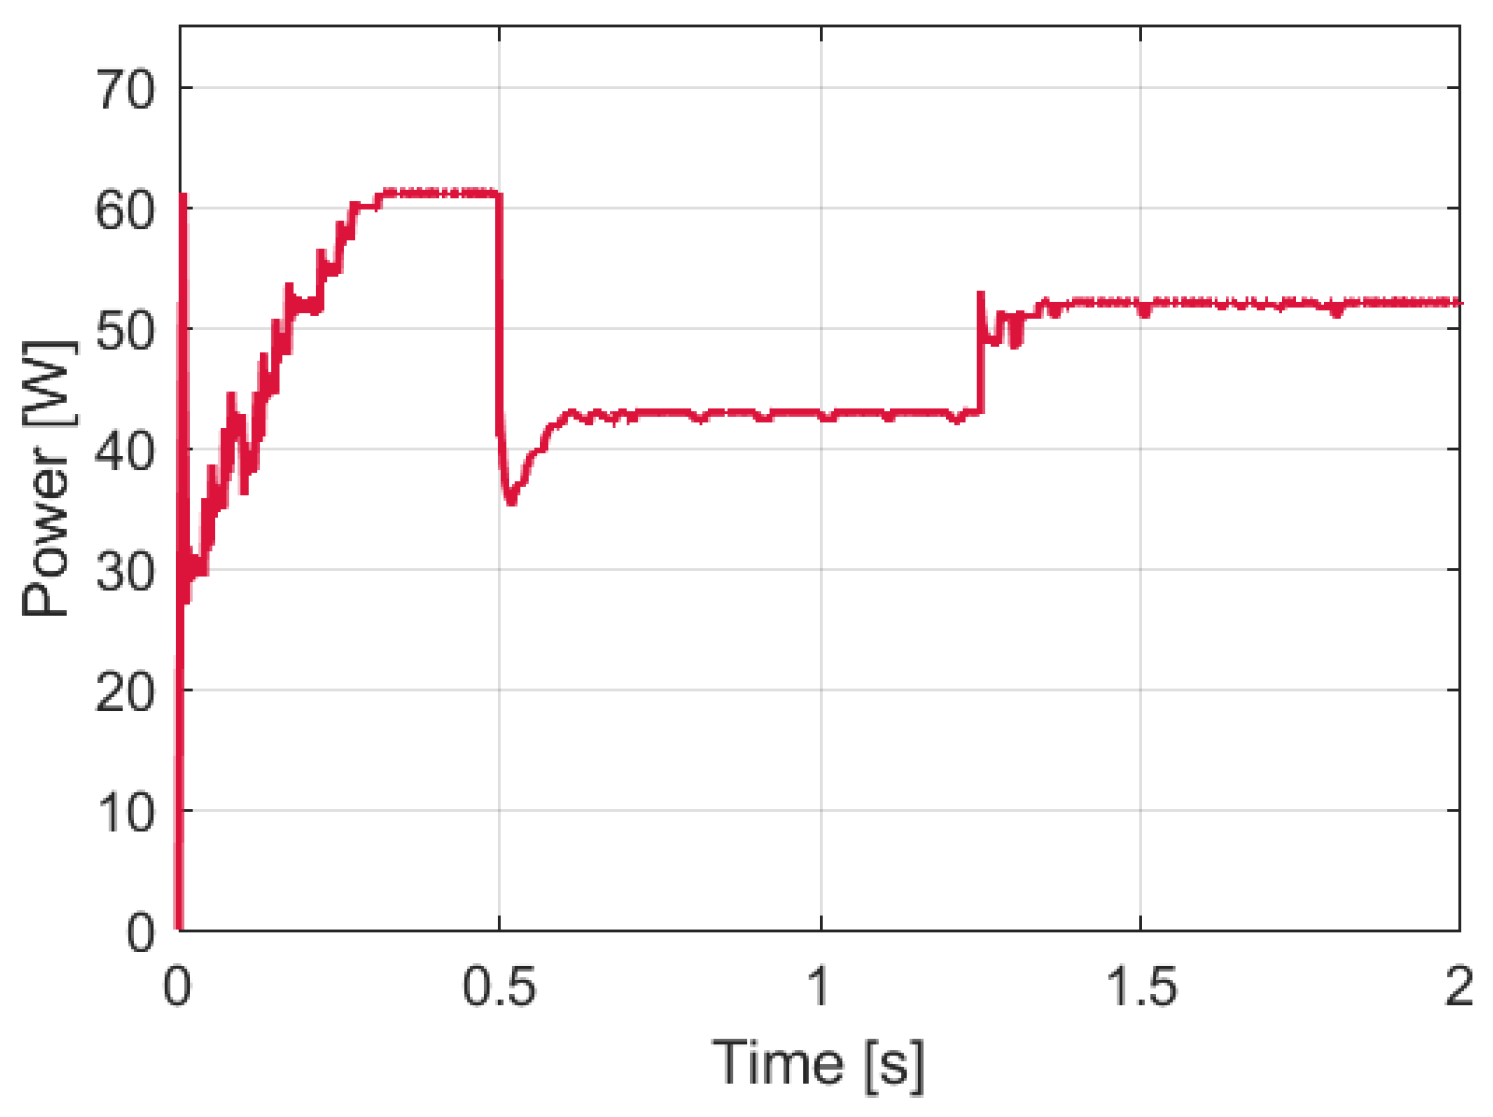
Following appropriate tuning of the membership functions, the impact of the algorithm on the system’s performance was investigated. Figure 24 shows the panel’s power profile over time. For comparison, the response of the P&O algorithm under the same conditions is also presented. Abrupt changes in solar irradiance—specifically 1000, 700, and 850 W/m2—were introduced to examine the response speed of both methods.
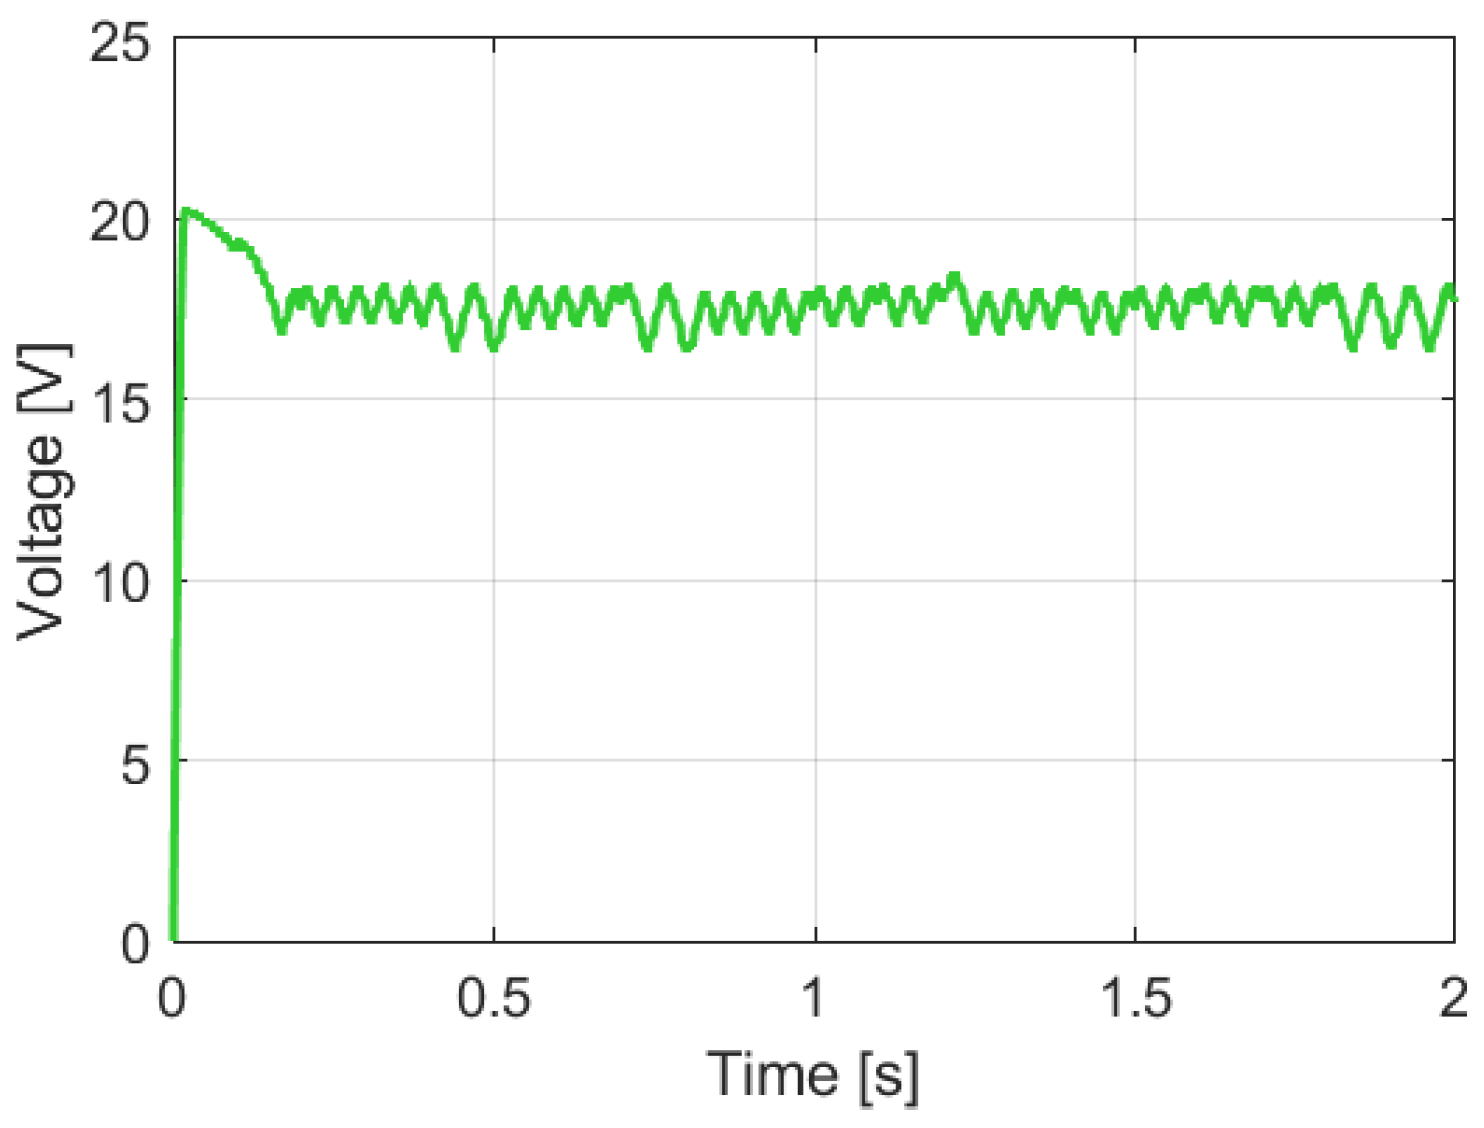
The application of a fuzzy logic-based algorithm significantly reduces the time required to reach the MPP and provides a dynamic response to changing conditions. However, it demands precise measurements. Figure 25 and Figure 26 show the power and voltage profiles of the panel, considering a measurement error of approximately 5%.
An analysis of the power and voltage curves, considering a 5% measurement error, indicates that although the error reduces the algorithm’s effectiveness, the resulting oscillation remains moderate, and the algorithm retains its dynamic response characteristics. The use of filtering circuits to suppress disturbances or the implementation of more accurate current and voltage sensors may help further reduce oscillations at the maximum power point. However, the implementation of the FLC, as described in Section 2.3.1, entails greater computational demands compared to conventional methods, potentially hindering its use, especially in compact and low-power systems [9].

3.5. Simulation of the PSO Algorithm Operation

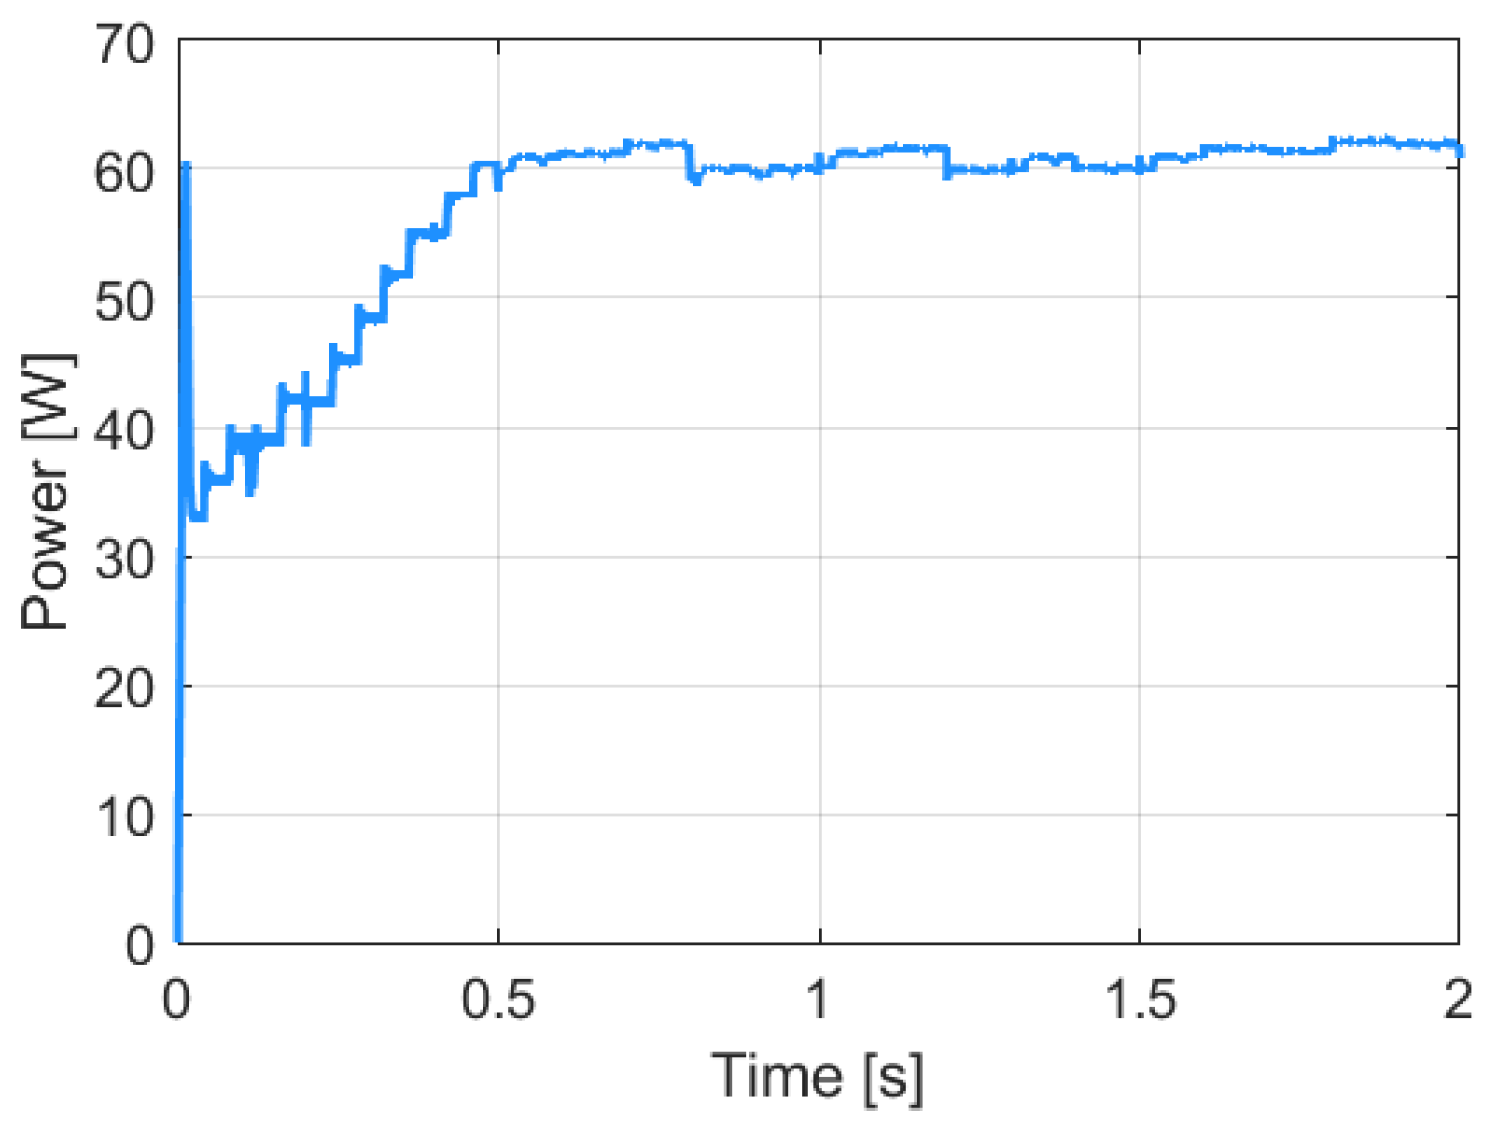
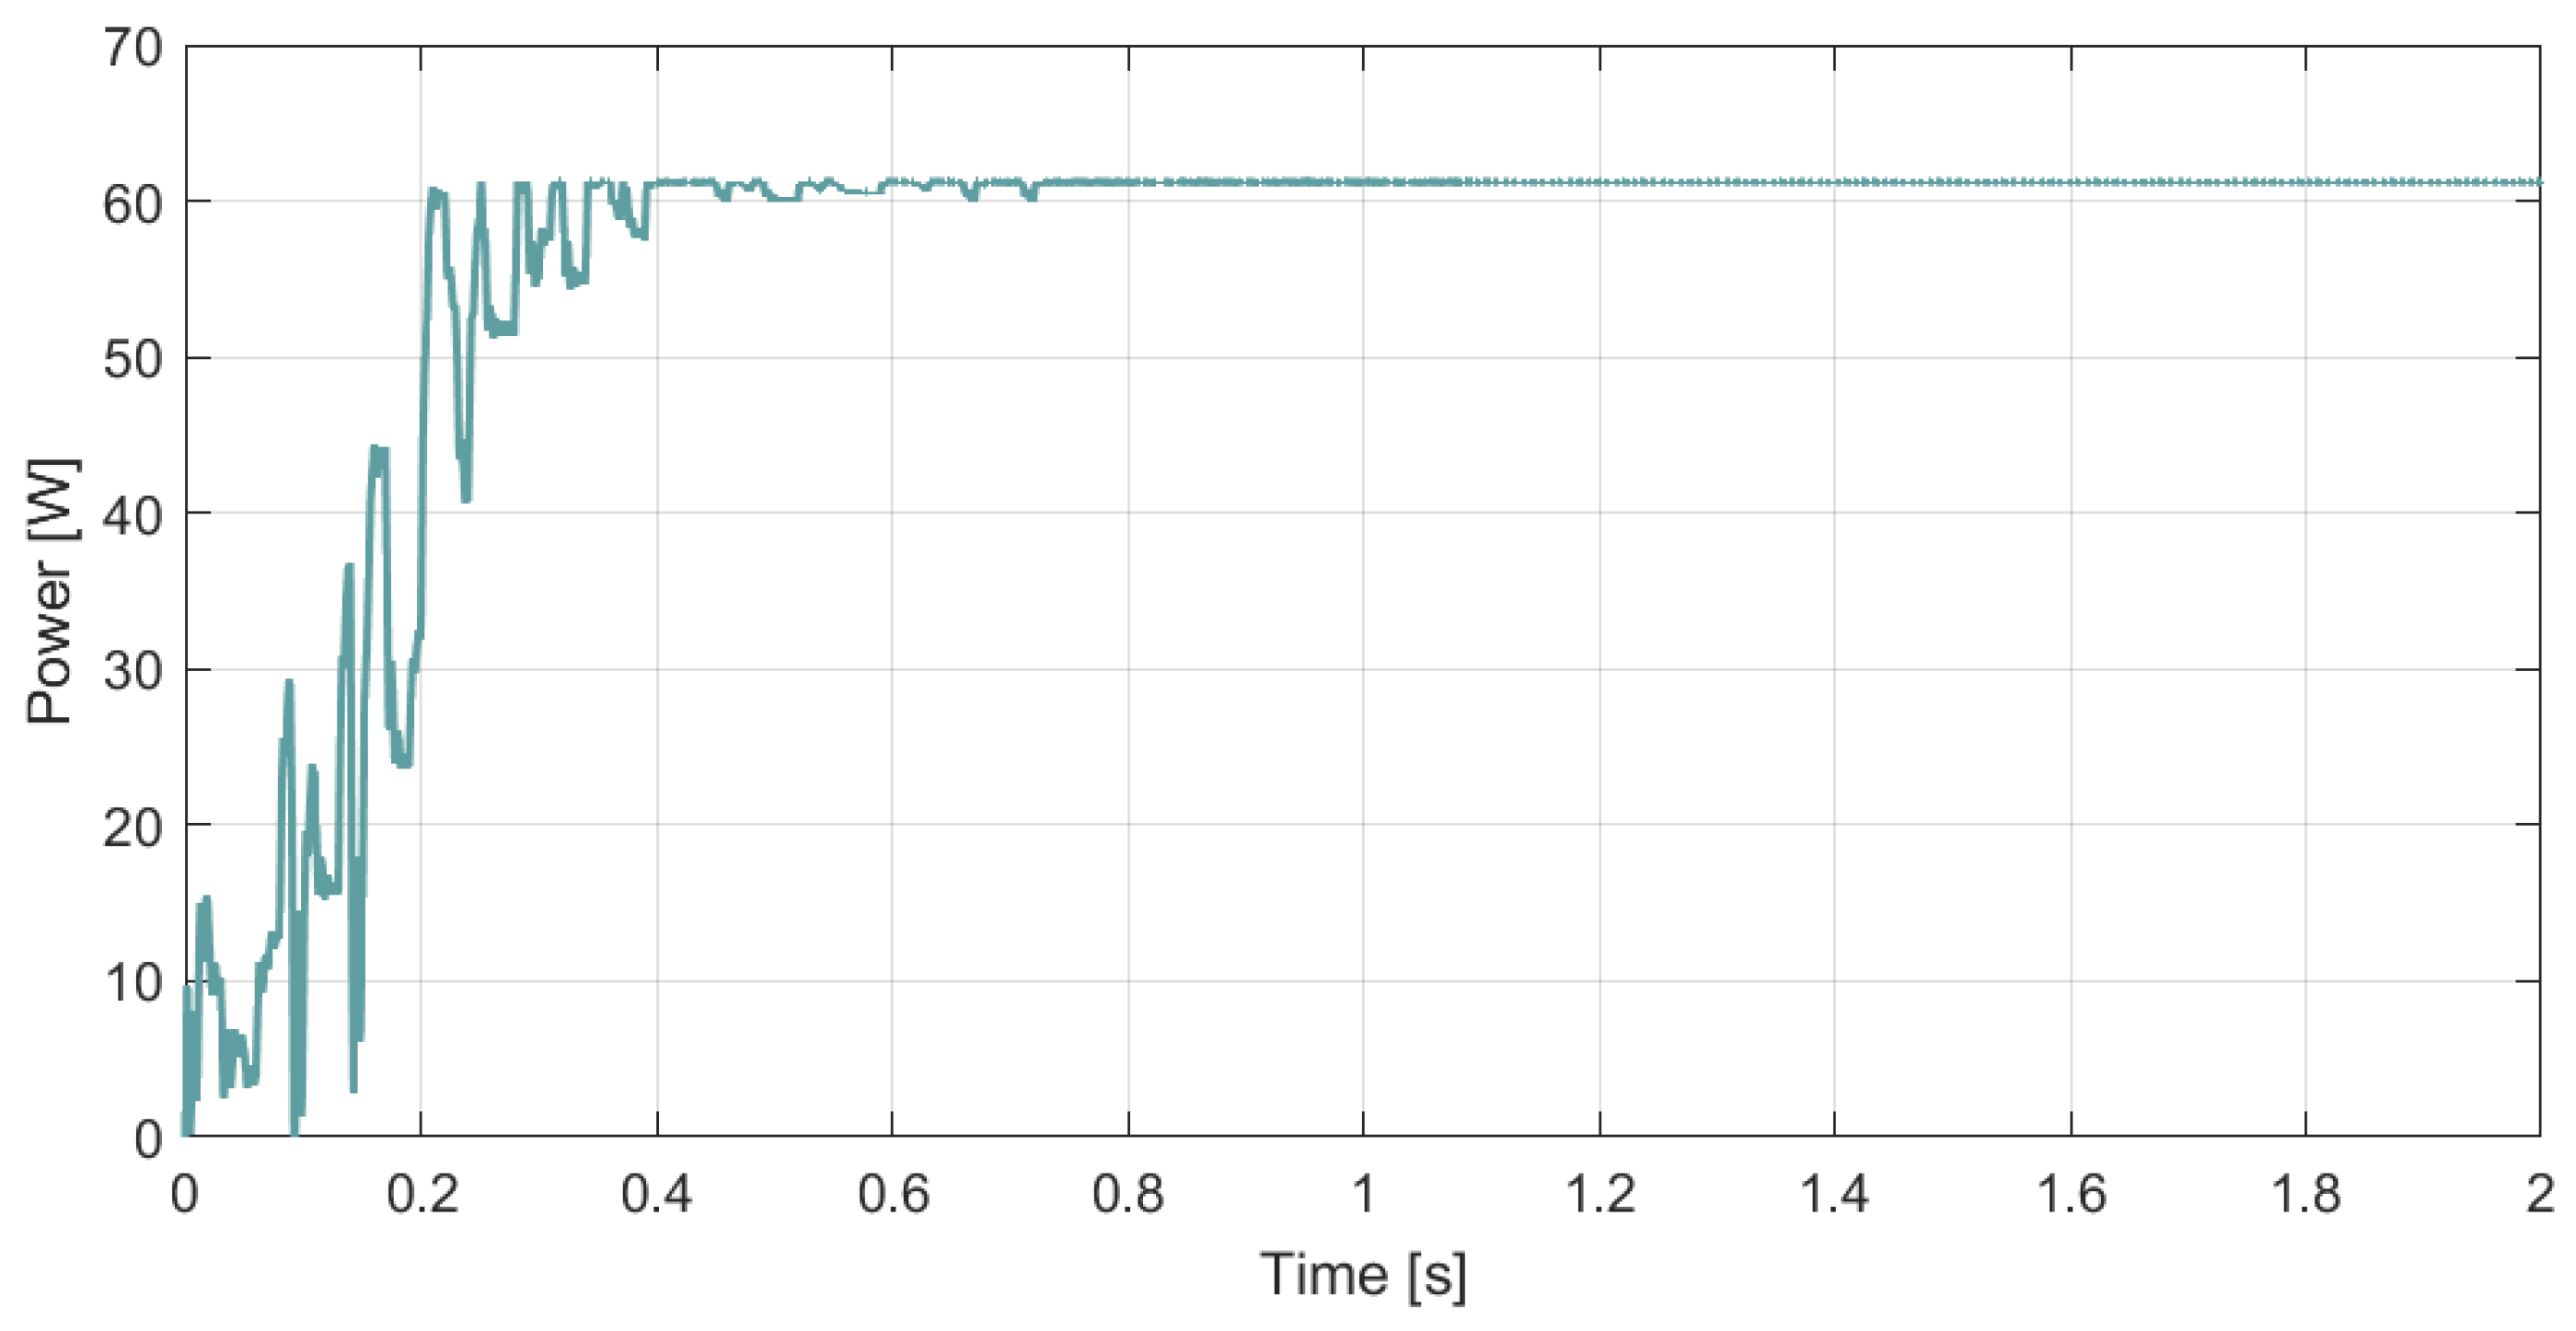
Optimisation algorithms enable the identification of the best solution within a large search space [33]. One of the most commonly used algorithms in this group is PSO [33]. In this application, a population of only five particles was employed, allowing the MPP to be identified within a timeframe comparable to that of the P&O algorithm. The power output of the panel over time is shown in Figure 27.
Equation (9) provides the mathematical representation of the velocity update for individual particles, while selected values of parameters influencing changes in particle position and velocity are listed in Table 2. These parameters were determined empirically, by modifying and adjusting their values while observing the simulation results.
The PSO algorithm enables the maximum power point to be located with high accuracy by comparing evaluation values, i.e., the power outputs of individual particles representing different duty cycle values. The random distribution of particles results in significant oscillations during the initial phase of the algorithm’s operation. Furthermore, any substantial changes in the panel operating conditions may trigger renewed oscillations. However, the use of an optimisation algorithm, such as PSO, allows for effective tracking of the maximum power point under partial shading conditions [30].

3.6. Simulation of the Hybrid PSO + P&O Algorithm Operation

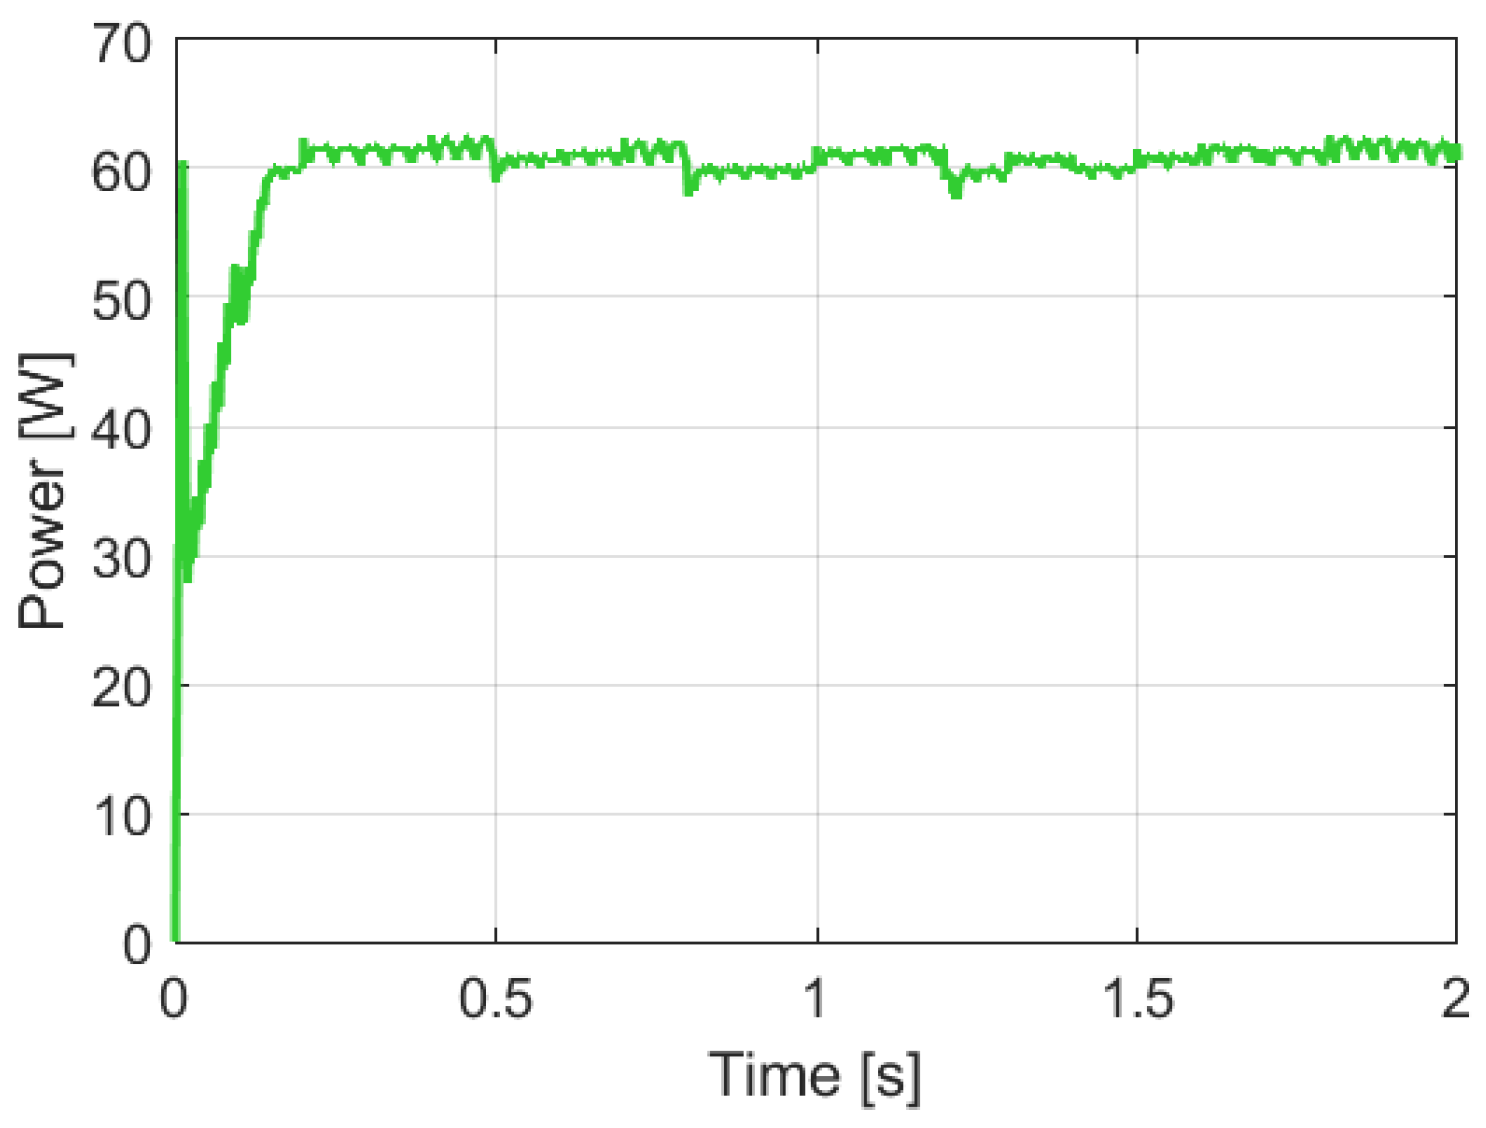
By combining two algorithms within a single system, it is possible to partially mitigate the drawbacks of each. Implementing a hybrid algorithm that integrates the previously described PSO method (detailed in Section 3.5) with the P&O method (Section 3.3), yields improved results compared to the individual operation of either of these algorithms.
At system startup, the PSO algorithm initiates the search by evaluating individual particles and recording the best solution found. After 0.16 s, once PSO has performed several evaluations, the best result is passed to the P&O algorithm, which then uses it as its initial operating point. This process is illustrated in Figure 28.
This approach reduces the time required to identify the MPP. Furthermore, the algorithm enables accurate identification of the MPP under partial shading conditions and provides more effective responses to minor and gradual changes in irradiance or temperature [43]. However, implementing such an algorithm increases system complexity and significantly increases the computational burden on the devices performing the calculations [26].

3.7. Comparison of Selected Qualitative Parameters

Table 3 compares selected quantitative (performance) parameters of MPPT algorithms operating under test conditions (STC).
The parameters in Table 3 are defined as follows:
  • Stabilisation time 98–100% [s]—the time required for the algorithm to reach and remain within 98% of the maximum power point.
  • Rise time 10–90% [s]—the time taken for the algorithm to increase from 10% to 90% of the maximum power point.
  • Accuracy [%]—the extent to which the maximum power point identified by the algorithm corresponds to the actual maximum power point.
  • Energy loss [%]—the relative energy loss during the simulation before the MPPT algorithm stabilises at the maximum power point (including any oscillations).
  • Standard deviation (from 98%) [%]—the standard deviation calculated from the moment the algorithm stabilises between 98% and 100% of the MPP.
  • Standard deviation (entire window [%]—the standard deviation calculated over the entire time window, i.e., for the full duration of the simulation).
Preliminary simulations conducted under variable operating conditions indicated that the algorithms generally exhibit parameter values similar to those in Table 3, except for the P&O algorithm (x = 0.01), whose performance deteriorates significantly, as partially illustrated in Figure 17, Figure 18, Figure 19 and Figure 20. Although this algorithm achieves the best parameter values under STC, the substantial decline in performance under variable operating conditions limits its suitability for practical applications. Apart from the aforementioned P&O (x = 0.01), both the FLC algorithm and the hybrid PSO + P&O algorithm warrant attention, as they maintain good performance well under variable operating conditions, which was confirmed by the preliminary simulation analyses.

3.8. Simulation of the Application of Selected Algorithms in the Situation of Partial Shading of the PV Installation

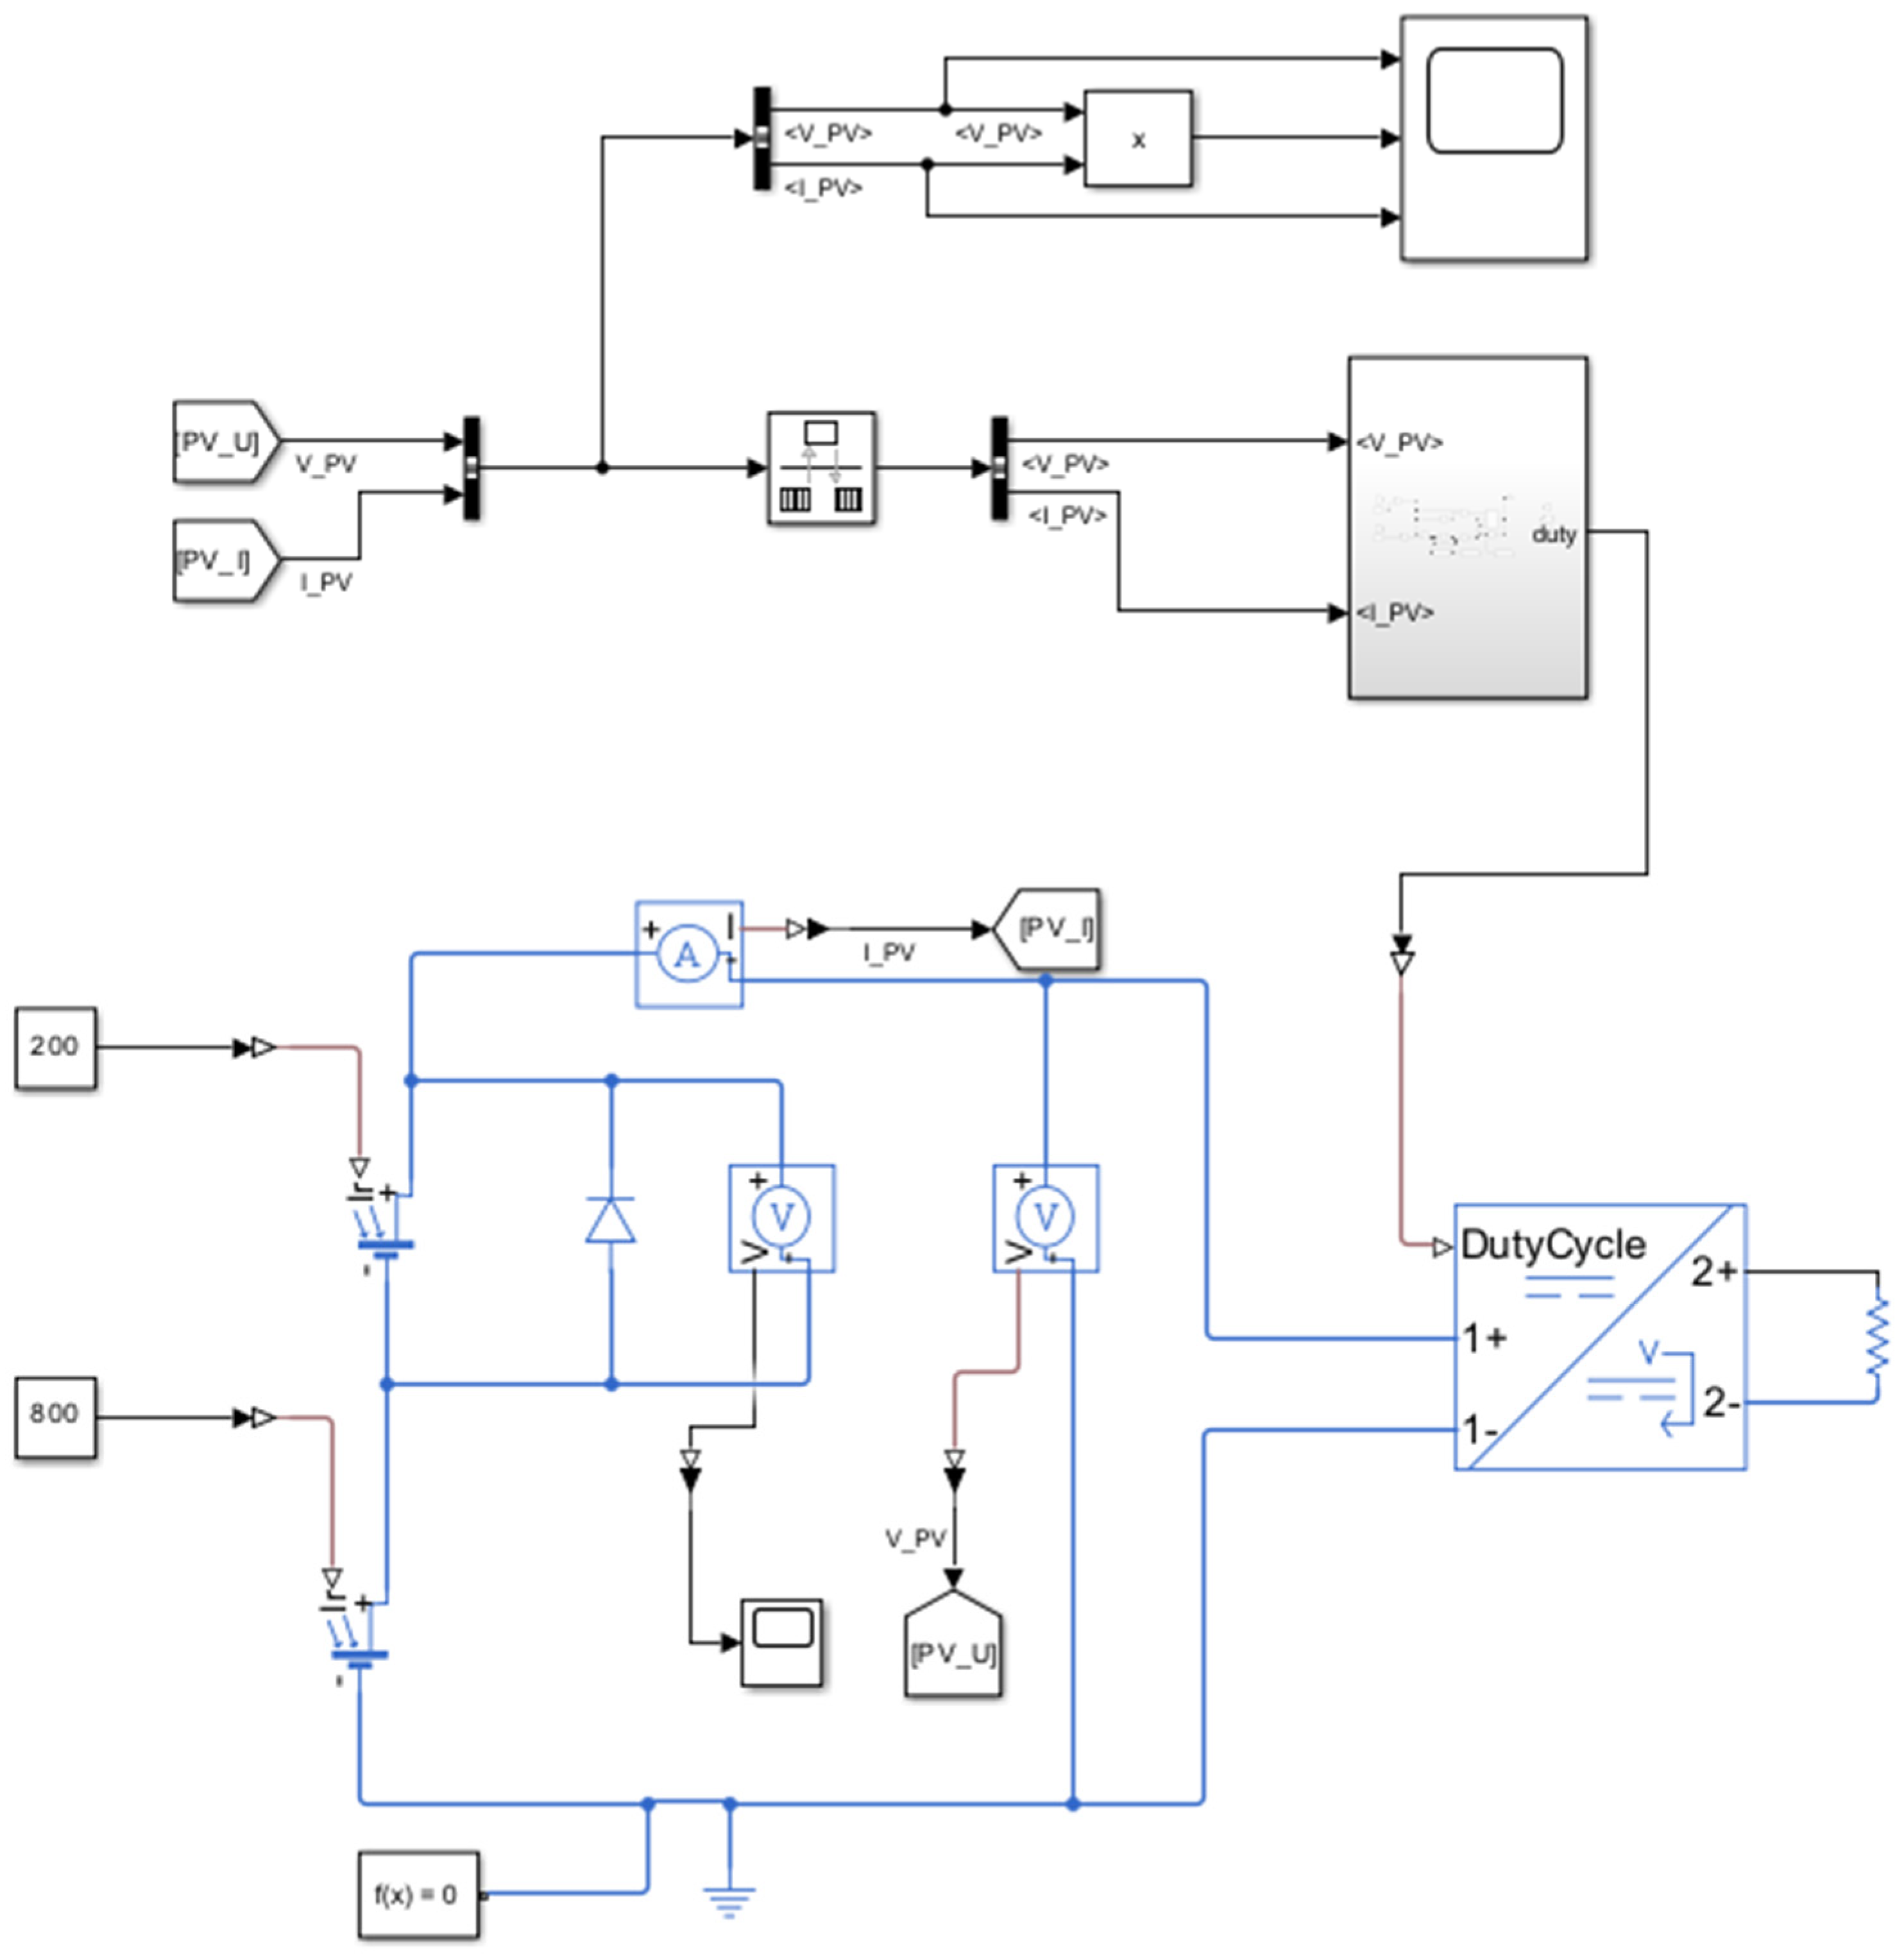
The previous simulations were extended to include a comparative analysis of selected algorithms under conditions of partial shading. Following an additional review of the literature [27,28,29], the scope of the analysis was limited to two MPPT algorithms: Particle Swarm Optimisation (PSO) and Perturb and Observe (P&O). The system behaviour under partial shading of the PV installation was simulated using two series-connected AS_6M30_HC_320W photovoltaic modules, and optionally, two additional 60 W PV modules equipped with bypass diodes. These modules operated under different irradiance levels of 800 and 200 W/m2. The schematic diagram of the system implemented in MATLAB is presented in Figure 29. In this case, the zeta converter was replaced by an alternative DutyCycle block with a Buck (or optionally Boost) converter. The use of these different converter configurations was tested in the systems shown in Figure 11 and Figure 29, which yielded identical results. However, the zeta converter required a longer simulation time, while proving to be the most accurate voltage step-up converter. In all converters, the load impedance was set to 2 Ω. Variations in impedance directly influenced the duty cycle, which determined the voltage rise rate, and consequently influenced the convergence speed of the algorithm towards the maximum power point (MPP).
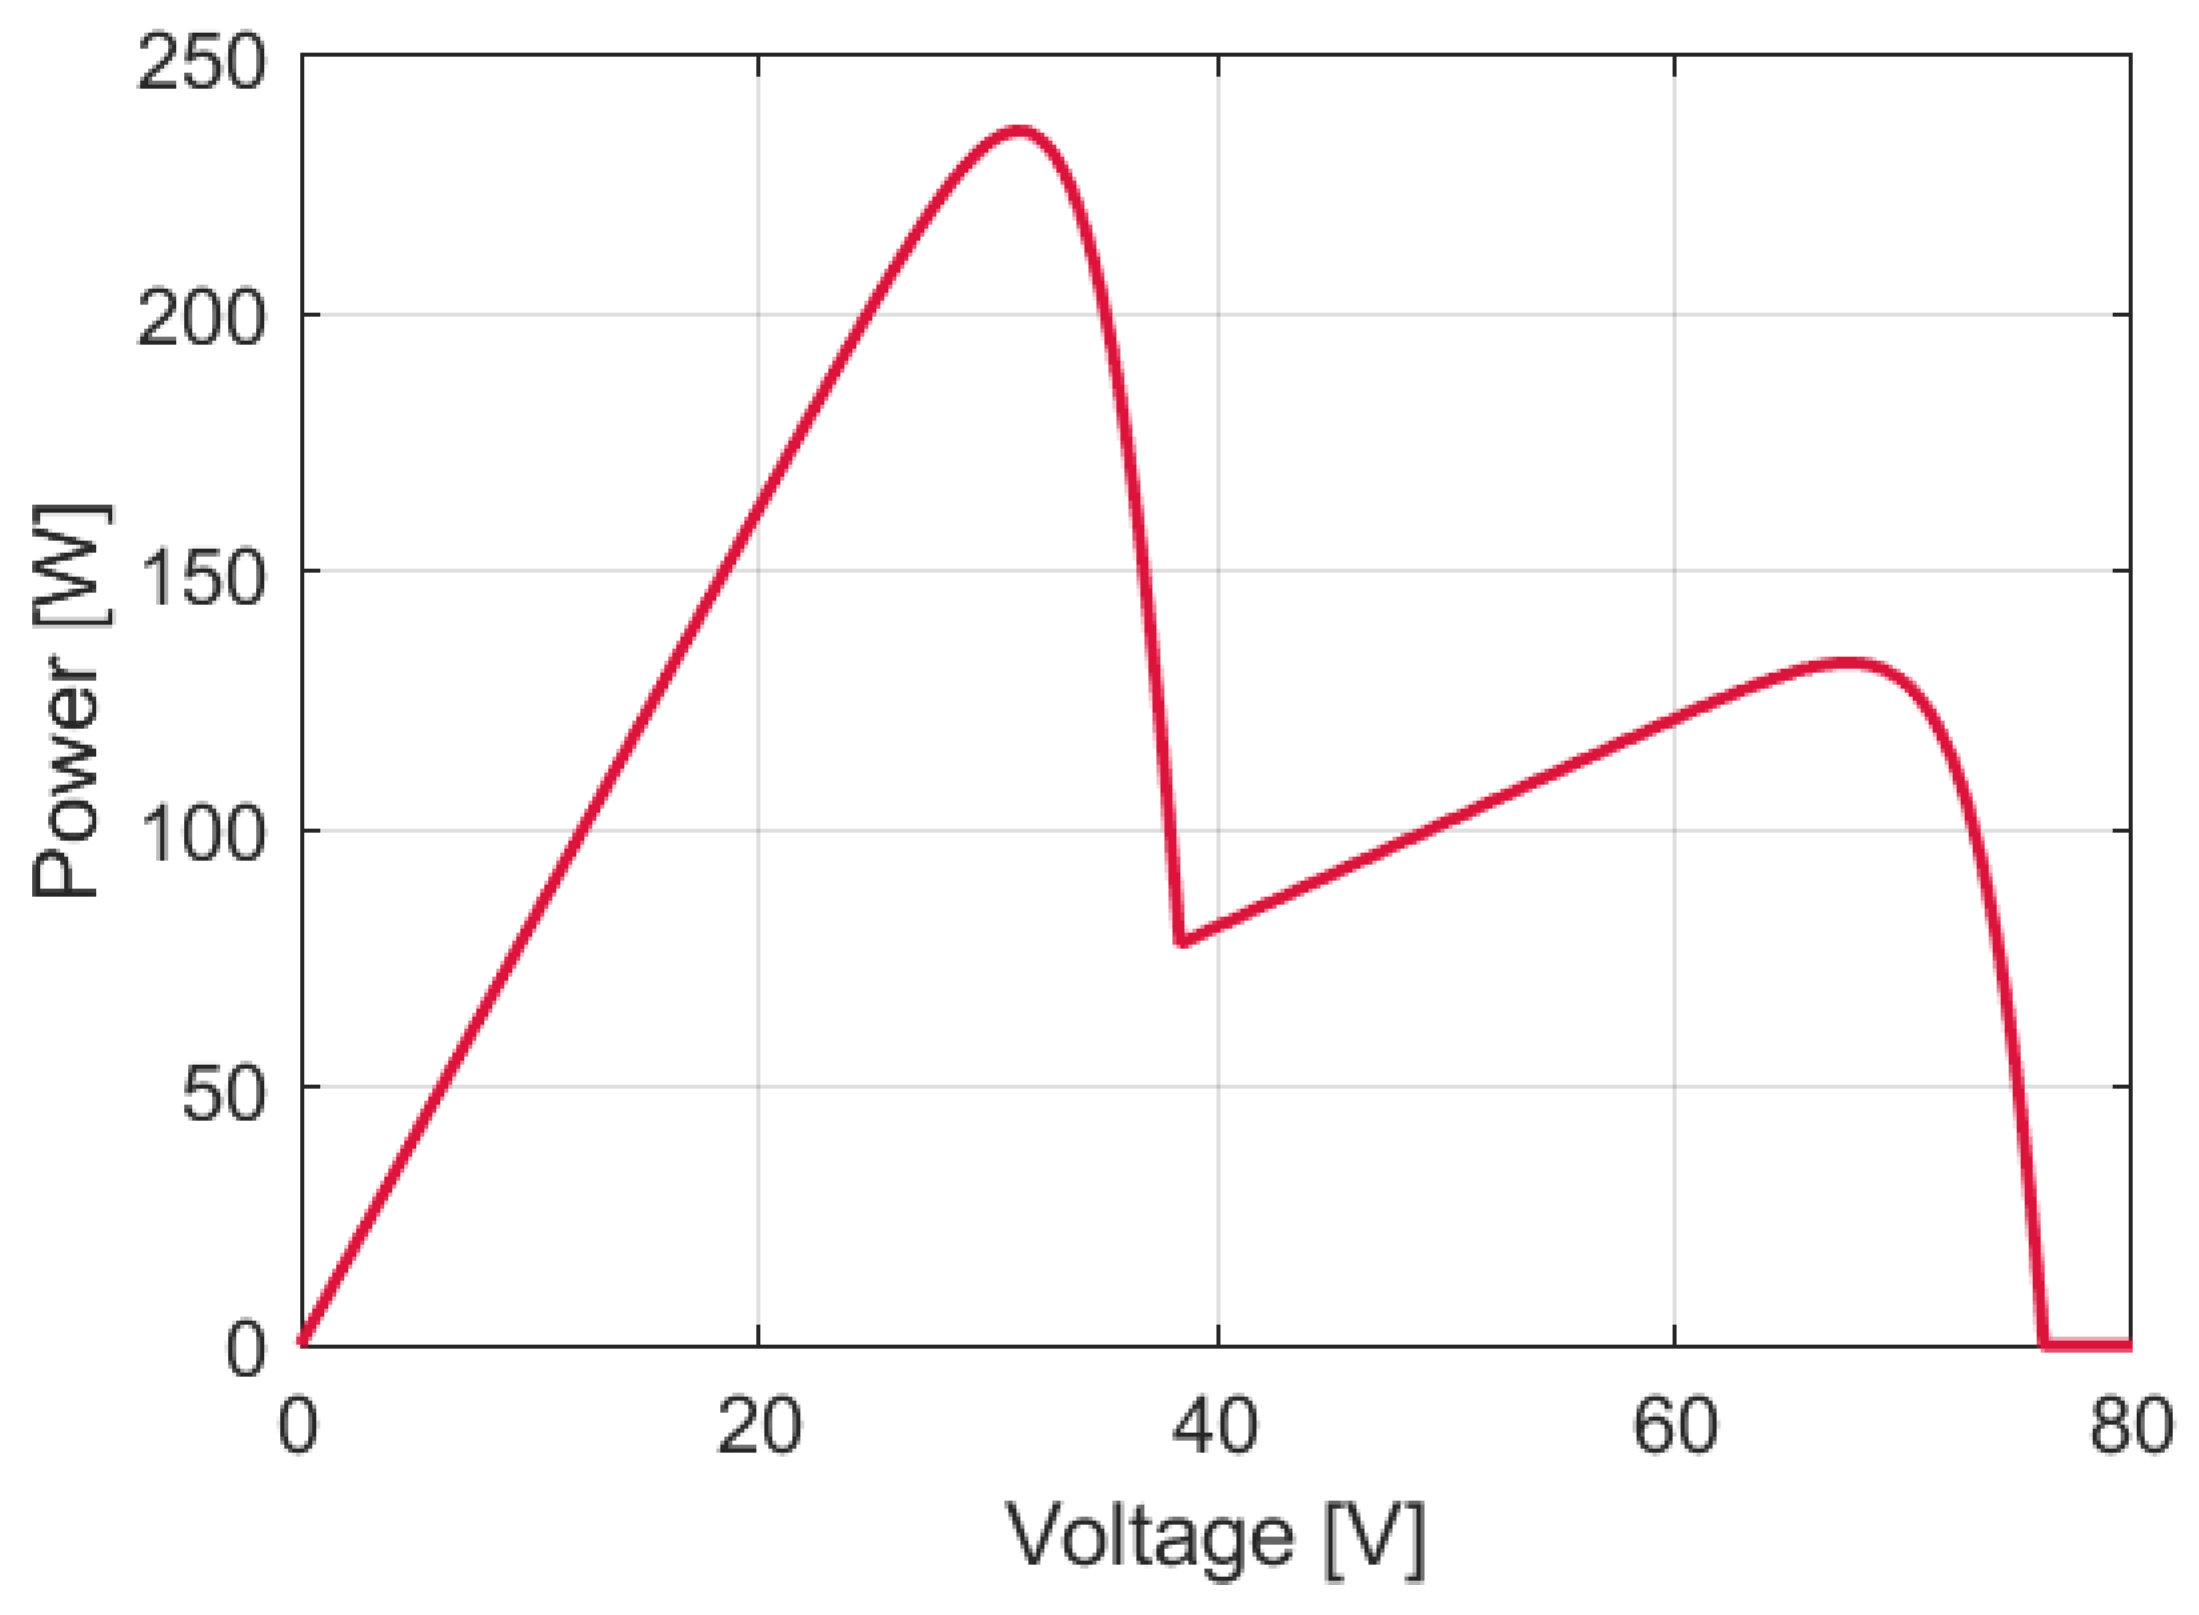
According to established knowledge [16,17,27,28,29] and the simulations carried out, a power curve for two series-connected PV modules was first obtained (Figure 30), confirming the existence of two distinct maximum power points. As illustrated in the figure, the global maximum power point (GMPP) is governed by the higher irradiance level on one of the modules, while the position of the local maximum power point (LMPP) depends on the lower irradiance level, for instance, on a shaded PV module. Comparable effects may also occur in the case of soiling or reduced transparency of the protective glass covering a PV module. In this study, the analysis was limited to two series-connected PV modules; however, for a larger number of modules with varying degrees of shading, the resulting curve would be analogous—featuring a single GMPP along with multiple LMPPs.
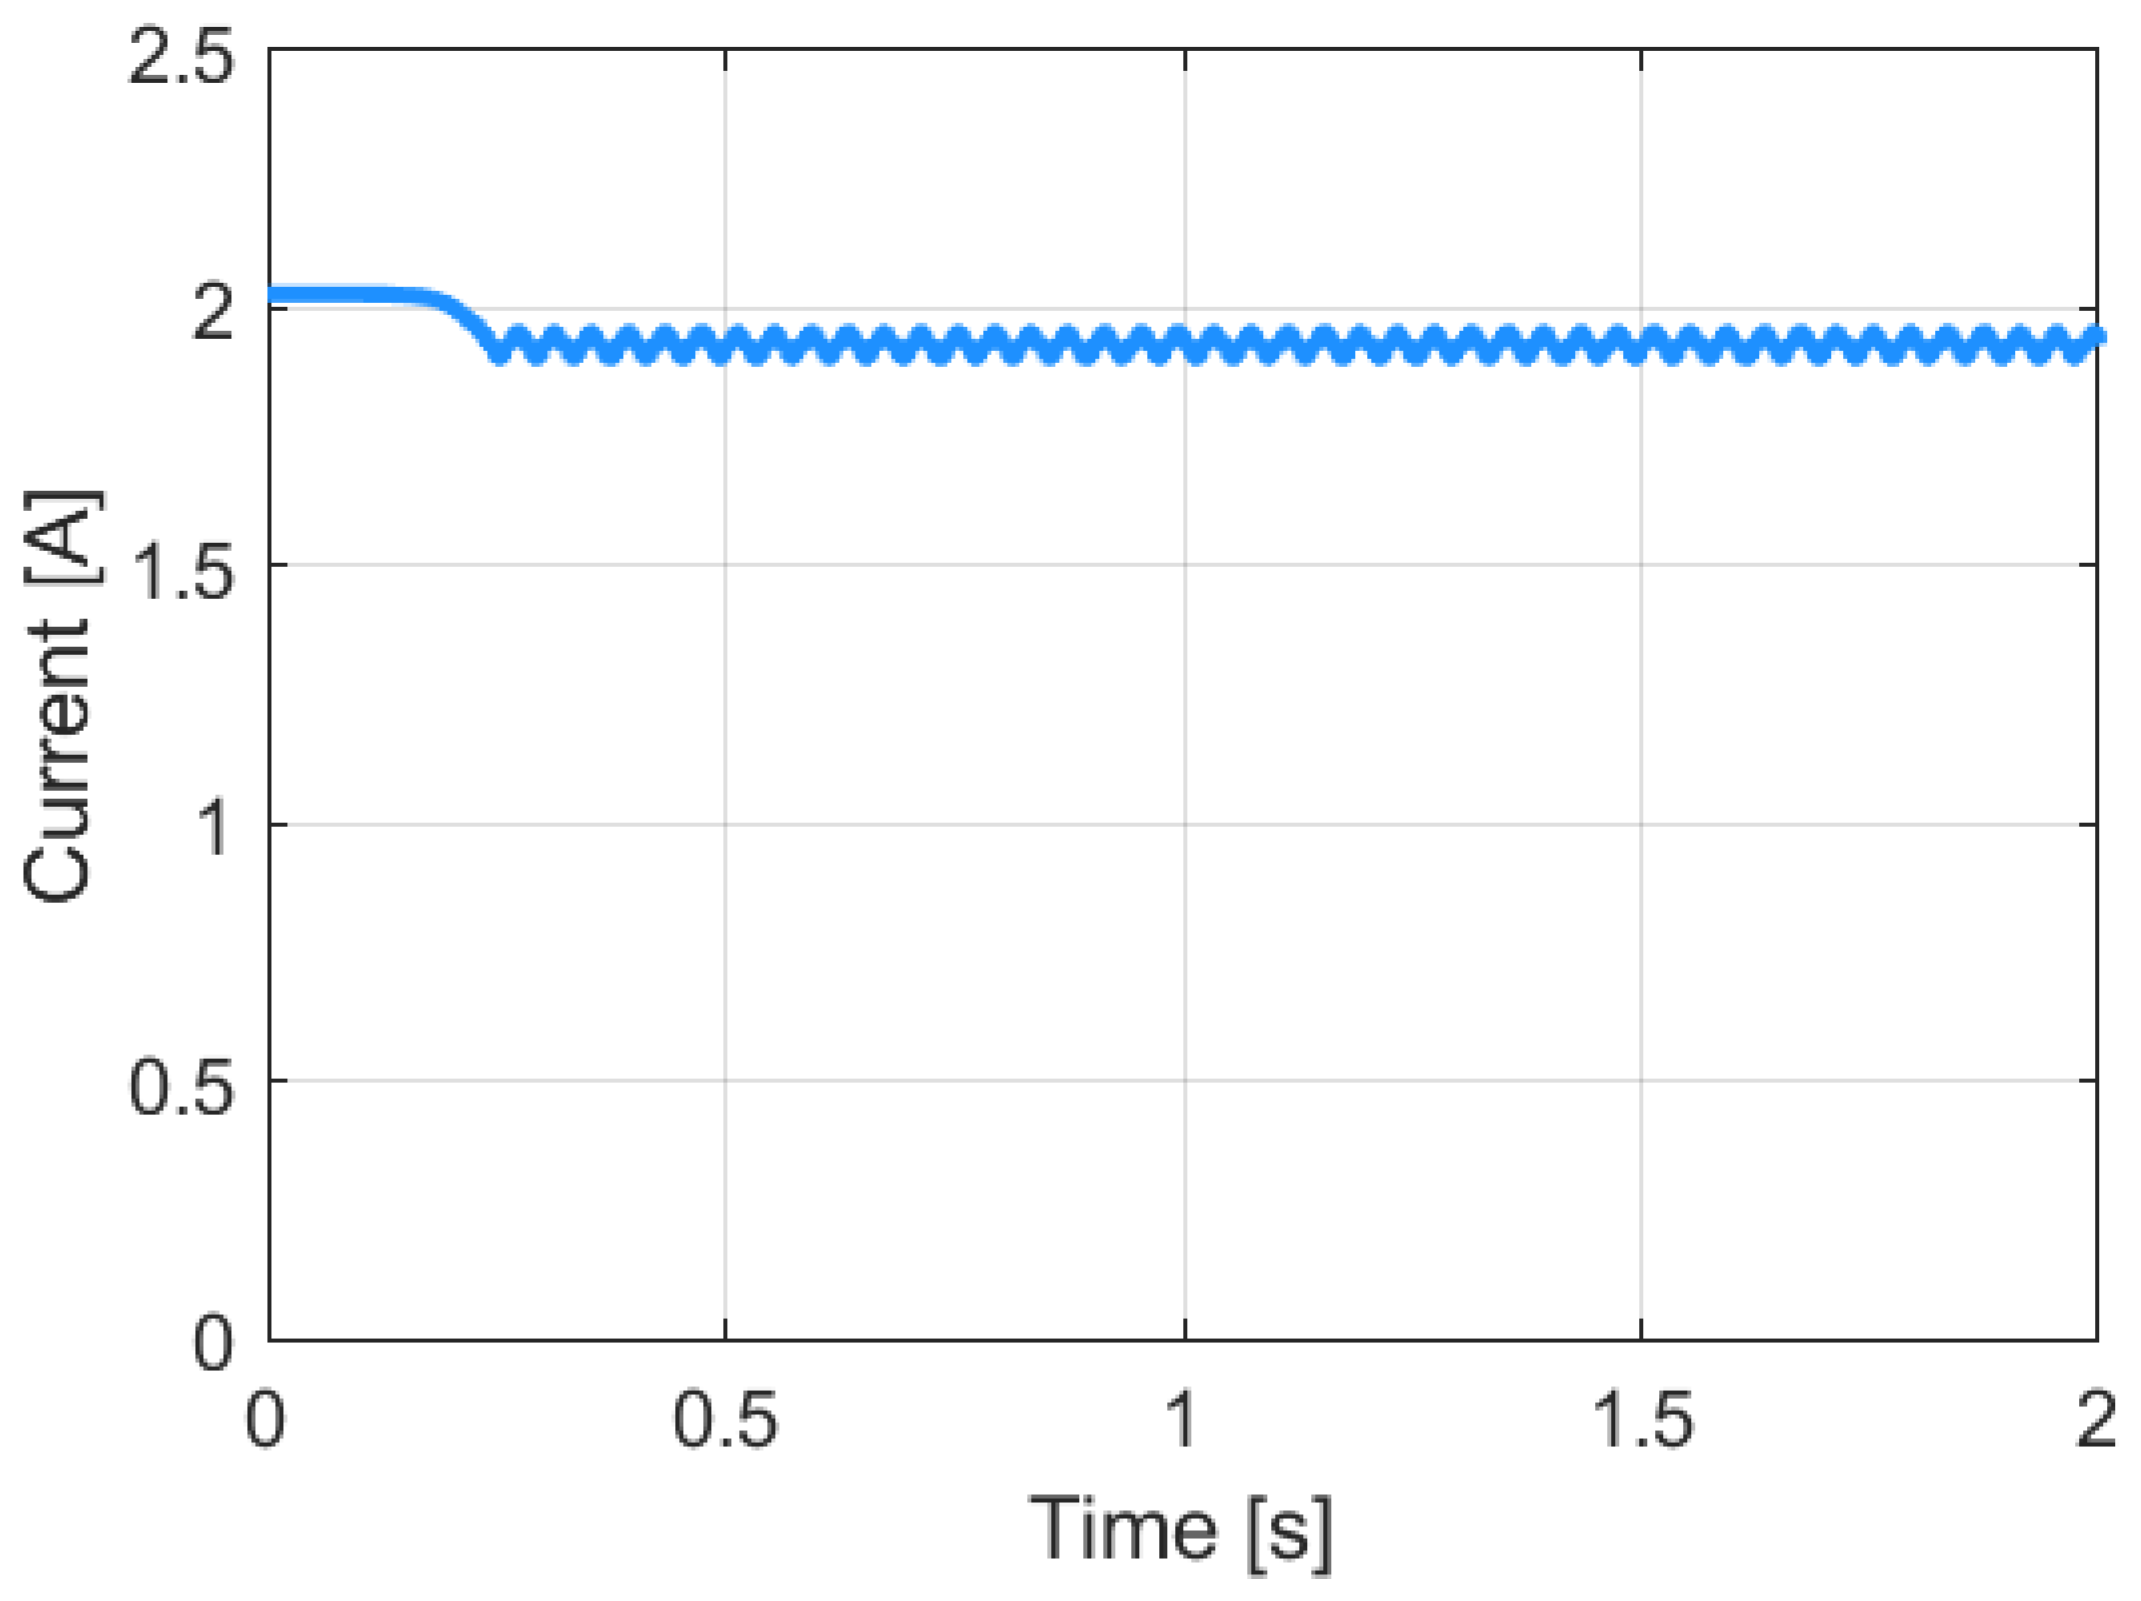
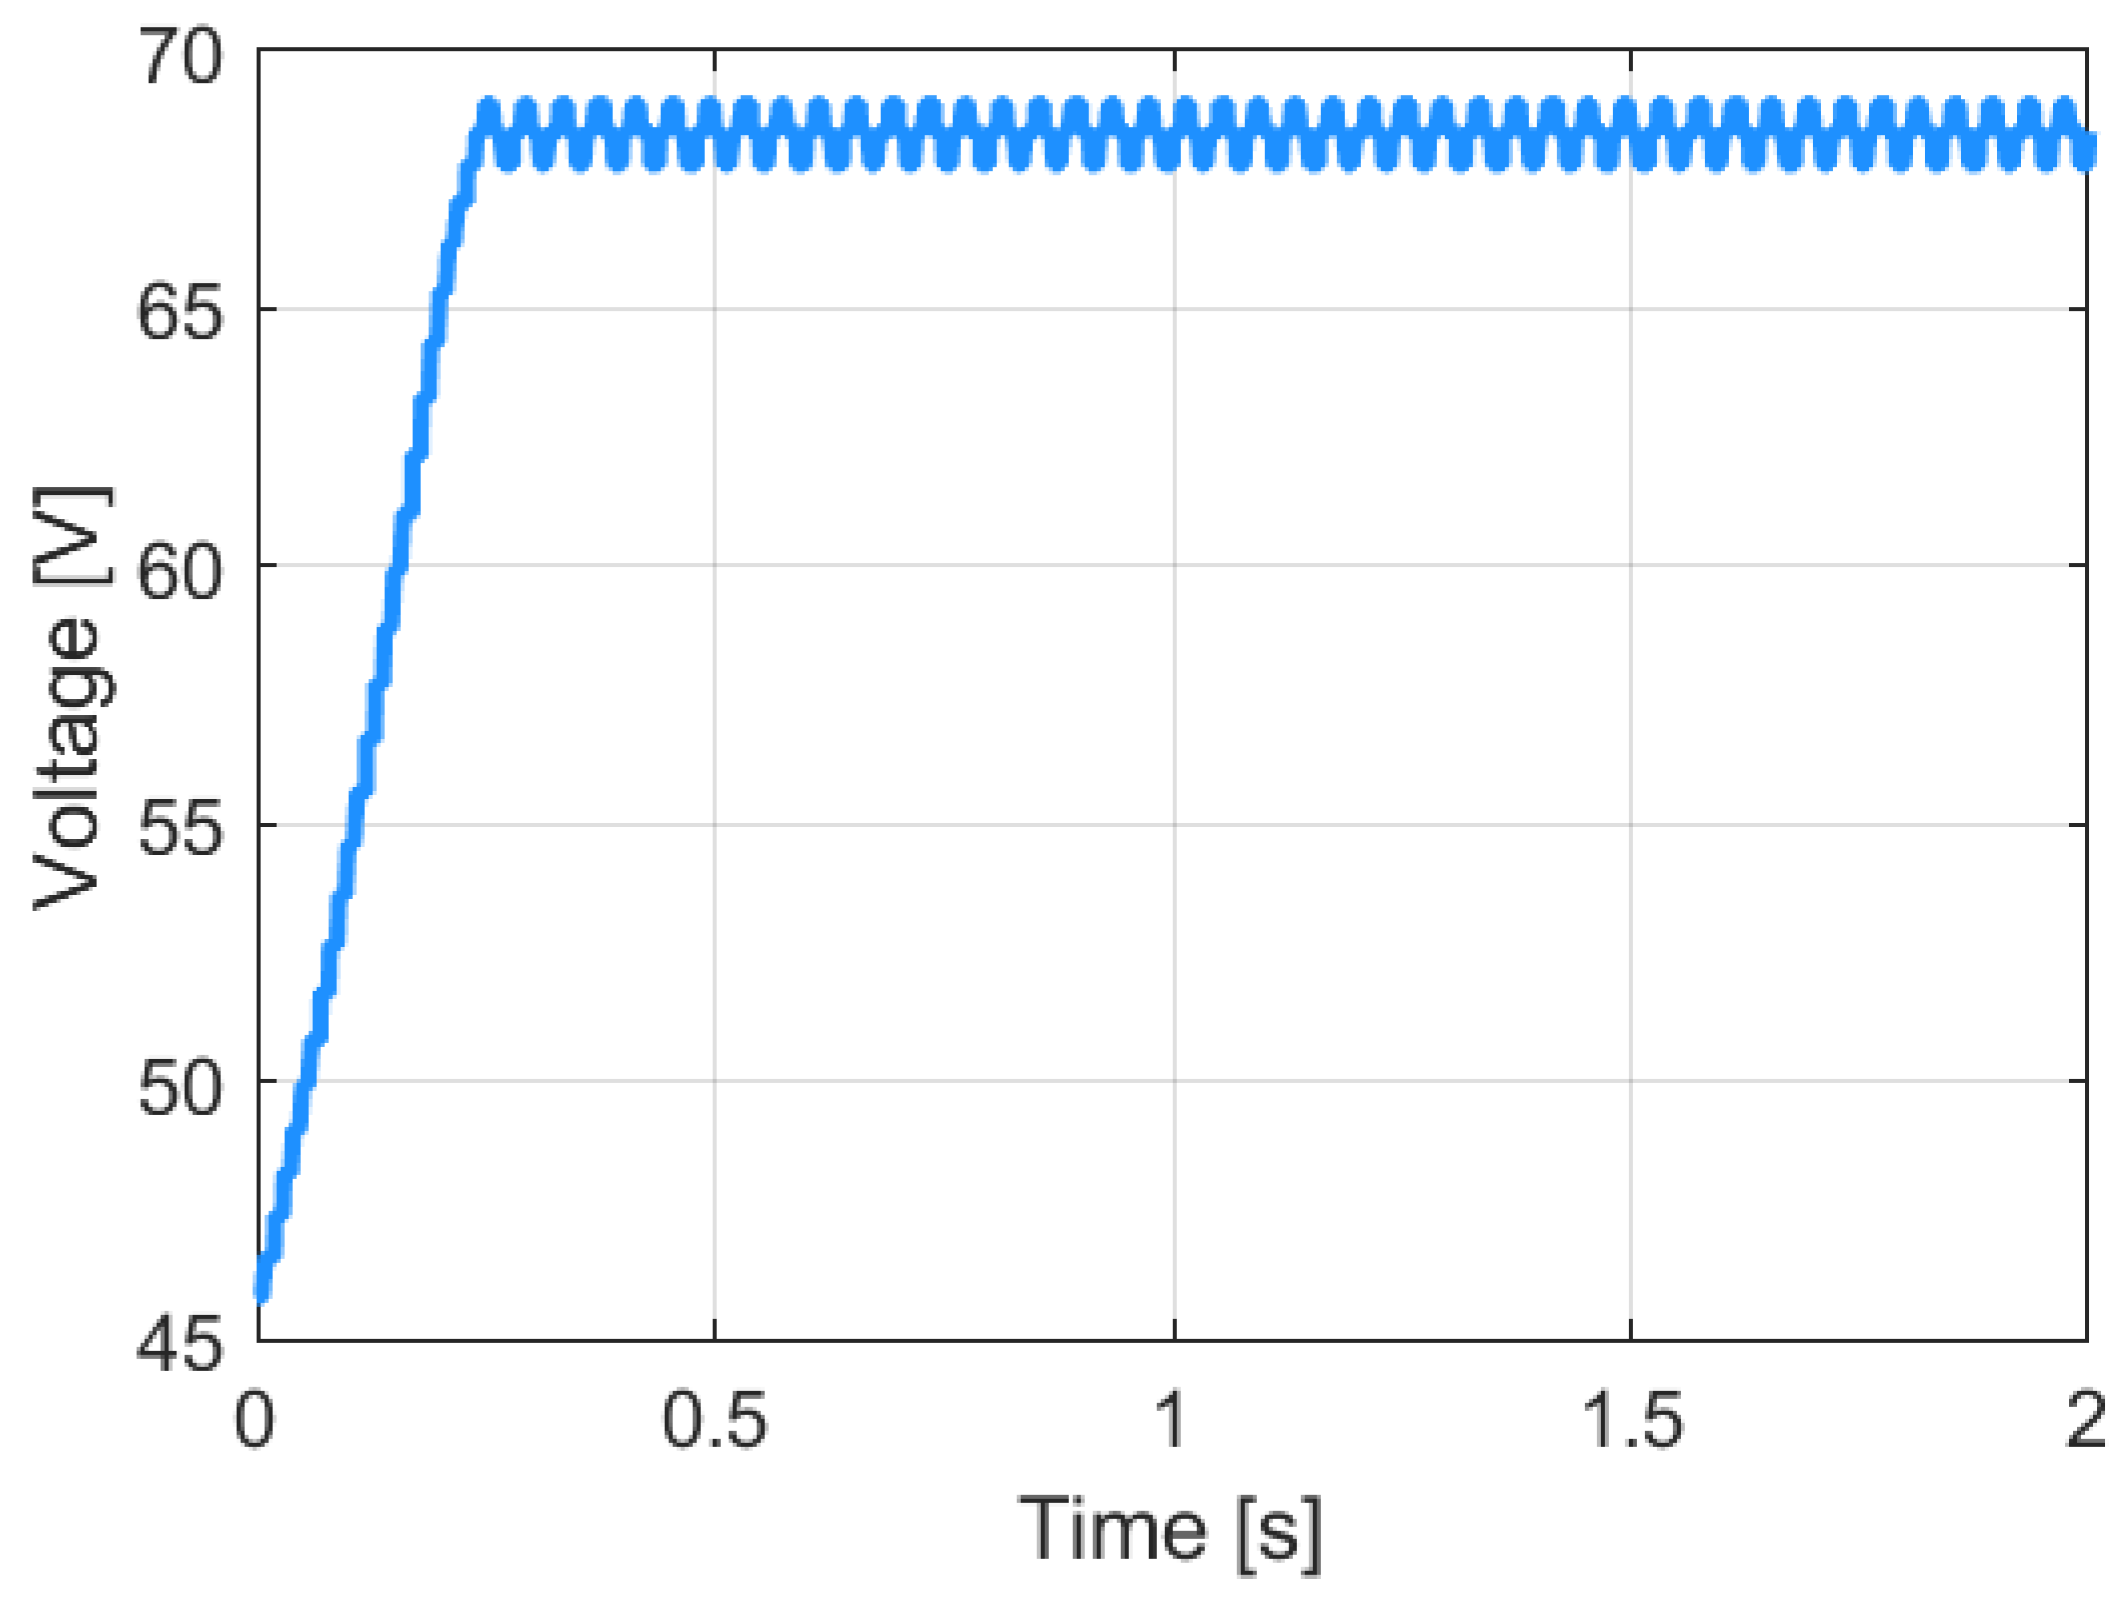
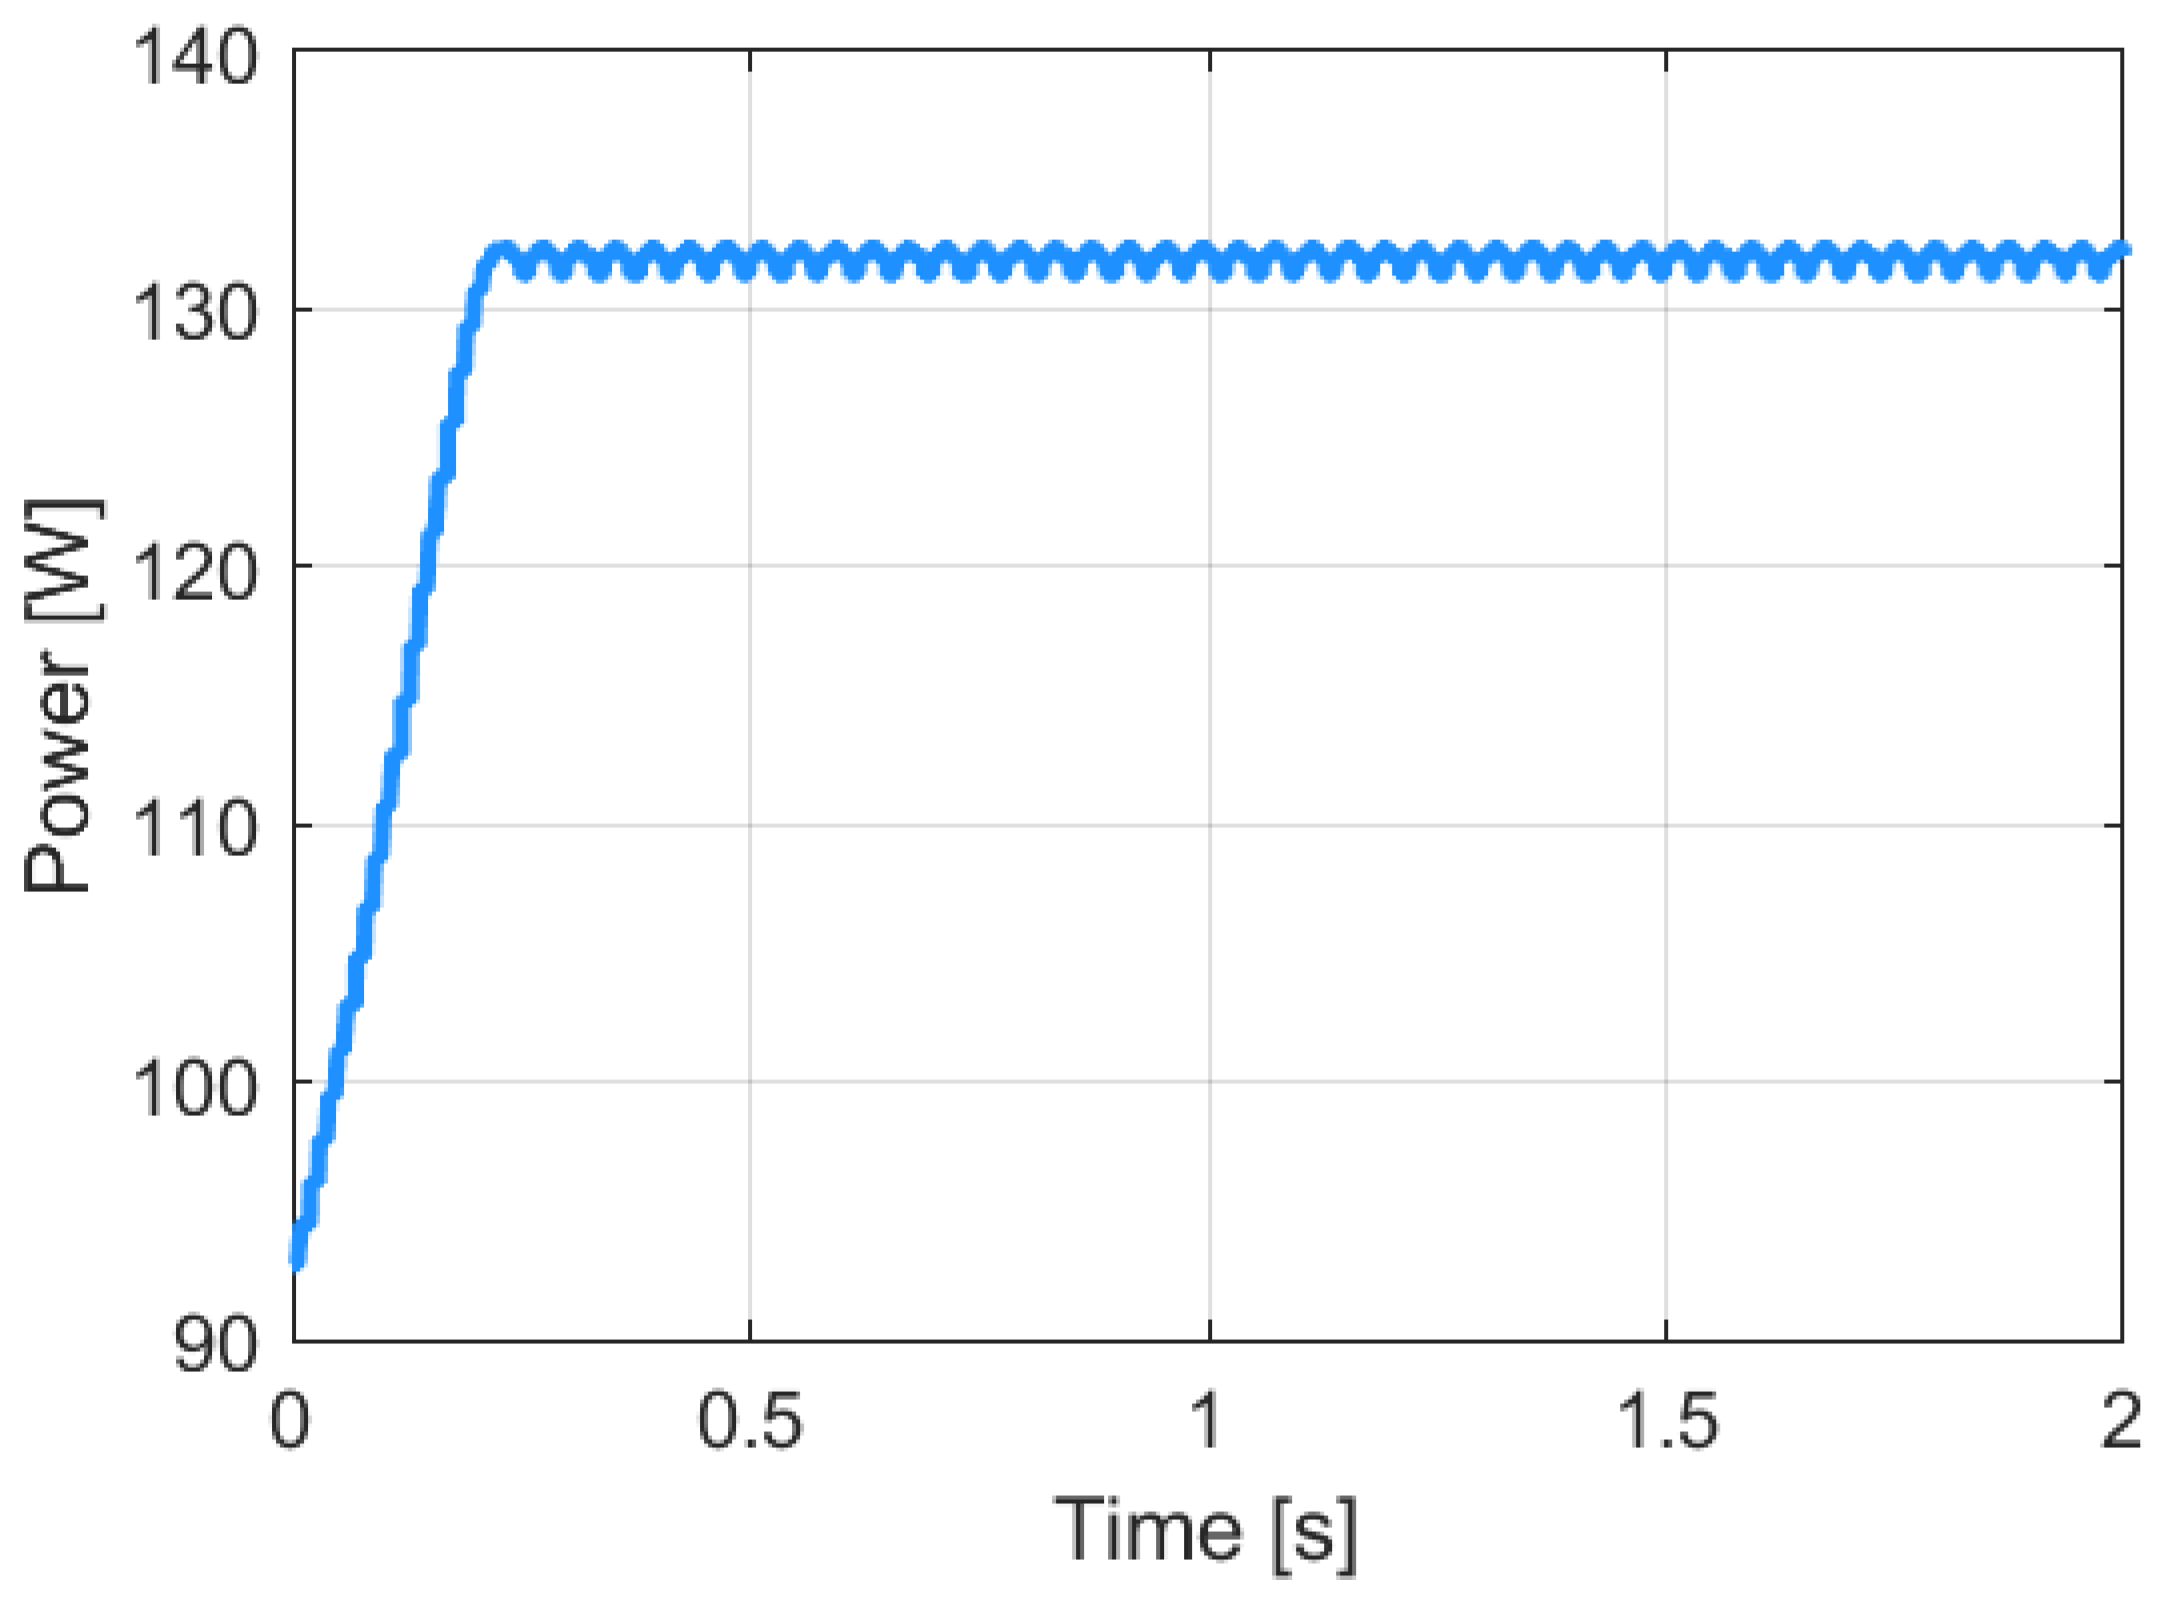
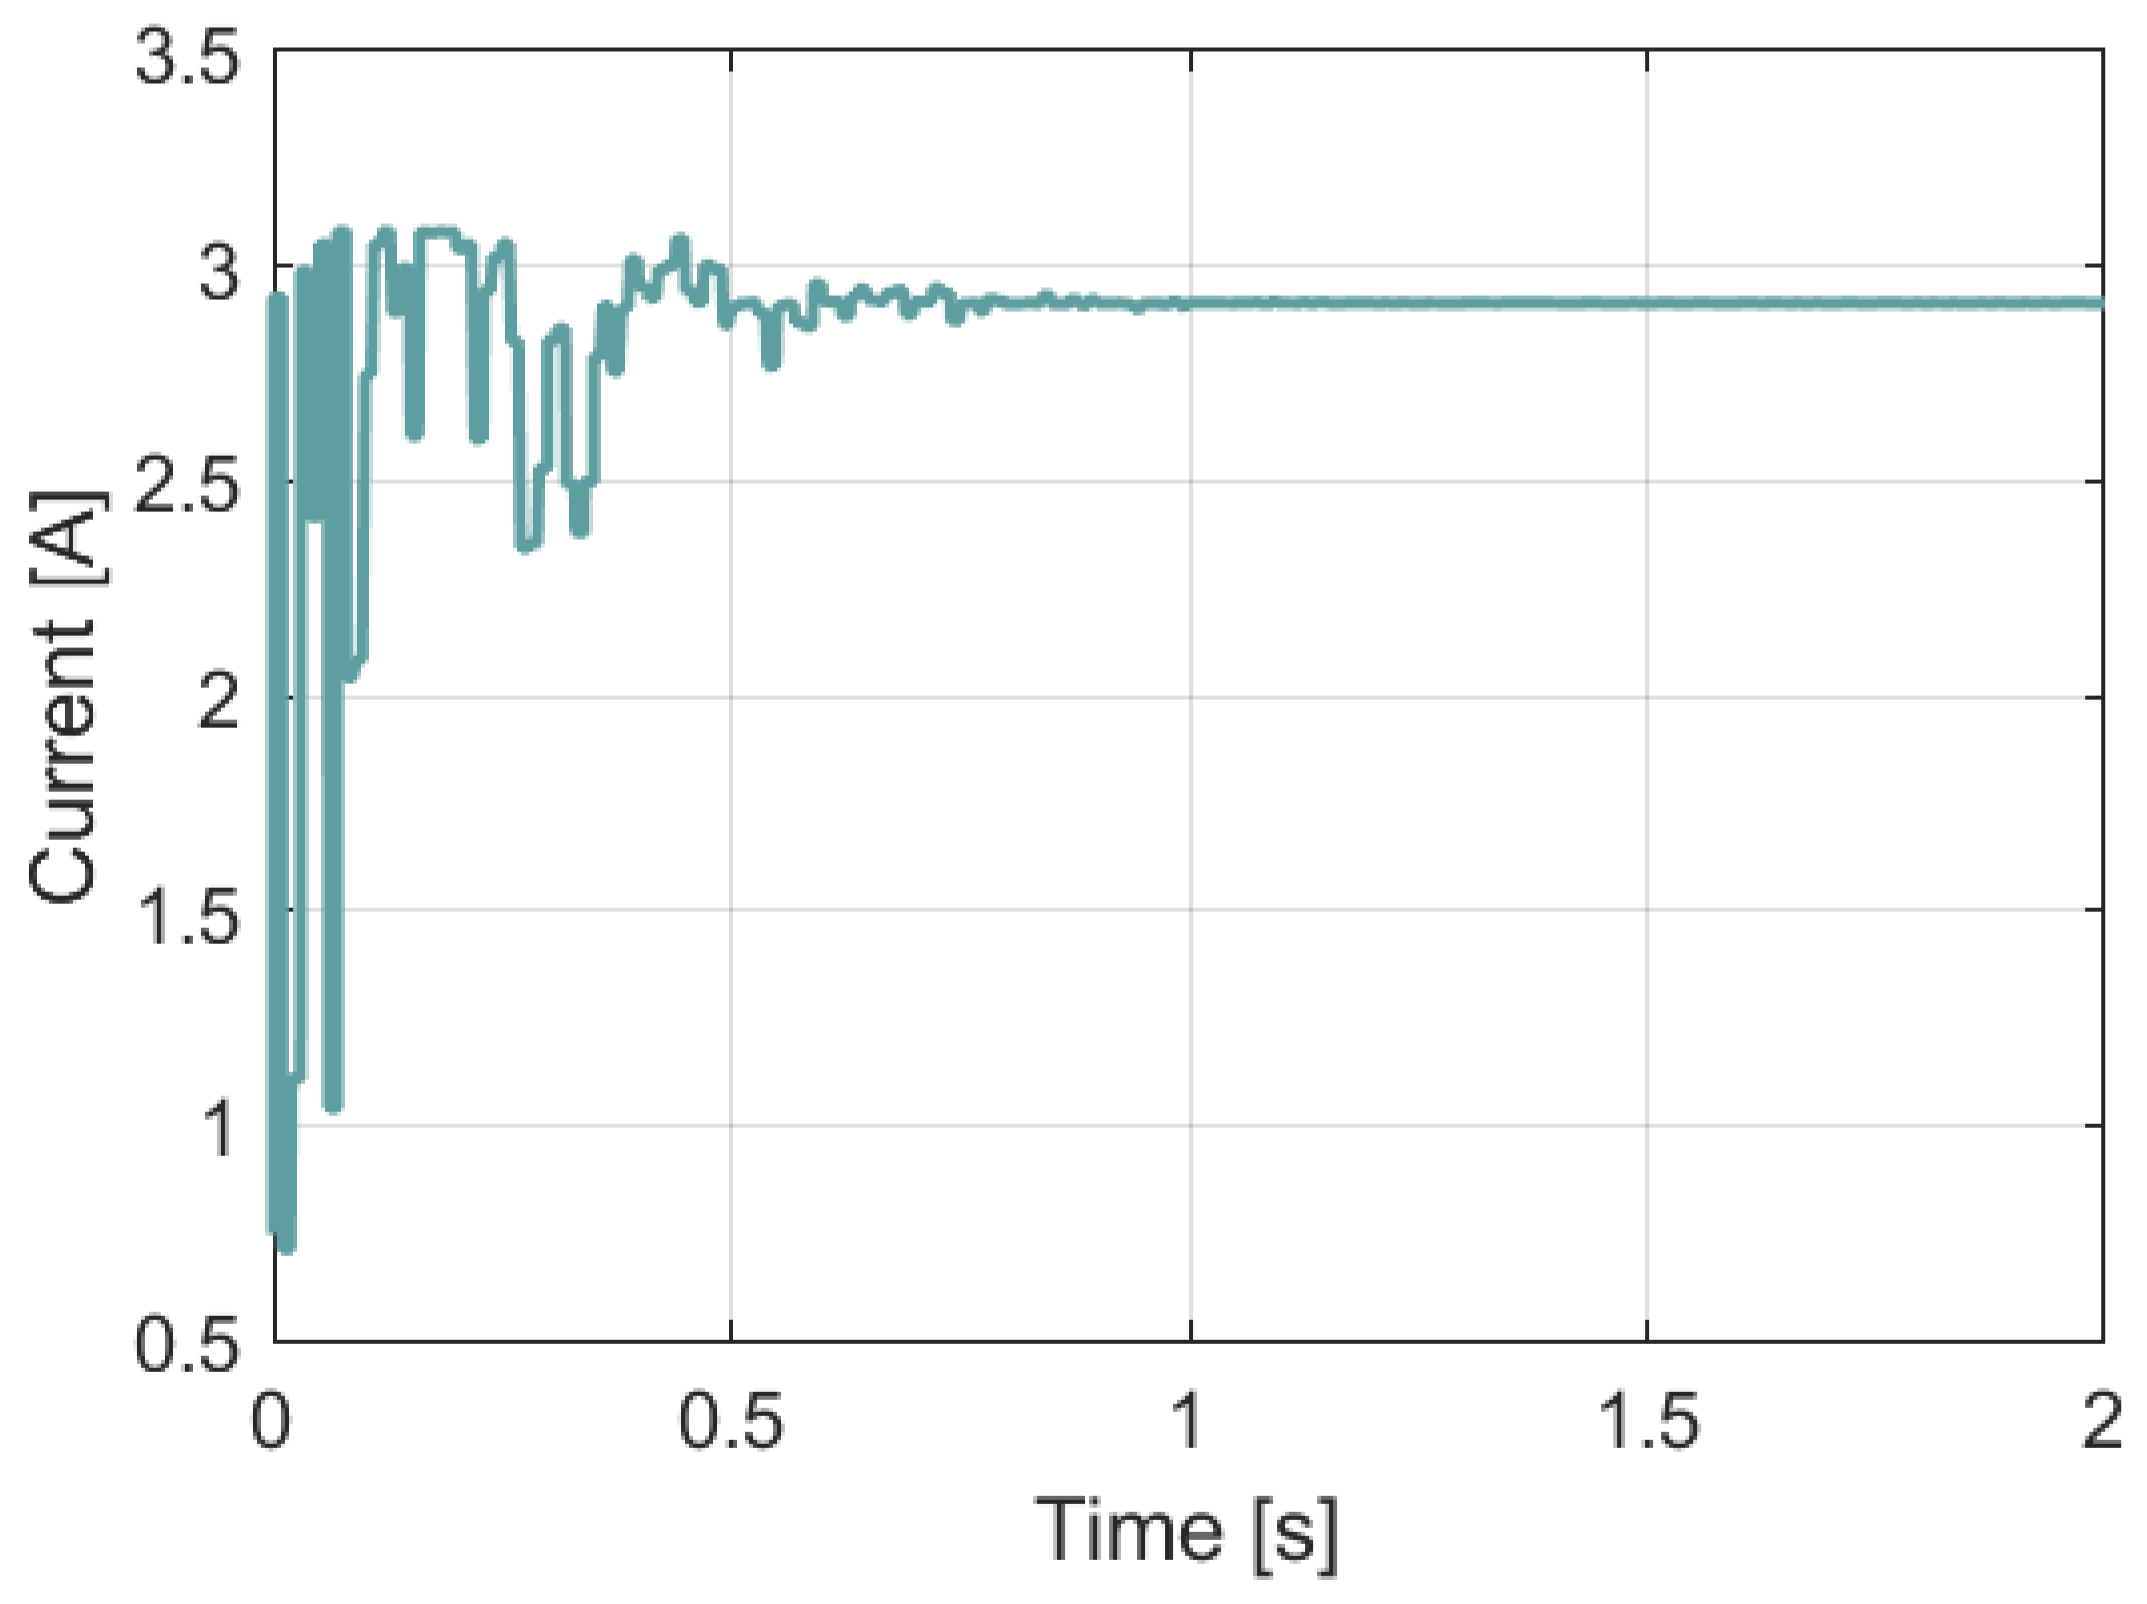
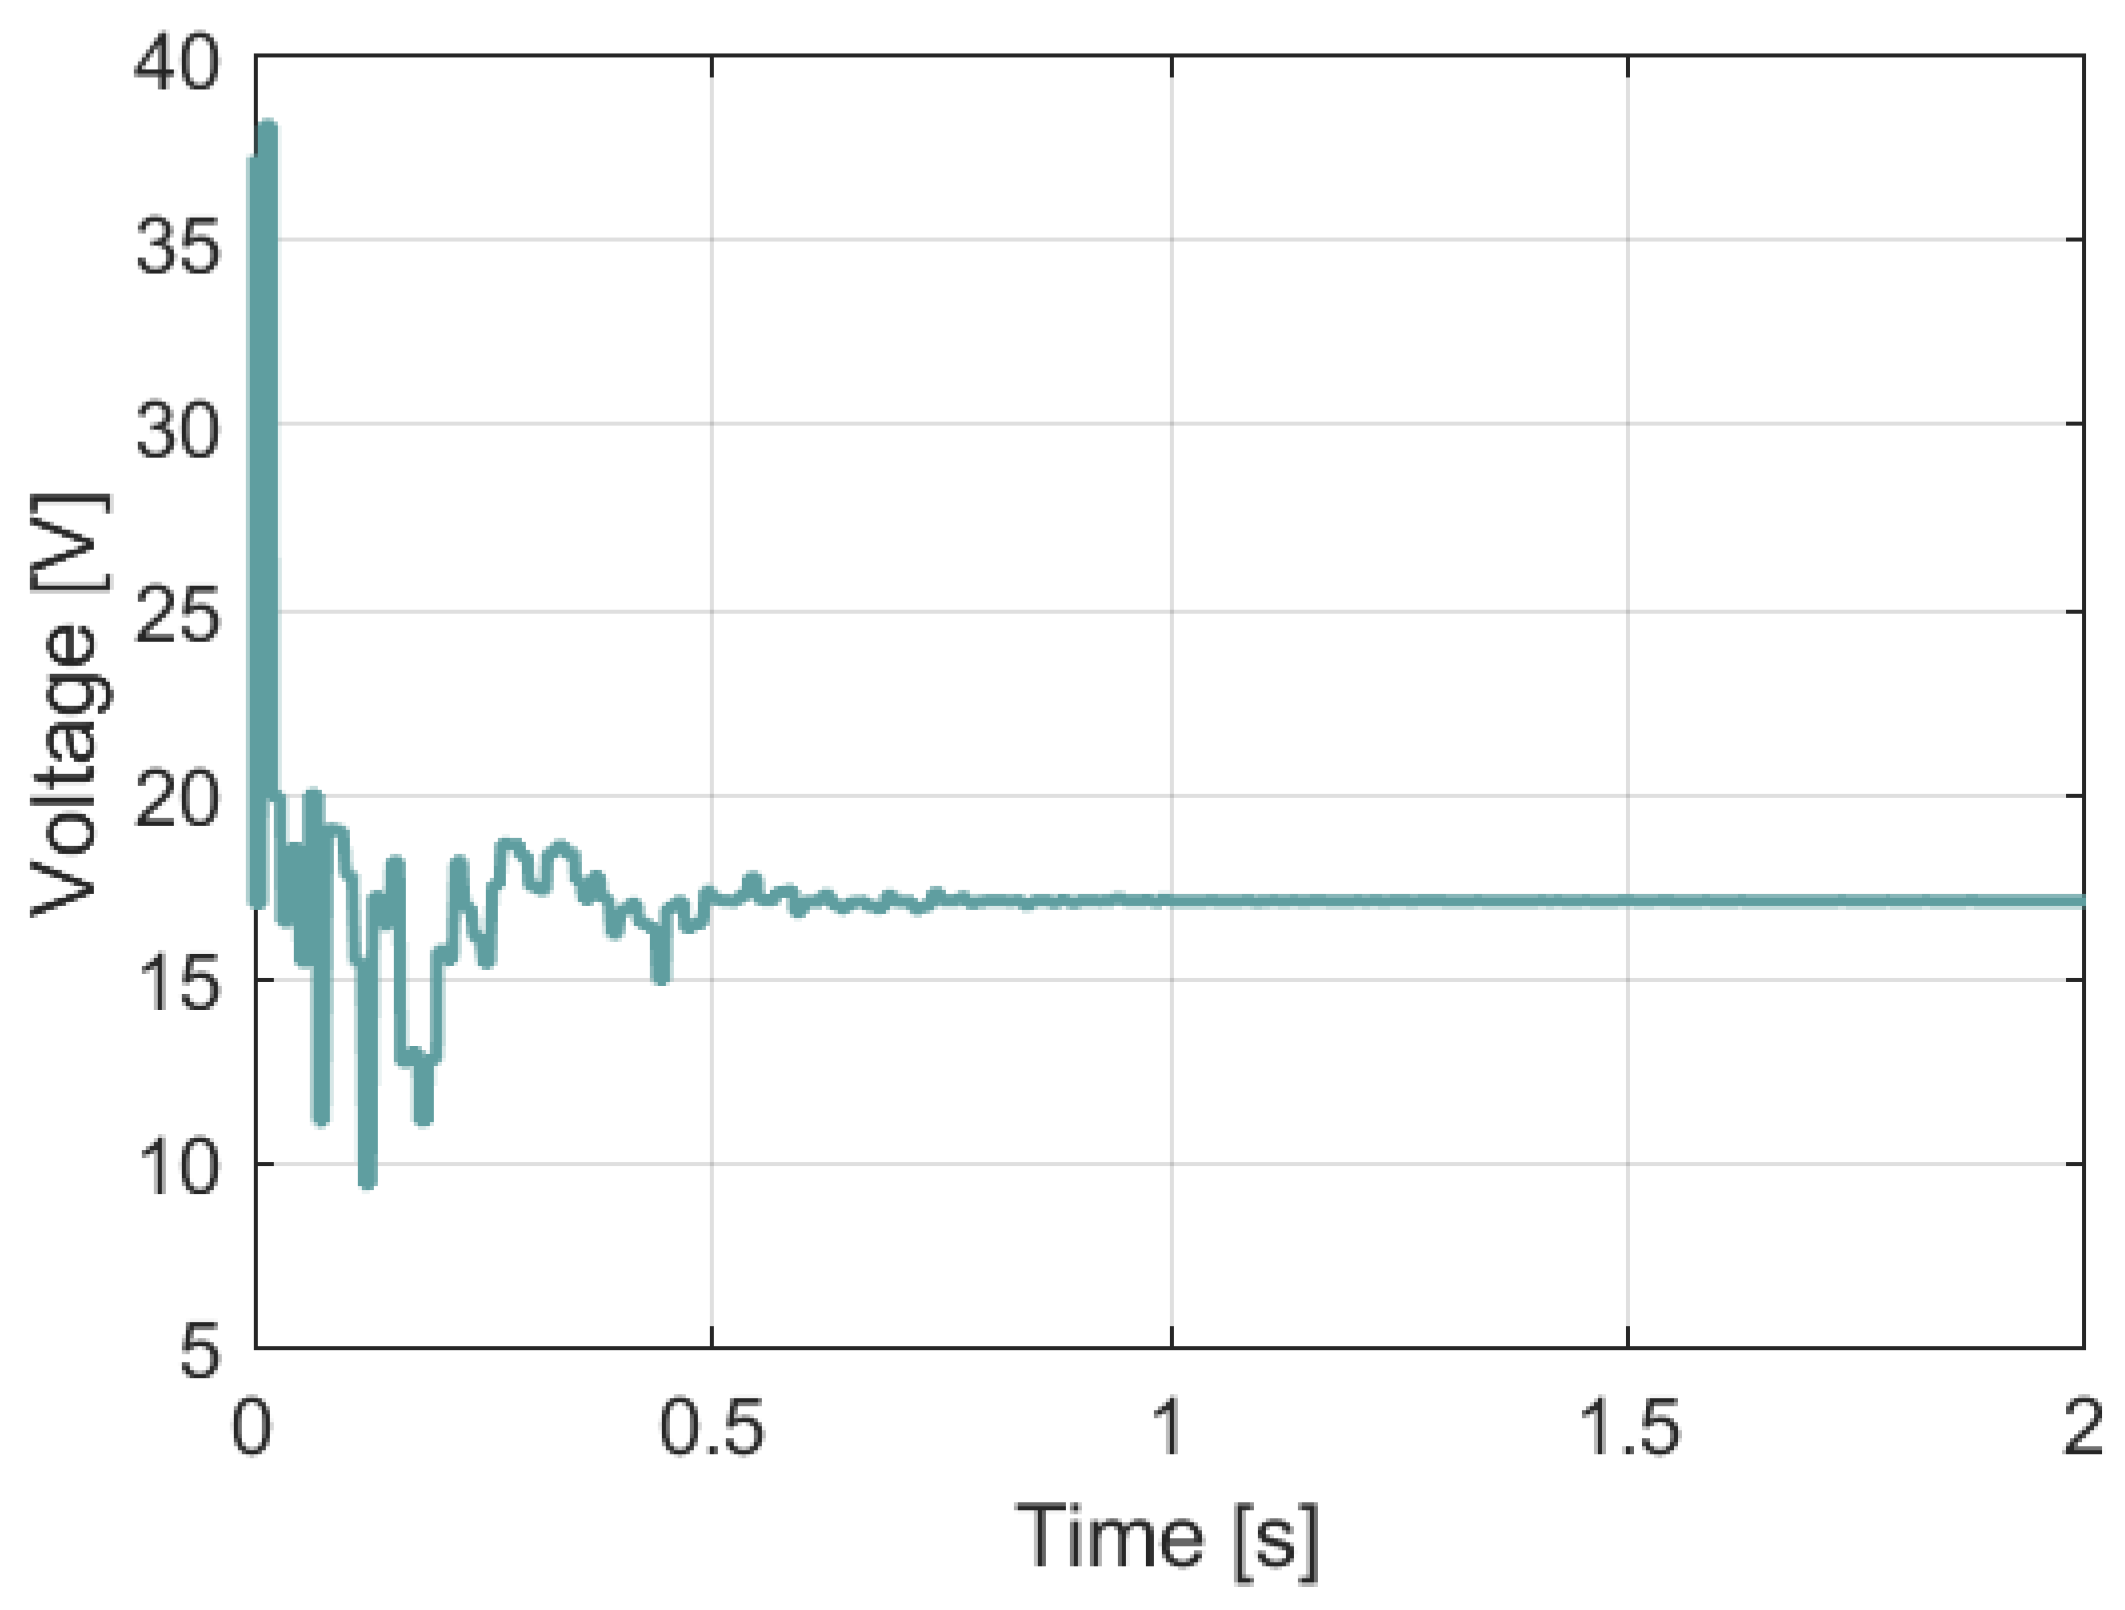
The system operation was simulated, and the current, voltage, and power waveforms were obtained using the P&O and PSO algorithms. Figure 31, Figure 32 and Figure 33 present the time-domain plots of current, voltage, and power obtained with the P&O algorithm, with the perturbation parameter set to x = 0.0025.
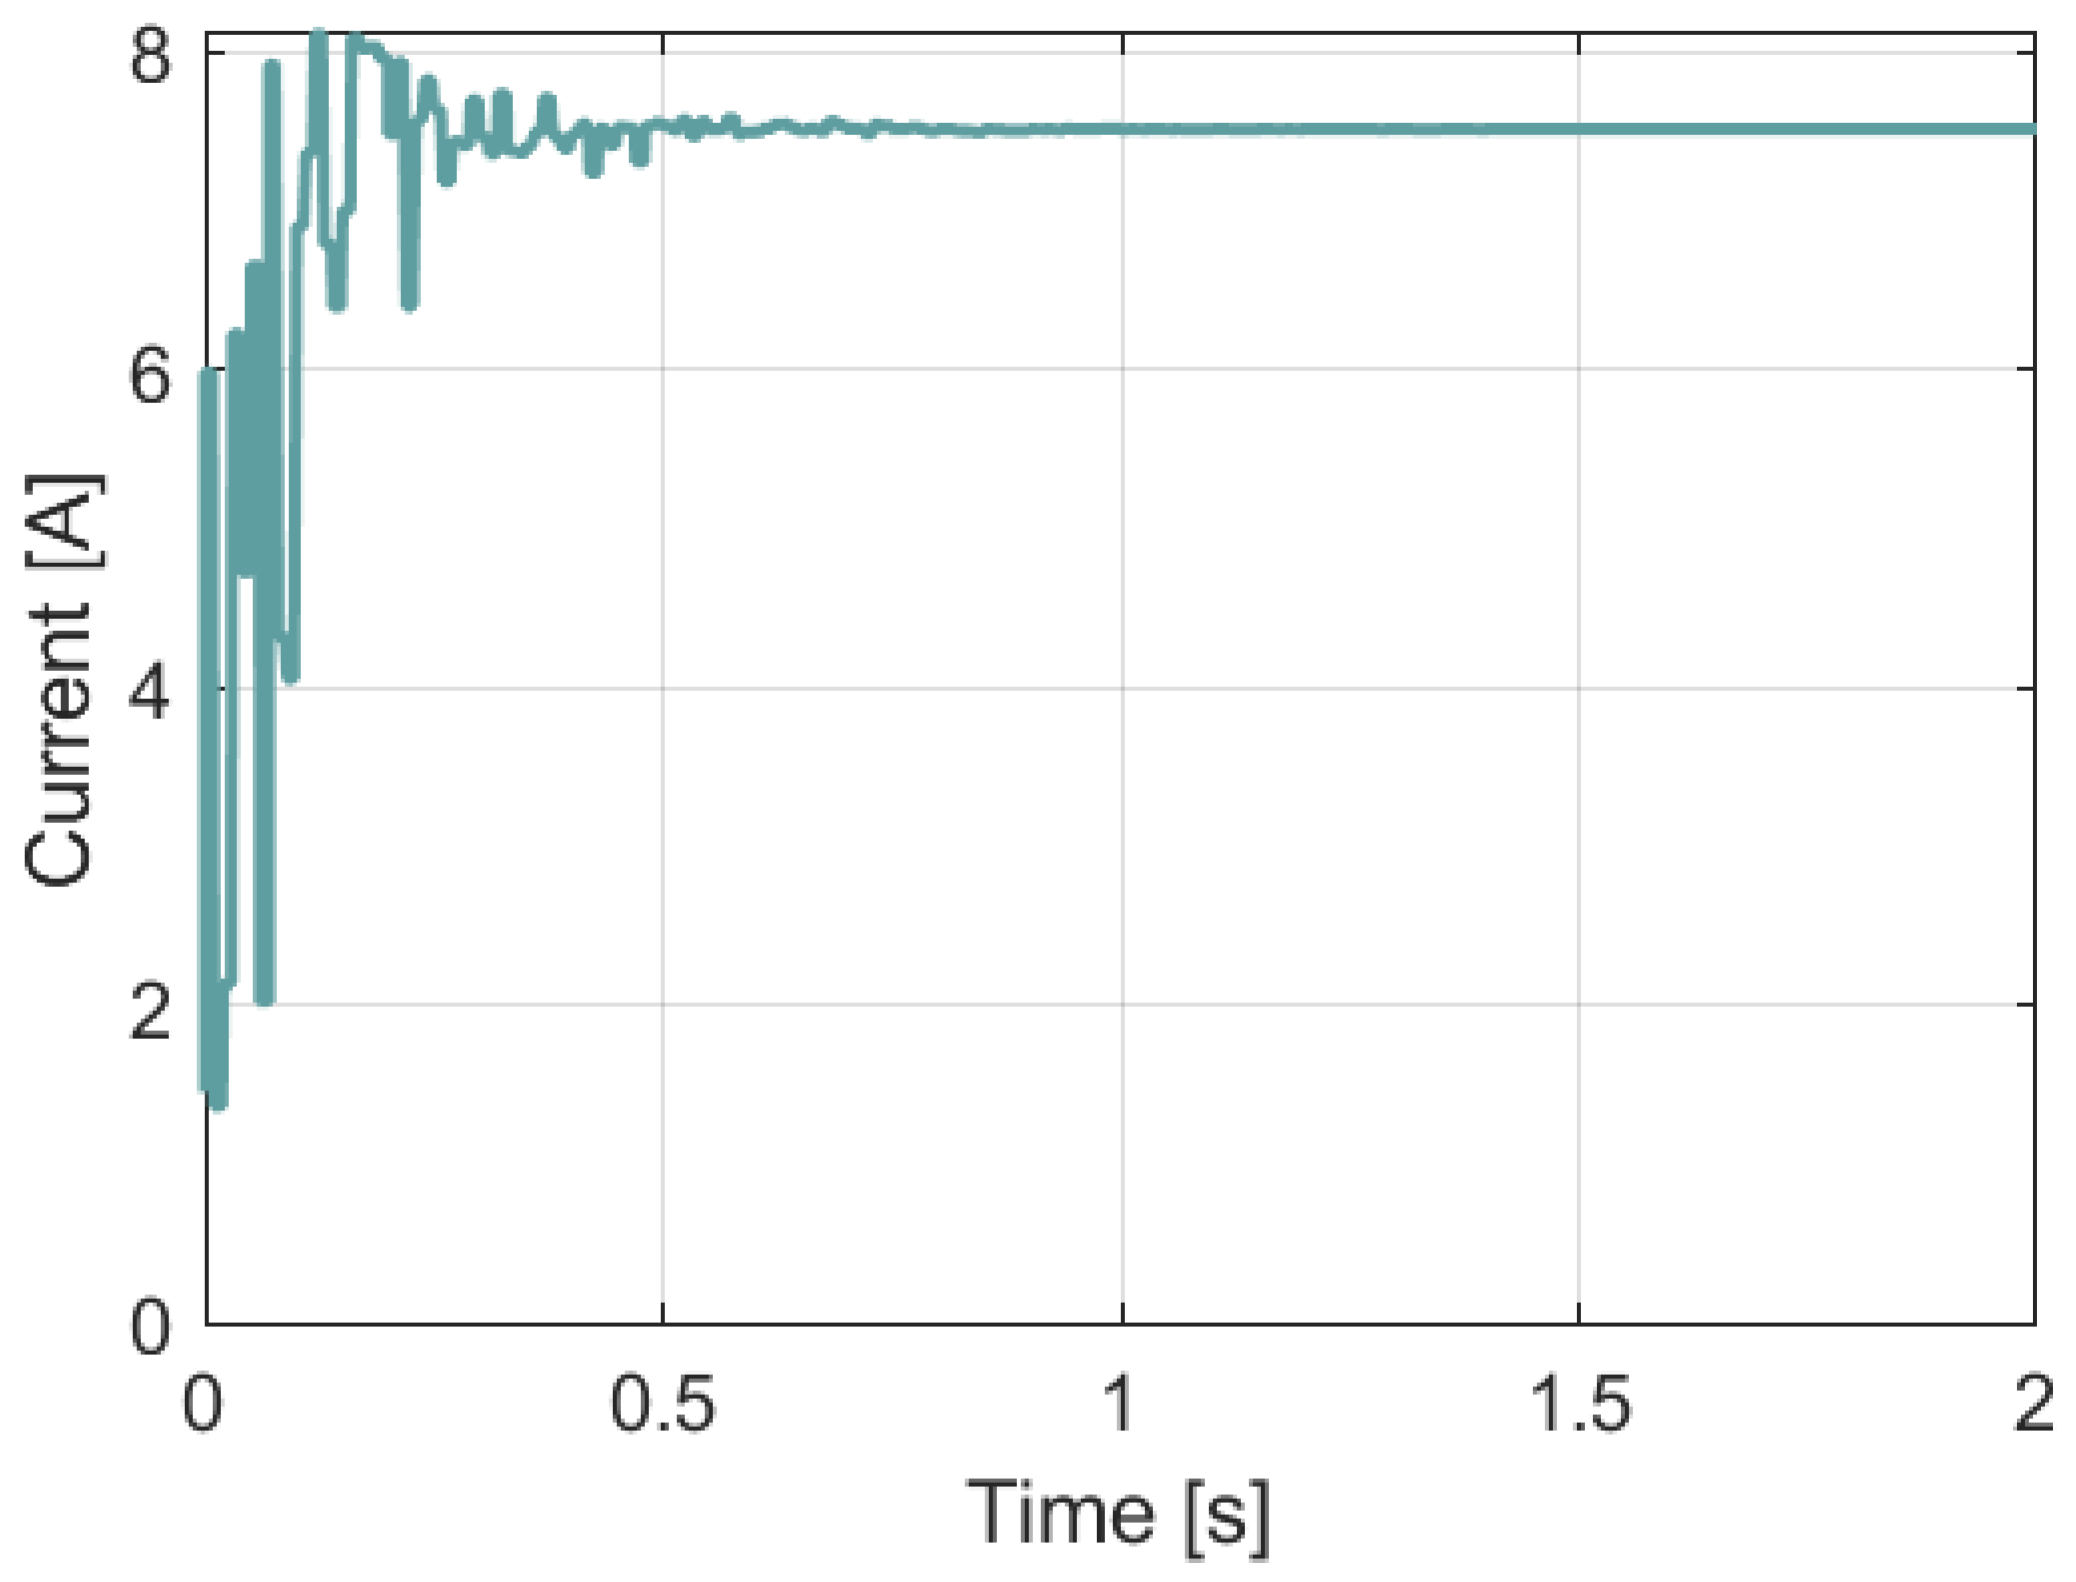
As shown in Figure 32 and Figure 33, the power stabilises at the LMPP at a voltage of approximately 68 V, in accordance with the power–voltage characteristic P = f ( U ) of the system shown in Figure 30. This indicates that the P&O algorithm fails to correctly track the maximum power point under partial shading conditions. Figure 34, Figure 35 and Figure 36 show the time-domain plots of current, voltage, and power obtained using the PSO algorithm, with parameters as specified in Table 2.
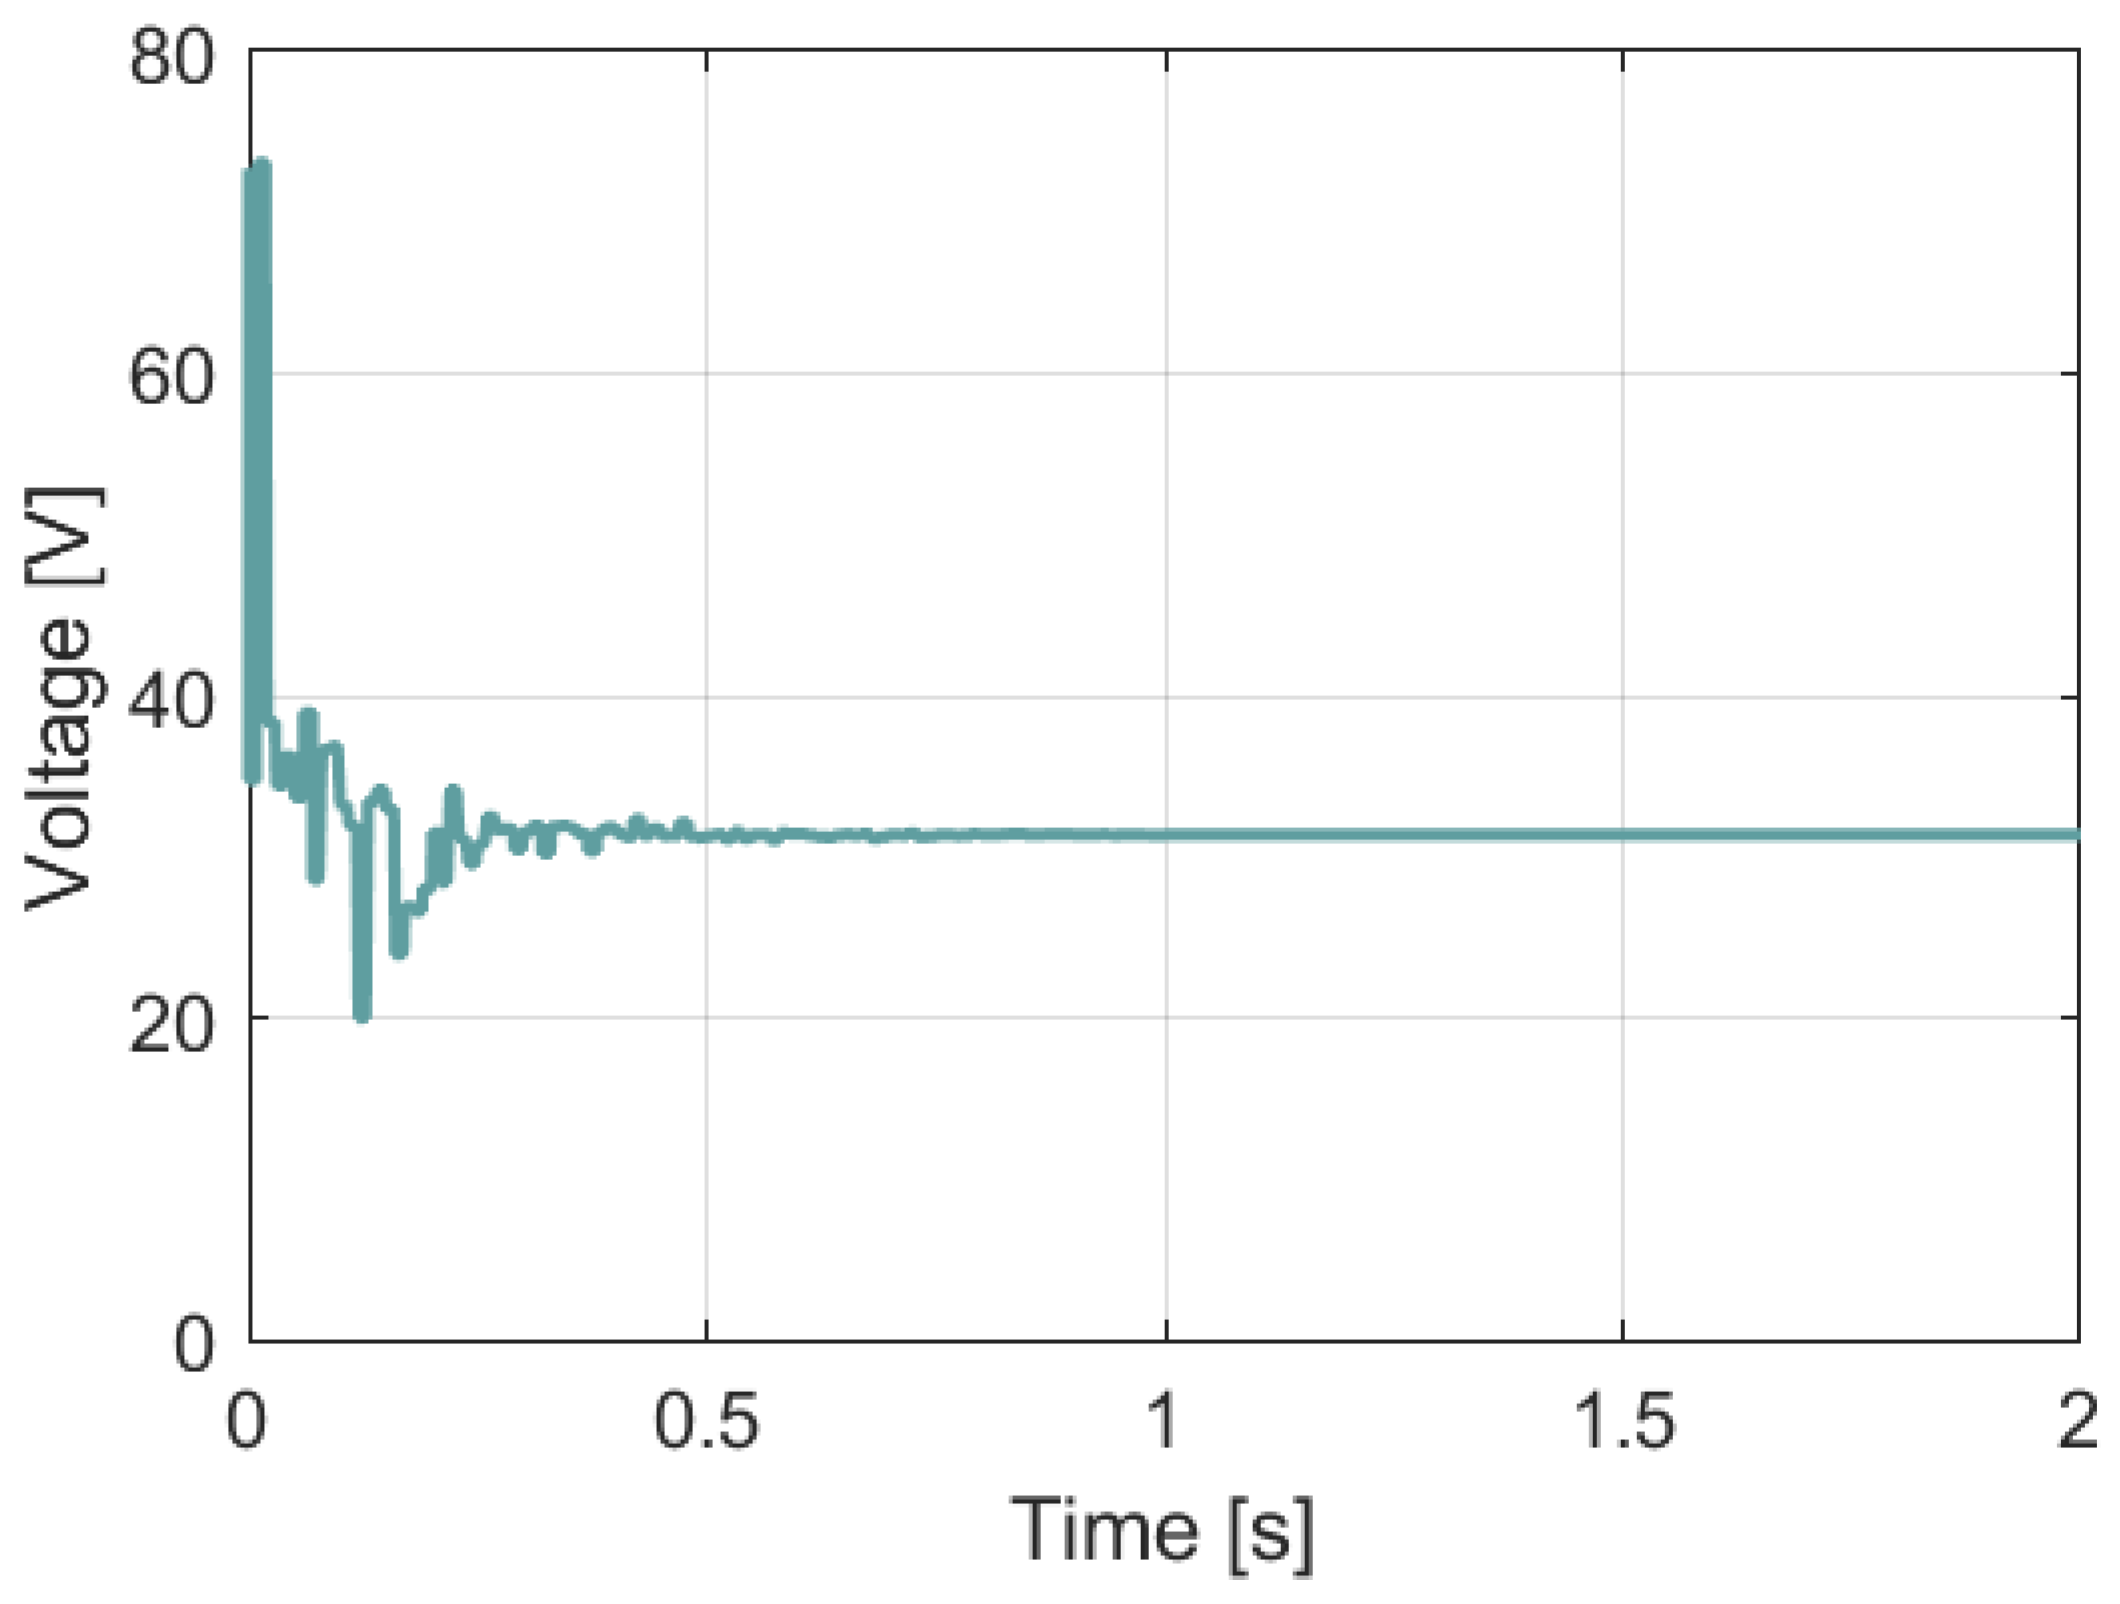
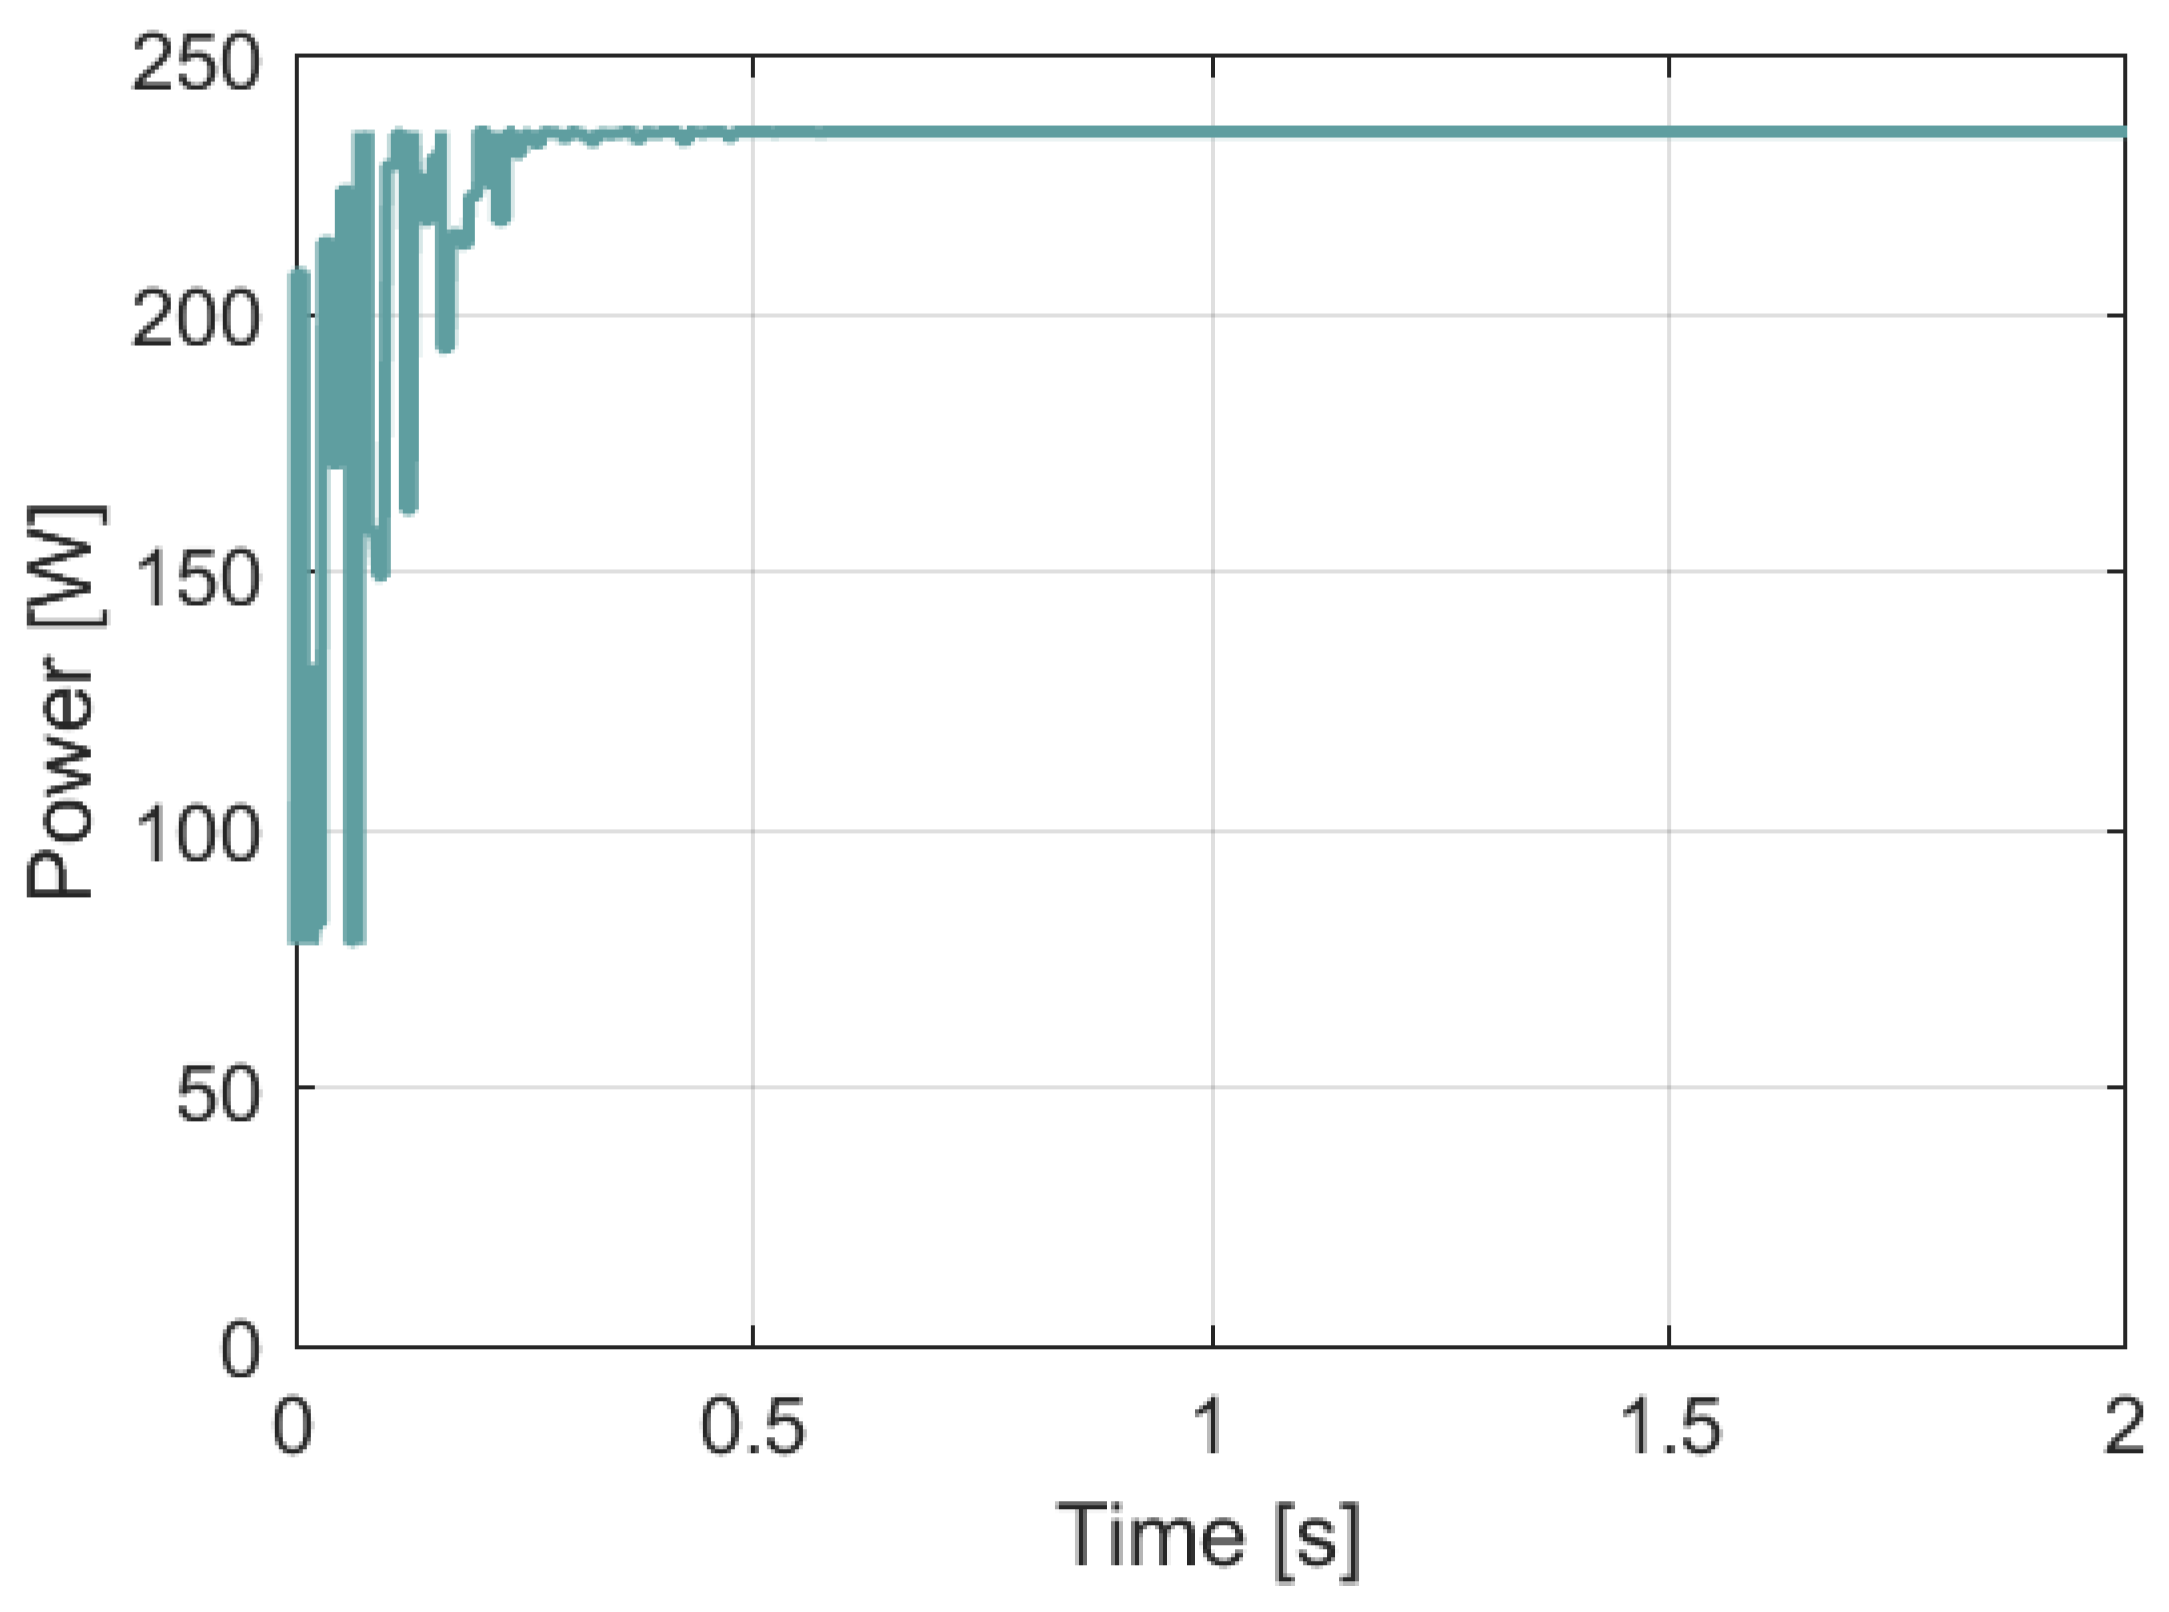
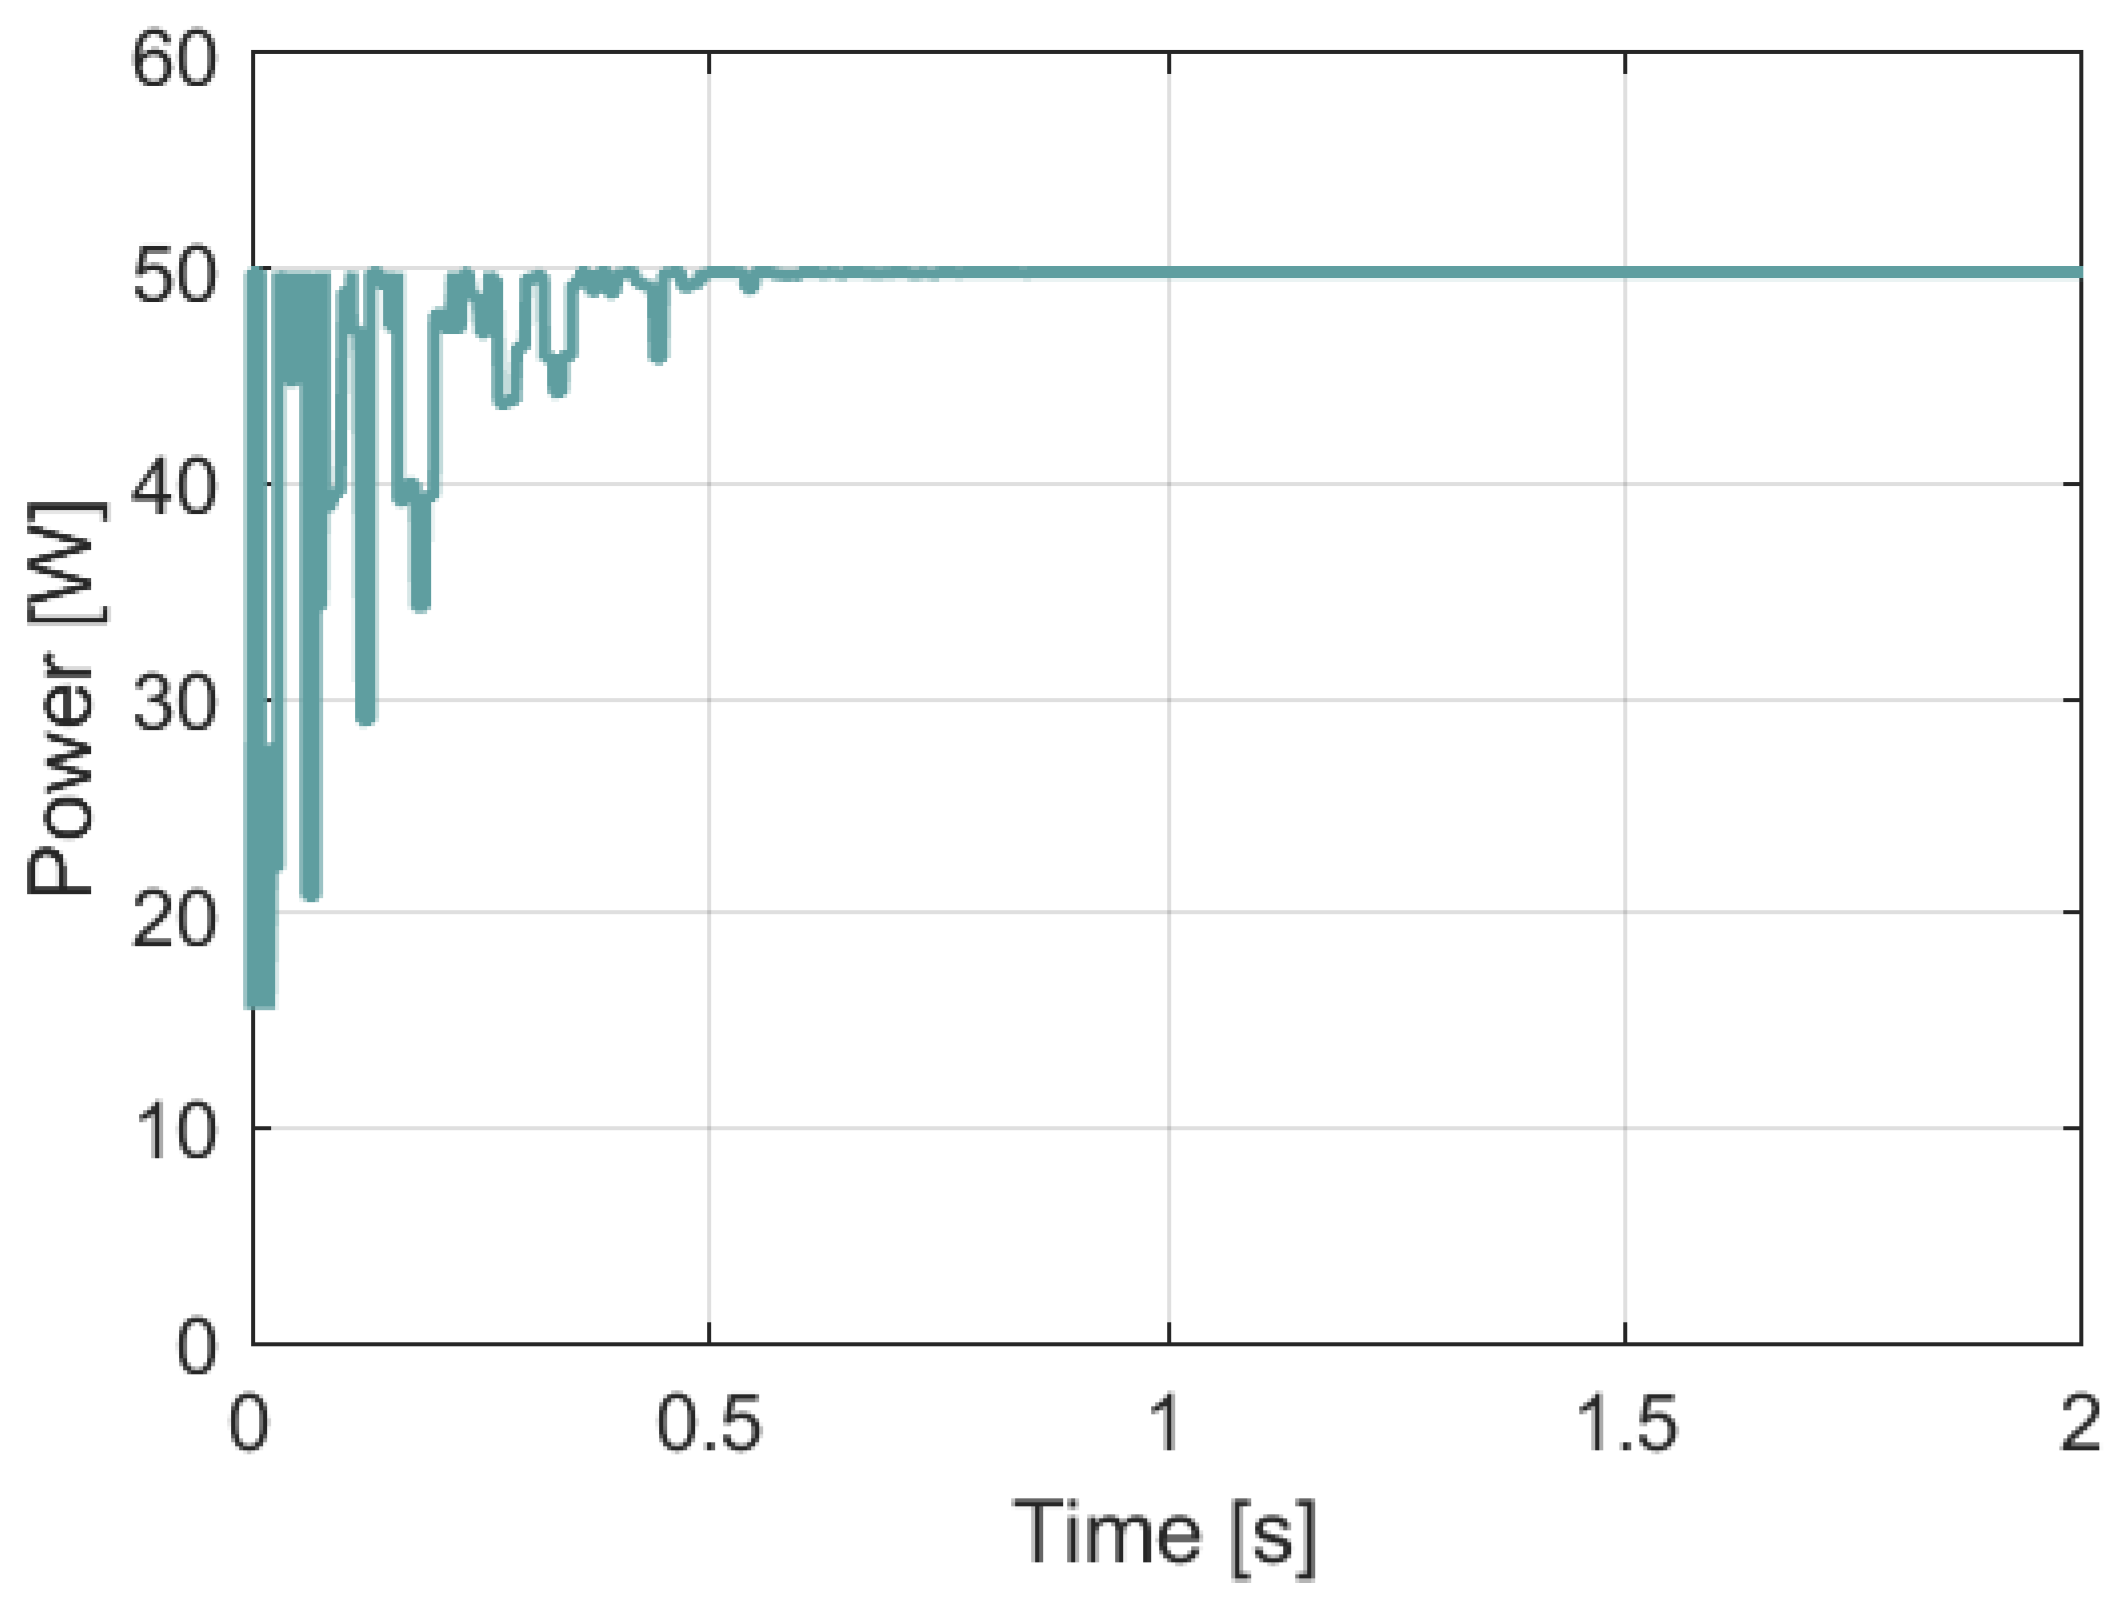
As shown in Figure 35 and Figure 36, the power stabilises at the GMPP at a voltage of approximately 32 V, in accordance with the power–voltage characteristic P = f ( U ) of the system shown in Figure 30. This indicates that the PSO algorithm correctly tracks the maximum power point under partial shading conditions.
Moreover, a comparative analysis of the time-domain plots in Figure 31, Figure 32, Figure 33, Figure 34, Figure 35 and Figure 36 shows that the current obtained using the PSO algorithm is approximately four times higher than that obtained with the P&O algorithm. This corresponds to the fourfold higher irradiance (800 W/m2) on one of the panels, resulting in a proportionally higher current. At the same time, the voltage stabilises at just over half the value observed with the P&O algorithm, which is consistent with the P = f ( U ) characteristic of the system (Figure 30).
The key conclusion is that the PSO-based algorithm effectively “locates” the global maximum power point (GMPP), which stabilises at approximately 235 W in this case. This value matches the system GMPP shown in Figure 30 and is significantly higher than the LMPP, which is around 130 W. The stabilisation times of both algorithms are similar, although the PSO algorithm requires slightly more time to stabilise all parameters, which ensures accurate detection of the GMPP. Other parameters of the algorithms are comparable to the values presented in Table 3.
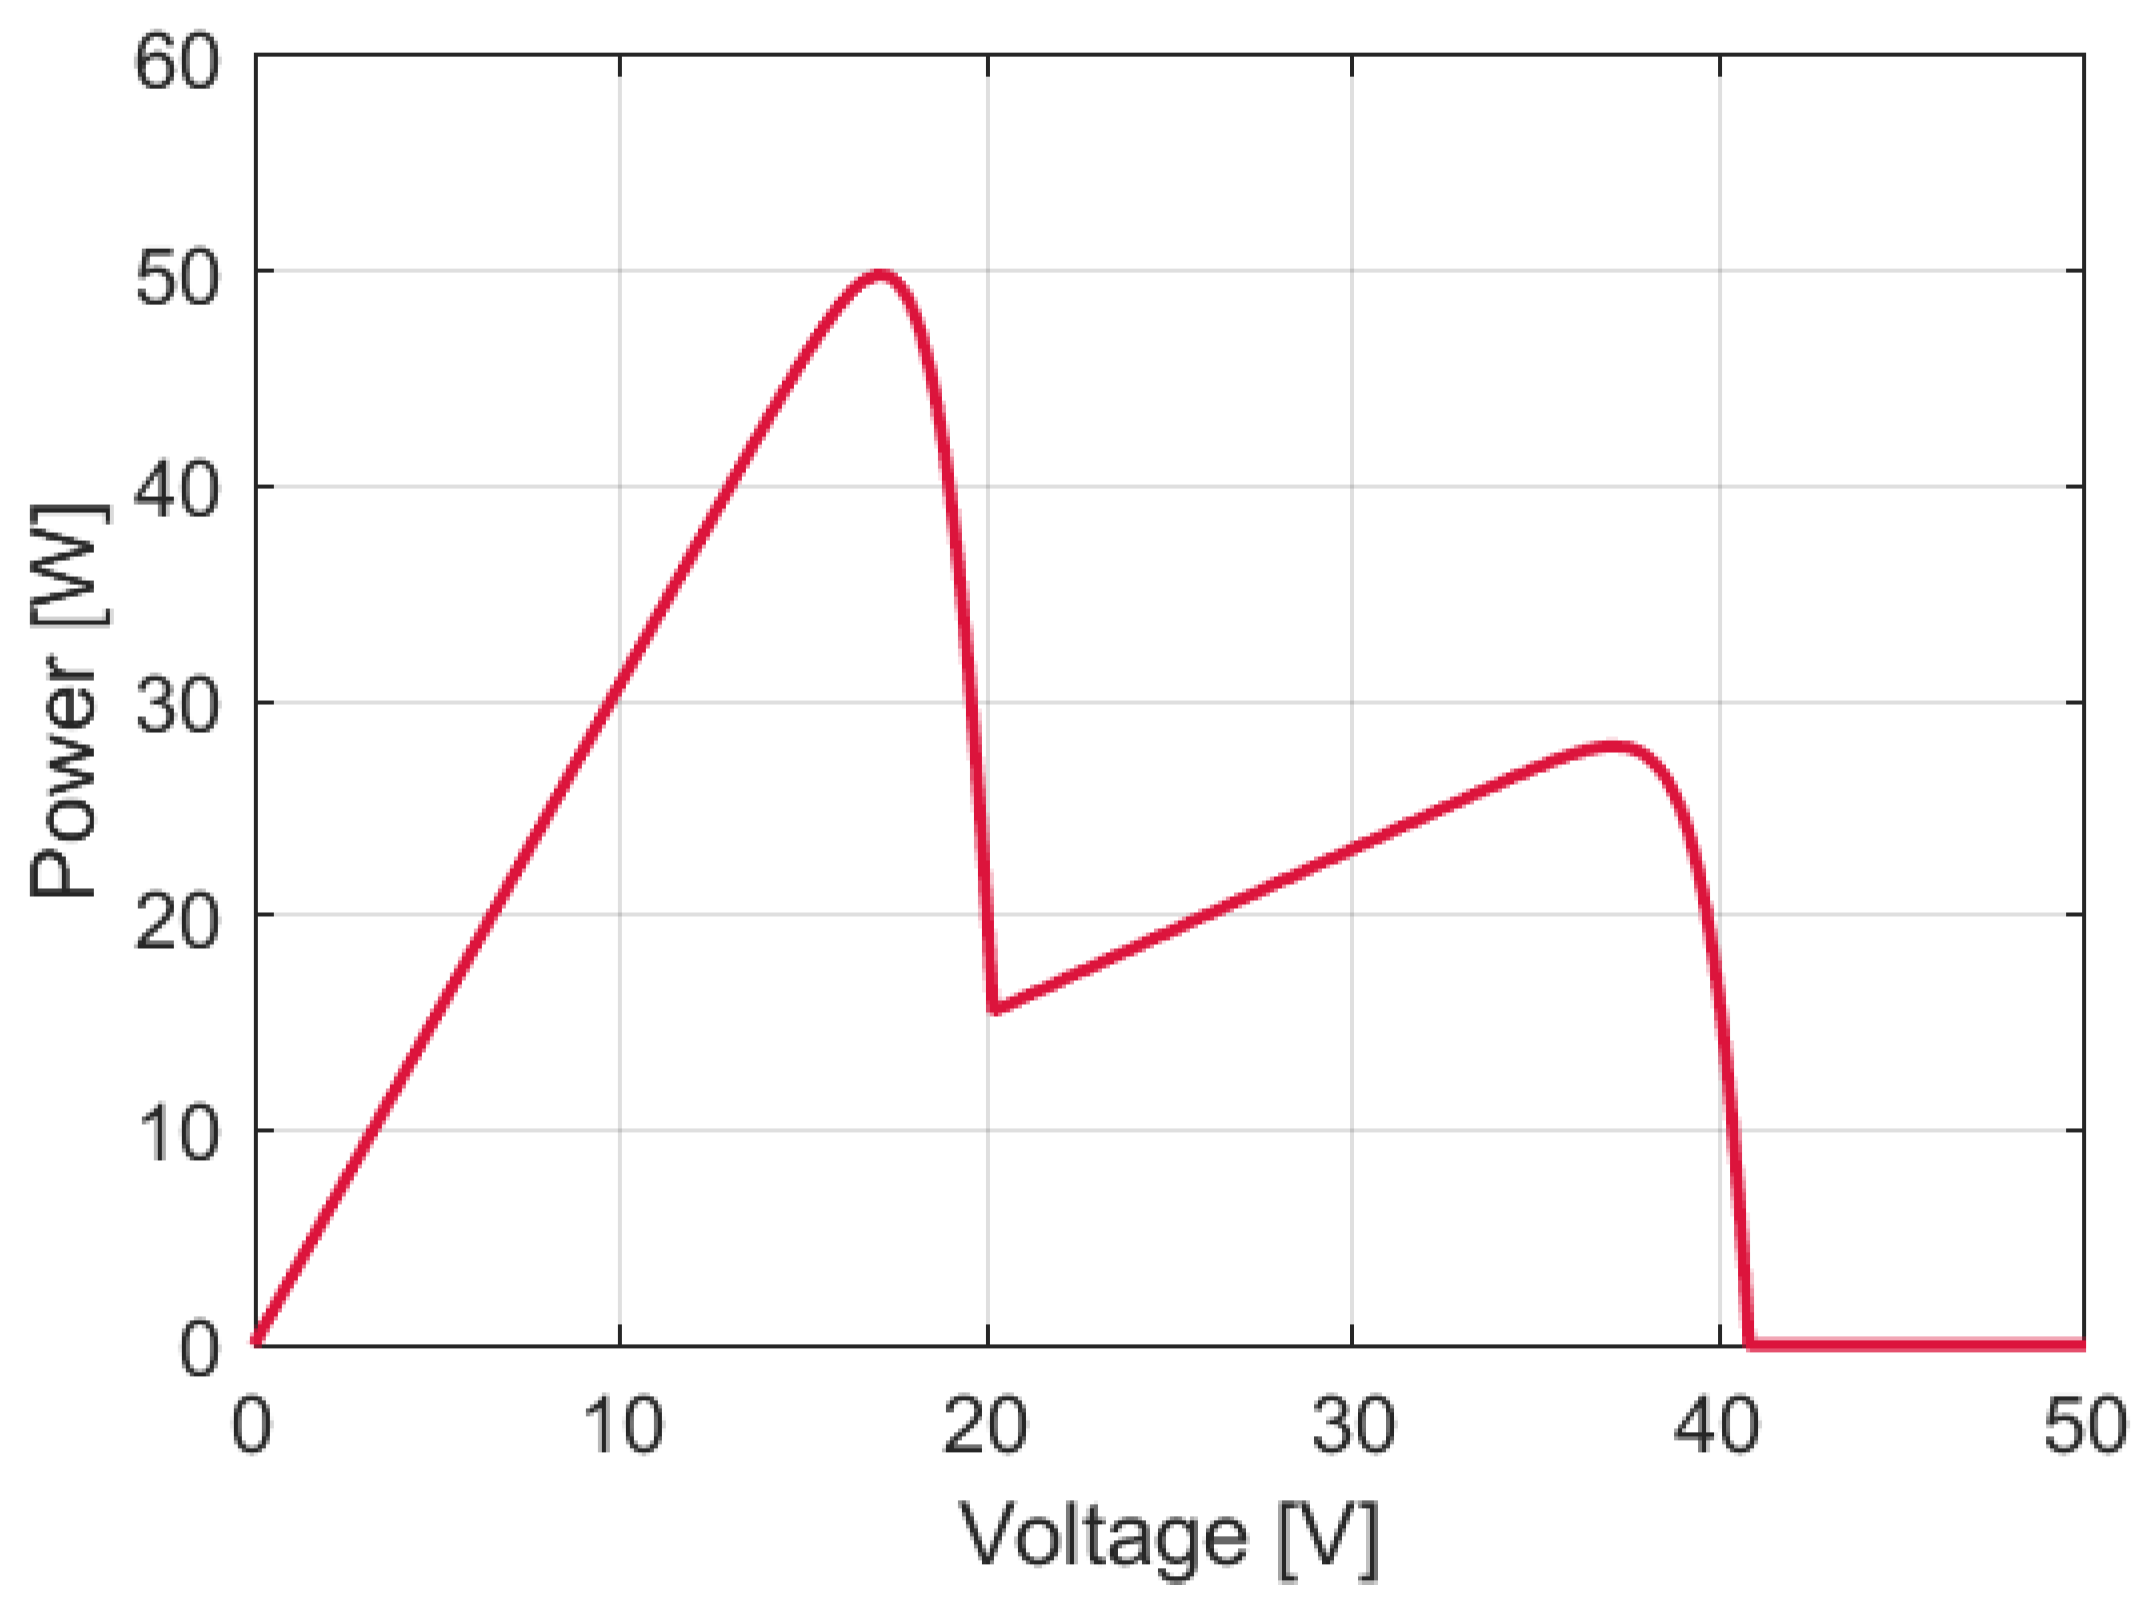
Similarly, simulations were conducted for two 60 W PV panels, also connected as shown in Figure 29 and illuminated with irradiances of 200 and 800 W/m2. This corresponds to the panel power used in the first part of the study under no shading in the system of Figure 11. A power curve for the two series-connected PV modules was then obtained (Figure 37).
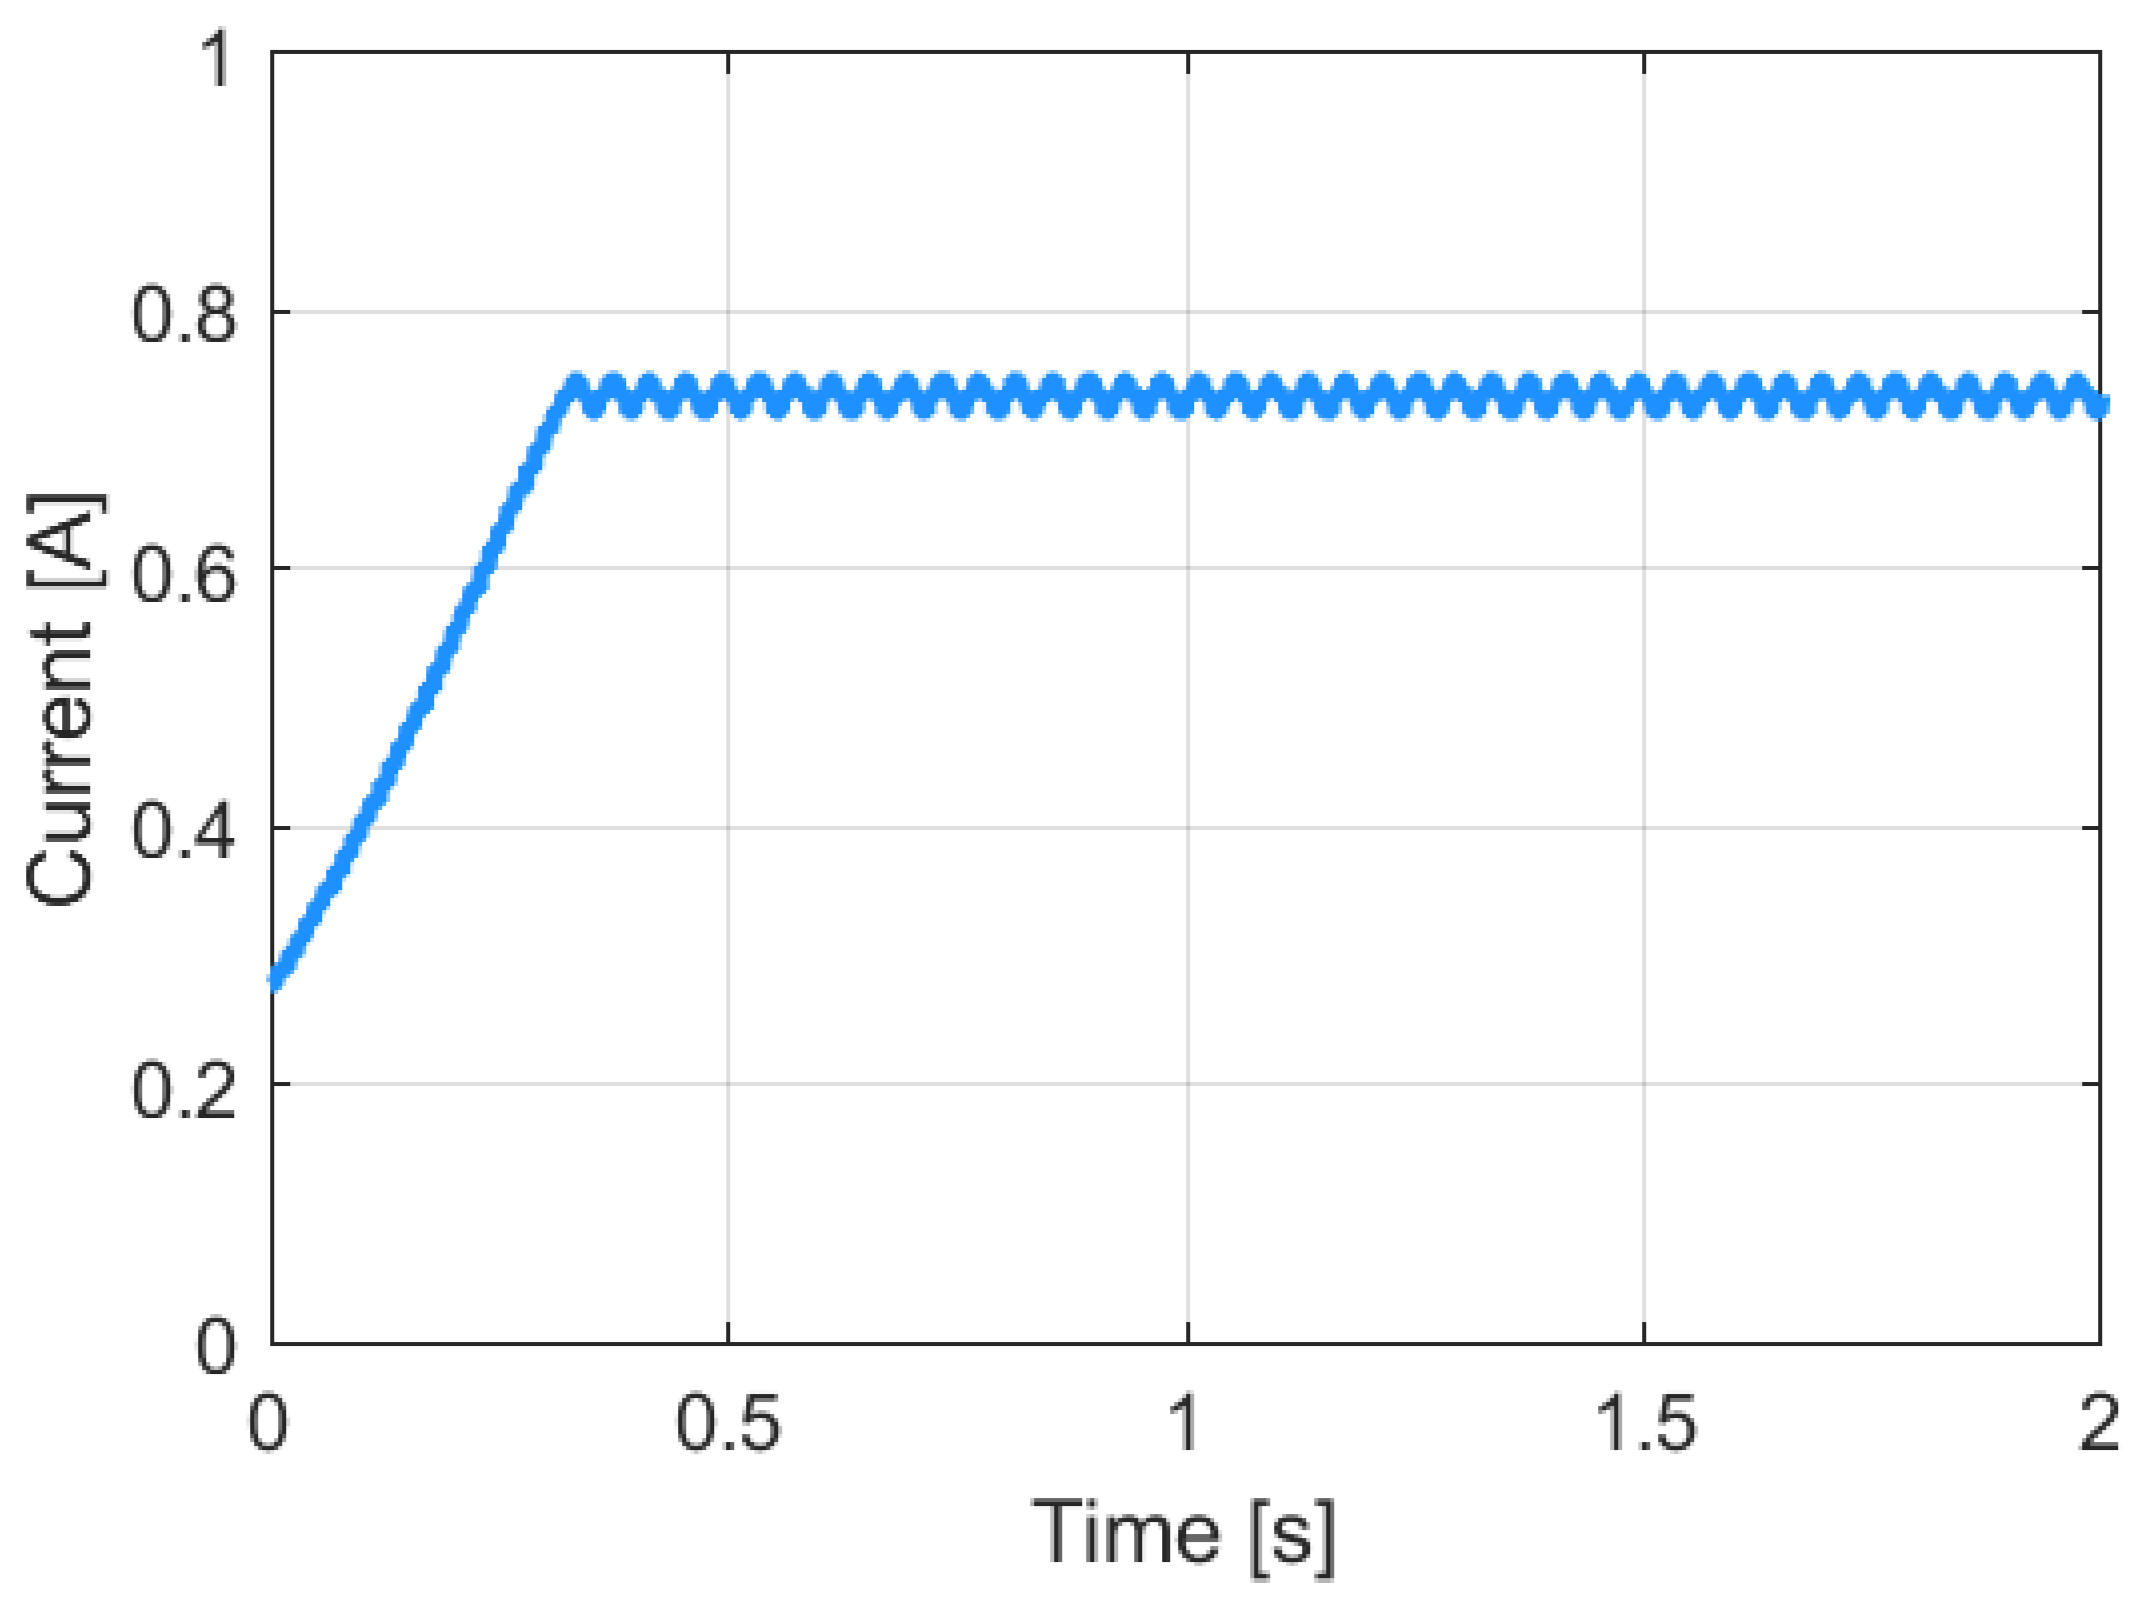
The system operation was simulated again, and the current, voltage, and power waveforms were obtained using the P&O and PSO algorithms. Figure 38, Figure 39 and Figure 40 show the time-domain plots of current, voltage, and power obtained with the P&O algorithm, while Figure 41, Figure 42 and Figure 43 present the corresponding waveforms obtained using the PSO algorithm.
The observations from Figure 38, Figure 39, Figure 40, Figure 41, Figure 42 and Figure 43 are consistent with those from Figure 31, Figure 32, Figure 33, Figure 34, Figure 35 and Figure 36. Even in this case, for a PV installation with power more than five times lower, the PSO-based algorithm effectively “locates” the global maximum power point (GMPP), in contrast to the P&O algorithm.

4. Conclusions

To thoroughly analyse maximum power point tracking (MPPT) methods for photovoltaic panel operation, simulations were performed using representative algorithms from each group defined in the classification shown in Figure 9. All graphs and simulations were generated using MATLAB 24.1 (R2024a) and Simulink 24.1 (R2024a) software.
As a starting point, the performance of the open-circuit voltage (OCV) method was simulated. The algorithm enables a dynamic transition to an operating point near the maximum power point (MPP). However, its accuracy is low and deteriorates further under varying operating conditions.
The classical and widely used perturb and observe (P&O) algorithm, despite its simple implementation, demonstrated relatively effective performance. However, the analysis revealed that disturbances negatively affect the algorithm’s performance by increasing oscillations around the MPP. When implementing a system based on the P&O algorithm, careful attention should be paid to the selection of the parameter governing the increment and decrement of the duty cycle controlling the converter, as it significantly influences the magnitude of oscillations. Despite the relatively high efficiency characteristic of the P&O algorithm, certain limitations remain inevitable. The algorithm requires a large number of iterations to locate the optimal operating point and tends to converge to a local MPP, particularly under partially shading conditions.
Compared to the P&O algorithm, the fuzzy logic-based (FLC) algorithm demonstrated a faster dynamic response in tracking the maximum power point and significantly reduced oscillation amplitude. FLC ensures more stable operating conditions of the system; however, its implementation is considerably more complex and may require higher-quality hardware to run the algorithm effectively.
Optimisation algorithms are known for their ability to accurately determine the maximum power point. The analysed PSO method identified the MPP within a response time comparable to that of the P&O algorithm, while demonstrating significantly higher accuracy. The most notable advantage of the PSO algorithm is its ability to locate the MPP in the presence of multiple local maxima on the photovoltaic panel’s characteristic curve, typically caused by partial shading.
The PSO algorithm was combined with the P&O method, thereby implementing a hybrid algorithm. Switching between the two methods reduces the time required to locate the MPP, although it simultaneously increases the system’s complexity.
Table 4 presents a comparison of selected characteristics of the individual algorithms.
The analysis of various maximum power point tracking (MPPT) algorithms for photovoltaic panels highlighted the strengths and weaknesses of each approach. Each method offers specific advantages and limitations. In real-world applications, the selection should consider the overall system requirements and the expected operating conditions.
In low-power applications, classical algorithms are often the most suitable due to their relatively high efficiency in tracking the maximum power point (MPP) combined with low implementation complexity. More advanced algorithms, such as those based on fuzzy logic control (FLC), provide a dynamic response to sudden environmental changes while maintaining low output oscillations—an important feature in systems operating under unstable conditions.
For large-scale systems spanning extensive areas, where individual panels may operate under different conditions, the Particle Swarm Optimisation (PSO) algorithm proves effective in handling partial shading and minimises oscillations in the later stages of operation. Moreover, combining the Perturb and Observe (P&O) algorithm with the PSO algorithm can enhance responsiveness to minor changes in environmental parameters, improving overall system adaptability and tracking accuracy.
A verification of the two selected algorithms (P&O and PSO) was also carried out under variable operating conditions of small-scale PV installations (in this study: 640 W and 120 W) under partial shading. The results demonstrated the low effectiveness of the P&O algorithm compared to PSO, as summarised in Table 4. The use of a zeta converter, as well as Buck and Boost converters, as step-up voltage converters (implemented via the DutyCycle block), was also experimentally tested. All three converters performed their tasks correctly; however, the zeta converter, being the most precise, required a longer simulation time. Other algorithms are generally not used for tracking the GMPP in partially shaded (or soiled) installations, or they require a lengthy parameter-tuning process for each specific PV system, as is the case with the FLC algorithm.
Furthermore, future work will involve testing on higher-power photovoltaic installations and various converter topologies to evaluate whether the results can be effectively scaled to industrial PV systems. These additional studies will allow for the assessment of the impact of quantitative indicators—such as tracking efficiency, convergence time, power loss, and standard deviation of MPP oscillations—on the effectiveness of MPPT algorithms across different system configurations and under variable operating conditions.

Author Contributions

Conceptualization, G.T., J.J., J.S., W.W. and N.C.-G.; methodology, G.T., J.J., J.S., N.C.-G. and W.W.; software Matlab 24.1. (R2024a), Simulink 24.1 (R2024a), Python 3.10.9, Spyder 5.4.1, G.T., J.J. and J.S.; validation, W.W. and N.C.-G.; formal analysis, N.C.-G., W.W., G.T., J.J. and J.S.; investigation, G.T., J.J., J.S., W.W. and N.C.-G.; resources, G.T., J.J., J.S. and N.C.-G.; data curation, G.T., J.J. and J.S.; writing—original draft preparation, G.T., J.J., J.S., W.W. and N.C.-G.; writing—review and editing, N.C.-G. and W.W.; visualisation, G.T., J.J. and J.S.; supervision, N.C.-G. and W.W.; project administration, W.W., N.C.-G., G.T., J.J. and J.S.; funding acquisition, W.W. and N.C.-G. All authors have read and agreed to the published version of the manuscript.

Funding

This research received no external funding.

Data Availability Statement

Data are contained in this article.

Conflicts of Interest

The authors declare no conflicts of interest.

References

  1. Instytut Energetyki Odnawialnej. Rynek Fotowoltaiki w Polsce 2024. Warszawa. Available online: https://ieo.pl/raport-rynek-fotowoltaiki-w-polsce-2024pv-2024 (accessed on 20 June 2025).
  2. Macías, J.; Herrero, R.; José, L.S.; Núñez, R.; Antón, I. On the validation of a modelling tool for Vehicle Integrated PhotoVoltaics: Reflected irradiance in urban environments. Sol. Energy Mater. Sol. Cells 2024, 277, 113060. [Google Scholar] [CrossRef]
  3. Bermudez-Garcia, A.; Voarino, P.; Raccurt, O. Environments, needs and opportunities for future space photovoltaic power generation: A review. Appl. Energy 2021, 290, 116757. [Google Scholar] [CrossRef]
  4. Shah, A.U.I.; Meyer, E.L. Perovskite-based solar cells in photovoltaics for commercial scalability: Current progress, challenges, mitigations and future prospectus. Sol. Energy 2025, 286, 113172. [Google Scholar] [CrossRef]
  5. Jastrzębska, G. Energia ze Źródeł Odnawialnych i jej Wykorzystanie; Wydawnictwa Komunikacji i Łączności: Warsaw, Poland, 2017. [Google Scholar]
  6. Hanzelka, Z.; Piątek, K. Instalacje Fotowoltaiczne w Systemie Elektroenergetycznym: Jakość Dostaw Energii Elektrycznej, Warunki Techniczne Przyłączenia Instalacji PV; Hanzelka, Z., Piątek, K., Eds.; PWN: Warsaw, Poland, 2024; Volume I. [Google Scholar]
  7. Kwiatkiewicz, P. Energetyka Solarna w Badaniach Naukowych; Kwiatkiewicz, P., Ed.; Fundacja na rzecz Czystej Energii: Poznań, Poland, 2018. [Google Scholar]
  8. Tytko, R. Fotowoltaika: Podręcznik dla Studentów, Uczniów, Instalatorów, Inwestorów; Wydawnictwo i Drukarnia Towarzystwa Słowaków w Polsce: Kraków, Poland, 2020; Volume IV. [Google Scholar]
  9. Abidi, H.; Sidhom, L.; Chihi, I. Systematic Literature Review and Benchmarking for Photovoltaic MPPT Techniques. Energies 2023, 16, 3509. [Google Scholar] [CrossRef]
  10. Trzmiel, G. Układy śledzące punkt maksymalnej mocy w inwerterach stosowanych w instalacjach fotowoltaicznych. Electr. Eng. 2016, 87, 23–35. [Google Scholar]
  11. Zaremba, A.; Rodziewicz, T.; Wacławek, M. Algorytmy śledzenia punktu mocy maksymalnej (MPPT) w systemach fotowoltaicznych. Proc. ECOpole 2012, 6, 805–810. [Google Scholar]
  12. Liu, Y.H.; Chen, G.J.; Liu, C.L.; Su, C.Y. Comprehensive review on fast maximum power point tracking algorithms for solar power generation systems. Ain Shams Eng. J. 2024, 15, 103093. [Google Scholar] [CrossRef]
  13. Amrouche, B.; Guessoum, A.; Belhamel, M. A simple behavioural model for solar module electric characteristics based on the first order system step response for MPPT study and comparison. Appl. Energy 2012, 91, 395–404. [Google Scholar] [CrossRef]
  14. KYOCERA. Specifications for the KC200GT Multicrystalline Photovoltaic Module. 2025. Available online: https://www.energymatters.com.au/images/kyocera/KC200GT.pdf (accessed on 20 June 2025).
  15. Rybak, T.; Mołczan, A.; Jarmuła, S.; Lichoń, M.; Majewska, S.; Michalski, M. Badanie wpływu zabrudzenia paneli fotowoltaicznych trawą na ich sprawność. Instal 2024, 463, 7–11. [Google Scholar]
  16. Seyedmahmoudian, M.; Mekhilef, S.; Rahmani, R.; Yusof, R.; Renani, E.T. Analytical Modeling of Partially Shaded Photovoltaic Systems. Energies 2013, 6, 128–144. [Google Scholar] [CrossRef]
  17. Teo, J.C.; Tan, R.H.G.; Mok, V.H.; Ramachandaramurthy, V.K.; Tan, C. Impact of Partial Shading on the P-V Characteristics and the Maximum Power of a Photovoltaic String. Energies 2018, 11, 1860. [Google Scholar] [CrossRef]
  18. Krystkowiak, M.; Gwóźdź, M. Przekształtnik energoelektroniczny dla elektrowni fotowoltaicznej współpracującej z siecią energetyczną. Pr. Nauk. Inst. Masz. Napędów Pomiarów Elektr. Politech. Wrocławskiej 2015, 71, 40–51. [Google Scholar]
  19. Consoli, A.; Cacciato, M.; Crisafulli, V. Power converters for photovoltaic generation systems in smart grid applications. Eletrônica Potência 2009, 14, 251–257. [Google Scholar] [CrossRef]
  20. Verbytskyi, I.; Lukianov, M.; Nassereddine, K.; Pakhaliuk, B.; Husev, O.; Strzelecki, R.M. Power Converter Solutions for Industrial PV Applications—A Review. Energies 2022, 15, 3295. [Google Scholar] [CrossRef]
  21. Iskandar, H.R.; Prasetya, A.; Zainal, Y.B.; Hidayat, M.R.; Taryana, E.; Megiyanto, G. Comparison Model of Buck-boost and Zeta Converter Circuit using MPPT Control Incremental Conductance Algorithm. In Proceedings of the 2020 International Conference on Sustainable Energy Engineering and Application (ICSEEA), Tangerang, Indonesia, 18–20 November 2020; IEEE: Piscataway, NJ, USA, 2020; pp. 185–190. [Google Scholar]
  22. Espinosa, M.; Mendoza, E.Y.; Flores, J.L. Passivity Based-Control of Output Voltage Regulation with MPPT for Photovoltaic Panel Using two SEPIC Converters. In Proceedings of the 2020 IEEE International Autumn Meeting on Power, Electronics and Computing (ROPEC), Ixtapa, Mexico, 4–6 November 2020; IEEE: Piscataway, NJ, USA, 2020; pp. 1–6. [Google Scholar]
  23. Yaich, M.; Dhieb, Y.; Bouzguenda, M.; Ghariani, M. Metaheuristic Optimization Algorithm of MPPT Controller for PV system application. E3S Web Conf. 2022, 336, 00036. [Google Scholar] [CrossRef]
  24. Kabalci, E.; Gokkus, G.; Gorgun, A. Design and implementation of a PI-MPPT based Buck-Boost converter. In Proceedings of the 2015 7th International Conference on Electronics, Computers and Artificial Intelligence (ECAI), Bucharest, Romania, 25–27 June 2015; IEEE: Piscataway, NJ, USA, 2015; pp. SG-23–SG-28. [Google Scholar]
  25. Ma, M.; Liu, X.; Lee, K.Y. Maximum Power Point Tracking and Voltage Regulation of Two-Stage Grid-Tied PV System Based on Model Predictive Control. Energies 2020, 13, 1304. [Google Scholar] [CrossRef]
  26. Li, P.; Zhang, J.; Xu, R.; Zhou, J.; Gao, Z. Integration of MPPT algorithms with spacecraft applications: Review, classification and future development outlook. Energy 2024, 308, 132927. [Google Scholar] [CrossRef]
  27. Siddique, M.A.B.; Zhao, D.; Rehman, A.U.; Ouahada, K.; Hamam, H. An adapted model predictive control MPPT for validation of optimum GMPP tracking under partial shading conditions. Sci. Rep. 2024, 14, 9462. [Google Scholar] [CrossRef] [PubMed]
  28. Figueiredo, S.; e Silva, R.N.A.L. Hybrid MPPT Technique PSO-P&O Applied to Photovoltaic Systems Under Uniform and Partial Shading Conditions. IEEE Lat. Am. Trans. 2021, 19, 1610–1617. [Google Scholar] [CrossRef]
  29. Bizon, N. Global Maximum Power Point Tracking (GMPPT) of Photovoltaic array using the Extremum Seeking Control (ESC): A review and a new GMPPT ESC scheme. Renew. Sustain. Energy Rev. 2016, 57, 524–539. [Google Scholar] [CrossRef]
  30. Simanjuntak, I.U.V.; Haidi, J.; Putra, R.F.A.; Silalahi, L.M. Comparison of MPPT Optimization Methods for P&O and PSO Solar Panels to Overcome Partial Shading. Int. J. Electron. Telecommun. 2024, 70, 1023–1029. [Google Scholar] [CrossRef]
  31. Eltawil, M.A.; Zhao, Z. MPPT techniques for photovoltaic applications. Renew. Sustain. Energy Rev. 2013, 25, 793–813. [Google Scholar] [CrossRef]
  32. Kota, V.R.; Bhukya, M.N. A simple and efficient MPPT scheme for PV module using 2-Dimensional Lookup Table. In Proceedings of the 2016 IEEE Power and Energy Conference at Illinois (PECI), Urbana, IL, USA, 19–20 February 2016; IEEE: Piscataway, NJ, USA, 2016; pp. 1–7. [Google Scholar]
  33. Saravanan, S.; Ramesh Babu, N. Maximum power point tracking algorithms for photovoltaic system—A review. Renew. Sustain. Energy Rev. 2016, 57, 192–204. [Google Scholar] [CrossRef]
  34. Batzelis, E.; Kampitsis, G.; Papathanassiou, S. A MPPT algorithm for partial shading conditions employing curve fitting. In Proceedings of the 32th EU PVSEC, Munich, Germany, 20–24 June 2016. [Google Scholar] [CrossRef]
  35. Wirateruna, E.S.; Afroni, M.J.; Ayu, A.F. Implementation of PSO algorithm on MPPT PV System using Arduino Uno under PSC. Int. J. Artif. Intell. Robot. 2023, 5, 13–20. [Google Scholar] [CrossRef]
  36. Pamuk, N. Performance Analysis of Different Optimization Algorithms for MPPT Control Techniques under Complex Partial Shading Conditions in PV Systems. Energies 2023, 16, 3358. [Google Scholar] [CrossRef]
  37. Atici, K.; Sefa, I.; Altin, N. Grey Wolf Optimization Based MPPT Algorithm for Solar PV System with SEPIC Converter. In Proceedings of the 2019 4th International Conference on Power Electronics and their Applications (ICPEA), Elazig, Turkey, 25–27 September 2019; IEEE: Piscataway, NJ, USA, 2019; pp. 1–6. [Google Scholar]
  38. Silaa, M.Y.; Barambones, O.; Bencherif, A.; Rahmani, A. A New MPPT-Based Extended Grey Wolf Optimizer for Stand-Alone PV System: A Performance Evaluation versus Four Smart MPPT Techniques in Diverse Scenarios. Inventions 2023, 8, 142. [Google Scholar] [CrossRef]
  39. Noman, A.M.; Addoweesh, K.E.; Mashaly, H.M. A fuzzy logic control method for MPPT of PV systems. In Proceedings of the IECON 2012—38th Annual Conference on IEEE Industrial Electronics Society, Montreal, QC, Canada, 25–28 October 2012; IEEE: Piscataway, NJ, USA, 2012; pp. 874–880. [Google Scholar]
  40. Baramadeh, M.Y.; Abouelela, M.A.A.; Alghuwainem, S.M. Maximum Power Point Tracker Controller Using Fuzzy Logic Control with Battery Load for Photovoltaics Systems. Smart Grid Renew. Energy 2021, 12, 163–181. [Google Scholar] [CrossRef]
  41. Ullah, K.; Ishaq, M.; Tchier, F.; Ahmad, H.; Ahmad, Z. Fuzzy-based maximum power point tracking (MPPT) control system for photovoltaic power generation system. Results Eng. 2023, 20, 101466. [Google Scholar] [CrossRef]
  42. Sharmin, R.; Chowdhury, S.S.; Abedin, F.; Rahman, K.M. Implementation of MPPT Technique of Solar Module with Supervised Machine Learning. arXiv 2021, arXiv:2110.00728. [Google Scholar] [CrossRef]
  43. Sundareswaran, K.; Vignesh Kumar, V.; Palani, S. Application of a combined particle swarm optimization and perturb and observe method for MPPT in PV systems under partial shading conditions. Renew. Energy 2015, 75, 308–317. [Google Scholar] [CrossRef]
  44. Alagesan, J.S.; Gnanavadivel, J.; Kumar, N.S.; Veni, K.K. Design and Simulation of Fuzzybased DC-DC Interleaved Zeta Converter for Photovoltaic Applications. In Proceedings of the 2018 2nd International Conference on Trends in Electronics and Informatics (ICOEI), Tirunelveli, India, 11–12 May 2018; IEEE: Piscataway, NJ, USA, 2018; pp. 704–709. [Google Scholar]
  45. Seguel, J.L.; Seleme, S.I.; Morais, L.M.F. Comparative Study of Buck-Boost, SEPIC, Cuk and Zeta DC-DC Converters Using Different MPPT Methods for Photovoltaic Applications. Energies 2022, 15, 7936. [Google Scholar] [CrossRef]
  46. Mohammad, K.; Arif, M.S.B.; Masud, M.I.; Ahmad, M.F.; Alqarni, M. Optimal Selection of Extensively Used Non-Isolated DC–DC Converters for Solar PV Applications: A Review. Energies 2025, 18, 1572. [Google Scholar] [CrossRef]
  47. Shiau, J.-K.; Wei, Y.-C.; Chen, B.-C. A Study on the Fuzzy-Logic-Based Solar Power MPPT Algorithms Using Different Fuzzy Input Variables. Algorithms 2015, 8, 100–127. [Google Scholar] [CrossRef]
  48. Harrison, A.; Nfah, E.M.; de Dieu Nguimfack Ndongmo, J.; Alombah, N.H. An Enhanced P&O MPPT Algorithm for PV Systems with Fast Dynamic and Steady-State Response under Real Irradiance and Temperature Conditions. Int. J. Photoenergy 2022, 2022, 6009632. [Google Scholar]
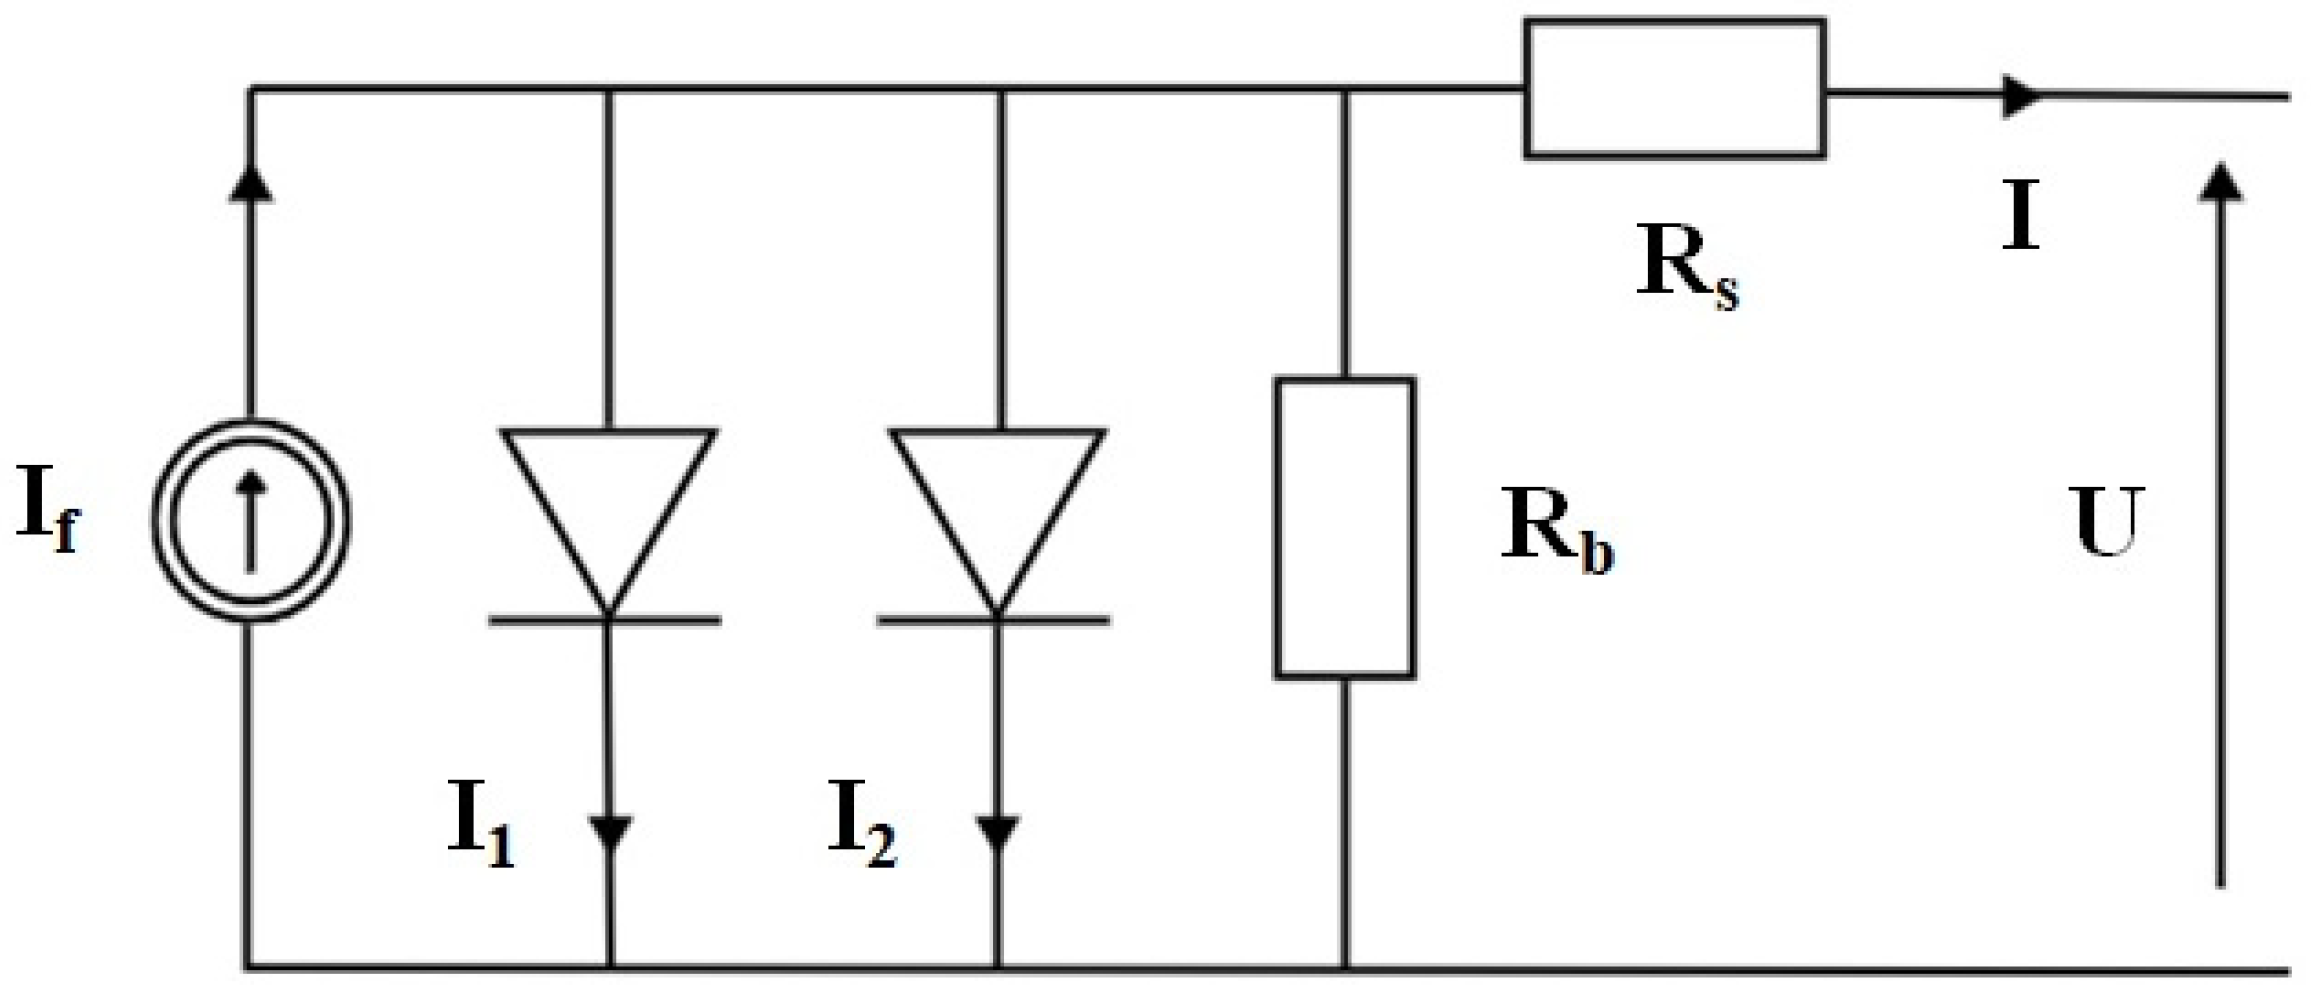
Figure 1. Electrical diagram of a photovoltaic cell.
Energies 18 05223 g001
Figure 2. Current–voltage characteristics I = f(U) for different irradiance levels.
Energies 18 05223 g002
Figure 3. Power–voltage characteristics P = f(U) for different irradiance levels.
Energies 18 05223 g003
Figure 4. Current–voltage characteristics I = f(U) for different temperature values.
Energies 18 05223 g004
Figure 5. Power–voltage characteristics P = f(U) for different temperature values.
Energies 18 05223 g005
Figure 6. Current-voltage characteristics I = f(U) of the PV panel for various irradiance levels G and temperatures T.
Energies 18 05223 g006
Figure 7. Power-voltage characteristics P = f(U) of the PV panel for various irradiance levels G and temperatures T.
Energies 18 05223 g007
Figure 8. Power-voltage characteristic P = f(U) for a partially shaded installation (two series-connected PV panels).
Energies 18 05223 g008
Figure 9. Classification of applied maximum power point tracking algorithms.
Energies 18 05223 g009
Figure 10. Block diagram of the perturb and observe algorithm operation [6,30]: k—sample number (step), P—PV panel power [W], ∆P—power increase [W], U—panel voltage [V], ∆U—voltage increase [V], I—current generated by the panel [A], x—disturbance” parameter.
Energies 18 05223 g010
Figure 11. The schematic diagram of the Zeta converter developed using Matlab 24.1 and Simulink 24.1.
Energies 18 05223 g011
Figure 12. Power waveform over time, G = 1000 W/m2.
Energies 18 05223 g012
Figure 13. Voltage over time, G = 1000 W/m2.
Energies 18 05223 g013
Figure 14. Power waveform over time, G = 600 W/m2.
Energies 18 05223 g014
Figure 15. Voltage over time, G = 600 W/m2.
Energies 18 05223 g015
Figure 16. Power extracted from the photovoltaic panel as a function of time using the P&O algorithm.
Energies 18 05223 g016
Figure 17. Power waveform for coefficient x = 0.0025.
Energies 18 05223 g017
Figure 18. Voltage waveform for coefficient x = 0.0025.
Energies 18 05223 g018
Figure 19. Power waveform for coefficient x = 0.01.
Energies 18 05223 g019
Figure 20. Voltage waveform for coefficient x = 0.01.
Energies 18 05223 g020
Figure 21. Membership function—∆E.
Energies 18 05223 g021
Figure 22. Membership function—E.
Energies 18 05223 g022
Figure 23. Membership Function—Fill Factor.
Energies 18 05223 g023
Figure 24. Power output curves over time corresponding to the fuzzy logic algorithm and Perturb and Observe (P&O) method.
Energies 18 05223 g024
Figure 25. Power profile over time, accounting for measurement error.
Energies 18 05223 g025
Figure 26. Voltage profile over time, accounting for measurement error.
Energies 18 05223 g026
Figure 27. Power curves over time—PSO algorithm.
Energies 18 05223 g027
Figure 28. Power curves over time—hybrid PSO + P&O algorithm.
Energies 18 05223 g028
Figure 29. Schematic diagram of the system implemented in Matlab 24.1 and Simulink 24.1 for the analysis of PV installation performance under partial shading conditions.
Energies 18 05223 g029
Figure 30. Power–voltage characteristic P = f ( U ) for a partially shaded installation (two series-connected PV modules AS_6M30_HC_320W) under irradiance levels of 200 and 800 W/m2.
Energies 18 05223 g030
Figure 31. Time-domain current waveform obtained using the P&O algorithm under partial shading of a 640 W photovoltaic system.
Energies 18 05223 g031
Figure 32. Time-domain voltage waveform obtained using the P&O algorithm under partial shading of a 640 W photovoltaic system.
Energies 18 05223 g032
Figure 33. Time-domain power waveform obtained using the P&O algorithm under partial shading of a 640 W photovoltaic system.
Energies 18 05223 g033
Figure 34. Time-domain current waveform obtained using the PSO algorithm under partial shading of a 640 W photovoltaic system.
Energies 18 05223 g034
Figure 35. Time-domain voltage waveform obtained using the PSO algorithm under partial shading of a 640 W photovoltaic system.
Energies 18 05223 g035
Figure 36. Time-domain power waveform obtained using the PSO algorithm under partial shading of a 640 W photovoltaic system.
Energies 18 05223 g036
Figure 37. Power-voltage characteristic P = f ( U ) for a partially shaded installation (two series-connected PV panels 60 W)—irradiance 200 and 800 W·m2.
Energies 18 05223 g037
Figure 38. Time-domain current waveform obtained using the P&O algorithm under partial shading of a 120 W photovoltaic system.
Energies 18 05223 g038
Figure 39. Time-domain voltage waveform obtained using the P&O algorithm under partial shading of a 120 W photovoltaic system.
Energies 18 05223 g039
Figure 40. Time-domain power waveform obtained using the P&O algorithm under partial shading of a 120 W photovoltaic system.
Energies 18 05223 g040
Figure 41. Time-domain current waveform obtained using the PSO algorithm under partial shading of a 120 W photovoltaic system.
Energies 18 05223 g041
Figure 42. Time-domain voltage waveform obtained using the PSO algorithm under partial shading of a 120 W photovoltaic system.
Energies 18 05223 g042
Figure 43. Time-domain power waveform obtained using the PSO algorithm under partial shading of a 120 W photovoltaic system.
Energies 18 05223 g043
Table 1. Summary of applied rules.
Set of RulesE
UDUMZDMDD
EUDZDDDMZUD
UMDDDMZZUD
ZDDDMZUMUD
DMDDZZUMUD
DDDDZUMUDZ
where UD/UM—negative high/low, Z—zero, DD/DM—positive high/low.
Table 2. Summary of the parameters from Equation (9) used for the implementation of the PSO algorithm.
wvelocity change weight0.4
c1local factor0.75
c2global coefficient1.6
r1, r2random coefficients0–1
Table 3. Selected quantitative metrics of the P&O, FLC, PSO, and the hybrid PSO + P&O algorithms.
Selected AlgorithmP&O (x = 0.0025)P&O (x = 0.01)FLCPSOHybrid
Stabilisation time
98–100% [s]
0.4450.130.2150.3920.245
Rise time 10–90% [s]0.290.1010.1820.340.153
Accuracy [%]98.9–99.998.2–99.899.9099.9099.90
Energy Loss [%]4.742.263.477.965.12
Standard Deviation (from 98%) [%]0.250.450.190.340.44
Standard Deviation
(entire window) [%]
11.398.347.8522.1317
where Hybrid—the hybrid PSO + P&O algorithm.
Table 4. Comparison of Simulated MPPT Algorithms.
Constant VoltageP&OFLCPSOPSO + P&O
Algorithm Group
Features
ClassicClassicSmartOptimisationHybrid
MeasurementVoc (V)V, IV, IV, I, items, ratingsV, I, time items, ratings
DynamicsMediumLowHighLowMedium
AccuracyLowMediumHighExtremely highExtremely high
OscillationSmallAverageLowLowLow
Complexity levelLowLowVery highMediumHigh
Partial Shading ToleranceNoneLowMediumHighHigh
Disclaimer/Publisher’s Note: The statements, opinions and data contained in all publications are solely those of the individual author(s) and contributor(s) and not of MDPI and/or the editor(s). MDPI and/or the editor(s) disclaim responsibility for any injury to people or property resulting from any ideas, methods, instructions or products referred to in the content.