Article

Influence of Web-Perforated Cold-Formed Steel Studs on the Heat Transfer Properties of LSF External Walls

Faculty of Engineering, Queensland University of Technology (QUT), Brisbane, QLD 4000, Australia
*
Author to whom correspondence should be addressed.
Energies 2025, 18(19), 5103; https://doi.org/10.3390/en18195103
Submission received: 25 August 2025 / Revised: 19 September 2025 / Accepted: 22 September 2025 / Published: 25 September 2025

Abstract

Thermal bridging through cold-formed steel (CFS) studs significantly reduces the thermal performance of light gauge steel frame (LSF) wall systems, particularly in climates demanding higher thermal resistance (R-value). While thermal breaks are commonly used, they increase material costs and construction complexity. According to NCC 2022, the minimum total R-value requirement for external walls ranges between 2.8 and 3.8 m2·K/W depending on the climate zone and building class. This study therefore evaluated web-perforated steel studs as a passive strategy to enhance thermal resistance of LSF walls, analysing 120 configurations with validated 3D finite element models in Abaqus and benchmarking in THERM. The results showed that web perforations consistently improved R-values by 14 to 20%, as isotherm contours and heat flux vectors demonstrated disruption of direct heat flow through the stud, thereby mitigating thermal bridging. Although the axial compression capacity of web-perforated CFS studs decreased by 29.5%, the use of 4 mm hole-edge stiffeners restored 96.8% of the original capacity. The modified NZS 4214:2006 and ASHRAE Modified Zone methods, incorporating steel area reduction and heat flux redistribution, closely matched Abaqus predictions, with coefficients of variation (COV) below 0.009, corresponding to less than 1% relative deviation between analytical and numerical R-values. Furthermore, application of web-perforated CFS studs in five external wall systems demonstrated improved thermal resistance, ensuring compliance with NCC 2022 R-value requirements across all Australian climate zones. Overall, the findings establish web-perforated studs as an effective solution for improving the energy performance of LSF building envelopes.

1. Introduction

Thermal losses in light gauge steel framed (LSF) buildings account for approximately 20 to 40% of total energy loss through the building envelope. Of these, external wall assemblies contribute 10 to 25%, primarily due to thermal bridging through high-conductivity steel components such as studs, noggings, and plates, which have conductivities exceeding 50 W/m·K. In contrast, adjacent materials such as insulation and sheathing typically exhibit conductivities below 0.05 W/m·K [1]. While internal LSF walls contribute minimally to building envelope heat transfer, external walls provide dominant conductive pathways and exert substantial influence on heating, ventilation, and air conditioning (HVAC) loads [2,3]. The thermal performance of LSF systems is characterised by thermal transmittance (U-value, W/m2·K) and thermal resistance (R-value, m2·K/W), which are inversely related (R = 1/U) [4]. The thermal performance of LSF wall assemblies is influenced by parameters such as stud spacing, flange geometry, insulation configuration, cladding type, thermal breaks, and web perforations [5]. Insulation layout can influence thermal resistance, as Santos et al. [6] and Rajanayagam et al. [7] demonstrated that varying insulation placement can result in efficiency differences exceeding 60%. Francis et al. [8] and Martins et al. [9] reported that cold-framed LSF walls produced U-values up to 0.432 W/m2·K, with R-value reductions approaching 65%, whereas warm-framed systems with continuous insulation achieved U-values as low as 0.295 W/m2·K. Stud spacing and flange width also modulate thermal performance, as closer spacing (e.g., 300 mm) increases the steel fraction, raising U-values by 0.10 to 0.16 W/m2·K and reducing R-values by up to 25%, whereas wider spacing with continuous insulation can improve R-values by about 20% [10,11]. Also, flange width reduction from 50 mm to 35 mm has been shown to improve R-values by up to 15% [5]. Additional strategies including staggered studs, optimised cavity insulation, and composite sheathing have produced R-value increases of over 22%, with some configurations exceeding 3.5 m2·K/W [12,13]. Among various passive strategies, web perforations offer an effective approach to mitigating thermal bridging by reducing conductive cross-sectional area and introducing air voids as shown in Figure 1. Sovetova and Calautit [14] reported heat transfer reductions of 50% using air-filled perforations. Yang et al. [15] reported U-value reductions from 0.697 to 0.428 W/m2·K using slotted studs, with further reduction to 0.329 W/m2·K achieved by increasing slot number and length. Alekperov et al. [16] found triangular and dumbbell-shaped slots lowered thermal conductivity by up to 19% versus rectangular slots. Further, Martins et al. [9] recorded an 8.3% drop in U-value using 10 mm thermal break strips on 28% web slotted studs. Langner et al. [17] demonstrated that slotting alone could match the resistance benefit of reducing stud thickness sixfold. Furthermore, Höglund and Burstrand [18] identified flanges and webs as primary heat conduction paths and confirmed that web perforations effectively reduce through-stud conduction. Combined, these methods improve R-values by 15 to 20%, supporting compliance with ISO 6946:2017 [19] and the National Construction Code (NCC) [20] while reducing HVAC energy demand. However, such web perforations in steel studs may introduce structural capacity concerns caused by premature buckling [21].
Globally, energy efficiency regulations have become increasingly stringent, mandating higher R-values in steel-framed building envelopes. The International Energy Conservation Code 2021 [22] requires total R-values between 2.29 and 3.52 m2·K/W, supplemented by energy rated cavity insulation. According to the American Society of Heating, Refrigerating and Air-Conditioning Engineers (ASHRAE) [23], above-grade LSF walls in cold climate zones (Zones 5 to 8) must not exceed a U-value of 0.064 W/m2·K. In Europe, national standards aligned with the European Union directive prescribe external wall R-values ranging from 2.8 to 6.0 m2·K/W, depending on the climate zone [24]. Australia’s NCC 2022 mandates total R-values between 2.8 and 3.8 m2·K/W based on climate zone and building class and requires thermal breaks with a minimum resistance of R 0.2 for direct-fix cladding. However, current provisions across these standards do not explicitly address passive enhancements such as web perforations in steel studs. In this context, to assess regulatory compliance, several analytical methods are employed, including ISO 6946:2017 [19], NZS 4214:2006 [25] and the ASHRAE Modified Zone Method [26], which estimate thermal resistance under steady-state conditions. ISO 6946:2017, although widely used for conventional walls, explicitly states that its combined method is not valid for cold and hybrid LSF walls due to the strong metal bridging effect. While NZS 4214:2006, based on the isothermal planes approach, is suitable for low R-value assemblies, it tends to overestimate performance of highly thermally bridged systems such as CFS frames, limiting its applicability. The ASRAE Modified Zone Method addresses some of these limitations by incorporating zone factors that account for lateral heat flow, offering improved accuracy for cold-framed or discontinuously insulated assemblies [27]. However, both NZS 4214 and the Modified Zone Method assume homogeneous steel framing and do not consider geometric disruptions such as web perforations, limiting their applicability to perforated LSF systems. Also, even with cavity insulation rated at R 2.5 m2·K/W, thermal bridging can reduce effective resistance to between R 1.1 and R 1.4 m2·K/W, resulting in performance losses exceeding 50%, depending on climate zone [28,29]. Although thermal breaks are mandated for cladding systems, passive strategies such as web perforations remain unacknowledged in existing regulations, and current calculation methods continue to overlook internal voids and discontinuities in steel geometry [30].
Previous research on LSF walls has primarily examined solid studs and, in some cases, slotted studs, focusing on insulation strategies, thermal breaks, and cavity design, which achieved only incremental gains. However, systematic strategies that alter the stud geometry to directly interrupt heat transfer pathways remain limited. In particular, the role of circular web perforations in passively enhancing the energy performance of LSF walls has not been investigated. This study addresses this gap through a comprehensive numerical and analytical evaluation of web-perforated CFS studs, incorporating thermal efficiency, structural performance in terms of load carrying capacity of the CFS studs, and compliance with NCC 2022 requirements. Full-scale 3 m LSF wall assemblies with 1.15 mm lipped-channel CFS studs were modelled for steady-state heat transfer using 3D Abaqus and 2D THERM under a 35 °C gradient (40 °C external, 5 °C internal) and validated against guarded hot-box experiments [31]. To capture the influence of geometry, 120 stud configurations were developed by systematically varying web hole diameters between 36 and 68 mm and spacings between 200 and 450 mm, consistent with the limits prescribed in AS/NZS 4600 and NASH provisions. The structural capacity of web-perforated studs was benchmarked against the experimental results of Gunalan et al. [32], ensuring that axial load-carrying performance was reliably represented. Perforations redistributed heat flux through the insulation, increasing thermal resistance by up to 20% relative to solid studs. This gain was initially accompanied by reduced axial capacity, but the addition of 4 mm web-hole stiffeners restored the performance with no significant loss of strength while retaining a 15% R-value improvement. The optimised perforated stud was further examined within five representative façade systems, confirming consistent thermal benefits at the envelope level. Finally, modified forms of NZS 4214 and the ASHRAE Zone Method were developed to account for discontinuous steel geometries, achieving close agreement with Abaqus and THERM predictions, and the resulting R-values were mapped against NCC 2022 thermal requirements across multiple climate zones.

2. Methodology

2.1. Model Validation

Experimental investigations into the thermal performance of LSF walls have played a critical role in validating numerical models used in estimating R-values. The benchmark study by Santos and Mateus [31] utilised a mini hot-box apparatus under quasi-steady-state conditions to evaluate the thermal resistance of both load-bearing and non-load-bearing LSF wall assemblies. The configuration of their load-bearing wall comprised three C90 × 43 × 15 × 1.5 mm steel studs at 400 mm spacing, with a 90 mm mineral wool core (λ = 0.035 W/m·K), 12 mm OSB on both faces, and an internal 12.5 mm gypsum plasterboard layer, resulting in a total thickness of 126.5 mm as shown in Figure 2. It measured 1030 mm × 1060 mm and included three symmetrically placed studs. The measured surface-to-surface thermal resistance was R = 1.558 m2·K/W. In this study, this reference load-bearing LSF wall was numerically modelled to evaluate its thermal performance using three-dimensional steady-state (3D) heat transfer analysis in Abaqus as shown in Figure 3. The 3D approach was adopted to better represent realistic heat flow in all spatial directions. Material conductivities were taken as 50 W/m·K for steel, 0.100 W/m·K for OSB, and 0.175 W/m·K for plasterboard. A temperature gradient of 35 °C was applied (40 °C hot side, 5 °C cold side), with heat fluxes recorded using four sensors positioned across the stud and cavity regions. The developed model was validated against measured surface-to-surface R values reported in [31].
A parallel simulation was performed in THERM as shown in Figure 4, which, in addition to providing validation, facilitated a clearer understanding of the distinctions between 2D and 3D thermal behaviour, particularly in relation to the influence of geometric dimensionality on predicted R-values.

2.2. Studied Cases—Thermal Resistance of LSF Wall and Structural Capacity of CFS Stud

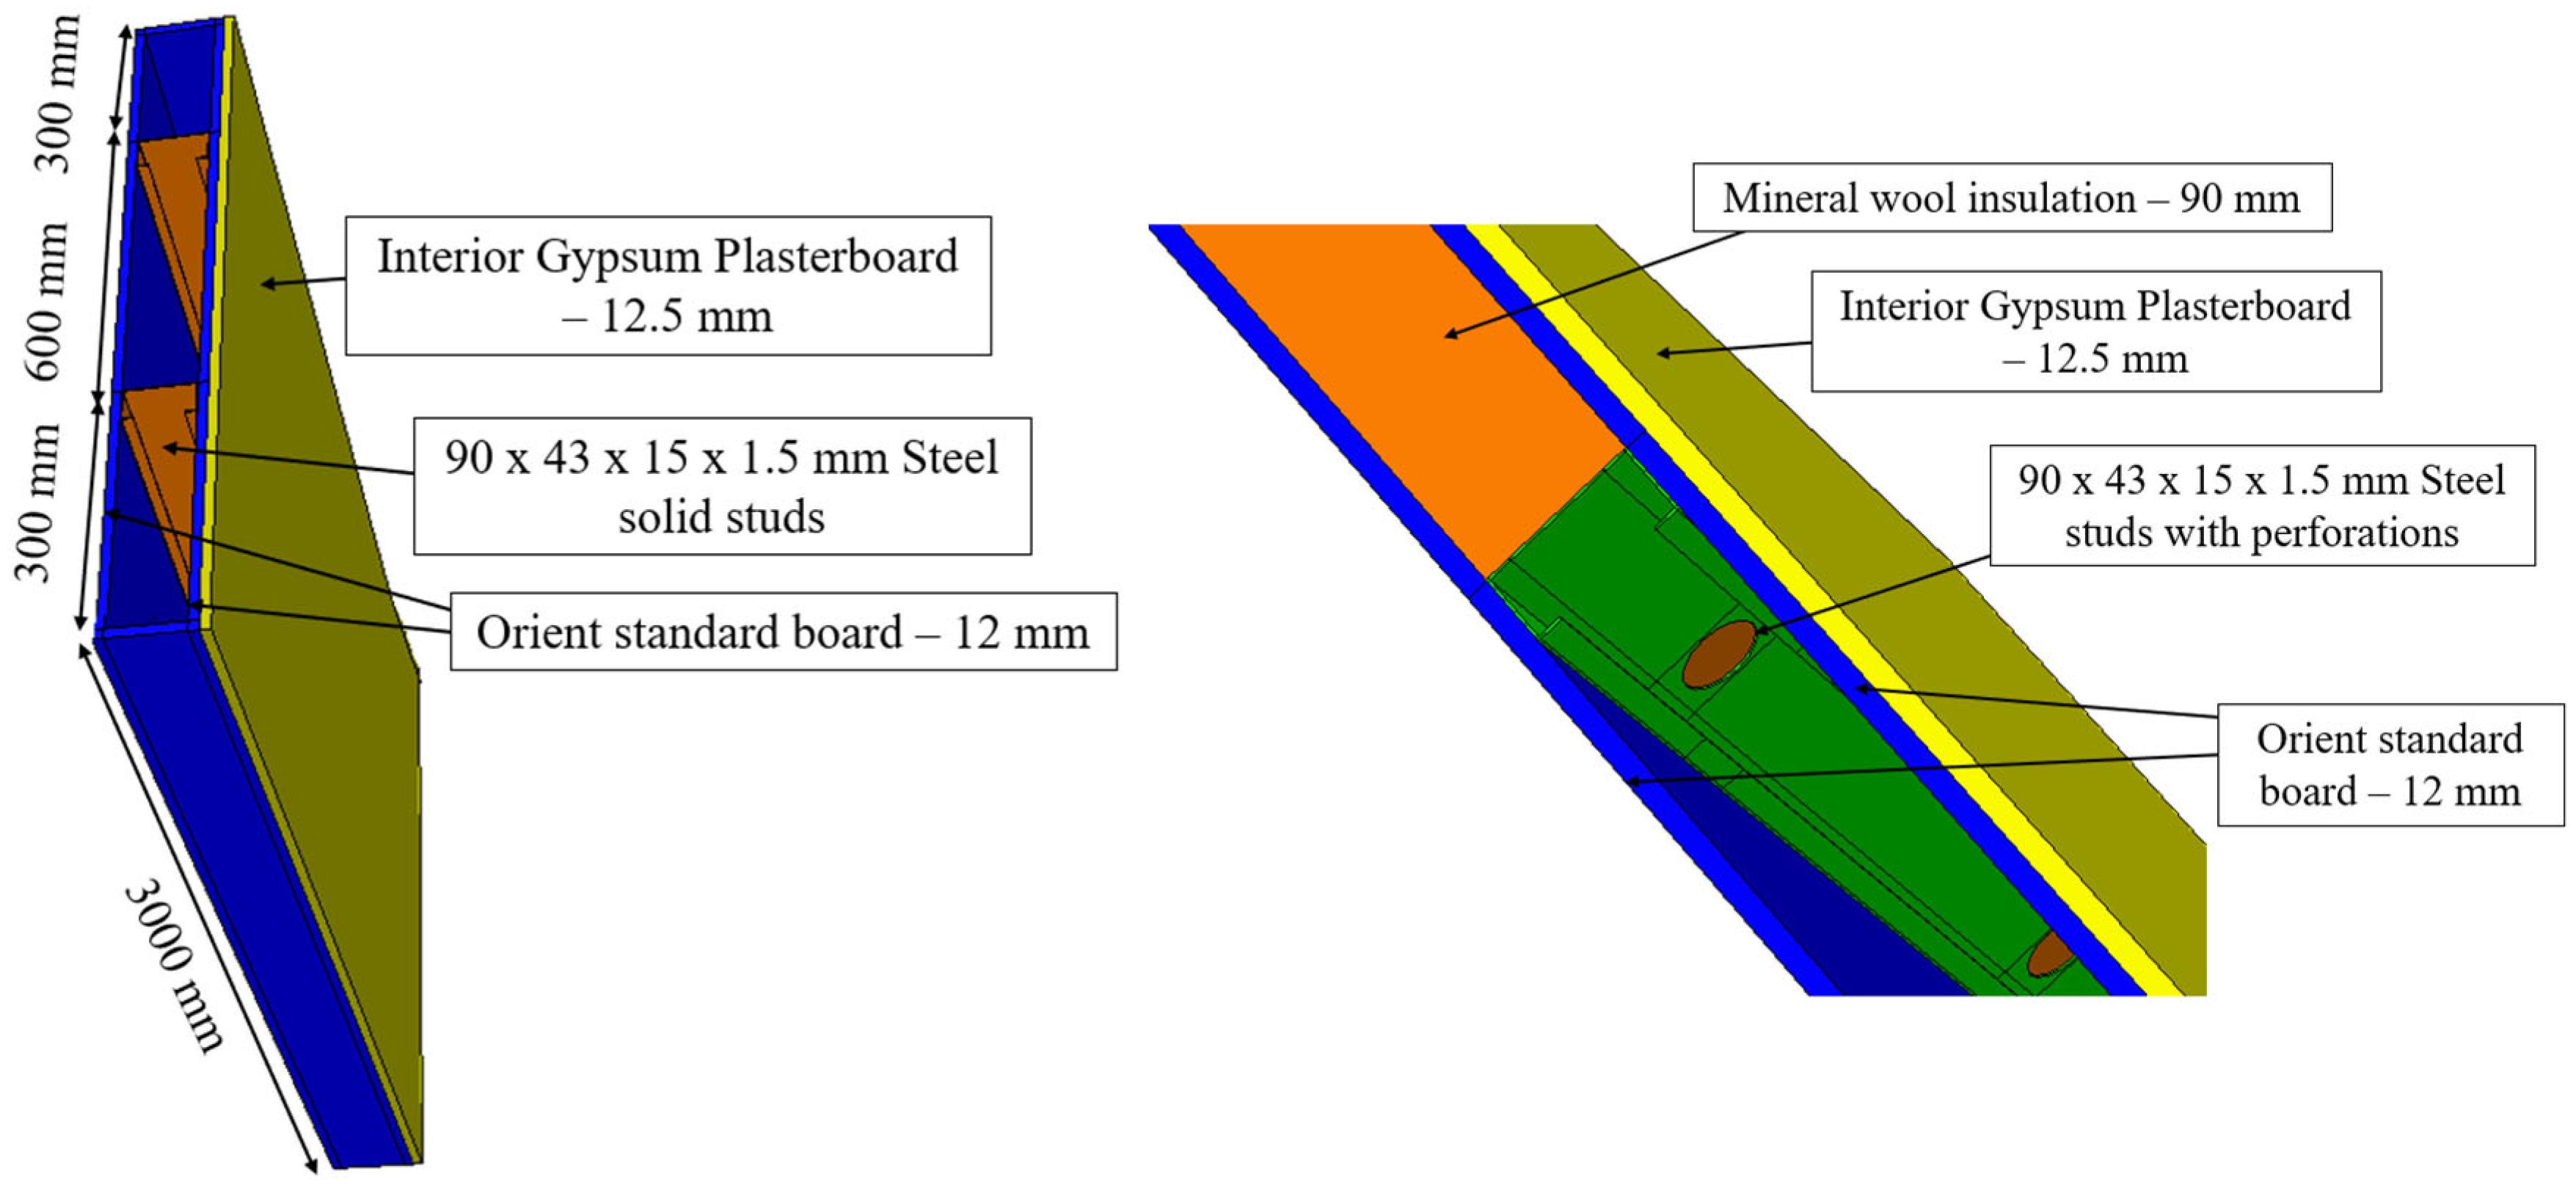
Following model validation, web perforations were introduced to the studs of the same LSF wall configuration to mitigate thermal bridging and investigate their influence on conductive heat transfer pathways. Five perforations with a diameter of 45 mm were introduced with a clear spacing of 160 mm between adjacent holes. The resulting effects on isotherm alignment and heat flux redistribution were investigated. Furthermore, a 1200 mm × 3000 mm wall with non-perforated CFS stud was developed in Abaqus to represent full scale LSF construction, as shown in Figure 5. Previous studies show that wall width has minimal impact on thermal resistance under steady-state conditions due to predominantly one-dimensional heat flow [33,34]. The 3 m height was adopted to enable axial conduction study along solid studs, followed by assessment of the potential thermal impact of introducing web perforations and the associated reduction in steel cross-sectional area. The R-value obtained from this configuration was used as a reference for subsequent analyses. To assess the influence of geometric modifications on thermal resistance, the model was then extended by incorporating circular web openings in the steel studs (Figure 5).
Moreover, the 1.5 mm thick CFS stud reported in the literature was replaced with a 1.15 mm thick section, consistent with the 3 m lipped channel stud experimentally investigated by Gunalan et al. [32] to allow structural capacity assessment. A parametric study was undertaken numerically in Abaqus, adopting the modelling methodology of Vy et al. [35] to evaluate the influence of web perforation geometry and spacing on the thermal and structural performance of CFS studs, aiming to enhance the thermal resistance of LSF walls. A total of 120 LSF configurations were evaluated by varying the web hole diameter to web depth ratio between 0.40 and 0.76, consistent with the limits defined in AS/NZS 4600 [36], National Association of Steel-Framed Housing (NASH) [37] and the NCC. Hole diameters ranged from 36 mm to 68 mm, with spacing between 120 mm and 450 mm along a 3000 mm stud length (Figure 6).
The analysis revealed that increases in thermal resistance were consistently accompanied by reductions in load-bearing capacity. To address this capacity reduction, the same configuration was refined by using 4 mm long hole-edge stiffeners, with material property identical to the base CFS stud material. This modification maintained the thermal improvement while enhancing load-bearing capacity, with the stiffened configuration substantially increasing the capacity compared to the unstiffened stud and recovering most of the capacity lost due to web perforations. The wall assembly, integrating web perforations and web-hole stiffeners, was used to evaluate the thermal performance of fire-rated external LSF walls. Five full-scale ventilated façade systems were modelled, each integrating a dedicated air cavity along with a distinct external cladding type: autoclaved aerated concrete panels, corrugated steel sheeting, non-combustible aluminium composite panels, fire-rated glass façades, and ventilated clay brick veneer. Thermal resistance was evaluated at each stage based on the required R-values for different Australian climate zones given in Table 1.
Additionally, external LSF wall performance was assessed by varying stud spacing, insulation configuration, plasterboard layers, and thermal break inclusion, benchmarked against R-value targets for extreme climates. Analytical methods, including NZS 4214 and the ASHRAE Modified Zone method, were adapted for web-perforated studs by recalculating frame fractions based on net steel area. The analytical expressions for thermal resistance were modified to account for the reduced steel cross-sectional area introduced by web perforations. Table 2 provides an overview of the present study on web-perforated CFS studs in LSF walls.

3. Three-Dimensional Heat Transfer Simulation Using Abaqus Finite Element Models

3.1. Model Description

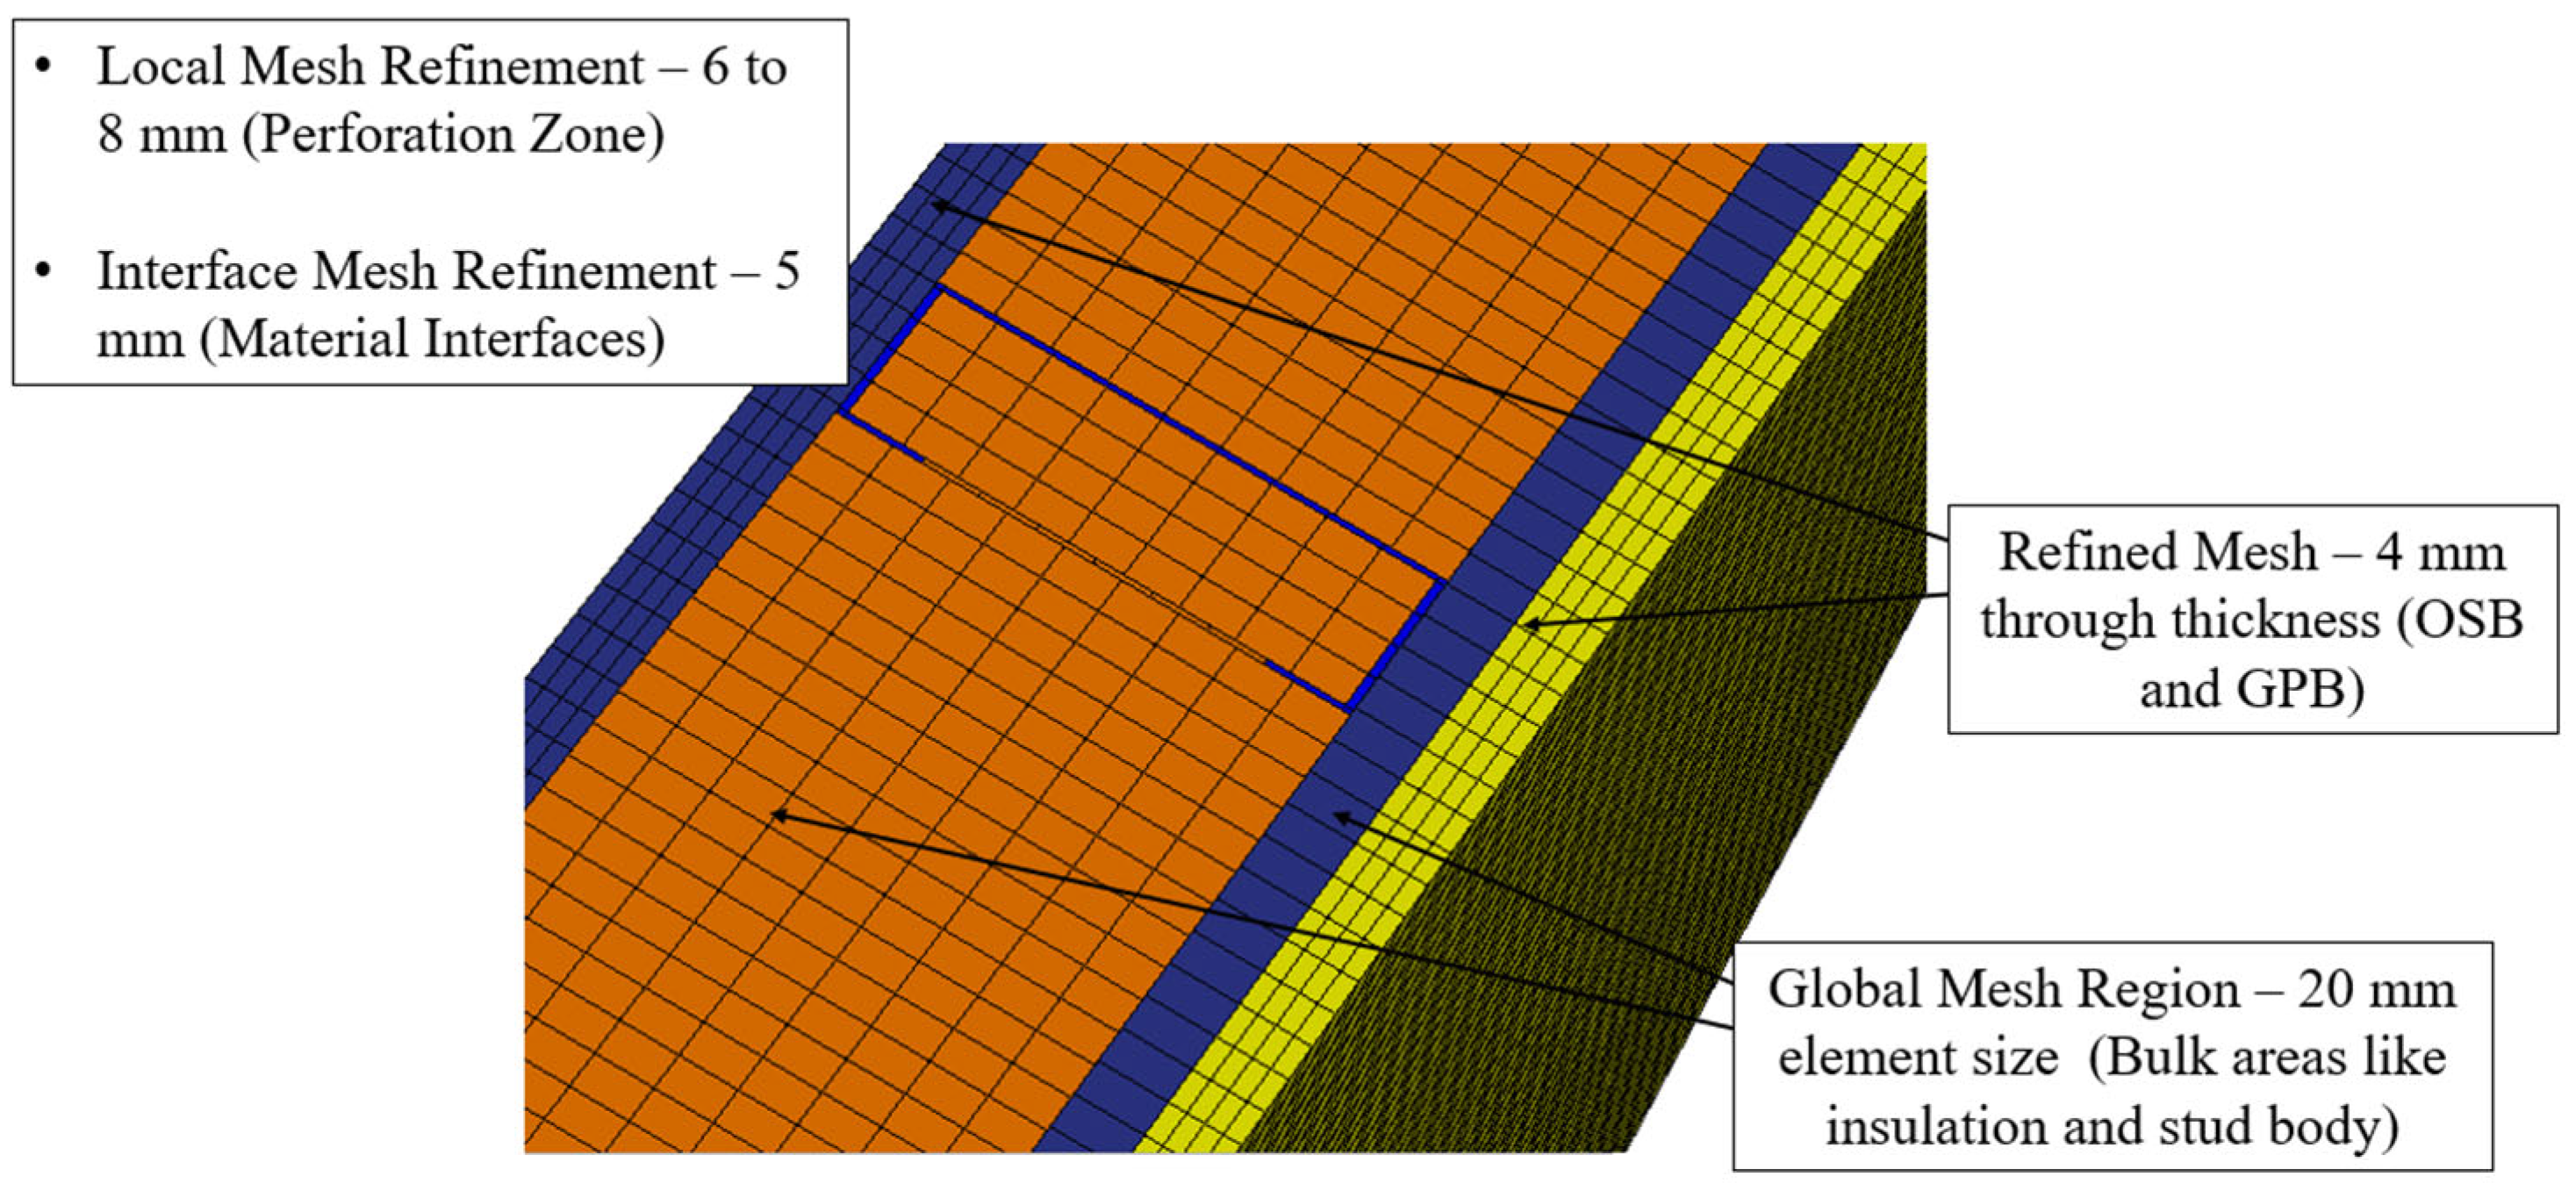
A 3D steady-state heat transfer model was developed in Abaqus/CAE 2023 [38] to evaluate the R-values of LSF wall assemblies, following the modelling framework of Ariyanayagam and Mahendran [39]. Several wall configurations were analysed, including (a) LSF wall specimens reported in the literature, measuring 1060 mm × 1030 mm with and without web perforations (Figure 3); (b) 1200 mm × 3000 mm walls with and without perforations (Figure 5); and (c) external wall assemblies with cladding, also measuring 1200 mm × 3000 mm. Configurations (b) and (c) incorporated two C90 × 43 × 15 × 1.5 mm LSF studs spaced at 600 mm, while configuration (a) used 400 mm spacing and were connected by top and bottom tracks. In configurations involving external walls, CFS battens were included. Components were assembled with spatial alignment and tie constraints ensured thermal continuity at all interfaces. All materials, including LSF framing, oriented strand board (OSB), gypsum plasterboard (GPB), and mineral wool insulation, were modelled as 3D homogeneous deformable solids using 3D eight-node linear brick elements with first-order temperature interpolation. A mesh independence study was performed to ensure accuracy of both thermal and structural simulations. Five mesh densities were examined: coarse (8 mm), medium (4 mm), and fine (2 mm). The predicted R-values for the reference wall varied by less than 1.2% between medium and fine meshes, while the axial capacity of the perforated stud differed by only 0.9%. Very fine mesh led to longer numerical simulation time. The final scheme applied a 20 mm global mesh to bulk regions such as insulation and stud bodies, 4 mm refinement through plasterboard and OSB layers, 5 mm elements at material interfaces, and 6 to 8 mm refinement around perforation zones to resolve heat-flux redistribution and stress concentrations. Mesh sensitivity analysis confirmed that further refinement produced negligible changes in the R-value, validating the mesh strategy. The final mesh configuration is illustrated in Figure 7. A steady-state heat transfer analysis was conducted to compute the temperature distribution and determine the R-value.

3.2. Constraints, Boundary Conditions and Contact Interactions

Thermal boundary conditions and heat transfer processes were defined following established finite element (FE) methods for LSF walls [40], as shown in Figure 8. Heat transfer was modelled by incorporating conduction through solid materials and convection at internal and external surfaces, while radiation was neglected under the steady-state assumption. Interfaces between LSF framing, OSB, plasterboard, and insulation were modelled using tie constraints with a tolerance of 0.0001 mm, automatically assigned through the contact detection algorithm in Abaqus. Surface film coefficients of 10 W/m2·K on the interior OSB surface and 25 W/m2·K on the exterior plasterboard face were applied, consistent with ASHRAE guidelines for vertical surfaces under natural convection, consistent with ASHRAE guidelines for vertical surfaces under natural convection [3]. To reflect the imposed temperature difference in experimental setups, boundary temperatures of 40 °C and 5 °C were used to simulate the experimental thermal gradient. Subsequently, a steady-state heat transfer step was employed with solver settings optimised for numerical stability. Surface heat flux results were used to calculate the R-value based on ISO 10211 2017 [34], and the modelling framework complied with NZS 4214 2006 for thermal resistance evaluation in LSF systems.

3.3. Thermal Resistance Calculation Using Heat Flux Measurement

The steady-state thermal performance (R-value) of the LSF wall system was evaluated in Abaqus by extracting nodal heat fluxes from five thermally critical regions: corners, cavity centre, stud location, web perforation zones, and continuous steel segments. These regions were selected to capture variations in heat transfer due to geometric and material discontinuities. Abaqus solves the steady-state heat conduction equation based on Fourier’s law, from which nodal heat fluxes (ϕᵢ) are derived. These were averaged to obtain the representative surface heat flux ϕ assuming fine meshing and uniform surface distribution, as shown in Equation (1):
ϕ 1 N i = 1 N ϕ
The thermal transmittance (U-value) was then computed by dividing the average heat flux by the applied temperature gradient ΔT (Equation (2)):
U = ϕ Δ T
The total thermal resistance (RT) of the assembly, representing its global resistance to conductive heat flow, was determined by Equation (3):
RT = 1/U
The total thermal resistance obtained from Abaqus aligns with the ISO 6946 formulation, comprising the internal and external surface resistances (Rsi, Rse) and the sum of individual layer resistances, as expressed by Equation (4):
R T   =   R si   +   x = 1 n d j k j   +   R se
Here, dj and kj are the thickness and thermal conductivity of the jth layer, n is the number of material layers in the assembly while Rsi and Rse correspond to internal and external surface resistances, typically taken as 0.13 and 0.04 m2·K/W.
The thermal results obtained from Abaqus are based on steady-state heat conduction governed by total heat transfer derived as in Equation (5) and Fourier’s law, shown in Equation (6).
Q = ϕ ¯ · A
where Q is the total heat transfer in Watts and A is the surface area of the wall in m2. The underlying heat flux distribution is defined by Equation (6),
q ¯ = k .   Δ T ,
where q ¯   is the heat flux vector (W/m2).
These formulations, applied under isotropic and homogeneous material assumptions, enabled robust calculation of the U and R-values while capturing directional thermal bridging effects introduced by CFS framing and web perforations using Abaqus as shown in Figure 9. Furthermore, Abaqus simulations incorporated appropriate thermal boundary conditions and calibrated material properties, with the resulting heat flux output (ϕ), used to compute the U-value and total thermal resistance of the LSF wall system.

4. Two-Dimensional Thermal Modelling of Load-Bearing LSF Walls Using THERM

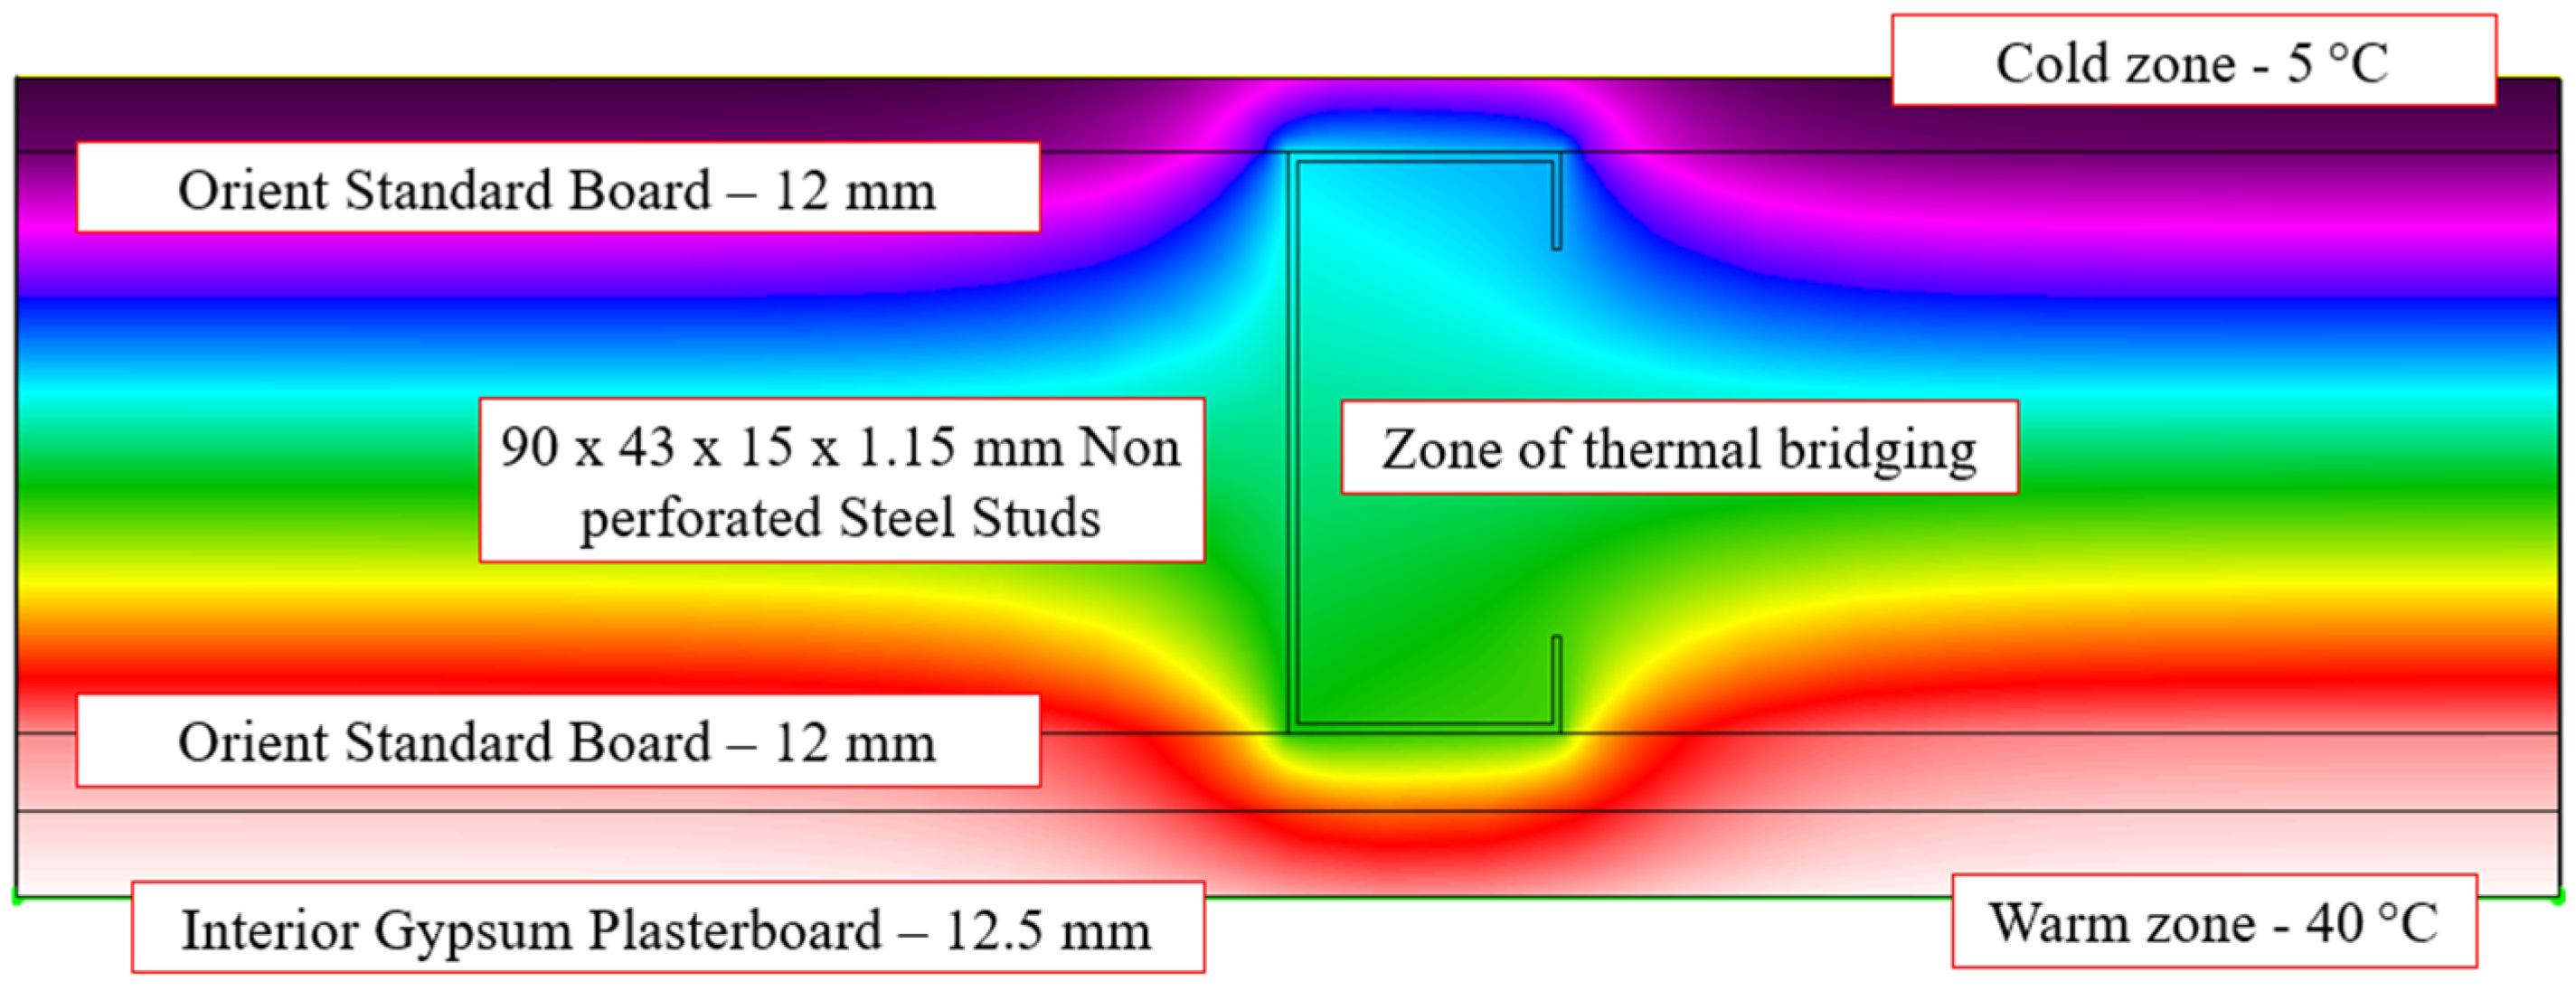
Two-dimensional steady-state thermal analysis was conducted in THERM (v7.8.2) to complement the 3D simulations in Abaqus (Figure 10). THERM was selected due to its widespread application in modelling planar conductive heat transfer in layered building envelopes. It was used alongside Abaqus to compare 2D and 3D thermal behaviour in the LSF wall assembly. The cross-sectional geometry and material properties were identical to those used in Abaqus and based on validation against experimental data from [31]. All materials were modelled as homogeneous and isotropic, with constant thermal conductivities assigned from standard references. Boundary conditions included fixed surface temperatures (40 °C interior, 5 °C exterior), and surface resistances were applied in accordance with ISO 6946:2017. These were applied as inputs but subtracted from the results to isolate the surface-to-surface R-value, in accordance with the referenced method. Mesh refinement was applied near material interfaces to capture thermal gradients while maintaining computational efficiency. Radiative and transient effects were neglected under the steady-state assumption. R-values were obtained directly from the simulation output. For perforated configurations, the thermal resistance was determined using a weighted average across perforated and adjacent solid web regions to account for the planar geometric simplification inherent to 2D THERM modelling.

5. Modified Analytical Methods for Calculating Thermal Resistance of LSF Walls with Web-Perforated Studs

5.1. Model-Based Validation of R-Values for Web-Perforated LSF Walls Using the NZS 4214 Analytical Framework

To overcome the limitations of conventional analytical methods in estimating the thermal resistance of web-perforated LSF walls, this study introduces an enhanced framework calibrated against 120 validated 3D FE simulations in Abaqus. As illustrated in Figure 11, standard approaches such as NZS 4214:2006 rely on the isothermal plane’s method, assuming uninterrupted axial conduction through continuous steel studs. These models simplify the stud as a thermally equivalent solid rectangle with effective conductivity, which fails to account for the disrupted conduction paths caused by web perforations. The equivalent rectangle conductivity expressing the equivalent thermal conductivity of the stud when simplified into an enclosing solid rectangle under the isothermal planes method is given by Equation (7):
K =   d a   k m
Also, the thermal resistance of the equivalent rectangle R is given by Equation (8):
R =   L k =   a l d   k m   + R c 1 +   R c 2
where k is the overall thermal conductivity (W/m·K) of the wall section through the metal path, d is web thickness, a is flange width, l is wall thickness, and km is the thermal conductivity of steel. However, this formulation fails to account for heat flow disruption caused by perforations, leading to overestimation of thermal bridging and underestimation of overall thermal resistance of web-perforated LSF wall. To overcome this, two corrections were introduced. First, the effective steel area was reduced by using a perforation-adjusted frame fraction and the modified frame fraction (f′s) is shown in Equation (9):
f s = f s × ( 1 A p A s )
where Ap and As denote the perforated and gross web areas and f s is the frame fraction of the LSF wall. Second, a flux redistribution factor (Cf) was developed using heat flux data from Abaqus to represent the alteration of conduction paths induced by web perforations. This factor quantifies the ratio of axial heat flux in perforated studs to that in solid studs, effectively capturing the reduction in axial conduction caused by geometric discontinuities. The correction factor is defined as shown in Equation (10):
C f = Q P Q N P
where Q P and Q N P are the surface heat fluxes for perforated and solid studs obtained from Abaqus simulations, respectively. Based on the results, the C f ranged from 0.5 to 0.9, with lower values corresponding to greater perforation size and density. The corrected stud thermal resistance incorporating this factor is expressed in Equation (11):
R W e b p e r f o r a t e d   s t e e l = a     l C f     d     k m +   R C o n t a c t 1 +   R C o n t a c t 2
This dual-modified expression captures both conduction loss due to cross-sectional voiding and the thermodynamic effects of lateral flux redistribution. The bridged layer resistance (Rb, corrected) was corrected using a perforation-adjusted frame fraction and corrected stud thermal resistance, as shown in Equation (12):
R b = f s R W e b p e r f o r a t e d   s t e e l + f i n s R i n s
The total thermal resistance of the whole system ( R T ) , including the corrected bridged layer resistance, is given by Equation (13):
R T =   R s e + R 1 + R 2 + R n + R W e b p e r f o r a t e d   s t e e l + R s i
where Rsi and Rse correspond to internal and external surface resistances, and R1 to Rn represent the thermal resistances of homogeneous material layers. The equation shows close alignment with FE predictions and extends the applicability of NZS 4214 to geometrically discontinuous LSF wall systems, offering improved accuracy in R-value estimation under realistic thermal conditions.

5.2. Modified ASHRAE Zone Method Incorporating Perforation-Based Heat Flux and Area Corrections

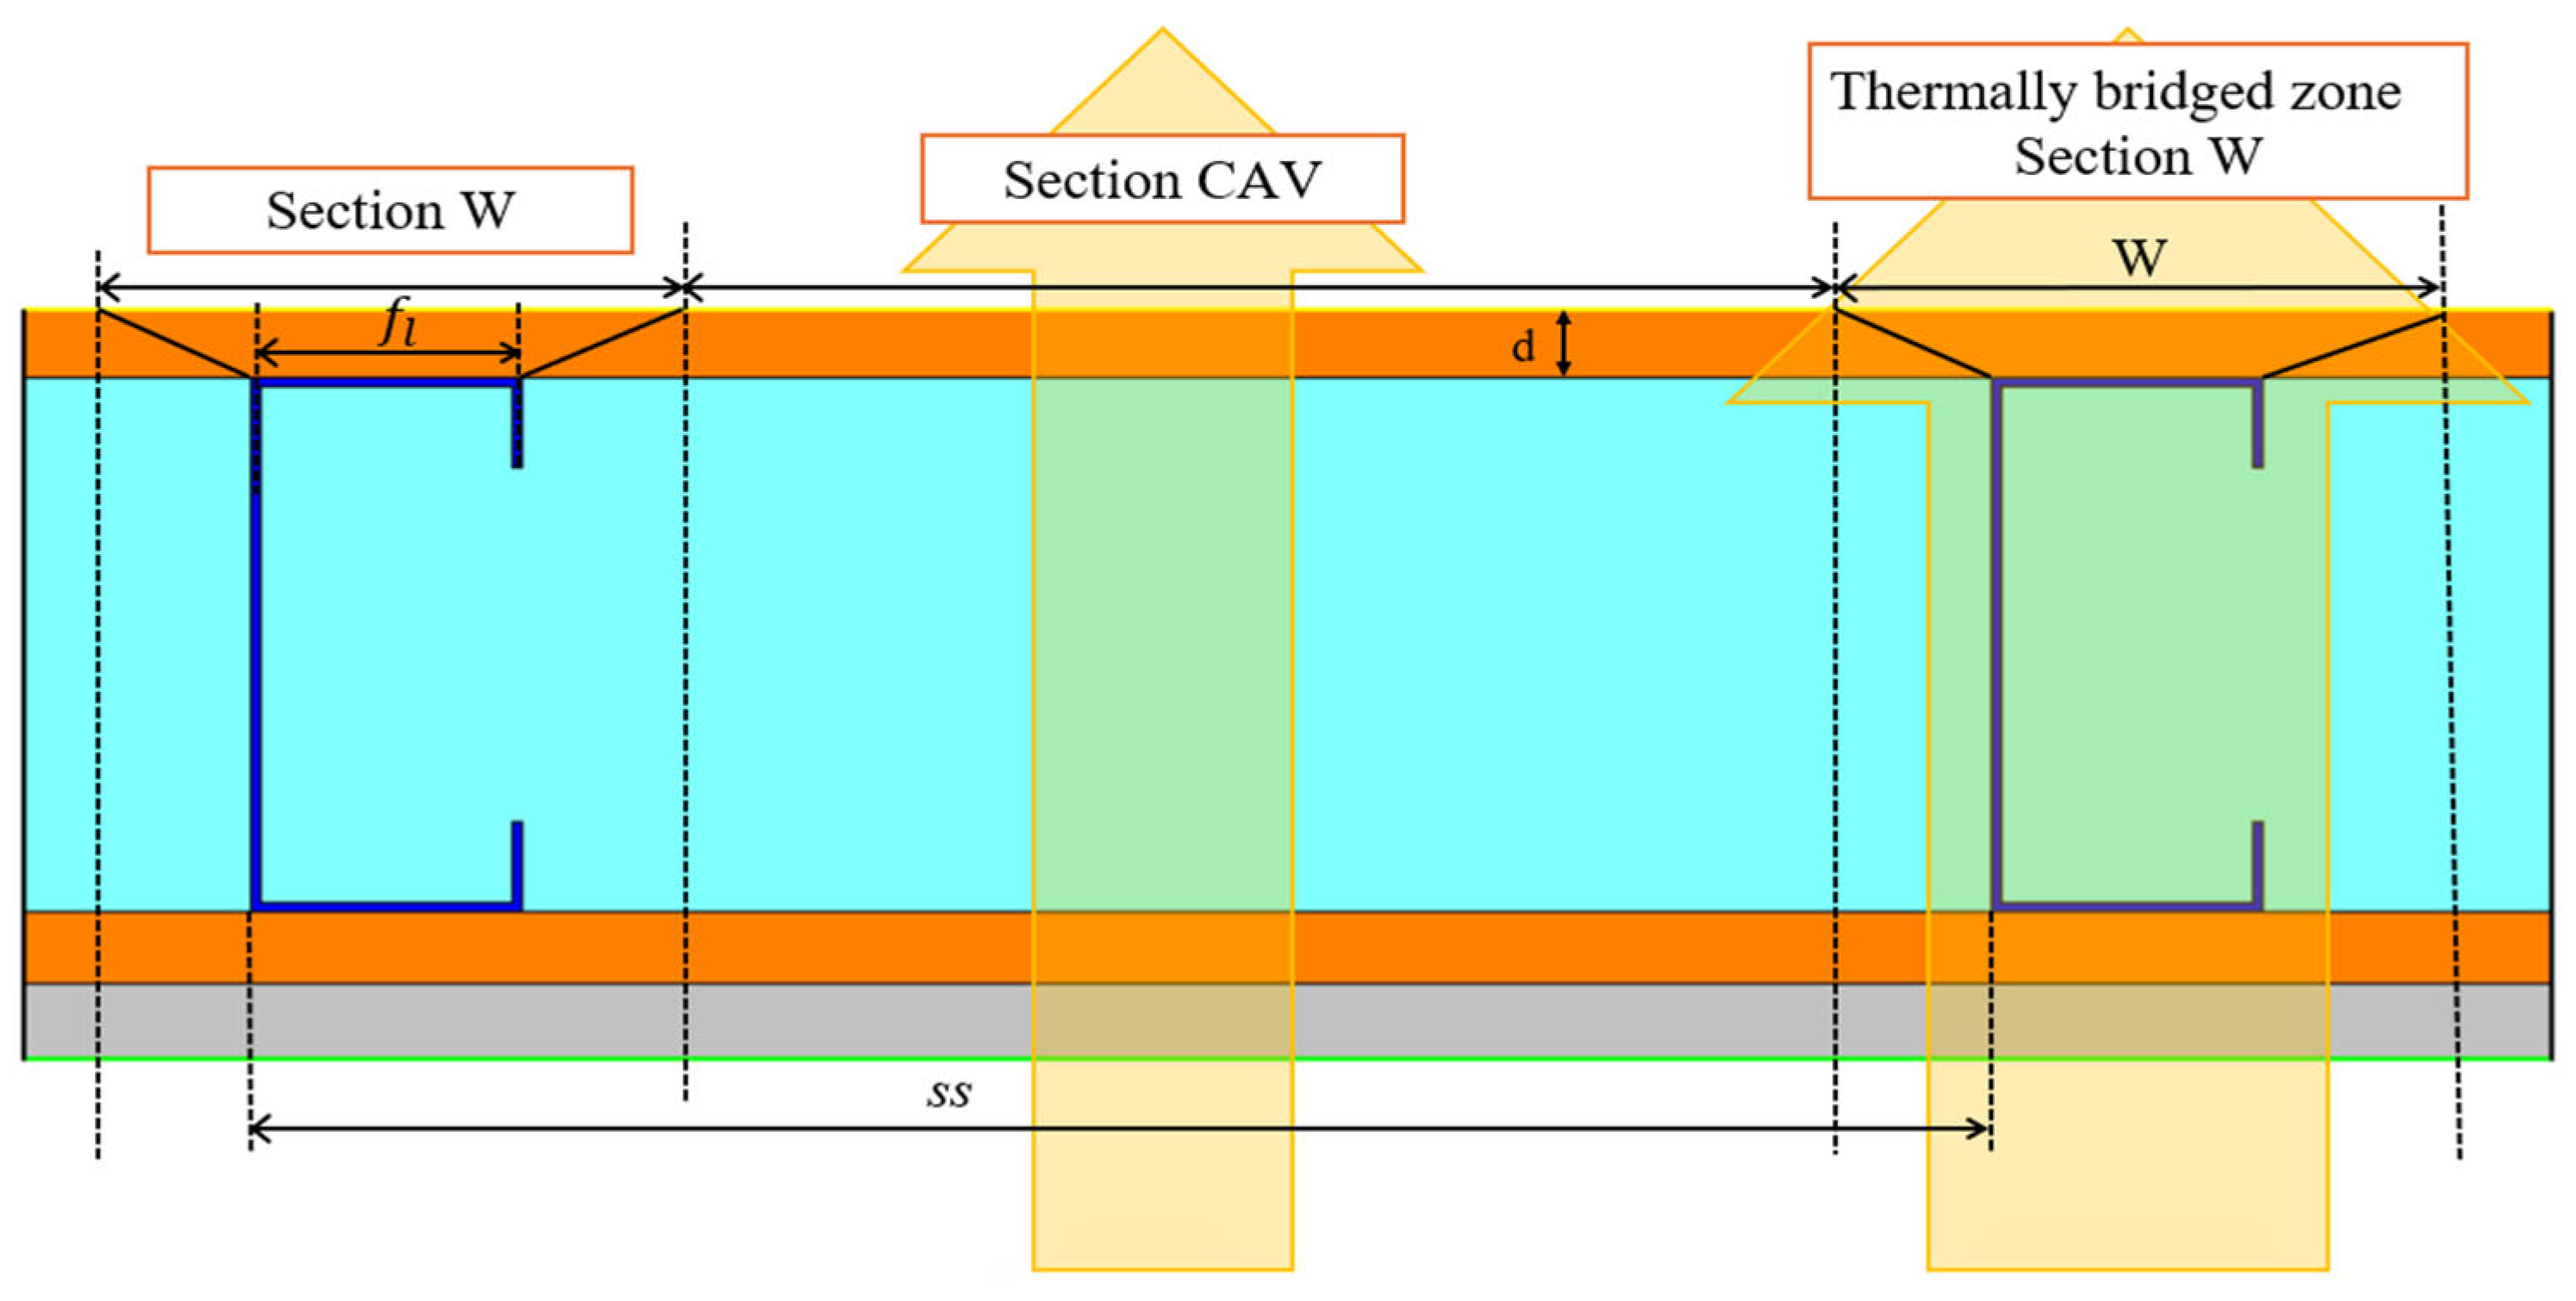
The Modified ASHRAE Zone Method was employed across all 120 web-perforated and non-perforated LSF wall configurations to evaluate R-values [13]. This method partitions the wall into two regions: a thermally bridged zone around the steel stud, Section W, and the insulated cavity, Section CAV, as shown in Figure 12. The influence zone width, w (m), is calculated by Equation (14):
w =   f l +   z f d s h e a t h
where f l is the stud flange width, d s h e a t h is the thicker sheathing thickness, and z f is a geometry and resistivity dependent factor derived from empirical charts.
For walls where at least one sheathing exceeds 16 mm, z f is derived from fitted power-law trendlines specific to each stud size. When both sheathings are thinner than 16 mm, a simplified rule assigns z f   = −0.5 for rsheathing ≤ 10.4 m·K/W and z f   = −0.5 for rsheathing > 10.4 m·K/W, where rsheathing is the sheathing resistivity. The overall thermal resistance is then computed using a parallel path formulation shown in Equation (15):
1 R t o t a l = w s s 1 R w + 1 w s s 1 R C a v
where s s is the stud spacing, R w (m2·K/W) is the resistance in Section W, which is the zone influenced by the stud, and R C a v is the resistance of the remaining cavity layers. In Section W, the resistance of each wall layer is computed as a parallel conduction path between steel and insulation given by Equation (16):
1 R j =   f j ( m e t ) R j ( m e t ) + f j ( i n s ) R j ( i n s )
where f j ( m e t ) and f j ( i n s ) are the area fractions of metal and insulation in layer j, and R j ( m e t ) and R j ( i n s ) are their respective resistances (m2·K/W). To capture the impact of web perforations, two corrections were introduced. First, the metal area fraction was reduced to reflect the loss of steel cross-section using Equation (17):
f j m e t ,   c o r r e c t e d =   f j m e t * ( 1   A p A s )
where A p is the total perforated area (m2) and A s is the gross web area of the stud (m2). Second, a heat flux correction factor was introduced to represent the reduction in heat conduction capacity due to perforations as shown in Equation (18):
C f =   Q P Q N P
where Q P and Q N P are the average surface heat fluxes through perforated and non-perforated studs (W/m2), respectively, extracted from steady-state FE simulations. The resistance of the steel conduction path was then corrected using Equation (19):
R j ( m e t ,   c o r r e c t e d ) =   R j ( S o l i d ) C f
Finally, the corrected total resistance for the stud-influenced zone is expressed by Equation (20):
1 R j ( W e b p e r o a t e d   s t e e l ) =   f j m e t ( 1   A p A s )   R j ( S o l i d ) C f + f j ( i n s ) R j ( i n s )
The total thermal resistance of the whole system ( R T ) , is given by Equation (13). This dual correction accounts for both geometric perforation-induced reductions in steel area and flux-based attenuation of thermal conduction, enabling the Modified ASHRAE Zone Method to deliver physically accurate and analytically efficient R-value predictions for discontinuous steel-framed wall systems.

6. Analysis of Results

6.1. Validation of Numerical Models

The developed numerical heat transfer thermal models were validated against the test results from a reference LSF wall specimen (1030 mm × 1060 mm) under steady-state conditions. As shown in Table 3, all predicted R-values (surface-to-surface) deviated by less than 5% from the experimental values, confirming the reliability of the modelling approaches. The Abaqus 3D FE model accurately simulated steady-state heat conduction by resolving 3D heat flux vectors, including anisotropic conduction through steel studs and thermal interface resistances. In contrast, the 2D THERM simulation, constrained by planar assumptions, slightly overestimated thermal resistance by neglecting through-thickness conduction paths and localised multidirectional fluxes near geometric discontinuities. Analytical methods based on NZS 4214 (Isothermal Planes Method) and the ASHRAE Modified Zone Method applied layer-based approximations and frame correction factors to estimate thermal bridging effects. Despite their geometric simplifications, both analytical approaches produced R-values within an acceptable margin of experimental results. The validated models, particularly the 3D Abaqus model, demonstrated sufficient spatial resolution to capture complex thermal bridging phenomena, including localised resistance zones. This good agreement across experimental, numerical, and analytical results establishes a robust basis for evaluating advanced thermal mitigation strategies in LSF wall systems.

6.2. Thermal Resistance Enhancement in LSF Walls with Perforated Studs

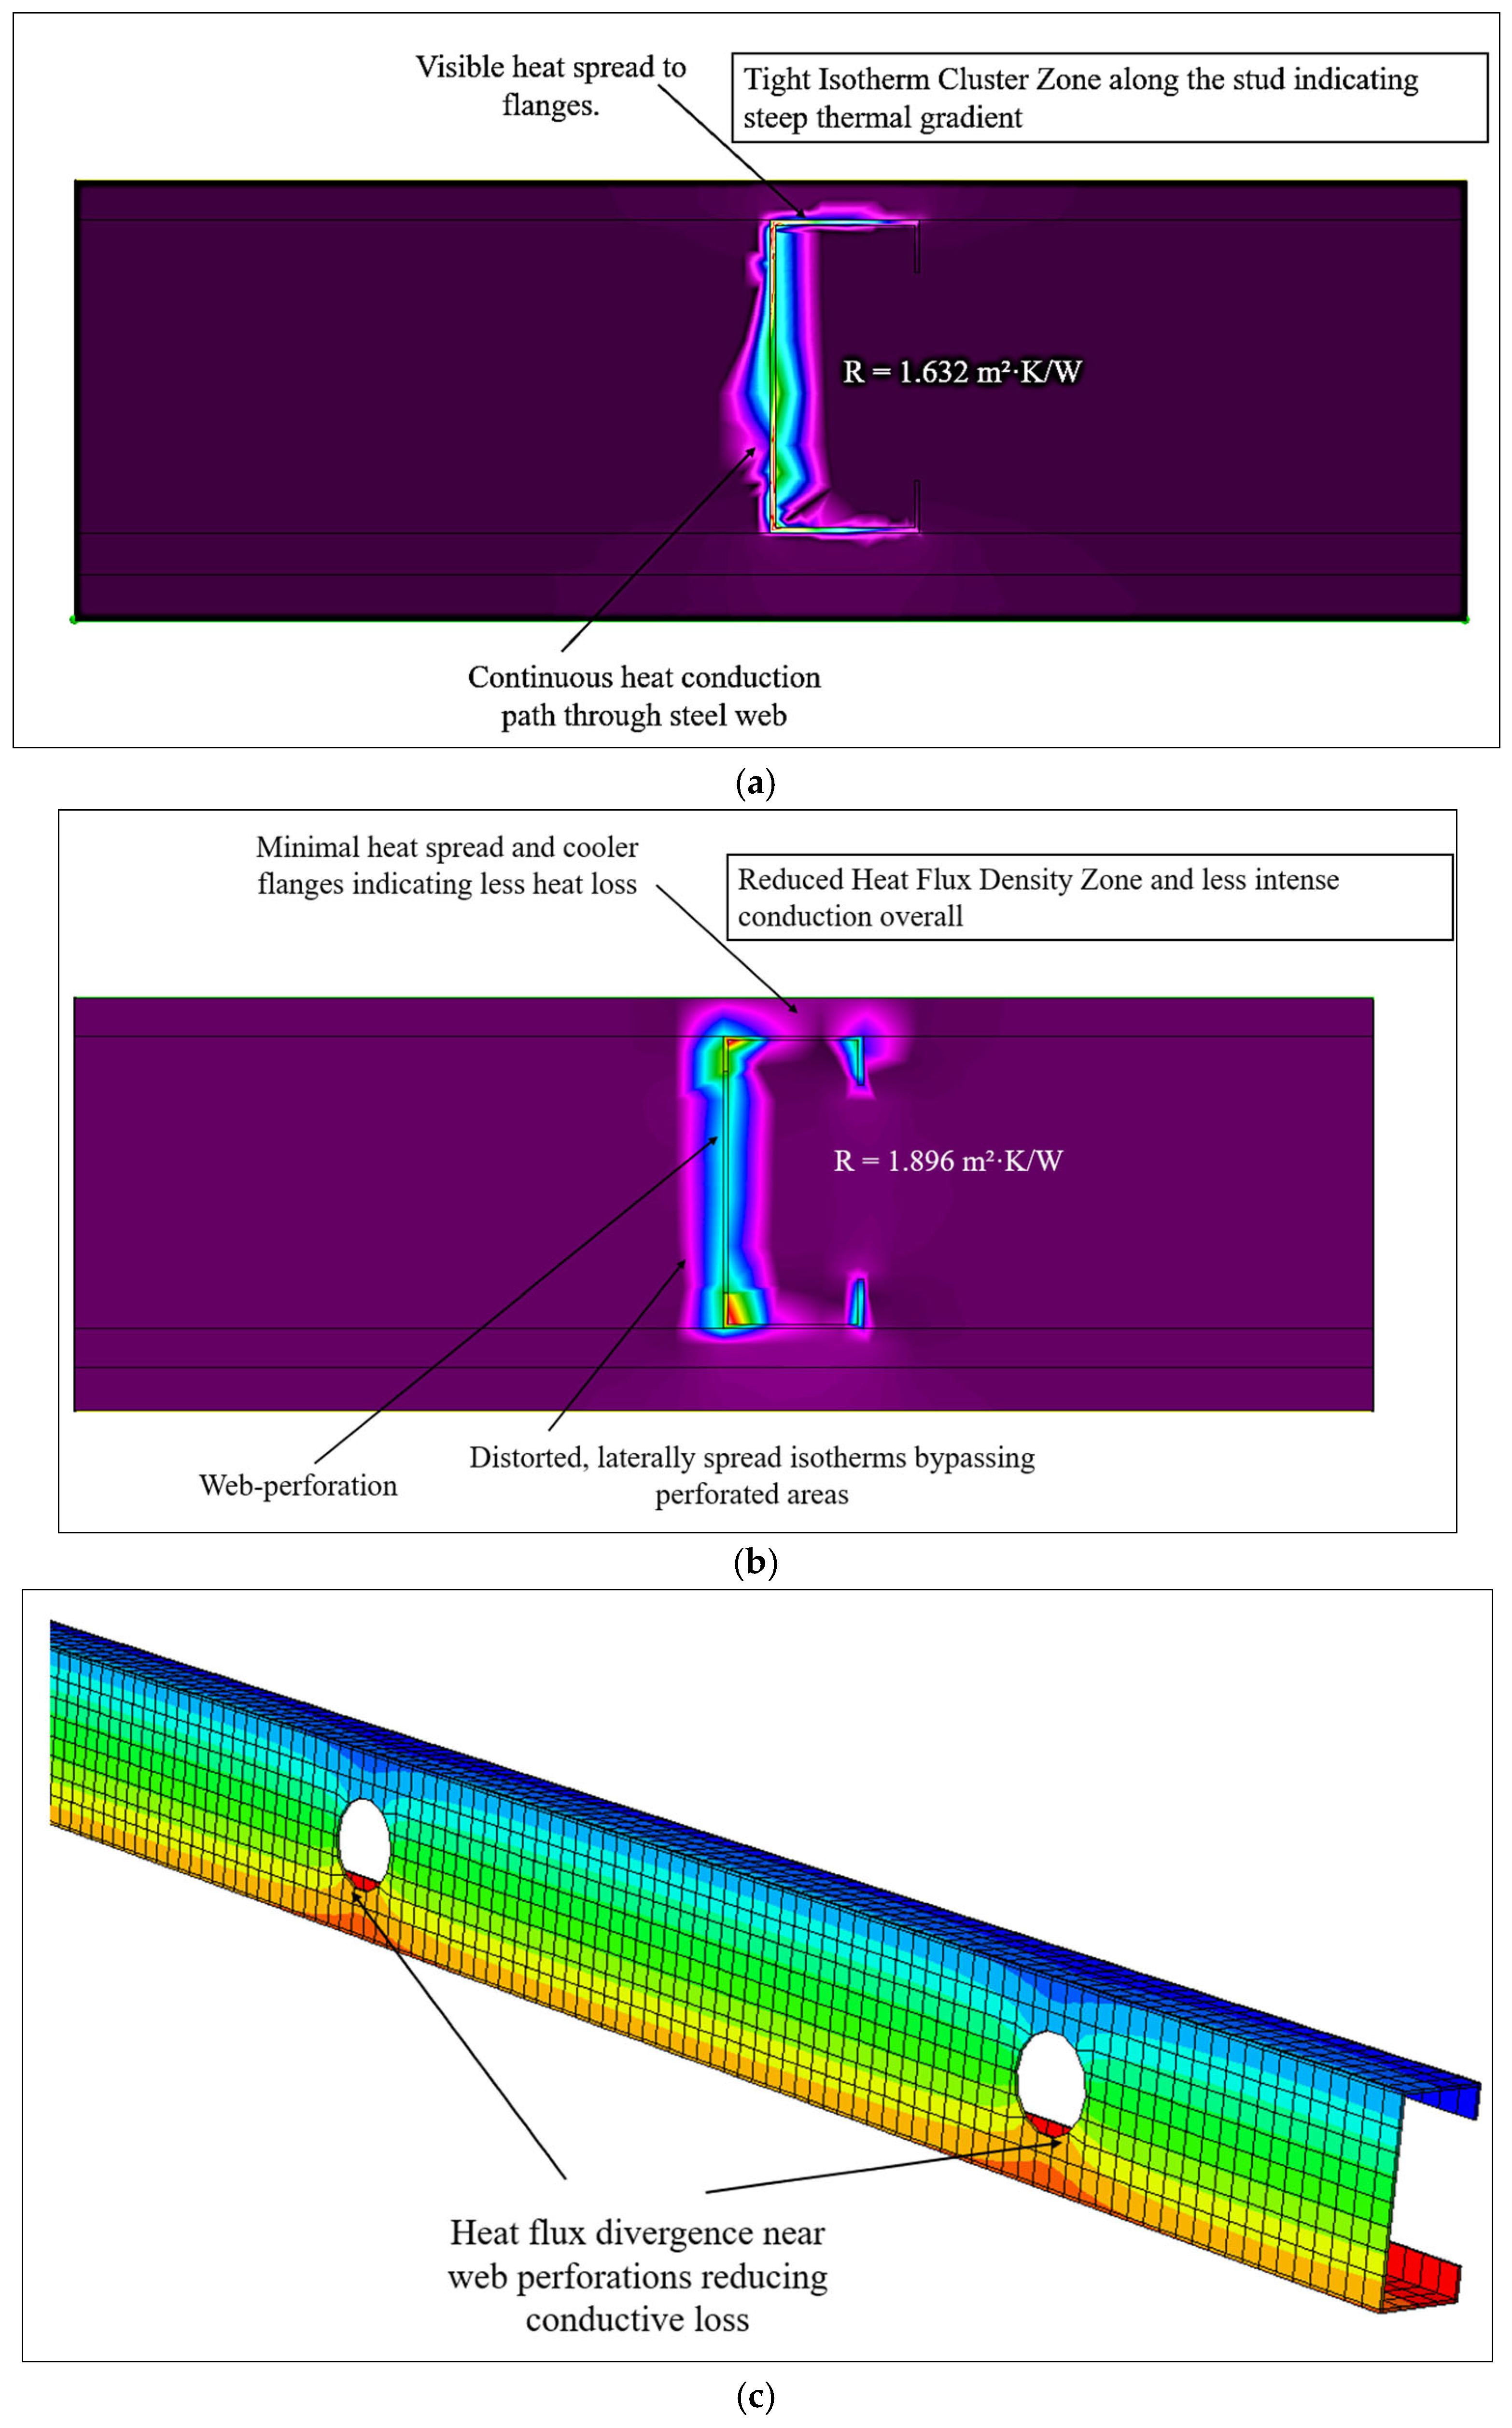
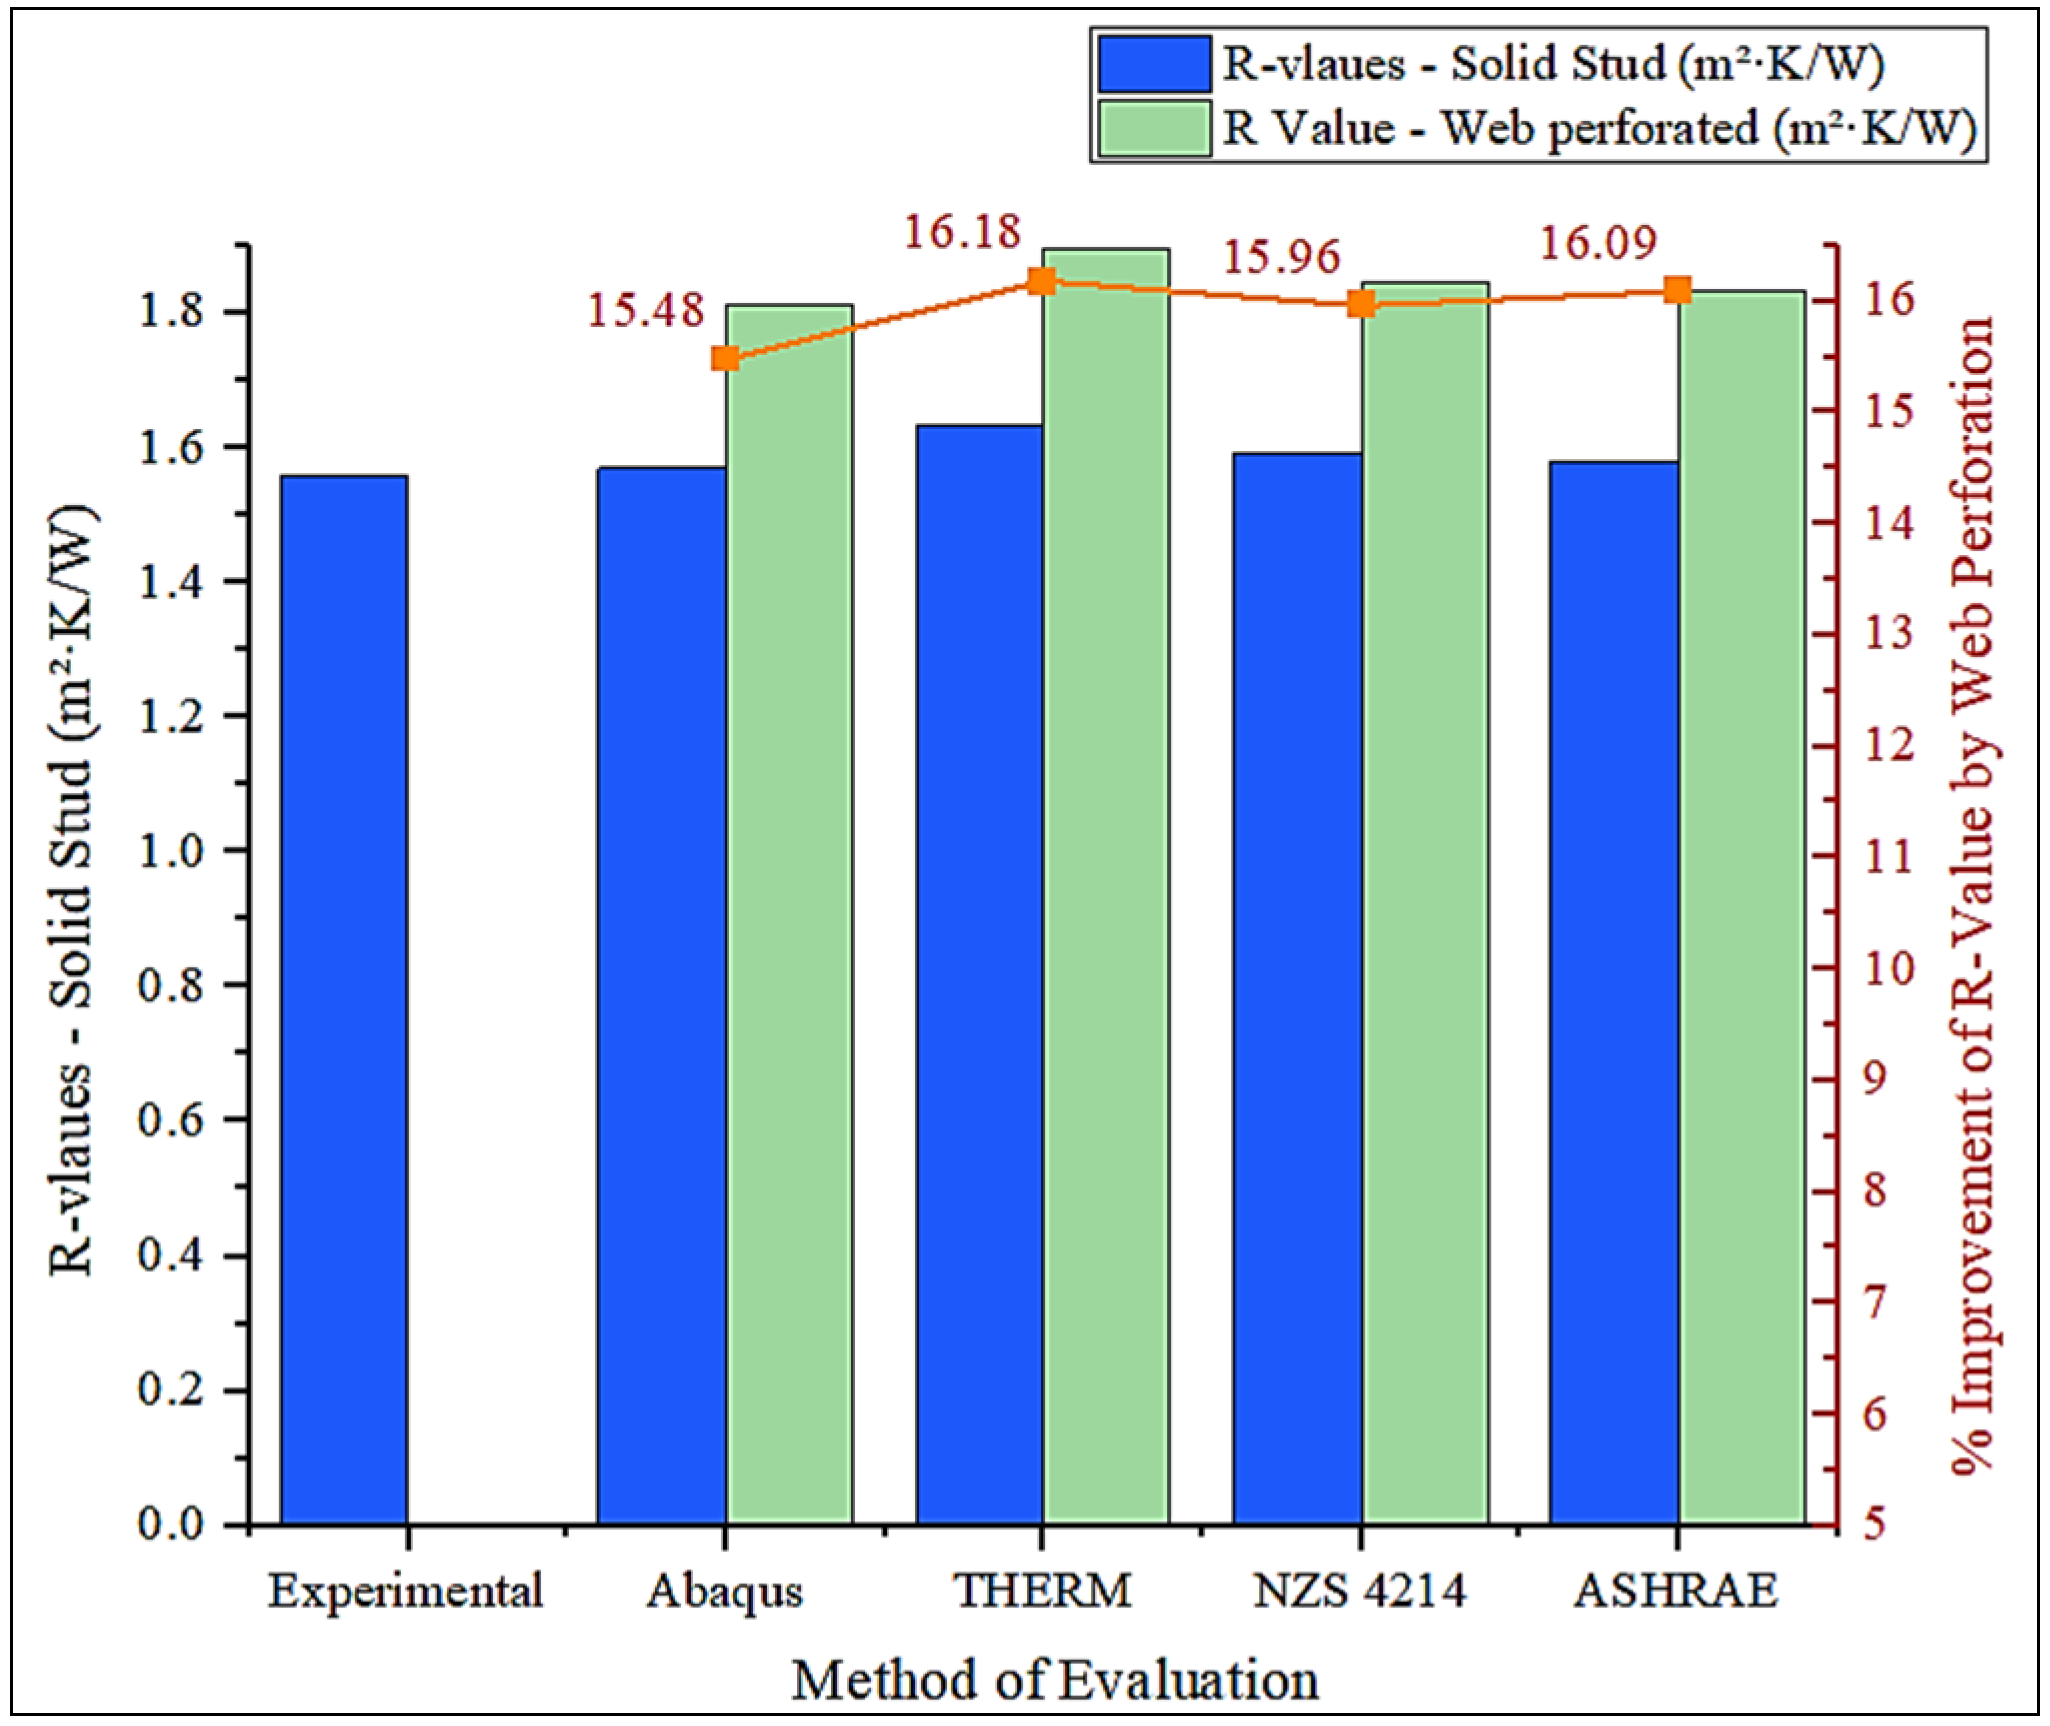
To mitigate thermal bridging in LSF walls, five web perforations were introduced, with a hole diameter of 45 mm and a spacing of 160 mm. The experimentally measured R-value for non-perforated studs was 1.558 m2·K/W. Numerical simulations incorporating web perforations predicted enhanced R-values in the range of 1.813 to 1.896 m2·K/W, depending on the evaluation method, as shown in Table 4. These correspond to relative improvements of approximately 15.4% to 16.2%. The enhancement is attributed to a reduction in effective thermal conductivity (keff), resulting from the replacement of thermally conductive steel sections with air voids in the web region. This alteration elongates the conduction path and interrupts direct heat flow [33]. Consequently, the net heat flux (q) across the wall assembly decreased. The Biot number remained well below unity, confirming a conduction-dominated regime. The efficiency of web perforations in improving thermal resistance is illustrated by the results of the 2D THERM and 3D Abaqus simulations shown in Figure 13.
Among the numerical methods, the highest R value of 1.896 m2·K/W was achieved by the 2D THERM simulation, representing a 16.18% improvement over its non-perforated counterpart (Figure 14). NZS 4214 and the ASHRAE Modified Zone methods predicted R values of 1.845 and 1.833 m2·K/W, corresponding to respective improvements of 15.96% and 16.09%. The 3D Abaqus model produced an R value of 1.813 m2·K/W, indicating a 15.48% increase. Although 2D and analytical models offer computational efficiency, they assume planar conduction and uniform cross-sections, thereby overlooking multidirectional heat transfer effects that are critical in perforated configurations. In contrast, the 3D modelling approach resolves cross-plane heat fluxes, localized thermal bridging zones, and multiaxial conduction paths, offering a more accurate representation of the thermal behaviour of perforated LSF wall systems [41].
Figure 15 depicts the thermal response of the non-perforated LSF wall, where uniformly spaced, orthogonal isotherms in the insulation zones signify idealised one-dimensional conduction governed by Fourier’s law (q = −k ∇T). As the isotherms approach the steel stud, they bend sharply and become highly compressed, especially within the web, reflecting steep thermal gradients and concentrated axial heat flux. This distortion illustrates anisotropic conduction and confirms the formation of a pronounced thermal bridge, as the high-conductivity steel provides a low-resistance path that short-circuits the surrounding insulation. In contrast, Figure 16 (perforated stud) reveals a disruption in isotherm alignment through the web, where geometric discontinuities attenuate axial conduction and redistribute heat laterally into the adjacent insulation. The contours are more widely spaced within the web zone, indicating increased local resistance and diminished gradient magnitude.
Heat flux vectors in the LSF wall with web perforations demonstrate redistribution of heat flow around the openings, reducing flux density along the stud web and thereby diminishing the strong conduction pathway observed in the non-perforated case. Compared with the directional flux convergence evident in the solid-stud wall, the perforated profile promotes lateral dispersion into the insulation and reduces thermal short-circuiting. Collectively, these behaviours confirm that web perforations shift the conduction balance from stud-dominated to insulation-dominated, thereby enhancing overall thermal resistance.

6.3. Thermal Performance of 3 m High LSF Walls

6.3.1. Walls with Non-Perforated Steel Studs

To simulate actual construction conditions and extend thermal analysis beyond laboratory scale, a 3 m high and 1.2 m wide LSF wall with non-perforated steel studs was modelled using the same configuration as the validated 1030 mm × 1060 mm wall assembly. Material layers, sheathing, and stud spacing were held constant. The Abaqus model predicted an R-value of 1.55 m2·K/W, showing a slight reduction compared to the 1030 mm wall which recorded 1.57 m2·K/W. The THERM model yielded 1.621 m2·K/W for both cases, while the NZS 4214 and ASHRAE Modified Zone methods reported values of 1.59 and 1.583 m2·K/W, respectively. The marginal decrease observed in Abaqus model is attributed to enhanced numerical resolution of temperature gradients along the extended steel conduction path. Greater nodal density enabled the model to capture localised flux intensification near steel and sheathing interfaces, increasing the computed heat flow and slightly reducing net resistance. Analytical methods, which apply simplified planar assumptions, remained unaffected by stud height variation. These findings validate the thermal scalability of non-perforated LSF walls and established a reference case for subsequent evaluation of web-perforated configurations in full-height assemblies.

6.3.2. Walls with Perforated Steel Studs

Following the validation of the 3 m high non-perforated LSF wall, a similar wall with web-perforated steel studs was modelled to assess the impact of perforations on thermal resistance. Various configurations of web perforations were analysed with diameters (d) varying from 36 mm to 68 mm, spacing from 200 mm to 450 mm, and the number of perforations ranging from 5 to 12 per stud using Abaqus FE simulations, as well as comparative assessments through THERM, NZS 4214 and ASHRAE Modified Zone methods. In all cases, the edge distance from the hole centre was maintained between 3d to 4d based on AS/NZS 4600 and NASH guidelines. Among all configurations, the layout comprising 68 mm diameter holes spaced at 200 mm with 10 perforations as shown in Figure 17, produced the highest thermal resistance of 1.892 m2·K/W, corresponding to a 20.06% increase compared to the non-perforated reference wall.
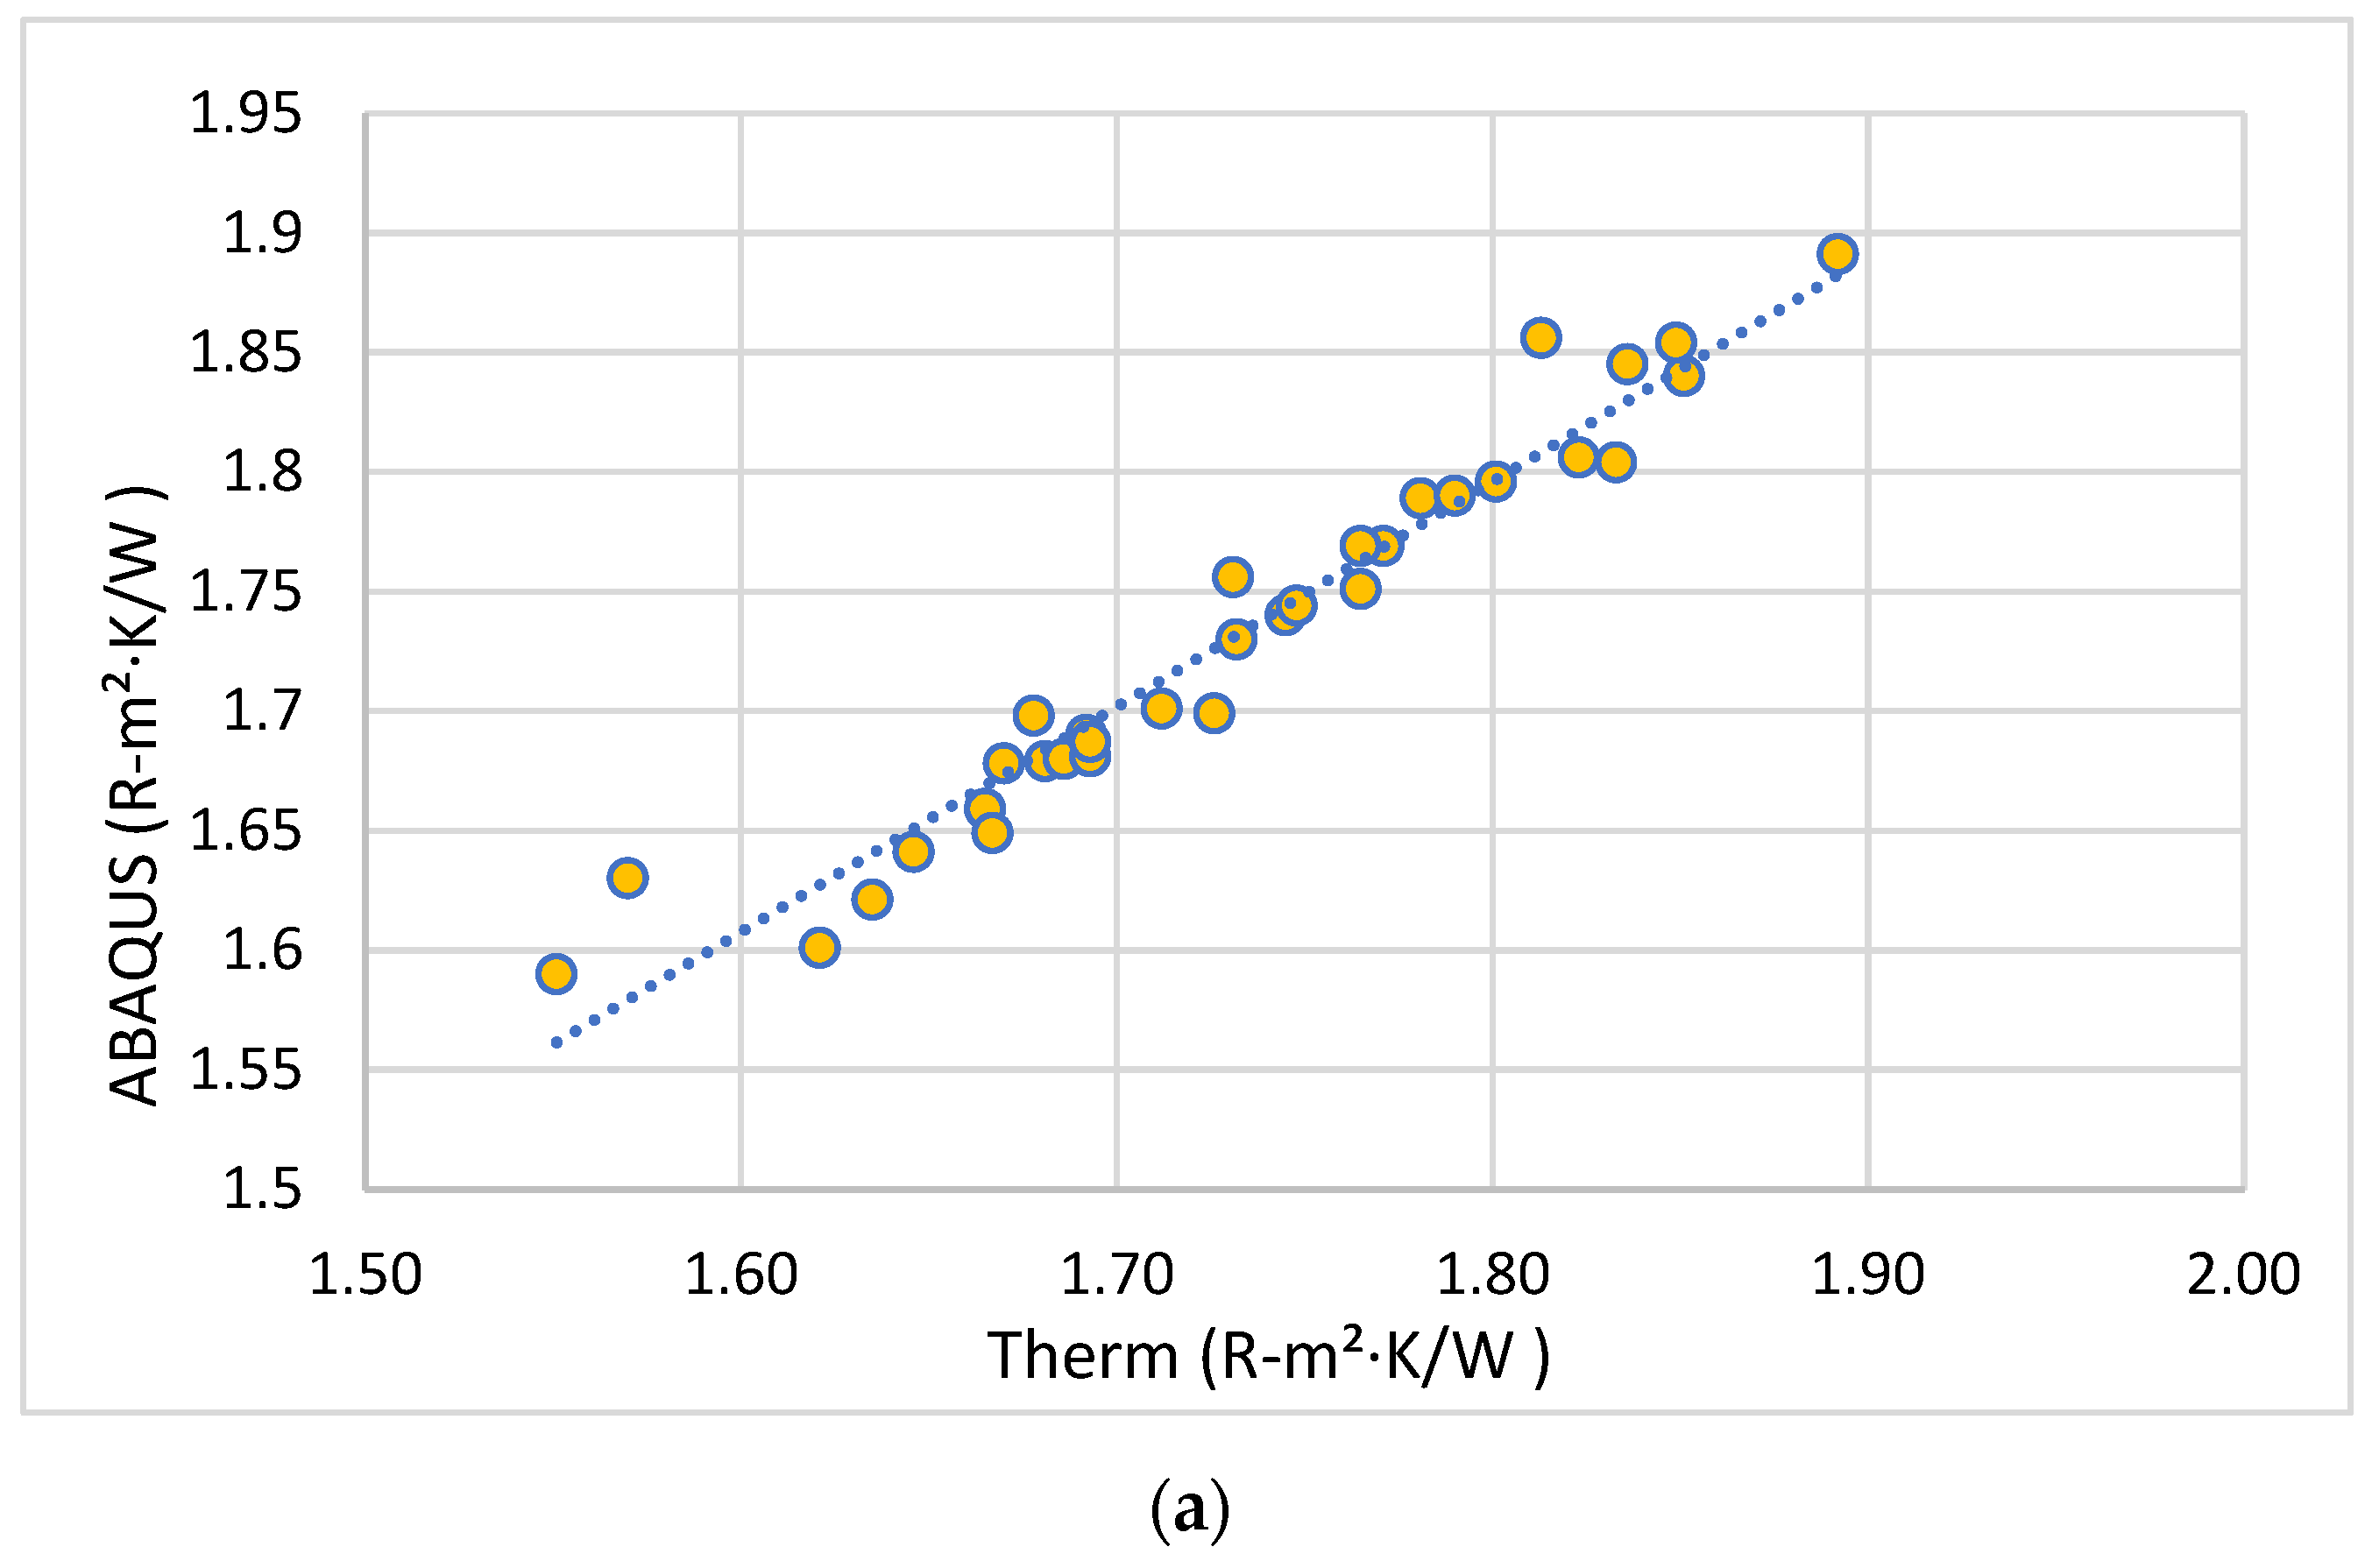
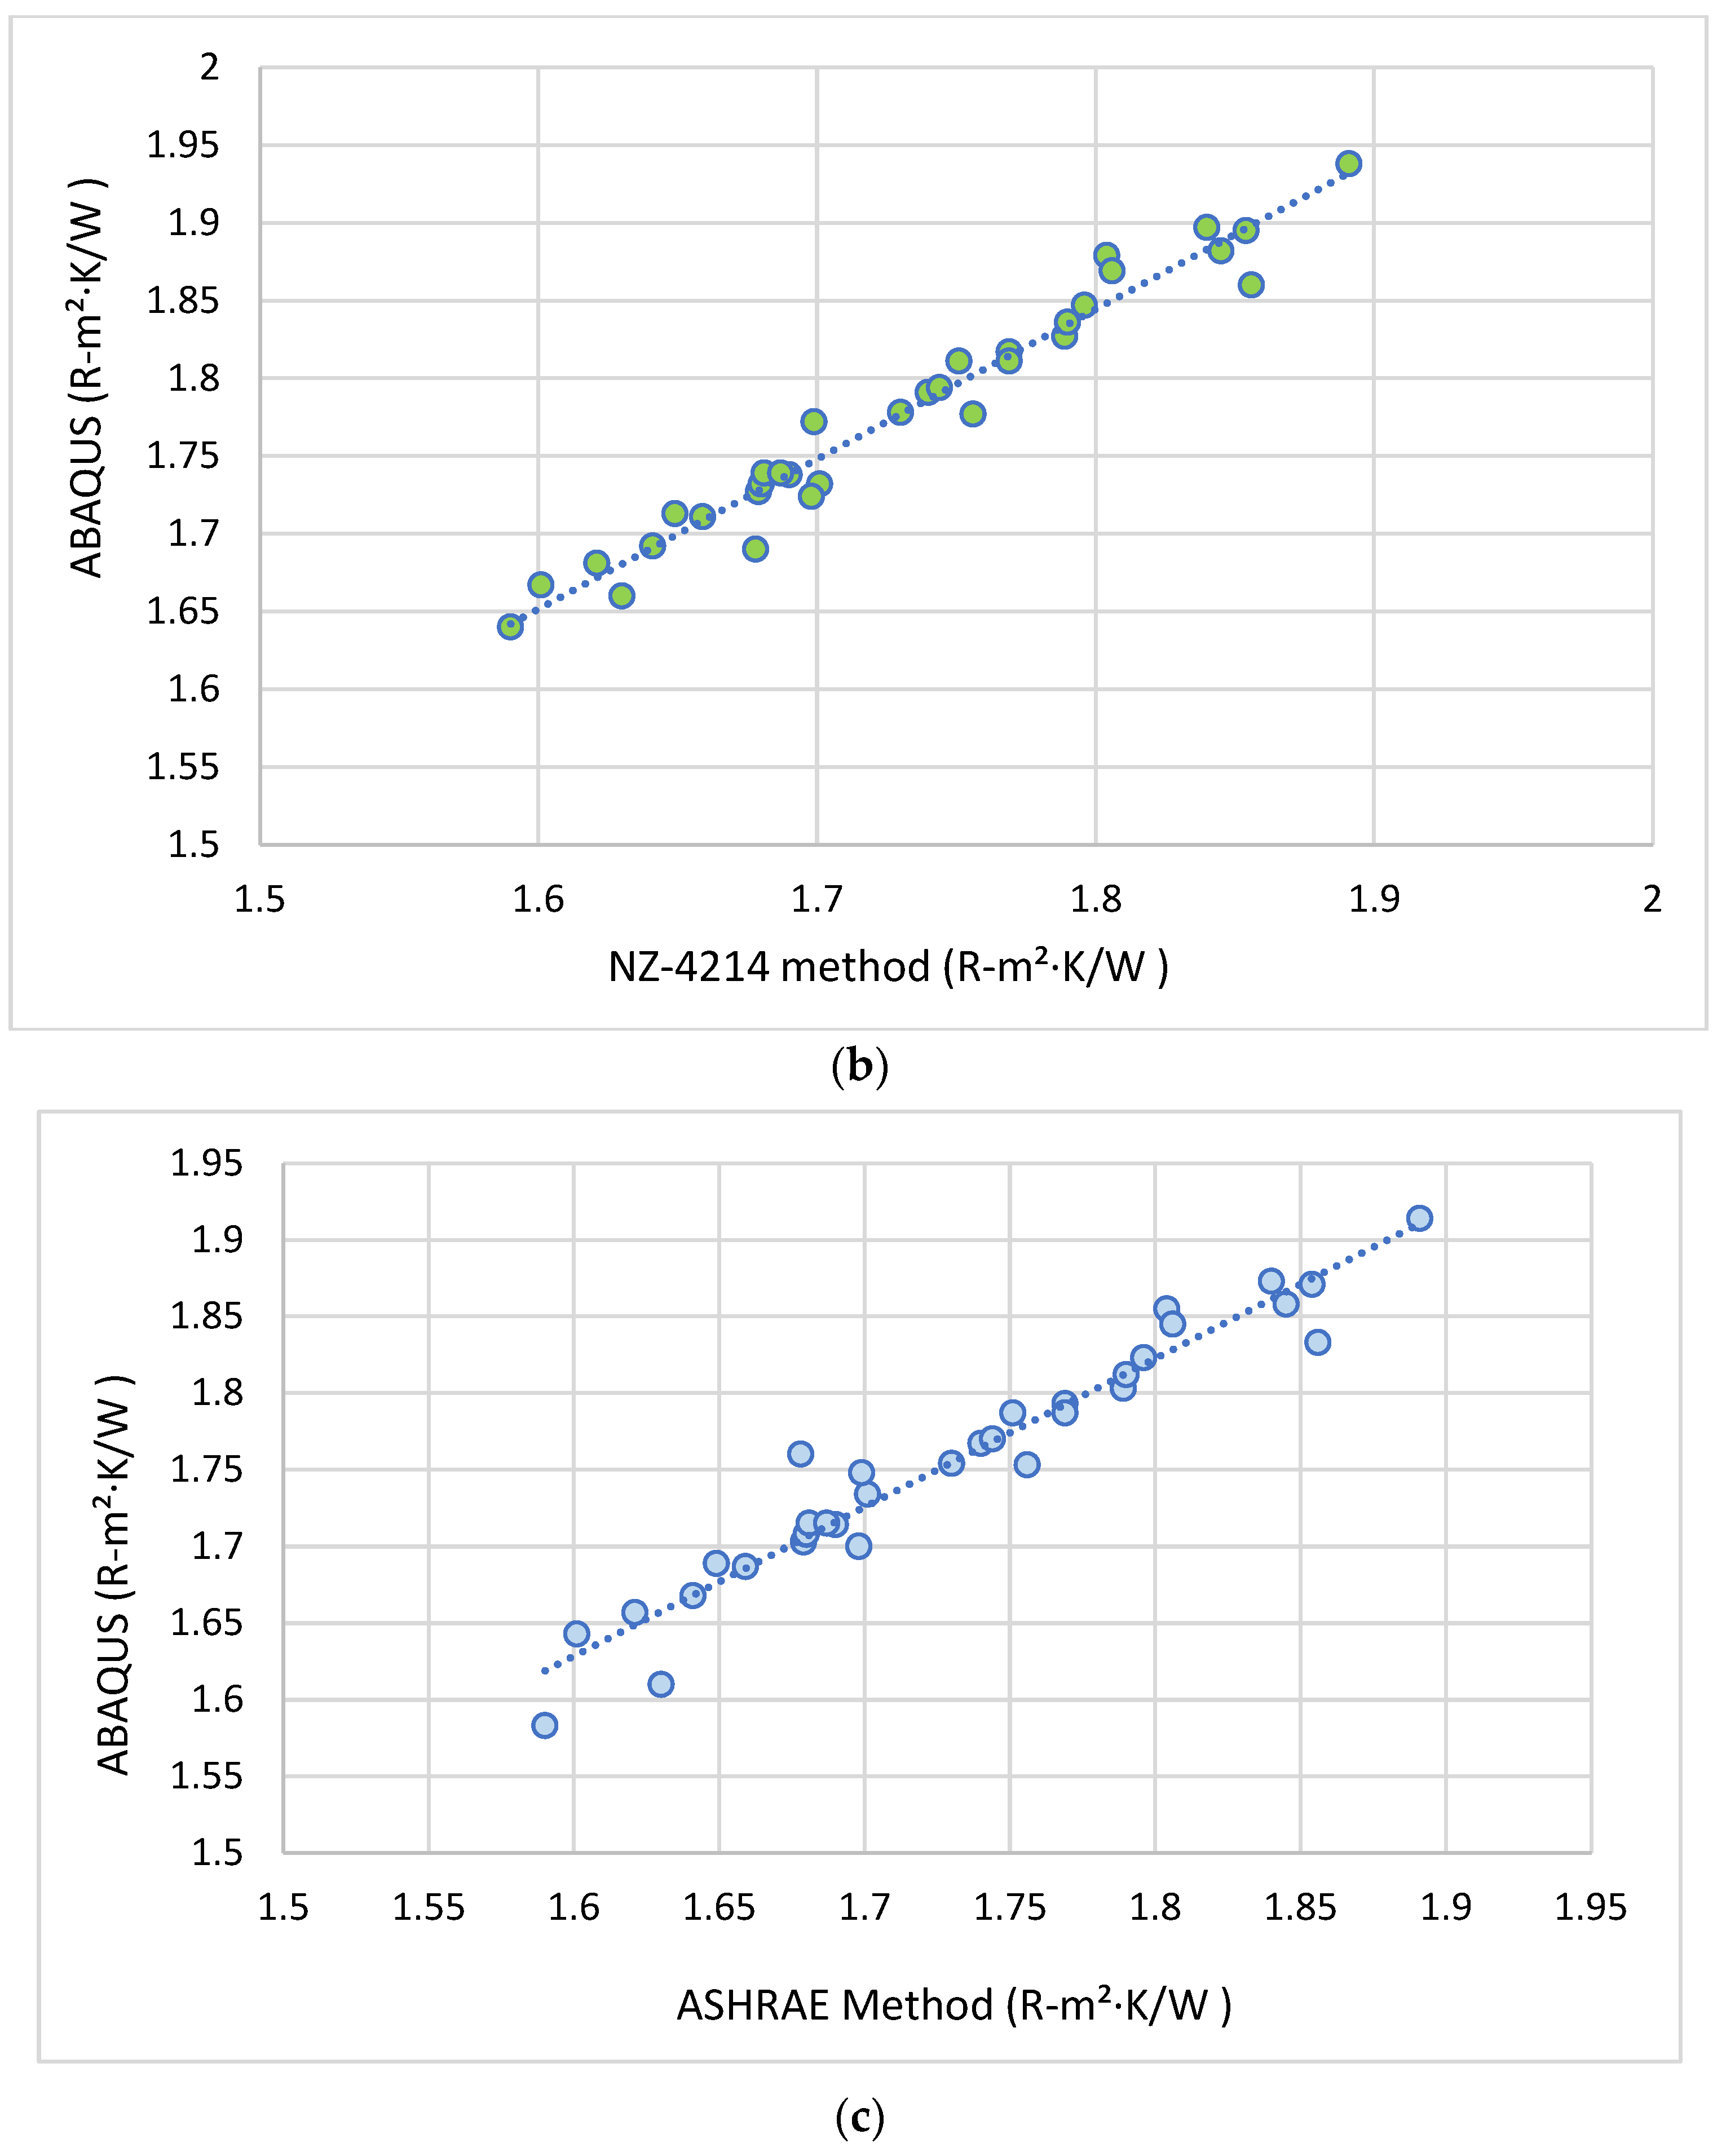
The R-value results from NZS 4214 and ASHRAE Modified Zone methods, as well as THERM 2D simulations, were compared against the 3D Abaqus FE simulations for 120 configurations. The models accounted for perforation-induced changes in cross-sectional area and flux distribution. Validation followed ISO 10211 using mean and coefficient of variation (COV) metrics. THERM and Abaqus results closely matched with a mean ratio of 1.0003 and COV of 0.0116. NZS 4214 and ASHRAE slightly overpredicted R-values, with mean values of 1.0277 and 1.0146, and COVs of 0.0085 and 0.0075, respectively. This confirms good agreement and low variability for configurations as shown in Figure 18. The error in R-value predictions across models was small. THERM and Abaqus results matched closely, with a mean deviation below 0.05% (ratio = 1.0003). The NZS 4214 method slightly overpredicted, with an average error of 2.8%, while the ASHRAE Modified Zone method showed a 1.5% overestimation. The coefficients of variation (≤0.012) confirm that the variability across the 120 configurations was negligible.
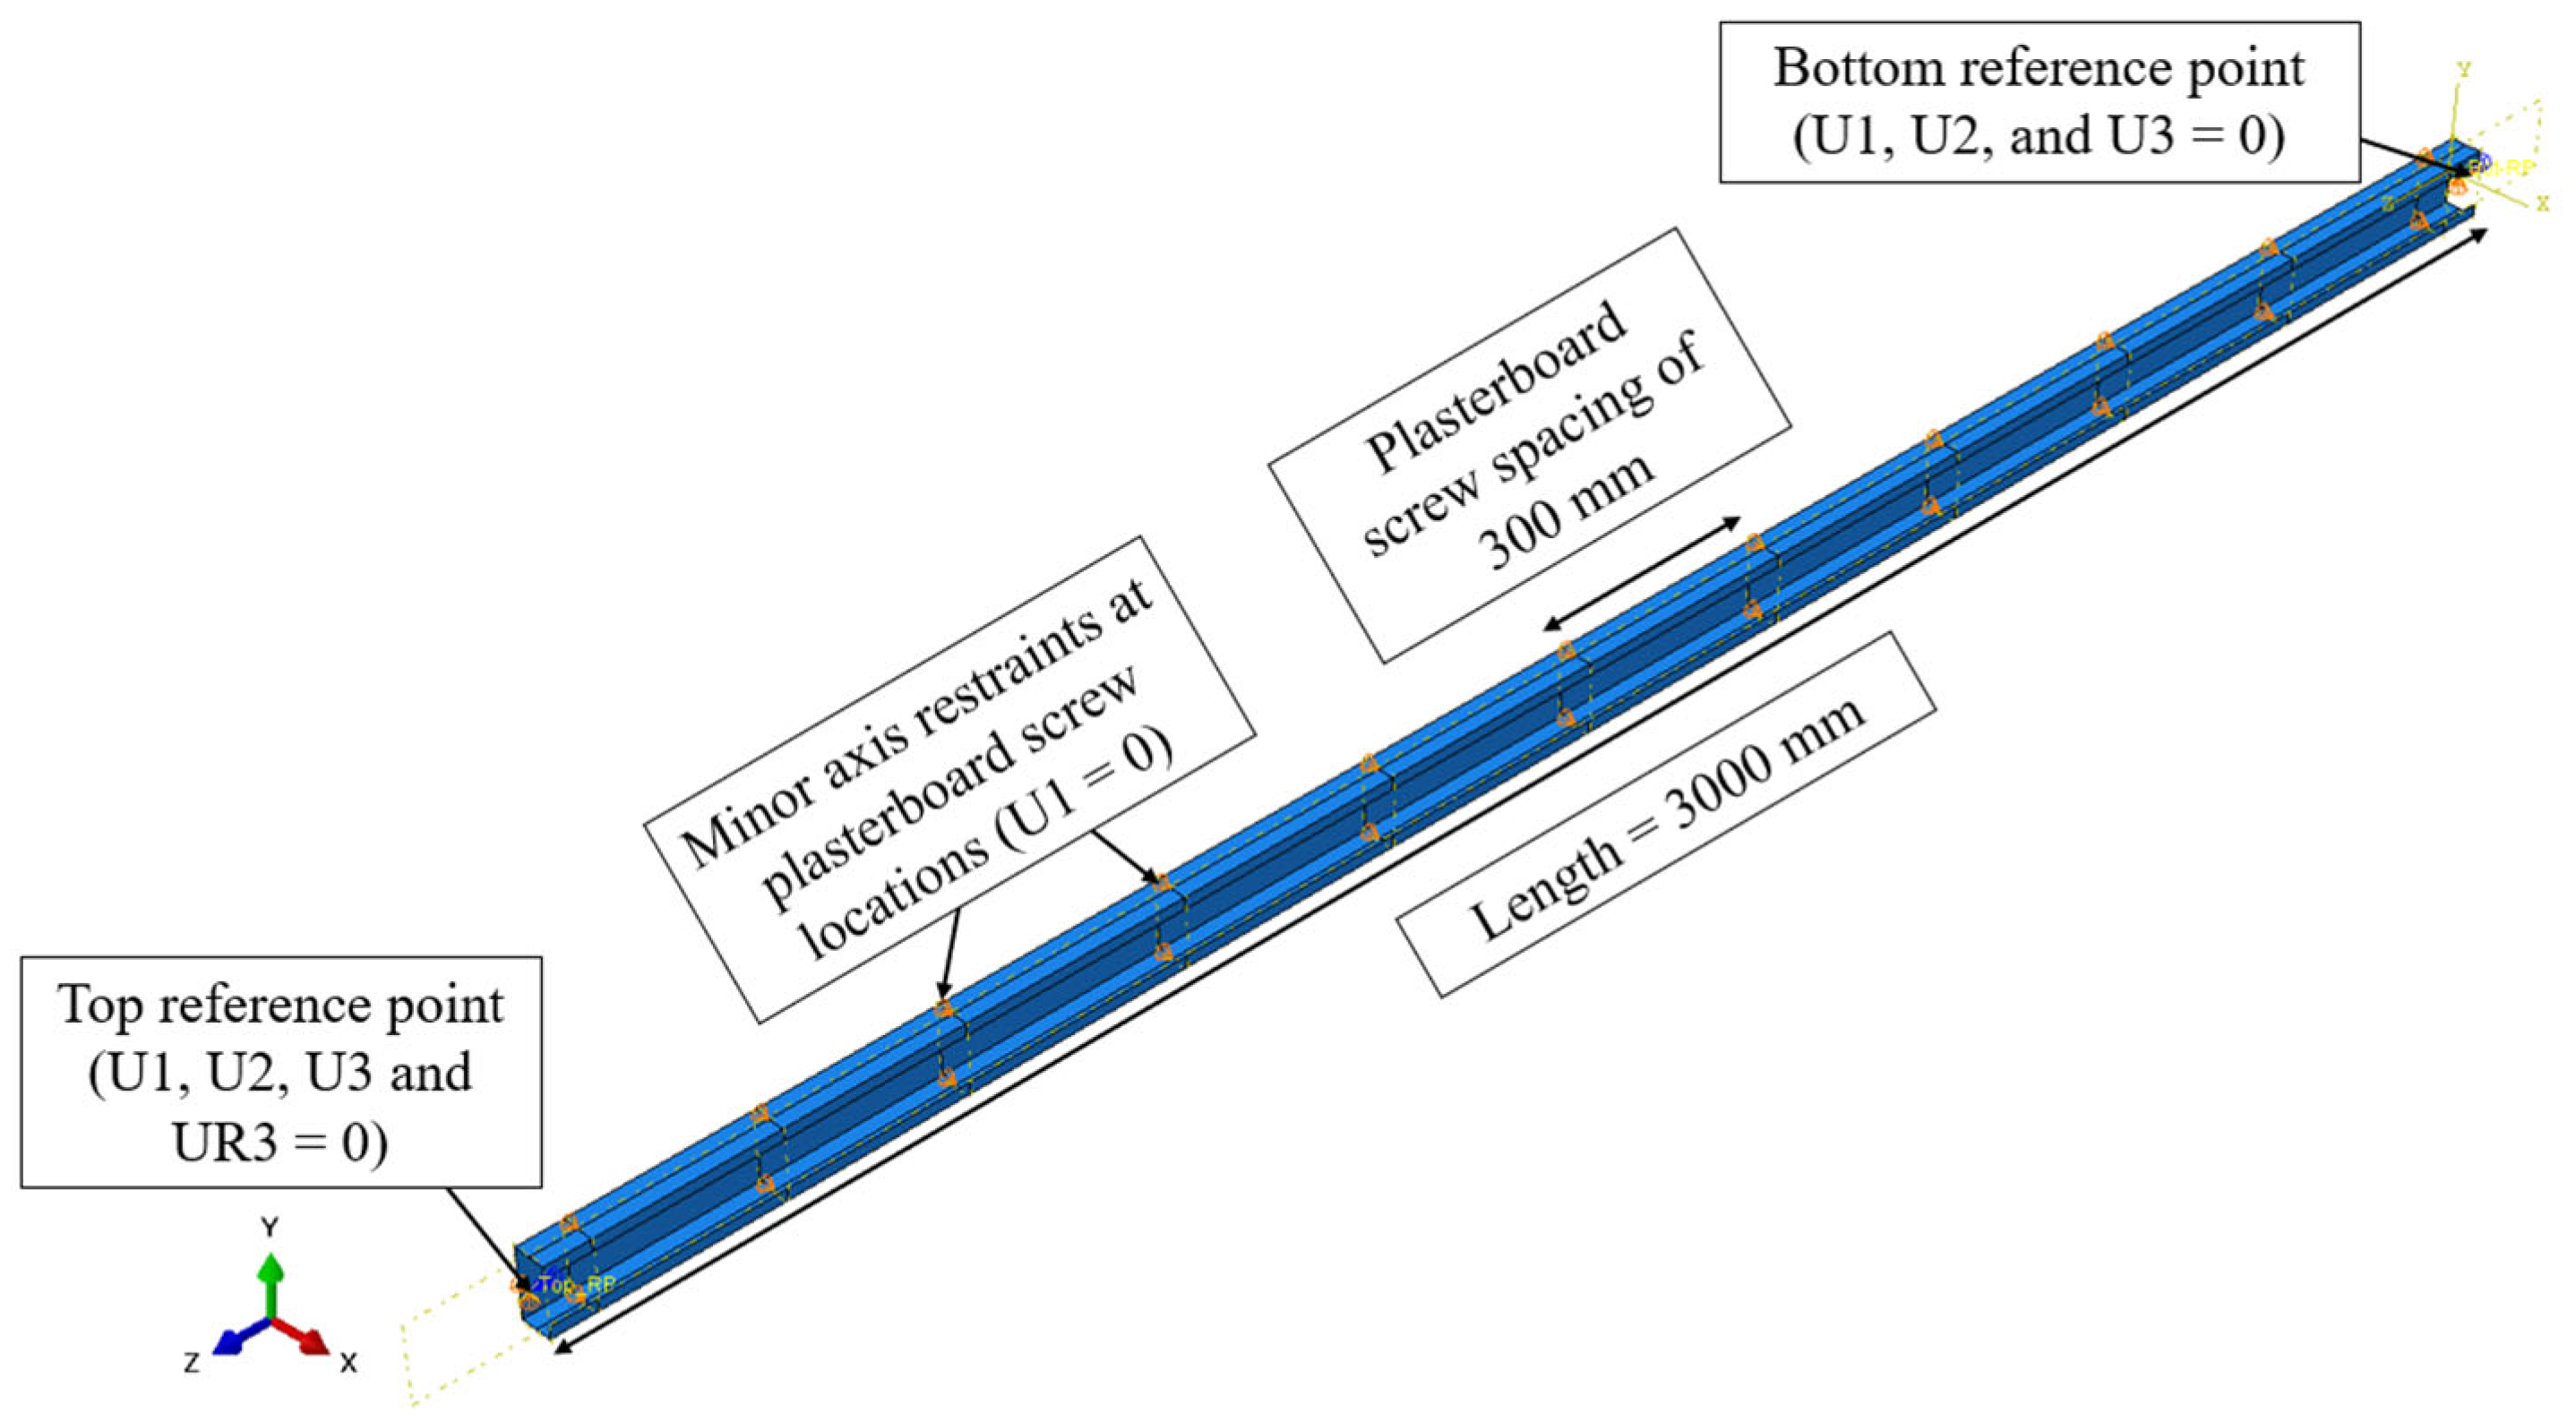
Furthermore, to assess the structural performance of 3 m high LSF walls under compression, structural FE models were developed using Abaqus using an established method used by several researchers [35,42]. An experimentally tested non-perforated stud lined on both sides was selected as the reference [32], and its geometry and boundary conditions were replicated in the model as shown in Figure 19. Elastic buckling analysis was first conducted, using which appropriate geometric imperfections were incorporated, followed by a nonlinear analysis. The non-perforated stud achieved a load capacity of 82.13 kN, showing good agreement with the experimental result of 79 kN and confirming the validity of the structural FE model.
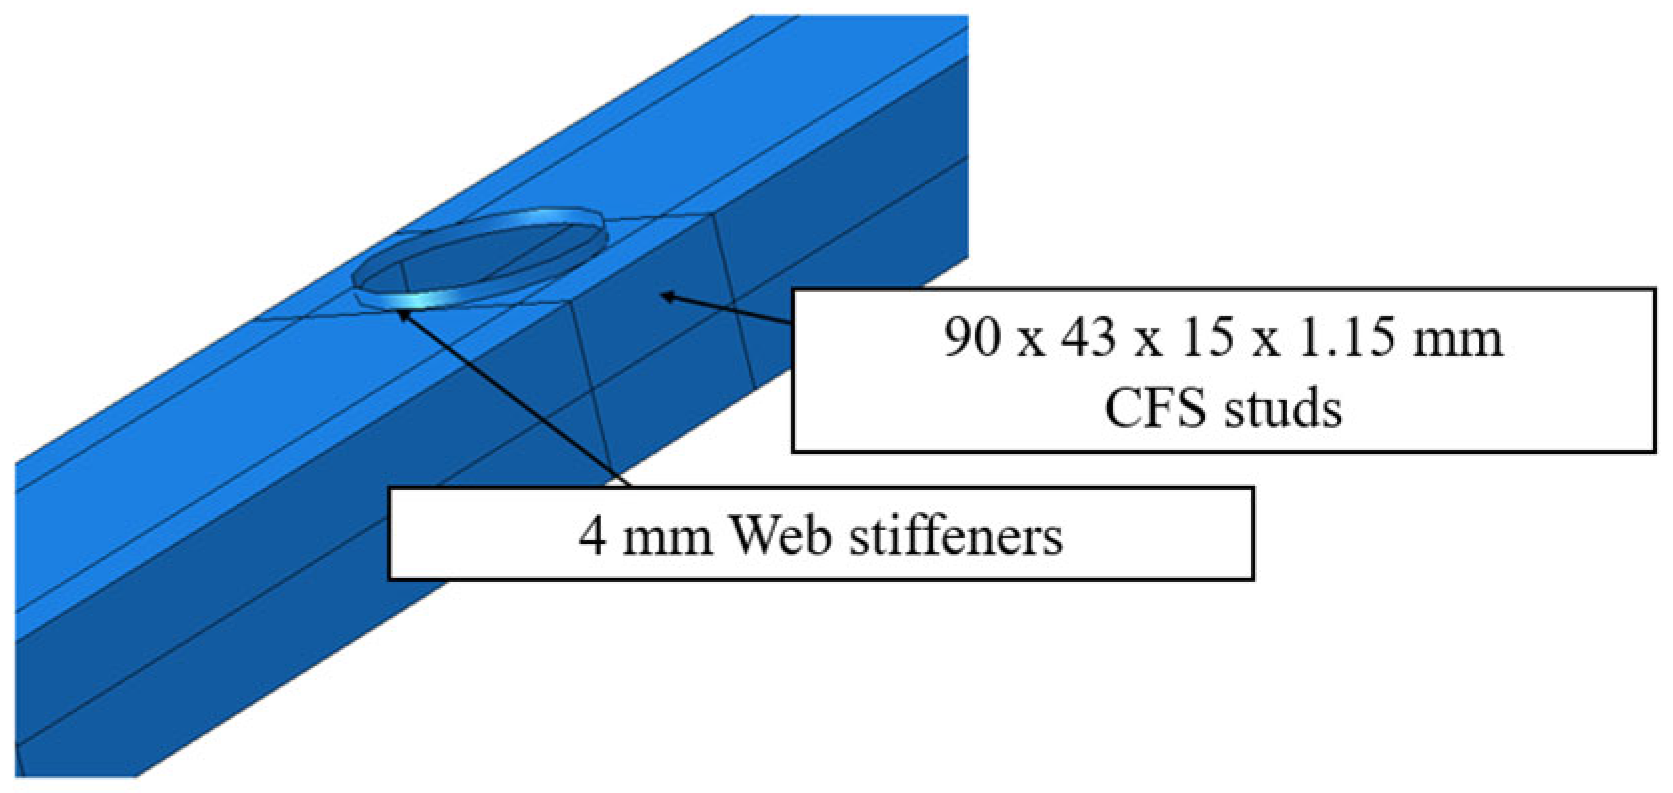
Following this validation, the same stud geometry was modified to incorporate web perforations. The thermally optimised configuration, incorporating 68 mm diameter holes spaced at 200 mm and comprising 10 perforations, reduced the axial compression load capacity to 57.89 kN, i.e., 29.51% reduction compared to non-perforated stud. This reduction was primarily due to the removal of web material and the associated increase in local buckling susceptibility around the perforated regions. To address this issue, 4 mm long stiffeners were used around the holes, as shown in Figure 20. This modification preserved thermal gains, maintaining a 15.3% increase in R-value, while significantly improved the axial capacity to 78.36 kN, i.e., with only 3.2% reduction.

6.4. Thermal Performance of External LSF Walls with Fire-Rated Facades and Web-Perforated Studs

The thermal performance of five external LSF wall systems was evaluated to determine the effectiveness of web-perforated CFS studs in enhancing R values under Australian climatic conditions. Each wall configuration included a fire-rated external façade systems as shown in Figure 21, consisting of 75 mm Autoclaved aerated concrete (AAC) panel, 0.42 mm profiled steel sheeting, 5 mm aluminium composite panel (ACP), 25 mm fire-rated glass, and 110 mm brick veneer. The façade systems considered in this study represent a broad spectrum of practical applications: AAC panels are widely used in lightweight masonry construction for their insulation and fire resistance; corrugated steel sheeting is common in residential and industrial claddings for its durability; ACP’s are prevalent in commercial façades as lightweight, non-combustible cladding with architectural flexibility; fire-rated glass is employed in façades and curtain walls to provide natural lighting while maintaining fire protection; and ventilated clay brick veneer is used in residential and institutional buildings, combining the appearance of traditional masonry with cavity ventilation for improved thermal and moisture performance. They were selected based on their prevalence in contemporary Australian facade systems and compliance with NCC 2022 fire and energy efficiency requirements. Their material properties are summarised in Table 5. All wall systems were constructed using a 3 m high LSF wall assembly with CFS framing and cavity insulation to ensure consistency across simulations. Steady-state thermal simulations were conducted in Abaqus using validated FE models of external LSF walls under a temperature gradient of 35 °C, with 40 °C applied externally and 5 °C internally. The studied configuration incorporated 68 mm diameter web perforations at 200 mm spacing, each locally stiffened with 4 mm edge plates to preserve load-bearing capacity.
As shown in Table 6, Table 7, Table 8, Table 9 and Table 10 and Figure 22, Figure 23, Figure 24, Figure 25, Figure 26, Figure 27, Figure 28, Figure 29, Figure 30 and Figure 31, five external wall types were assessed using Abaqus, THERM, NZS 4214, and the ASHRAE Modified Zone Method. Both perforated and non-perforated stud wall assemblies were analysed to evaluate the influence of web openings on thermal resistance. R-values for non-perforated walls ranged from 2.05 to 2.83 m2·K/W, increasing to values between 2.65 and 3.27 m2·K/W for perforated walls. THERM consistently predicted higher values due to its 2D simplification, while Abaqus produced lower but more representative results by including multidirectional conduction. NZS 4214 and ASHRAE methods yielded intermediate values consistent with composite wall behaviour under steady-state conditions.

6.4.1. External LSF Wall with AAC External Cladding

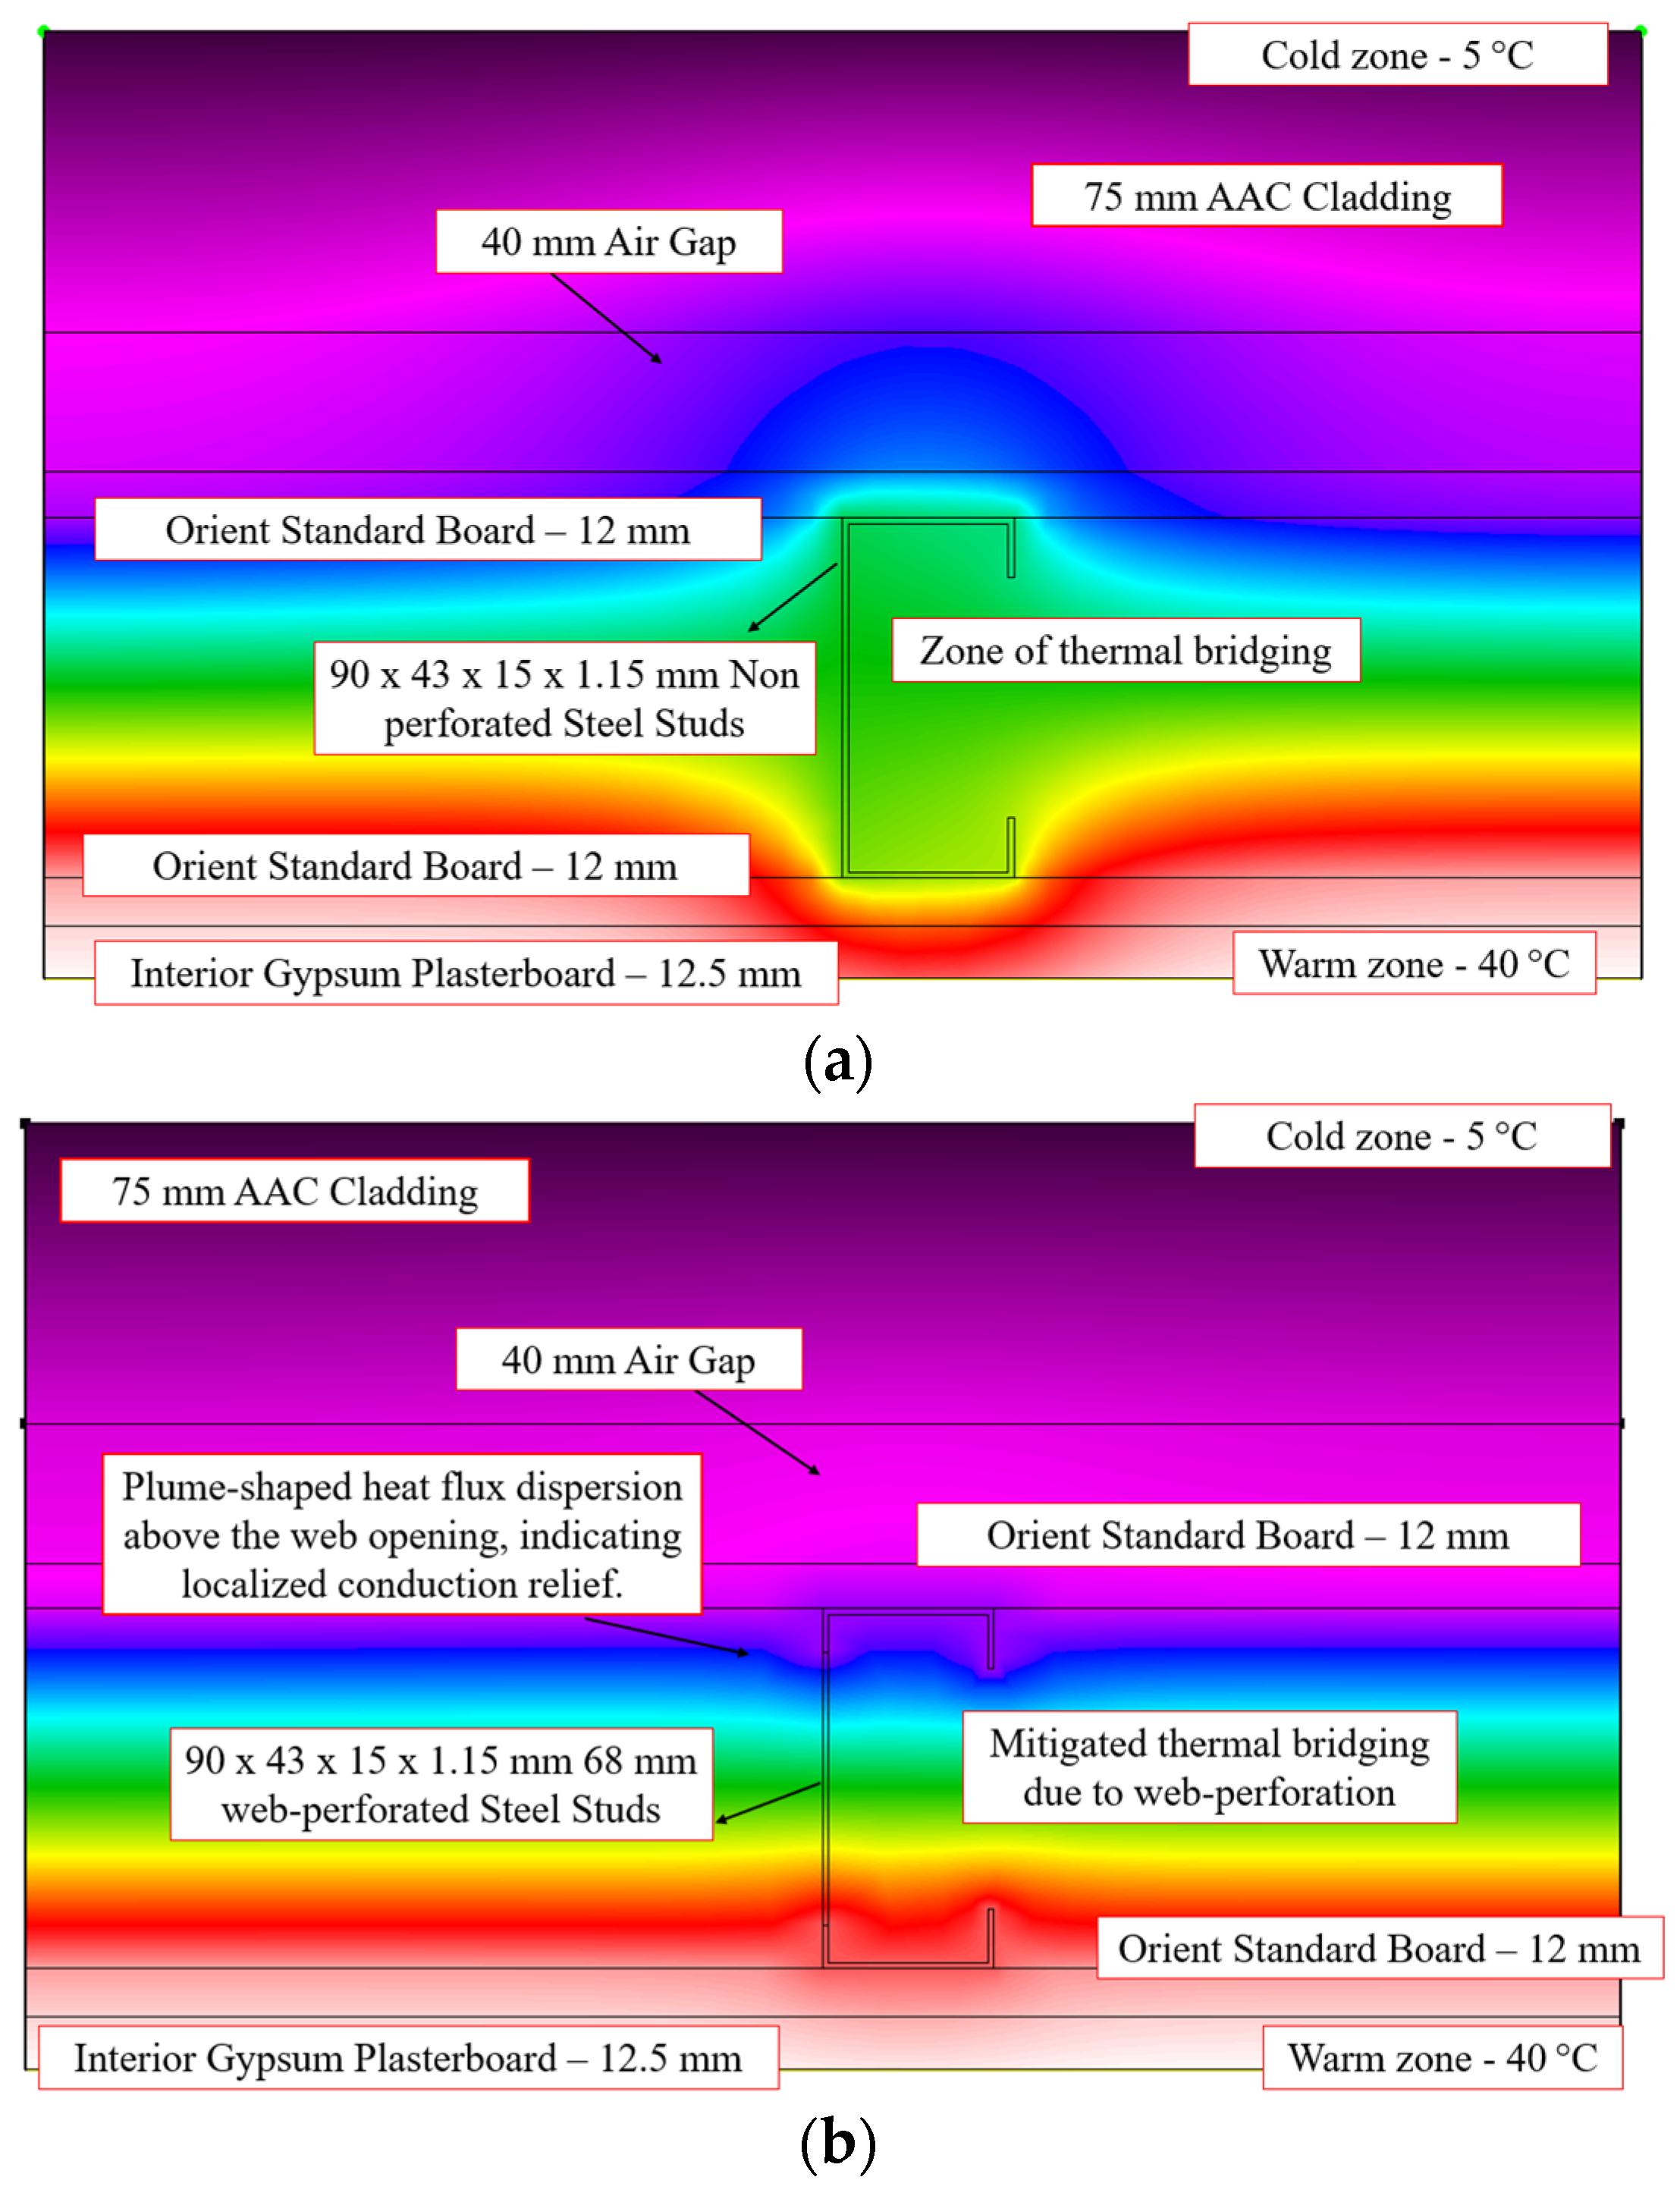
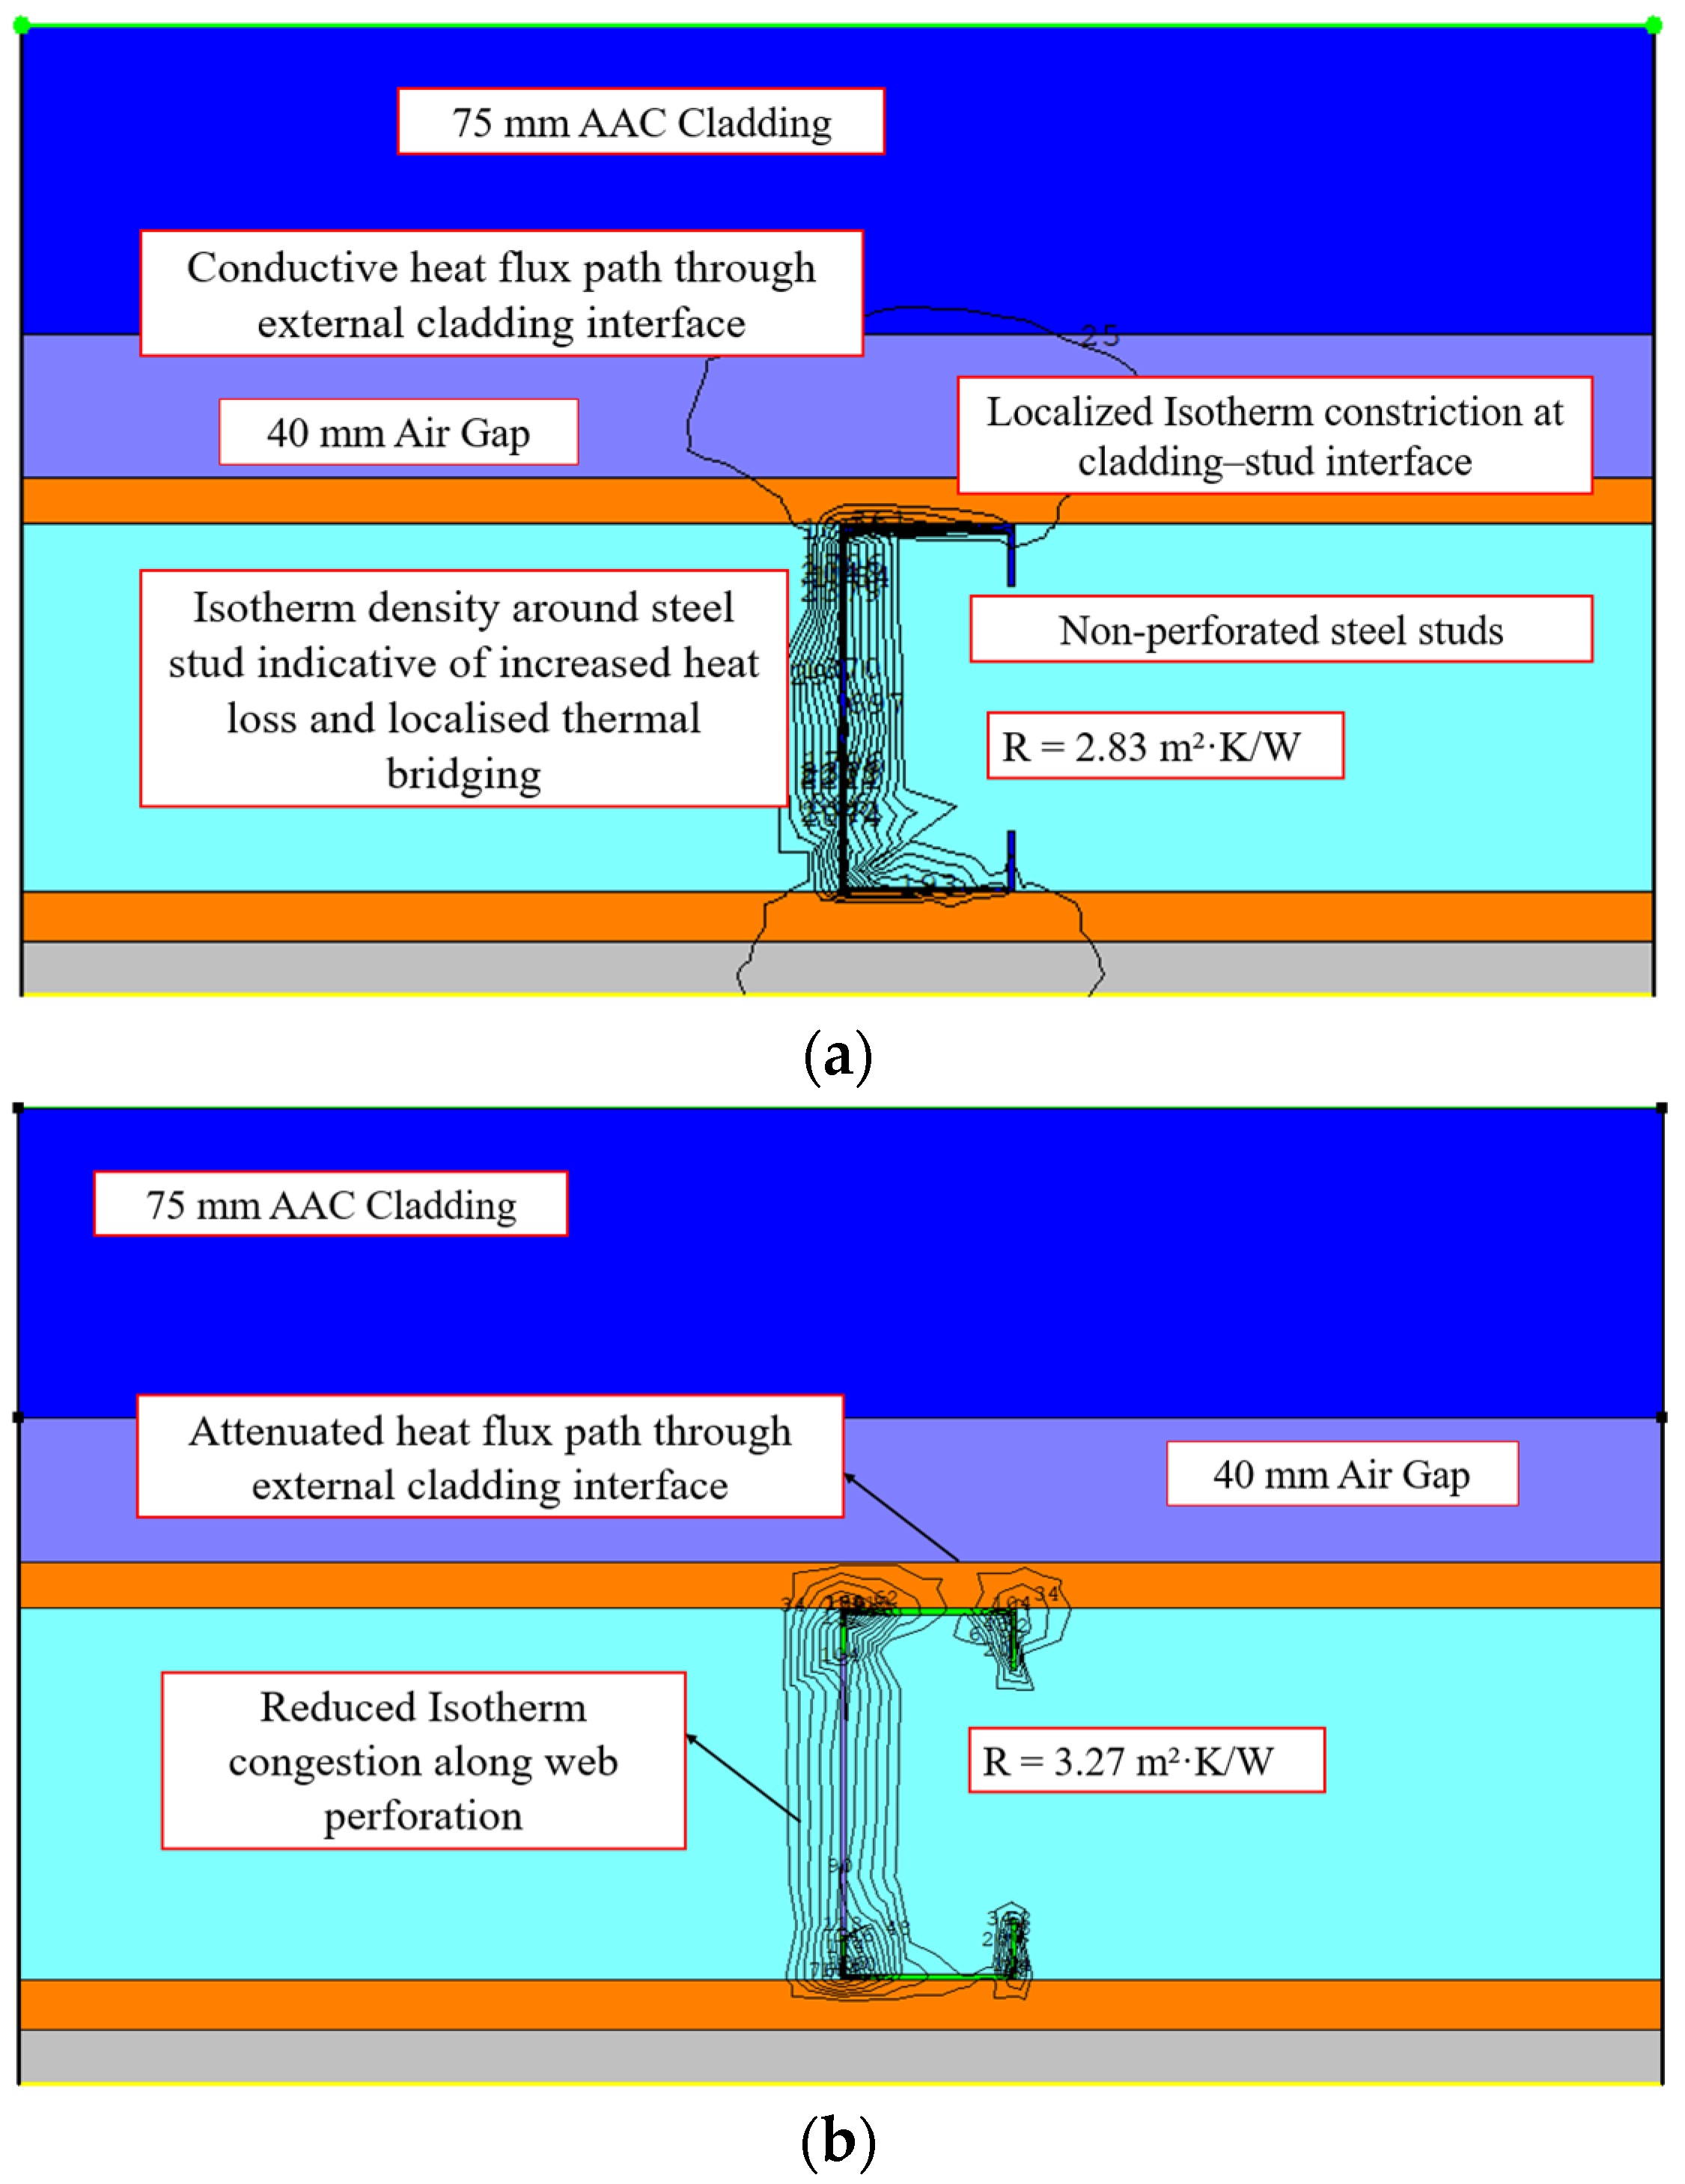
In AAC-clad LSF walls, the 75 mm aerated concrete layer attenuates surface heat flux through low-conductivity, high-porosity material, suppressing conductive transport at the cladding-cavity interface. In the non-perforated case, the 90 × 43 × 15 × 1.15 mm steel stud acts as a dominant thermal bridge, concentrating axial conduction through the web, as evidenced by steep gradients and compressed isotherms at the AAC–stud and flange–cladding junctions (Figure 22). R-values across methods range from 2.71 to 2.83 m2·K/W. Introducing 68 mm web perforations interrupts the longitudinal heat pathway, promoting lateral flux redistribution into adjacent insulation. As shown in Figure 23, perforations induce plume-shaped diffusion fields and smoother isothermal gradients across the stud–cavity domain. This geometry increases thermal resistance to 3.12–3.27 m2·K/W, reflecting a 15.13 to 16.48% improvement. Perforations thus reduce directional conduction continuity, enabling more uniform energy transport and enhancing the thermal resistance of the wall system.

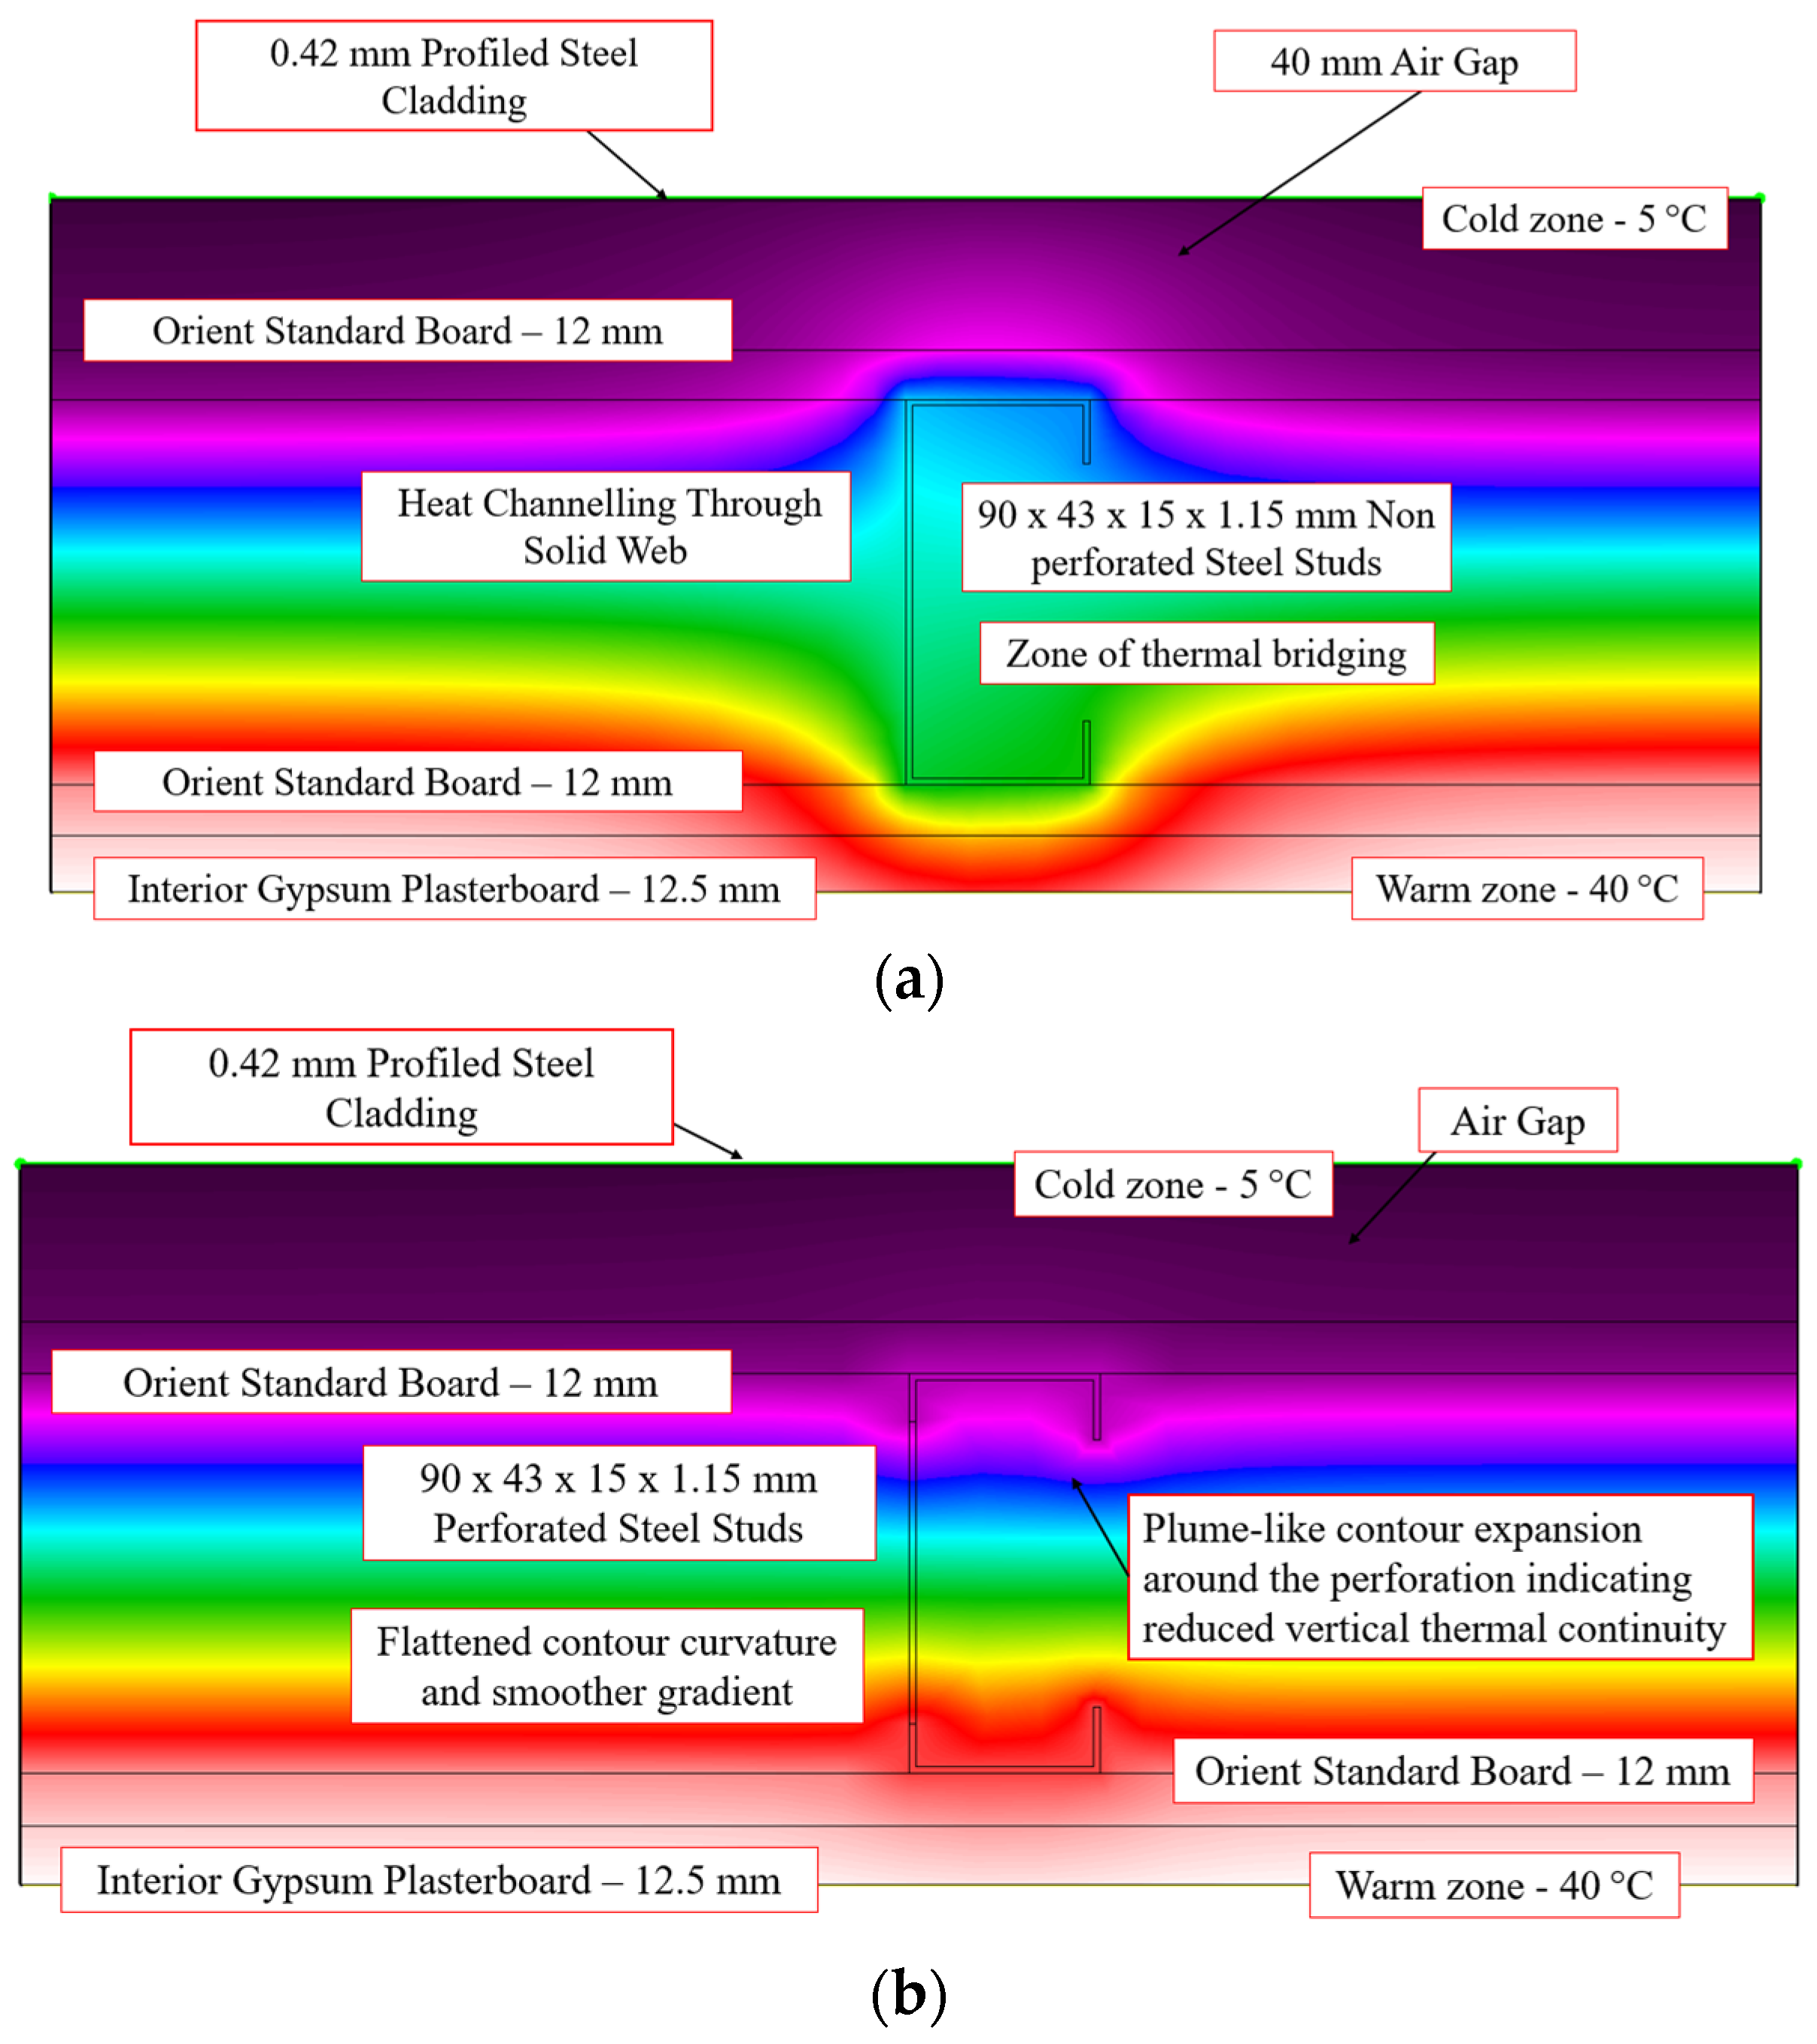
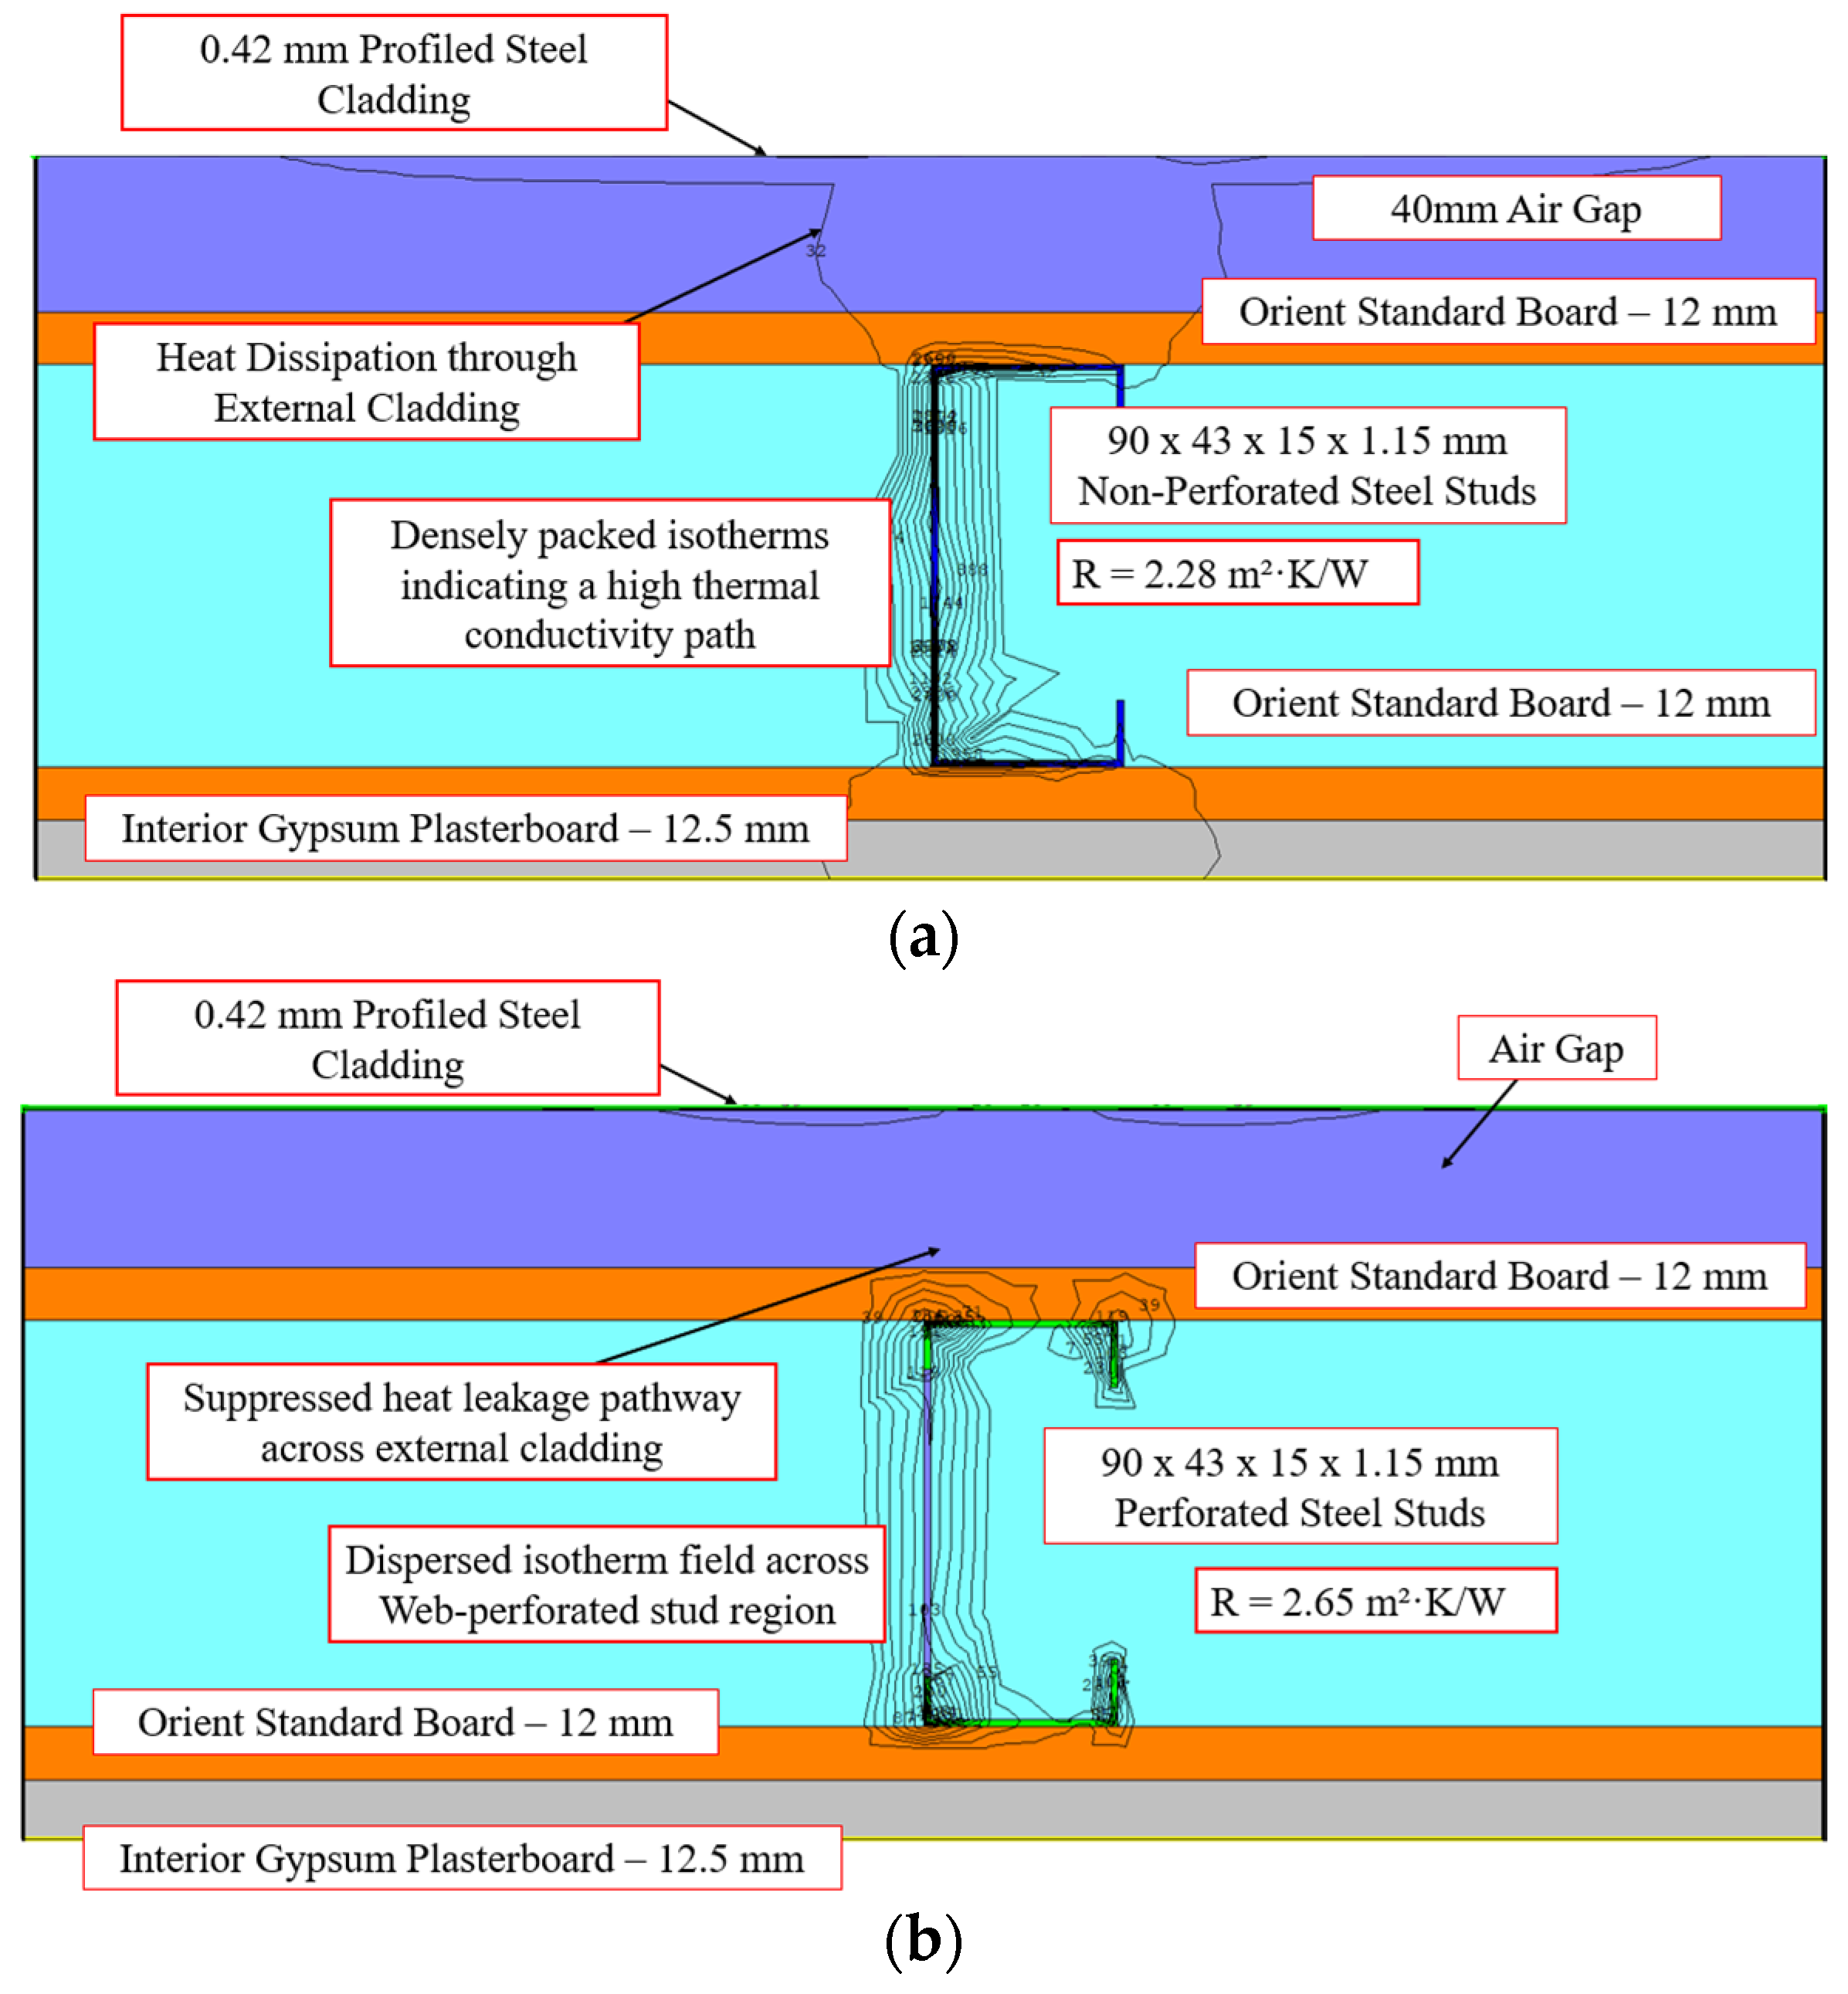
6.4.2. External LSF Wall with 0.42 mm Profiled Steel Cladding

In profiled steel-clad LSF walls, heat transfer is dominated by axial conduction through the steel frame. In the non-perforated stud configuration, vertically aligned isotherms and steep gradients at the cladding–flange and base junctions indicate strong directional heat flow and concentrated thermal bridging (Figure 24). This yields R-values between 2.32 and 2.41 m2·K/W. Introducing 68 mm web perforations disrupts the primary conduction path, promoting lateral thermal diffusion into the insulation. As shown in Figure 25, this results in flattened isotherms, reduced flux density, and suppressed thermal plumes at boundary zones. Thermal resistance increases to 2.67–2.79 m2·K/W, reflecting a 15.09 to 17.60% improvement. The enhancement stems from geometric redirection of heat flux, reducing anisotropic conduction and improving overall energy attenuation.

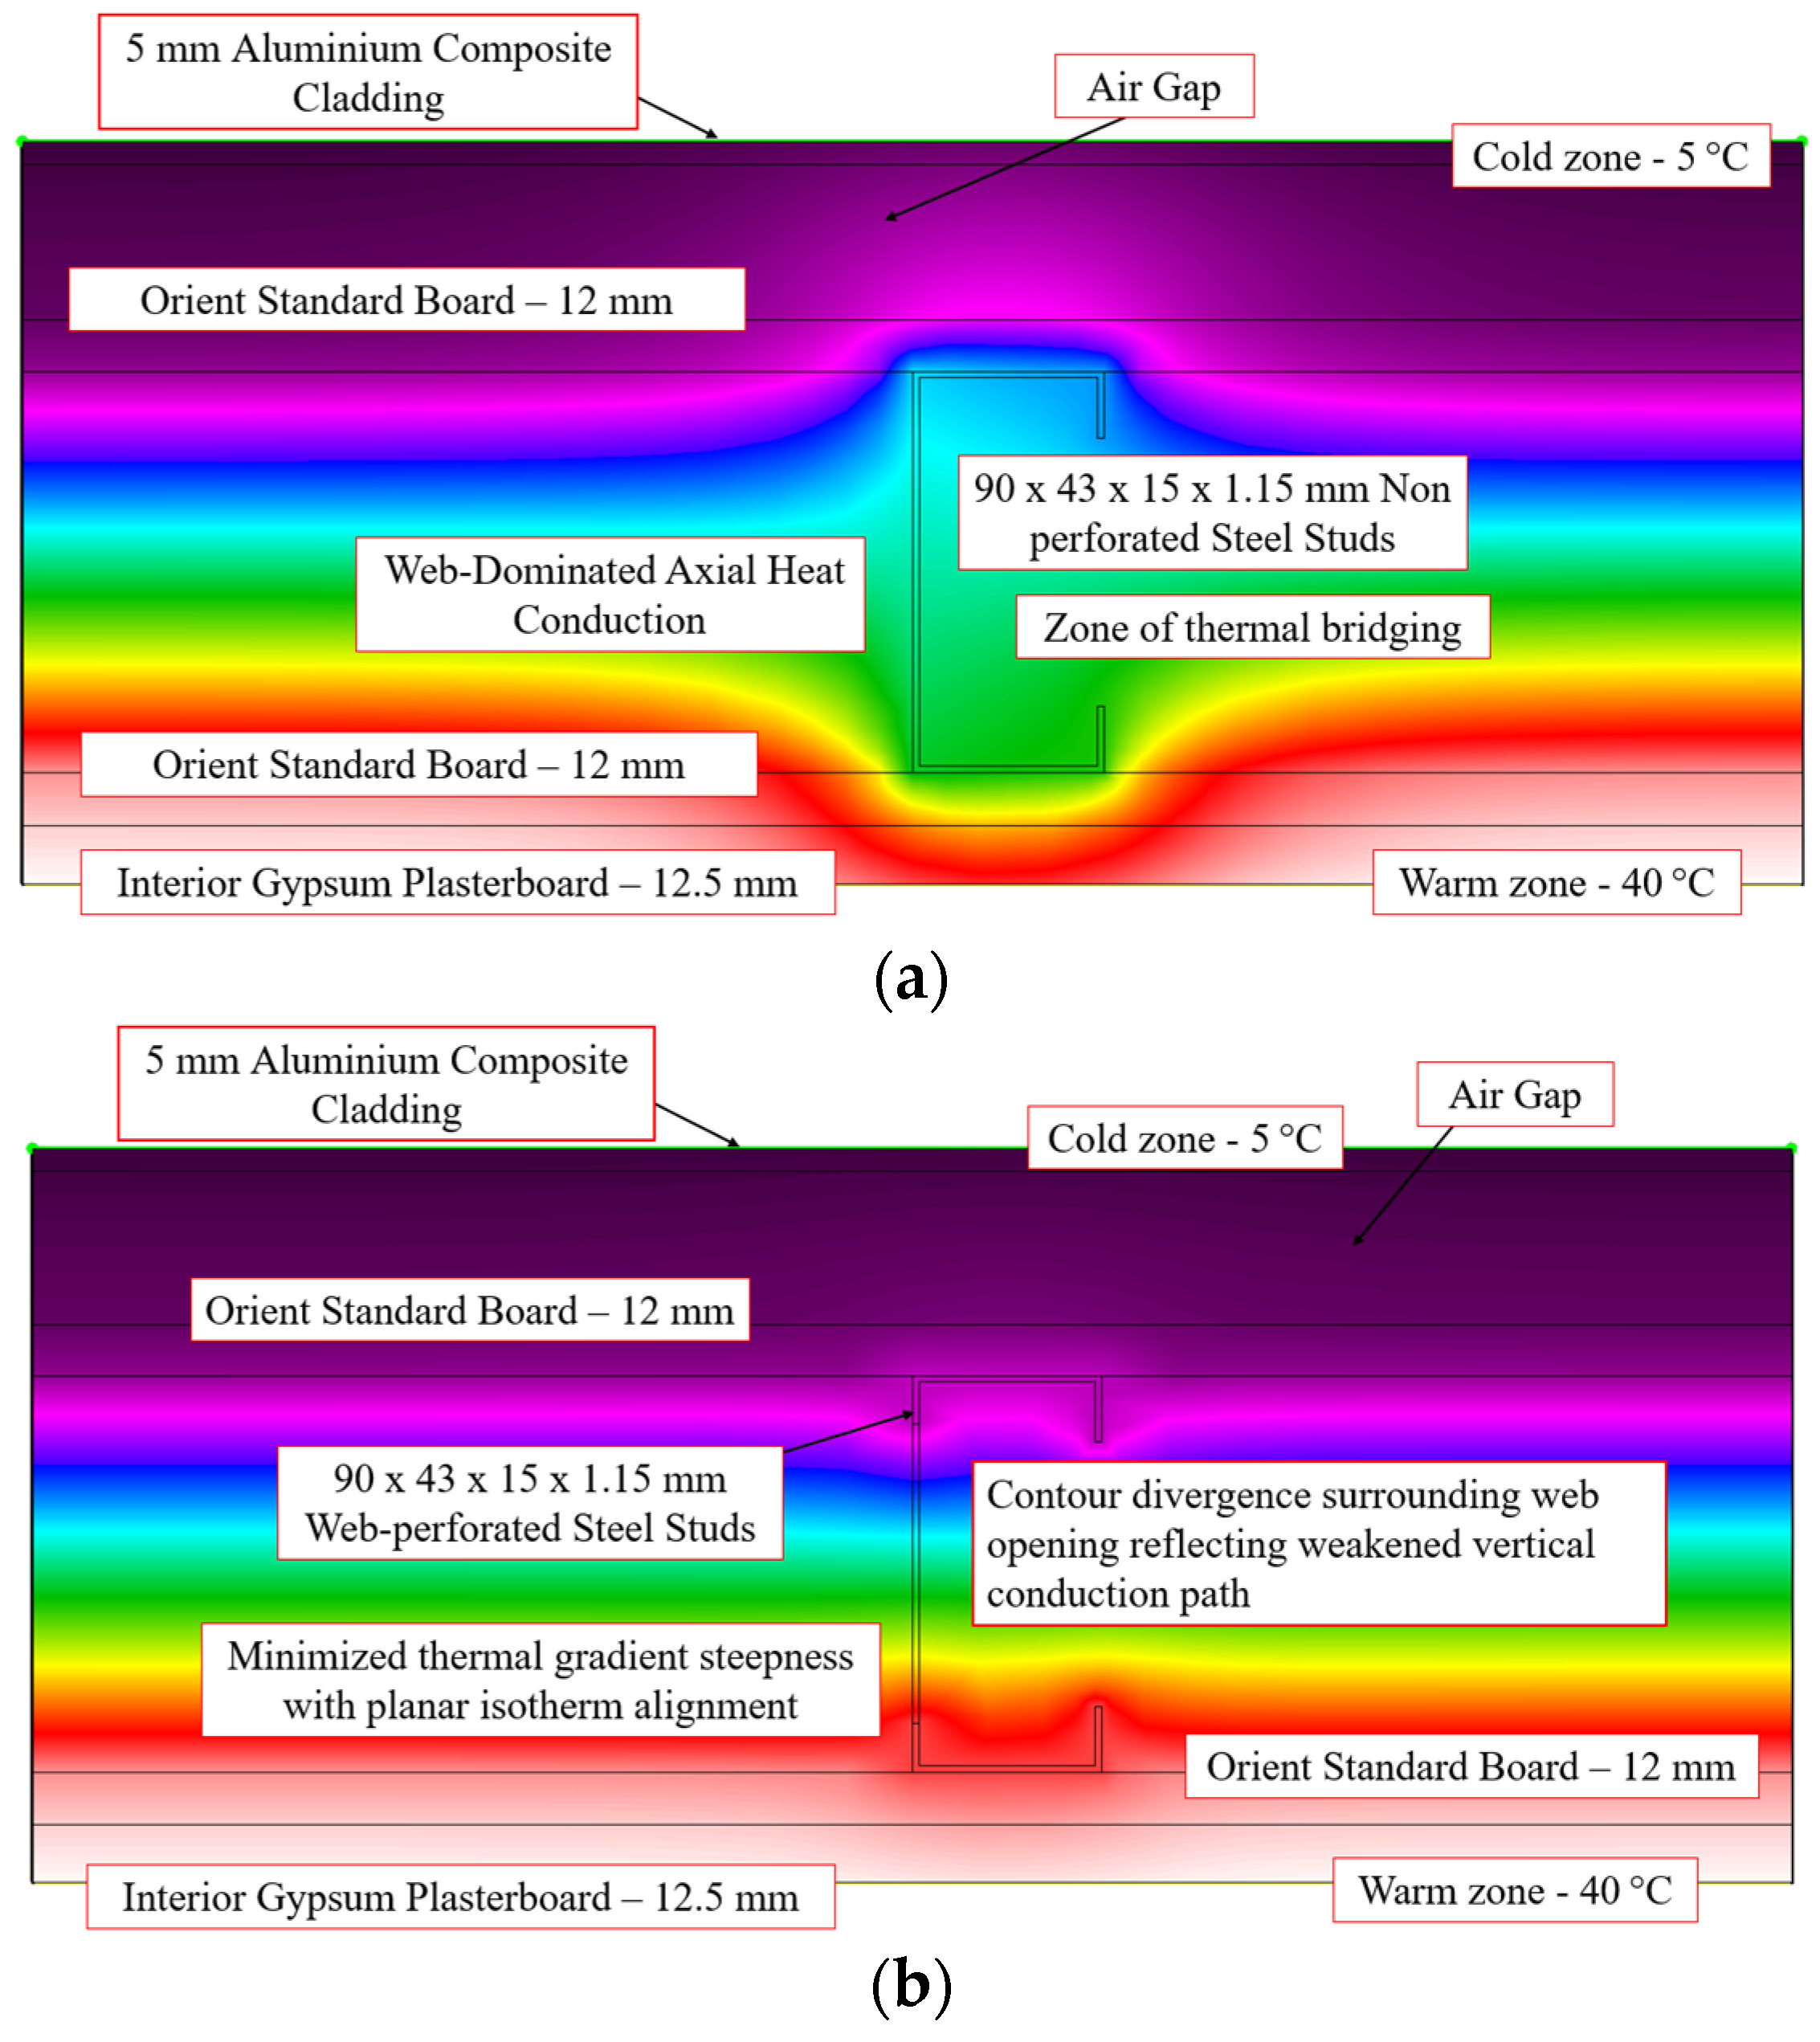
6.4.3. External LSF Wall with 5 mm Aluminium Composite Panel (ACP) Cladding

In ACP-clad LSF walls, the 5 mm high-conductivity external layer facilitates lateral heat dissipation, particularly at batten–cladding interfaces. In the non-perforated configuration, axial conduction dominates through the continuous steel web as shown in Figure 26, producing steep thermal gradients and compressed isotherms across the stud zone. This concentrated flux pathway lowers thermal resistance, yielding R-values from 2.67 to 2.76 m2·K/W. Introducing 68 mm web perforations disrupts this vertical conduction path, promoting planar isotherm alignment and lateral diffusion into the insulation layer. As shown in Figure 27 the resulting thermal field, plume suppression and distributed flux patterns emerge around the perforations. This geometric interruption enhances the thermal performance, raising R-values to 3.109–3.20 m2·K/W and achieving a 15.94% to 17.60% increase. These results confirm that web perforations act as passive thermal breaks, reducing axial conduction and enhancing lateral energy attenuation across the steel–ACP interface.

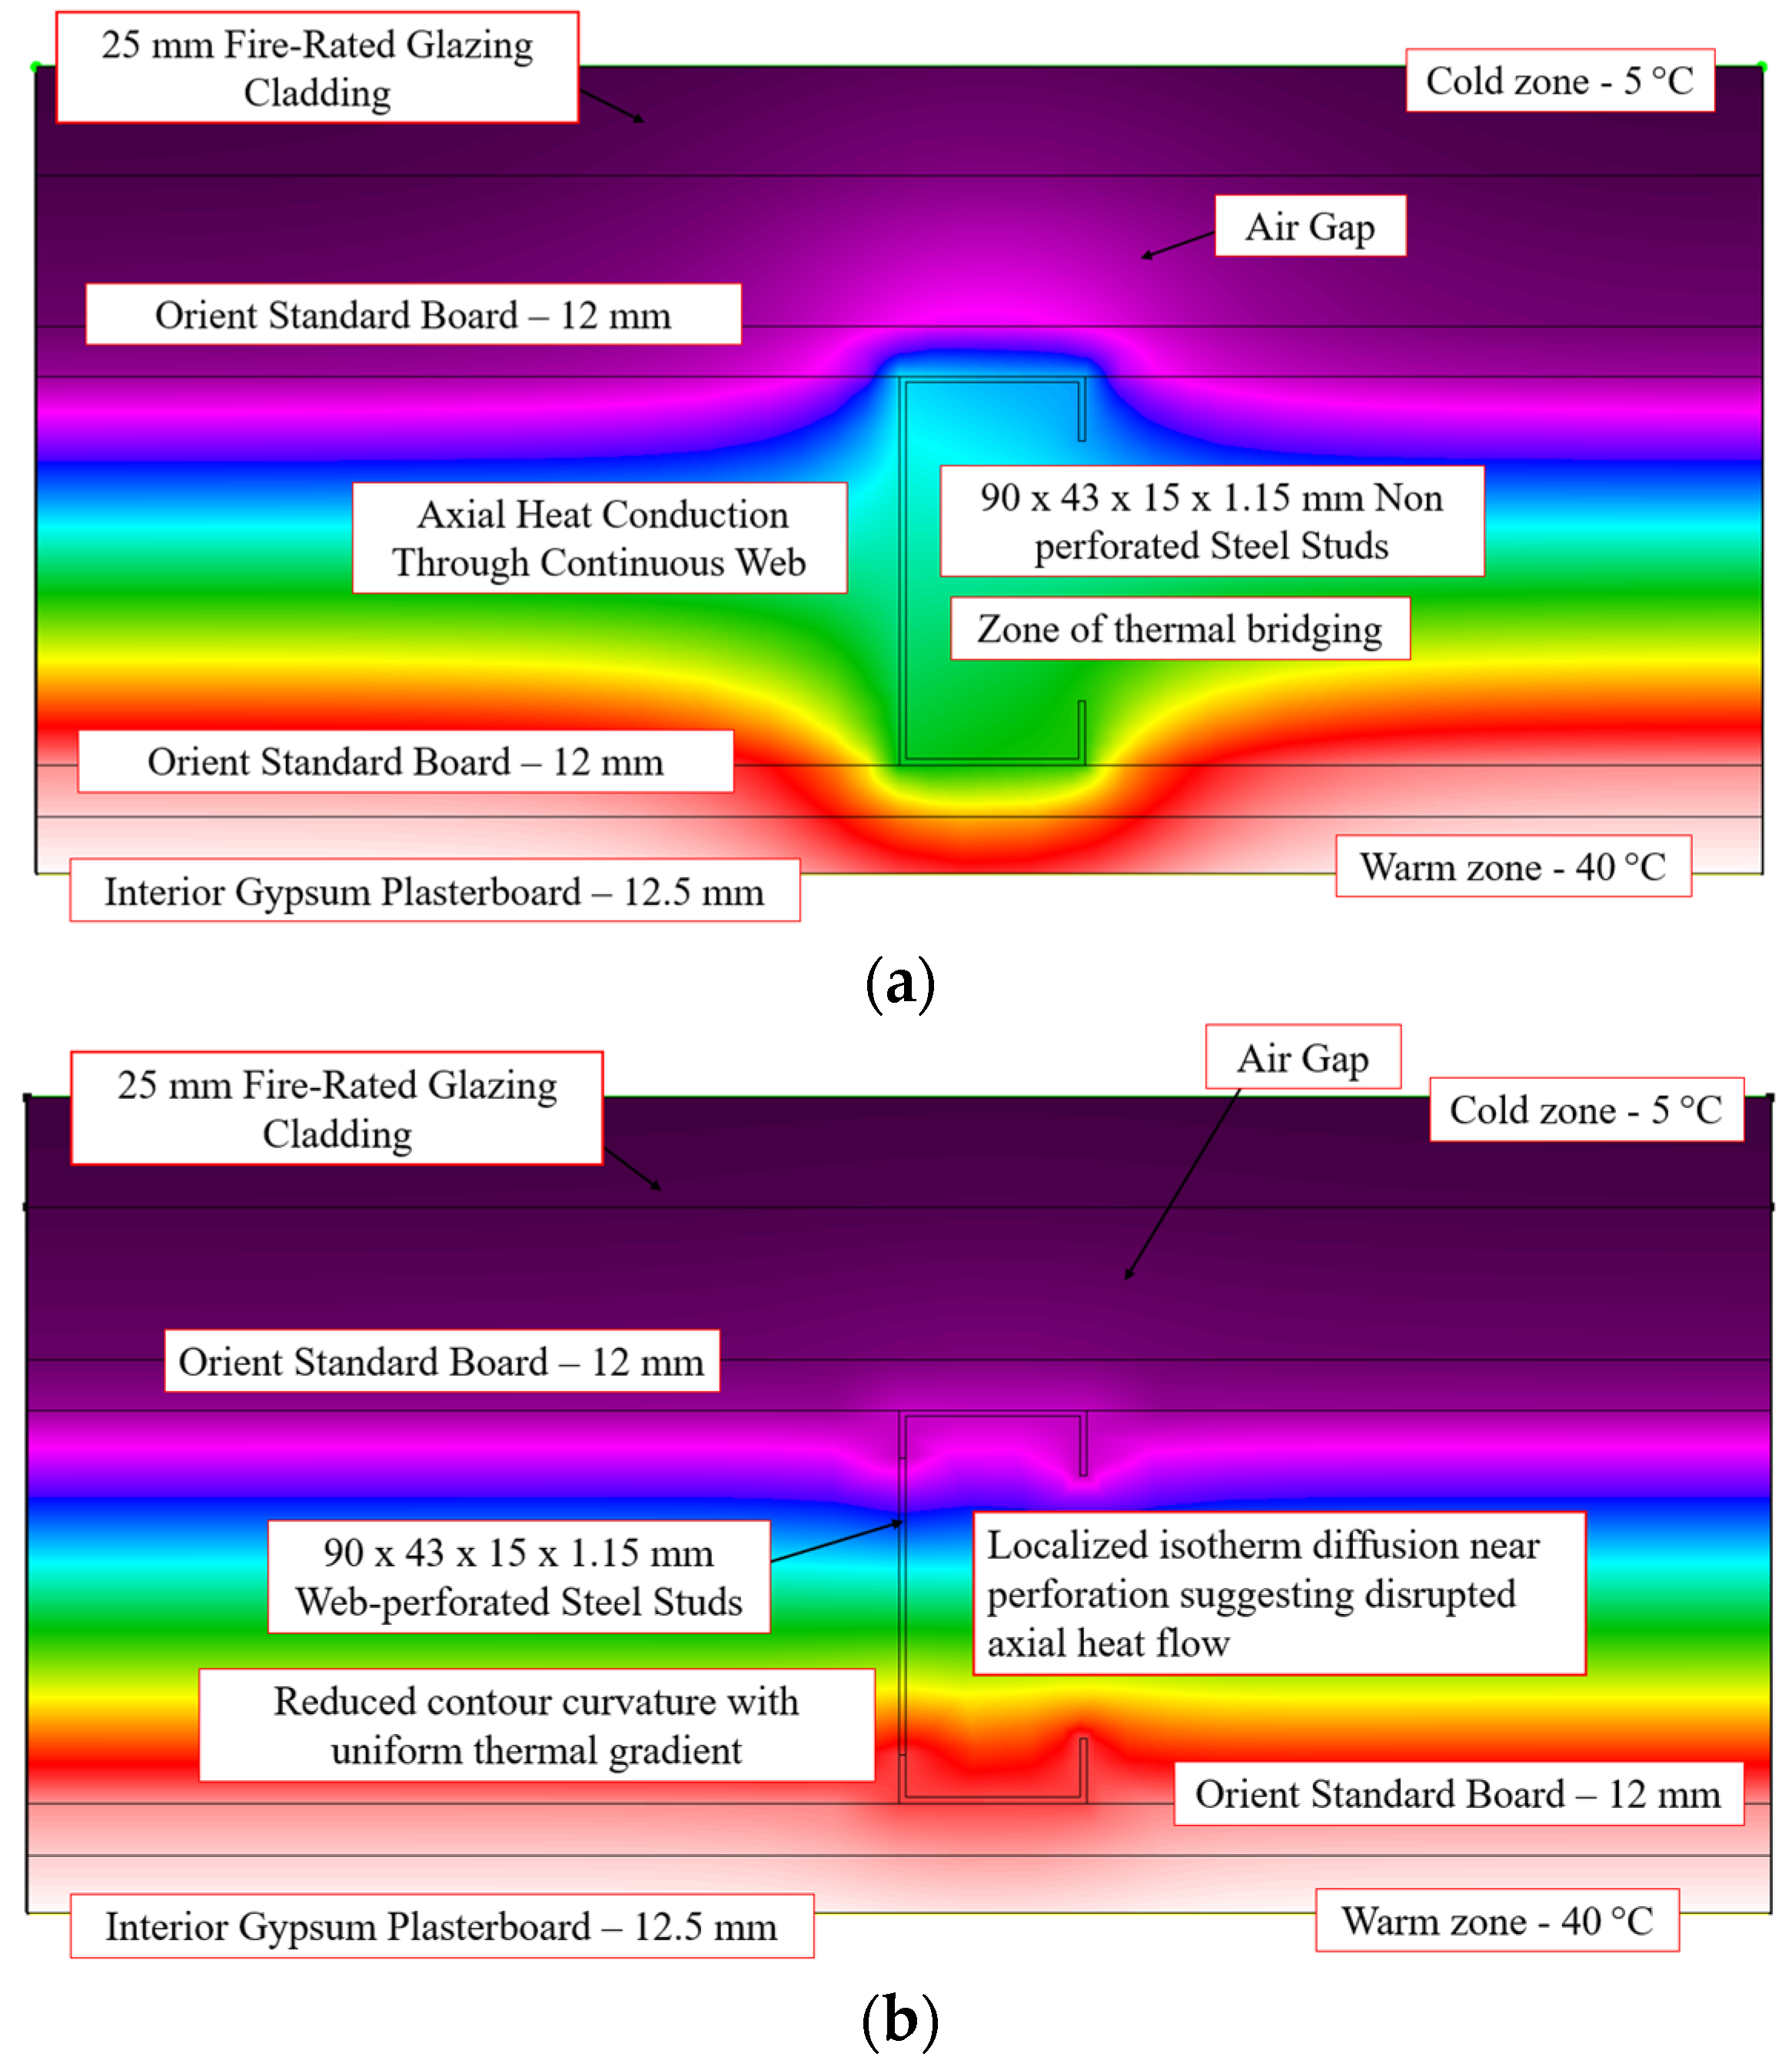
6.4.4. External LSF Wall with 25 mm Fire-Rated Glazing Cladding

In fire-rated glazing-clad LSF walls, the 25 mm glass layer provides moderate thermal resistance, but permits considerable heat transmission due to its relatively high thermal conductivity. In the non-perforated configuration, vertically stratified isotherms concentrate along the stud web, with peak thermal gradients at the flange–cladding interface and stud base (Figure 28a and Figure 29a), indicating dominant axial conduction. This constrained thermal field yields R-values between 2.61 and 2.71 m2·K/W. Introducing 68 mm web perforations interrupts the vertical conduction stream, promoting lateral heat diffusion into surrounding insulation. As shown in Figure 28b and Figure 29b, the isotherm field becomes less aligned and more dispersed, with reduced curvature near perforations. Plume suppression at critical junctions and reoriented thermal gradients enhance energy attenuation across the stud–glazing interface. The resultant R-values increase to 3.00–3.14 m2·K/W, corresponding to a 14.94–17.62% improvement. This confirms the role of perforations in redistributing flux, mitigating axial conduction, and improving the thermal performance of fire-glazed assemblies.

6.4.5. External LSF Wall with 110 mm Brick Veneer Cladding

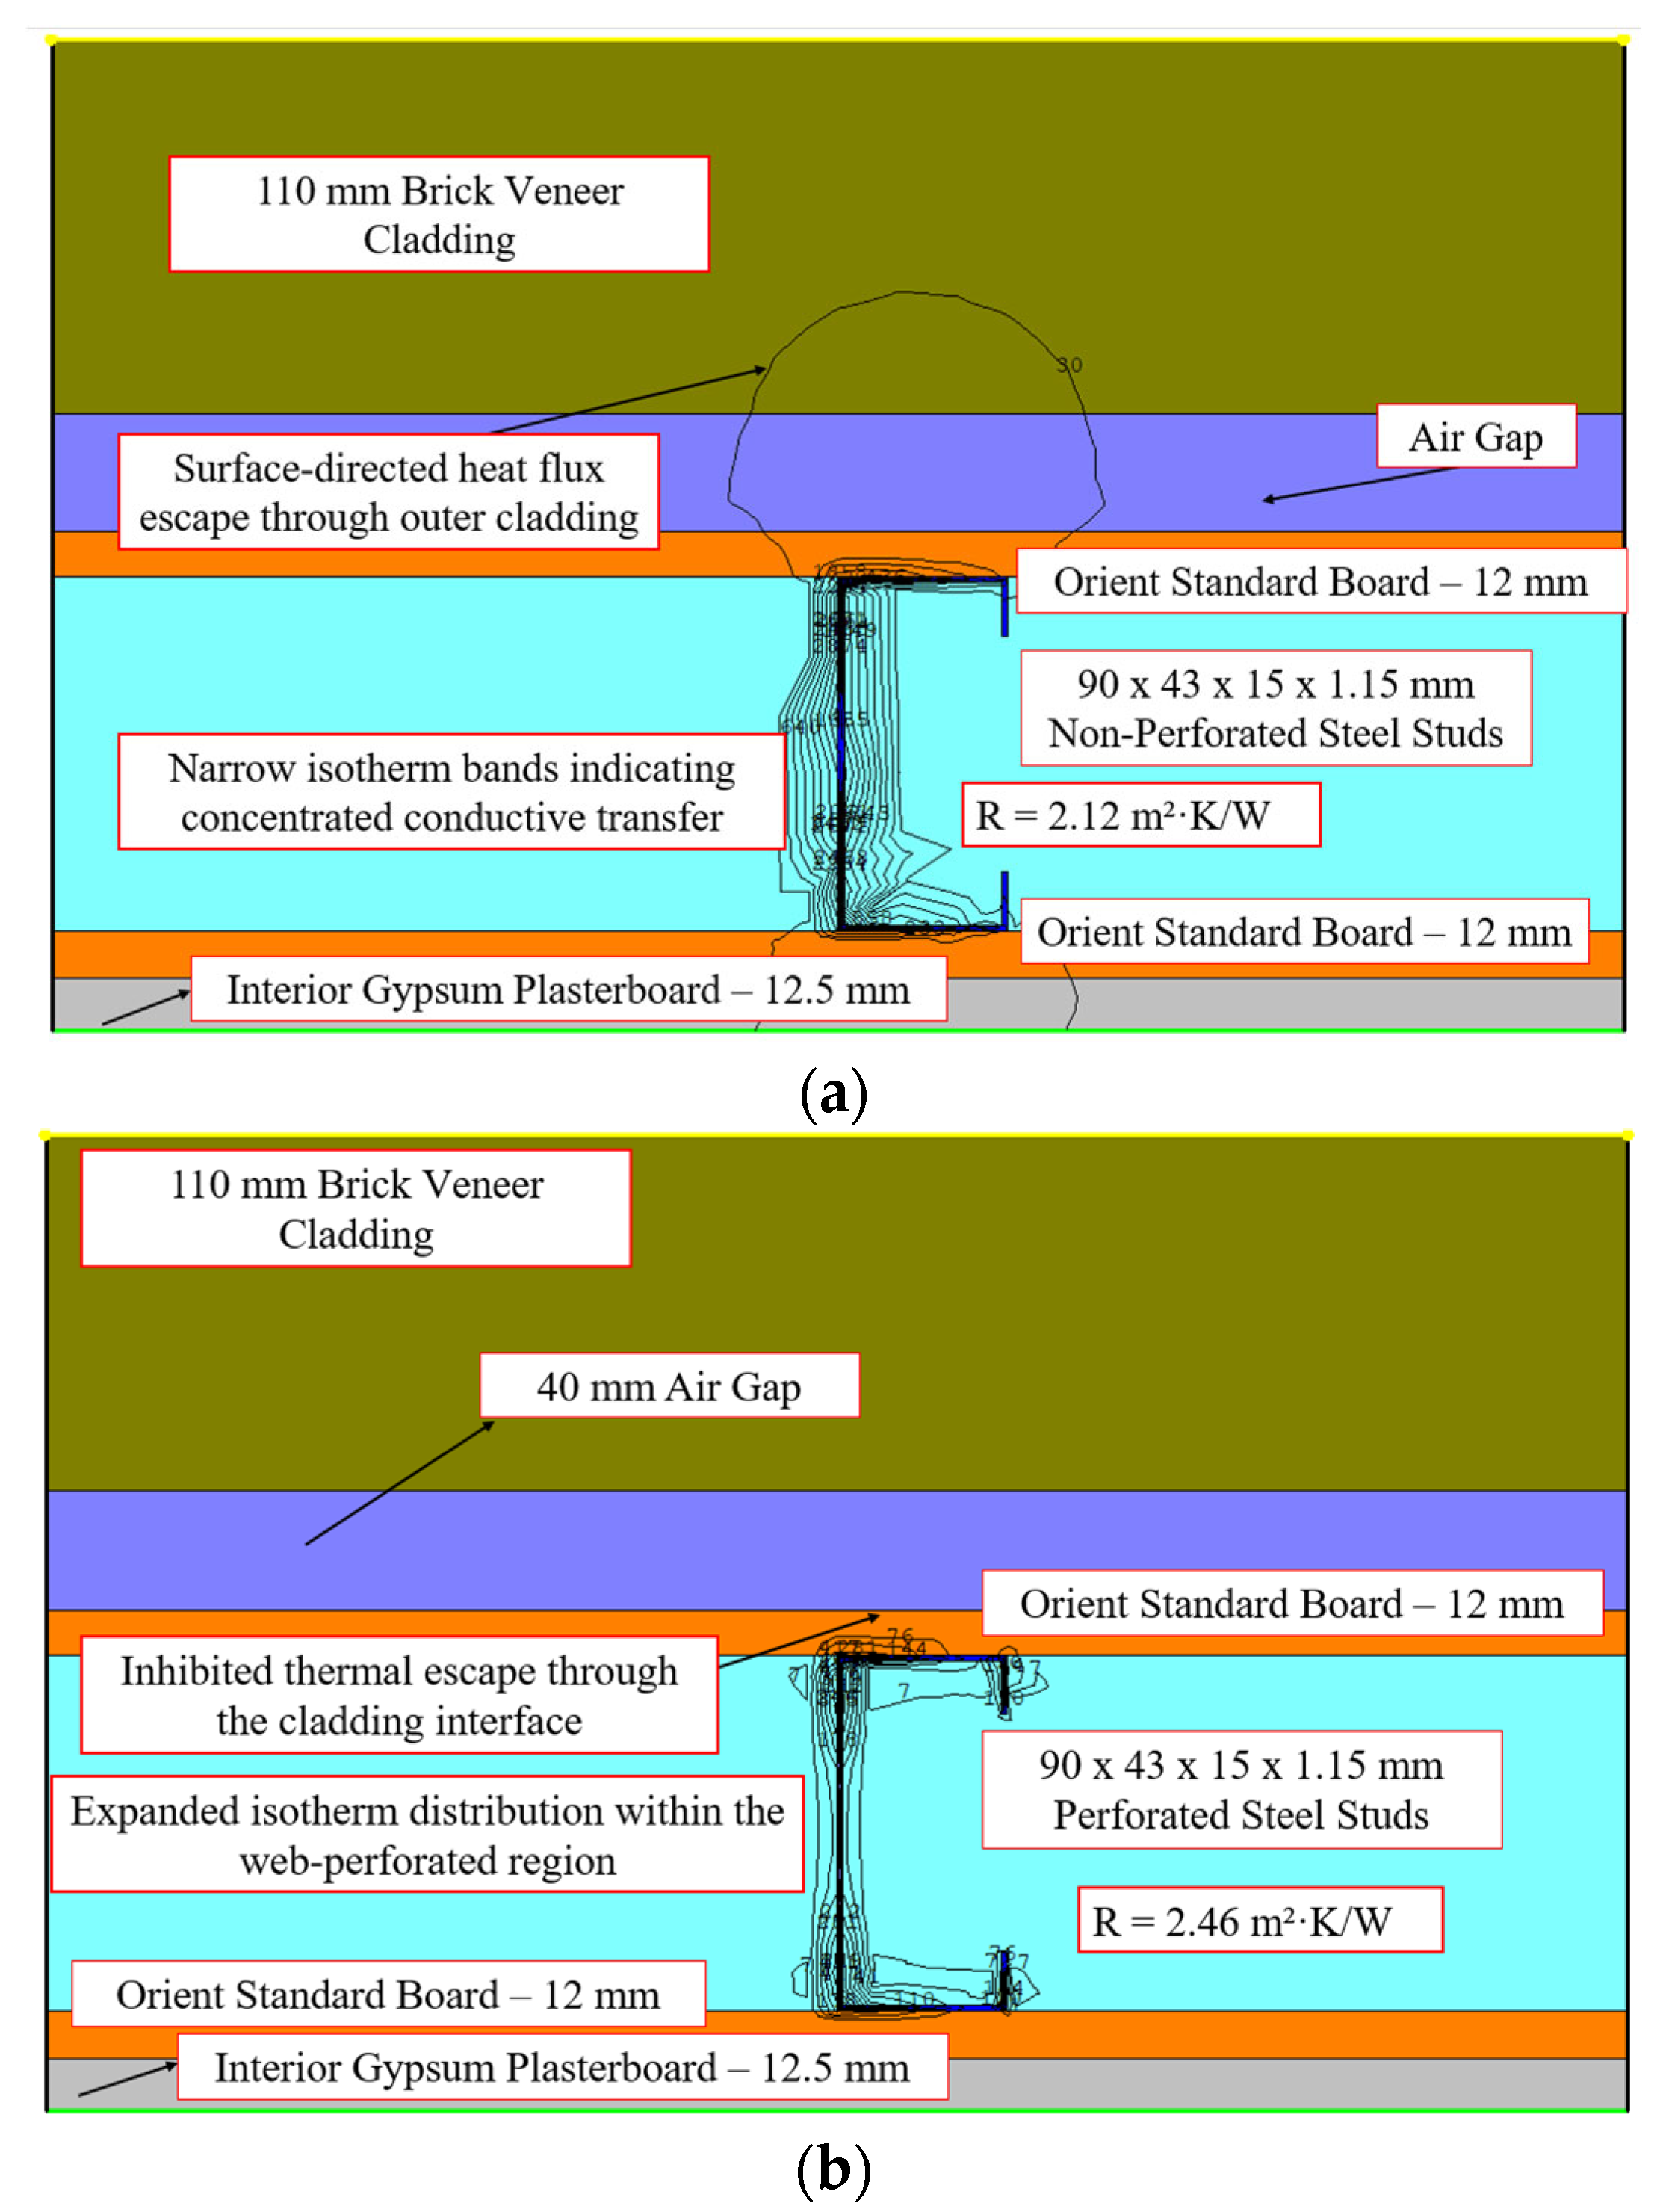
In brick veneer-clad LSF walls, the thermal field is shaped by the high thermal mass and moderate conductivity of the 110 mm external masonry layer. In the non-perforated configuration, axial conduction dominates along the steel web, with dense isotherms and steep gradients forming a narrow conduction channel from exterior to interior (Figure 30 and Figure 31). These concentrated flux pathways yield R-values between 2.57 and 2.70 m2·K/W. Introducing 68 mm web perforations interrupts this direct conduction stream, enhancing lateral thermal diffusion into the surrounding insulation. As shown in Figure 30b and Figure 31b, isotherms exhibit radial dispersion around the perforations, reduced curvature, and broadened thermal contours, especially near flange and floor junctions. These modifications redistribute the thermal gradient and suppress interface leakage. The improved energy spread raises R-values to 2.95–3.13 m2·K/W, corresponding to a 14.79–17.42% improvement. This confirms that geometric disruption of axial heat paths enhances thermal resistance, even under heavy cladding conditions where mass effects dominate.
Comparative thermal analysis of five external LSF wall systems demonstrates that incorporating web-perforated studs consistently enhances thermal resistance across all cladding types. Among them, AAC and profiled steel exhibited high R-value gains. Overall, web-perforated CFS studs act as effective thermal modifiers by altering conduction path geometry and promoting distributed flux, delivering R-value gains based on the results of Abaqus, THERM, NZS4214 and ASHRAE Modified Zone methods.

7. Heat Transfer Modulation Through Web Perforations in Previously Published LSF Wall Assemblies

Previous research has demonstrated the use of passive measures such as thermal breaks, additional insulation layers, and double lining systems to increase the thermal resistance (R-value) of LSF wall systems. In this study, reference wall configurations with non-perforated CFS studs reported in the literature were modelled using THERM to establish baseline performance. To quantify the influence of web perforations, circular web openings of 68 mm diameter were introduced at the stud centre, and the R-values were recalculated. The results showed that the inclusion of perforations increased thermal resistance by reducing direct heat transfer across the steel web. The outcomes of these modifications are presented in Table 11.
Among the reviewed configurations shown in Table 11, web perforations consistently disrupt axial heat conduction through steel studs, promoting lateral thermal diffusion into adjacent insulation layers such as mineral wool, EPS, and aerogel. In conventional C90 assemblies, both single and back-to-back, perforations fragment the continuous steel conduction path, yielding improvements of 13.10 to 15.73%. In walls with thermal breaks (TBS) or high-resistance materials, such as aerogel or ETICS, perforations further suppress axial gradients and redistribute concentrated flux zones, with thermal gains rising to 16.79 and 17.44%. Heavier steel sections like C150 studs exhibit enhanced benefit (up to 17.0%) as perforations mitigate intensified directional conduction by redirecting heat laterally. Systems with continuous external insulation, such as hybrid and warm constructions, also experience 13.49 to 15.00% increases, as perforations reorient residual conduction into low-conductivity exterior envelopes. Overall, the use of web perforations enhances transverse heat dispersion, weakens axial flux continuity, and delivers up to 19.01% improvement in R-values, confirming their role as effective geometric modifiers for thermal optimization in LSF wall systems.

8. Climate Zoning Assessment of Enhanced Web-Perforated LSF Wall Systems

The climate zoning assessment was undertaken to evaluate whether web-perforated LSF wall systems, with and without supplementary measures, could achieve compliance with the minimum R-value requirements of NCC 2022 across Australia’s eight climate zones. In this study, external wall configurations reported in the previous section were modelled in THERM. Sequential enhancements were then systematically introduced, beginning with the addition of web perforations, followed by perforations combined with external and dual flange thermal breaks, hybrid insulation, and double plasterboard linings, as shown in Table 12. These configurations were selected because they represent the most widely adopted strategies in the literature for improving thermal resistance in steel-framed walls [39,43]. This modelling approach enabled a direct comparison of the performance of perforated studs against mandated solutions and demonstrated the effectiveness of combined strategies in reducing thermal bridging.
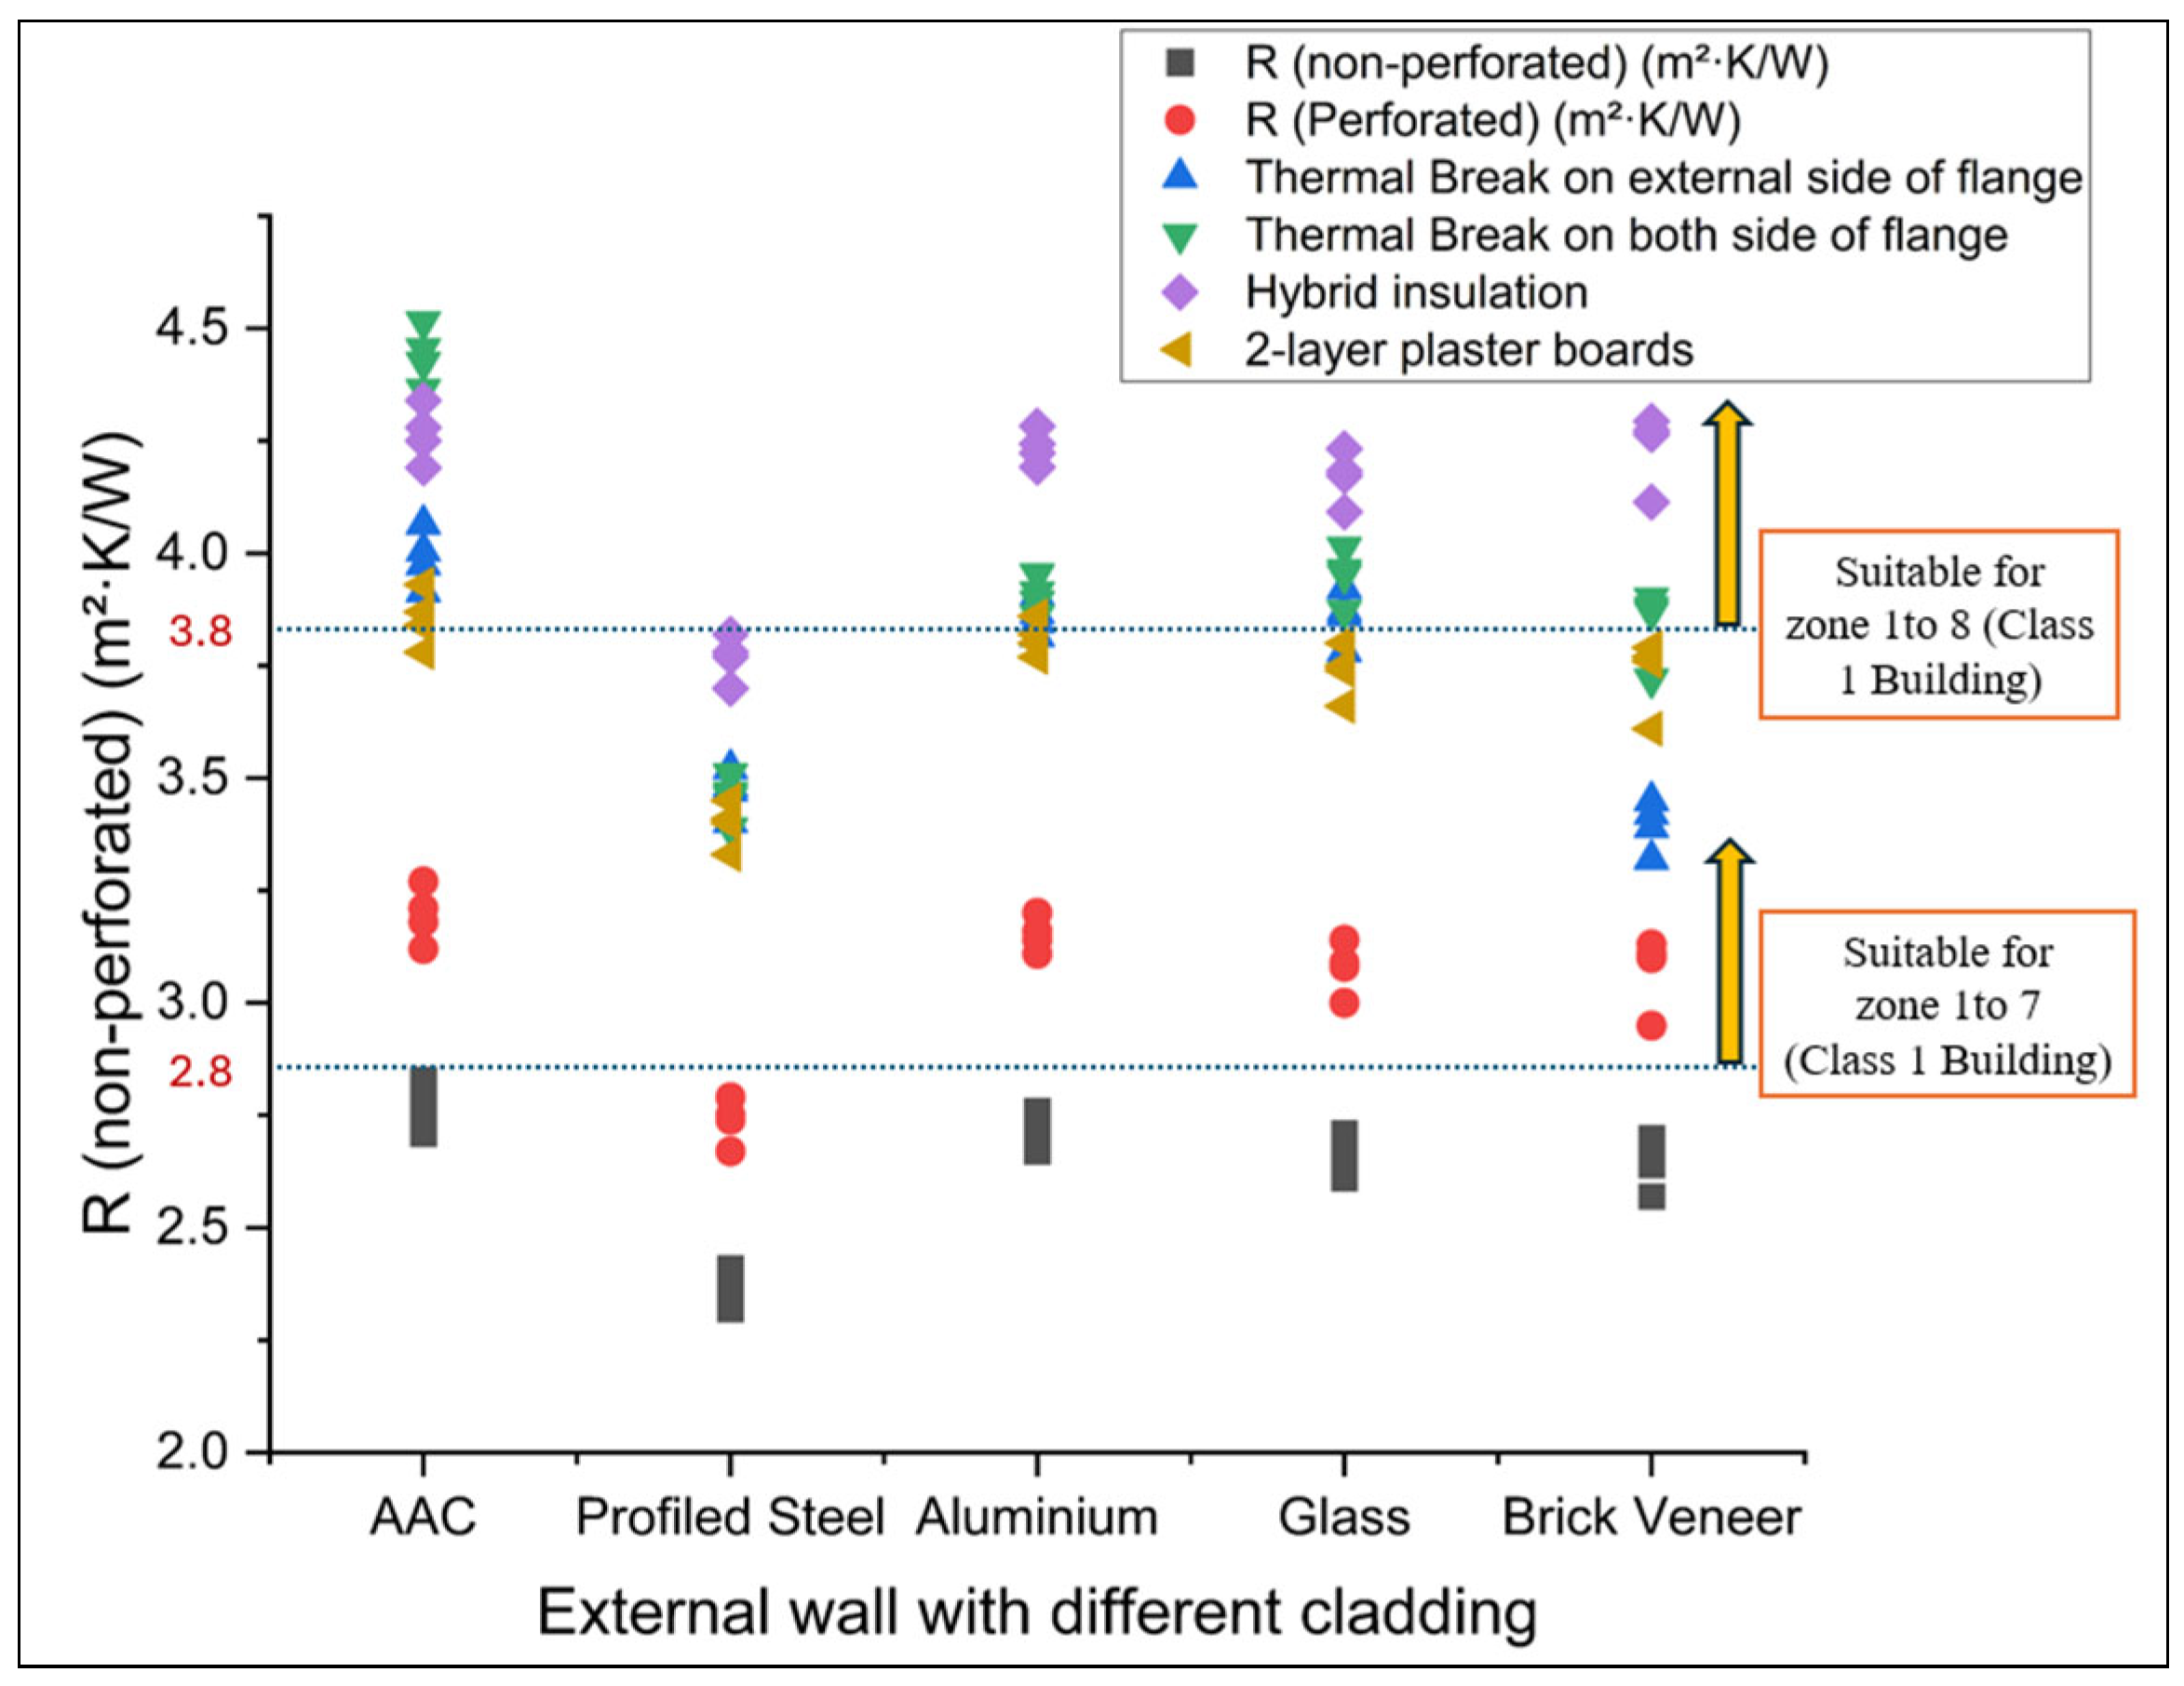
Figure 32 presents the thermal resistance outcomes summarised in Table 12 for external LSF wall systems incorporating web-perforated studs, evaluated across five cladding types and four analytical methods (Abaqus, THERM, NZS 4214, ASHRAE Modified Zone). Table 12 quantifies R-values for each system under five enhancement configurations: baseline perforated, external thermal break, dual-side thermal break, hybrid insulation, and internal double plasterboards. Across all cladding types, web perforations consistently improved R-values by 14–18% compared to their non-perforated counterparts, primarily by attenuating axial conductive flux through the steel webs and introducing thermal discontinuities that reduce effective conductivity. The highest thermal resistance values up to 4.515 m2·K/W were achieved in AAC-clad systems with dual thermal breaks, owing to suppressed lateral conduction and increased surface resistance. While hybrid insulation and double plasterboards yielded incremental gains, the dominant improvement mechanism was the conduction-path interruption induced by perforation, which aligns with Fourier-driven heat transport theory. These results confirm that in specific climates, wall designs optimised with perforations and moderate enhancements may deliver sufficient thermal resistance, potentially reducing the need for mandatory thermal breaks.
Table 13 presents the climate zone applicability of external LSF wall types incorporating web-perforated studs under a range of thermal enhancement configurations. R-values were mapped to Australian climate zones (Z1 to Z8) based on minimum required thermal resistance for energy efficiency compliance. Across all wall types, the baseline perforated configuration extended zone coverage beyond the non-perforated case, most notably, AAC walls expanded from Zones Z1 to Z7 (R = 2.71 to 2.83 m2·K/W) to the same zone range with increased resistance (R = 3.12 to 3.27 m2·K/W). ACP, brick veneer, and fire-rated glass systems also exhibited improvements, qualifying for up to Z7 under perforated or enhanced conditions. Configurations with thermal breaks (both external and dual-sided) enabled all wall types to meet R-value thresholds across Zones Z1 to Z8, achieving values up to 4.5 m2·K/W. Hybrid insulation and double-layer plasterboards further supported full climatic applicability, with most systems exceeding 4.0 m2·K/W. Profiled steel-clad walls, while initially limited to Z4 to Z5 in the non-perforated state, were rendered zone-compliant across Z1 to Z8 when enhanced. These results highlight the critical role of perforations in achieving broader climatic compatibility, particularly when paired with passive resistive strategies.

9. Conclusions

This study has assessed the thermal and structural performance of web-perforated cold-formed light steel frame walls using validated numerical models and analytical methods. Based on the results, the following conclusions were drawn.
  • Web perforations in CFS studs function as a passive thermal optimization strategy, delivering consistent R-value enhancements of 14.79 to 20.06% across all tested wall systems. R-values increased from 2.57–2.83 m2·K/W (non-perforated) to 2.95–3.27 m2·K/W (perforated), with a peak gain of 0.54 m2·K/W in AAC-clad walls.
  • By reducing the steel web cross-sectional area, perforations interrupted the continuous through-stud conduction path and promoted lateral heat flux redistribution into the insulation. Heat flux vectors along the stud web decreased by 23.6–37.5%, with 2D and 3D isotherm analyses in THERM and Abaqus confirming flux redistribution and attenuated thermal bridging.
  • The maximum R-value of 1.892 m2·K/W was achieved in a 3 m wall with 68 mm diameter holes at 200 mm spacing, improving thermal resistance by 20.06%.
  • Although the axial compression capacity reduced by 29.51% in perforated studs (from 82.13 to 57.1 kN), it was restored to within 3.2% of the non-perforated stud capacity using 4 mm long edge stiffeners around the holes (78.31 kN).
  • Web-perforated studs increased thermal resistance across all façade systems, with perforations alone sufficient to satisfy NCC 2022 R-value thresholds in several zones. As NCC mandates thermal breaks (R ≥ 0.2) for metal-framed external walls and roofs where cladding and lining are directly fixed, combined systems with 19 mm thermal breaks or hybrid insulation achieved 4.2–4.5 m2·K/W, ensuring compliance across all climate zones (Z1–Z8).
  • Adapted NZS 4214 and ASHRAE Modified Zone methods accurately predicted the R-values of perforated walls using frame fraction and flux correction adjustments.
  • Across selected façade systems, web-perforated LSF wall designs achieved R-values of 3.14 to 3.27 m2·K/W, demonstrating that in certain climates, thermal breaks can be excluded where cladding or insulation sufficiently limits heat transfer.
  • Heat flux correction factors (Cf= 0.52 to 0.89) derived from the 120 Abaqus models allow accurate R-value estimation without full 3D FE simulations, supporting practical design and compliance with NCC, ASHRAE, and ISO 6946.
  • Furthermore, the climate zoning analysis demonstrated that web-perforated LSF wall systems, either alone or in combination with moderate enhancements such as thermal breaks or hybrid insulation, satisfied the NCC 2022 R-value requirements across all Australian climate zones (Z1–Z8).
Overall, web perforations offer a geometry-driven, energy-efficient, and structurally viable solution to mitigating thermal bridging in steel-framed wall systems, scalable across assemblies and climates without reliance on costly thermal breaks.

Author Contributions

S.I.: Conceptualization, Data curation, Formal analysis, Investigation, Methodology, Visualization, Writing—original draft. A.A.: Conceptualization, Methodology, Project administration, Resources, Supervision, Validation, Writing—review & editing. M.M.: Conceptualization, Project administration, Supervision, Validation, Writing—review & editing. All authors have read and agreed to the published version of the manuscript.

Funding

This research received no external funding.

Data Availability Statement

The datasets generated or analysed during the current study are available from the corresponding author upon reasonable request.

Acknowledgments

The authors acknowledge the Queensland University of Technology (QUT) for providing a PhD scholarship to the first author and the necessary facilities to undertake this research project.

Conflicts of Interest

The authors declare that there are no conflicts of interest related to this work.

References

  1. Song, J.-H.; Kim, H.-W. Performance Evaluation of Low Thermal Bridging Drywall System with Separating Clips for C-Studs. Buildings 2024, 14, 3032. [Google Scholar] [CrossRef]
  2. Qi, X.; Tan, Y.; Tan, J.; Li, X. Methods for improving the thermal performance of thermal bridges of lightweight steel-framed buildings. PLoS ONE 2024, 19, e0314634. [Google Scholar] [CrossRef]
  3. Soares, N.; Santos, P.; Gervásio, H.; Costa, J.J.; da Silva, L.S. Energy efficiency and thermal performance of lightweight steel-framed (LSF) construction: A review. Renew. Sustain. Energy Rev. 2017, 78, 194–209. [Google Scholar] [CrossRef]
  4. Soares, N.; Martins, C.; Gonçalves, M.; Santos, P.; da Silva, L.S.; Costa, J.J. Laboratory and in-situ non-destructive methods to evaluate the thermal transmittance and behavior of walls, windows, and construction elements with innovative materials: A review. Energy Build 2019, 182, 88–110. [Google Scholar] [CrossRef]
  5. Santos, P.; Poologanathan, K. The importance of stud flanges size and shape on the thermal performance of lightweight steel framed walls. Sustainability 2021, 13, 3970. [Google Scholar] [CrossRef]
  6. Santos, P. Energy Efficiency of Lightweight Steel-Framed Buildings. In Energy Efficient Buildings; InTech: London, UK, 2017. [Google Scholar] [CrossRef]
  7. Rajanayagam, H.; Upasiri, I.; Poologanathan, K.; Gatheeshgar, P.; Sherlock, P.; Konthesingha, C.; Nagaratnam, B.; Perera, D. Thermal Performance of LSF Wall Systems with Vacuum Insulation Panels. Buildings 2021, 11, 621. [Google Scholar] [CrossRef]
  8. Francis, E.; Gatheeshgar, P.; Santos, P. Thermal transmittance of single and double stud LSF walls: Parametric study and simplified models. J. Build. Eng. 2025, 102, 111939. [Google Scholar] [CrossRef]
  9. Martins, C.; Santos, P.; da Silva, L.S. Lightweight steel-framed thermal bridges mitigation strategies: A parametric study. J. Build. Phys. 2016, 39, 342–372. [Google Scholar] [CrossRef]
  10. Santos, P.; Abrantes, D.; Lopes, P.; Mateus, D. Experimental and Numerical Performance Evaluation of Bio-Based and Recycled Thermal Break Strips in LSF Partition Walls. Buildings 2022, 12, 1237. [Google Scholar] [CrossRef]
  11. Gorgolewski, M. Developing a simplified method of calculating U-values in light steel framing. Build Environ. 2007, 42, 230–236. [Google Scholar] [CrossRef]
  12. Chandrasiri, D.; Gatheeshgar, P.; Ahmadi, H.M.; Simwanda, L. Numerical Study of Thermal Efficiency in Light-Gauge Steel Panels Designed with Varying Insulation Ratios. Buildings 2024, 14, 300. [Google Scholar] [CrossRef]
  13. Santos, P.; Lemes, G.; Mateus, D. Analytical Methods to Estimate the Thermal Transmittance of LSF Walls: Calculation Procedures Review and Accuracy Comparison. Energies 2020, 13, 840. [Google Scholar] [CrossRef]
  14. Sovetova, M.; Calautit, J.K. Thermal and energy efficiency in 3D-printed buildings: Review of geometric design, materials and printing processes. Energy Build. 2024, 323, 114731. [Google Scholar] [CrossRef]
  15. Yang, Z.; Sun, L.; Nan, B.; Wei, S. Thermal Performance of Slotted Light Steel-Framed Composite Wall. Energies 2023, 16, 2482. [Google Scholar] [CrossRef]
  16. Alekperov, R.; Aksenov, I. Decrease of cold-formed slotted studs heat conductivity by slots shape modification. E3S Web Conf. 2019, 97, 06009. [Google Scholar] [CrossRef]
  17. Langner, M.; Soares, T.A.; Figueiredo, A.; Almeida, R.M.S.F.; Vicente, R. Parametric Analysis of Steel Studs to Reduce Thermal Bridges in Light Steel Framing Construction Systems. Buildings 2025, 15, 194. [Google Scholar] [CrossRef]
  18. Höglund, T.; Burstrand, H. Slotted steel studs to reduce thermal bridges in insulated walls. Thin-Walled Struct. 1998, 32, 81–109. [Google Scholar] [CrossRef]
  19. BS EN ISO 6946:2017; Building Components and Building Elements. Thermal Resistance and Thermal Transmittance. Calculation Methods. British Standards Institute: London, UK, 2017.
  20. NCC 2022 Volume Two—Building Code of Australia Class 1 and 10 Buildings. Available online: http://ncc.abcb.gov.au/editions/ncc-2022/adopted/volume-two (accessed on 1 April 2025).
  21. Liang, H.; Roy, K.; Fang, Z.; Lim, J.B.P. A Critical Review on Optimization of Cold-Formed Steel Members for Better Structural and Thermal Performances. Buildings 2022, 12, 34. [Google Scholar] [CrossRef]
  22. 2021 International Energy Conservation Code (IECC) and ANSI/ASHRAE/IES Standard 90.1-2022. Available online: https://www.energycodes.gov/sites/default/files/2024-02/Standard_90.1-2022_Final_Determination_TSD.pdf (accessed on 1 March 2025).
  23. ASHRAE. Handbook of Fundamentals, American Society of Heating; Refrigeration and Air-Conditioning Engineers, Inc.: Atlanta, GA, USA, 2021. [Google Scholar]
  24. European Commission. Directive (EU) 2018/844 on the Energy Performance of Buildings (EPBD). Off. J. Eur. Union 2018, L156, 75–91. [Google Scholar]
  25. NZS 4214; Methods of Determining the Total Thermal Resistance of Parts of Buildings. New Zealand Standard: Wellington, New Zealand, 2006.
  26. Santos, P.; Ribeiro, T. Thermal Performance of Double-Pane Lightweight Steel Framed Walls with and without a Reflective Foil. Buildings 2021, 11, 301. [Google Scholar] [CrossRef]
  27. Kempton, L.; Kokogiannakis, G.; Green, A.; Cooper, P. Evaluation of thermal bridging mitigation techniques and impact of calculation methods for lightweight steel frame external wall systems. J. Build. Eng. 2021, 43, 102893. [Google Scholar] [CrossRef]
  28. A Review of Thermal Bridging Mitigation Provisions and Thermal Break Provisions NCC 2022. Available online: https://www.abcb.gov.au/sites/default/files/resources/2023/LittleShrub%20Report%20-%20Thermal%20Bridging%20and%20Thermal%20Break.pdf (accessed on 1 February 2025).
  29. Department of Climate Change, Energy, the Environment and Water. Trajectory for Low Energy Buildings; Department of Climate Change, Energy, the Environment and Water: Canberra, Australia, 2019.
  30. ationwide House Energy Rating Scheme. Software Accreditation Protocol—New Homes 2025. Available online: https://www.nathers.gov.au/sites/default/files/2025-02/Software%20Accreditation%20Protocol%20-%20New%20Homes%2020250227.pdf (accessed on 1 March 2025).
  31. Santos, P.; Mateus, D. Experimental assessment of thermal break strips performance in load-bearing and non-load-bearing LSF walls. J. Build. Eng. 2020, 32, 101693. [Google Scholar] [CrossRef]
  32. Gunalan, S.; Kolarkar, P.; Mahendran, M. Experimental study of load bearing cold-formed steel wall systems under fire conditions. Thin-Walled Struct. 2013, 65, 72–92. [Google Scholar] [CrossRef]
  33. Incropera, F.P.; DeWitt, D.P.; Bergman, T.L.; Lavine, A.S. Fundamentals of Heat and Mass Transfer, 6th ed.; Wiley: Hoboken, NJ, USA, 2007. [Google Scholar]
  34. ISO 10211:2017; Thermal Bridges in Building Construction—Heat Flows and Surface Temperatures—Detailed Calculations. International Organization for Standardization: Geneva, Switzerland, 2017.
  35. Vy, S.T.; Mahendran, M.; Ariyanayagam, A. Numerical modelling and investigation of CFS built-up stud walls in fire. Fire Saf. J. 2024, 144, 104102. [Google Scholar] [CrossRef]
  36. AS/NZS 4600:2005; Cold-Formed Steel Structures. Standards Australia: Sydney, Australia; Standards New Zealand: Wellington, New Zealand, 2018.
  37. Clayton, T.G. Design of Steel Wall Studs with Service Holes; Senior Research Engineer, BlueScope Steel Research. Available online: https://www.nash.asn.au/wp-content/uploads/2022/04/303_1330395018.pdf (accessed on 1 April 2023).
  38. ABAQUS; Dassault Systèmes: Providence, RI, USA, 2023.
  39. Keerthan, P.; Mahendran, M. Thermal Performance of Composite Panels Under Fire Conditions Using Numerical Studies: Plasterboards, Rockwool, Glass Fibre and Cellulose Insulations. Fire Technol. 2013, 49, 329–356. [Google Scholar] [CrossRef]
  40. Perera, D.; Upasiri, I.R.; Poologanathan, K.; Gatheeshgar, P.; Sherlock, P.; Hewavitharana, T.; Suntharalingam, T. Energy performance of fire rated LSF walls under UK climate conditions. J. Build. Eng. 2021, 44, 103293. [Google Scholar] [CrossRef]
  41. Auwerda, G.J.; Zheng, Y.H.; Kloosterman, J.L.; Lathouwers, D. Comparison of 2D and 3D heat transfer models around the coolant channels in the HTR-PM side reflector. Nucl. Eng. Des. 2014, 271, 465–471. [Google Scholar] [CrossRef]
  42. Peiris, M.; Mahendran, M. Behaviour of cold-formed steel lipped channel sections subject to eccentric axial compression. J. Constr. Steel Res. 2021, 184, 106808. [Google Scholar] [CrossRef]
  43. Santos, P.; Lopes, P.; Abrantes, D. Thermal Performance of Lightweight Steel Framed Facade Walls Using Thermal Break Strips and ETICS: A Parametric Study. Energies 2023, 16, 1699. [Google Scholar] [CrossRef]
  44. Roque, E.; Santos, P. The Effectiveness of Thermal Insulation in Lightweight Steel-Framed Walls with Respect to Its Position. Buildings 2017, 7, 13. [Google Scholar] [CrossRef]
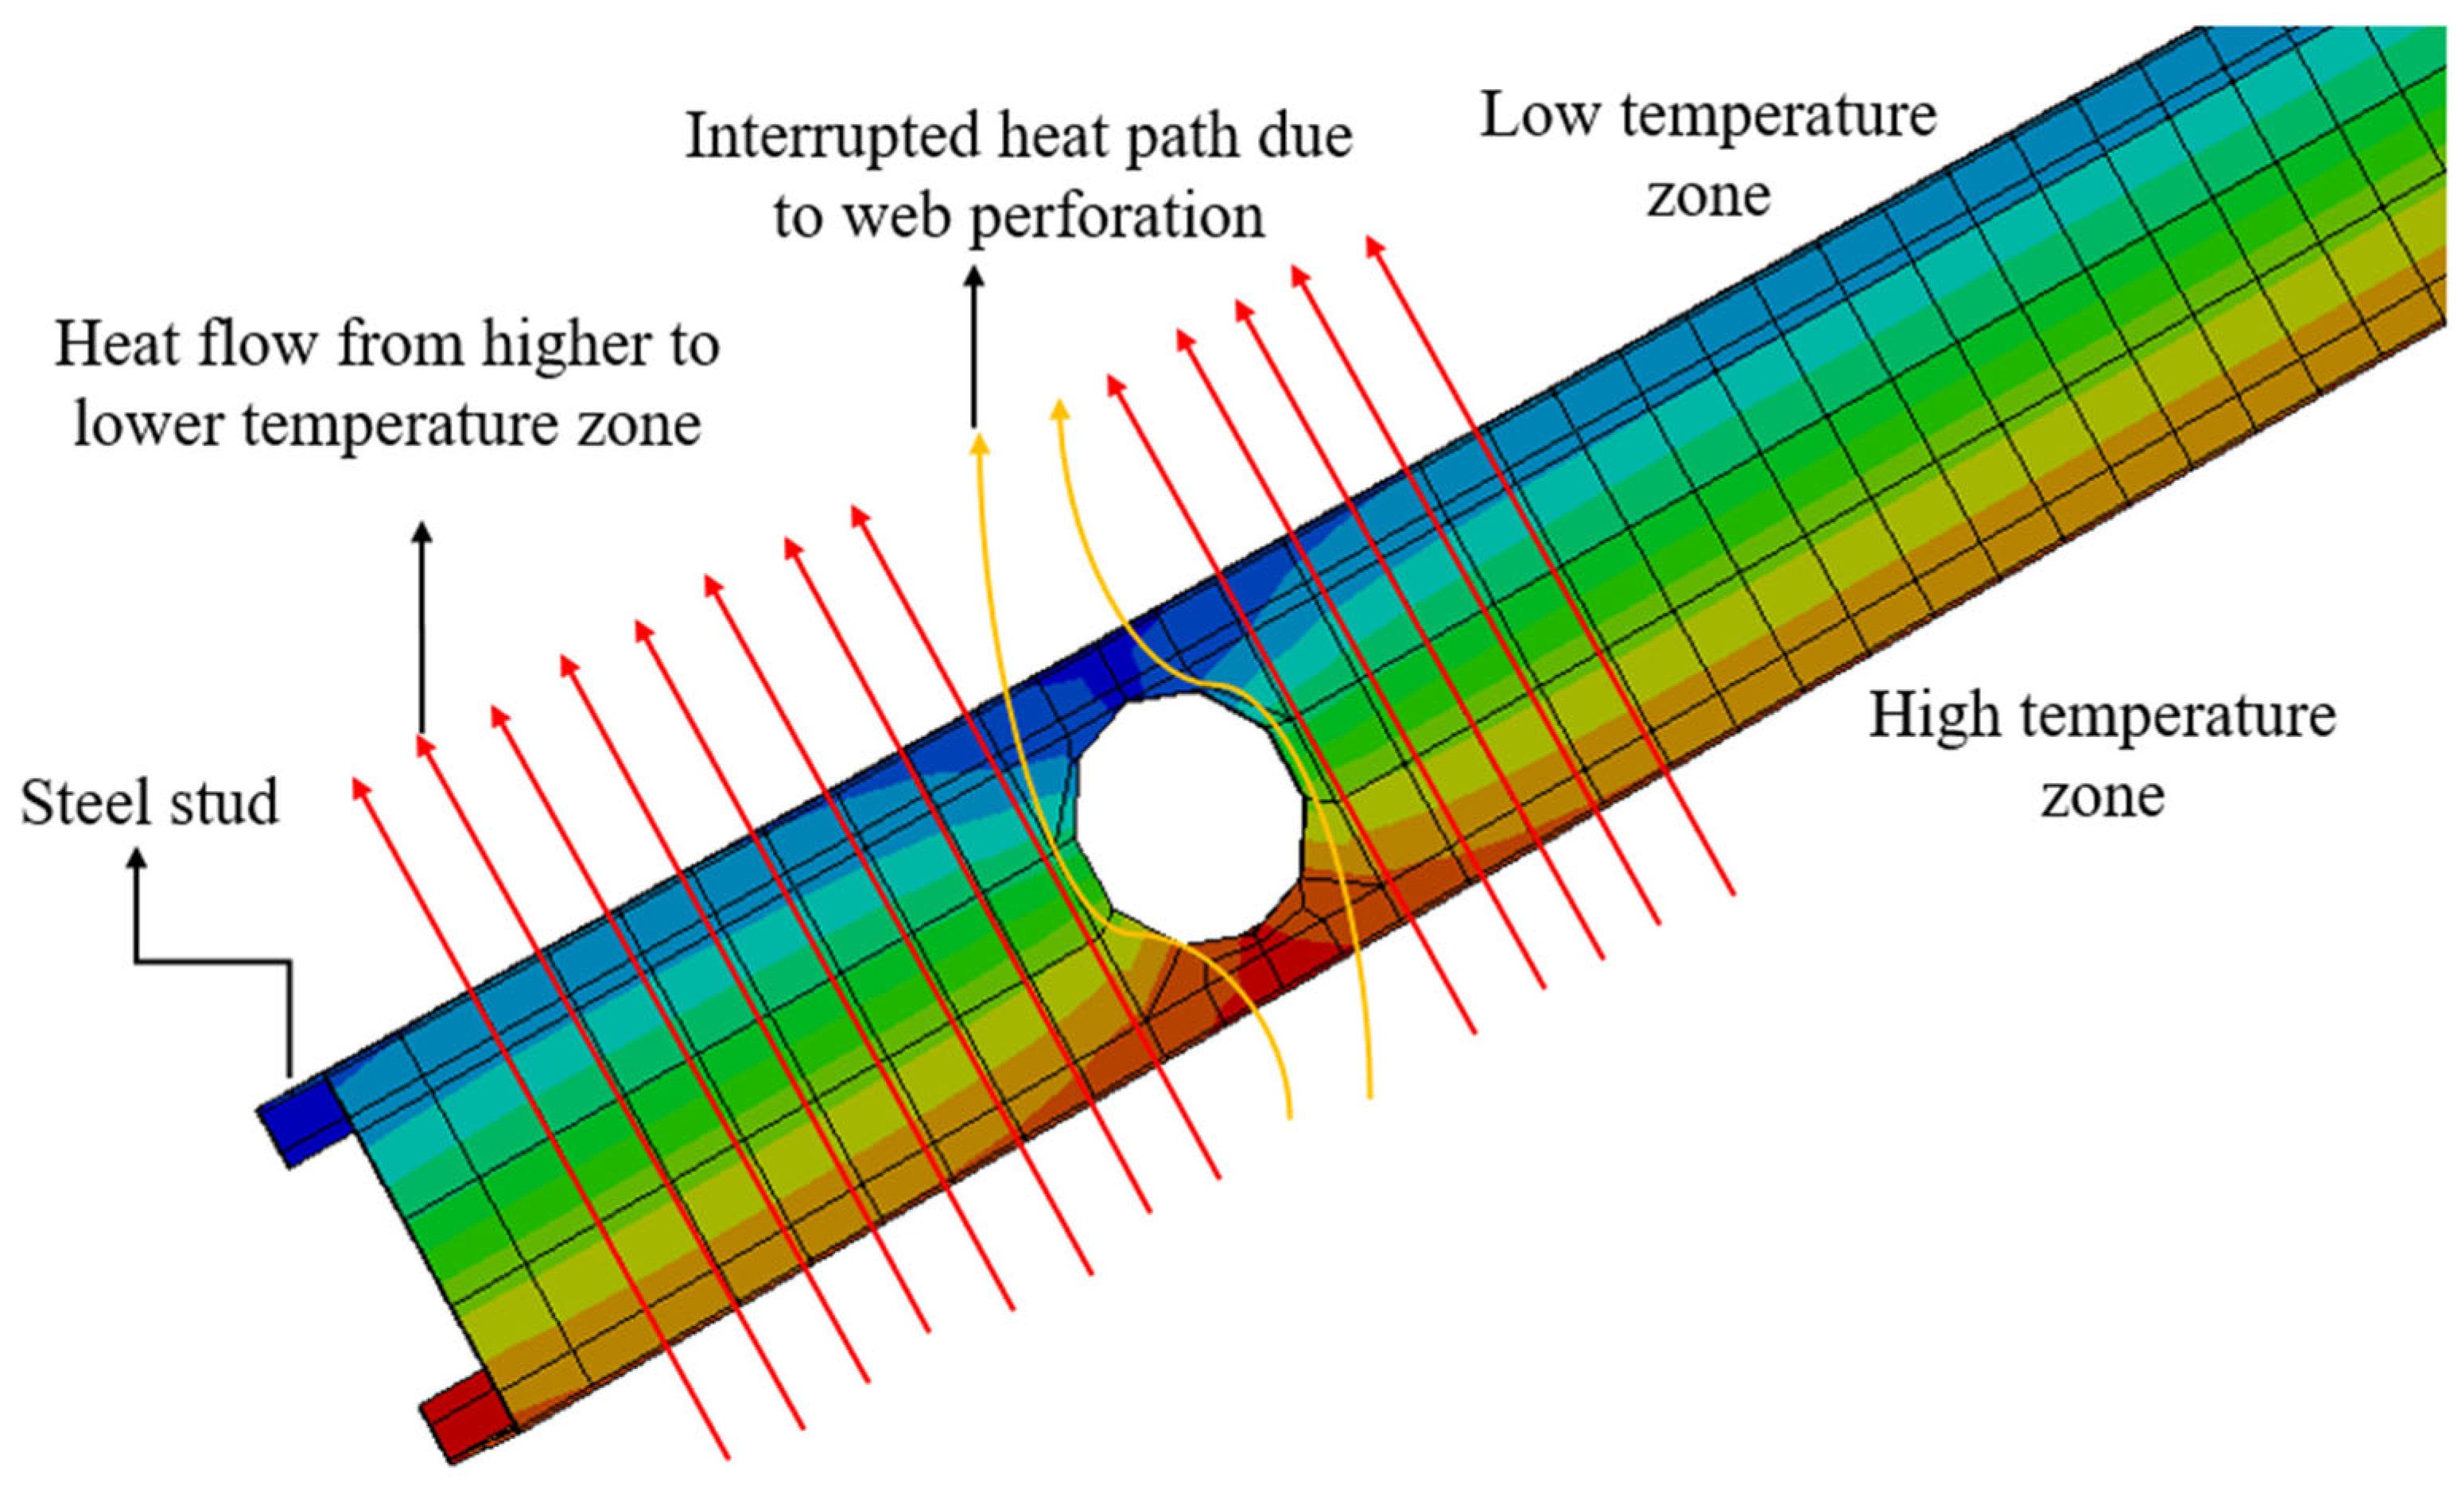
Figure 1. Heat flow distribution in a web-perforated steel stud.
Energies 18 05103 g001
Figure 2. Load-bearing LSF Wall investigated in [31].
Energies 18 05103 g002
Figure 3. Three-dimensional Abaqus model of the reference wall.
Energies 18 05103 g003
Figure 4. THERM model of the reference wall.
Energies 18 05103 g004
Figure 5. Abaqus model of 1200 mm × 3000 mm LSF wall with solid and web-perforated CFS studs.
Energies 18 05103 g005
Figure 6. Locations and sizes of web perforations modelled in Abaqus.
Energies 18 05103 g006
Figure 7. Final mesh configuration.
Energies 18 05103 g007
Figure 8. Thermal boundary conditions and material interactions in LSF Walls.
Energies 18 05103 g008
Figure 9. Measurement of total thermal resistance in LSF wall assemblies.
Energies 18 05103 g009
Figure 10. Model validation of THERM simulations based on thermal gradient analysis and resistance evaluation.
Energies 18 05103 g010
Figure 11. Steel frame elements replaced with an enclosing equivalent solid rectangle in conventional NZS 4214-based analytical configuration.
Energies 18 05103 g011
Figure 12. Regions of Section W and Section CAV in LSF wall based on ASHRAE method [13].
Energies 18 05103 g012
Figure 13. Results of LSF walls: (a,b) 2D Isotherm and heat flux distribution of a solid and web-perforated stud in THERM model; (c) 3D localized resistance zones in Abaqus model.
Energies 18 05103 g013
Figure 14. Comparison of R-values.
Energies 18 05103 g014
Figure 15. Temperature contours for LSF walls without web perforations in THERM.
Energies 18 05103 g015
Figure 16. Temperature contours for LSF walls with web perforations in THERM.
Energies 18 05103 g016
Figure 17. Stud configuration yielding maximum thermal resistance in Abaqus.
Energies 18 05103 g017
Figure 18. Comparison of R-values of web-perforated stud walls between Abaqus model and (a) THERM models (b) modified NZ4214 method (c) modified ASHRAE method.
Energies 18 05103 g018aEnergies 18 05103 g018b
Figure 19. Structural FE model of non-perforated stud.
Energies 18 05103 g019
Figure 20. Studs with 4 mm web-hole stiffeners.
Energies 18 05103 g020
Figure 21. External LSF wall with cladding in Abaqus.
Energies 18 05103 g021
Figure 22. Heat flux behaviour in AAC-Clad external LSF wall with (a) non-perforated and (b) web-perforated studs.
Energies 18 05103 g022
Figure 23. Isotherm distribution in AAC-Clad external LSF Wall with (a) non-perforated and (b) web-perforated studs.
Energies 18 05103 g023
Figure 24. Heat flux behaviour in profiled steel-clad external LSF wall with (a) non-perforated and (b) perforated studs.
Energies 18 05103 g024
Figure 25. Isotherm distribution in profiled steel-clad external LSF wall with (a) non-perforated and (b) web-perforated studs.
Energies 18 05103 g025
Figure 26. Heat flux behaviour in ACP-clad external LSF Wall with (a) non-perforated and (b) perforated studs.
Energies 18 05103 g026
Figure 27. Isotherm distribution in ACP-clad external LSF wall with (a) non-perforated and (b) web-perforated studs.
Energies 18 05103 g027
Figure 28. Heat flux behaviour in fire-rated glazing-clad external LSF wall with (a) non-perforated and (b) perforated studs.
Energies 18 05103 g028
Figure 29. Isotherm distribution in fire-rated glazing-clad external LSF Wall with (a) non-perforated and (b) web-perforated studs.
Energies 18 05103 g029
Figure 30. Heat flux behaviour in brick veneer-clad external LSF wall with (a) non-perforated and (b) perforated studs.
Energies 18 05103 g030
Figure 31. Isotherm distribution in brick veneer-clad external LSF wall with (a) non-perforated and (b) web-perforated studs.
Energies 18 05103 g031
Figure 32. Comparison of R-values of external LSF walls with web-perforated studs across different cladding types with thermal enhancement strategies.
Energies 18 05103 g032
Table 1. Required total R-Values for external walls from NCC [20].
Climate ZoneClass of Building
12, 5, 6, 7, 8 or 9b or 9a Excluding Ward Area3 or 9c or 9a Ward Area
12.82.43.3
22.81.41.4
32.81.43.3
42.81.42.8
52.81.41.4
62.81.42.8
72.81.42.8
83.81.43.8
Table 2. Overview of the present study on web-perforated CFS studs in LSF walls.
Study ComponentDetailsScope/ConfigurationsPurpose
Model ValidationReference LSF wall by Santos & Mateus [31] (guarded hot-box)1 wall (R = 1.558 m2·K/W)—Heat transfer modelBenchmark validation of LSF wall using Abaqus and THERM
Gunalan et al. [32] 3 m lipped channel CFS stud1 stud (81 kN vs. 79 kN (experimental).)—Structural capacity modelStructural validation of CFS stud model in Abaqus
Numerical Study Validated LSF walls with and with-out web-perforated CFS studsTHERM (2D), Abaqus (3D), and analytical methods (NZS 4214, ASHRAE)Evaluate the role of web-perforations in thermal capacity enhancement
Parametric Study (CFS studs)Lipped channel stud 90 × 40 × 15 × 1.15 mm, 3 m height120 CFS studs: Hole Ø 36–68 mm, spacing 120–450 mm (d/h = 0.40–0.76)Evaluate thermal R-values and load capacity
Edge stiffeners (4 mm plates)1 CFS stud with 68 mm Ø holes with 200 mm clear spacingRestore structural capacity of perforated studs
Analytical MethodsModified NZS 4214 & ASHRAE MZMCompared with Abaqus & THERMDevelop reliable predictive models
Façade Systems (External Walls)AAC panels1 case (THERM (2D), Abaqus (3D), and analytical methods (NZS 4214, ASHRAE))High thermal mass façade
Corrugated steel sheeting1 case (THERM (2D), Abaqus (3D), and analytical methods (NZS 4214, ASHRAE))Lightweight, high conductivity façade
Aluminium composite panels (ACP)1 case (THERM (2D), Abaqus (3D), and analytical methods (NZS 4214, ASHRAE))Insulated lightweight façade
Fire-rated glass façade1 case (THERM (2D), Abaqus (3D), and analytical methods (NZS 4214, ASHRAE))Transparent, fire-resistant façade
Ventilated brick veneer1 case (THERM (2D), Abaqus (3D), and analytical methods (NZS 4214, ASHRAE))Brick veneer with ventilated cavity
EnhancementsThermal breaksApplied in all external walls considered in studyReduce thermal bridging
Hybrid insulation (partial cavity fill + sheathing)Applied in all external walls considered in studyImprove thermal efficiency
Double plasterboardApplied in all external walls considered in studyIncrease thermal mass & fire performance
Climate Zone AnalysisNCC 2022 Australian climate zones (Z1–Z8)Applied in all external walls considered in studyDemonstrate compliance with R-value requirements
Table 3. Validation of R-values against experimental results.
MethodR Value–Non-Perforated LSF Walls (m2·K/W)Deviation from Experiment (%)
Experimental reference1.558
Abaqus 1.5700.77%
THERM 1.6324.75%
NZS 4214:20161.5912.12%
ASHRAE Modified Zone method1.5791.35%
Table 4. Enhanced R-values of perforated stud walls.
MethodR Value–Web-Perforated LSF Walls (m2·K/W)% Improvement of R Value Due to Web-Perforation
Abaqus1.81315.48%
THERM1.89616.18%
NZS 42141.84515.96%
ASHRAE Modified Zone1.83316.09%
Table 5. Physical and material properties of external cladding materials.
MaterialDescriptionThickness (mm)Thermal Conductivity (W/m·K)
AACLightweight cellular concrete panel750.14
Profiled Steel CladdingZinc-coated profiled steel cladding (BMT 0.42 mm)0.4251
ACPNon-combustible A1-grade panel with mineral core5.0 (total)0.40 (effective)
Fire-Rated GlazingLaminated fire-resistive glass with intumescent core251.0 (overall)
Brick VeneerExternal clay brick masonry1100.7
Table 6. Thermal resistance of AAC-Clad LSF walls with and without web perforations.
External Wall TypeMethodR (Non-Perforated) (m2·K/W)R (Perforated) (m2·K/W)% Improvement
AAC CladdingAbaqus2.713.1215.13
THERM2.833.2715.50
NZS 42142.773.2115.88
ASHRAE Modified Zone2.733.1816.48
Table 7. Thermal resistance of profiled steel-clad LSF walls with and without web perforations.
External Wall TypeMethodR (Non-Perforated) (m2·K/W)R (Perforated) (m2·K/W)% Improvement
Profiled Steel CladdingAbaqus2.322.6715.09%
THERM2.412.7915.77%
NZS 42142.352.7517.02%
ASHRAE Modified Zone2.332.7417.60%
Table 8. Thermal resistance of ACP-clad LSF walls with and without web perforations.
External Wall TypeMethodR (Non-Perforated) (m2·K/W)R (Perforated) (m2·K/W)% Improvement
ACP CladdingAbaqus2.683.10915.99%
THERM2.763.215.94%
NZS 42142.713.1616.61%
ASHRAE Modified Zone2.673.1417.60%
Table 9. Thermal resistance of fire-rated glazing-clad LSF walls with and without web perforations.
External Wall TypeMethodR (Non-Perforated) (m2·K/W)R (Perforated) (m2·K/W)% Improvement
Fire-Rated Glazing CladdingAbaqus2.61314.94%
THERM2.713.1415.87%
NZS 42142.653.0916.60%
ASHRAE Modified Zone2.613.0817.62%
Table 10. Thermal resistance of brick veneer-clad LSF walls with and without web perforations.
External Wall TypeMethodR (Non-Perforated) (m2·K/W)R (Perforated) (m2·K/W)% Improvement
Fire-Rated Glazing CladdingAbaqus2.572.9514.79%
THERM2.703.1315.93%
NZS 42142.673.1116.48%
ASHRAE Modified Zone2.643.1017.42%
Table 11. Thermal performance improvements from web perforations based on literature.
Wall ConfigurationR
(Non-Perforated)
(m2·K/W)
R (Perforated)
(m2·K/W)
% ImprovementSource
12.5 mm gypsum plasterboard (both sides) + 90 mm mineral wool + single C90 stud (400 mm spacing)1.782.0615.73%Francis et al. [8] Journal of Building Engineering, 2025.
12.5 mm gypsum plasterboard (both sides) + 90 mm mineral wool + back-to-back C90 studs (400 mm spacing)1.451.6413.10%Francis et al. [8] Journal of Building Engineering, 2025,
12.5 mm gypsum + 12 mm OSB + 90 mm mineral wool + C90 × 43 × 15 × 1.5 mm stud (400 mm spacing) + 50 mm EPS + ETICS finish (no Thermal breaks -TBS)3.2043.64813.87%Santos et al. [43] Energies, 2023.
12.5 mm gypsum + 12 mm OSB + 90 mm mineral wool + C90 × 43 × 15 × 1.5 mm stud + 1 TBS (10 mm, λ = 7.5 mW/m·K) + 50 mm EPS + ETICS finish 3.8424.48716.78%Santos et al. [43] Energies, 2023.
12.5 mm gypsum + 12 mm OSB + 90 mm mineral wool + C90 × 43 × 15 × 1.5 mm stud + 2 TBS (5 mm each, λ = 7.5 mW/m·K) + 50 mm EPS + ETICS finish 4.4445.21917.43%Santos et al. [43] Energies, 2023.
12.5 mm gypsum plasterboard + 90 mm mineral wool + single C90 stud (600 mm spacing) + 15 mm flange indentation filled with aerogel1.9062.13512.00%Santos et al. [5] Sustainability, 2021.
12.5 mm gypsum + 90 mm MW + C90 (600 mm) + 15 mm indentation (aerogel) + ETICS3.4993.95413.00%Santos et al. [5] Sustainability, 2021.
12.5 mm gypsum + 90 mm MW + C150 (600 mm) + 15 mm indentation (aerogel) + ETICS4.3015.03217.00%Santos et al. [5] Sustainability, 2021.
12.5 mm gypsum + 90 mm MW + C90 (400 mm) + 15 mm indentation (aerogel) + ETICS3.2033.81219.00%Santos et al. [5] Sustainability, 2021.
12.5 mm plasterboard + 10 mm OSB + 150 mm RW between steel studs + 15 mm OSB + 5 mm ETICS (C1—Cold Construction)2.3172.59512.00%Santos et al. [44] Buildings, 2017.
12.5 mm plasterboard + 10 mm OSB + 150 mm steel studs + 15 mm OSB + 75 mm RW (internal) + 75 mm EPS (external) + 5 mm ETICS (H1—Hybrid Construction)3.7444.24913.50%Santos et al. [44] Buildings, 2017.
12.5 mm plasterboard + 10 mm OSB + 150 mm steel studs + 15 mm OSB + 150 mm EPS (fully external) + 5 mm ETICS (W1—Warm Construction)4.7795.49615.00%Santos et al. [44] Buildings, 2017.
Table 12. R-Values of LSF external wall systems with web-perforated studs and various enhancement configurations.
External Wall TypeMethodR (Non-Perforated) (m2·K/W)R (Perforated) (m2·K/W)Web-Perforated + Thermal Break (External Flange)—R (m2·K/W)Web-Perforated + Thermal Break (Both Flanges)—R (m2·K/W)Web-Perforated + Hybrid Insulation—R (m2·K/W)Web-Perforated + Double Plasterboards—R (m2·K/W)
AACAbaqus2.713.123.9154.3654.193.78
THERM2.833.274.0654.5154.343.93
NZS 42142.773.214.0054.4554.283.87
ASHRAE Mod. Zone2.733.183.9754.4254.253.84
Profiled SteelAbaqus2.322.673.4013.3893.73.33
THERM2.412.793.5213.5093.823.45
NZS 42142.352.753.4813.4693.783.41
ASHRAE Mod. Zone2.332.743.4713.4593.773.4
ACPAbaqus2.683.1093.8153.8634.1923.769
THERM2.763.23.9063.9544.2833.86
NZS 42142.713.163.8663.9144.2433.82
ASHRAE Mod. Zone2.673.143.8463.8944.2233.8
Fire-Rated GlassAbaqus2.6133.7823.8734.09233.66
THERM2.713.143.9224.0134.23233.8
NZS 42142.653.093.8723.9634.18233.75
ASHRAE Mod. Zone2.613.083.8623.9534.17233.74
Brick VeneerAbaqus2.572.953.323.724.1143.61
THERM2.73.133.453.94.2943.79
NZS 42142.673.113.423.884.2743.77
ASHRAE Mod. Zone2.643.13.393.874.2643.76
Table 13. Climate zone applicability of external LSF wall systems with web-perforated studs under diverse thermal enhancement configurations.
External Wall TypeR (Non-Perforated)ZonesR (Perforated)ZonesThermal Break-ExtZonesThermal Break-BothZonesHybrid InsulationZonesDouble PlasterboardsZones
AAC2.71–2.83Z1–73.12–3.27Z1–73.9–4.1Z1–84.4–4.5Z1–84.19–4.34Z1–83.78–3.93Z1–8
ACP2.67–2.76Not suitable for any zone3.10–3.2Z1–73.8–3.9Z1–83.9–3.95Z1–84.19–4.3Z1–83.769–3.86Z1–8
Brick Veneer2.57–2.7Not suitable for any zone2.95–3.13Z1–73.3–3.5Z1–73.72–3.9Z1–84.1–4.3Z1–83.61–3.79Z1–8
Fire-Rated Glass2.61–2.71Not suitable for any zone3.00–3.14Z1–73.8–3.9Z1–83.9–4.0Z1–84.1–4.2Z1–83.66–3.8Z1–8
Profiled Steel2.32–2.41Not suitable for any zone2.67–2.79Not suitable for any zone3.4–3.5Z1–83.39–3.5Z1–83.7–3.82Z1–83.33–3.45Z1–8
Disclaimer/Publisher’s Note: The statements, opinions and data contained in all publications are solely those of the individual author(s) and contributor(s) and not of MDPI and/or the editor(s). MDPI and/or the editor(s) disclaim responsibility for any injury to people or property resulting from any ideas, methods, instructions or products referred to in the content.