Article

The Effect of Hydrothermal Carbonization Temperature on Microplastic Content in Digested Sewage Sludge and Its Relation to the Fuel Properties of Hydrochars

1
Department of Heat Engineering & Environment Protection, Faculty of Metals Engineering and Industrial Computer Science, AGH University of Krakow, Mickiewicza 30 Ave., 30-059 Krakow, Poland
2
Department of Medical Physics and Biophysics, Faculty of Physics and Applied Computer Science, AGH University of Krakow, Mickiewicza 30 Ave., 30-059 Krakow, Poland
3
Institute of Geological Sciences, Jagiellonian University, Gronostajowa 3a Ave., 30-387 Kraków, Poland
4
Department of Fuel Technology, Faculty of Energy and Fuels, AGH University of Krakow, Mickiewicza 30 Ave., 30-059 Krakow, Poland
*
Author to whom correspondence should be addressed.
Energies 2025, 18(19), 5105; https://doi.org/10.3390/en18195105
Submission received: 28 August 2025 / Revised: 13 September 2025 / Accepted: 19 September 2025 / Published: 25 September 2025
(This article belongs to the Special Issue Biomass, Biofuels and Waste: 3rd Edition)

Abstract

Microplastics (MPs) represent a persistent class of emerging contaminants, of which significant amounts can be found in sewage sludge. In this study, the effect of hydrothermal carbonization (HTC) temperature on MPs and the properties of digested sewage sludge (DSS) was evaluated. The HTC process was carried out at temperatures of 200, 210, and 220 °C for 2 h in a batch reactor, and the solid products were subjected to (i) mass balance and fuel properties and (ii) microplastic occurrence analysis using Confocal Raman Microspectroscopy and Scanning Electron Microscopy. In digested sludge, 2700 ± 475 MP particles/100 g d.m. were detected, mostly fragments with ~350 ± 100 fibers. Hydrocharcontained only black and brown fragments in the following amounts: 4175 ± 575 (200 °C), 4450 ± 700 (210 °C), and 1450 ± 590 (220 °C), respectively, after 2 h. The microplastic removal rate was 54% for the highest temperature. Polystyrene (PS) was identified in untreated sludge, while only PE was detected after HTC at 200–210 °C, and no MPs were identifiable at 220 °C. The surfaces of post-MPs exhibited progressive degradation with increasing HTC temperature. The results confirm that HTC lowers the content and alters the physicochemical properties of microplastics, reducing their thermal stability and degrading their structure, while simultaneously improving the fuel properties of hydrochars by increasing the calorific value and carbon content.

1. Introduction

The pervasive presence of microplastics (MPs), defined as polymer particles typically smaller than 5 mm, has emerged as one of the most pressing and multifaceted environmental challenges of the 21st century [1]. These ubiquitous contaminants originate from many sources, including fragmentation of larger plastic debris and release from personal care products, eventually accumulating across diverse ecosystems [2,3]. Their persistent nature, high mobility, and reported ability to adsorb other micropollutants make them vectors, posing a significant concern for both ecological and public health [4,5]. Wastewater treatment plants (WWTPs) are increasingly recognized as critical hubs for the transfer of MPs into terrestrial and aquatic environments [6]. However, their efficacy in eliminating MPs remains limited, and up to 90% of MP particles accumulate in sewage sludge (SS) [7]. The management of SS, with its substantial MP content, poses a direct environmental challenge, especially given that SS is often valorized through land application as agricultural biosolids or used as a feedstock for energy production via incineration. The high organic matter content ensures SS is suitable for various energy conversion technologies, aligning with circular economy principles [8]. However, the presence of diverse contaminants, including MPs, necessitates effective pretreatment strategies to enhance their fuel properties, improve handling, and, crucially, mitigate associated environmental risks [9,10,11]. Among various thermal and physicochemical treatment methods, hydrothermal carbonization (HTC) has gained significant attention [12,13]. Operating at moderate temperatures (typically 180–250 °C), under autogenous saturated pressure conditions, HTC uses subcritical water as a reaction medium. It effectively dewaters, disinfects, and transforms SS into a carbon-rich solid product known as hydrochar (HC), as well as producing process liquid that exhibits high biogas potential within a three times shorter residence time [14,15,16]. Compared to the feedstock, HC displays greater than raw sludge lignite-like characteristics, including higher heating value (HHV), enhanced hydrophobicity, and reduced leachability of specific contaminants, making it a viable solid fuel or soil amendment [17]. Recent research has highlighted the potential of HTC to degrade MPs present in SS [18]. Whereas several studies have demonstrated that HTC conditions can lead to fragmentation, chemical alteration, or partial mineralization of various polymer structures, the extent and specific mechanisms of these transformations are highly dependent on the type of plastic, reaction severity (temperature, residence time), and the properties of SS matrix itself [19,20,21]. These emerging findings position HTC as a dual-benefit technology, offering a pathway for renewable energy recovery from wastewater residuals and a proactive strategy for mitigating environmental risks associated with microplastic pollution. MP content in SS is strongly dependent on the location of WWTPs and the treatments applied. Its content can be significant and, thus, have an impact on the fuel properties of the resulting hydrochar [22].
In this study, the impact of hydrothermal carbonization (HTC) on the content and general characteristics of microplastics (MPs) in digested sewage sludge (DSS) was evaluated. The primary objective of the study was to examine the fuel properties of DSS and itstotal microplastic content before and after HTC, rather than investigating specific polymer degradation mechanisms. Accordingly, the study focused on microplastics naturally present in the real sludge matrix and their correlation with the properties of the resulting hydrochars. For completeness, the fuel-related characteristics of the corresponding hydrochars were also determined.

2. Materials and Methods

2.1. Materials

2.1.1. Reagents

Anhydrous calcium chloride (CaCl2, p.a.) and hydrogen peroxide (H2O2, 30 wt% p.a.) were purchased from Chempur (Piekary Śląskie, Poland), glass microscope slides, MirrIR, from Kevley Technologies (Chesterland, OH, USA), Anodisc alumina oxide filters (ANODISC 0.2 μm, Whatman, Maidstone, UK), and GF-5 glass fiber filters (1 μm) from Sigma-Aldrich (Saint Louis, MO, USA).

2.1.2. Digested Sewage Sludge Collection

Samples of digested sewage sludge (DSS) were collected during the winter season of 2024 from the WWTP located in the southern part of Poland. This facility is designed for 680,000 population equivalent (PE) and operates with an average dry-weather flow of 165,000 m3/d. Wastewater reaches the plant through three main collectors, where it undergoes mechanical, biological, and chemical treatments, including a complete activated sludge process. Wastewater is first subjected to mechanical treatment (screening, grit removal, and primary settling), followed by biological treatment in activated sludge reactors and clarification in secondary settling tanks, with excess sludge directed to the sludge line. Primary and excess sludge are then anaerobically digested in fermentation chambers, producing biogas for combined heat and power generation. The DSS is further dewatered and thickened to reduce its volume and for disinfectionIn this study, all DSS samples were collected after the fermentation process and prior to thickening. After sampling, they were immediately transported to the laboratory in sealed containers, where they were stored at 4 °C for subsequent sample preparation.

2.2. Methods

2.2.1. Hydrothermal Carbonization

HTC has been shown to be effective in removing MPs [20]. The selected temperature range (200–220 °C) was chosen based on reports in the literature investigating HTC at 170, 180, 200, 220, and 260 °C. Although the highest degradation efficiencies of selected polymers (>50%) were generally achieved at temperatures above 220 °C, significant degradation has also been observed at 200 °C; for example, in a study of PE degraded by 71% after 3 h at 220 °C [21]. Similarly, Akaniro R. I. et al. (2024) reported that PS, PET, and PP exhibited more than 90% overall degradation of PS, PP, and PET after doubling the time to 6 h at 200 °C, indicating that these particular polymers start to degrade at around this threshold under hydrothermal conditions, with the extent of decomposition strongly influenced by reaction time [23]. When shifting these results to sustainable sewage sludge processing, the experimental conditions of 200, 210, and 220 °C with 2 h residence time were selected as representatives for hydrothermal treatment. Under these conditions, significant degradation of MPs can also occur, allowing both sludge pretreatment and MP removal to be achieved within a single process.
The HTC experiments were performed in a 1 L stainless steel stirred reactor (Zipperclave, Parker Autoclave Engineers, Erie, PA, USA) equipped with a MagneDrive magnetic agitator. Prior to the experiments, DSS was diluted with distilled water to achieve a target moisture content of approx. 90 wt%, ensuring proper mixing and reactor operation [22]. For each run, 750 mL of the prepared slurry was loaded into the reactor, leaving free volume for liquid volume expansion during the experiment. The reactor was tightly sealed and heated to 200 °C, 210 °C, or 220 °C, and maintained for 2 h. After 2 h, it was rapidly cooled with an ice water bath to room temperature, then removed from the receptacle. The general experimental methodology is depicted in Figure 1. Experiments were divided into two series: 1-HTC runs to fuel properties and 2-HTC runs to MP extraction, with different sample preparation methods. 1-HTC slurries were separated into solid hydrochar (1-HC) and the liquid phase by vacuum filtration using quantitative cellulose filters, solid were then dried in an oven at 105 °C for 24 h, ground in a grinder to homogenize the samples, and stored at room temperature. Liquid phases properties were not investigated in this study. The solid and liquid yields were determined experimentally, while the gas yield was calculated by difference.
2-HTC slurries were frozen and freeze-dried at −60 °C in a Freeze Dryer Alpha 1-2 LD Plus (Martin Christ, Osterode am Harz, Germany) for 5 days to remove water while preserving all chemical compounds within the hydrochar matrix (2-HC). Resulting samples were then ground manually with a mortar and pestle, then stored at −20 °C for subsequent MPs extraction. Same preparation procedures were applied to untreated DSS within each series, which was labelled as follows: DSS-d, dried, and DSS-fd, freeze-dried sludge.

2.2.2. Fuel Properties of DSS and 1-HCs

Elemental composition, including carbon (C), hydrogen (H), nitrogen (N), and sulphur (S), was determined using a LECO CHNS628 elemental analyzer, following PKN-ISO/TS 12902:2007 [24]. Oxygen (O), Fixed carbon (FC) content, and high heating value (HHV) were calculated by differences according to an established method [25]. Moisture (M), ash (A), and volatile matter (VM) contents were determined using a 5E-MAC6710 Proximate Analyzer—TGA (Changsha Kaiyuan Instruments Co., Ltd., Changsha, China) according to Equations (1)–(3), in accordance with ASTM D7582 and ISO 17246:2010 standards [26,27].
O = 100 C + H + N + S + A ,   %
F C = 100 M + V M + A ,   %
H H V = 0.3491 C + 1.1783 H + 0.1005 S 0.1034 O 0.015 N 0.0211 A ,     MJ / kg
where M is moisture content (% d.m.), VM is volatile matter (wt% d.m.), and A is the ash content (wt% d.m.), and C, H, N, S, and O represent elemental contents (wt%, d.m.).

2.2.3. MP Extraction

DSS-fd and hydrochars: 2-HC-200/2, 2-HC-210/2, and 2-HC-220/2 were subjected to MP extraction. The sequential procedure with density separation in saturated salt solution, followed by chemical digestion with hydrogen peroxide, is a well-known and broadly tested method for recovering MPs from organic matter. However, it remains time-consuming and requires extensive manual handling [28,29,30]. As many different filters can be used for wastewater filtration, GF-5 and ANODISC filters were chosen to evaluate accessibility for MPs extraction from the digested matrix, before and after the digestion of organic matter, respectively. Density separation was performed using 150 mL of a saturated CaCl2 solution (d = 1.39 g/cm3) poured into glass beakers. Samples were shaken on a vibrational shaker at 150 rpm for 2 h and then left to settle for 24 h. Approximately 50 mL of the supernatant was decanted into a glass beaker, rinsed with 1 L of distilled water, and filtered through a GF-5 filter; this step was repeated three times. Subsequently, chemical digestion of the floating residue was performed with 15% H2O2 under the same shaking and settling conditions. Again, approximately 50 mL of the supernatant was decanted, rinsed, and filtered. This process was repeated three times. The remaining material was filtered through ANODISC metal filters to recover particles, which were then transferred to glass Petri dishes and air-dried.

2.2.4. MP Identification

Due to the high number of MPs in each sample, five representative particles were selected from each for Raman spectroscopic identification. The five most prominent representative MPs from each experiment were selected under a 10× magnification lens for further Raman spectroscopic analysis.
Confocal Raman Microspectroscopy (CRM)
Confocal Raman Microspectroscopy analysis was performed to identify MPs and distinguish polymer particles from the organic matter surroundings. Kevley MirrIR autofluorescence-eliminating microscope slides were employed for the analysis, which allowed for more detailed images and reduced background interference. No solvent was added, and samples were analyzed in air-dry form. Raman spectra and corresponding images were obtained using a WITec Alpha 300 R Raman imaging system (WITec GmbH, Ulm, Germany) equipped with a 532 nm excitation laser, a UHRS 300 spectrometer (600 gratings/mm), and a 100× air objective lens EC Epiplan-Neofluar, NA 0.9 (Carl Zeiss Microscopy GmbH, Oberkochen, Germany).A thermoelectrically cooled CCD camera was used for detection. Spectra were collected over the 400–3800 cm−1 range at a laser power of <10 mW, with an integration time of 0.5 s and 30 accumulations per measurement.
Scanning Electron Microscopy with Energy-Dispersive X-Ray Spectroscopy (SEM-EDS)
SEM-EDS analysis was performed at the Scanning Electron Microscopy and Microanalysis Laboratory, Institute of Geological Sciences, Jagiellonian University, using a high-resolution field emission scanning electron microscope (FE-SEM, Hitachi SU8600, Hitachi High-Technologies Corporation, Tokyo, Japan).Image acquisition employed a mixed signal of secondary electrons (SE) and backscattered electrons (BSE). Elemental composition in selected micro-areas was determined using a Bruker XFlash 7 EDS detector. Both SEM imaging and EDS analyses were conducted at an accelerating voltage of 15 kV, a beam current of 10 µA, and a working distance of approximately 15 mm.

2.2.5. Quality Assurance and Quality Control

Reactor parameters, including temperature, pressure, mixing speed, and residence time, were continuously monitored and logged. Elemental analysies weres performed in duplicate for each sample, while thermogravimetric analyses (TGAs) were conducted in triplicate to ensure reproducibility and data reliability. During the MP extraction procedure, all glassware and filters were pre-rinsed with distilled water, and laboratory work was conducted under clean laboratory conditions with cotton laboratory coats and nitrile gloves to minimize airborne or operator-derived contamination. Blank samples were prepared for DSS and 2-HCs extraction, respectively, to assess potential contamination introduced during the extraction procedure. Laboratory blanks were prepared by running the complete extraction protocol with only distilled water to monitor contamination introduced by materials during sample processing. Equipment blanks were obtained by rinsing cleaned glassware and tools with ultrapure water, followed by filtration of the rinse water. This step ensured that no residual MPs or carryover from previous samples interfered with the results. Each extraction was carried out in duplicate to confirm the reproducibility of the protocol, with relative percentage differences maintained within acceptable limits. The chemical digestion step, 15% H2O2 applied without heating, was previously tested under controlled shaking and settling conditions to prevent damage or alteration of the polymer particles [31]. During Raman spectroscopy analysis, spectra were collected three times for each particle to ensure reproducibility, with the averaged spectrum used for further analysis. For EDS analysis, measurements were performed twice for particles when the sample was heterogeneous.

3. Results and Discussion

3.1. HTC Product Distribution

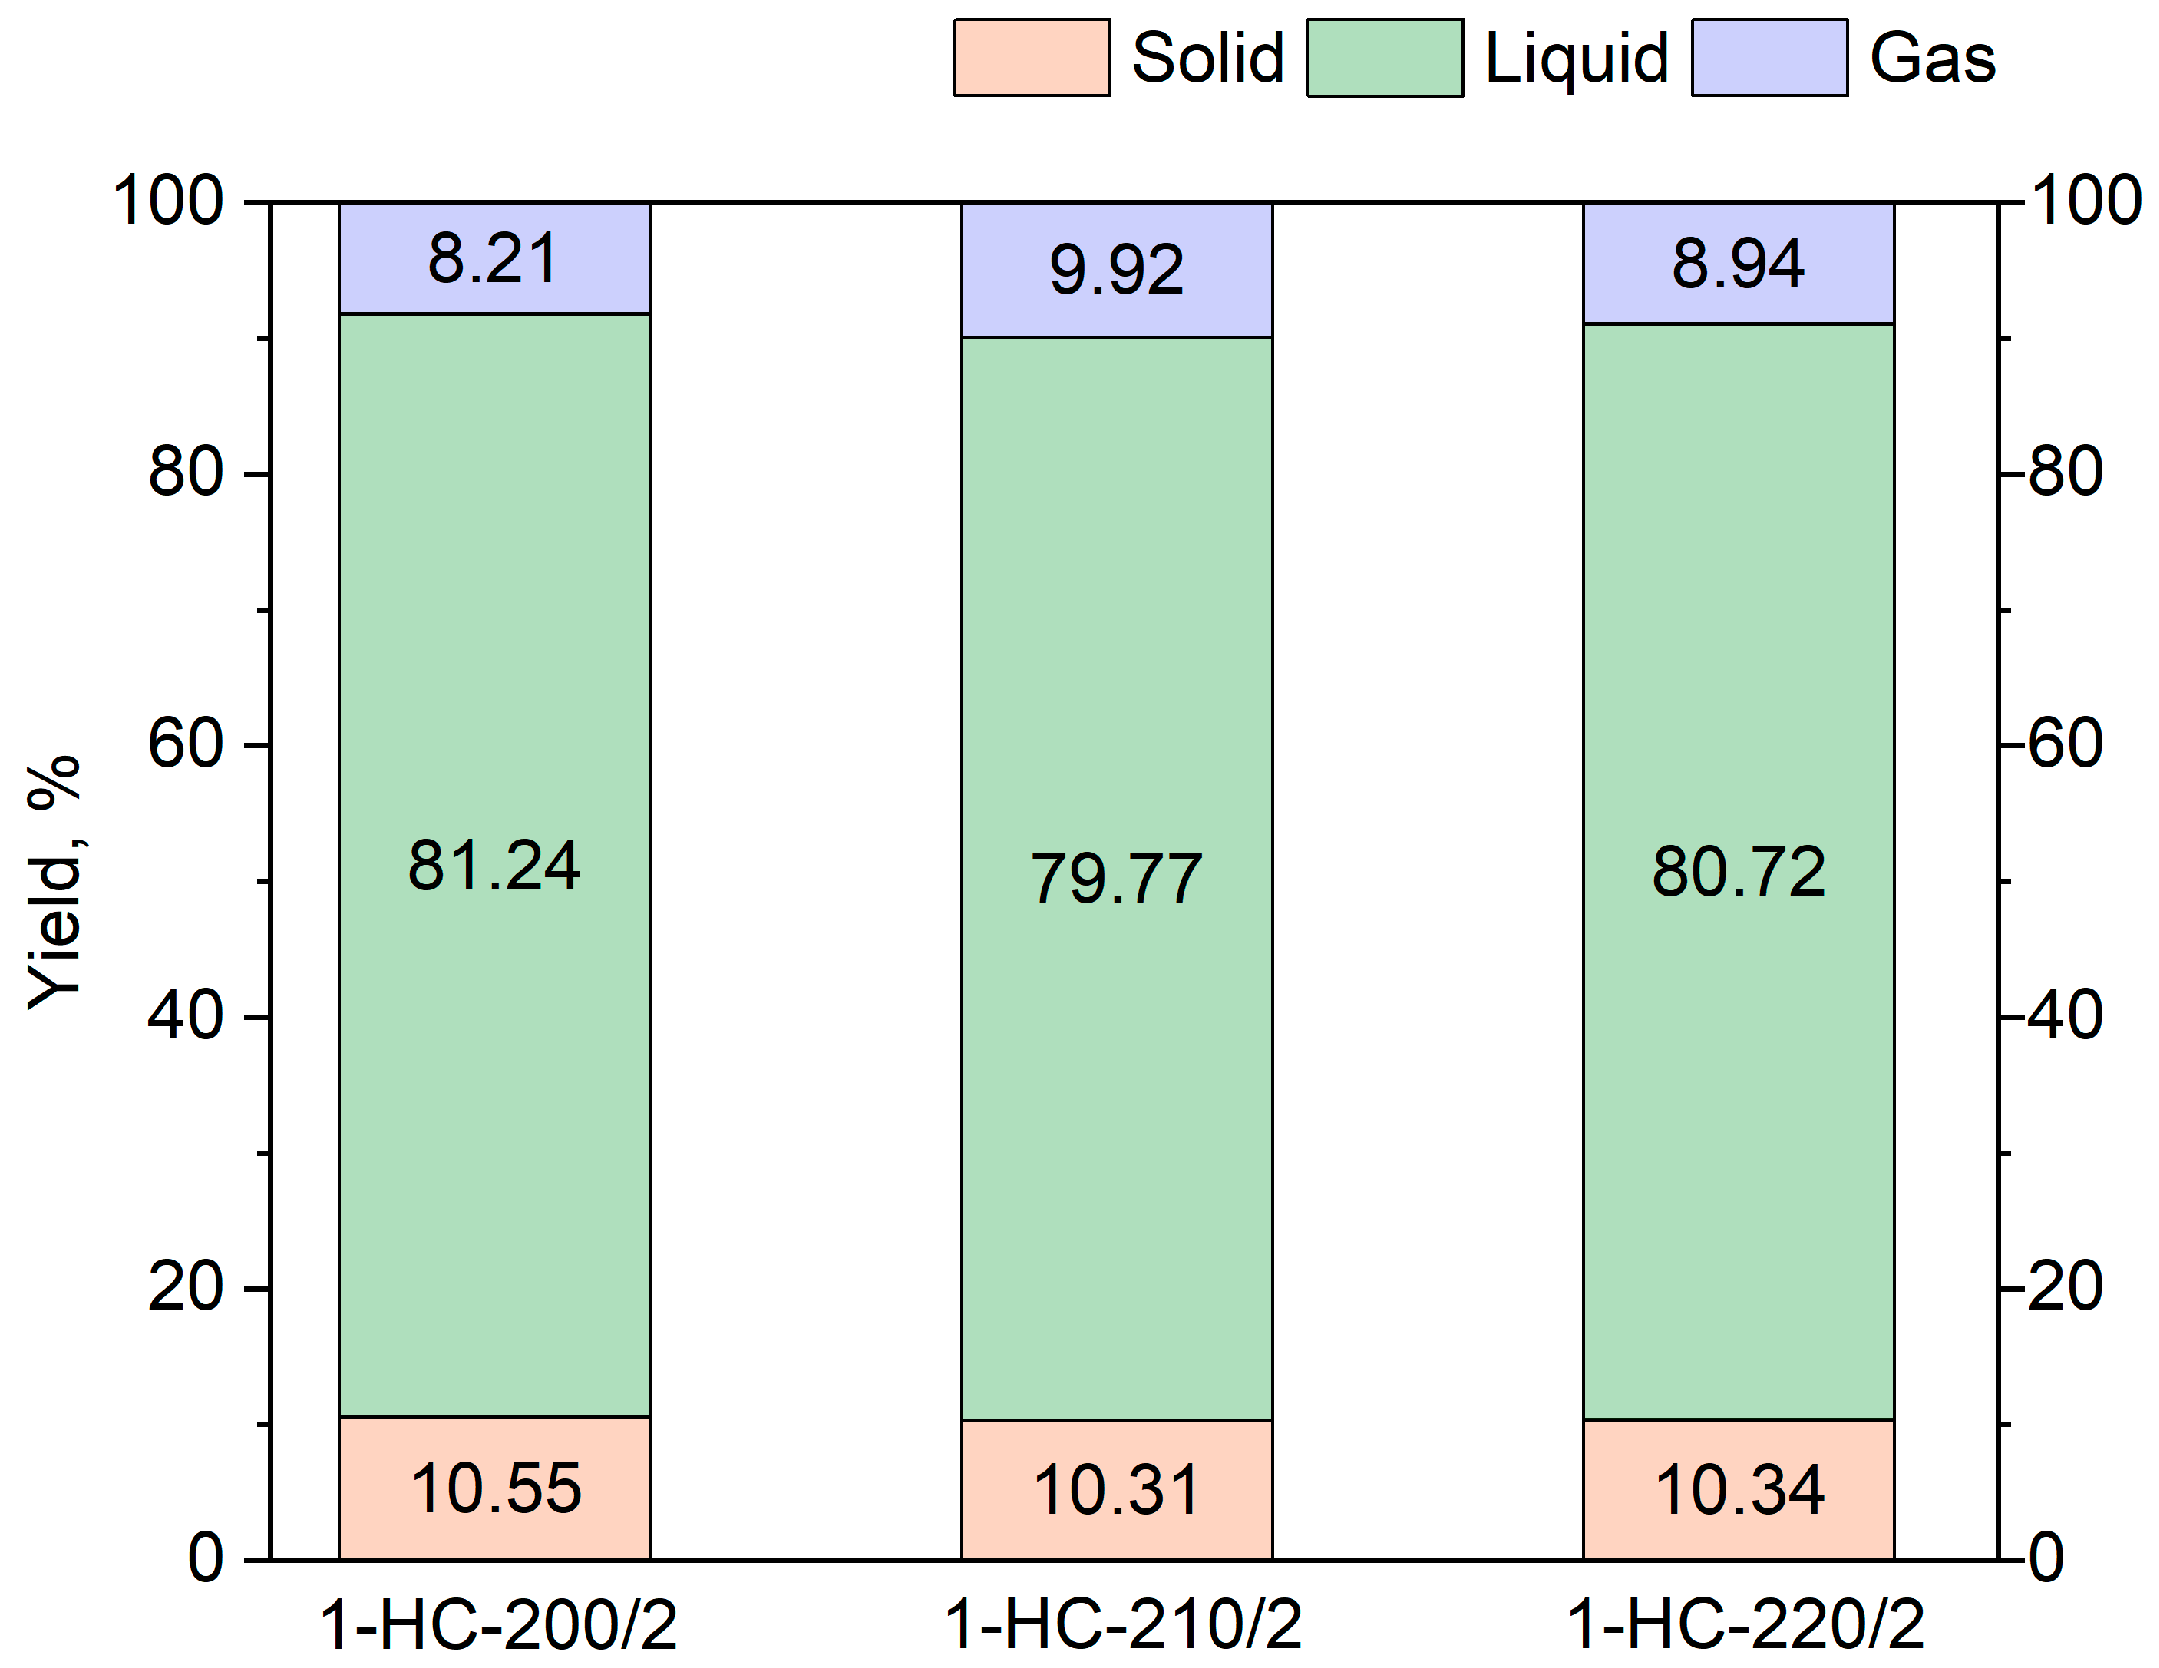
The distributions of HTC products after 200, 210, and 220 °C for 2 h are presented in Figure 2. In all experimental runs, the liquid fraction was dominant, accounting for almost 80%. The solid hydrochar contributed only slightly above 10%; similarly, the relatively low hydrochar yield indicates that most of the organic matter in DSS is easily solubilized and redistributed into the aqueous phase. Gas formation remained low and relatively constant across all runs; however, the values obtained were higher than those typically reported in the literature for sewage sludge processed under comparable HTC conditions [15]. The overall product distribution revealed only minor variations with an increasing temperature threshold. This suggests that within the selected narrow range (200–220 °C), the temperature exerts a limited influence on phase separation. Therefore, the results confirm that within the studied range, an increase in temperature by 10 and 20 °C at a 2 h residence time primarily promotes the solubilization of organic matter into the process water, without leading to a more significant formation of solids.
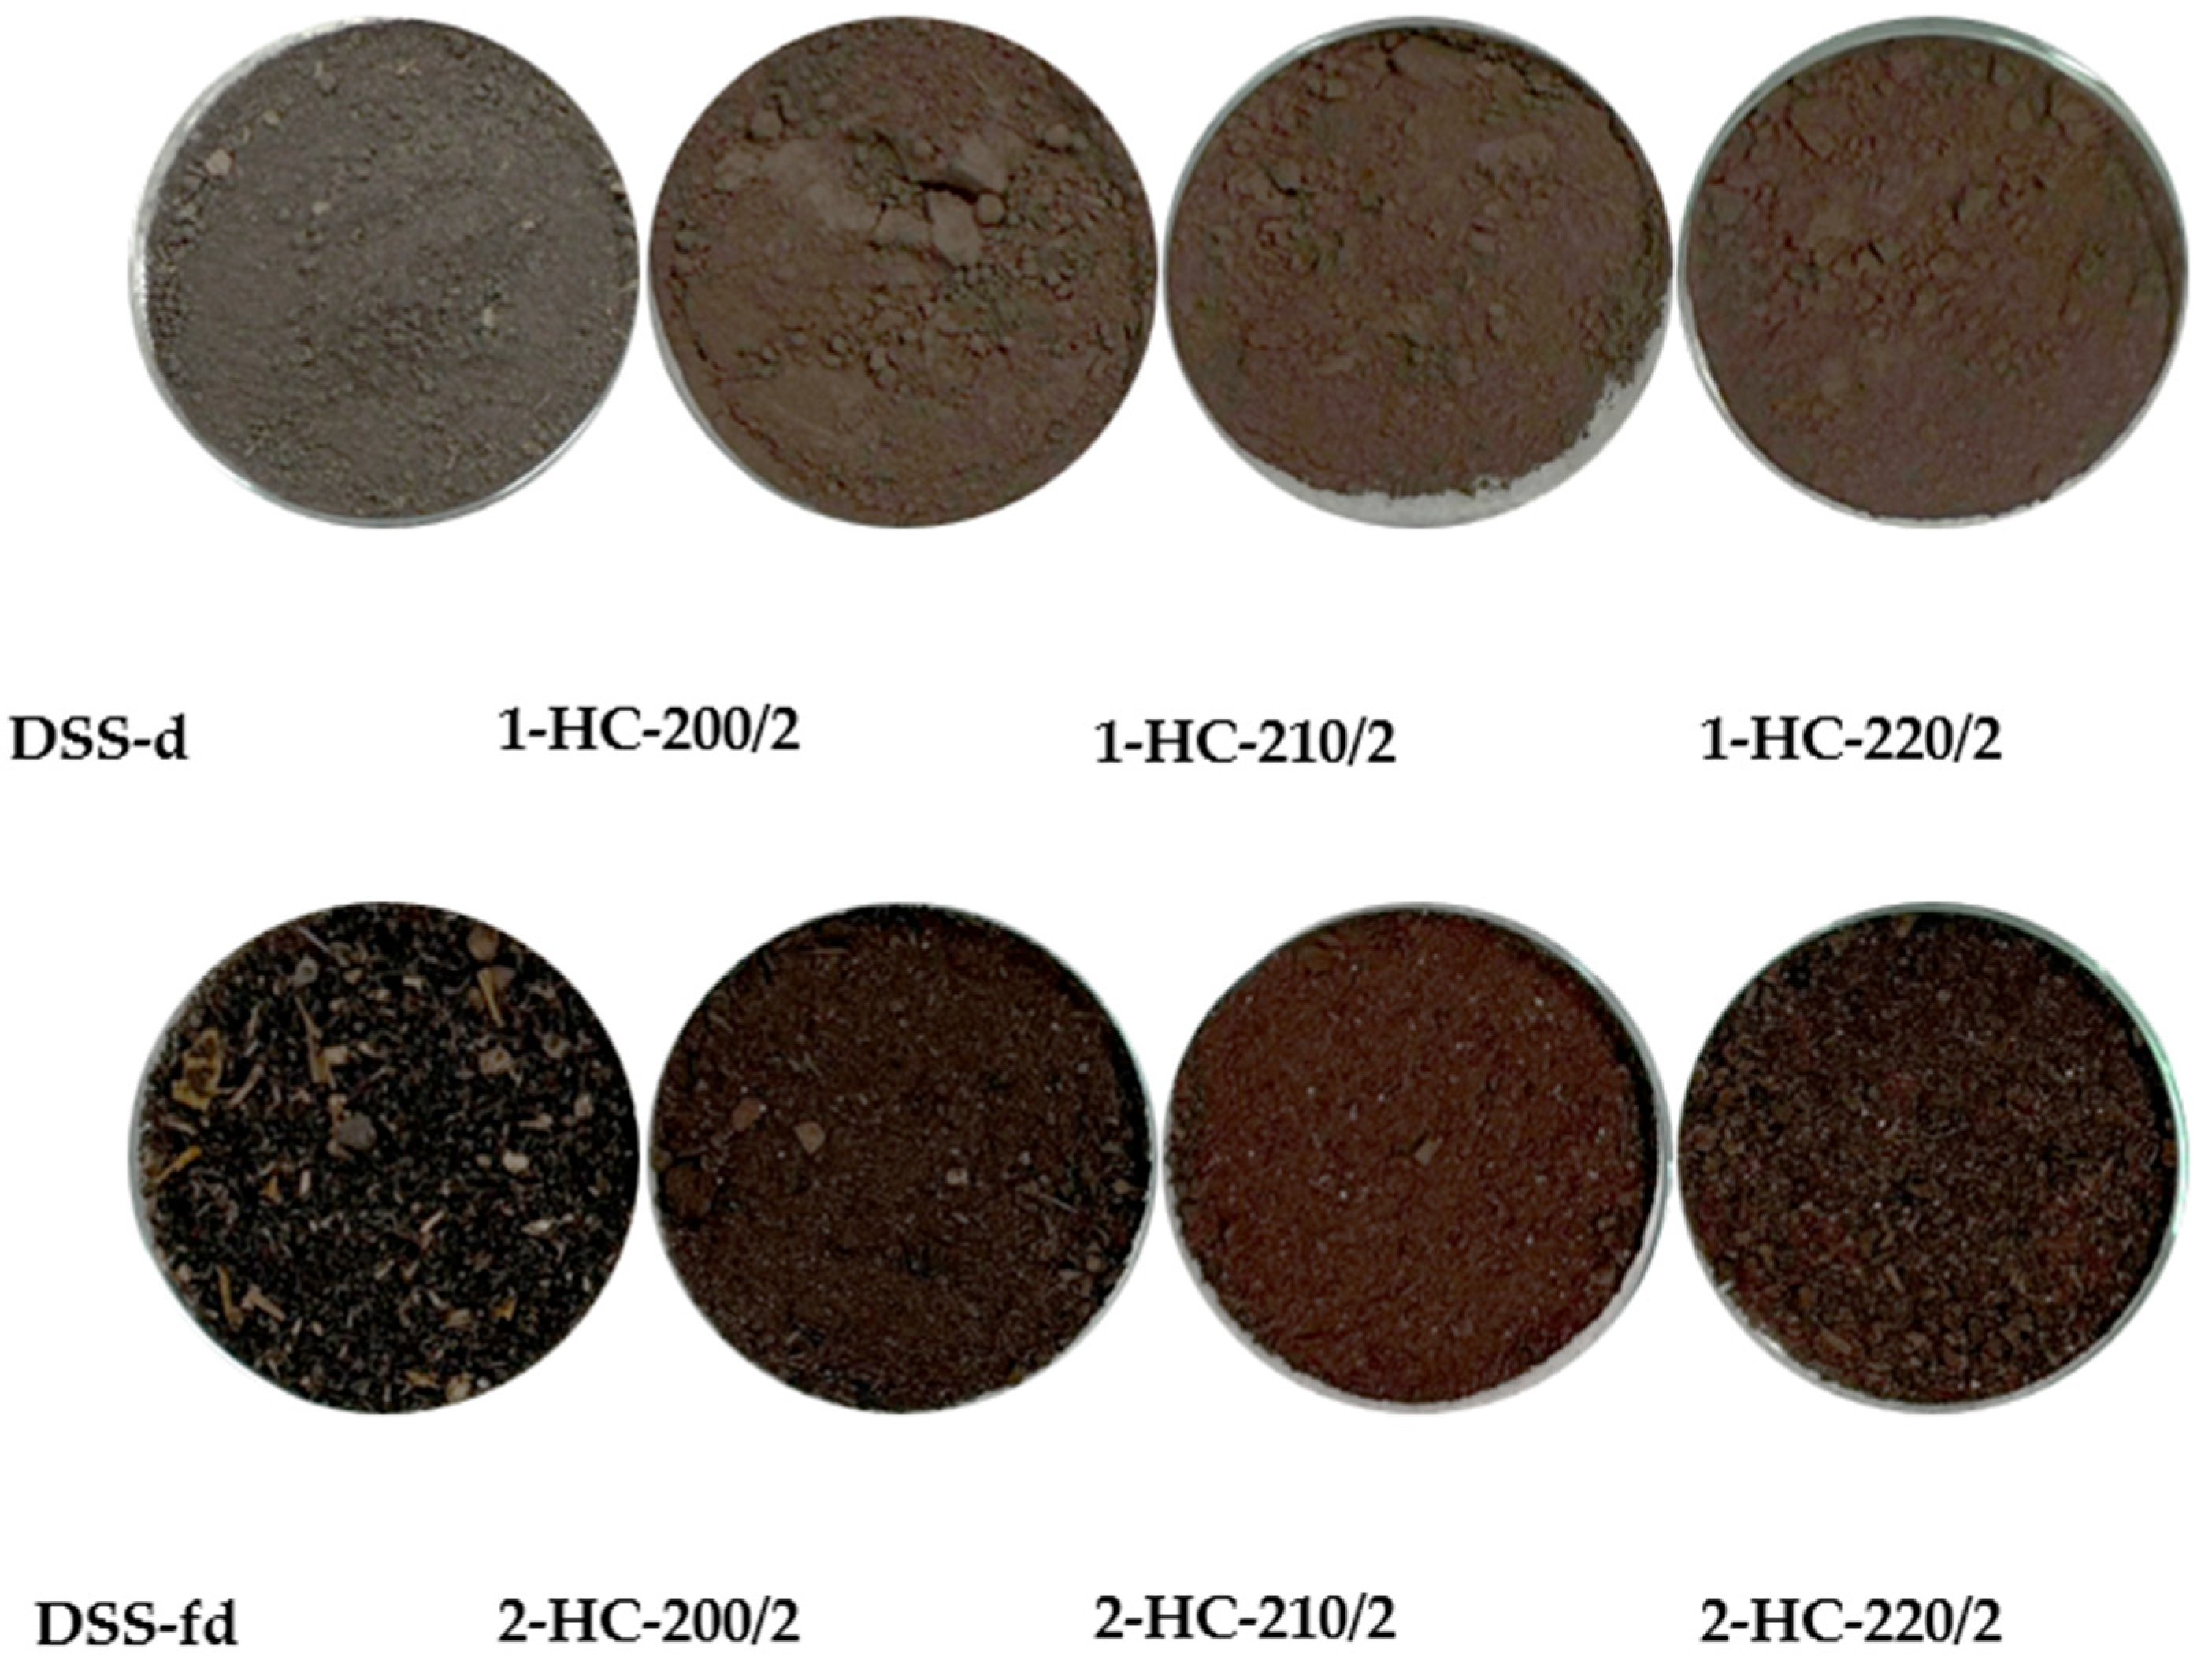
The visual observation of digested sewage sludge and corresponding hydrochars is shown in Figure 3. Compared to DSS, HCs have a fine-grained, more powdery structure and a darker color, which deepened with increasing HTC temperature.

3.2. Fuel Properties of Sludge and Hydrochars

The ultimate and proximate analyses of DSS-d and 1-HC samples, along with their calculated higher heating value (HHV), are shown in Table 1. Compared to DSS-d, all hydrochars exhibited an increase in carbon (C) content, accompanied by reductions in hydrogen (H), nitrogen (N), sulphur (S), and oxygen (O). This compositional shift resulted in an increase of HHVs for the hydrochars, with the maximum observed for the sample produced at 210 °C (13.61 MJ/kg). An apparent increase in fixed carbon (FC) content (42.4% and 41.4%) was observed for 1-HC-200/2 and 2-HC-220/2, respectively, indicating progressive carbon enrichment of the solid phase with increasing temperature, consistent with previous findings reported by Kim D. et al. (2014) [32]. However, sample 1-HC-220/2 exhibited a 7.8% increase. In terms of ash content (A), DSS-d exhibited the lowest value. At the same time, the highest value was recorded for the sample obtained at 220 °C, which can be attributed to the substantial devolatilization that occurs at elevated temperatures, explaining the increase in FC content. As expected, the volatile matter (VM) content decreased with increasing HTC intensity between 200 °C and 210 °C, confirming the contribution of dehydration and decarboxylation reactions [33]. However, at 220 °C, a slight increase in VM and O was observed again, compared to 210 °C. This may be related to the occurrence of secondary reactions or the possible degradation of MPs, including PS present in DSS-d. For example, Xie et al. (2022) and Wang L. et al. (2016) stated that the decomposition of Polyvinyl chloride (PVC) during the co-HTC of PVC and sewage sludge at 240 °C leads to the generation of increased volatile matter, especially organic Volatile Fatty Acids (VFAs) [34,35]. As discussed in the literature, hydrothermal conditions at higher temperatures (≥300 °C) lead to intense depolymerization of MPs and the release of products such as volatile organic compounds or low-molecular-weight organic acids [36]. Although most synthetic polymers undergo significant degradation at higher temperatures, typically above 300 °C, studies indicate that decomposition processes can begin even below 100 °C under specific conditions. For example, for unplasticized PVC, the onset of thermal degradation has been found to occur in the range of 60–80 °C, associated with the formation of radicals and unsaturated C=C bonds [37]. Similarly, PS can decompose in the range of 30–150 °C, producing styrene oligomers, including monomers, dimers, and trimers [38]. In an aqueous environment, PET becomes more susceptible to enzymatic hydrolysis at temperatures as low as 60–65 °C, when its amorphous regions gain greater chain mobility [39]. In the present study, these reactions may start to occur at 220 °C, generating limited amounts of oxygen compounds, which could be responsible for the observed increase in the O content of hydrochar. This also corresponds to a slight rise in solid yield at 220 °C.
It is worth remembering that DSS subjected to HTC was diluted with distilled water to almost 90 wt% moisture, creating an aqueous medium. These results should enhance attention to the temperature thresholds at which polymer degradation is assumed to occur. Under hydrothermal conditions, the combined effects of elevated pressure, subcritical water as a reactive medium, and the possible catalytic influence of organic matter can significantly accelerate chemical transformations; hence, comparisons with different, non-hydrothermal conditions on polymer degradation can be inaccurate. Consequently, polymer breakdown may initiate at substantially lower temperatures than those typically reported under dry thermal conditions.

3.3. Microplastic Characteristics

3.3.1. MP Occurrence

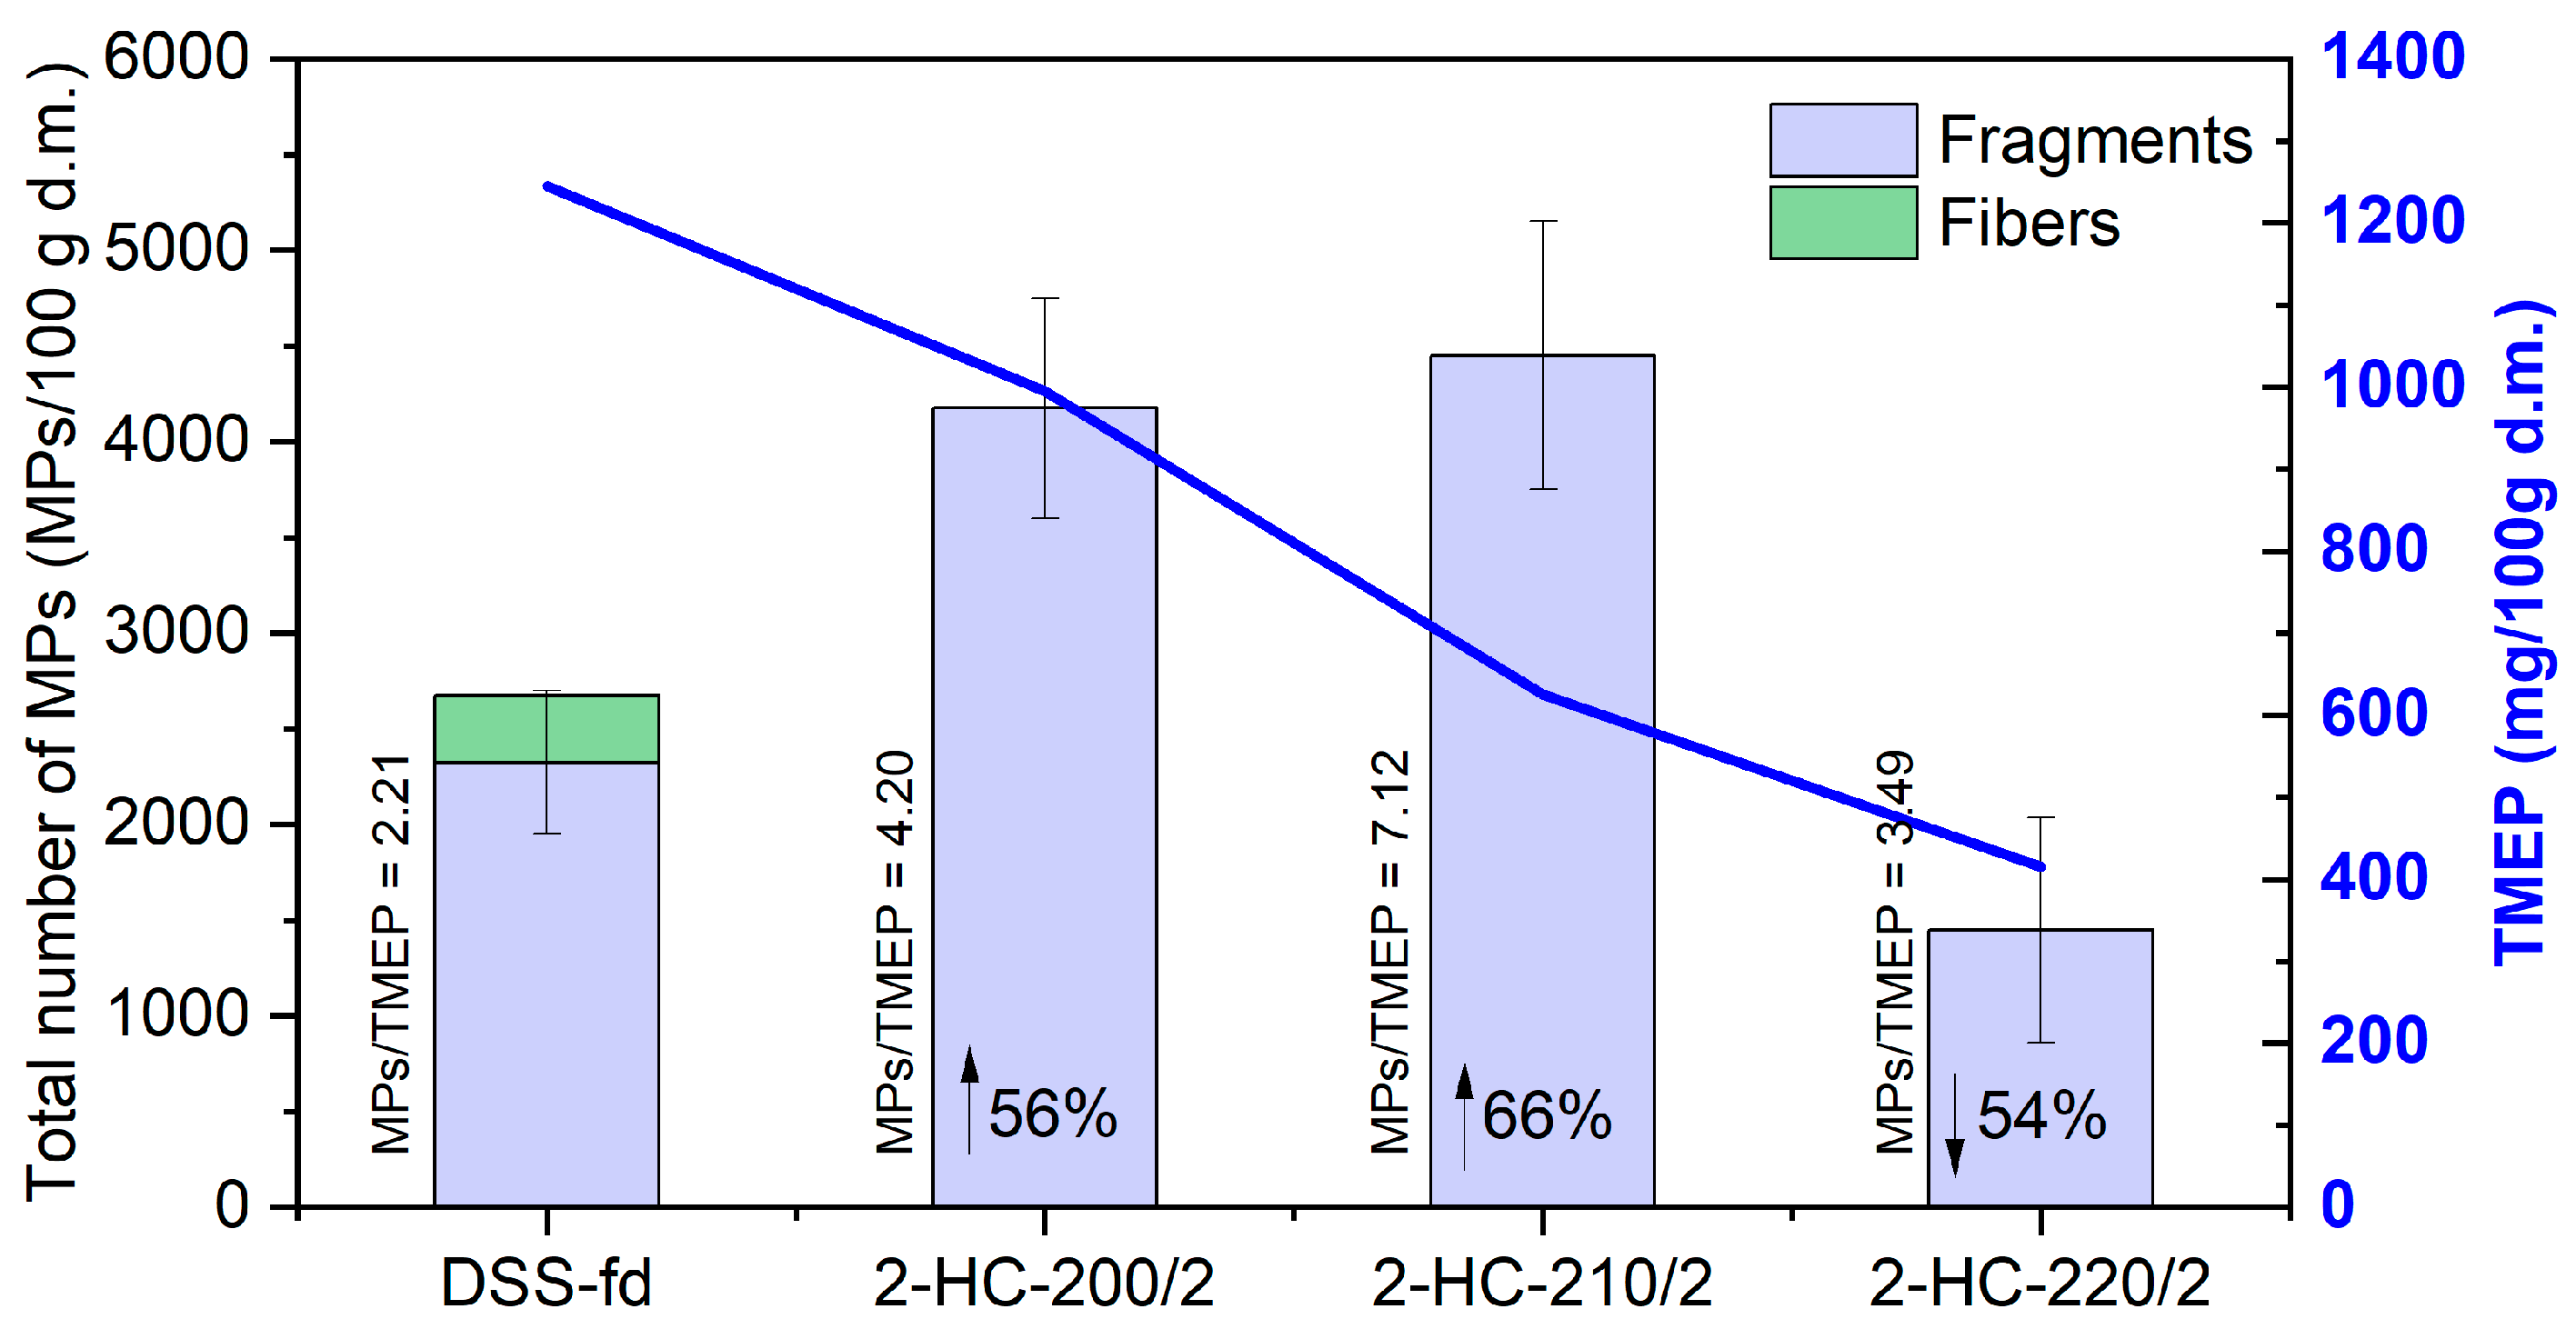
The total mass of extracted particles (TMEP) from DSS-fd, 2-HC-200/2, 2-HC-210/2, and 2-HC-220/2 amounted to 24.9, 19.9, 12.5, and 8.3 mg per 2 g of solid sample, respectively. As the HTC temperature increased, the TMEP decreased; however, this trend did not directly correlated with the number of MPs. This suggests that higher temperatures promoted the release of more numerous, but lighter and degraded, particles. MPs were then counted manually and calculated per 100 g of dry sewage sludge. Figure 4 shows the amounts of separated MPs, with the blue line representingTMEP. In DSS-fd, an average of 2700 ± 75 MPs/100 g d.m. was found, including 350 ± 100 MPs/100 g d.m. classified as fibers, with the remainder identified as fragments. For hydrochars, only brown and black fragments were collected, while no fibers were observed. The number of MP particles in hydrochars was 4175 ± 575, 4450 ± 700, and 1450 ± 590 per 100 g d.m. samples 2-HC-200/2, 2-HC-210/2, and 2-HC-220/2, respectively. Based on these amounts, an 56% increase in the number of MP particles with decrease in TMEP at 200 °C is observed, compared to the initial sediment, which can be attributed to the fragmentation of larger MPs into smaller particles. Furthermore, it shows that these conditions were not sufficient to degrade most polymer particles. A similar effect was observed at 210 °C, suggesting that, in addition to fragmentation, partial degradation processes may have begun. The lowest number of MP particles and TMEP with decreasing trend was found in the sample from 220 °C, indicating that at this temperature, in addition to fragmentation, decomposition, and degradation of polymers occurred, leading to a reduction in the total number of MPs recovered. The MPs/TMEP parameter was used to evaluate the relative contribution of microplastics to the overall extracted particle amount for each hydrochar sample. The MPs/TMEP ratio was increasing with the HTC temperature, up to the lowest for 2-HC-220-2 (3.49), confirming that with increasing HTC temperature, the degradation of MPs becomes more effective, leading to their reduced share in the overall number of particles extracted from the matrix.
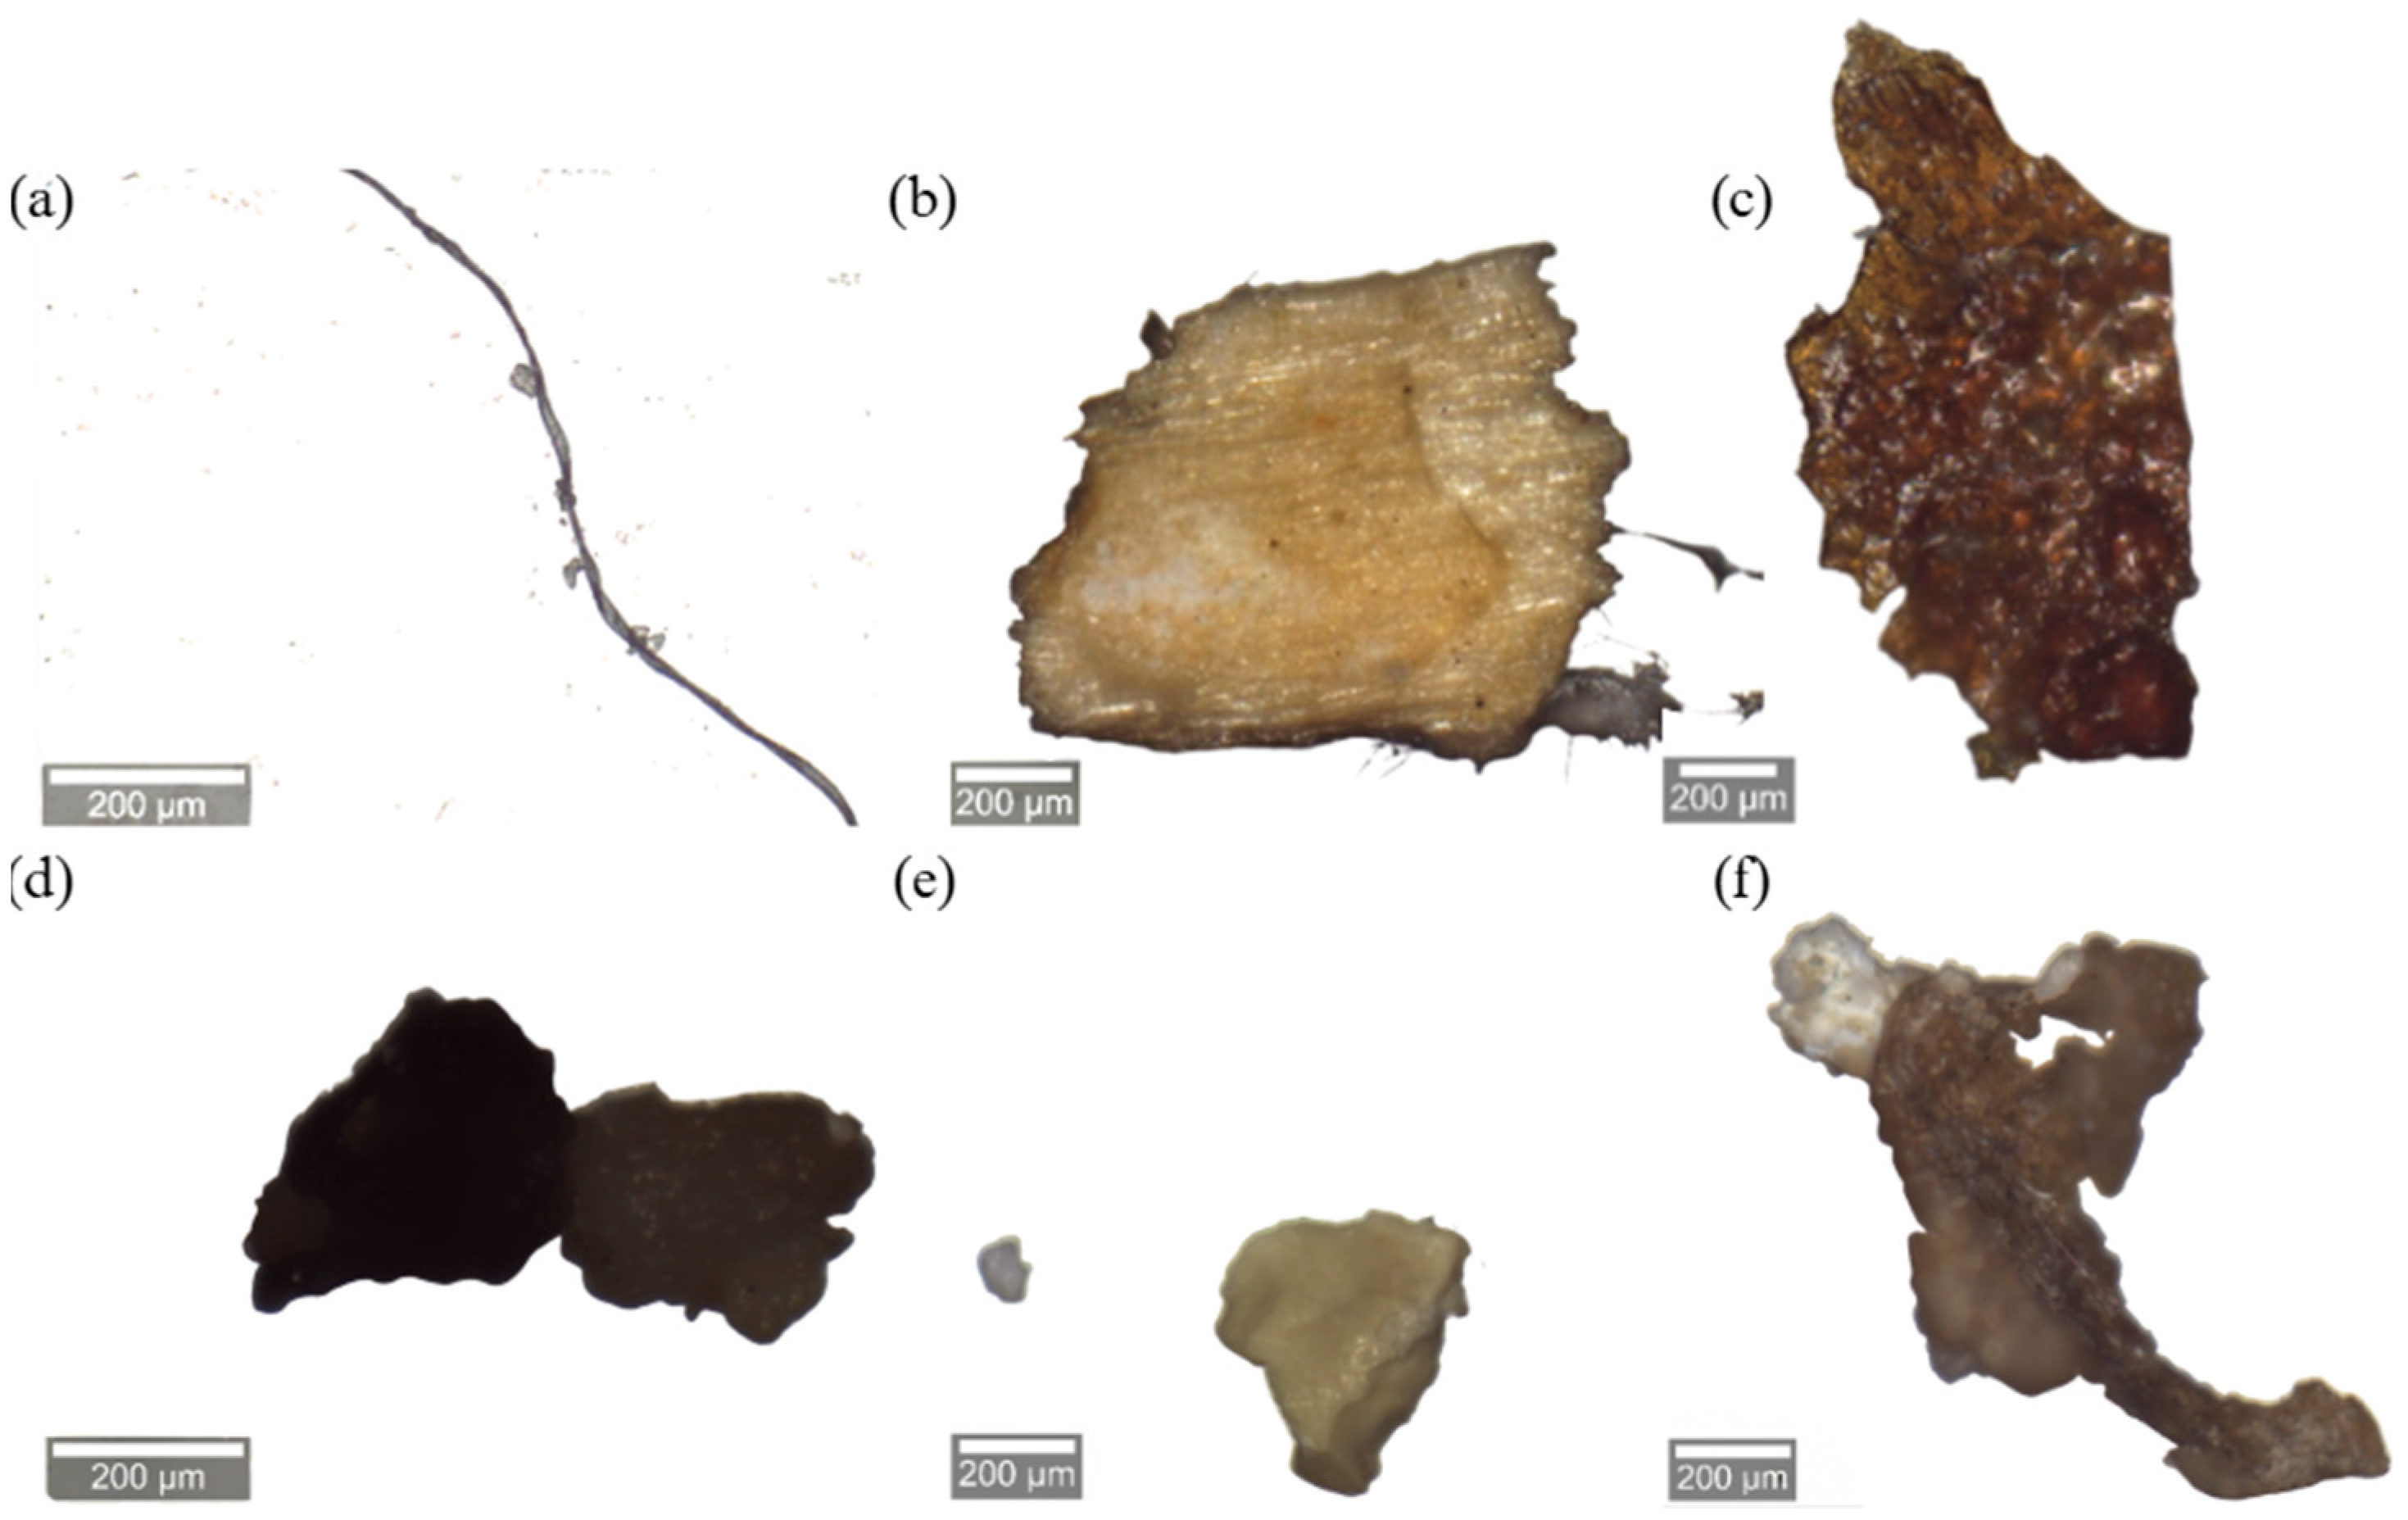
A preliminary visual identification was applied to distinguish potential MPs from other non-plastic particles that may float during the density separation step. An additional difficulty related to the procedure is the manual transfer of fine particles to the microscope slide. These problems are commonly highlighted in the literature, particularly in the case of separating soil- or wastewater-derived MPs, especially in the absence of advanced automated systems capable of mapping the entire sample area [17,30,40]. For this reason, a preliminary selection was made using a confocal microscope at 10× magnification based on visual assessment and the characteristics reported in the literature. This was aimed at selecting the particles most likely to be classified as MPs and categorizing them under the fibers or fragments group [41,42]. The criteria were as follows: size >100 μm (size referring to the longest dimension of the particle), irregular or elongated shape, and visible signs of heterogeneous surface texture, which are commonly used as indicators in environmental microplastic research. Examples of MPs are shown in Figure 5. Choosing representatives from extracted particles collected from hydrochars (post-HTC MPs) was more difficult since all particles were almost black, and were brittle and fragile during handling.

3.3.2. Polymer Identification

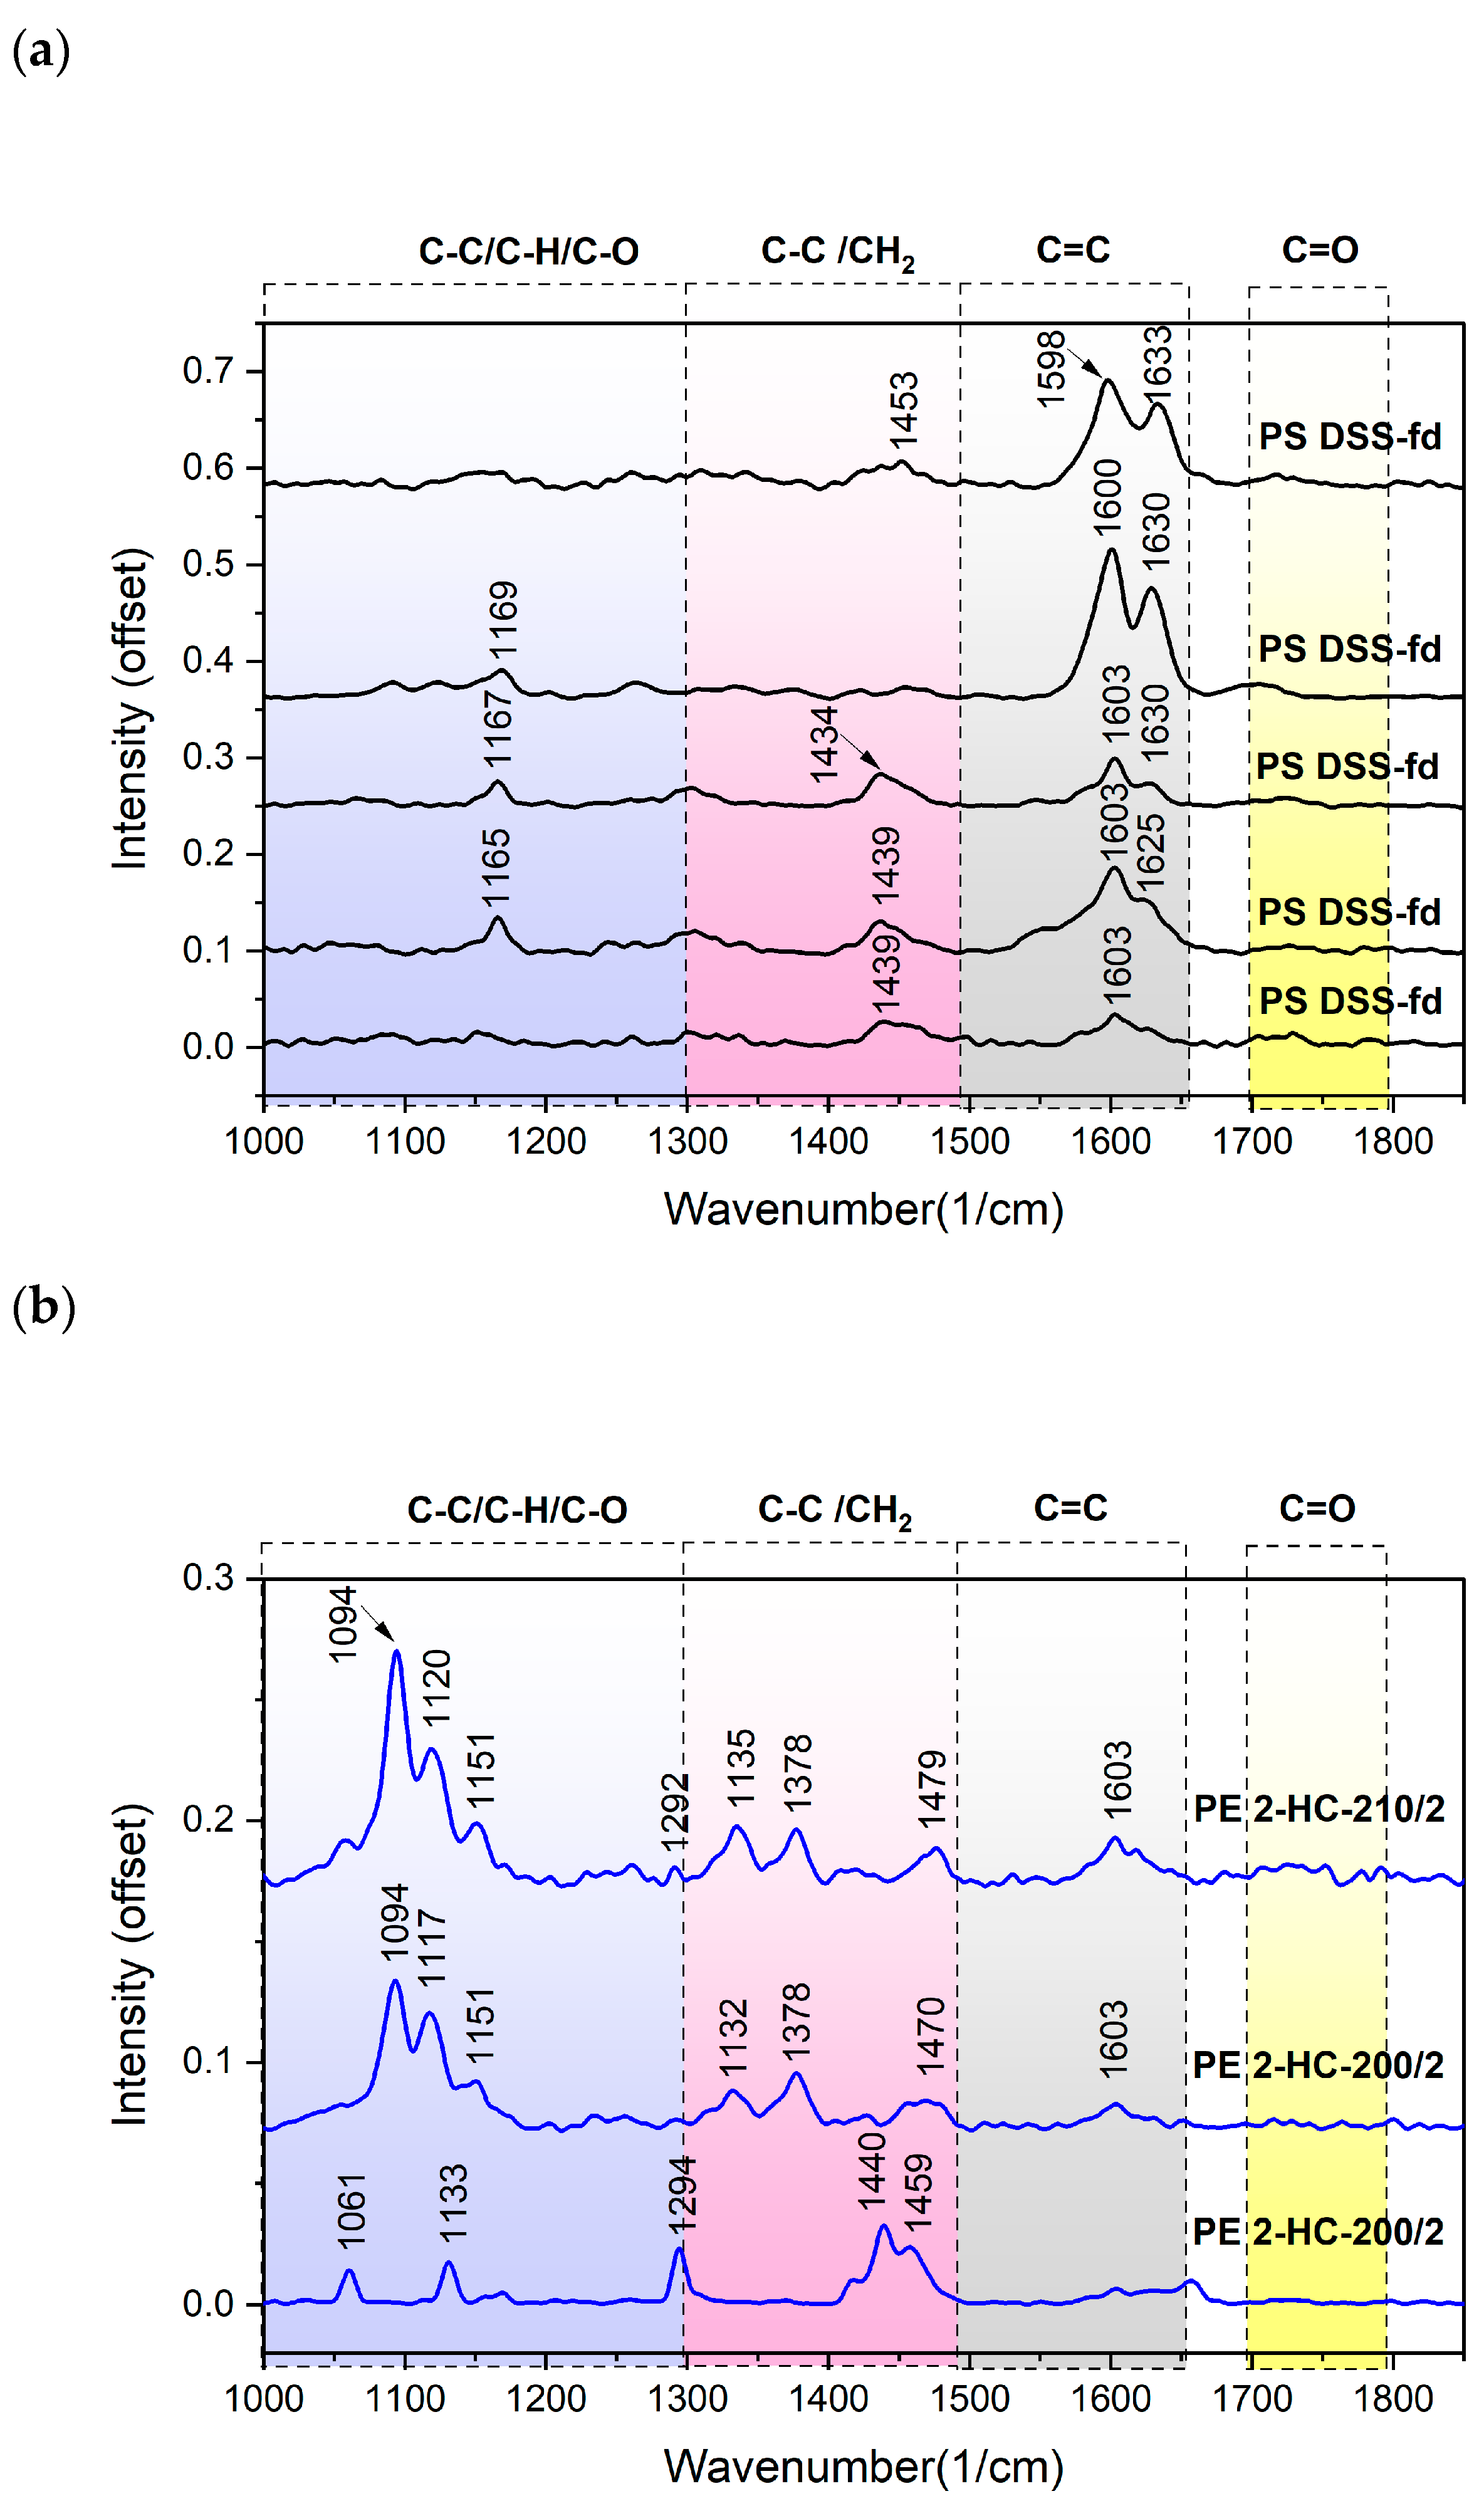
The collected Raman spectra are presented in Figure 6, highlighting the vibrational features of representative particles, enabling polymer classification based on characteristic peak positions. In the DSS-fd sample, only PS was detected, which does not correspond with a previous study from southern Poland indicating PE as the dominant polymer in sewage sludge [43,44]. The PS spectrum is characterized by the presence of dominant aromatic bands in the ~1500–1650 cm−1 region, corresponding to the stretching vibrations of C=C bonds in the phenyl ring [45]. The low signal in the ~1000 cm−1 region, typical of phenyl ring breathing vibrations in intact PS, suggests a loss of part of the aromatic structure after wastewater treatment. This may indicate the partial degradation or dissolution of styrene compounds [46]. In the case of MPs recovered from hydrochars, spectroscopic identification was more challenging. Two PE particles were identified in 2-HC-200/2, one PE particle from 2-HC-210/2, and none from 2-HC-220/2, as they were strongly affected by spectral noise across the entire spectrum and could not be clearly assigned to a specific polymer. This was considered an indication of advanced degradation of the polymer structure. The obtained PE spectra showed typical bands in the ~1000–1200 cm−1 region, attributed to skeletal C–C stretching vibrations, and in the 1300–1500 cm−1 range, associated with deformation vibrations of CH2 groups [47,48]. The band slightly appearing at ~1600 cm−1 was atypical for intact PE, potentially indicating partial degradation or oxidation of the polymer, leading to the formation of unsaturated C=C fragments. This phenomenon may be a consequence of both hydrothermal degradation and photochemical processes, during which chain breaking, double bond formation, and the formation of carbonyl groups occur [49].
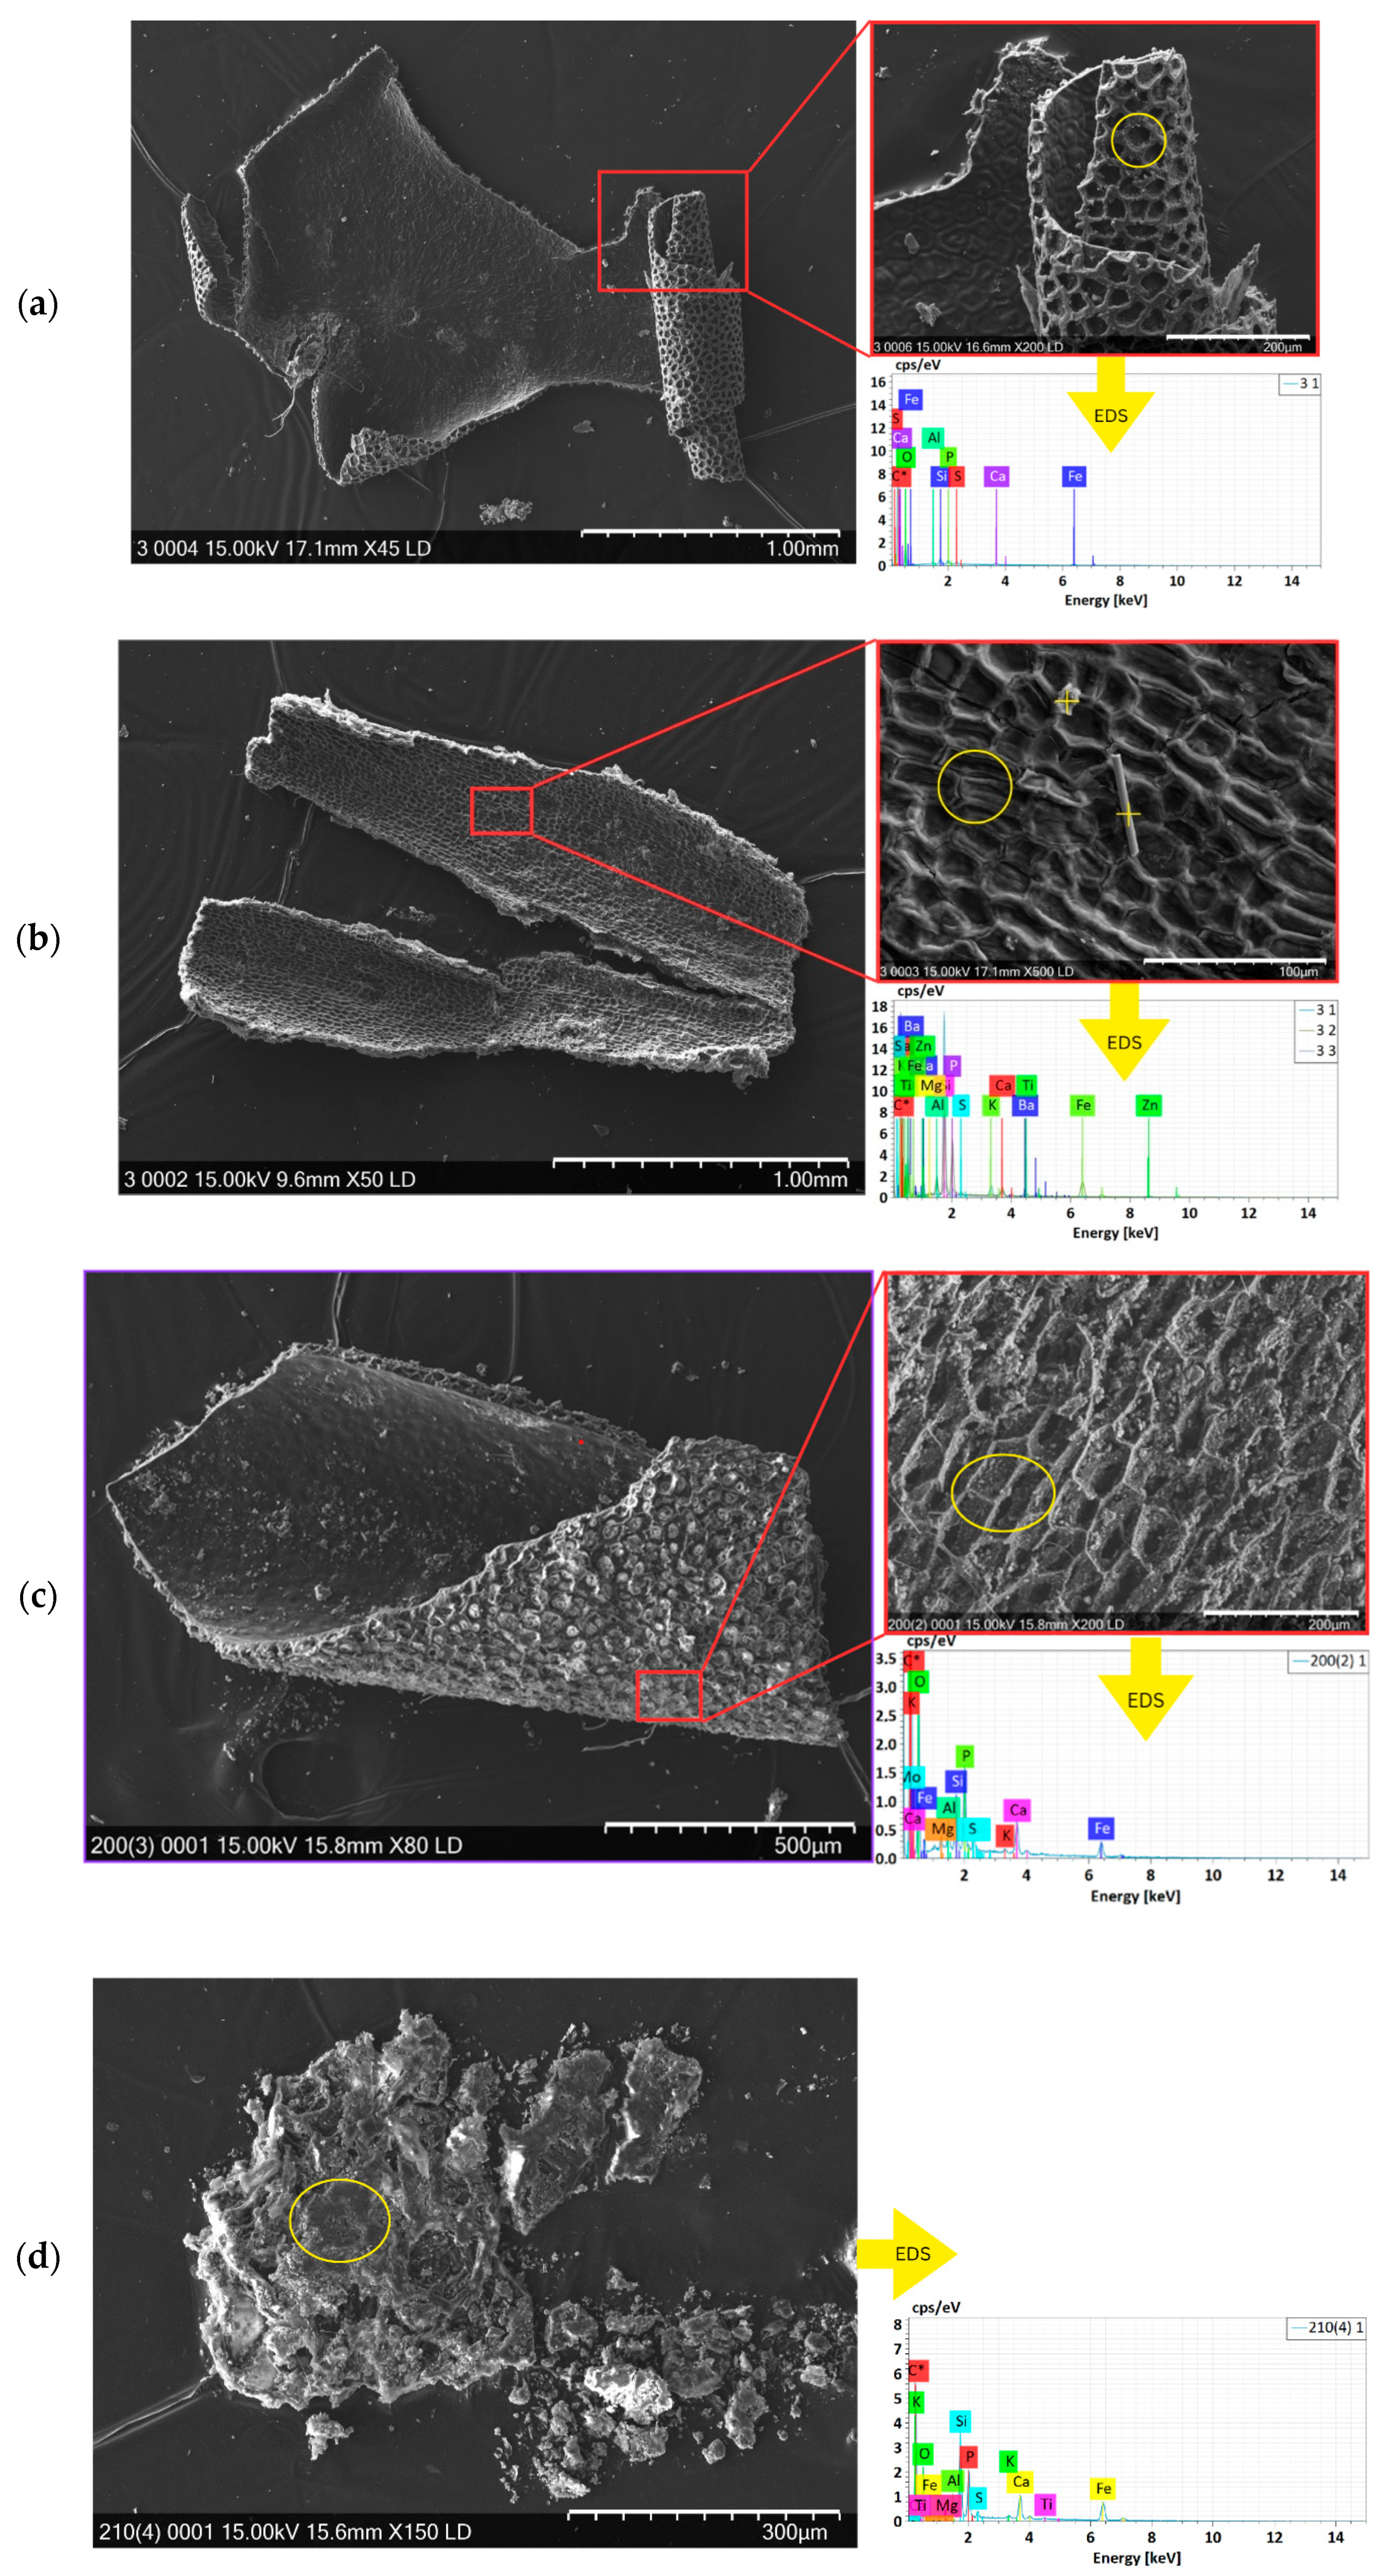
Compared to untreated MPs, post-HTC MPs displayed pronounced structural alterations, including fragmentation and partial embedding within organic residue. Spectral acquisition and the collection of CRM spectra were more challenging for post-HTC particles, necessitating even 10 times lower laser power compared to that used for DSS-MPs (up to 10 mW). This was likely due to increased surface degradation and thermal sensitivity. Identified particles were subjected to SEM-EDS analysis to assess their surface and morphology (Figure 7). Images revealed the asymmetrical morphology of particles isolated from DSS-fd. One side of the particle had a relatively smooth surface, while the opposite side had a distinctly porous, cellular structure. The formation of a porous structure significantly increases the specific surface area of the MP particle, which promotes interactions with compounds present in the sewage environment [48,49]. EDS analysis revealed the presence of several mineral elements on the particle surface, including components typical of a wastewater environment (e.g., silicon, calcium, iron, and phosphorus) that remained present even after chemical digestion during the extraction step, which suggests MP sorption ability [50,51,52]. It was observed that higher HTC temperatures caused more pronounced surface melting and structural degradation of MPs, accompanied by a decrease in the signal intensity of the attached compounds.

4. Conclusions

This study has confirmed that the hydrothermal carbonization process affects both the content and structural properties of microplastics present in digested sewage sludge. Polyethene and polystyrene were identified in the sludge sample, while polyethene was the only material present in the hydrochars obtained at 200 and 210 °C. The number of microplastic particles initially increased at 200 °C, which can be attributed to the fragmentation of larger structures, with the highest values recorded at 210 °C. Furthermore, at 220 °C, the degradation processes were the most intense, resulting in a significant decrease in the number of particles and making it difficult to identify the polymers clearly. Raman and SEM analyses revealed physical and chemical changes, including fragmentation, oxidation, increased porosity of the particle surfaces, and an association with mineral compounds. The fuel properties of sludge and hydrochar samples suggest a link between microplastic degradation and energy-related characteristics of the solid products. Increasing the HTC temperature led to a marked decrease in identifiable microplastics, accompanied by higher fixed carbon content and HHV. This indicates that microplastic breakdown, together with the transformation of sludge organics, contributes to the progressive carbon enrichment of hydrochars. The findings suggest that HTC reduces the environmental persistence of microplastics and simultaneously enhances the fuel quality of hydrochars, which can be beneficial in evaluating its potential as a practical method for the sustainable management of sewage sludge. Further research should focus on assessing the ecotoxicological risks associated with HTC-treated sludge in terms of microplastic and sorbed micropollutants content.

Author Contributions

Conceptualization, Z.P., K.S. (Katarzyna Styszko), and M.W.; methodology, Z.P., J.C., K.S. (Katarzyna Styszko) and M.W.; investigation, Z.P., K.S. (Klaudia Szkadłubowicz)., J.M., A.D. and I.B.; formal analysis and data curation, Z.P., A.D., I.B., K.S. (Katarzyna Styszko) and M.W.; resources, J.C., K.S. (Katarzyna Styszko)., and M.W.; writing—original draft preparation, Z.P.; writing—review and editing, Z.P., K.S. (Katarzyna Styszko) and M.W.; visualization, Z.P., A.D. and I.B.; supervision, K.S. (Katarzyna Styszko) and M.W.; project administration and funding acquisition, Z.P. All authors have read and agreed to the published version of the manuscript.

Funding

This research project was supported by the programme, “Excellence Initiative—Research University”, for the AGH University of Krakow, Poland. This research was partially financed by the Ministry of Science and Higher Education [AGH University grant no. 16.16.110.663].

Data Availability Statement

The data presented in this study are available on request from the corresponding author due to project management.

Acknowledgments

The study was carried out using research infrastructure funded by the Priority Research Area Anthropocene Flagship Project Earth System Science Core Facility in the framework of the Excellence Initiative—Research University programme of the Ministry of Higher Education and Science.

Conflicts of Interest

The authors declare no conflicts of interest.

References

  1. Thompson, R.C.; Moore, C.J.; vom Saal, F.S.; Swan, S.H. Plastics, the Environment and Human Health: Current Consensus and Future Trends. Philos. Trans. R. Soc. B Biol. Sci. 2009, 364, 2153–2166. [Google Scholar] [CrossRef]
  2. Allen, S.; Allen, D.; Phoenix, V.R.; Le Roux, G.; Jimenez, P.D.; Simonneau, A.; Binet, S.; Galop, D. Atmospheric Transport and Deposition of Microplastics in a Remote Mountain Catchment. Nat. Geosci. 2019, 12, 339–344. [Google Scholar] [CrossRef]
  3. Geyer, R.; Jambeck, J.R.; Law, K.L. Production, Use, and Fate of All Plastics Ever Made. Sci. Adv. 2017, 3, e1700782. [Google Scholar] [CrossRef] [PubMed]
  4. Wright, S.L.; Kelly, F.J. Plastic and Human Health: A Micro Issue? Environ. Sci. Technol. 2017, 51, 6634–6647. [Google Scholar] [CrossRef] [PubMed]
  5. Kurniawan, S.B.; Mohd Said, N.S.; Imron, M.F.; Abdullah, S.R.S. Microplastic Pollution in the Environment: Insights into Emerging Sources and Potential Threats. Environ. Technol. Innov. 2021, 23, 101790. [Google Scholar] [CrossRef]
  6. Carnevale Miino, M.; Galafassi, S.; Zullo, R.; Torretta, V.; Rada, E.C. Microplastics Removal in Wastewater Treatment Plants: A Review of the Different Approaches to Limit Their Release in the Environment. Sci. Total Environ. 2024, 930, 172675. [Google Scholar] [CrossRef]
  7. Habib, R.Z.; Thiemann, T.; Al Kendi, R. Microplastics and Wastewater Treatment Plants—A Review. J. Water Resour. Prot. 2020, 12, 1–35. [Google Scholar] [CrossRef]
  8. Huang, Y.-F.; Chiueh, P.-T.; Lo, S.-L. Energy Recovery from Sewage Sludge: Product Characteristics, Heating Value Prediction and Reaction Kinetics. Chemosphere 2021, 268, 128783. [Google Scholar] [CrossRef]
  9. Khanh Nguyen, V.; Kumar Chaudhary, D.; Hari Dahal, R.; Hoang Trinh, N.; Kim, J.; Chang, S.W.; Hong, Y.; Duc La, D.; Nguyen, X.C.; Hao Ngo, H.; et al. Review on Pretreatment Techniques to Improve Anaerobic Digestion of Sewage Sludge. Fuel 2021, 285, 119105. [Google Scholar] [CrossRef]
  10. Alper, K.; Tekin, K.; Karagöz, S.; Ragauskas, A.J. Sustainable Energy and Fuels from Biomass: A Review Focusing on Hydrothermal Biomass Processing. Sustain. Energy Fuels 2020, 4, 4390–4414. [Google Scholar] [CrossRef]
  11. European Environment Agency. Greenhouse Gas Intensities of Transport Fuels in the EU in 2021 Monitoring; European Environment Agency: Copenhagen, Denmark, 2023. [Google Scholar]
  12. Wilk, M.; Gajek, M.; Śliz, M.; Czerwińska, K.; Lombardi, L. Hydrothermal Carbonization Process of Digestate from Sewage Sludge: Chemical and Physical Properties of Hydrochar in Terms of Energy Application. Energies 2022, 15, 6499. [Google Scholar] [CrossRef]
  13. Wilk, M.; Czerwińska, K.; Śliz, M.; Imbierowicz, M. Hydrothermal Carbonization of Sewage Sludge: Hydrochar Properties and Processing Water Treatment by Distillation and Wet Oxidation. Energy Rep. 2023, 9, 39–58. [Google Scholar] [CrossRef]
  14. Czerwińska, K.; Śliz, M.; Wilk, M. Thermal Disposal of Post-Processing Water Derived from the Hydrothermal Carbonization Process of Sewage Sludge. Waste Biomass Valorization 2024, 15, 1671–1680. [Google Scholar] [CrossRef]
  15. Czerwińska, K.; Mikusińska, J.; Błoniarz, A.; Śliz, M.; Wilk, M. The Effect of Residence Time during the Hydrothermal Carbonization Process of Sewage Sludge on the Properties of Hydrochar. Energies 2024, 17, 3380. [Google Scholar] [CrossRef]
  16. Cao, Z.; Hülsemann, B.; Wüst, D.; Oechsner, H.; Lautenbach, A.; Kruse, A. Effect of Residence Time during Hydrothermal Carbonization of Biogas Digestate on the Combustion Characteristics of Hydrochar and the Biogas Production of Process Water. Bioresour. Technol. 2021, 333, 125110. [Google Scholar] [CrossRef]
  17. Chen, M.; Coleman, B.; Gaburici, L.; Prezgot, D.; Jakubek, Z.J.; Sivarajah, B.; Vermaire, J.C.; Lapen, D.R.; Velicogna, J.R.; Princz, J.I.; et al. Identification of Microplastics Extracted from Field Soils Amended with Municipal Biosolids. Sci. Total Environ. 2024, 907, 168007. [Google Scholar] [CrossRef]
  18. Prus, Z.; Wilk, M. Microplastics in Sewage Sludge: Worldwide Presence in Biosolids, Environmental Impact, Identification Methods and Possible Routes of Degradation, Including the Hydrothermal Carbonization Process. Energies 2024, 17, 4219. [Google Scholar] [CrossRef]
  19. Jiang, C.; Chen, Z.; Lu, B.; Li, Z.; Zhang, S.; Liu, Y.; Luo, G. Hydrothermal Pretreatment Reduced Microplastics in Sewage Sludge as Revealed by the Combined Micro-Fourier Transform Infrared (FTIR) and Raman Imaging Analysis. Chem. Eng. J. 2022, 450, 138163. [Google Scholar] [CrossRef]
  20. Xu, Z.; Bai, X. Microplastic Degradation in Sewage Sludge by Hydrothermal Carbonization: Efficiency and Mechanisms. Chemosphere 2022, 297, 134203. [Google Scholar] [CrossRef]
  21. Jose, S.; Lonappan, L.; Cabana, H. Hydrothermal Carbonization as a Promising Approach towards the Removal of Polyethylene Microplastics and Trace Organic Contaminants from Wastewater Sludge. J. Environ. Chem. Eng. 2025, 13, 118262. [Google Scholar] [CrossRef]
  22. Wilk, M.; Śliz, M.; Czerwińska, K.; Gajek, M.; Kalemba-Rec, I. Improvements in Dewaterability and Fuel Properties of Hydrochars Derived from Hydrothermal Co-Carbonization of Sewage Sludge and Organic Waste. Renew. Energy 2024, 227, 120547. [Google Scholar] [CrossRef]
  23. Akaniro, I.R.; Zhang, R.; Tsang, C.H.M.; Wang, P.; Yang, Z.; Zhao, J. Exploring the Potential of Hydrothermal Treatment for Microplastics Removal in Digestate. ACS Sustain. Chem. Eng. 2024, 12, 14187–14199. [Google Scholar] [CrossRef]
  24. PKN-ISO/TS 12902:2007; Solid Mineral Fuels—Determination of Total Carbon, Hydrogen and Nitrogen—Instrumental Method. Polish Committee for Standardization: Warsaw, Poland, 2007.
  25. Channiwala, S.A.; Parikh, P.P. A Unified Correlation for Estimating HHV of Solid, Liquid and Gaseous Fuels. Fuel 2002, 81, 1051–1063. [Google Scholar] [CrossRef]
  26. ISO 17246:2010; Coal—Proximate Analysis. International Organization for Standardization: Geneva, Switzerland, 2010.
  27. ASTM D7582-15; Standard Test Methods for Proximate Analysis of Coal and Coke by Macro Thermogravimetric Analysis. ASTM International: West Conshohocken, PA, USA, 2015.
  28. Worek, J.; Styszko, K. Comparative Study of Matrix Etching Methods for the Separation of Microplastics from Environmental Samples. Desalination Water Treat. 2025, 322, 101140. [Google Scholar] [CrossRef]
  29. Casella, C.; Sol, D.; Laca, A.; Díaz, M. Microplastics in Sewage Sludge: A Review. Environ. Sci. Pollut. Res. 2023, 30, 63382–63415. [Google Scholar] [CrossRef] [PubMed]
  30. Li, Q.; Wu, J.; Zhao, X.; Gu, X.; Ji, R. Separation and Identification of Microplastics from Soil and Sewage Sludge. Environ. Pollut. 2019, 254, 113076. [Google Scholar] [CrossRef] [PubMed]
  31. Li, J.; Liu, Y.; Gao, Y.; Li, X.; Gong, Y. Study on the Extraction Method of Microplastic System in Textile Wastewater. Polymers 2023, 15, 1394. [Google Scholar] [CrossRef]
  32. Kim, D.; Lee, K.; Park, K.Y. Hydrothermal Carbonization of Anaerobically Digested Sludge for Solid Fuel Production and Energy Recovery. Fuel 2014, 130, 120–125. [Google Scholar] [CrossRef]
  33. Roslan, S.Z.; Zainudin, S.F.; Mohd Aris, A.; Chin, K.B.; Musa, M.; Mohamad Daud, A.R.; Syed Hassan, S.S.A. Hydrothermal Carbonization of Sewage Sludge into Solid Biofuel: Influences of Process Conditions on the Energetic Properties of Hydrochar. Energies 2023, 16, 2483. [Google Scholar] [CrossRef]
  34. Xie, L.; Gou, L.; Wang, Y.; Dai, L. Co-Hydrothermal Carbonization of Sewage Sludge and Polyvinyl Chloride for the Production of High-Quality Solid Fuel with Low Nitrogen Content. Sci. Total Environ. 2022, 804, 150094. [Google Scholar] [CrossRef]
  35. Wang, L.; Li, A.; Chang, Y. Hydrothermal Treatment Coupled with Mechanical Expression at Increased Temperature for Excess Sludge Dewatering: Heavy Metals, Volatile Organic Compounds and Combustion Characteristics of Hydrochar. Chem. Eng. J. 2016, 297, 1–10. [Google Scholar] [CrossRef]
  36. Musivand, S.; Bracciale, M.P.; Damizia, M.; De Filippis, P.; de Caprariis, B. Viable Recycling of Polystyrene via Hydrothermal Liquefaction and Pyrolysis. Energies 2023, 16, 4917. [Google Scholar] [CrossRef]
  37. Saad, M.; Bucki, M.; Bujok, S.; Pawcenis, D.; Rijavec, T.; Górecki, K.; Bratasz, Ł.; Kralj Cigić, I.; Strlič, M.; Kruczała, K. The Impact of Heat and Humidity on Unplasticized Poly(Vinyl Chloride). Polym. Degrad. Stab. 2025, 238, 111334. [Google Scholar] [CrossRef]
  38. Kimukai, H.; Kodera, Y.; Koizumi, K.; Okada, M.; Yamada, K.; Hiaki, T.; Saido, K. Low Temperature Decomposition of Polystyrene. Appl. Sci. 2020, 10, 5100. [Google Scholar] [CrossRef]
  39. Mohanan, N.; Montazer, Z.; Sharma, P.K.; Levin, D.B. Microbial and Enzymatic Degradation of Synthetic Plastics. Front. Microbiol. 2020, 11, 580709. [Google Scholar] [CrossRef]
  40. Wu, J.; Gao, J.; Pei, Y.; Luo, K.; Yang, W.; Wu, J.; Yue, X.; Wen, J.; Luo, Y. Microplastics in Agricultural Soils: A Comprehensive Perspective on Occurrence, Environmental Behaviors and Effects. Chem. Eng. J. 2024, 489, 151328. [Google Scholar] [CrossRef]
  41. Lares, M.; Ncibi, M.C.; Sillanpää, M.; Sillanpää, M. Occurrence, Identification and Removal of Microplastic Particles and Fibers in Conventional Activated Sludge Process and Advanced MBR Technology. Water Res. 2018, 133, 236–246. [Google Scholar] [CrossRef]
  42. Letwin, N.V.; Gillespie, A.W.; Ijzerman, M.M.; Kudla, Y.M.; Csajaghy, J.D.; Prosser, R.S. Characterizing the Microplastic Content of Biosolids in Southern Ontario, Canada. Environ. Toxicol. Chem. 2023, 43, 793–806. [Google Scholar] [CrossRef]
  43. Styszko, K.; Bolesta, W.; Worek, J.; Prus, Z.; Cwynar, K.; Pyssa, J.; Uchmanowicz, D.; Frydel, L.; Daso, A.P.; Kasprzyk-Hordern, B. Tracking Nonregulated Micropollutants in Sewage Sludge: Antimicrobials, OH-PAHs, and Microplastics—Environmental Risks, Fertilizer Implications and Energy Considerations. Energy Rep. 2025, 13, 4756–4768. [Google Scholar] [CrossRef]
  44. Worek, J.; Kawoń, K.; Chwiej, J.; Berent, K.; Rego, R.; Styszko, K. Assessment of the Presence of Microplastics in Stabilized Sewage Sludge: Analysis Methods and Environmental Impact. Appl. Sci. 2024, 15, 1. [Google Scholar] [CrossRef]
  45. Socrates, G. Infrared and Raman Characteristic Group Frequencies: Tables and Charts, 3rd ed.; Wiley: Hoboken, NJ, USA, 2004. [Google Scholar]
  46. Dement’ev, K.I.; Palankoev, T.A.; Alekseeva, O.A.; Babkin, I.A.; Maksimov, A.L. Thermal Depolymerization of Polystyrene in Highly Aromatic Hydrocarbon Medium. J. Anal. Appl. Pyrolysis 2019, 142, 104612. [Google Scholar] [CrossRef]
  47. Prata, J.C.; Paço, A.; Reis, V.; da Costa, J.P.; Fernandes, A.J.S.; da Costa, F.M.; Duarte, A.C.; Rocha-Santos, T. Identification of Microplastics in White Wines Capped with Polyethylene Stoppers Using Micro-Raman Spectroscopy. Food Chem. 2020, 331, 127323. [Google Scholar] [CrossRef]
  48. Luo, H.; Zhao, Y.; Li, Y.; Xiang, Y.; He, D.; Pan, X. Aging of Microplastics Affects Their Surface Properties, Thermal Decomposition, Additives Leaching and Interactions in Simulated Fluids. Sci. Total Environ. 2020, 714, 136862. [Google Scholar] [CrossRef] [PubMed]
  49. Mais, L.; Melis, N.; Vacca, A.; Mascia, M. Electrochemical Removal of PET and PE Microplastics for Wastewater Treatment. Environ. Sci. 2024, 10, 399–407. [Google Scholar] [CrossRef]
  50. Hao, L.; Ma, H.; Xing, B. Surface Characteristics and Adsorption Properties of Polypropylene Microplastics by Ultraviolet Irradiation and Natural Aging. Sci. Total Environ. 2024, 944, 173962. [Google Scholar] [CrossRef]
  51. Liu, X.; Sun, P.; Qu, G.; Jing, J.; Zhang, T.; Shi, H.; Zhao, Y. Insight into the Characteristics and Sorption Behaviors of Aged Polystyrene Microplastics through Three Type of Accelerated Oxidation Processes. J. Hazard. Mater. 2021, 407, 124836. [Google Scholar] [CrossRef] [PubMed]
  52. Jiménez-Skrzypek, G.; Hernández-Sánchez, C.; Ortega-Zamora, C.; González-Sálamo, J.; González-Curbelo, M.Á.; Hernández-Borges, J. Microplastic-Adsorbed Organic Contaminants: Analytical Methods and Occurrence. Trends Anal. Chem. 2021, 136, 116186. [Google Scholar] [CrossRef]
Figure 1. Schematic overview of the experimental workflow.
Energies 18 05105 g001
Figure 2. Solid, liquid, and gas yields obtained from HTC of DSS at 200, 210, and 220 °C for 2 h.
Energies 18 05105 g002
Figure 3. Dry digested sewage sludge (DSS), freeze-dried digested sewage sludge (DSS-fd) and corresponding hydrochars (1-HC and 2-HC) samples used for this study.
Energies 18 05105 g003
Figure 4. Total number of MPs per 100 g d.m. in DSS-fd 2-HC-200/2, 2-HC-210/2, and 2-HC-220/2. The bar chart represents the number of MPs, divided into fibers (green) and fragments (violet). The blue line indicates the total mass of extracted particles (TMEP).
Energies 18 05105 g004
Figure 5. Microscopic images of MPs extracted from sewage sludge (ac), and representative MPs extracted from hydrochar (df).
Energies 18 05105 g005
Figure 6. Raman spectra of MPs from (a) DSS-fd, (b) hydrochars.
Energies 18 05105 g006
Figure 7. SEM images and EDS spectra of PE-MPs extracted from (a,b) DSS-fd, (c) 2-HC-200/2, (d) 2-HC-210/2. The yellow markers indicate the locations from which the spectra were collected.
Energies 18 05105 g007
Table 1. Elemental and proximate analysis of DSS with calculated oxygen (O), fixed carbon (FC), and higher heating value (HHV).
Sample/
Parameter
Ultimate AnalysisProximate Analysis
CHNSOHHVMAVMFC
%%%%%MJ/kg%%%%
DSS-d28.0660
24.0880
28.1400
5.3334
4.5771
5.5261
4.3146
2.6743
4.4014
1.2975
1.3006
1.3015
15.6660
22.0606
15.9425
13.8136
10.8987
14.0475
12.76
12.8
12.63
33.86
33.80
33.36
50.35
46.47
46.97
3.03
6.93
7.04
1-HC-200/230.4500
30.2470
30.3740
4.2101
4.1820
3.7538
3.4318
3.4231
3.4114
1.1900
1.1800
11.1481
11.1279
11.8708
13.4612
13.3519
12.7057
1.23
1.18
1.19
49.53
49.84
49.40
41.15
41.19
41.25
8.09
7.79
8.16
1-HC-210/230.5910
30.5120
4.1887
4.0978
3.2281
3.2558
1.1500
1.1800
10.2922
10.3544
48.4100
13.5670
13.4256
1.9
1.84
1.82
49.80
49.94
49.77
40.3
40.24
40.18
8.00
7.98
8.23
1-HC-220/228.341
28.3920
29.8050
3.8217
3.8213
3.9093
2.9405
2.9505
2.9235
1.1800
1.1500
12.6668
12.6562
11.3822
12.0997
12.1114
12.7340
1.90
1.68
1.91
50.33
50.50
50.07
42.72
42.7
42.52
5.05
5.12
5.50
Disclaimer/Publisher’s Note: The statements, opinions and data contained in all publications are solely those of the individual author(s) and contributor(s) and not of MDPI and/or the editor(s). MDPI and/or the editor(s) disclaim responsibility for any injury to people or property resulting from any ideas, methods, instructions or products referred to in the content.