1. Introduction
Over the past decade, Ukraine has seen considerable growth in electricity production from photovoltaic (PV) and wind turbine (WT) plants [
1]. Most renewable energy sources (RESs) with capacities ranging from tens of kW to several MW are used in low and medium-voltage (MV) distribution grids. Through intermittent power generation, the RES creates problems in maintaining the required voltage levels on the substation buses and optimal energy loss in the distribution grid. As reported in [
2], even at the current stage of operation of PV and WT generations, Ukrainian power system operators are forced to limit the RES generation during extreme situations due to significant concerns regarding frequency keeping, control of power flows, and voltage profiles.
Analysing the existing MV distribution grids in Ukraine shows that, in most cases, it was not feasible to implement the optimal location and acceptable capacity of the RES plant within the distribution grid due to technical and economic constraints. Such a discrepancy often worsens the grid’s voltage control problem and limits the ability of RES to reduce energy loss.
A review of the studies on the issue shows a notable interest in increasing RESs’ controllability to reduce their disturbing impact on the distribution grid. To find the key to solving the problem of mitigating the adverse RES impact on the distribution grid, the following approaches are used: active and reactive power control, hybrid using renewable energy sources and energy storage systems, active distribution systems, and controlled consumption [
3,
4,
5,
6].
Many works have explored the possibilities of RES reactive power control technologies and the use of on-load tap changers (OLTC) to improve the voltage profile and reduce voltage variations in the distribution grid [
3,
6,
7,
8,
9,
10]. According to the IEEE 1547 standard [
10], the inverters of all new or existing RES plants larger than 2 MW must be equipped with reactive power and voltage control functions that allow operators to use their availability to control voltage and optimise energy loss in the grid.
In [
3], the authors proposed an optimal scheduling method for distributed generators, battery energy storage systems, tap-changing transformers, and controllable loads applicable to a smart grid. This method, based on predicted values of distributed generation and load demand, generates a power reference schedule for the control system of these elements to minimise total distribution losses in the grid. It has been demonstrated that voltage control objectives can also be achieved by adhering to the power loss optimisation constraints. The article [
5] presents an overview of the technical and economic aspects of hybrid renewable energy systems and optimisation methods to achieve an optimal configuration in power grids. The paper [
6] describes a combination of both central and local control methods for voltage management by PV inverters in unbalanced distribution grids. It has been shown that in unbalanced three-phase four-wire grids, the neutral-point shifting effect requires particular attention for active and reactive power control. In [
7], a compact expression for transformer voltage regulation is proposed. The primary feature of the proposed method is the consideration of voltage deviation from the nominal value when determining the operating transformation ratios. The presented method can be employed to calculate the running changes in transformer ratios during variations in the operating conditions of renewable energy sources. A simple scheme for the optimal utilisation of the reactive power of existing solar photovoltaic inverters to enhance total wind power penetration in a distribution system is proposed in [
8]. From the comparative study of wind penetration levels when solar photovoltaic inverters are operating at fixed reactive power support, and the actual capability curve of the inverter, it can be concluded that the use of the reactive power capability of existing solar photovoltaic inverters can support the significant enhancement of wind power penetration into the power grids. In [
9], a new cooperative protocol is proposed to ensure proper voltage regulation for multiple feeders with transformer tap changer, unbalanced load sharing, and several distributed generating units in each feeder. The objective aims to achieve the system requirements by minimising the voltage deviation, and the device requirements by reducing the tap operation and maximising the energy capture for transformer tap changers and distributed generation units, respectively.
The available publications report several techniques and devices to mitigate grid voltage control concerns; the use of capacitor banks, FACTS devices, and OLTC on transformers has been proposed and studied in [
7,
8,
9,
11,
12,
13,
14]. A PV control method presented in [
11] proposes operating PV during the night as a STATCOM with full inverter capacity, and during the day with inverter capacity remaining after real power generation. The authors named such a photovoltaic system PV-STATCOM. In a study [
12], a combined strategy where a feeder distribution transformer electronic tap changer provides a voltage control function in the low-voltage grid, and PV systems at each feeder bus are then used to minimise feeder losses by providing local load reactive power support. An optimisation method has been developed to optimally coordinate fast control of photovoltaic inverters with slow control of on-load tap changer and capacitor banks for voltage regulation in a three-phase unbalanced distribution system [
13]. The trade-off between the constraints of voltage control requirements and power loss is analysed by the developed multi-objective volt/var optimisation models. Concerns of optimal voltage control and coordination with distributed generation are described in [
14]. Collaborative control of reactive adjustment devices in the distribution grid and within virtual power plants to optimise reactive power and minimise the overall voltage deviation is studied in [
15]. An extensive overview of the development and evolution of the control algorithms in power system support functions by distributed energy resources (DERs) is described in [
16]. Standards and grid codes for DER inverters to interconnect with the distribution grid have been analysed. The benefits and drawbacks of control algorithms from renewable DER inverters, such as voltage regulation by active/reactive power control, and voltage ride-through, are presented and compared with their predecessors. A comprehensive review of voltage control concerns in distribution grids under conditions of high penetration of photovoltaic-energy storage systems is provided in [
17]. The authors analyse overvoltage mechanisms and basic control strategies, compare direct voltage control with reported optimisation methods, and discuss centralised and distributed control architectures.
The normal operation of RESs in the distribution grid is accompanied by voltage changes, which, according to the actual Standard EN 50160 [
18], can be categorised into two types: slow voltage changes (voltage variations) and rapid cyclic irregular voltage changes (voltage fluctuations).
The described methods provide mitigation of voltage variations caused by the intermittent nature of RES generation. Still, they are insufficient to handle fast voltage deviations, such as voltage fluctuations in the real-time operation of the RES. Moreover, the additional costs are related to the installation of supplementary corrective devices. Therefore, there is interest in the advanced control of RES power electronic inverters as an economical solution.
This article studies the impact of RES reactive power control strategies on the propagation of voltage fluctuations in the distribution grid and their influence on energy loss.
2. RES Impact on Power Losses
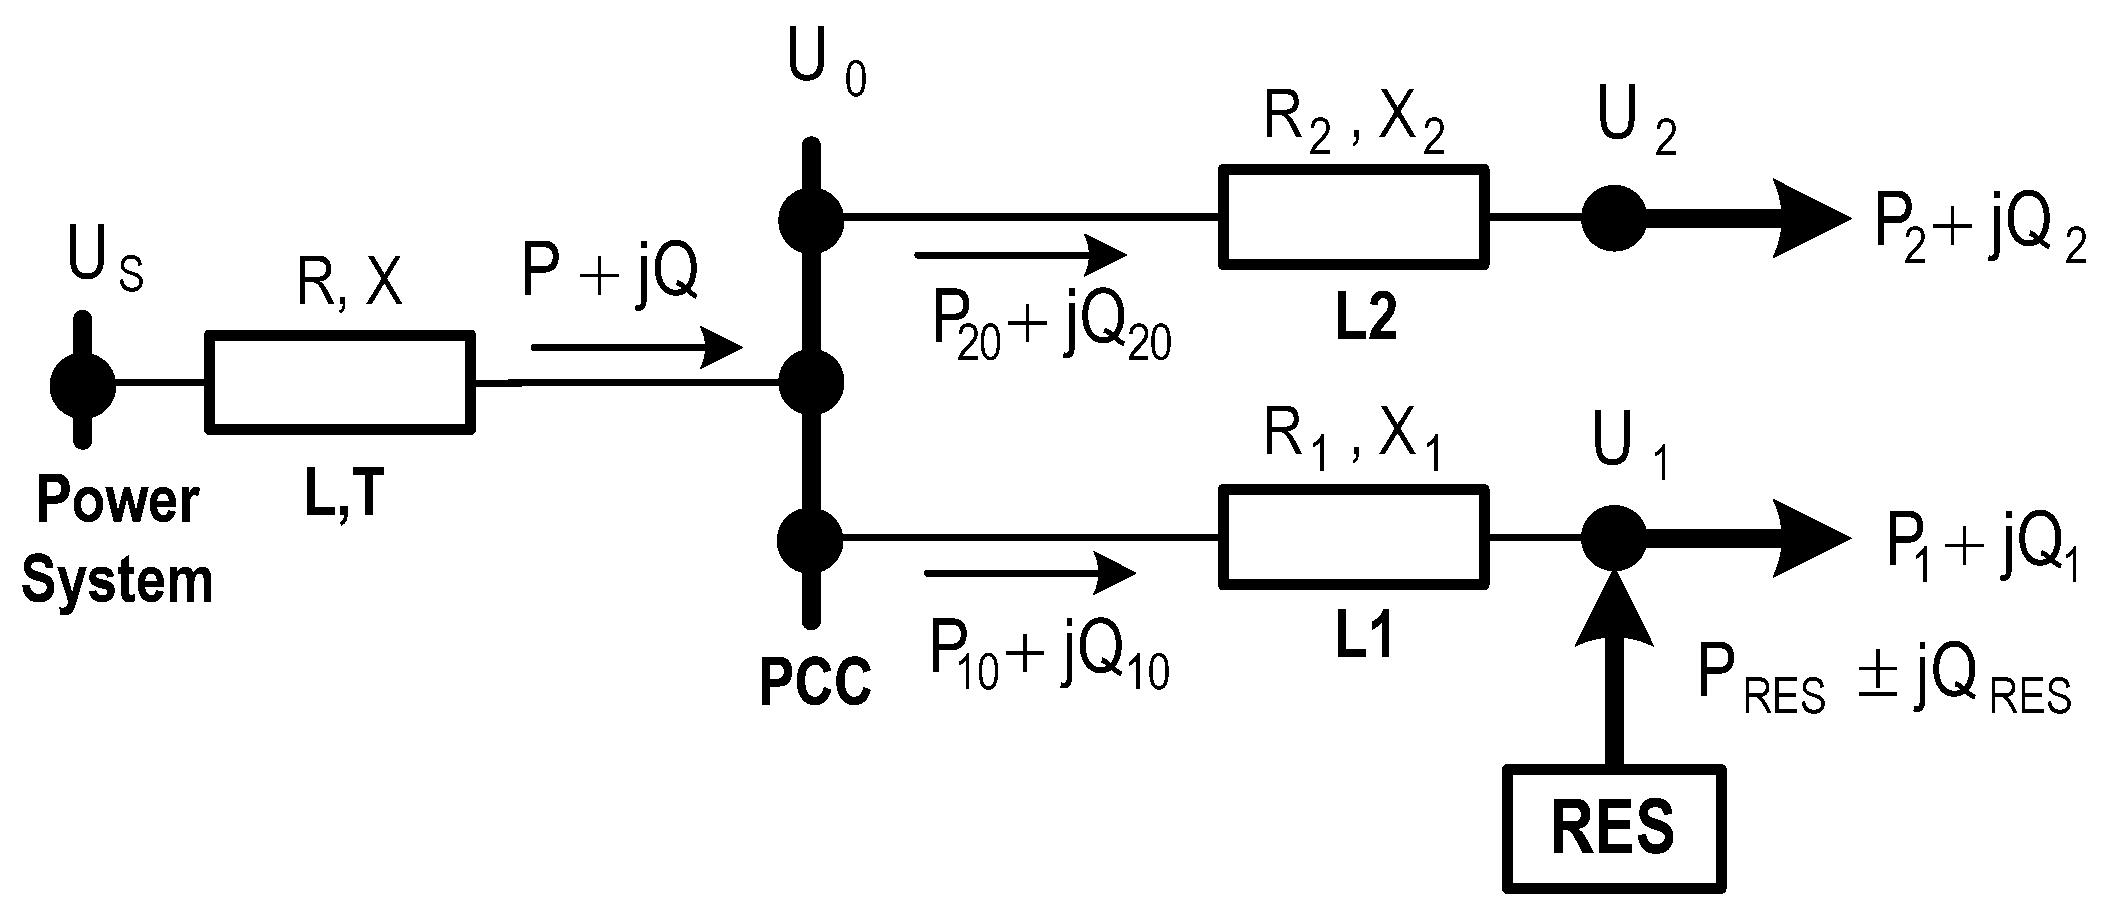
Let us consider the impact of a RES on the MV distribution grid operating condition using the example of the most straightforward equivalent shown in
Figure 1.
The following symbols are used in the figure:
—HV overhead line and transformer;
—reduced voltages of the bulk power system substation buses and the secondary side of the distribution grid transformer, respectively;
—voltages on the distribution grid substation buses;
—total equivalent resistance and reactance of the HV line and distribution grid transformer;
—equivalent resistance and reactance of distribution lines.
During RES operation, active and reactive power losses in the L1 line are calculated as follows:
The grid line’s active and reactive power loss may increase or decrease depending on the balance of active and reactive powers between the RES and the local load. Moreover, the daily profiles of grid loads and RES generation have apparent distinctions. As can be seen from Formula (1), the power losses in the network depend on the sum of the squares of the active and reactive powers and are independent of their directions. If we accept that under operating conditions, the voltage at point 1 is maintained as
, then the additional power losses relative to the power losses without RES (
and
) will change as follows:
Expression (2) clearly shows that the change in power losses depends not only on the current value of the RES output, but also on the current load powers.
The line L1 power flow change under RES operation will also change power losses in the supply feeder LT grid:
Thus, changes in power losses in the supply feeder will occur not merely in consequence of the RES operation, but also through changes in power losses in the L1 line.
However, the line L1 power flow has a slight impact on the power losses in the collateral line L2. Thus, the operation of the RES mainly impacts the power losses in the power supply feeder and the feeder where the RES is installed.
The RES’s reactive power control strategy has a significant impact on the grid power losses. Wind and photovoltaic generators are connected to the distribution grid through inverters, which can control the RES’s reactive power output depending on the grid requirements. The capability of a RES inverter’s reactive power output depends on its rating and current active power output. Therefore, the output reactive power of a RES inverter cannot be considered an infinite quantity, and this reality should be accounted for when designing and operating RES. The lowest RES reactive power output can be estimated by accounting for the maximum RES active power output
and the inverter capacity
by the following expression:
As can be seen from (4), with a decrease in the RES output active power, the ability of the RES inverter to control the grid reactive power flow increases. When using a relatively high-capacity RES installation in a lightly loaded local distribution grid, power losses can increase if the RES’s reactive power injection significantly exceeds the reactive demand of the local load. Therefore, grid load losses can be increased or decreased depending on the reactive power control strategy of the RES inverter. As the operating experience of wind and photovoltaic plants in the western region of Ukraine shows, the maximum RES operating active power output does not exceed 70–90% of the rating. However, under operating conditions when the maximum active power is generated, one should be guided by the limitations arising from (4). These considerations demonstrate the capability of using RES inverters for reactive power control tasks in the distribution grid.
3. RES Impact on Voltage Variations
Random variations in the active and reactive power of RES cause corresponding variations in power flows and, as a result, variations in voltage drops in the distribution grid.
For the grid equivalent in
Figure 1, the voltage drop on line L1 under RES operation can be expressed as follows:
or
where
and
are power losses accounted for
and
.
The change of the RES output from 0 to the value of
, considering the change of L1 power loss according to (3), causes the following voltage fluctuation in the 1 node:
where
is the L1 voltage drop without RES and
,
are power loss changes due to
and
.
As one can see in Formula (5), a variation in voltage drop caused by a change in RES active power output can be compensated by a sufficient value of RES reactive power output. This means that, based on the requirement of a constant voltage drop in the grid, a rise in node voltage through an increase in the RES active power will require an increase in the RES consumed reactive power; therefore, the RES reactive power, in this case, should be inductive. Vice versa, increasing the RES reactive power output (capacitive reactive power) increases the voltage rise amplitude when increasing the RES active power output. It should be noted that the impact of changes in the RES reactive power output also depends on the ratio between the line reactance and resistance, i.e., the line impedance factor . In this way, the RES reactive power control can impact the grid voltage variations.
Assuming
we can express the voltage fluctuation
dependence on the RES power output as:
Exploring Expression (8), it can be noted that the voltage drop dependence is generally not a linear function of the RES active power input at a given reactive power factor, since the value of depends on the power losses in the line L1 due to changes in the RES power output.
The grid power flow variations due to RES operation also impact the voltage drop in the upstream grid LT:
where
.
Similarly to (7), voltage fluctuation in the 0 node (PCC) under the total change of the RES output results in:
Thus, we get the voltage fluctuation at the PCC node under the change of the RES output as follows:
and for 1 node, accounting
change, we obtain the voltage fluctuation as:
When the HV/MV transformer is equipped with automatic online tap changers (OLTC), as is typically the case, the voltage at the main MV bus (i.e., PCC in
Figure 1) is kept constant during relatively slow variations of the RES power output. Then we obtain:
.
If the RES power output variations occur at a significant rate (so-called fluctuations), then the OLTC does not respond to these changes. Voltage changes will be according to Expression (12).
Considering the impact of the RES’s reactive power nature on the grid line’s operating condition, the following cumulative effect can be stated: an increase in its consumption at a given RES active power output provokes an increasing line power loss and a decreasing change in voltage drop caused by the RES active power output. As can be seen from Expression (8), with an increase in the RES active power output and neglecting , it is possible to provide an invariable line voltage drop fulfilling the condition and using the RES inductive reactive power capability, thus preventing an excessive voltage rise in the grid node.
Concerning
Figure 1, the PCC voltage
is related to the node 2 voltage
by the following expression:
When voltage fluctuation
is observed at the PCC node during RES operation, node 2 of the collateral grid line L2 will also experience voltage fluctuation, and node 2 voltage changes to:
where
,
—line active and reactive powers under increase node voltage by
.
Node 2 voltage fluctuation results as:
Assuming the little effect of the voltage variation
on the L2 line voltage drop
, the dependence of voltage fluctuation
on the voltage fluctuation
can be estimated as follows:
Expression (16) shows that the voltage fluctuation magnitudes on the busbars of the distribution grid substations will increase with their distance from the bulk system substation bus. Moreover, the voltage fluctuation magnitudes rise with increasing feeder power flow.
Using Expressions (1)–(16), let us examine the distinctive signs of the propagating voltage fluctuations in the most straightforward MV distribution network, shown in
Figure 1. The 35 kV medium voltage grid is supplied from 110/35 kV stepdown transformer T of 10 MVA capacity, which is connected through the line L to the power system bus where voltage
remains constant. The impedance of the LT feeder, reduced to the MV voltage, is
Ω. Impedances of 35 kV overhead lines L1 and L2, corresponding to
aluminum-steel wire, are
Ω and
Ω, respectively. The maximum loads of the MV grid are
MVA and
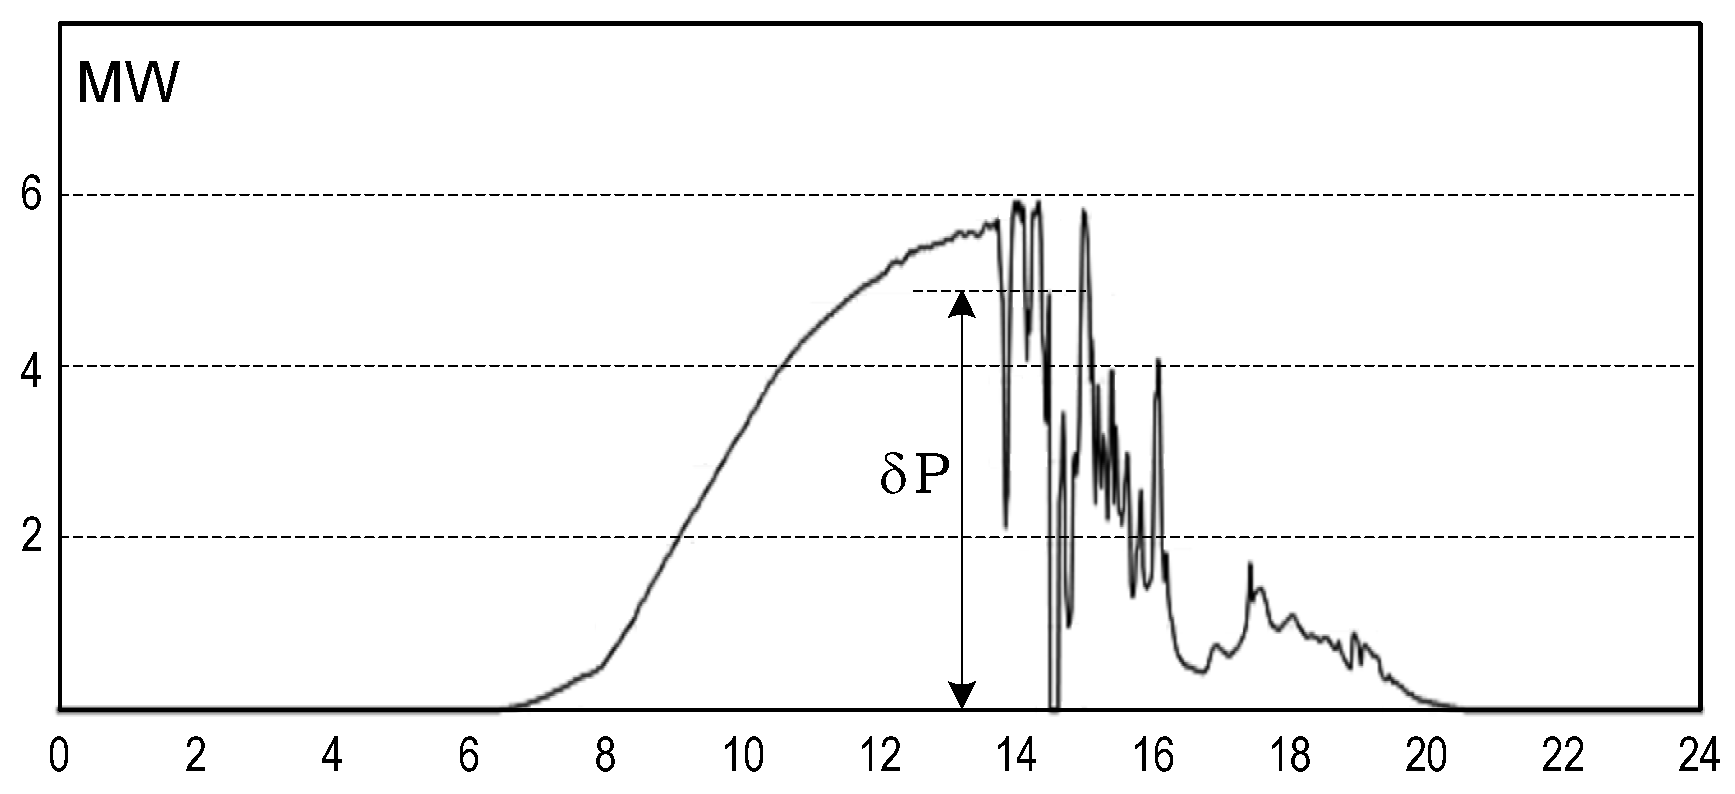
MVA, respectively. The RES maximum active power output is 5 MW, and the operating reactive power factor is within ±0.25. During the RES operation, sharp fluctuations in power within
MW are possible. The system transformer OLTC cannot handle the rapid voltage fluctuations on the PCC bus that accompany such changes in RES power. Let us consider the nature of voltage fluctuations in grid nodes under RES active power changes
at typical reactive power factors:
.
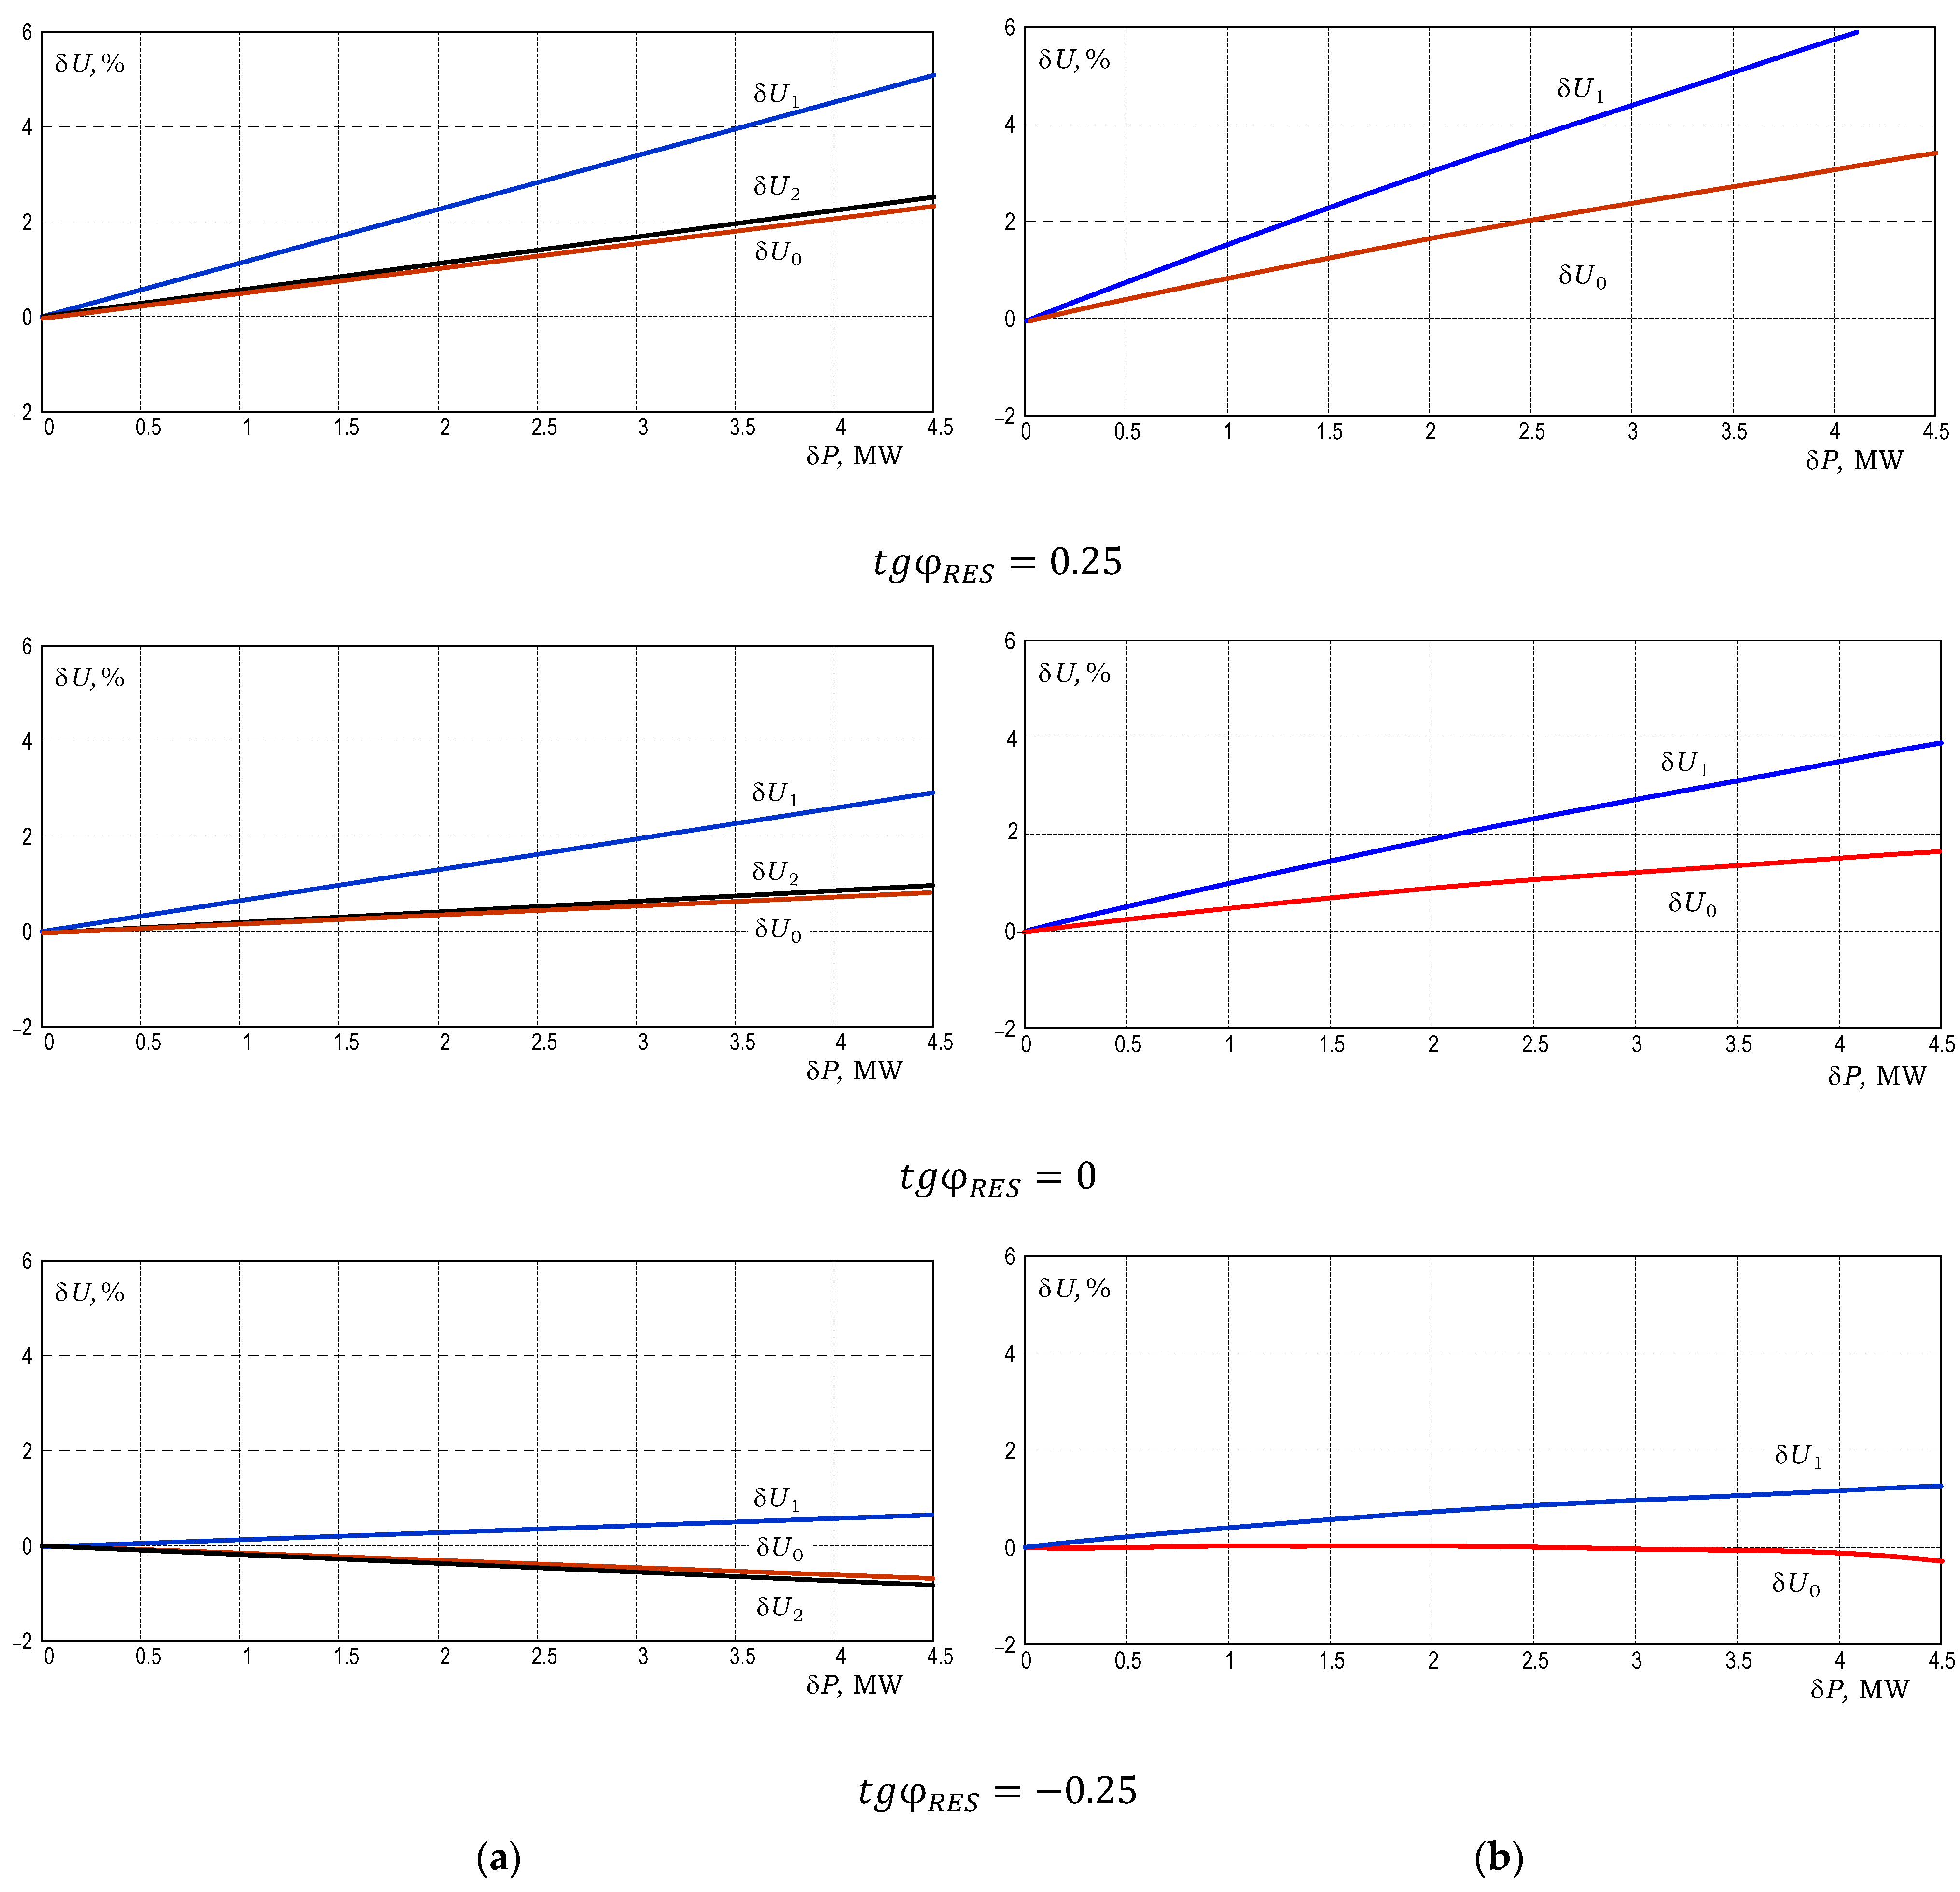
Dependences of voltage fluctuations in the nodes 1, 2, and 3 on the RES active power changes
at the analysed reactive power factors are shown in
Figure 2. Comparing the dependencies from
Figure 2a,b, we can observe the influence of the change in power losses during
fluctuation on the voltage fluctuation value calculations in the grid nodes. When accounting for changes in power losses in the grid during RES power fluctuations, the calculations result in higher voltage fluctuation values in the grid nodes within
. However, if the RES operates with negative values of
, the fluctuations at the RES node increase slightly, and are decreased at the PCC node.
When RES operates with capacitive reactive power , the voltage fluctuations in the grid nodes are increased compared to the conditions of . Therefore, with the increase in (capacitive RES reactive power), voltage fluctuations in the network nodes increase, and both in the RES node and the PCC node have the same sign. While the RES operates under inductive reactive power (), voltage fluctuations in the grid nodes are reduced compared to the condition . However, the voltage fluctuations in the PCC node develop with a negative sign relative to the fluctuations in the RES node.
Voltage fluctuations
are only dependent on the voltage fluctuations
at the PCC node, and the power loss changes in the lines L1 and LT do not impact
. Therefore, the
dependencies are not shown in
Figure 2b. The results of the calculations are presented in
Table 1. One can notice a slight increase in voltage fluctuations
at the 2 node of the grid relative to the voltage fluctuations
at the PCC node.
As shown previously, reactive power regulation of RES is of practical interest for minimising voltage fluctuations in selected grid nodes.
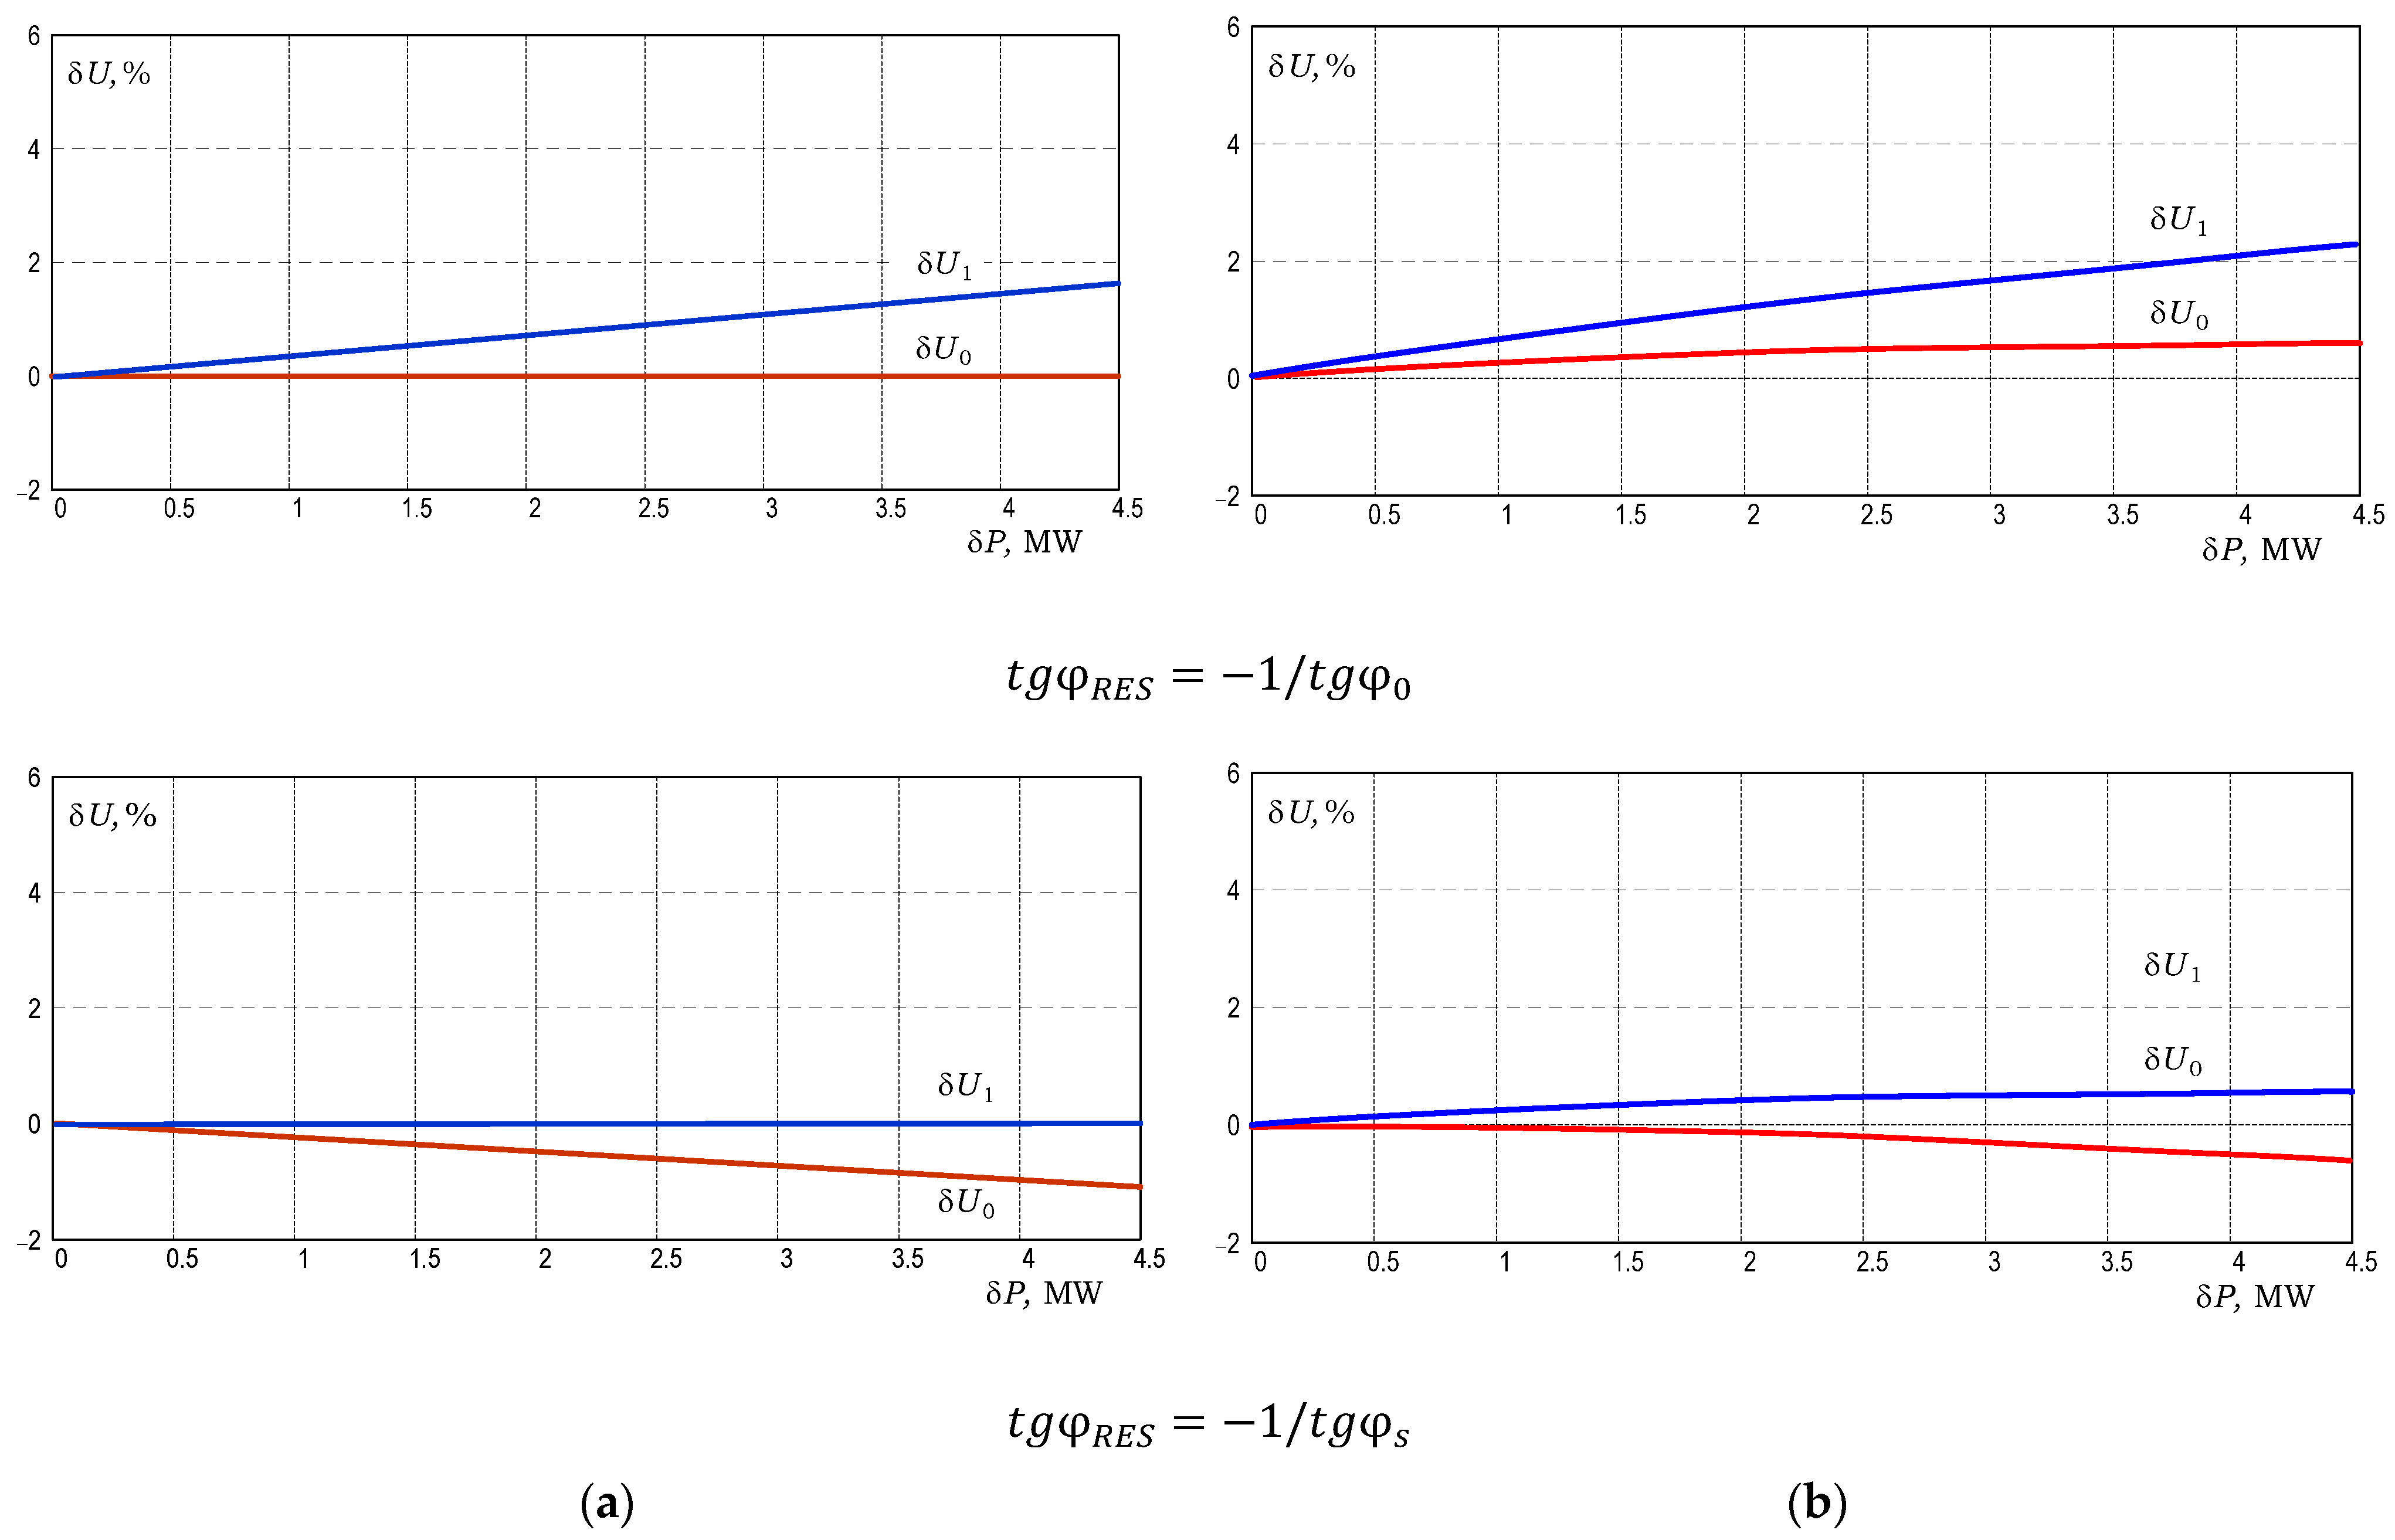
Figure 3 shows two specified cases, when RES operates under:
, where
, where
Figure 3.
Voltage fluctuations in the grid nodes: (a) Without describing the power losses change; (b) Power losses change described.
Figure 3.
Voltage fluctuations in the grid nodes: (a) Without describing the power losses change; (b) Power losses change described.
Figure 3a,b show the calculated dependences of voltage fluctuations in specified grid nodes (PCC and RES) for both scenarios, with and without considering the power losses change in the grid due to fluctuations in the power of the RES, respectively. In the first case, by maintaining
, it is possible to ensure the minimisation of voltage fluctuations during the operation of the RES in the PCC node. To minimise fluctuations in the RES node, it is required to maintain
. However, in the second case, under minimising fluctuations in the RES node, the voltage fluctuations in the PCC node will be greater than in the RES node. Comparing
Figure 3a,b, one can observe that the voltage fluctuations on the buses of a true grid, where power losses changes are considered, will differ somewhat from the idealised dependences in
Figure 3a. Therefore, the fact should be accounted for when choosing the RES reactive power factor for a given grid operating condition.
5. Simulating Operating Conditions
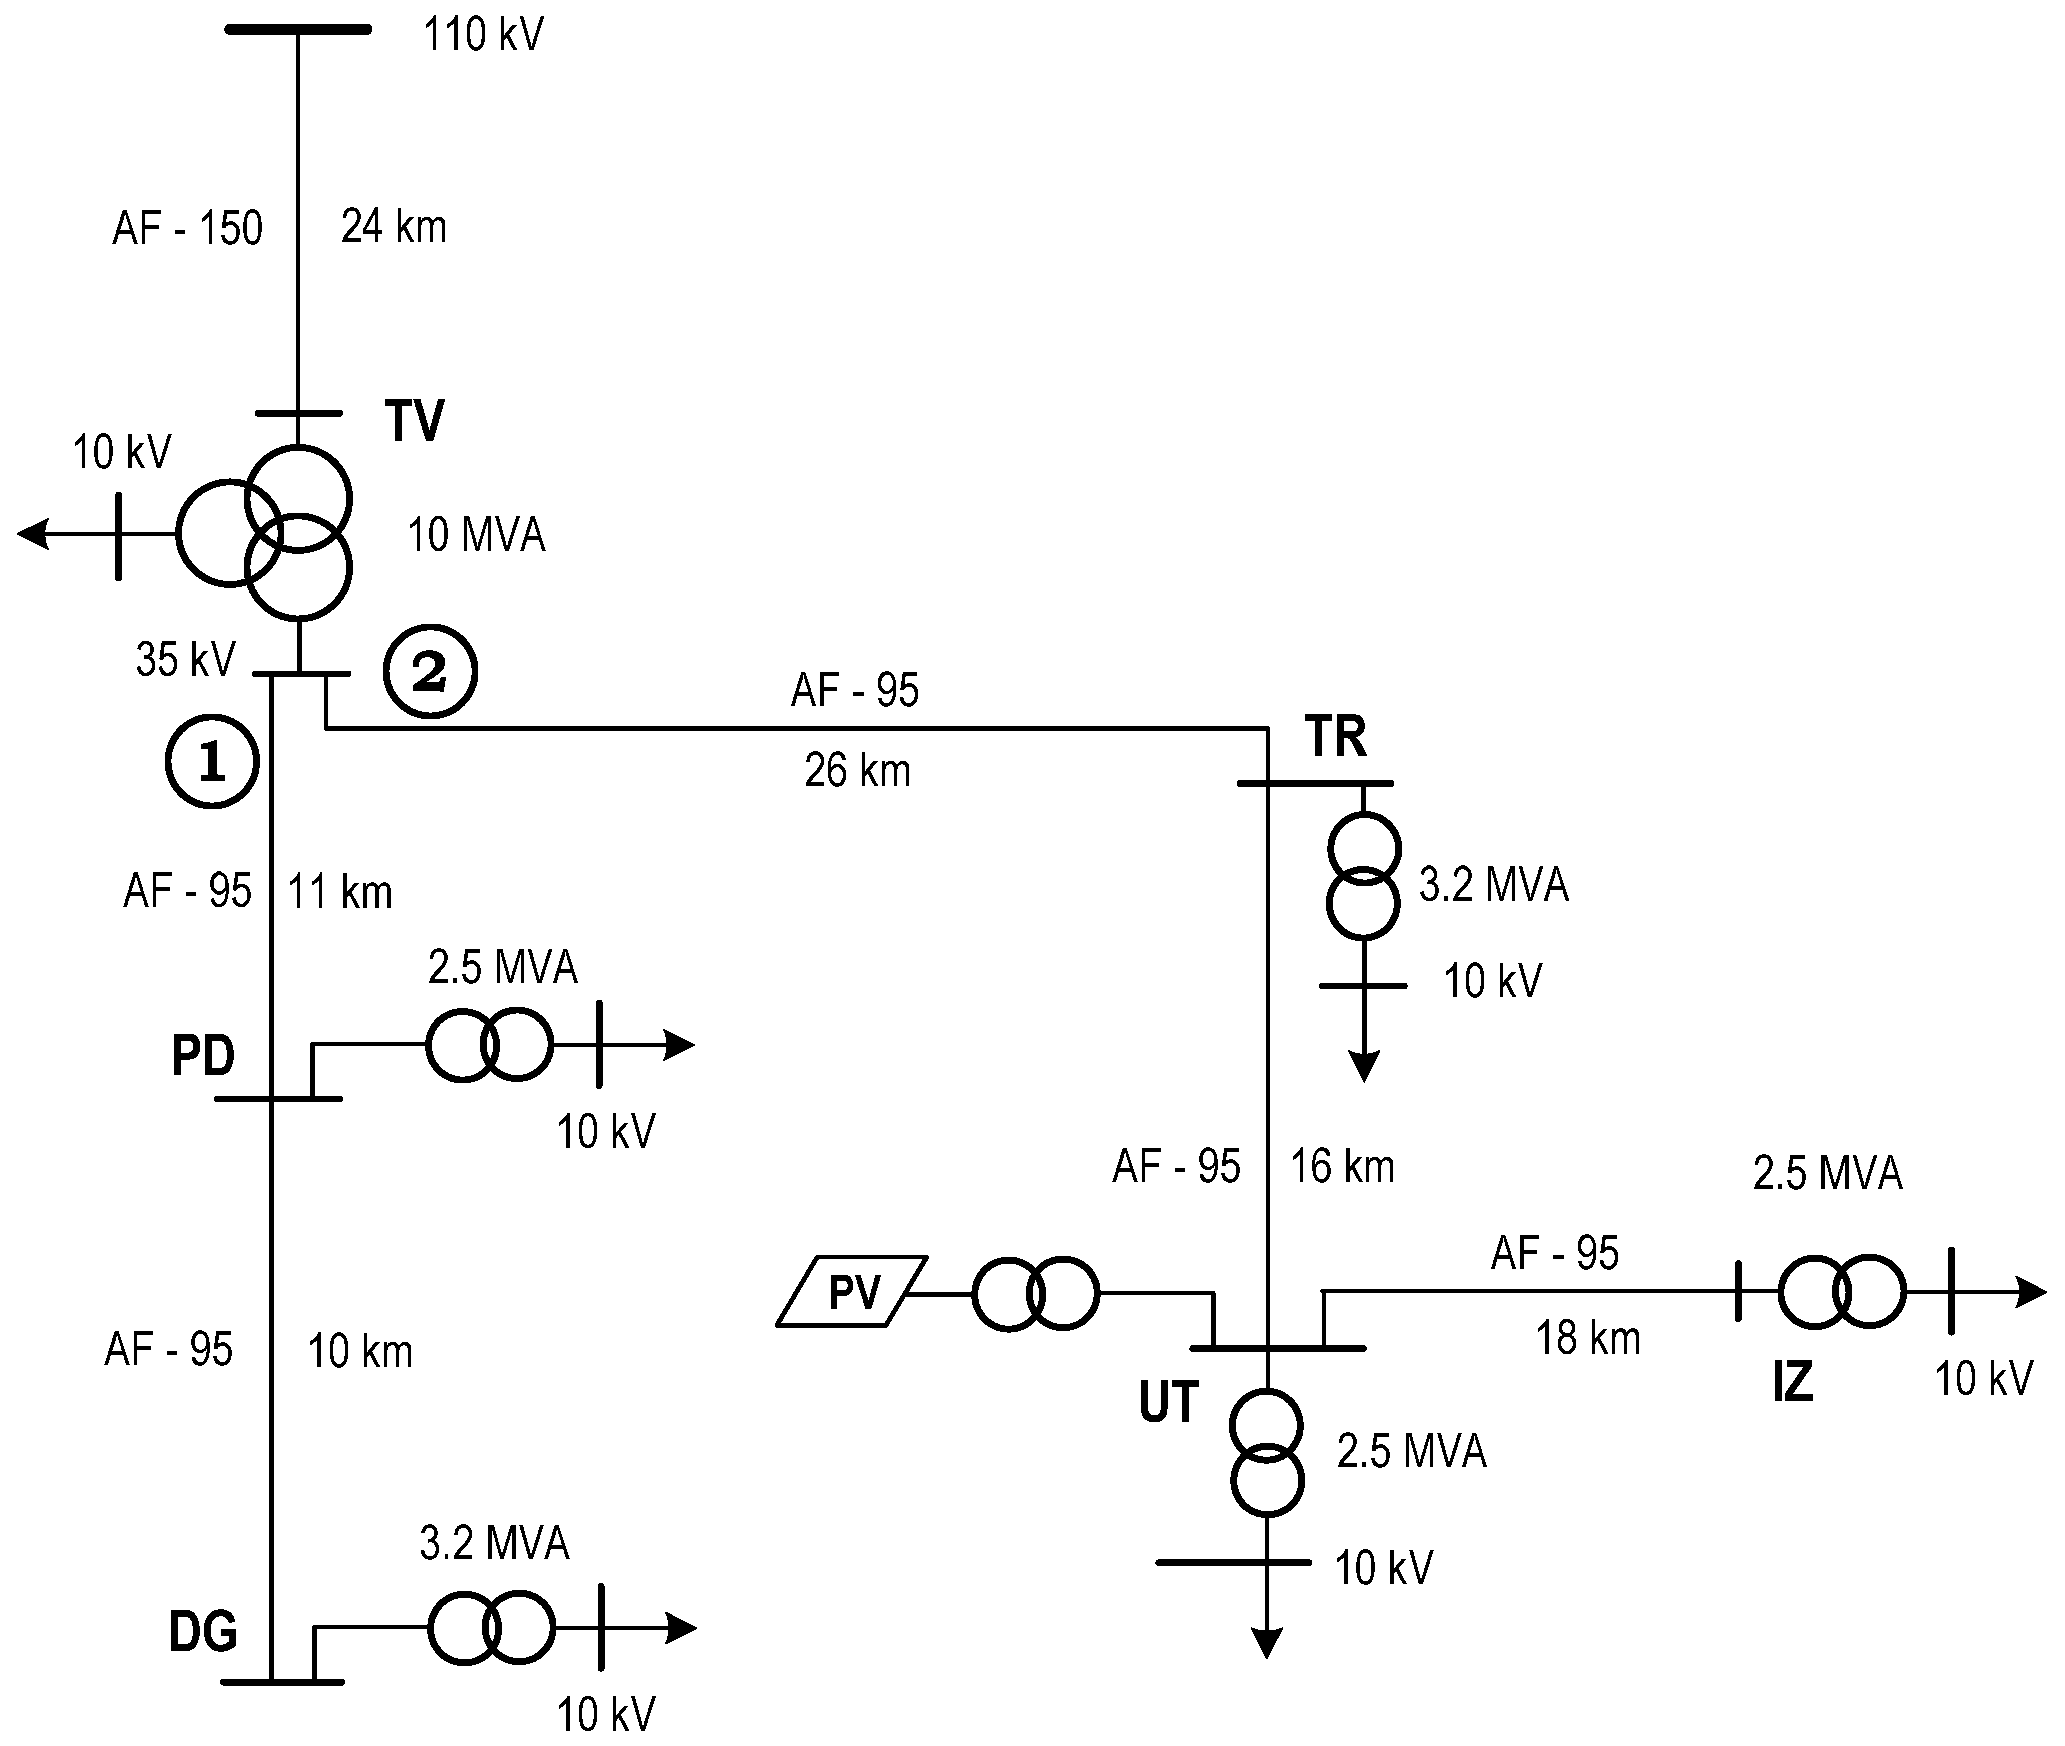
Since there are known constraints on performing simultaneous measurements of voltage fluctuations in electrical grid nodes, the authors have employed computer modelling to study voltage fluctuation propagation. Simulations of the operating conditions of the studied distribution grid were conducted using a model developed based on the free DAKAR software version [
19]. To solve the model state equations, the Newton–Raphson iterative method with controlled accuracy of the end solutions was used. An algorithm was developed to account for time-varying grid loads, enabling the simulation of variations in grid power flows throughout the day. This approach is discussed in more detail in [
20,
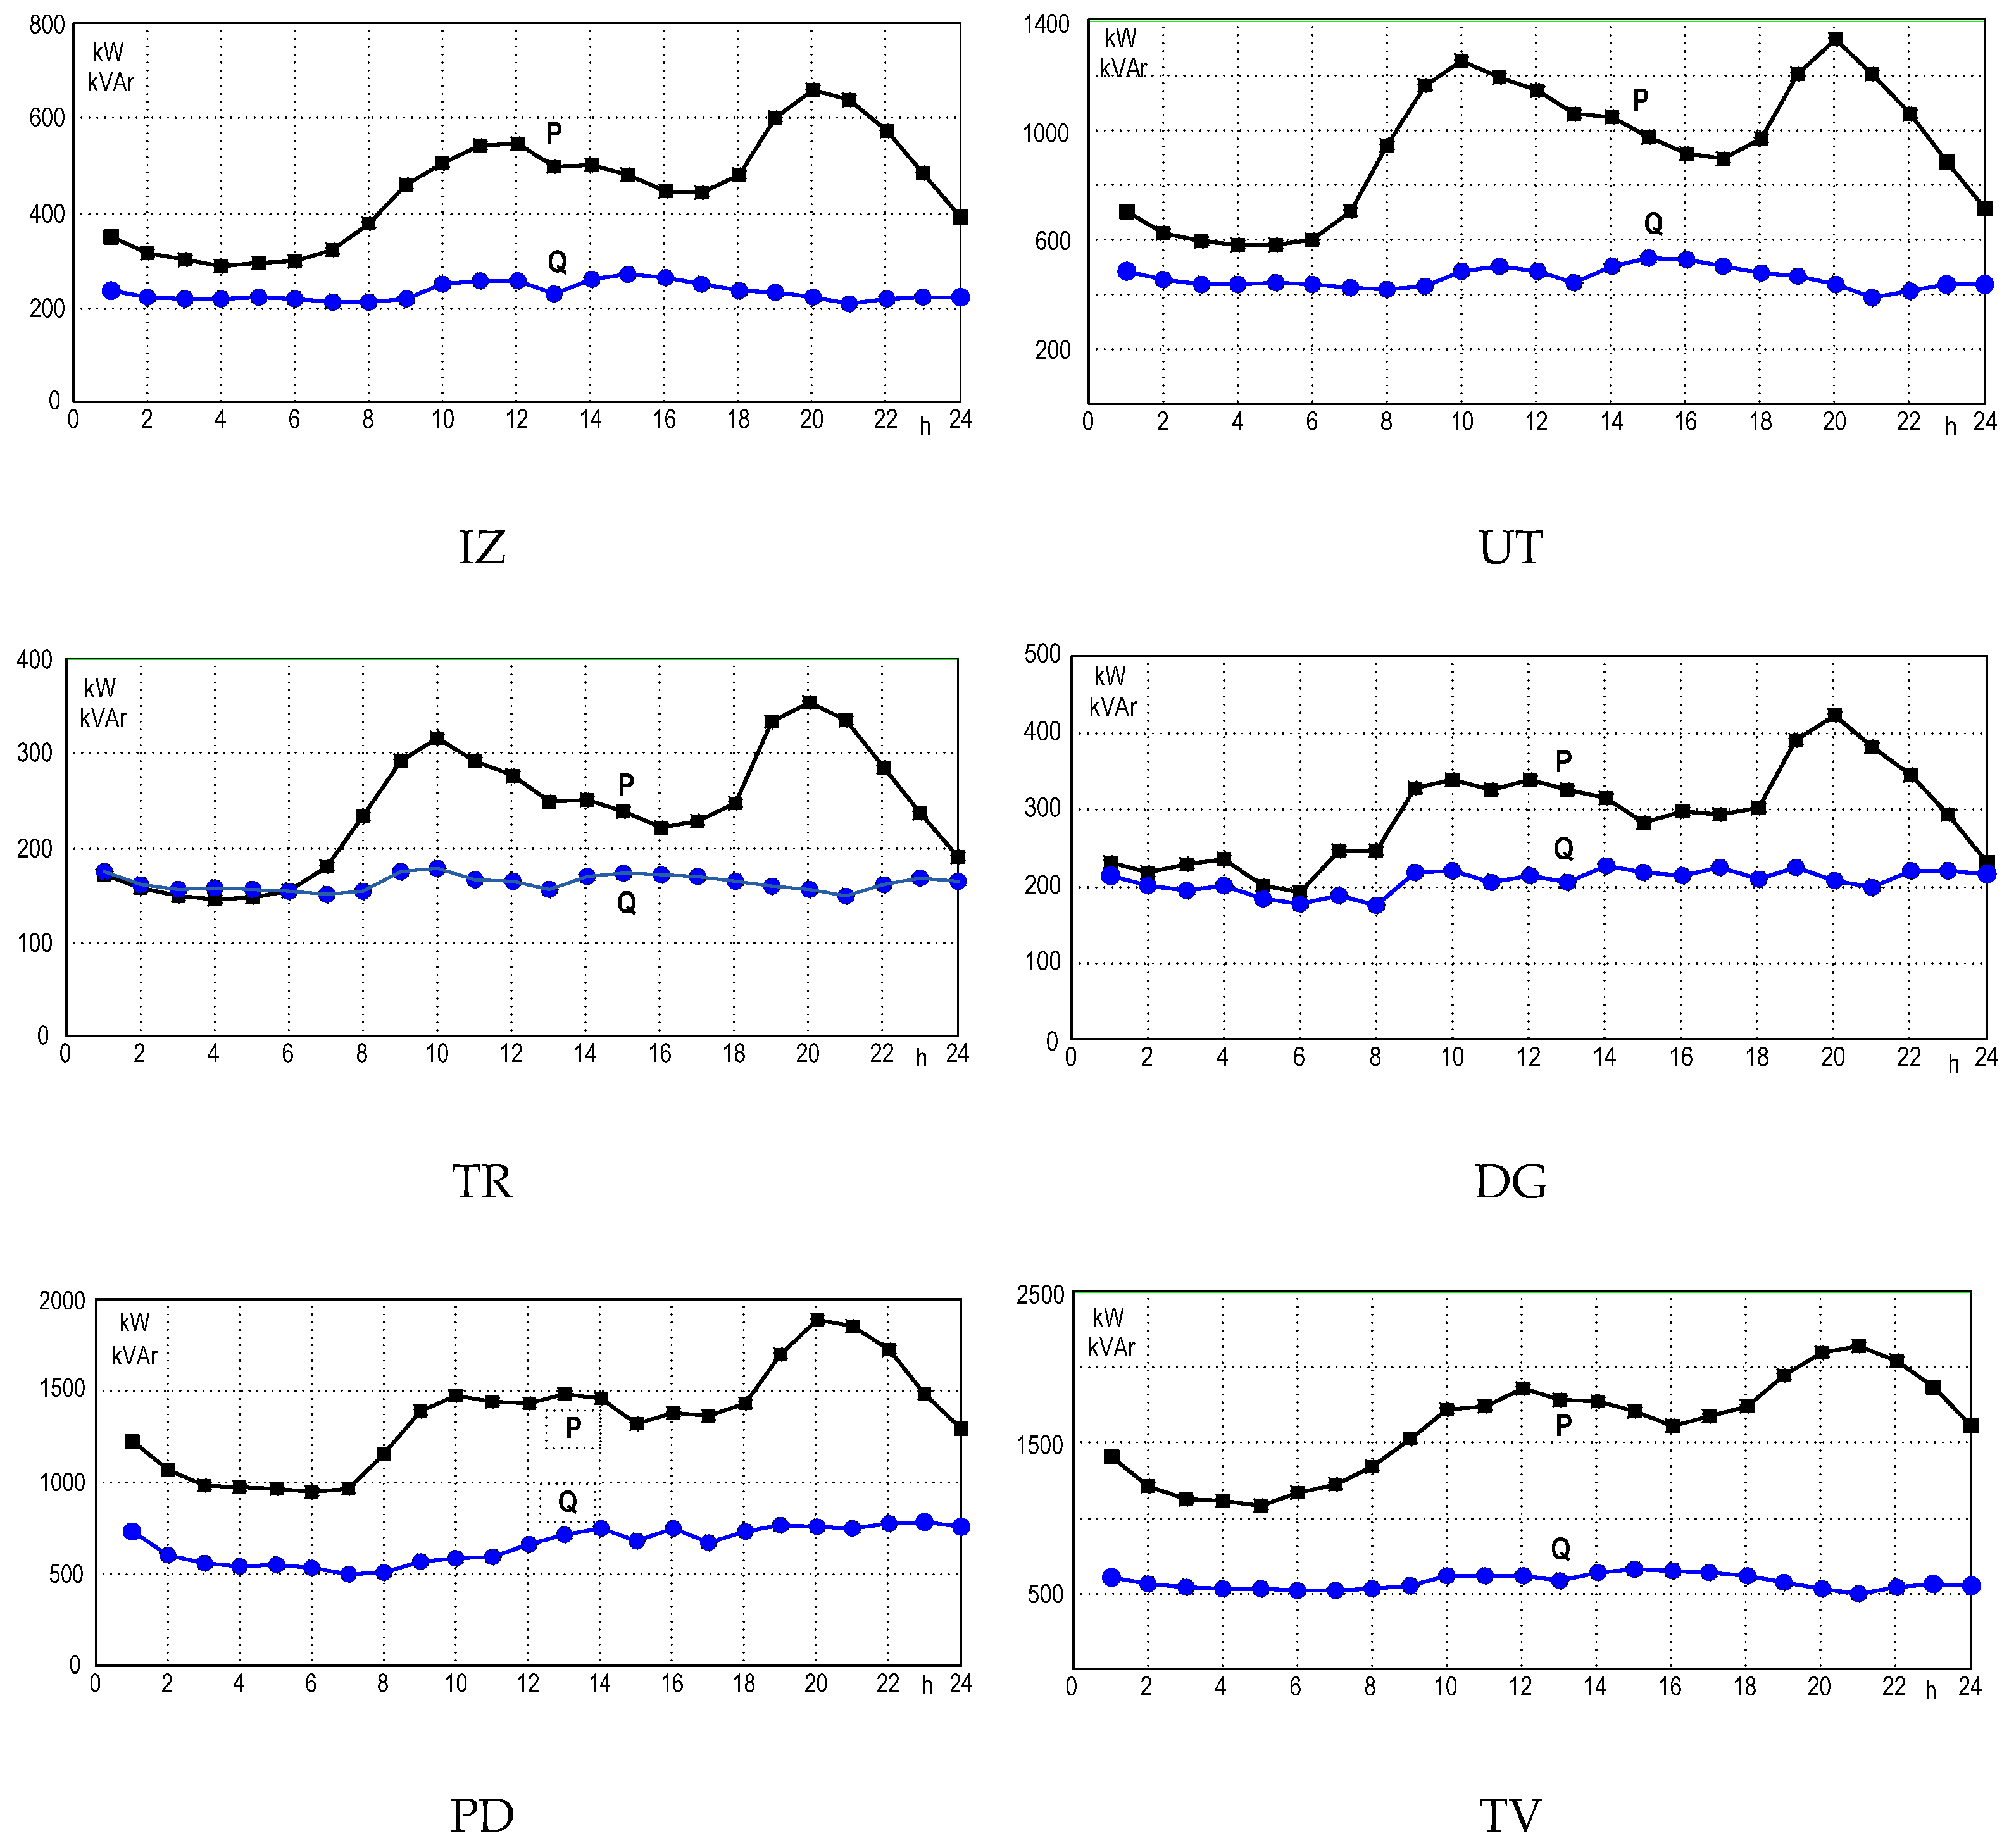
21]. The grid loads and PV output were provided to the model using numerical matrices representing 24-h averaged power profiles (see
Figure 5 and
Figure 6). As a result of these calculations, the daily profiles of voltage and power loss were obtained.
To study the impact of sudden changes
(see
Figure 5) in the PV power output on the distribution grid operating condition, a calculation approach was used, which ensures the PV power output changes at constant values of the loads of the substations at this time of the day. Since individual voltage fluctuations are considered as changes in the RMS voltage, as a rule, within 0.5–25 Hz, there is no physical distinction in what frequency they occur, considering the distribution pattern in the grid, i.e., the same pattern of amplitudes in the grid nodes will be for both lower and higher frequencies of changes. This means that the selected value of
will provide the same degree of reduction in the amplitudes of the entire spectrum of fluctuations. Therefore, voltage fluctuation on the busbars of the grid substations caused by the change in the PV power output can be estimated as the difference between two calculated states: with and without the
output power.
Calculations were performed for the following reactive power coefficients:
, 0, and
to study the impact of the PV reactive power on voltage fluctuations in the distribution grid.
Table 2 and
Table 3 present the results of modeling voltage fluctuations in the grid when changing the active power of RES at
and the specified above reactive power coefficients.
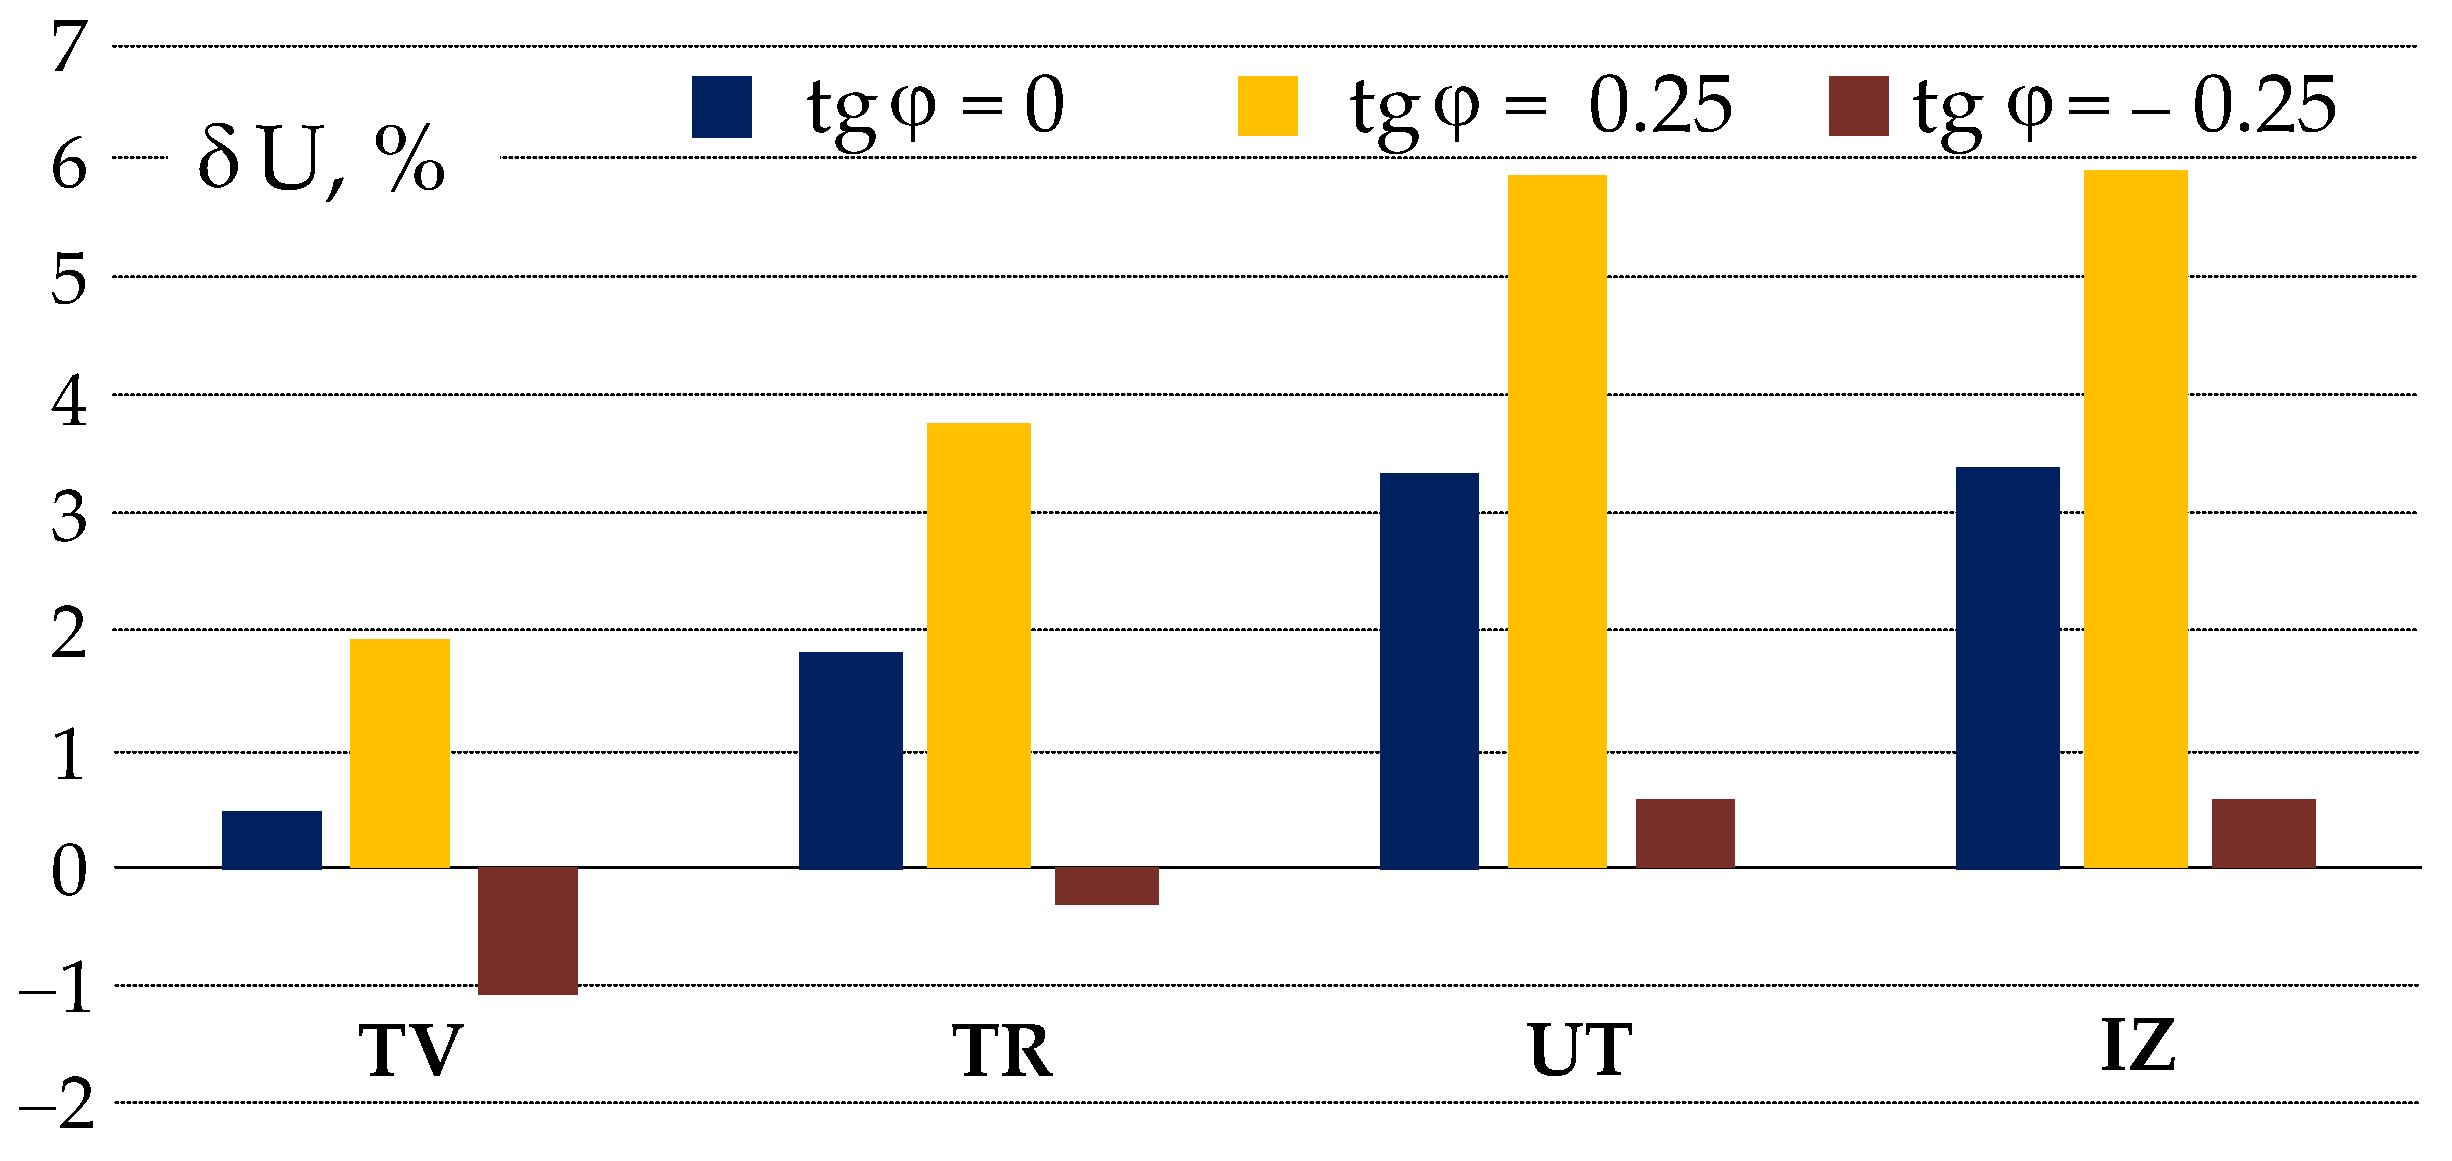
Voltage fluctuations comparative dependencies at 35 kV buses for substations of the second line of the grid on reactive power factors are shown in
Figure 7. When the PV operates with a capacitive reactive power factor (
), the voltage fluctuation magnitudes at the substation UT will be the highest compared to conditions when the reactive power factors are equal to 0 and
. We can observe the least voltage fluctuation magnitude at the inductive reactive power factor (
). The magnitude of voltage fluctuations decreases at upstream substations when factors of 0 and (
are applied, but with the inductive reactive power factor, the dependence is more complicated.
Figure 8 shows voltage fluctuations on the 35 kV buses of substations of the grid’s first feeder. The magnitudes of voltage fluctuations on the 35 kV bus of the TV substation are the same as those in
Figure 7, as the same operating conditions of the grid are simulated. The dependence of the voltage fluctuation magnitudes on the substation’s location in the first feeder clearly shows their rise with distance from the buses of the bulk power system substation TV. The further away from the TV substation, the higher the amplitude of voltage fluctuations on the buses of the local substation will be compared to the bulk system substation. The effect of voltage fluctuation magnification on the feeder substation buses does not depend on their source outside the feeder; it is determined solely by the grid line parameters and the loading of the local substations. However, it should be noted that the degree of magnification of voltage fluctuation amplitudes at the substations of the 1st feeder is insignificant. This can be seen by analysing the simulation results in
Table 3 and
Figure 8.
The studies show that PV operation with inductive reactive power can reduce the amplitudes of voltage fluctuations in the grid caused by sudden changes in the generated power. Let us analyse two typical tasks of reducing voltage fluctuations in the distribution network:
The analysis of the propagation of voltage fluctuations in the distribution grid carried out in the previous chapter shows that providing during the PV operation minimises voltage fluctuations at the point of PV connection. In this case, voltage fluctuations will not be observed at all downstream substations of this feeder. All at once, voltage fluctuations will increase at the PCC point and, as a result, at the substations of parallel feeder 1.
To minimise voltage fluctuations at the PCC point, the required PV reactive power factor should be . This PV operating condition eliminates voltage fluctuations on the parallel feeder 1, but voltage fluctuations downstream of the PCC point increase slightly.
The results of simulating the grid operating conditions are shown in
Table 4 and
Table 5 for the three described inductive reactive power coefficients of PV.
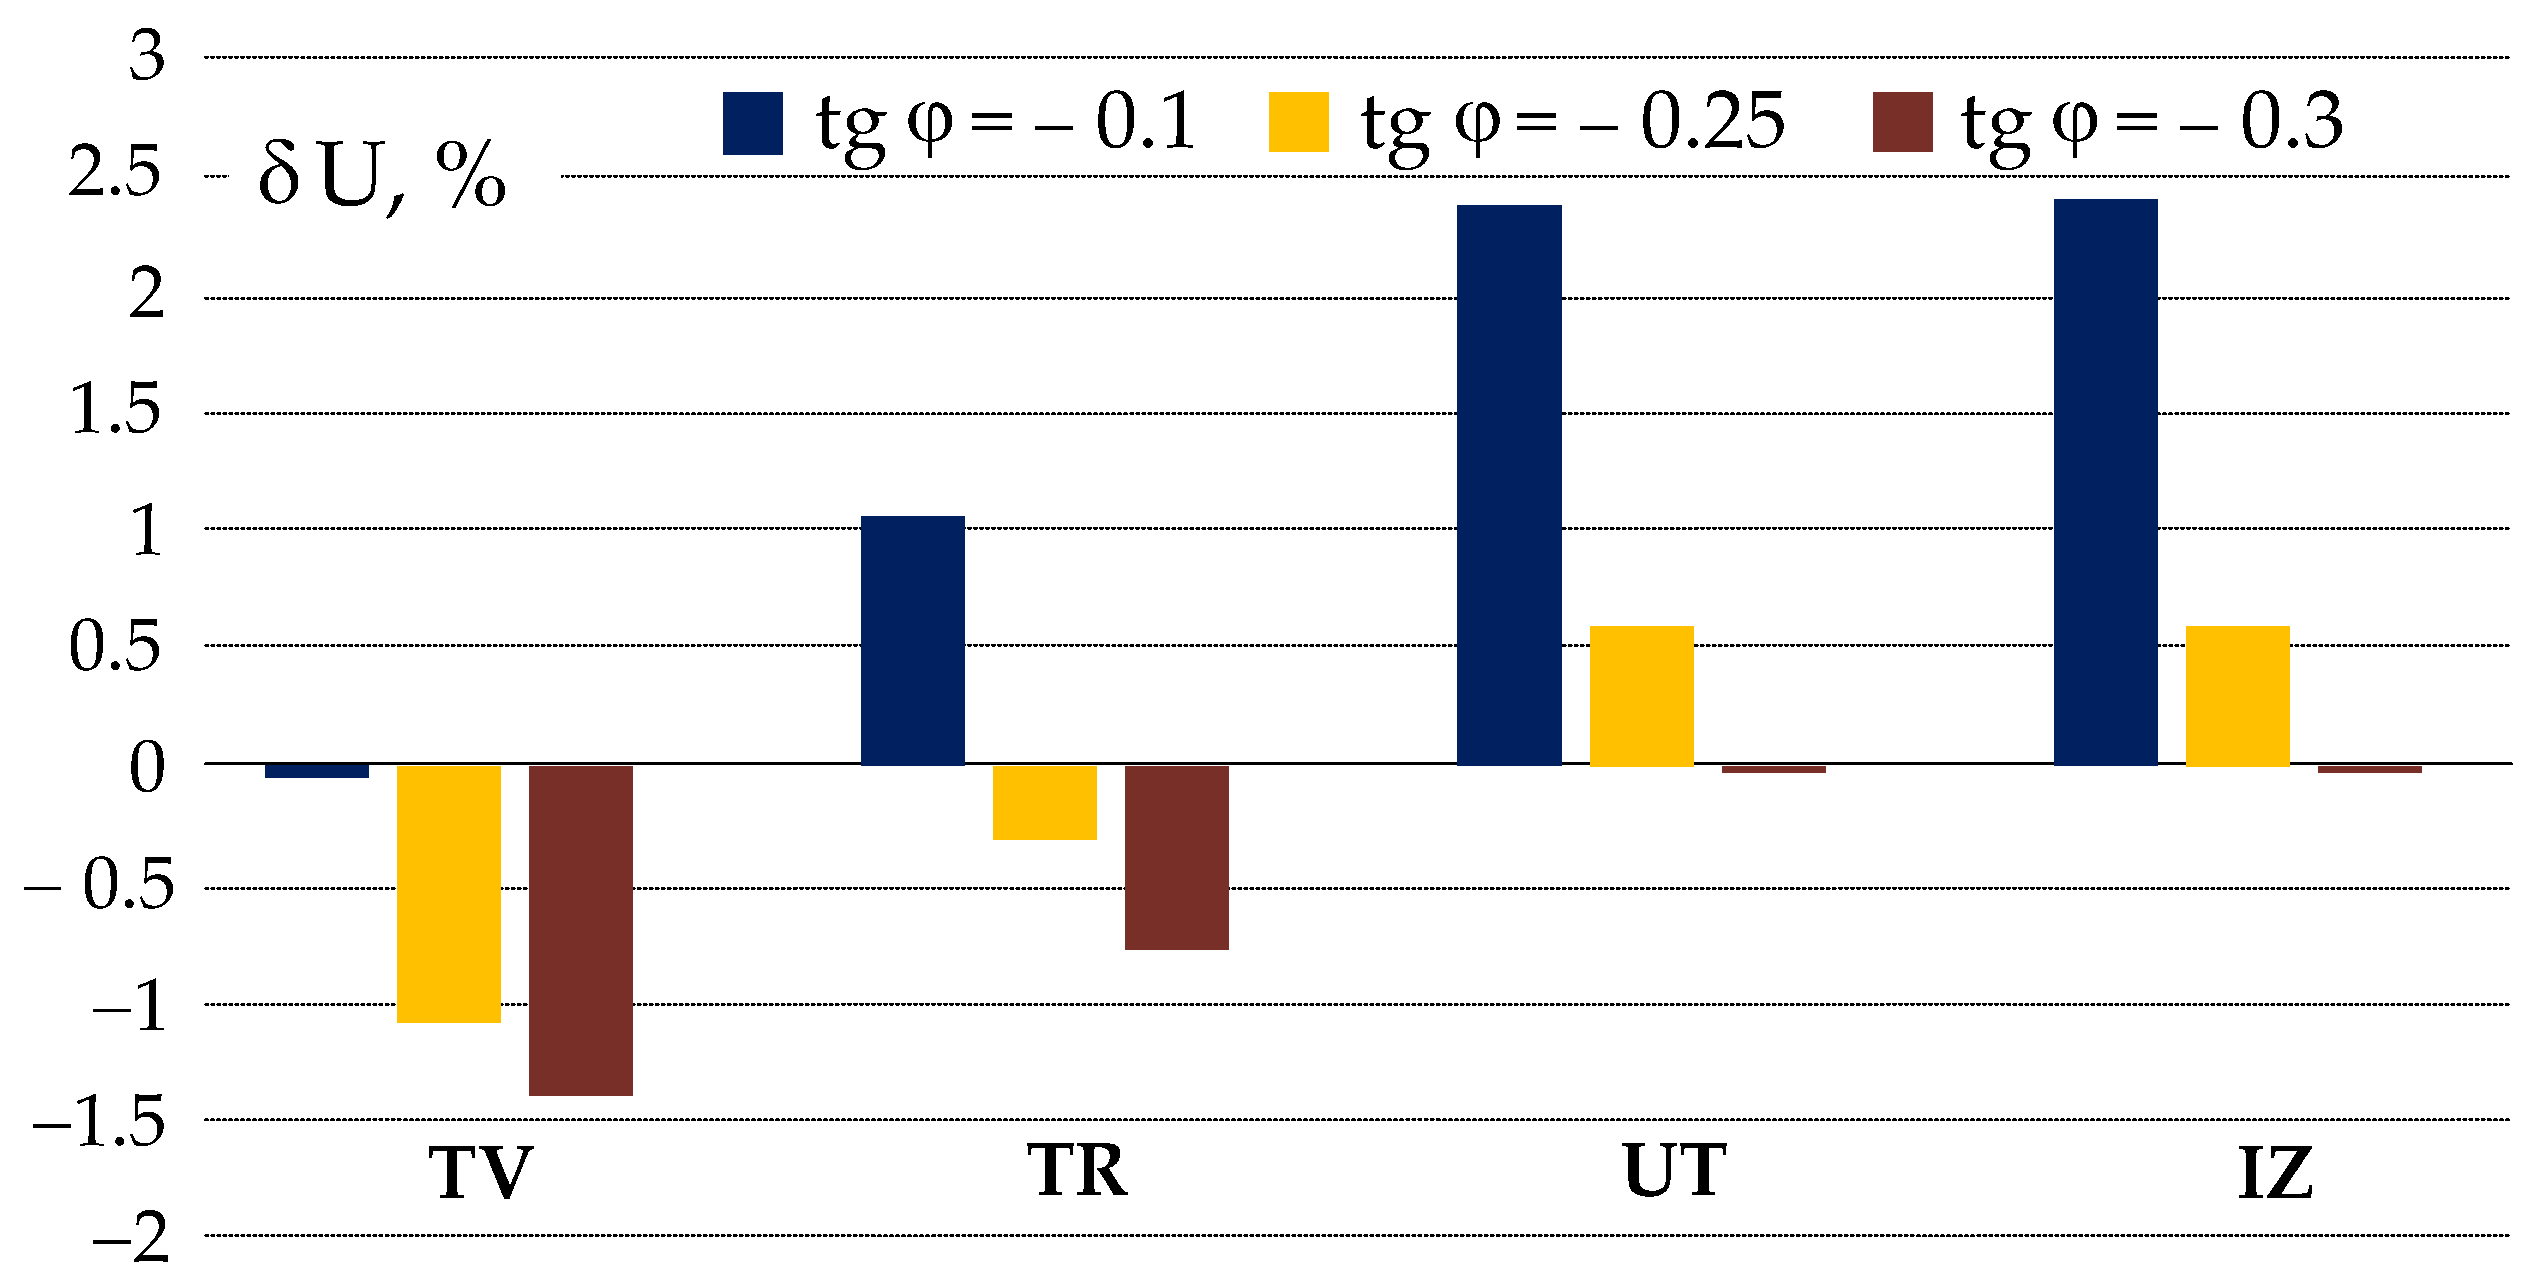
Comparative dependencies of the voltage fluctuations at 35 kV buses for second feeder substations of the grid under the analysed PV inductive reactive power factors are shown in
Figure 9.
Estimating the impact of the PV reactive power output on the voltage fluctuation magnitudes, it can be stated that with a decrease in the reactive power factor, the voltage fluctuation amplitudes on the buses of grid substations decrease. The proposed method can be used to calculate the required values of PV reactive power factors to reduce voltage fluctuations in a distribution grid. The method provides accounting for the parameters and operating conditions of a true distribution grid with renewable energy sources.
When implementing a RES reactive power control method to mitigate voltage fluctuations, the change in energy loss in the distribution grid must also be considered. The RES operation significantly changes the power flow values and directions in the distribution grid throughout the day. The maxima of the RES generation profiles, as a rule, have significant shifts relative to the maxima of the grid load profiles. As a result, the maximum values of grid power losses are not reliable indices for comparing the analysed operating conditions. The only energy loss during the analysed day should be considered when estimating the grid operating conditions. Simulating power flows in the distribution grid for the day was carried out for 24 operating conditions, accounting for the grid load profiles shown in
Figure 6 and the impact of PV generation. As a result, time dependencies of power flows and power losses for all network components were obtained. Next, the energy loss during 24-h grid operation is calculated as follows:
where—
is the 1-h mean load loss of active power in the
i-th grid component.
Table 6 presents the daily energy loss in the analysed distribution grid under the above operating conditions.
The energy loss in the lines of grid feeder 1 is a little dependent on the PV power output. However, energy loss in the lines of grid feeder 2 significantly depends on the PV reactive power output. As shown in
Table 6, as the PV reactive power factor increases, the energy loss in the distribution grid decreases.
Distribution grid modelling has shown the feasibility of using a RES inverter to control reactive power, aiming to reduce voltage fluctuations in the grid. However, when choosing an adequate degree of RES reactive power output for the selected distribution grid, it is necessary to consider certain contradictions; requirements to reduce voltage fluctuations by RES reactive power control lead to increased energy losses in the network. It should also be considered that voltage fluctuations on the bulk substation, caused by the RES operation on one of the feeders, will be magnified on the substations of other bulk substation feeders.
6. Conclusions
Commissioning wind and photovoltaic plants in the MV distribution grid creates some operational concerns related to voltage control and energy loss in grids. Distribution grid operators provide required voltage profiles at the grid buses using transformer on-load tap changers and controlled reactive power sources. Generally, these devices are controlled depending on the local substation bus voltage. As shown by the results of the review of specialised literature, carried out in the proposed article introduction, the use of supplementary devices for rapid reactive power compensation (such as SVC and STATCOM) is accompanied by additional costs, and, as practice shows, they are not used in medium-voltage grids. When wind and photovoltaic generation systems are equipped with inverters that provide reactive power control capabilities, grid operators can use the inverters to support optimal operating conditions through an adequate inverter control strategy that considers the fulfilment of local grid requirements.
The article reports a study of the impact of RES power factor on the voltage fluctuations in the medium-voltage distribution grid. An algorithm is proposed to estimate the newly designed RES impact on voltage fluctuations, considering load characteristics and the configuration of the distribution grid. The algorithm implements a fixed RES power factor control strategy where a fixed power factor is maintained during the RES operation.
As a result of the study, it is shown that the voltage fluctuation amplitudes in the grid caused by the RES operation in a grid node are also affected by additional power losses in the grid elements due to the RES power fluctuations. Moreover, the voltage fluctuation amplitudes in this case will be greater than those without considering this phenomenon. It is shown that voltage fluctuations will be amplified on the buses of substations located downstream from the RES installation node; however, in typical medium-voltage grids, this effect is relatively small. A slight magnification of voltage fluctuations is also observed at the collateral feeder nodes, and the amplification degree rises the further they are located from the PCC node.
The nature of the reactive power of the RES significantly impacts the pattern of voltage fluctuation propagation in the grid. If the RES operates with leading reactive power factors (capacitive reactive power), the propagation of voltage fluctuations is similar to when the RES operates with a unity power factor. But in this case, the voltage fluctuations in the grid increase significantly. Furthermore, the RES operation with lagging reactive power factors (inductive reactive power) results in a more complex pattern of voltage fluctuations, which is attributed to the opposing effects of the RES’s active and reactive power on the voltage drop in this case. Typically, voltage fluctuations in the grid are significantly reduced during the operation of RES due to the lagging reactive power factor. Determining the required value of the lagging reactive power factor provides the practical elimination of voltage fluctuations at a given grid node. Minimising voltage fluctuations on the substation bus that feeds several feeders (the PCC point) is of practical interest. This way, we can eliminate voltage fluctuations on the buses of collateral feeders due to RES operation on one of them.
However, the operation of a RES with a lagging power factor aiming at the mitigation of voltage fluctuations can be limited by often overlooked operational reasons, such as a rise in reactive power requirement with a decrease in the X/R ratio of the grid; requirements of network operators to maintain a power factor equal to unity; requirements to reduce grid energy losses. Selecting the optimal value of the inductive reactive power factor of
is always specified by a compromise between the desired degree of mitigating voltage fluctuations and the effect of increasing energy losses in the network. Usually, the grid operator manages the allowable value of
for grid load nodes. The degree of mitigating fluctuations, as shown in the analytical examination in
Section 3, depends on the structure and parameters of the grid. Therefore, selecting the operating setting of
for mitigating voltage fluctuations should be carried out within the restrictions set by the grid operator. Further, depending on the requirements for mitigating voltage fluctuations in the specified grid nodes, the operating setting of
is selected. As shown in the example considered in the article, to compensate for voltage fluctuations in the PCC node, and, as a consequence, in the load nodes of parallel feeders of the substation, it is sufficient to maintain a relatively small setting of the negative reactive power factor (
). In electrical grids with a high relative active resistance (this applies to low-voltage electrical grids), the efficiency of mitigating voltage fluctuations by the inductive power of RES is significantly lessen, since to achieve the required effect, the source inductive power has to be notably increased, which means that it is forced to set sizeable margins into the RES inverter rating capacity and rising grid active power losses.
The presented case study analyses the nature of the propagation of voltage fluctuations in a real medium-voltage distribution grid with an RES and the impacts that should be considered when choosing the capacity and location of the RES in the grid. The amplitude spectrum of voltage fluctuations depends on the characteristics of the RES itself and the random variations of regional climatic attributes. According to current standards, the acceptability of irregular voltage fluctuations in distribution grid nodes is estimated based on two consolidated indices—short-term and long-term flicker severities. So, from the point of future research, there is a practical interest in developing a model for estimating voltage flicker propagation in the distribution grid with a RES based on measurements carried out only in the RES node.
