Abstract
Optimizing the power allocation and capacity configuration of hybrid energy storage systems (HESS) is crucial for enhancing grid stability, power quality and renewable energy utilization in wind–solar complementary microgrids. However, the conventional configuration methods exhibit inaccuracy and low reliability. To achieve the optimal capacity configuration of HESS in wind–solar complementary microgrids, a power allocation strategy and a capacity optimization configuration model for HESS consisting of vanadium redox flow batteries (VRBs) and supercapacitors (SCs) were proposed based on parameter-optimized variational mode decomposition (VMD). Firstly, the number of mode decomposition (K) and the penalty factor (α) of VMD were optimized using the random walk grey wolf optimizer (RW-GWO) algorithm, and the HESS power signal was decomposed by RW-GWO-VMD. Secondly, an optimal capacity configuration model was formulated, taking into account the whole life cycle cost of HESS, and particle swarm optimization (PSO) algorithm was applied to optimize HESS capacity while satisfying operational constraints on charge/discharge power, state of charge (SOC) range, and permissible rates of load deficit and energy loss. Thirdly, the optimal capacity allocation was obtained by minimizing the whole life cycle cost of HESS, with the frequency division threshold N serving as the optimization parameter. Finally, comprehensive comparison and analysis of proposed methods were conducted through simulation experiments. The results demonstrated that the whole life cycle cost of RW-GWO-VMD was 7.44% lower than that of EMD, 1.00% lower than that of PSO-VMD, 0.72% lower than that of AOA-VMD, and 0.27% lower than that of GWO-VMD.
1. Introduction
Renewable energy power generation based on wind and solar energy has attracted considerable attention around the world [1]. Nevertheless, the randomness, intermittence and periodicity of wind and solar energy challenge the stability of the power grid and power quality [2,3]. Recently, microgrids possessing advantages of flexible, modular and localized attributes emerged as a solution [4,5], but the output power of renewable energy generation and load consumption are inherently dynamic, making continuous balance impossible, which will influence the safe operation of microgrids. The application of energy storage systems (ESS) can effectively mitigate the variability of wind and solar power generation [6,7,8]. However, single ESS often have inherent limitations [6,9]. For instance, vanadium redox flow batteries (VRBs) have high energy density but struggle with rapid charge/discharge cycles [9]. Supercapacitors (SCs) excel in high-power, but their energy density is low [10]. Hybrid energy storage systems (HESS) combining VRBs and SCs create a synergistic solution for applications requiring both long-duration storage and rapid power response [11,12].
To fully leverage the advantages of different energy storage components, optimal power allocation and capacity configuration are the cornerstones of HESS to ensure grid stability, efficiency and longevity [13]. Scholars have extensively studied power and capacity allocation strategies to optimize performance, cost and reliability [14,15,16]. The primary approaches include filtering decomposition [17,18], Fourier decomposition [19], wavelet decomposition [20,21] and mode decomposition [22,23,24]. Filtering decomposition such as low-pass filters and high-pass filters are generally used to allocate power in HESS for smoothing renewable energy fluctuations [25,26], but there is a delay in the low-pass filter process, which will distort power allocation in HESS, and lead to inefficient operation or even instability. Jiao et al. [27] found that power allocation based on low-pass filters resulted in excessively large capacity values. The Discrete Fourier Transform (DFT) approach for HESS power allocation has a key limitation: loss of temporal information due to its frequency-domain nature [28]. Yun et al. [29] employed Wavelet Packet Decomposition (WPD) to split renewable energy output power into high-frequency and low-frequency components for optimal allocation between batteries and SCs. Nevertheless, the performance of WPD is highly sensitive to the choice of wavelet basis function [21]. Additionally, wavelet analysis is computationally intensive, which can be a critical bottleneck for real-time HESS power allocation [20]. Empirical mode decomposition (EMD) proposed by Huang could self-adjust according to the time-scale attributes of data for signal decomposition [30]. Tian et al. [31] and He et al. [32] applied EMD to achieve the active power distribution, but EMD has a critical limitation of mode mixing, where components with similar frequencies are improperly separated during recursive decomposition [33]. Furthermore, researchers developed ensemble-based EMD variants such as EEMD [34], CEEMD [35] and CEEMDAN [36]. These methods can improve frequency separation for HESS by introducing controlled noise during decomposition, but EMD and the improved methods rely entirely on data-driven decomposition.
To solve the above problems, variational mode decomposition (VMD) excelling in local optimization was proposed by Dragomiretskiy [37], which makes it particularly effective for handling anti-noise robustness and non-stationary burst signals while mitigating mode aliasing [6,38]. However, VMD is not model-adaptive, and the decomposition results heavily rely on the number of mode decomposition (K) and the penalty factor (α), which should be set in advance [39]. This means that the performance of VMD heavily depends on the parameters of K and α. The traditional methods such as the maximum central frequency criterion were generally used to optimize VMD parameters [38]. However, there are no clear measurement criteria; they are subjective. Several researchers proposed entropy-based optimizati [6,38] to automatically determine the optimal parameter for VMD [40]. This approach minimizes the entropy measures that quantify mode compactness, sparsity, or information uniformity, leading to more adaptive and accurate signal decomposition [40,41,42,43]. Xiao et al. [38] employed adaptive VMD to determine the decomposed mode number and grid-connected modes and allocated power to SCs and lead-carbon batteries accordingly. Zhang et al. [44] used a genetic algorithm (GA) to optimize the selection of K and α and improve the decomposition efficacy. Huang et al. [45] and Gao et al. [46] applied the whale optimization algorithm (WOA) and the sparrow search algorithm (SSA) to optimize the parameters of VMD for HESS power decomposition. Zhang et al. [47] applied the improved pelican optimization algorithm (IPOA) to adjust the parameter of VMD, enabling accurate distribution of power for different storage types. However, algorithms like WOA, SSA, and IPOA often face challenges such as long computation times, convergence to local optima, or even failure to find viable solutions, prompting the need for more efficient approaches.
In contrast, the grey wolf optimizer (GWO) algorithm, proposed by Mirjalili et al. [48], is less prone to falling into local optima and possesses high global search capabilities. With fewer parameters, GWO is easier to adjust and control, making it more convenient and efficient for practical applications. Elsaid et al. [49] utilized GWO to address the challenges of Intrusion Detection Systems in efficiently handling redundant features, significantly boosting detection accuracy and reducing computational overhead. Nevertheless, basic GWO may suffer from premature convergence and sensitivity to parameter settings. To eliminate the limitations, Shaikh et al. [50] used a chaotic map to improve the ability of GWO to find the best solutions and achieve faster convergence. The Improved Chaotic Grey Wolf Optimization (ICGWO) algorithm was applied to enhance wireless sensor networks coverage and connectivity. The findings confirmed that ICGWO efficiently improved the coverage and connectivity. Dagal et al. [51] applied the Hierarchical Multi-Step Gray Wolf Optimization (HMS-GWO) algorithm to specific energy systems optimization problems. The results demonstrated that HMS-GWO effectively optimized the operation of the IEEE 30-bus system, demonstrating superior performance compared to other algorithms.
The random walk grey wolf optimizer (RW-GWO) algorithm combines the robust exploitation–exploration balance of GWO with enhanced global search capabilities through random walk dynamics, mitigating stagnation in local optima [52]. Therefore, RW-GWO outperforms basic GWO and several established optimization techniques including Particle Swarm Optimization (PSO), Aquila Optimization Algorithm (AOA), Ant Colony Optimization (ACO), Spider Monkey Optimization (SMO), and Whale Optimization (WO) in terms of solution accuracy as well as convergence speed for complex multimodal problems, motivating its selection for this work.
In this paper, a RW-GWO-optimized VMD approach was developed for power allocation to mitigate wind–solar fluctuation-induced instability in wind–solar complementary microgrids. HESS capacity was determined based on the allocation strategy, with the optimization objective being whole life cycle cost reduction. To validate the proposed strategy’s feasibility, we conducted comparative analyses against EMD, PSO-VMD, AOA-VMD and GWO-VMD approaches. The principal contributions of this work are as follows:
- (1)
- A power allocation strategy based on RW-GWO-VMD was proposed. Compared with PSO, AOA and GWO, RW-GWO demonstrated superior search speed and optimization accuracy, improving the mode-matching accuracy of VMD.
- (2)
- Using the whole life cycle cost of HESS as the objective function, the dividing point N was used as the optimization variable to obtain the optimal capacity configuration results. The configuration costs for HESS are significantly reduced.
- (3)
- An optimization model was established to determine HESS capacity requirements using normalized daily operational data. Case study analysis showed that the proposed approach reduced the whole life cycle cost of HESS by 7.44%, 1.00% and 0.72% compared with EMD, PSO-VMD and AOA-VMD, respectively, providing valuable engineering insights for HESS capacity planning.
The paper is structured as follows: Section 2 presents the structure of microgrids, Section 3 introduces the proposed power allocation strategy for HESS, Section 4 establishes the capacity optimization configuration model for HESS, Section 5 introduces the model solution methods, Section 6 presents a comparative analysis of HESS power allocation strategies and capacity configuration results, and Section 7 is the conclusion.
2. Structure of Microgrid
The system architecture is illustrated in Figure 1. As shown in Figure 1, the wind–solar hybrid off-grid microgrid system integrated wind turbines, photovoltaic (PV), a central controller, an electrical load and a HESS that consists of VRBs and SCs.
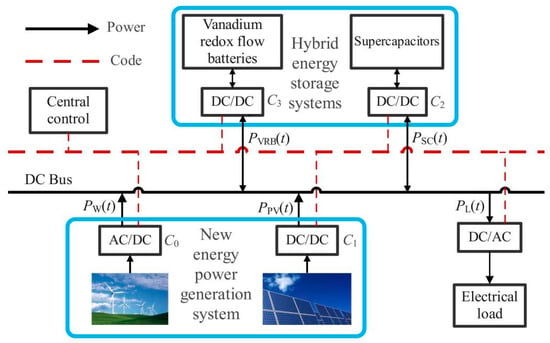
Figure 1.
Structure of the microgrids composed of wind–solar generation and HESS.
As shown in Figure 1, PV, VRBs and SCs are interfaced with the DC bus via DC/DC converter, while an AC/DC converter is applied to connect the wind system. The electricity load is connected to the DC bus through a DC/AC converter. The unbalanced power between the output of wind–solar power generation system and the electricity load is smoothed by HESS. The power relationship in Figure 1 can be expressed by Equations (1) and (2):
where PPV(t) and PW(t) are the PV and wind output power at time t, respectively; PHESS(t) is the compensation power of HESS at time t; PL(t) is the power of the electricity load at time t; PVRB(t) and PSC(t) are the charging/discharging power of VRBs and SCs at time t, respectively; C0 is the AC/DC converter, and C1, C2 and C3 are the DC/DC converters.
The HESS charges when wind–solar generation exceeds load demand and discharges when generation falls short, maintaining continuous microgrid operation [53].
3. Power Allocation Strategy
3.1. Principle of VMD
VMD adaptively decomposes non-stationary signals into quasi-orthogonal Intrinsic Mode Functions (IMFs) through constrained variational problem formulation and solution. It is realized by determining the center frequency and bandwidth of modes through frequency domain optimization.
According to the literature [42], the constrained variational model is formulated as follows:
where {uk} represents the IMFs derived from decomposing the original signal; {ωk} denotes the central frequency of IMFs; K is the number of decomposition of IMFs; δ(t) is the Dirac distribution; f(t) is the input signal.
The constrained optimization problem is then reformulated as an unconstrained problem by introduction of a quadratic penalty term and Lagrange multipliers for solution derivation:
where α is the penalty factor; λ is the Lagrange multiplier that enforces the satisfaction of reconstruction constraints.
The Alternating Direction Multiplier Method (ADMM) is adopted to iteratively update. The updated mode function and their center frequencies are obtained as follows:
where is the Wiener filter of the current residual; represents the center frequency of the current sub-modular function.
Update Lagrange multipliers:
The loop iterates until convergence:
where e represents the convergence parameter.
The final output is a K mode, uk(t) and a center frequency.
3.2. Random Walk Grey Wolf Optimizer Algorithm
3.2.1. Grey Wolf Optimizer Algorithm
GWO is an innovative metaheuristic algorithm inspired by the social hierarchy and cooperative hunting strategy of grey wolf packs [54]. GWO employs a distinctive hierarchical structure centered on three elite solutions (α, β, δ) to guide large-scale optimization. The algorithm classifies candidate solutions into four ranks—α (best), β (second-best), δ (third-best), and ω (remaining solution)—where the ω solution was iteratively improved by tracking the leading wolves. The hunting strategy of grey wolves consists of three sequential phases: encircling prey, pursuing the target, and launching the final attack.
The prey-encircling behavior of wolves is mathematically represented by the following governing equations:
where t is the number of iterations; is the position of prey at iteration; is the position of wolf at iteration; A and C are the coefficient vectors; a is a vector that linearly decreases from 2 to 0 across iterations; and are the random vectors within the range [0, 1].
After encircling its prey, grey wolves hunt the prey to update the equation as follows:
where , and are the positions approximated by α, β and δ solutions (wolves).
Gray wolves conclude their hunt when the prey ceases movement, as influenced by A ∈ [−2a, 2a]. This is primarily due to the reduction of a in Equation (11). When |A| ≥ 1, grey wolves distance themselves from the prey to conduct a global search; conversely, when |A| < 1, the grey wolf pack approaches the prey and finally completes it.
3.2.2. Random Walk
Random walk represents a stochastic process comprising successive random steps in mathematical space [52].
where si represents a random step drawn from an arbitrary probability distribution.
The transition between successive random walk positions follows the relation:
Consider a wolf beginning at position x0 and reaching final position xn after n steps; its random walk trajectory can be mathematically expressed as:
where αi > 0 is a parameter that controls the step size si in each iteration.
3.2.3. Random Walk-Based GWO
During each iteration, a random walk is selectively applied to the leading wolves (α, β and δ), with parameter αi implemented as a vector that linearly decreases from 2 to 0 over successive iterations. Random walk is incorporated in GWO, and the step size is drawn from a Cauchy distribution.
The Cauchy distribution possesses undefined variance, enabling occasional long-range displacements that mitigate stagnation convergence. This heavy-tailed perturbation mechanism enhances the exploratory capability of leader agents (α, β, δ wolves), thereby providing superior search-space guidance for subordinate ω-agents. Critically, no additional objective function evaluations are introduced, preserving computational equivalence with the baseline algorithm [52].
The pseudo code of RW-GWO is described in Figure 2.
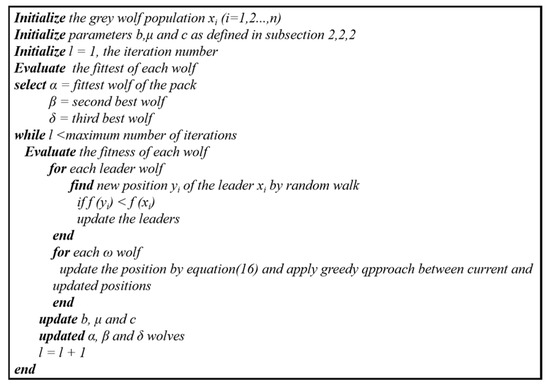
Figure 2.
Pseudo code of RW-GWO.
As defined in the literature of GWO, all the wolves of the pack update their position with the help of leading wolves (α, β, δ). Therefore, it is essential that the leading wolves should be the best (in terms of fitness) during an iteration to update the position of each wolf of the pack. Otherwise, GWO may suffer from premature convergence due to over-reliance on the leadership hierarchy. In RW-GWO, the leading wolves explore the search space by random walk, and then omega wolves update their position by following them. RW-GWO enhances robustness in complex landscapes by integrating randomness, making RW-GWO more effective in avoiding local optima while maintaining convergence precision.
3.3. Optimization of VMD Parameters by RW-GWO
Researchers have employed center frequency analysis to identify optimal K, examining IMF frequency distributions across different K settings [42]. However, the technique exhibits subjectivity and does not incorporate considerations of the α value.
In this study, RW-GWO was used to optimize VMD parameters by minimizing envelope entropy as its fitness criterion. Envelope entropy is a characteristic index used to quantify the complexity of the signal envelope. The range [2, 19] of Kc ensures sufficient decomposition fidelity for most signals while avoiding over-decomposition or under-decomposition, as validated in [42] for similar applications. The range [100, 3000] of αc balances noise robustness and mode specificity, aligning with recommendations from [42] for non-stationary signal analysis.
Table 1 presents the parameter configurations for GWO and RW-GWO optimized VMD, while Figure 3 illustrates the algorithmic workflow. The processes are as follows: (1) Generate initial population of grey wolves and evaluate their fitness. (2) Update the leaders α, β and δ with random walk and other wolves ω by Equation (16). (3) Apply a greedy approach between old and updated positions of grey wolves. (4) Determine whether the maximum number of iterations is reached; if not, return to step 2; if reached, output the optimal position and best fitness value.

Table 1.
GWO and RW-GWO optimization of VMD parameter settings.
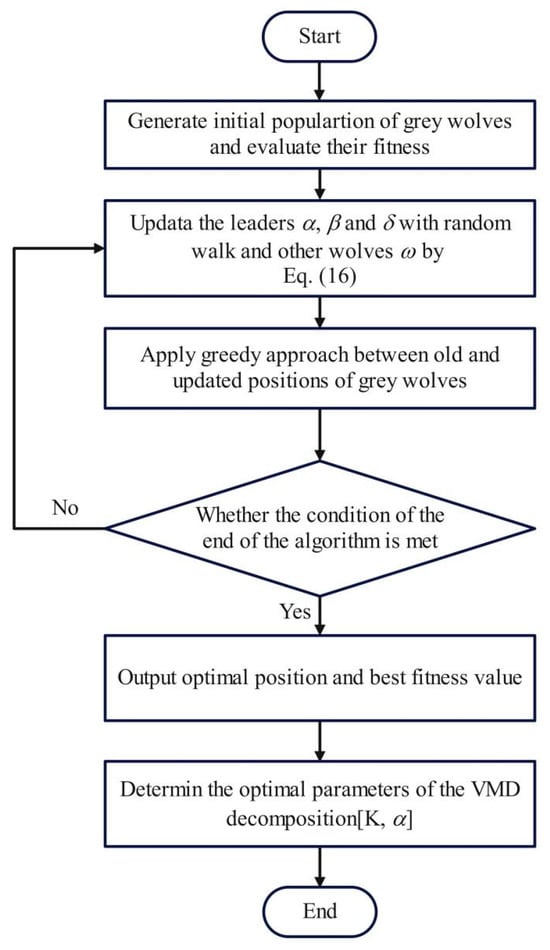
Figure 3.
RW-GWO optimization of VMD parameters flowchart.
In Table 1, x denotes the population size; Maxiteration represents the maximum iterations count; Kc and αc represent the feasible range bounds for decomposition mode number and penalty factor, respectively.
3.4. Power Allocation Strategy for HESS
The reconstructed signal is separated into high-frequency components (sum of IMFs 1 to N) and low-frequency components (sum of IMFs N + 1 and higher). Based on the operational properties of HESS components, VRBs are assigned the low-frequency VMD components while SCs handle the high-frequency portions. The power allocation strategy can be mathematically represented as:
where R1 and R2 represent the charge/discharge power commands for the SCs and VRBs, respectively.
4. Capacity Configuration Model of HESS
4.1. Charge/Discharge Model of HESS
When PPV(t) + PW(t) > PL(t), the HESS charges, and the relationship equation between the remaining energy of HESS and the charging power is given in Equation (21) [55]:
when PPV(t) + PW(t) < PL(t), the HESS discharges, and the relationship equation between the remaining energy of HESS and the discharging power is given in Equation (22):
where EVRB(t) and EVRB(t − 1) denote the remaining energies of VRBs at times t and t − 1, while ESC(t) and ESC(t − 1) represent the remaining energies of SCs at these times. PVRB(t) and PSC(t) indicate the charging/discharging powers of VRBs and SCs at time t, with positive values for charging and negative values for discharging. The efficiencies for charging/discharging of VRBs and SCs are given by ηVRBc, ηSCc, ηVRBd, and ηSCd, respectively. Δt is the time step; η1 and η2 are the conversion efficiencies of DC converters.
4.2. Objective Function
The capacity configuration of HESS in this study aims to minimize the whole life cycle costs, with the objective function formulated as:
where C is the whole life cycle cost of the HESS; CINV denotes the energy storage device’s initial investment cost; CMAI represents the maintenance expenditure for the energy storage system; CREP represents the replacement cost of the system for the equipment in the system; CRES is the residual recovery value of the energy storage system.
CINV, CMAI, CREP and CRES can be expressed as follows:
where CVRB, CSC, CECD, and CAUE are the investment costs of the VRBs, SCs, energy conversion devices and auxiliary equipment, respectively; EVRB and PVRB are the rated capacity and rated power of the VRBs, respectively; ESC and PSC are the rated capacity and rated power of the SCs, respectively; kVRBe and kSCe are the capacity cost coefficients of the VRBs and SCs, respectively; kVRBp and kSCp are the power cost coefficients of the VRBs and SCs, respectively; kVRB-ecd and kSC-ecd are the energy conversion device cost coefficients of the VRBs and SCs, respectively; kVRB-aue and kSC-aue are the auxiliary equipment cost coefficients of the VRBs and SCs, respectively; kVRB-mai and kSC-mai are the maintenance cost coefficients for the VRBs and SCs, respectively; m is the number of energy storage replacements during the project life cycle. λRES is the residual recovery rate; y is the project life cycle (years); r is the discount rate.
4.3. Constraints
4.3.1. Power Constraints
The HESS operation is subject to power constraints:
where and are the maximum charging and discharging power of VRBs, respectively; and are the maximum charging and discharging power of SCs, respectively.
4.3.2. SOC Constraints
The SOC dynamics satisfy:
where SOCVRB(t) and SOCSC(t) are the SOC of the VRBs and SCs at time t, respectively; SOCVRB-max and SOCVRB-min are the upper and lower limits of the SOC for VRBs, respectively; SOCSC-max and SOCSC-min are the upper and lower limits of the SOC for SCs, respectively.
4.3.3. Load Deficit Rate Constraints
The deficit rate of load is constrained to guarantee the stability of wind–solar complementary off-grid microgrids.
where, , and are the conversion efficiency of DC converters; and represent the charging/discharging conversion efficiencies of VRBs and SCs, respectively; is the rate of load deficit; is the maximum value of load deficit rate.
4.3.4. Rate of Energy Loss Constraints
The rate of energy loss is constrained to reduce the abandoning wind and electricity.
where is the energy loss rate; is the maximum value of energy loss rate.
5. Model Solution Methods
The proposed model is solved using the Particle Swarm Optimization (PSO) algorithm. The position of the i-th particle can be represented as: , and the velocity of the i-th particle can be represented as: . For each generation of particles, their velocity and position changes in the d-dimensional space are described in Equation (32).
where i is the number of the particle; k is the number of iterations of the particle; and are the velocity and displacement of the i-th particle after k + 1 iterations, respectively; w is the inertia weight coefficient, which controls the influence of the previous velocity on the current velocity; , are the learning factors, which regulate the step lengths of the particles towards their own optimal position and the global optimal position , respectively; and are uniformly distributed random numbers between [0, 1]. Following these fundamental principles, the optimization procedures are as follows:
- (1)
- Setting the parameters of the energy storage system, importing relevant data, initializing the particle swarm and particle positions, setting the maximum number of iterations and population size.
- (2)
- Check if the particle satisfies the constraints of the power and energy balance strategy.
- (3)
- Calculate the particle fitness based on the objective function and update the particle velocity and position by combining individual historical optimum () and population global optimum ().
- (4)
- Update the individual optimal solution and global optimal solution of the particle and track the current optimal solution.
- (5)
- Determine whether the maximum number of iterations is reached; if not, return to step (3), if reached, output the global optimal solution.
6. Example Analysis
A wind–solar hybrid farm in Northwestern China serves as a case study to validate the effectiveness of the RW-GWO-VMD strategy. The historical data from the wind–solar farm with the capacity of a 2.0 MW wind turbine and 1.5 MW solar as well as typical electrical load are employed as test data. The dataset comprises 1440 samples collected at an interval of 1 min over a 24-h monitoring period. Measurement data over 15 consecutive days during the latter half of June are shown in Figure 4. The statistical analysis for the measurement data over 15 consecutive days is displayed in Table 2.
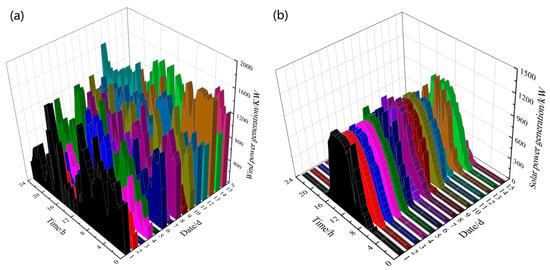
Figure 4.
Measurement data over 15 consecutive days during the latter half of June. (a) Wind power (b) Solar power.

Table 2.
The average power, maximum power and standard deviation of photovoltaic power and wind power measured over 15 consecutive days.
As shown in Table 2, for photovoltaic power generation, the average power remained at about 305 kW on D4, D8, D10 and D14, with stable maximum power (around 1050–1176 kW). However, the average power was similarly low on D12 (69 kW) and D15 (95 kW), possibly due to cloudy conditions. In addition, power data with high standard deviation of 417 on D1 indicated unstable sunlight conditions. For wind power generation, the average power was 1067 kW and 994 kW on D11 and D13, respectively, with maximum power approaching the limit of 1640 kW. Nevertheless, the average power was lower on D2 and D9 than that of other days, likely due to low wind speeds. Taking the maximum photovoltaic power generation and fluctuation into account, data collected on the eighth day were representative, but D13 was chosen as a typical day considering the maximum wind power generation. In this paper, the choice of typical day mainly referred to the maximum photovoltaic power generation data.
The wind and solar power generation as well as the power consumption curves of electrical load are shown in Figure 5. As depicted in Figure 5, the data exhibit significant fluctuation, indicating that the unstable wind and solar conditions are characterized by frequent wind speed variations and illumination variation. The relevant system parameters are shown in Table 3.
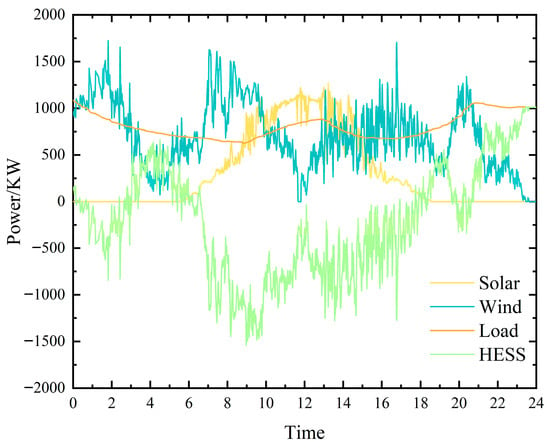
Figure 5.
Typical daily profiles of wind–solar generation, load demand and HESS power.

Table 3.
System related parameters.
6.1. Results of Power Allocation
A comparative evaluation of RW-GWO against AOA, PSO and standard GWO was conducted to demonstrate its superior performance in VMD parameter optimization. The fitness convergence curves of PSO, AOA, GWO and RW-GWO are shown in Figure 6. From Figure 6, it can be observed that RW-GWO has rapid convergence ability, achieving a fitness value of 9.9564 within 5 iterations, while the fitness function of GWO, AOA and PSO converges to 9.9564 (after 27 iterations), 9.9577 (after 8 iterations) and 9.9562 (after 9 iterations), respectively, indicating that RW-GWO could achieve fast convergence and find better results relative to GWO, AOA and RW-GWO.
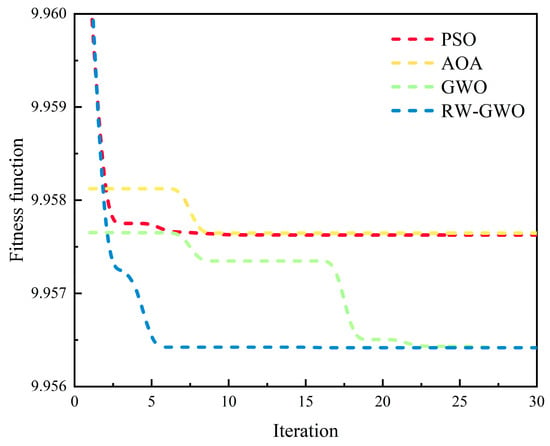
Figure 6.
Comparative results for PSO, AOA, GWO and RW-GWO.
To empirically demonstrate the superior performance of RW-GWO-VMD, methods such as EMD, AOA-VMD, PSO-VMD and GWO-VMD are used to decompose the power curve of HESS synthesized by the electricity load and the wind–solar power generation data for comparison. The variational nature of VMD intrinsically demands presetting the parameters of K and α for its constrained optimization framework [56]. Therefore, the parameters of VMD are optimized by PSO, AOA, GWO and RW-GWO in this paper, and the results are shown in Table 4.

Table 4.
The parameters [K, α] of VMD optimized by PSO, AOA, GWO and RW-GWO.
As shown in Table 4, the RW-GWO optimization yielded the following VMD parameters: K = 11 and α = 432.14. The IMF components decomposed by RW-GWO-VMD are shown in Figure 7. From Figure 7, it can be seen that the frequency of each mode function gradually decreases from IMF1 to IMF11, while the amplitude gradually increases. The decomposition results from EMD, PSO-VMD, AOA-VMD and GWO-VMD have similar rules, as depicted in Figure 8, Figure 9, Figure 10 and Figure 11. Every IMF component is capable of fully capturing the fluctuation features present in the original unbalanced power. Furthermore, the low-frequency modal component obtained by RW-GWO-VMD is more prominent and less volatile than EMD, PSO-VMD and AOA-VMD, which is suitable for the actual reference value of VRB energy storage frequency modulation.
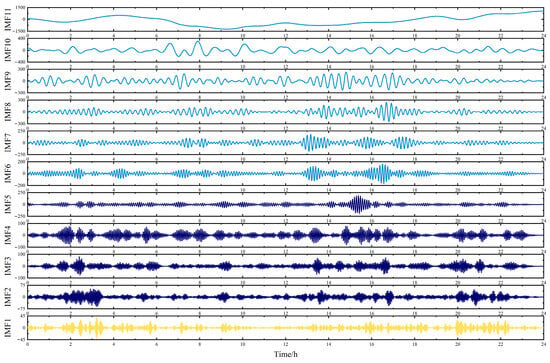
Figure 7.
IMF components decomposed by RW-GWO-VMD with the penalty factor α = 432.14 and the mode decomposition number K = 11.
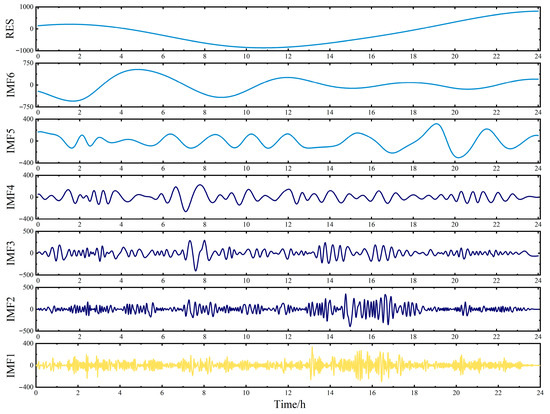
Figure 8.
IMF components decomposed by EMD.
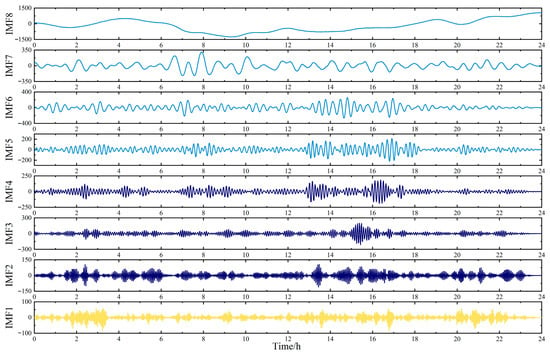
Figure 9.
IMF components decomposed by PSO-VMD with the penalty factor α = 225.41 and the mode decomposition number K = 8.
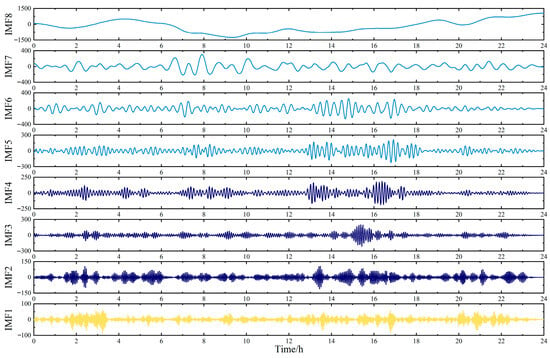
Figure 10.
IMF components decomposed by AOA-VMD with the penalty factor α = 228.38 and the mode decomposition number K = 8.
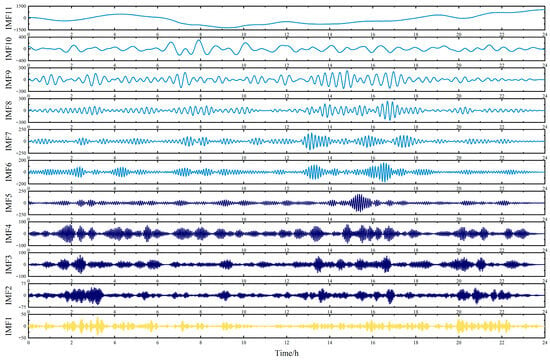
Figure 11.
IMF components decomposed by GWO-VMD with the penalty factor α = 432.12 and the mode decomposition number K = 11.
Based on the decomposition results from EMD and parameter-optimized VMD, as illustrated in Figure 7, Figure 8, Figure 9, Figure 10 and Figure 11, the Hilbert algorithm was used to calculate each modal component, and the calculation results are shown in Figure 12, Figure 13, Figure 14, Figure 15 and Figure 16.
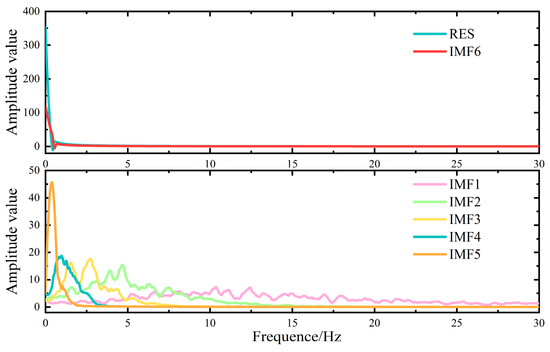
Figure 12.
The spectrum of IMFs using EMD.
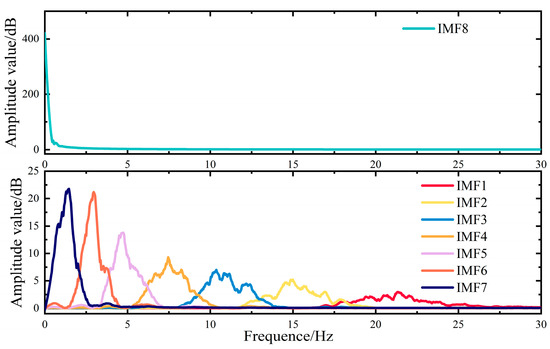
Figure 13.
The spectrum of IMFs using PSO-VMD with the penalty factor α = 225.41 and the mode decomposition number K = 8.
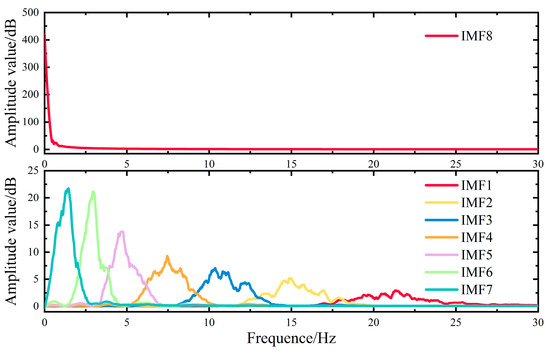
Figure 14.
The spectrum of IMFs using AOA-VMD with the penalty factor α = 228.38 and the mode decomposition number K = 8.
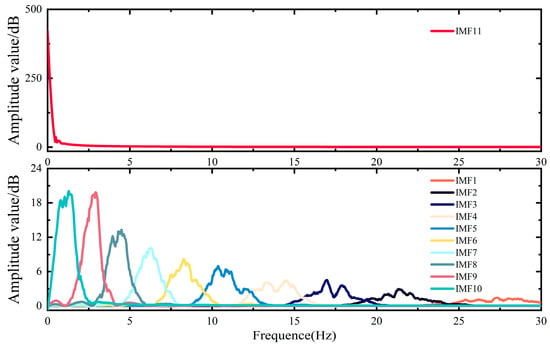
Figure 15.
The spectrum of IMFs using GWO-VMD with the penalty factor α = 432.12 and the mode decomposition number K = 11.
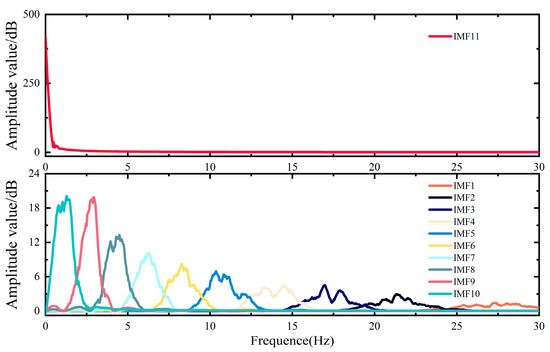
Figure 16.
The spectrum of IMFs using RW-GWO-VMD with the penalty factor α = 432.14 and the mode decomposition number K = 11.
The components obtained through EMD decomposition include multiple overlapping frequency elements (see Figure 12), and the considerable spectral overlap makes it difficult to differentiate low-frequency from high-frequency elements. Conversely, as illustrated in Figure 13 and Figure 14, the VMD parameters optimized by PSO and AOA yield appropriate K and α values that can partially mitigate modal aliasing. As a result, the IMFs exhibit clear frequency separation and uniform distribution. However, PSO and AOA have a higher tendency to converge to local optima during optimization compared with GWO and RW-GWO. Therefore, PSO-VMD and AOA-VMD decomposition lacks thoroughness, which may affect the HESS configuration results [35]. The spectrum of IMFs from the GWO-VMD and RW-GWO-VMD algorithms showed clearly delineated frequency components (see Figure 15 and Figure 16), indicating successful mode separation.
VRBs as energy-type storage devices are suitable for low-frequency fluctuations, which exhibit small amplitudes but long durations. In contrast, SCs as power-type storage devices are suitable for high-frequency fluctuations, which possess larger instantaneous amplitudes but short durations. An inappropriate division point between high- and low-frequency components in the unbalanced power will impact the charge/discharge commands for VRBs and SCs and thus affect the results of capacity configuration. In this paper, the selection of the frequency-dividing point is based on the optimal whole life cycle cost of HESS as the objective, and the dividing point as the optimization variable.
As depicted in Figure 17, the whole life cycle costs vary depending on the selected frequency boundary. Especially, the whole life cycle cost of HESS is the lowest when N = 1. Combined with the analysis of modal components obtained by RW-GWO-VMD, GWO-VMD, PSO-VMD, AOA-VMD and EMD in Figure 7, Figure 8, Figure 9, Figure 10 and Figure 11, the amplitude of IMF1 vibration is much larger than that of the other modal components. Additionally, the frequency of IMF1 is low, which is in line with the storage characteristics of VRBs. For the IMF components obtained by RW-GWO-VMD, the center frequency of IMF1 is only 4.04% of that of IMF2. Therefore, the sub-modal IMF1 is reconstructed as the compensation power of VRBs, and IMF2~IMF11 are reconstructed as the compensation power of SCs.
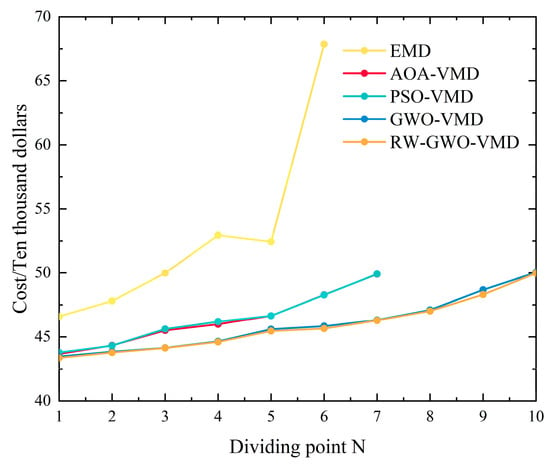
Figure 17.
The whole life cycle cost under different dividing points with different mode decomposition methods.
Based on the previous HESS power distribution strategy, the power fluctuation characteristics of VRBs and SCs are determined through RW-GWO-VMD. Additionally, the results are further compared with those from GWO-VMD, AOA-VMD and PSO-VMD methods, as illustrated in Figure 18 and Figure 19.
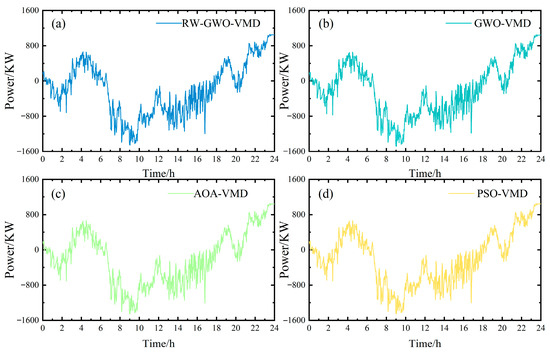
Figure 18.
Compensation power curves of VRBs with different mode decomposition methods. (a) RW-GWO-VMD; (b) GWO-VMD; (c) AOA-VMD; (d) PSO-VMD.
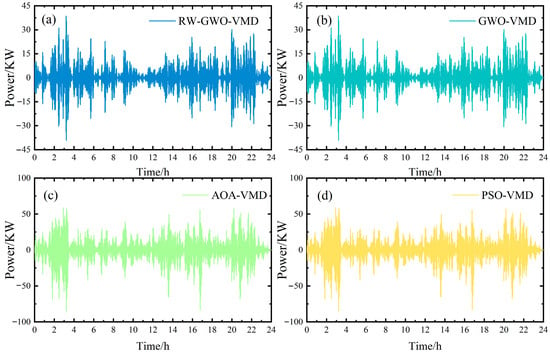
Figure 19.
Compensation power curves of SCs with different mode decomposition methods. (a) RW-GWO-VMD; (b) GWO-VMD; (c) AOA-VMD; (d) PSO-VMD.
The combination of modal decomposition and the whole life cycle cost optimization provides an excellent method for establishing frequency separation points and allocating HESS power. From Figure 18, it can be seen that the power curves of VRBs among the four algorithms are rather similar. However, the power curves of VRBs obtained by GWO-VMD and RW-GWO-VMD exhibit greater fluctuation compared with the power curves based on AOA-VMD and PSO-VMD. The reason may be that RW-GWO-VMD and GWO-VMD yield less high-frequency residual in IMF1 compared to other decomposition methods. From Figure 19, it can be seen that SCs, functioning as power-based devices, primarily absorb high-frequency power components. Compared with AOA-VMD and PSO-VMD, the power curves of SCs based on RW-GWO-VMD and GWO-VMD show low fluctuation amplitude and fast charging and discharging, indicating that RW-GWO-VMD and GWO-VMD could suppress mode aliasing and enable SCs to smooth high-frequency fluctuations.
6.2. Results of Configuration
Based on the results in Section 4 and Section 6.1, the capacity configuration of HESS was carried out. Table 5 and Figure 20 show the results of the configuration scheme with different methods, with reference to the economic parameters detailed in Table 3.

Table 5.
Results of capacity configuration.
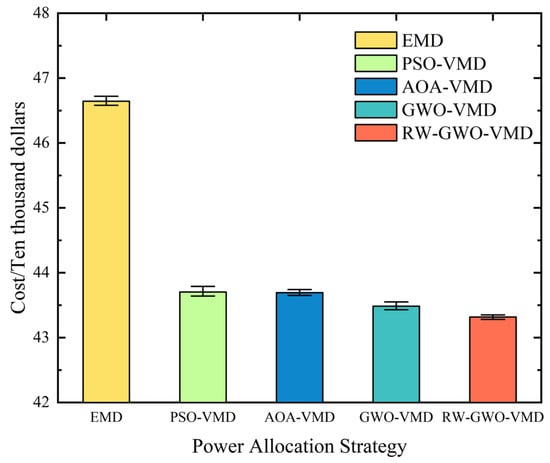
Figure 20.
Bar chart with error bars.
Table 5 demonstrates that the rated power and rated capacity configuration of SCs derived from optimized VMD methods (PSO-VMD, AOA-VMD, GWO-VMD and RW-GWO-VMD) are reduced compared to those obtained by EMD. However, all the algorithms produce minimal variation in rated power and the rated capacity configuration of VRBs. The explanation lies in the enhanced ability of VMD to prevent modal aliasing compared to EMD. The bandwidth and frequency range of the modal function can be constrained through the introduction of the regularization term, which can differentiate the high- and low-frequency signals. As a result, more reasonable power allocation and accurate HESS capacity configuration can be realized. The whole life cycle cost of RW-GWO-VMD is 7.44% lower than that of EMD, 1.00% lower than that of PSO-VMD, 0.72% lower than that of AOA-VMD, and 0.27% lower than that of GWO-VMD.
As observed in Figure 20, EMD and PSO-VMD exhibit longer error bars with significant fluctuations in objective function values. In contrast, AOA-VMD and GWO-VMD show shorter error bars, while RW-GWO-VMD demonstrates the shortest error bars and the most stable objective function values.
The convergence curve of the capacity optimization configuration model is shown in Figure 21. Compared with the methods of PSO-VMD, AOA-VMD and GWO-VMD, RW-GWO-VMD exhibits the fastest convergence speed and the highest accuracy.
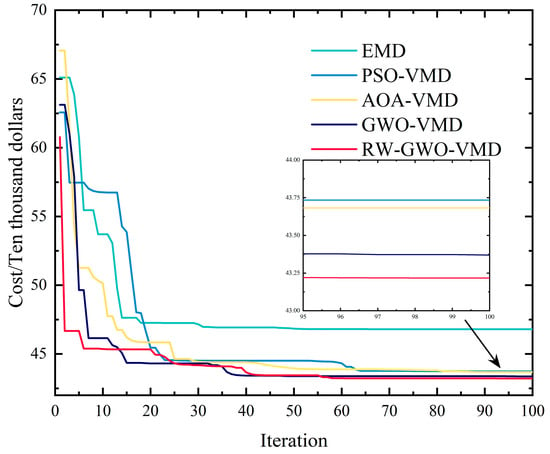
Figure 21.
Convergence curve of capacity optimization configuration model.
It is well known that EMD suffers from mode mixing issues, failing to adequately accommodate the characteristics of different energy storage devices. AOA exhibits premature convergence, resulting in local optimal solutions. PSO demonstrates weak global search capability and similarly tends to become trapped in local optima. GWO lacks sufficient search capacity, leading to slow convergence speed. In contrast, the random walk mechanism in RW-GWO significantly accelerates search capability. Therefore, RW-GWO-VMD delivers more accurate HESS power distribution than PSO-VMD, AOA-VMD and GWO-VMD approaches.
6.3. Comparative Analysis
The running time can reflect the computational complexity of the algorithm, and the reconstruction error indicates the accuracy. The running time and reconstruction error are shown in Table 6. It can be seen that RW-GWO-VMD has the least running time and the smallest reconstruction error, which indicates its accuracy and low complexity.

Table 6.
Running time and reconstruction error of VMD optimized by PSO, AOA, GWO and RW-GWO.
Based on CEC 2022 functions (dimension = 10), a Wilcoxon signed-rank test between RW-GWO and GWO was conducted at a significance level of 5%. The results were evaluated based on the following criteria: (A) The observed difference is significant if p-value < 0.05; (B) The observed difference is marginally significant if 0.05 < p-value < 0.10. (C) The observed difference is not significant if p-value > 0.10. The results are shown in Table 7. When RW-GWO is superior to GWO, the conclusions are A+, B+ and C+. When GWO is superior to RW-GWO, the conclusions are A, B and C. From Table 7, it can be seen that RW-GWO is better than GWO in 10 out of 12 functions and significantly better than GWO in 6 out of 12 functions.

Table 7.
Results of Wilcoxon signed-rank test based on CEC 2022 functions.
7. Conclusions
To address the inherent variability in wind and solar power generation, this paper proposed a power allocation strategy and a capacity optimization configuration model based on RW-GWO-VMD for the HESS consisting of VRBs and SCs to achieve the optimal configuration of the HESS. The HESS capacity was optimized for 24-h operation with the objective to minimize the whole life cycle cost of HESS. The primary findings can be summarized as follows:
- (1)
- RW-GWO outperforms conventional PSO, AOA and GWO in optimizing VMD parameters [K, α], demonstrating superior convergence speed and optimization precision. This leads to higher VMD modal matching accuracy and more precise HESS power allocation.
- (2)
- RW-GWO-VMD effectively prevents the modal aliasing that typically occurs with EMD decomposition. The capacity optimal configuration model of HESS was developed with the whole life cycle cost of HESS as the objective function and the high-frequency and low-frequency dividing points of the unbalanced power as the optimization variables.
- (3)
- The configuration cost of the HESS was optimized for capacity configuration under different allocation strategies, including EMD, PSO-VMD, AOA-VMD and GWO-VMD. The whole life cycle cost of RW-GWO-VMD is 7.44% lower than that of EMD, 1.00% lower than that of PSO-VMD, 0.72% lower than that of AOA-VMD, and 0.27% lower than that of GWO-VMD, demonstrating the superiority of RW-GWO-VMD decomposition of HSEE power.
The robustness of RW-GWO-VMD with respect to noisy or missing data was not investigated in this paper. However, RW-GWO-VMD generally outperformed VMD in terms of robustness. Moreover, the robustness of RW-GWO-VMD could be improved by adding an adaptive wavelet threshold denoising module and integrating a Long Short-Term Memory predictor as a preprocessing unit.
Author Contributions
Conceptualization, H.L. and D.L.; methodology, H.L. and Z.X.; software, Z.X. and D.L.; validation, H.L., Q.Q. (Qiansheng Qiu) and X.T.; formal analysis, Q.Q. (Qifeng Qian); investigation, M.J.; resources, H.L., Q.Q. (Qiansheng Qiu) and D.L.; data curation, M.J.; writing—original draft preparation, H.L.; writing—review and editing, D.L., H.L. and W.Y.; visualization, X.T. and Z.X.; supervision, H.L.; project administration, W.Y.; funding acquisition, H.L. All authors have read and agreed to the published version of the manuscript.
Funding
This research was funded by the Hebei Provincial Department of Education Youth Top Talents Project (BJK2024086) and the Fundamental Research Funds for the Central Universities (3142024026).
Data Availability Statement
Data is contained within the article.
Conflicts of Interest
Authors Qiansheng Qiu and Qifeng Qian were employed by the Zhejiang Sunoren Solar Technology Co., Ltd. The remaining authors declare that the research was conducted in the absence of any commercial or financial relationships that could be construed as a potential conflict of interest.
References
- Liang, J.; Zhou, J.; Yuan, X.; Huang, W.; Gong, X.; Zhang, G. An active distribution network voltage optimization method based on source-network-load-storage coordination and interaction. Energies 2024, 17, 4645. [Google Scholar] [CrossRef]
- Hamad, A.A.; Azzouz, M.A.; El-Saadany, E.F. Multiagent supervisory control for power management in DC microgrids. IEEE Trans. Smart Grid 2015, 7, 1057–1068. [Google Scholar] [CrossRef]
- Mastoi, M.S.; Zhuang, S.; Haris, M.; Hassan, M.; Ali, A. Large-scale wind power grid integration challenges and their solution: A detailed review. Environ. Sci. Pollut. Res. 2023, 30, 103424–103462. [Google Scholar] [CrossRef] [PubMed]
- Li, J.; Chen, S.; Wu, Y.; Wang, Q.; Liu, X.; Qi, L.; Lu, X.; Gao, L. How to make better use of intermittent and variable energy? A review of wind and photovoltaic power consumption in China. Renew. Sustain. Energy Rev. 2021, 137, 110626. [Google Scholar] [CrossRef]
- Ahmed, F.; Al Kez, D.; McLoone, S.; Best, R.J.; Cameron, C.; Foley, A. Dynamic grid stability in low carbon power systems with minimum inertia. Renew. Energy 2023, 210, 486–506. [Google Scholar] [CrossRef]
- Zhang, Y.; Yuan, C.; Du, X.; Chen, T.; Hu, Q.; Wang, Z.; Lu, J. Capacity configuration of hybrid energy storage system for ocean renewables. J. Energy Storage 2025, 116, 116090. [Google Scholar] [CrossRef]
- Pan, G.; Gu, W.; Gu, Z.; Lin, J.; Zhou, S.; Wu, Z.; Lu, S. Feasibility of scaling up the cost-competitive and clean electrolytic hydrogen supply in China. Engineering 2024, 39, 154–165. [Google Scholar] [CrossRef]
- Numan, M.; Baig, M.F.; Yousif, M. Reliability evaluation of energy storage systems combined with other grid flexibility options: A review. J. Energy Storage 2023, 63, 107022. [Google Scholar] [CrossRef]
- Hajiaghasi, S.; Salemnia, A.; Hamzeh, M. Hybrid energy storage system for microgrids applications: A review. J. Energy Storage 2019, 21, 543–570. [Google Scholar] [CrossRef]
- Hou, H.; Xu, T.; Wu, X.; Wang, H.; Tang, A.; Chen, Y. Optimal capacity configuration of the wind-photovoltaic-storage hybrid power system based on gravity energy storage system. Appl. Energy 2020, 271, 115052. [Google Scholar] [CrossRef]
- Aluko, A.; Knight, A. A Review on Vanadium Redox Flow Battery Storage Systems for Large-Scale Power Systems Application. IEEE Access 2023, 11, 13773–13793. [Google Scholar] [CrossRef]
- Rana, M.M.; Uddin, M.; Sarkar, M.R.; Meraj, S.T.; Shafiullah, G.M.; Muyeen, S.M.; Islam, M.A.; Jamal, T. Applications of energy storage systems in power grids with and without renewable energy integration-A comprehensive review. J. Energy Storage 2023, 68, 107811. [Google Scholar] [CrossRef]
- Olabi, A.G.; Abbas, Q.; Al Makky, A.; Abdelkareem, M.A. Supercapacitors as next generation energy storage devices: Properties and applications. Energy 2022, 248, 123617. [Google Scholar] [CrossRef]
- Amirthalakshmi, T.M.; Ramesh, S.; Prabu, R.T.; Ramkumar, G.; Sahoo, S.; Thomas, P.; Ramalingam, R.J.; Al-Dhayan, S. Sureshkumar, S. A novel approach in hybrid energy storage system for maximizing solar PV energy penetration in microgrid. Int. J. Photoenergy 2022, 2022, 3559837. [Google Scholar] [CrossRef]
- Bahloul, M.; Khadem, S.K. An analytical approach for techno-economic evaluation of hybrid energy storage system for grid services. J. Energy Storage 2020, 31, 101662. [Google Scholar] [CrossRef]
- Mohseni, S.; Brent, A.C. Probabilistic sizing and scheduling co-optimisation of hybrid battery/super-capacitor energy storage systems in micro-grids. J. Energy Storage 2023, 73, 109172. [Google Scholar] [CrossRef]
- Pan, R.; Wu, Y.; Wang, Y.; Chen, J.; Wang, L. Adaptive power allocation strategy for hybrid energy storage system based on driving pattern recognition. J. Energy Storage 2024, 83, 110787. [Google Scholar] [CrossRef]
- Bocklisch, T. Hybrid energy storage approach for renewable energy applications. J. Energy Storage 2016, 8, 311–319. [Google Scholar] [CrossRef]
- Feng, S.; Wei, W. Hybrid energy storage sizing in energy hubs: A continuous spectrum splitting approach. Energy 2024, 300, 131504. [Google Scholar] [CrossRef]
- Guo, T.; Zhang, T.; Lim, E.; López-Benítez, M.; Ma, F.; Yu, L. A Review of Wavelet Analysis and Its Applications: Challenges and Opportunities. IEEE Access 2022, 10, 58869–58903. [Google Scholar] [CrossRef]
- Lu, Q.; Yang, Y.; Chen, J.; Liu, Y.; Liu, N.; Cao, F. Capacity optimization of hybrid energy storage systems for offshore wind power volatility smoothing. Energy Rep. 2023, 9, 575–583. [Google Scholar] [CrossRef]
- Song, J.; Geng, L.; Sang, Y.; Wen, R.; Sun, P.; Gong, L. Study on primary frequency modulation capacity planning of thermal power unit assisted by hybrid energy storage based on EMD decomposition. Energy Storage Sci. Technol. 2023, 12, 496. [Google Scholar]
- Li, X.; Pan, L.; Zhang, J.; Jin, Z.; Jiang, W.; Wang, Y.; Liu, L.; Tang, R.; Lai, J.; Yang, X.; et al. A novel capacity allocation method for hybrid energy storage system for electric ship considering life cycle cost. J. Energy Storage 2025, 116, 116070. [Google Scholar] [CrossRef]
- Li, C.; Qin, L. Sizing optimization for hybrid energy storage system independently participating in regulation market using improved particle swarm optimization. Acta Energiae Solaris Sin 2023, 44, 426–434. [Google Scholar]
- Wen, S.; Wang, S.; Liu, G.; Liu, R. Energy Management and Coordinated Control Strategy of PV/HESS AC Microgrid During Islanded Operation. IEEE Access 2019, 7, 4432–4441. [Google Scholar] [CrossRef]
- Wang, K.; Wang, S.; Yang, G.; Zhao, X.; Zhang, L.; Nie, Q.; Gan, Z.; Qi, Y. Control strategy research of hybrid energy storage system to smooth out PV fluctuations. In Proceedings of the 2022 IEEE Conference on Telecommunications, Optics and Computer Science (TOCS), Dalian, China, 11–12 December 2022; pp. 887–892. [Google Scholar]
- Jiao, Y.; Månsson, D. Study of the oversized capacity and the increased energy loss of hybrid energy storage systems and design of an improved controller based on the low-pass filter. J. Energy Storage 2022, 50, 104241. [Google Scholar] [CrossRef]
- Hajiaghasi, S.; Hosseini Ahmadi, M.M.; Goleij, P.; Salemnia, A.; Hamzeh, M. Hybrid energy storage sizing based on discrete Fourier transform and particle swarm optimization for microgrid applications. Int. Trans. Electr. Energy Syst. 2021, 31, e13156. [Google Scholar] [CrossRef]
- Yun, P.P.; Chen, Q.T.; Mi, Y.; Ren, B.; Miao, Y.J.; Ren, Y.F. Improved wavelet packet of hybrid energy storage to smooth wind power fluctuation. In Proceedings of the 2021 IEEE Sustainable Power and Energy Conference (iSPEC), Nanjing, China, 23–25 December 2021; pp. 1160–1165. [Google Scholar]
- Huang, N.E.; Shen, Z.; Long, S.R.; Wu, M.C.; Shih, H.H.; Zheng, Q.; Yen, N.-C.; Tung, C.C.; Liu, H.H. The empirical mode decomposition and the Hilbert spectrum for nonlinear and non-stationary time series analysis. Proc. R. Soc. London Ser. A Math. Phys. Eng. Sci. 1998, 454, 903–995. [Google Scholar] [CrossRef]
- Tian, C.; Li, K.; Yan, Y.; Zhang, C. A multi-time scale control strategy of hybrid energy storage system in wind farm based on empirical mode decomposition. Power Syst. Technol. 2015, 39, 2167–2172. [Google Scholar]
- He, Z.; Wang, Q.; Shen, Y.; Sun, M. Kernel sparse multitask learning for hyperspectral image classification with empirical mode decomposition and morphological wavelet-based features. IEEE Trans. Geosci. Remote Sens. 2013, 52, 5150–5163. [Google Scholar]
- Wen, Z.; Fang, P.; Yin, Y.; Krolczyk, G.; Gardoni, P.; Li, Z. A novel machine learning model for safety risk analysis in flywheel-battery hybrid energy storage system. J. Energy Storage 2022, 49, 104072. [Google Scholar] [CrossRef]
- Wu, Z.; Huang, N.E. Ensemble empirical mode decomposition: A noise-assisted data analysis method. Adv. Adapt. Data Anal. 2009, 1, 1–41. [Google Scholar] [CrossRef]
- Su, H.; Yang, J.; Du, X.; Wang, Z.; Li, Y. Configuration of community hybrid energy storage system based on retired power battery. Energy Rep. 2020, 6, 934–942. [Google Scholar] [CrossRef]
- Gao, X.; Wang, L.; Sun, H.; Tian, J.; Wang, Z.; Jiang, J.; Guo, W. Research on optimal configuration of hybrid energy storage system based on improved CEEMDAN. Energy Rep. 2021, 7, 1308–1318. [Google Scholar] [CrossRef]
- Dragomiretskiy, K.; Zosso, D. Variational Mode Decomposition. IEEE Trans. Signal Process. 2014, 62, 531–544. [Google Scholar] [CrossRef]
- Xiao, G.; Xu, F.; Tong, L.; Xu, H.; Zhu, P. A hybrid energy storage system based on self-adaptive variational mode decomposition to smooth photovoltaic power fluctuation. J. Energy Storage 2022, 55, 105509. [Google Scholar] [CrossRef]
- Chen, C.; Tang, W.; Xia, Y.; Chen, C. Hybrid-energy storage optimization based on successive variational mode decomposition and wind power frequency modulation power fluctuation. Energies 2024, 17, 4391. [Google Scholar] [CrossRef]
- Li, Y.; Ding, Z.; Yu, Y.; Liu, Y. Hybrid energy storage power allocation strategy based on parameter-optimized VMD algorithm for marine micro gas turbine power system. J. Energy Storage 2023, 73, 109189. [Google Scholar] [CrossRef]
- Zhang, C.; Li, Z.; Ge, Y.; Liu, Q.; Suo, L.; Song, S.; Peng, T. Enhancing short-term wind speed prediction based on an outlier-robust ensemble deep random vector functional link network with AOA-optimized VMD. Energy 2024, 296, 131173. [Google Scholar] [CrossRef]
- Ma, Z.; Han, J.; Chen, H.; Houari, A.; Saim, A. Research on power allocation strategy and capacity configuration of hybrid energy storage system based on double-layer variational modal decomposition and energy entropy. J. Energy Storage 2024, 95, 112492. [Google Scholar] [CrossRef]
- Zhou, Z.; Ma, Z.; Mu, T. Hybrid energy storage capacity optimization based on VMD-SG and improved Firehawk optimization. Electr. Power Syst. Res. 2025, 239, 111218. [Google Scholar] [CrossRef]
- Zhang, Y.; Pan, G.; Chen, B.; Han, J.; Zhao, Y.; Zhang, C. Short-term wind speed prediction model based on GA-ANN improved by VMD. Renew. Energy 2020, 156, 1373–1388. [Google Scholar] [CrossRef]
- Huang, L.; Zhang, X.; Liang, S.; Shi, R.; Liao, S.; Zhang, G. Method of hybrid energy storage capacity allocation for stabilizing fluctuation of wind-PV power. Mod. Electron. Tech. 2023, 46, 173–177. [Google Scholar]
- Gao, X.; Wang, L.; Tian, J.; Liu, J.; Liu, Q. Research on hybrid energy storage power distribution strategy based on parameter optimization variational mode decomposition. Energy Storage Sci. Technol. 2022, 11, 147–155. [Google Scholar]
- Zhang, X.; Kang, L.; Wang, X.; Liu, Y.; Huang, S. Capacity optimization configuration of hybrid energy storage systems for wind farms based on improved k-means and two-stage decomposition. Energies 2025, 18, 795. [Google Scholar] [CrossRef]
- Mirjalili, S.; Lewis, A. Grey wolf optimizer. Adv. Eng. Softw. 2014, 69, 46–61. [Google Scholar] [CrossRef]
- Elsaid, S.; Shehab, E.; Mattar, A.; Azar, A.; Hameed, I. Hybrid intrusion detection models based on GWO optimized deep learning. Discov. Appl. Sci. 2024, 6, 531. [Google Scholar] [CrossRef]
- Shaikh, M.S.; Wang, C.; Xie, S.; Zheng, G.; Dong, X.; Qiu, S.; Ahmad, M.A.; Raj, S.J. Coverage and connectivity maximization for wireless sensor networks using improved chaotic grey wolf optimization. Sci. Rep. 2025, 15, 15706. [Google Scholar] [CrossRef]
- Dagal, I.; Ibrahim, A.; Harrison, A.; Mbasso, W.; Hourani, A.; Zaitsev, I. Hierarchical multi step Gray Wolf optimization algorithm for energy systems optimization. Sci. Rep. 2025, 15, 8973. [Google Scholar] [CrossRef]
- Gupta, S.; Deep, K. A novel Random Walk Grey Wolf Optimizer. Swarm Evol. Comput. 2019, 44, 101–112. [Google Scholar] [CrossRef]
- Hoang, K.D.; Lee, H.H. Accurate power sharing with balanced battery state of charge in distributed DC microgrid. IEEE Trans. Ind. Electron. 2019, 66, 1883–1893. [Google Scholar] [CrossRef]
- Niu, P.; Niu, S.; Liu, N.; Chang, L. The defect of the Grey Wolf optimization algorithm and its verification method. Knowl.-Based Syst. 2019, 171, 37–43. [Google Scholar] [CrossRef]
- Li, X.; Wang, J.; Qiu, Y.; Hou, Y.; Zhou, Q. Optimal allocation of hybrid energy storage capacity based on variational mode decomposition. Acta Energ. Sol. Sin. 2022, 43, 88–96. [Google Scholar]
- Chen, C.; Li, S.; Wen, M.; Yu, Z. Ultra-short term wind power prediction based on quadratic variational mode decomposition and multi-model fusion of deep learning. Comput. Electr. Eng. 2024, 116, 109157. [Google Scholar] [CrossRef]
Disclaimer/Publisher’s Note: The statements, opinions and data contained in all publications are solely those of the individual author(s) and contributor(s) and not of MDPI and/or the editor(s). MDPI and/or the editor(s) disclaim responsibility for any injury to people or property resulting from any ideas, methods, instructions or products referred to in the content. |
© 2025 by the authors. Licensee MDPI, Basel, Switzerland. This article is an open access article distributed under the terms and conditions of the Creative Commons Attribution (CC BY) license (https://creativecommons.org/licenses/by/4.0/).