Article

Evaluation System of AC/DC Strong–Weak Balance Relationship and Stability Enhancement Strategy for the Receiving-End Power Grid

by
Hui Cai
1,
Mingxin Yan
2,
Xingning Han
1,
Guoteng Wang
2,
Quanquan Wang
1 and
Ying Huang
2,*
1
Economic Research Institute, State Grid Jiangsu Electric Power Co., Ltd., Nanjing 210008, China
2
College of Electrical Engineering, Zhejiang University, Hangzhou 310027, China
*
Author to whom correspondence should be addressed.
Energies 2025, 18(16), 4216; https://doi.org/10.3390/en18164216
Submission received: 25 June 2025 / Revised: 31 July 2025 / Accepted: 6 August 2025 / Published: 8 August 2025

Abstract

With the maturation of ultra-high-voltage direct current (UHVDC) technology, DC grids are taking on a more critical role in power systems. However, their impact on AC grids has become more pronounced, particularly in terms of frequency, short-circuit current level, and power flow control capabilities, which also affects the power supply reliability of the receiving-end grid. To comprehensively evaluate the balance between AC and DC strength at the receiving-end, this paper proposes a multidimensional assessment system that covers grid strength and operational security under various operating conditions. Furthermore, a rationality evaluation model for the AC/DC strong–weak balance relationship is developed based on the entropy weight method, forming a complete evaluation framework for assessing the AC/DC strong–weak balance in the receiving-end power grid. Finally, to address strength imbalances in grid, a structural optimization method for the receiving-end grid is designed by combining network decoupling techniques with modular multilevel converter-based HVDC (MMC–HVDC), serving as a strategy for enhancing grid stability. The proposed strategy is validated through simulations in a typical test system using PSD-BPA, demonstrating its effectiveness in optimizing power flow characteristics, improving system stability, reducing the risk of short-circuit current overloads and large-scale blackouts, and maintaining efficient system operation.

1. Introduction

In the context of the accelerated global energy transition and the “dual carbon” goals, along with the increasing demand for transmission capacity and flow control of power transmission sections in grid [1,2], and constrained by the short-circuit current levels and thermal stability limits of AC network lines, the power system is undergoing a profound transformation from traditional AC grids to AC/DC hybrid grids [3]. With the maturation of ultra-high-voltage direct current (UHVDC) technology, large-scale interregional power transmission through high-capacity DC lines has become a key approach for optimizing energy allocation. A significant amount of clean electricity is transmitted from energy bases to load centers, leading to notable changes in the structural form and operational characteristics of the receiving-end AC grids. A large amount of load is integrated into the receiving-end grid, forming a high-density load center grid. However, the adoption of high-density DC injection patterns and the step increase in DC infeed capacity have caused some receiving-end load center grids to exhibit a “strong DC, weak AC” characteristic [4]. In this grid configuration with an imbalance in the strength of the AC/DC grids, the structure of AC grid is relatively weak. DC blocking faults can lead to large-scale power flow transfers, impacting weakly connected grid sections [5,6]. Moreover, the significant DC infeed will continuously reduce the equivalent inertia of the receiving-end grid, leading to a decline in frequency regulation and voltage support capabilities, which results in more pronounced challenges related to frequency and voltage stability issues [7]. Faults will also cause power fluctuations in transmission sections, impacting transient stability. In severe cases, this could lead to out-of-step phenomena in grids across different regions [8]. Additionally, issues related to current distribution and safety in AC/DC hybrid grids have increasingly drawn attention. In this context, developing a scientific assessment system for the strength balance relationship between the AC and DC systems in receiving-end grids, along with proposing effective enhancement strategies, has become a key issue in ensuring the operational safety and efficiency of the power grid.
To improve the operational safety of AC/DC hybrid grids, current research mostly focuses on the control strategies of the DC system. Reference [9] proposes enhancing the transient stability for the AC system through emergency power support from the DC transmission system. By adopting a coordinated droop control mechanism, participating in frequency support is achieved for the LCC-HVDC system, ensuring the satisfaction of transient stability constraints. And a Lyapunov-based stability analysis of the system is also conducted. Reference [10] proposes a hierarchical control strategy for multiple HVDC lines in AC/DC hybrid power grids, aiming to enhance the dynamic response and disturbance rejection capability of power system through distributed control. Reference [11] enhances frequency control performance by designing an Auxiliary Deadband Controller (ADC) in the HVDC grid. The controller adjusts the deadband setpoint of the fast frequency controller based on the measured change rate of frequency and frequency deviation, thereby providing effective frequency support to the system. However, although control strategies in DC systems can regulate power transmission, they cannot fundamentally resolve the stability issues caused by the strength imbalance between AC and DC systems. It is also necessary to comprehensively consider the power grid structure to optimize power flow margins and ensure secure system operation.
To address the common issues of large short-circuit currents, uncontrollable power flows, and complex control measures caused by the integration of massive loads into the receiving-end load central grid, a widely used solution is network decoupling [12,13]. This approach can effectively reduce short-circuit currents and prevent unwanted load transfers. However, the decoupling technique may increase the risk of large-scale blackouts. Therefore, decoupling technology is only applicable to receiving-end grids with strong high-voltage networks in the load center. For the receiving-end grid, the operational boundaries can also be ensured through constraints to maintain stability. This method achieves stability requirements at the cost of grid utilization, as high-voltage lines typically need to be operated with a larger load margin to prevent the overload risk on low-voltage lines [14].
With the advancement of power electronics technology, devices such as Fault Current Limiters (FCLs), Unified Power Flow Controllers (UPFCs), and Modular Multilevel Converter (MMC)-based flexible DC transmission systems have been applied to the practical power grid engineering [15,16]. MMC-based flexible DC transmission technology offers significant advantages in operational performance, including the absence of commutation failures and reactive power compensation issues, the ability to supply power to passive systems, simultaneous regulation of active and reactive power, long-distance high-capacity power transmission, and the operational mode of asynchronous interconnection [17]. These features make it suitable for the reconstruction of receiving-end power grids. Given the performance advantages and high cost of MMC–HVDC, how to integrate decoupling technology with MMC–HVDC to reconstruct the network structure of the receiving-end load center grid is an urgent issue that requires further research.
The complex operational characteristics of AC/DC hybrid power grids place higher demands on ensuring the secure and stable power supply of the receiving-end grid, with the strength balance between AC and DC systems being a key evaluation criterion. Effectively assessing the strength balance between AC and DC systems is a critical issue in power system planning. Current research in this field mainly focuses on evaluating a single aspect of the operational characteristics of the receiving-end grid. In terms of evaluating the electrical strength of the grid structure, a more rigorous Generalized Short Circuit Ratio (gSCR) indicator is proposed based on eigenvalue angles and static voltage stability, to assess the voltage stability of multi-infeed AC/DC hybrid systems [18]. Reference [19] introduced the concept of equivalent node voltage sensitivity, employing a simplified single-source model to analyze and evaluate the power system voltage stability degree. Based on equivalent DC power, the Effective Short Circuit Ratio (ESCR) is introduced [20]. Considering the mutual influence among multiple DC infeeds, the Multi-Infeed Interaction Factor (MIIF) has been introduced as a tool to evaluate the voltage stability of receiving-end grids with multi-DC infeed [21]. In addition, the assessment framework for the strength balance between AC and DC systems must also focus on the operational stability of the receiving-end grid. Reference [22] has conducted an evaluation of the operational security and stability of the East China Power Grid’s load center from multiple perspectives, including the electrical strength, frequency, voltage, and transient stability of the receiving-end AC grid. Furthermore, reference [23] conducted a comprehensive assessment of power flow across grid transmission sections following the integration of ultra-high voltage AC/DC systems.
Existing methods have not comprehensively quantified the strength balance relationship of receiving-end power grids from multiple dimensions. Evaluation approaches centered on a single aspect are insufficient to meet the security and stability requirements of large-scale AC/DC hybrid power systems. Therefore, it is urgent to establish a multidimensional assessment framework that incorporates both grid strength and security/stability resilience. To address the adaptability of the receiving-end grid across different operating conditions, this paper proposes a multidimensional evaluation indicator system for the strength balance of AC/DC systems, covering grid strength and security/stability resilience. By coupling multidimensional evaluation indicators, decision support can be provided for strategies aimed at enhancing system stability, including the identification of target decoupling loops and the siting and sizing of MMC–HVDC systems. A comprehensive assessment framework and enhancement strategy for the strength balance of AC/DC hybrid receiving-end power grids is established, enabling the balance between power flow risks and system stability under different operating conditions.

2. Multidimensional Evaluation Indicator System for the AC/DC Strong–Weak Balance of the Receiving-End Power Grid

To guide the safe, reliable, and efficient planning and maintenance of the receiving-end power grid under the integration of renewable energy, a quantitative assessment of the AC/DC strong–weak balance in the receiving-end grid is conducted based on grid strength and multidimensional operational reliability indicators under different operating conditions. This assessment helps identify the key limiting factors in the expansion of AC/DC hybrid grid structures and clarifies the critical technical bottlenecks that must be addressed to meet the adaptive requirements for future power systems characterized by security, controllability, and stability. The framework for constructing this multidimensional evaluation indicator system is shown in Figure 1.

2.1. Grid Strength Evaluation

The assessment of the AC/DC strength balance in the receiving-end grid can be quantitatively analyzed through the evaluation of grid electrical strength and the AC channel utilization ratio indicator. Grid strength is typically used to measure the interaction intensity between the power grid and the primary equipment connected to it. It comprehensively reflects the voltage support strength and frequency support strength of power grid.

2.1.1. Voltage Support Capability Evaluation Indicator

Under the impact of non-synchronous power sources under the background of high renewable energy integration, as well as the strong interactions among converter stations in the multi-infeed DC systems due to the close electrical proximity of DC injection points, traditional Short Circuit Ratio (SCR) indicators are no longer applicable. Instead, the voltage stiffness indicator is adopted to assess the voltage support capacity of the receiving-end grid, considering comprehensively the impact factors mentioned above with high-penetration renewable energy. The calculation of this indicator is shown in Equations (1) and (2).
U s y s = λ S C R 1 + λ S C R 2 U s y s 0 = λ S C R 1 + λ S C R 2 U N
K vtg = U sys / U sys 0
where, U s y s represents the voltage magnitude of the network port, and U s y s 0 is the no-load voltage value at any point when the connected equipment is not yet integrated into the grid. U N is the nominal voltage of the power grid. The ratio U s y s / U s y s 0 defines the voltage stiffness, where λ S C R corresponds to the short-circuit ratio (SCR) of the equipment connected at any point of the power grid. The voltage stiffness indicator represents the ability of the power grid to maintain the voltage magnitude at any point close to the no-load voltage, directly reflecting the grid’s voltage support capability [24]. Based on practical operational experience, when λ S C R > 3, that is U s y s   > 0.95 U N , the receiving-end power grid is considered strong; when λ S C R < 1, that is U s y s < 0.71 U N , the receiving-end power grid is considered weak; when 1 < λ S C R < 3, that is 0.71 U N < U s y s < 0.95 U N , the receiving-end power grid is considered as a medium-strength system.

2.1.2. Frequency Support Capability Evaluation Indicator

The assessment of the grid frequency support capability is mainly measured from two dimensions including system inertia and primary frequency regulation. It reflects the system’s ability to suppress frequency variations under active power imbalance conditions.
(1)
System inertia level
The system inertia level is an indicator reflecting the change rate of system frequency. In the brief period right after a disturbance, before the governor starts operating and without load frequency regulation effect, the variation characteristics of the frequency are determined entirely by two factors of the system: inertia level and magnitude of the disturbance power.
H sys = h sys P sys = Δ P ine f 0 2 R O C O F
where, R O C O F represents the system frequency rate of change indicator. P i n e refers to the active power imbalance value under system disturbance. f 0 is the reference frequency of the system, and H s y s is the system inertia time constant. Considering that the inertia of non-synchronous power sources is determined by their control systems, an equivalent inertia enhancement factor is introduced to measure the inertia support strength of non-synchronous power sources.
H amp = H sys 1 H sys 0
where H s y s 1 represents the system inertia time constant when the inertia support control of all non-synchronous power sources is fully activated, and H s y s 0 represents the system inertia time constant when the inertia support control of all non-synchronous power sources is not activated. Therefore, system inertia H s y s characterizes the grid’s ability to resist frequency fluctuations during active power imbalances under short time, and the indicator H a m p reflects the enhancement effect of inertia support control from non-synchronous power sources on the system inertia.
(2)
System primary frequency regulation indicator
Considering the impact of non-synchronous power sources, the primary frequency regulation capability of the power system can be measured using the frequency deviation factor [24].
β = 1 R G + K NG + D L = Δ P ine / Δ f st
where, R G is the droop characteristic of the governors of synchronous power sources in the system. K N G is the frequency regulation coefficient of non-synchronous power sources. D L is the frequency regulation coefficient related to system loads. β is the system frequency deviation factor with units of MW/Hz, and Δ f s t is the quasi-steady-state frequency deviation in the system, which reflects the relationship between active power imbalance and the system frequency deviation under quasi-steady-state conditions. Therefore, the primary frequency regulation factor β quantifies the collaborative frequency regulation capability of multiple entities such as synchronous power sources, asynchronous power sources, and loads, directly reflecting the grid’s frequency support capability during the primary frequency regulation phase after a disturbance. The larger the value, the stronger the grid’s frequency support capability.

2.1.3. AC Channel Utilization Ratio Indicator

Within AC/DC hybrid transmission sections, a fault in the DC line can cause power flow fluctuations in the transmission channel, affect the operational synchronism between the sending-end grid and the receiving-end grid, and increase the risk to transient stability. As a result, due to the transient stability constraints imposed by DC line faults, the power transfer limit of the AC channel is usually significantly lower than the level allowed by static stability.
The AC channel utilization ratio indicator reflects the impact of transient stability constraints on the power transmission capacity of the AC channel, triggered by faults within the DC transmission line. It indicates the effective utilization of the AC channel under the requirement of maintaining synchronism [25]. This indicator is mainly influenced by the configuration of the AC/DC transmission channel and the strength of the sending-end and receiving-end AC systems. It comprehensively reflects the system’s ability to withstand power flow disturbances induced by the faults and maintain transient stability.
S ac _ i j = P ac _ i j c P ac _ i j max
In Equation (6), P a c _ i j c represents the maximum steady-state power flow of the AC channel between node i-th and node j-th that can maintain transient stability of the power grid under an N-1 contingency. P a c _ i j m a x denotes the total transmission capacity of the AC channel between node i-th and node j-th. The AC channel utilization ratio indicator ranges from [0, 1]. A lower value indicates lower utilization of the AC channel due to the impact of DC power flow transfer under fault conditions, while a higher value indicates higher utilization. In engineering practice, it is generally considered that when the utility ratio is less than 0.33, the system has weak transient stability; when it is between 0.33 and 0.5, the system has moderate transient stability; and when it is greater than 0.5, the system has strong transient stability. This indicator reflects the utilization efficiency of AC channels under transient stability constraints, directly connected to the coordination of AC/DC power transfer capabilities. The higher the indicator value, the smaller the impact of transient stability constraints on the maximum allowable power under normal operating conditions of the AC corridor. This indicates a higher steady-state power transfer capability, stronger AC interconnection, and thus greater overall transient stability of the power grid. Meanwhile, the utilization of the AC corridor is also higher.

2.2. Operational Security and Reliability Assessment

In load center power grids, common stability issues include high short-circuit currents, line overloading, low static stability margins of generators, and the risk of large-scale blackouts. To effectively assess the receiving-end grid’s ability to withstand various faults, an operational security and reliability evaluation indicator system can be established from five dimensions: power flow transfer security, short-circuit current security, frequency stability, rotor angle stability, and large-scale blackout risk.

2.2.1. N-1 Power Flow Transfer Resilience Indicator

When a large amount of DC power is injected into the receiving-end grid, the DC injection points become power flow convergence centers, which may lead to power flow congestion and security issues in the receiving-end power network. In the event of a fault on any single transmission line in the grid, power will shift to the remaining parallel AC lines, causing power flow shocks on the transmission channel. Therefore, the rational matching of power capacities between AC and DC transmission channels is a key criterion for evaluating the AC/DC strength balance relationship.
The rational matching of power flows between AC and DC transmission channels should focus on evaluating the capacity of the system to endure power flow transfer shocks under N-1 contingencies, in order to assess the security of power flow transfer during faults. This can be assessed using the N-1 power flow transfer resilience indicator, as defined in Equation (7) [26].
δ ac ,   dc = ( j = 1 n ac P ac   j cap P ac sta ) / P dc   i max
In the formula, δ a c , d c is the N-1 power flow transfer resilience indicator. P d c   i m a x is the maximum transmission power of a single DC line within the key transmission corridor of the receiving-end grid. P a c   j c a p is the transmission capacity of the j-th AC line. n a c is the number of AC lines in the key transmission channel of the receiving-end grid, and P a c s t a is the total steady-state transmission capacity of the AC lines in the key transmission channel. To ensure the security of power flow transfer, the N-1 power flow transfer resilience indicator must satisfy the requirement δ a c , d c > 1 .

2.2.2. Short-Circuit Current Margin Indicator

With the increase in power transmission capacity, short-circuit current levels also rise, and excessive short-circuit currents can pose serious threats to the safe operation of the power system. To assess the short-circuit current security of the grid, the short-circuit current margin indicator for receiving-end grid buses is defined as shown in Equation (8).
K sh = ( I b max - I short ) / I b max
where Ishort is the actual value of the short-circuit current at the bus during a fault, considering the most severe three-phase metallic short-circuit fault in the security assessment. Ibmax is the maximum allowable short-circuit current at the bus. Ksh is the short-circuit current margin indicator.
For 500 kV main grid buses in the receiving-end power system, Ibmax is typically set to 63 kA. If Ksh < 0, it indicates a short-circuit current security risk in the system. And if Ksh > 0, the short-circuit current level will remain within safe limits of the power system engineering, and the larger the value, the higher the safety margin of power system.

2.2.3. Frequency Stability Margin Indicator

In load center power grids, generators may be connected to the main grid with a weak connection. An N-1 incident in the generator output line may cause the generator to reach its static stability limit. The generator static stability margin indicator is defined as shown in Equation (9).
K st = P g max P g P g max
In the formula, Pgmax is the output limit of the generator to maintain static stability, usually taken as the value under the generator output line N-1 contingency condition. Pg is the generator output under normal conditions. And Kst is the static stability margin indicator. Kst should be greater than zero, and the larger the value, the better.

2.2.4. Rotor Angle Stability Indicator

To assess the transient stability of system under fault conditions, the maximum value of rotor angle difference for generators can be checked. The rotor angle stability of system is characterized by the maximum power angle difference between generators, as defined in Equation (10).
Δ θ max = max ( θ i θ j )
In the formula, Δ θ m a x represents the maximum rotor angle difference in the generators, and max() denotes taking the maximum value. In engineering practice, based on the equal area criterion, the threshold for the maximum rotor angle difference to ensure transient stability is obtained as Δ θ t h . The system can maintain synchronous stable operation under different operating conditions only if this indicator is satisfied.

2.2.5. Large-Scale Blackout Risk Indicator

There are various methods to assess the risk of large-scale blackouts. Here, the Chinese security and stability criterion is selected, which states that have no load shedding after an N-1 contingency, while load shedding is allowed after an N-2 contingency. The maximum load shedding capacity indicator under the N-2 condition is used here as the indicator of large-scale blackout risk.
K bl = P L max
where PLmax is the maximum amount of load shedding under various N-2 contingencies, and Kbl is the blackout risk indicator. Kbl is always greater than zero, and the smaller the value, the better.

3. Evaluation Process for the Rationality of AC/DC Strong–Weak Balance Relationship in the Receiving-End Grid

3.1. Rationality Evaluation Model for the AC/DC Strength Balance Relationship

The entropy weight method is used to couple and compute various indicators. The specific procedure for establishing the rationality evaluation model of the AC/DC strength balance relationship is as follows. First, obtain the entropy weight coefficients corresponding to each indicator and construct the comprehensive weight matrix A for the evaluation indicators as shown in Equation (12).
A = A 1 A 2 A 9

3.1.1. Indicator Membership Function Classification

For the assessment of the receiving-end grid strength, the evaluation includes the voltage stiffness indicator for voltage support capability, the inertia level and frequency deviation factor for frequency support capability, and the AC channel utilization ratio indicator for transient stability evaluation. In addition, for evaluating the operational security and reliability of the receiving-end grid under fault conditions, the indicators include the short-circuit current margin indicator for assessing the risk of excessive short-circuit current, the generator static stability margin for frequency stability, and the maximum load shedding indicator for assessing the risk of large-scale blackouts. Each of these indicators adopts membership functions corresponding to three evaluation levels—weak, moderate, and strong, with the respective membership functions defined as follows.
λ i 1 = 1 , x i e 1 x i e 2 e 1 e 2 , e 1 < x i < e 2 0 , x i e 2
λ i 2 = x i e 1 e 2 e 1 , e 1 < x i < e 2 x i e 3 e 2 e 3 , e 2 < x i < e 3 0 , x i e 3 , x i e 1
λ i 3 = 0 , x i e 2 x i e 2 e 3 e 2 e 2 < x i < e 3 1 , x i e 3
where λ i k represents the membership degree of indicator i corresponding to evaluation level k , where k = 1, 2, 3, respectively, denoting the evaluation levels of poor, moderate, and good. i = 1, 2, 3, 4, 5, 6, 7, respectively, correspond to the voltage stiffness indicator, inertia level indicator, frequency deviation factor indicator, AC channel utilization ratio indicator, short-circuit current margin indicator, generator static stability margin indicator,; and maximum load shedding capacity indicator. e 1 ,   e 2 ,   e 3 are the indicator values corresponding to a membership degree of 1 for the weak, moderate, and strong levels, respectively.
For the N-1 power flow transfer resilience indicator, which is used to evaluate the security of power flow transfer, and the maximum rotor angle difference in generators, which is used to assess rotor angle stability under fault conditions, membership function is adopted with two evaluation levels—qualified and unqualified.
λ i k = 1 , e 0 < x i < e 4 0 , x i e 0 , x i e 4
In the formula, λ i k represents the membership degree of indicator i corresponding to evaluation level k , where k = 0, 4 denote the evaluation levels qualified and unqualified, respectively. i = 8, 9 correspond to the N-1 power flow transfer resilience indicator and the maximum rotor angle difference in generators, respectively. And e 0 ,   e 4 are the indicator values corresponding to a membership degree of 1 for the qualified and unqualified levels, respectively.

3.1.2. Comprehensive Scoring Model

For the voltage stiffness indicator, inertia level indicator, frequency deviation factor indicator, AC channel utilization ratio indicator, short-circuit current margin indicator, generator static stability margin indicator, and maximum load shedding indicator, the evaluation levels of weak, moderate, and strong correspond to scores of 60, 80, and 100, respectively. The specific scoring rules are as follows.
W i k = 60 , k = 1 80 , k = 2 100 , k = 3
where W i k represents the score of the i -th indicator corresponding to the k -th evaluation level. For the N-1 power flow transfer resilience indicator and the maximum rotor angle difference in generators, the evaluation levels of qualified and unqualified correspond to scores of 100 and −∞, respectively. The specific scoring rules are as follows.
W i k = 100 , k = 0 , k = 4
Finally, the comprehensive score for the rationality of the AC/DC strength balance relationship in the power grid is calculated as shown in Equation (19).
W = i = 1 A i W i k λ i k k = 1 λ i k
where W represents the rationality score of the AC/DC strength balance relationship.
Based on the calculated rationality score, the evaluation levels are classified. When W < 60, the rationality evaluation level is unqualified. When 60 ≤ W < 80, the evaluation level is weak. When 80 ≤   W < 90, the evaluation level is moderate. When 90 ≤ W < 100, the evaluation level is strong.

3.1.3. Sensitivity Analysis

To further verify the robustness of the rationality evaluation model, a sensitivity analysis of the indicator weights is conducted. Five key indicators significantly affecting AC/DC power balance are selected: voltage stiffness, system inertia level, short-circuit current margin, AC corridor utilization, and large-scale blackout risk. For each indicator, its entropy-based weight is adjusted by ±10% within a reasonable fluctuation range. Then, the comprehensive rationality score for the AC/DC power balance is recalculated using Equation (19).
Assuming the original weights for voltage stiffness, system inertia level, short-circuit current margin, AC corridor utilization, and large-scale blackout risk are 0.18, 0.15, 0.20, 0.17, and 0.10, respectively, the original comprehensive score W for a provincial test system is 82.5, where the short-circuit current level is relatively high. After adjusting each key indicator’s weight, the maximum fluctuation in the score is 2.06%, occurring when the weight of the short-circuit current margin is reduced by 10%. The minimum fluctuation is 0.24%, occurring when the weight of the large-scale blackout risk indicator is reduced by 10%. All score variations remain within 3%, indicating the model is robust to minor variations in indicator weights.
Among the indicators, the short-circuit current margin has the greatest influence on the overall score, implying it most directly reflects the AC/DC power balance strength. Therefore, changes in its weight more significantly impacts the overall evaluation. In this case, the short-circuit current margin is relatively low, making it a weak point that should be prioritized in grid planning. Accordingly, when assessing the rationality of AC/DC balance in real-world systems, increasing the weight of weak indicators and reducing that of more tolerant dimensions can help emphasize critical aspects.
Overall, compared with the Analytic Hierarchy Process (AHP), the entropy weight method determines weight based on the dispersion of target data, effectively avoiding subjective bias and enabling a more accurate quantification of technical dimension importance, better aligning with actual grid operation characteristics. Compared with Principal Component Analysis (PCA), the entropy weight method retains the physical meaning of each indicator, with every weight directly corresponding to its contribution to AC/DC balance. This allows a more comprehensive reflection of the grid’s multidimensional characteristics and plays a key role in guiding structural optimization.

3.2. Evaluation Scheme for the Rationality of AC/DC Strength Balance Relationship

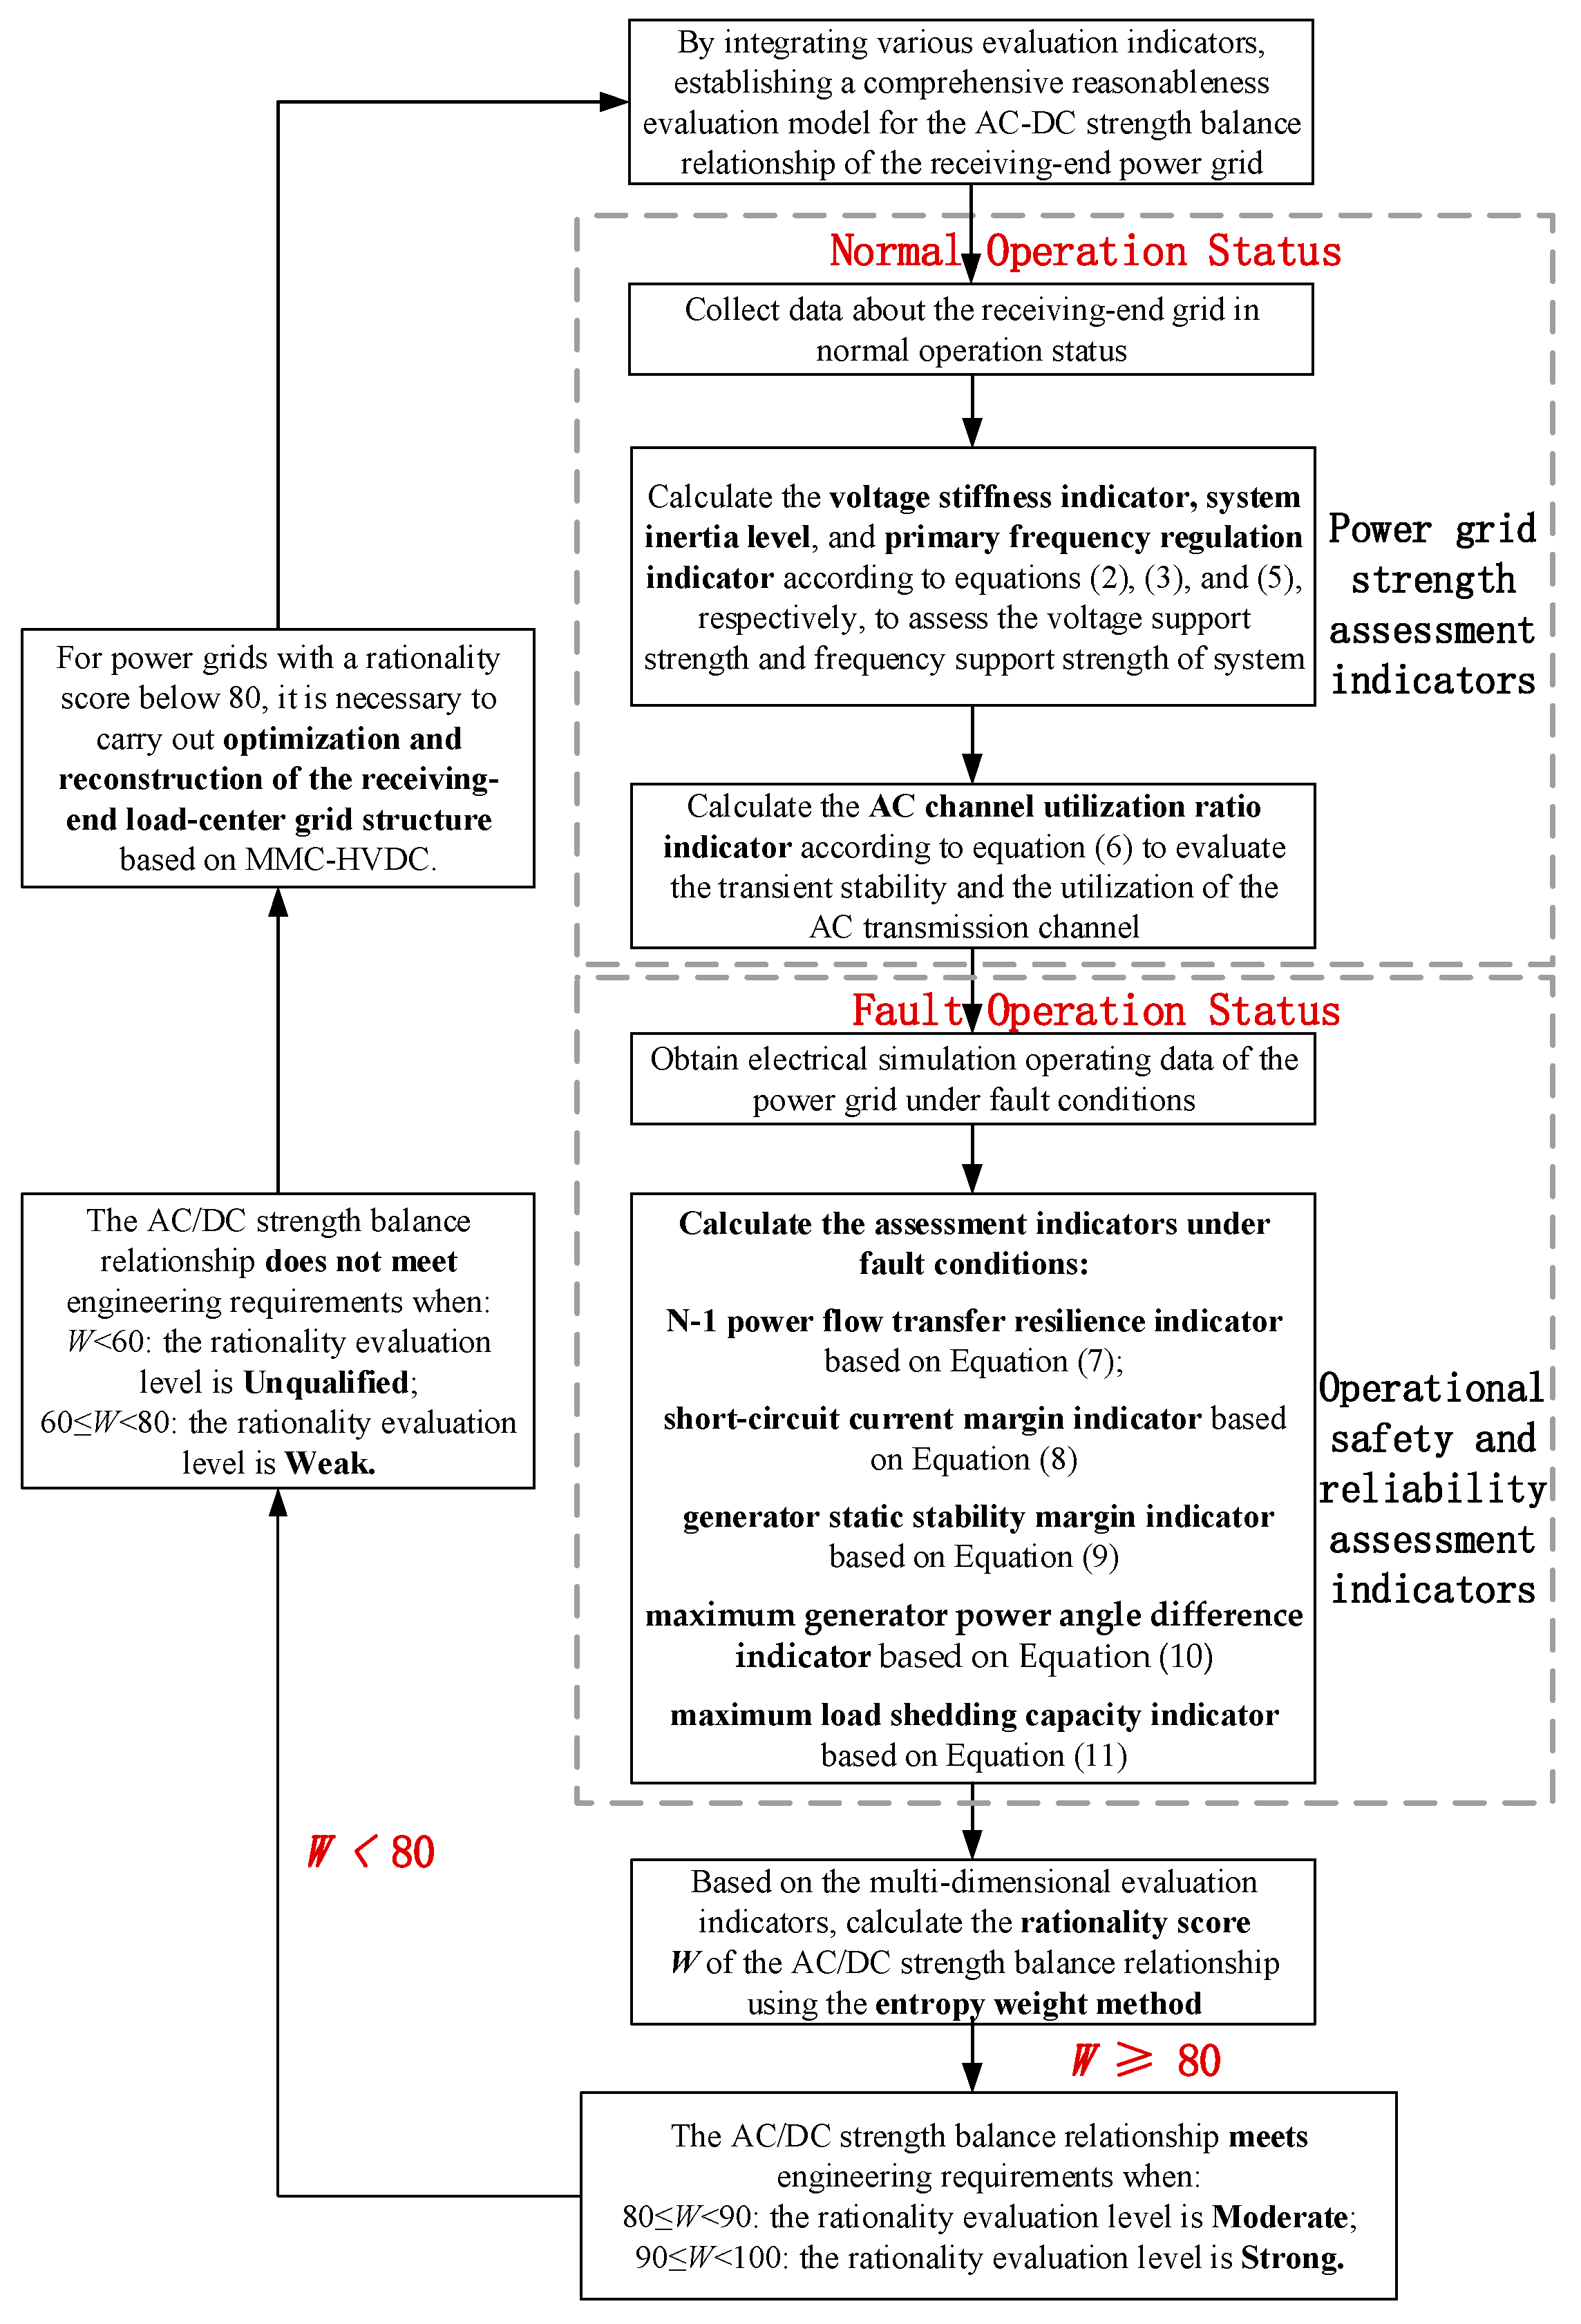
Based on the above multidimensional evaluation indicator system for the AC/DC strength balance relationship, the evaluation process for the rationality of AC/DC strong–weak balance relationship in the receiving-end power grid is shown in Figure 2. The specific steps are as follows.
(1)
Taking into comprehensive consideration the various evaluation indicators of grid strength and operational security and reliability, establish a complete reasonableness evaluation model for the AC-DC strength balance relationship of the receiving-end power grid.
(2)
Collect data AC-DC hybrid network topology, AC and DC transmission channel capacities and actual power flows, generator output statuses, operating characteristics of non-synchronous power sources, short-circuit currents, and other relevant information of the receiving-end grid, and sequentially calculate the values of each evaluation indicator.
(3)
First, calculate the voltage stiffness indicator, system inertia level, and primary frequency regulation indicator separately to assess the voltage support strength and frequency support strength of power system. When the voltage stiffness indicator is below 0.95, the grid is considered to have weak voltage support strength; similarly, when the inertia level is low, the grid is considered to have weak frequency support strength.
(4)
Calculate the AC channel utilization ratio indicator to evaluate the transient stability and the utilization rate of the AC channel in grid. When the indicator is less than 0.33, it is considered that the transient stability is poor under single-circuit channel blocking conditions, and the channel utilization is low, indicating resource waste.
(5)
Next, simulate and calculate various operational security and reliability indicators of the grid under fault conditions. Specifically, calculate the N-1 power flow transfer resilience indicator, short-circuit current margin indicator, generator static stability margin indicator, maximum rotor angle difference indicator, and maximum load shedding capacity indicator, and evaluate whether they meet engineering safety requirements.
(6)
For the above indicators, calculate the rationality score of the AC/DC strength balance relationship in the grid based on the entropy weight method. For grids with a score below 80, optimization and reconstruction of the receiving-end load center grid structure are required.

4. Structural Enhancement Method for the Receiving-End Power Grid Based on MMC–HVDC

To balance the stability and economic requirements of the load center in the receiving-end power grid, a grid enhancement and reconstruction scheme combining MMC–HVDC technology with network decoupling techniques can be adopted.

4.1. Role of MMC–HVDC in Improving the Security and Stability of Load Center Grid

The typical structure of a two-terminal MMC—HVDC system is shown in Figure 3. Under fault conditions, the MMC—HVDC technology has a low contribution to the grid’s short-circuit current level and it is capable of providing flexible and stable support to the power grid across different operating conditions, which makes it an excellent approach to maintain sufficient short-circuit current and stability safety margin of the load center in the receiving-end power grid. MMC–HVDC technology demonstrates outstanding performance in enhancing power grid security and stability.
(1)
Security Enhancement
Due to the presence of high-density loads, the receiving-end load center experiences heavy power flow and strong electrical coupling. The equivalent electrical distance between synchronous generators and nodes is short, resulting in a significant contribution to short-circuit current during faults and a high risk of exceeding short-circuit limits. Given the high loading of transmission lines and the power redistribution patterns under N-1 contingencies, key lines in the load center face a high risk of overload during such events.
To address the risks of excessive short-circuit currents and overloads, decoupling technologies can increase the electrical distance between load nodes, helping to mitigate these issues. However, this also weakens AC interconnection strength, reduces system stability support, and lowers the static stability margin of generators, ultimately degrading overall system stability. MMC–HVDC technology, with its highly controllable power flow and much lower short-circuit current contribution compared to synchronous generators, serves as a key technology for enhancing load center security, effectively resolving short-circuit overcurrent and line overload problems.
(2)
Stability Enhancement
Considering the contradiction between enhancing grid security and reducing stability with decoupling technology, MMC–HVDC technology can be adopted to reduce the electrical coupling of the grid, thereby lowering the risk of large-scale blackouts. Compared with conventional HVDC systems, MMC–HVDC features decoupled control of active and reactive power, enabling flexible power flow regulation and providing stable support to the receiving-end grid. This helps maintain voltage and frequency stability under various operating conditions.
Additionally, MMC–HVDC can share the power transfer burden of transmission lines, effectively reducing the risk of N-1 line overloads and enhancing the static stability margin of generators. As a result, it significantly improves the overall operational stability of the load center without increasing the risks of excessive short-circuit current or line overloading.
Based on the above analysis, MMC–HVDC technology can simultaneously enhance both the security and stability of high-density load centers. Considering its high cost, a grid enhancement scheme that combines decoupling technology with MMC–HVDC is adopted to balance economic efficiency with safety and stability requirements.

4.2. Enhancement Method of the Load Center Grid

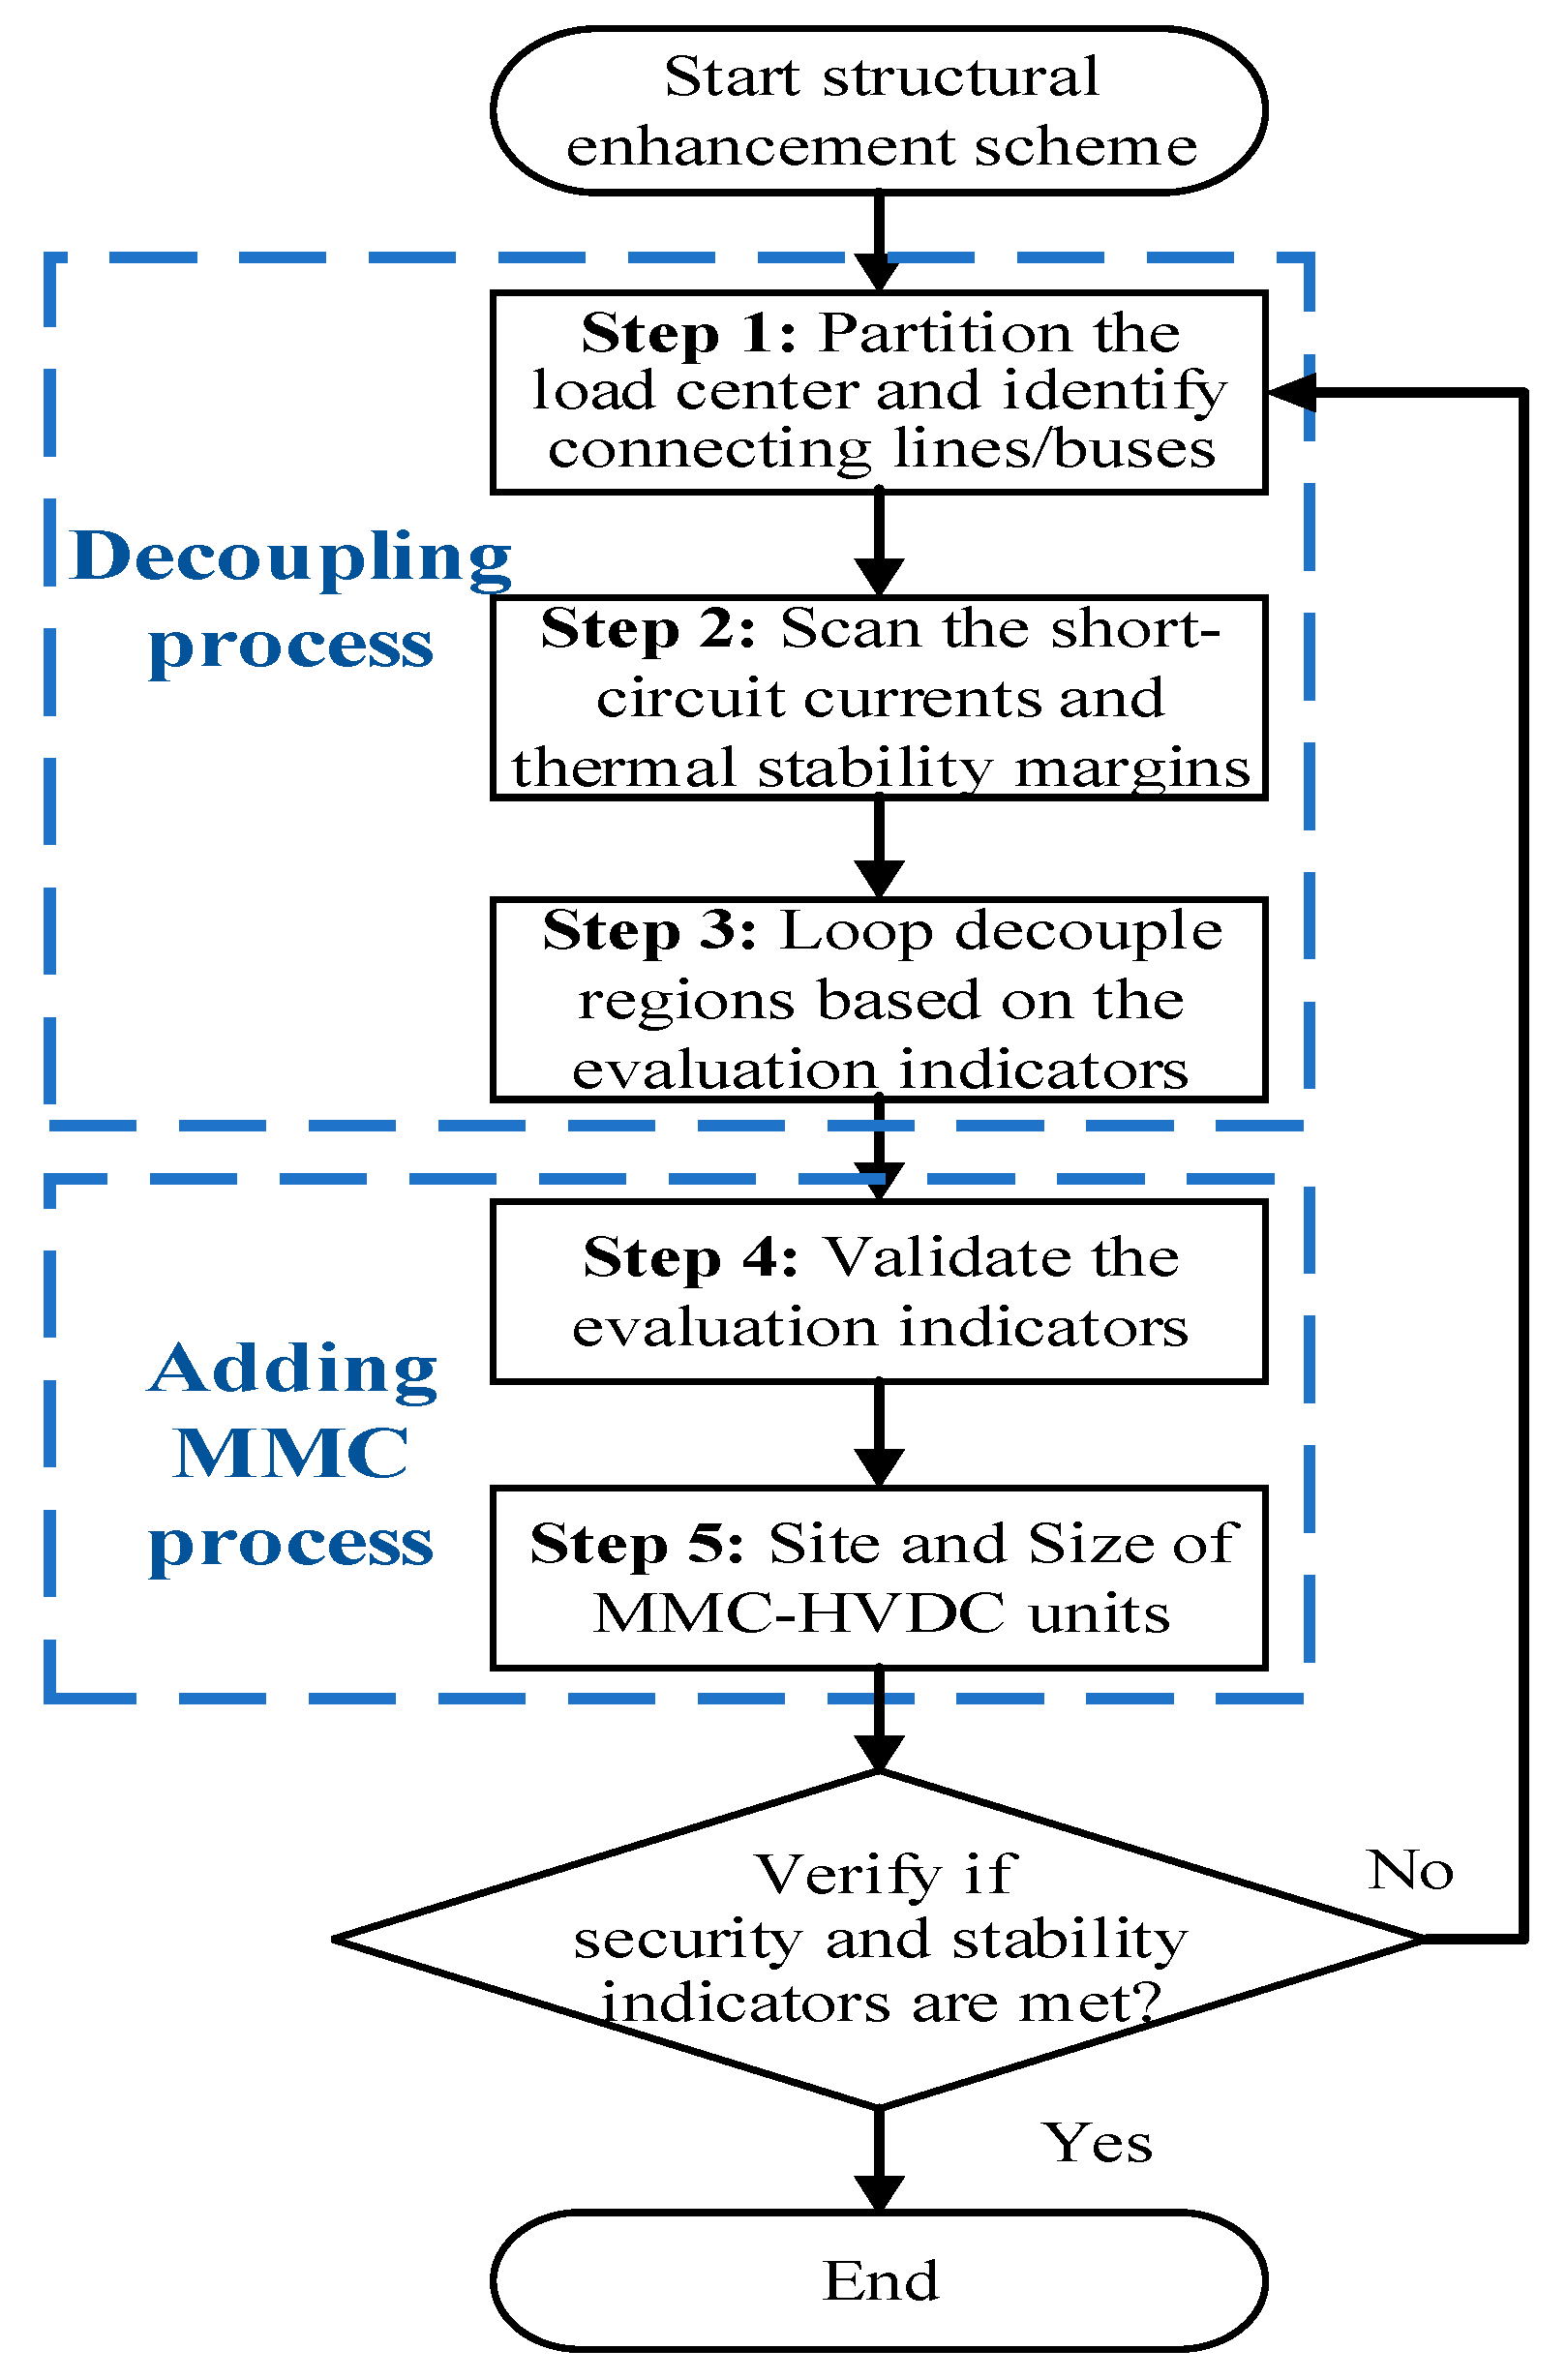
To enhance the security and stability of load centers, a grid reinforcement scheme combining decoupling technology and MMC–HVDC technology is proposed. The process flow is shown in Figure 4. The specific steps are as follows.
(1)
Based on the partitioning structure of the load center, evaluate the short-circuit current margin at all buses in the grid, and identify key buses with a high risk of short-circuit current exceeding the limit.
(2)
Decouple the identified key buses with high short-circuit current risk from other partitions, reducing the short-circuit current level at the load center of the receiving grid to within the safety limits allowed by engineering standards.
(3)
Assess the operational stability of the grid after decoupling by scanning the generator static stability margin and the large-scale blackout risk indicators and identify areas with higher stability risks.
(4)
Determine the location of MMC–HVDC units and add MMC–HVDC lines at key buses between areas with high blackout risk and nearby areas with stronger grid strength.
(5)
Determine the capacity of the MMC–HVDC units to reduce the large-scale blackout risk and improve generator static stability margin to within engineering-acceptable ranges. The units should be designed with a certain long-term overload capability to adapt to various operating conditions.
(6)
Assess the operational security of the load center by scanning the short-circuit current margin indicator and assess the operational stability by scanning both the large-scale blackout risk and generator static stability margin indicators. If all indicators meet engineering requirements, the proposed grid reinforcement scheme is deemed reasonable; otherwise, return to previous steps for re-planning.

5. Case Analysis

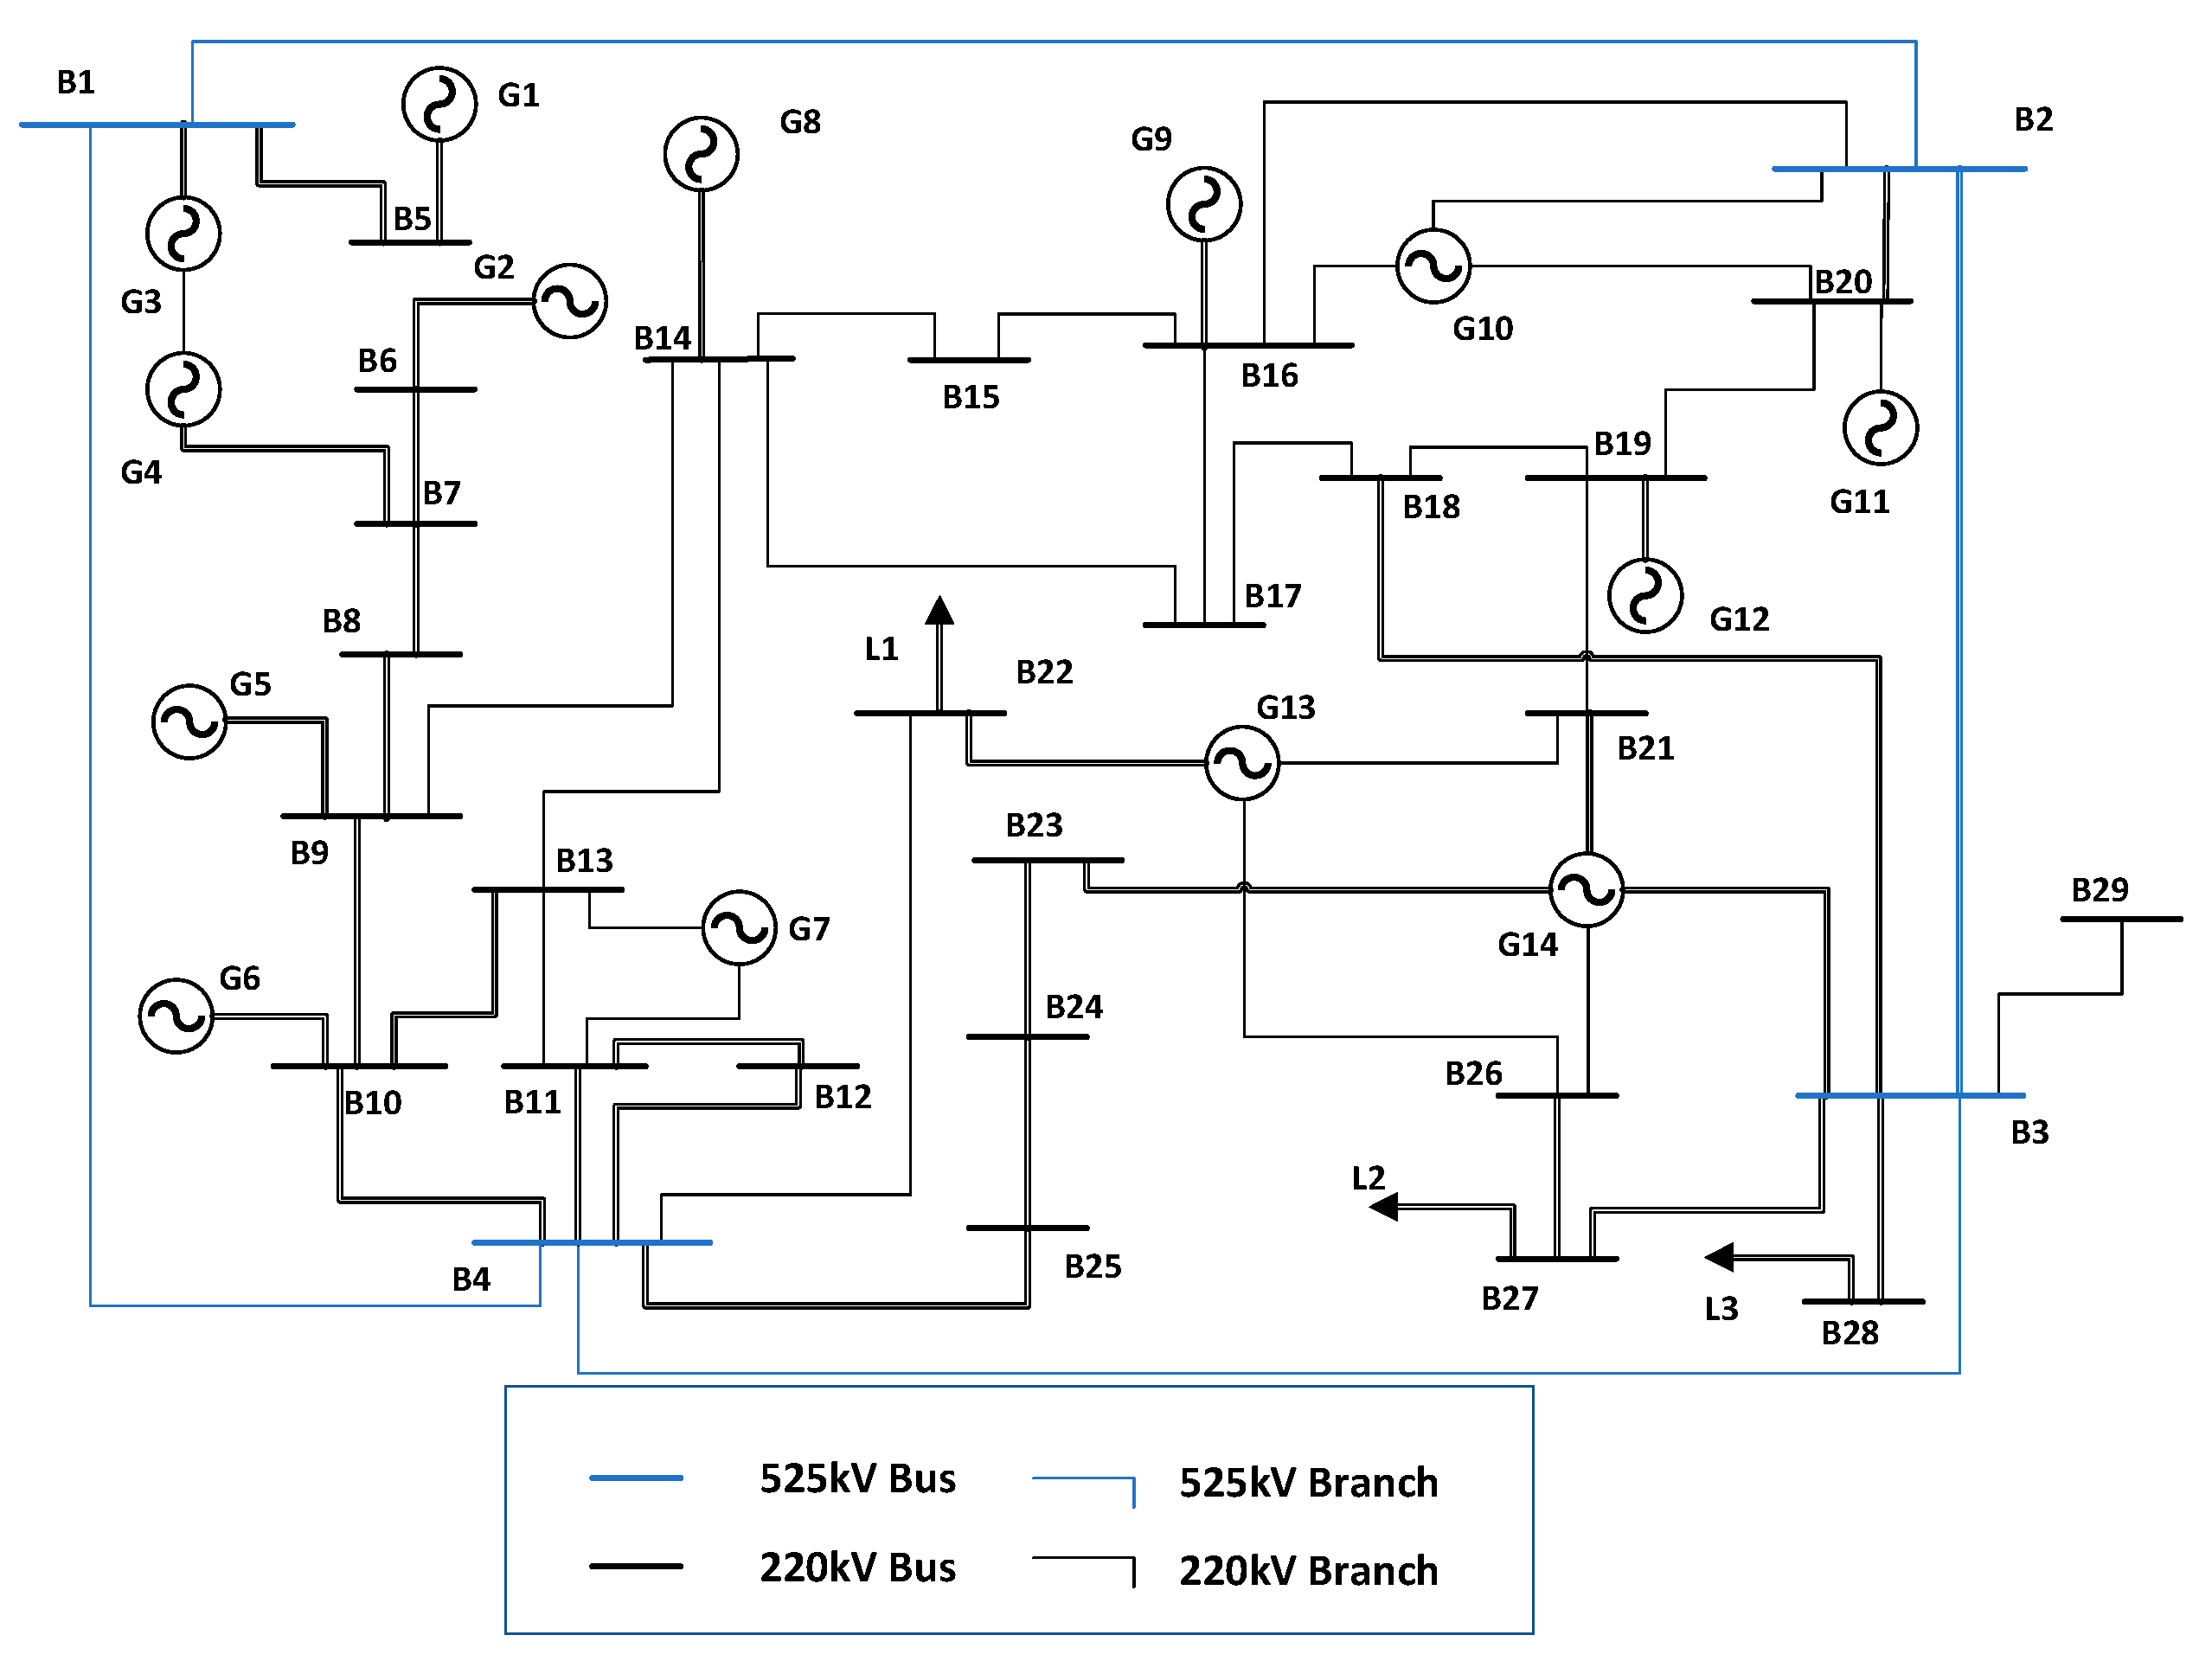
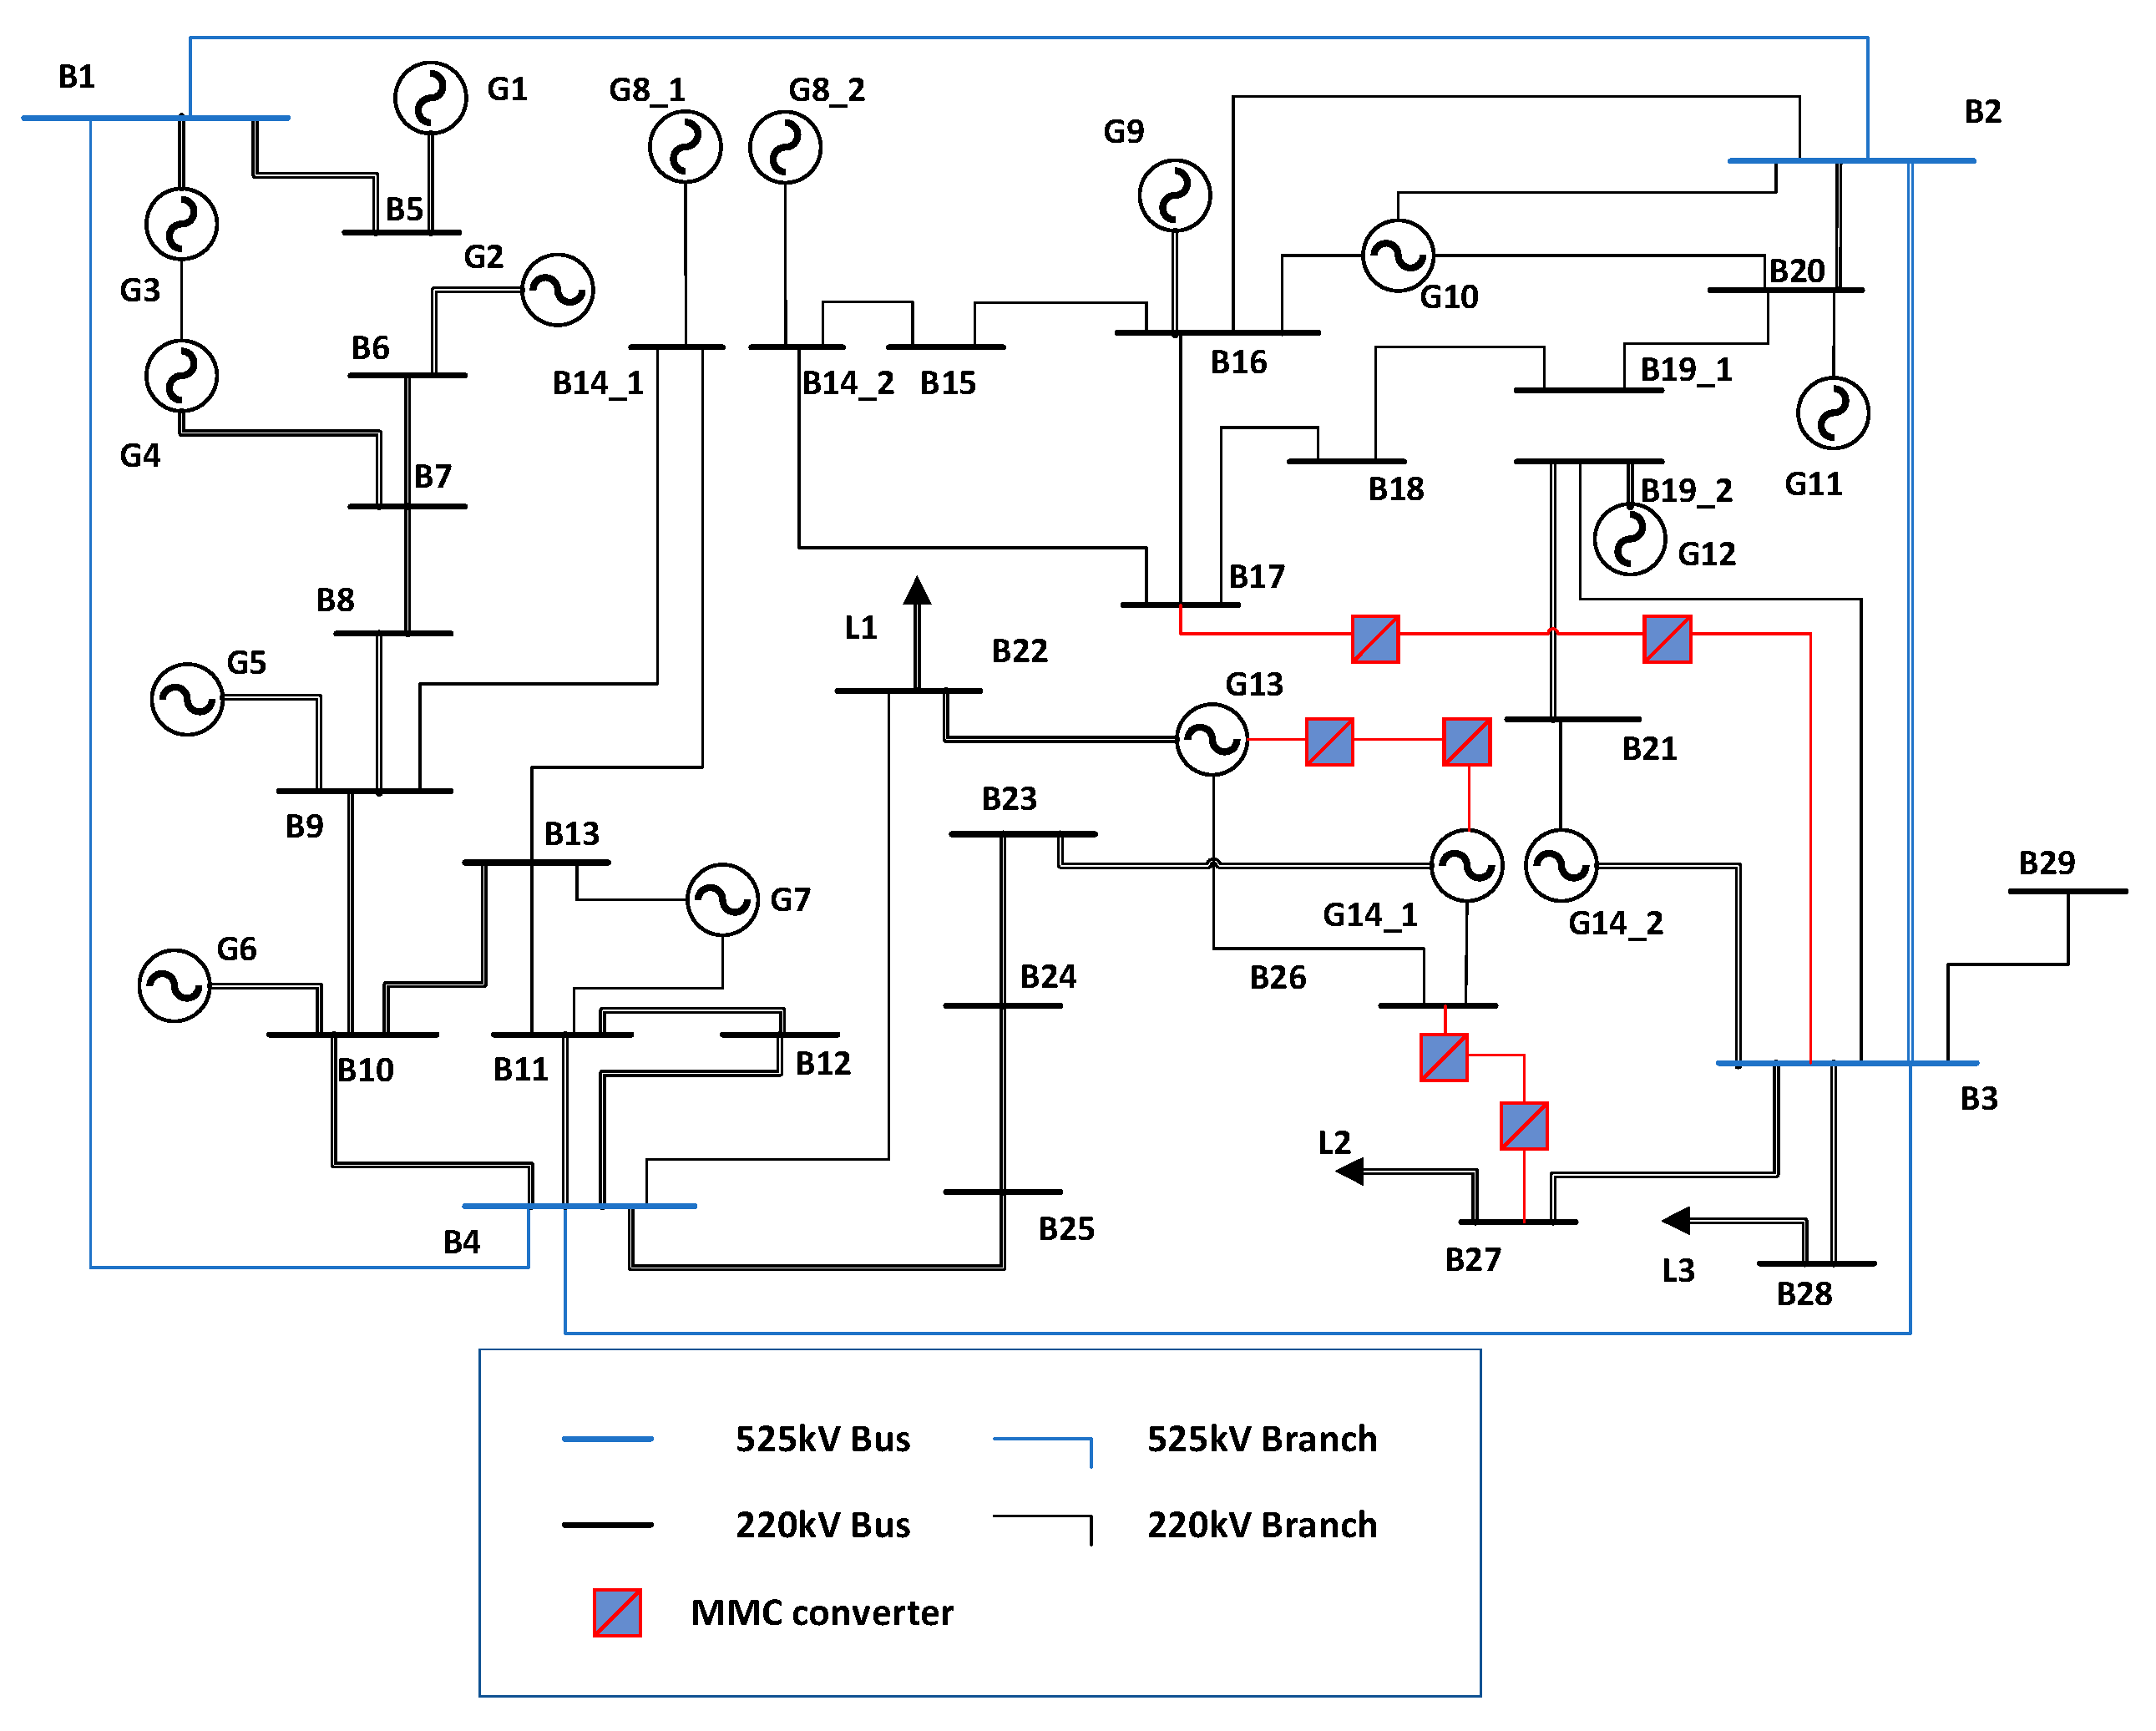
The proposed method in this study will be validated through simulation using a provincial power grid system. The simulation is conducted using the PSD-BPA software (version 5.5.0). Figure 5 shows the one-line diagram of the test grid before reinforcement, representing a high-density load center divided into four regions: Region 1, Region 2, Region 3, and Region 4. The grid partitioning is based on the locations of the 525 kV buses B1, B2, B3, and B4. The following sections will present the planning process of the grid reinforcement scheme and analyze its effectiveness in enhancing security and stability.
First, a security analysis is conducted on the test power grid by evaluating the short-circuit current margins across all nodes. Key buses that do not meet engineering requirements in terms of short-circuit current margin indicators are summarized in Table 1. Since the 220 kV network features tight electrical coupling and high electrical strength, it can withstand load and power flow transfers caused by faults in the 525 kV network. Therefore, the risk of overload in each area is relatively low, and reinforcement is not considered for this load center grid.
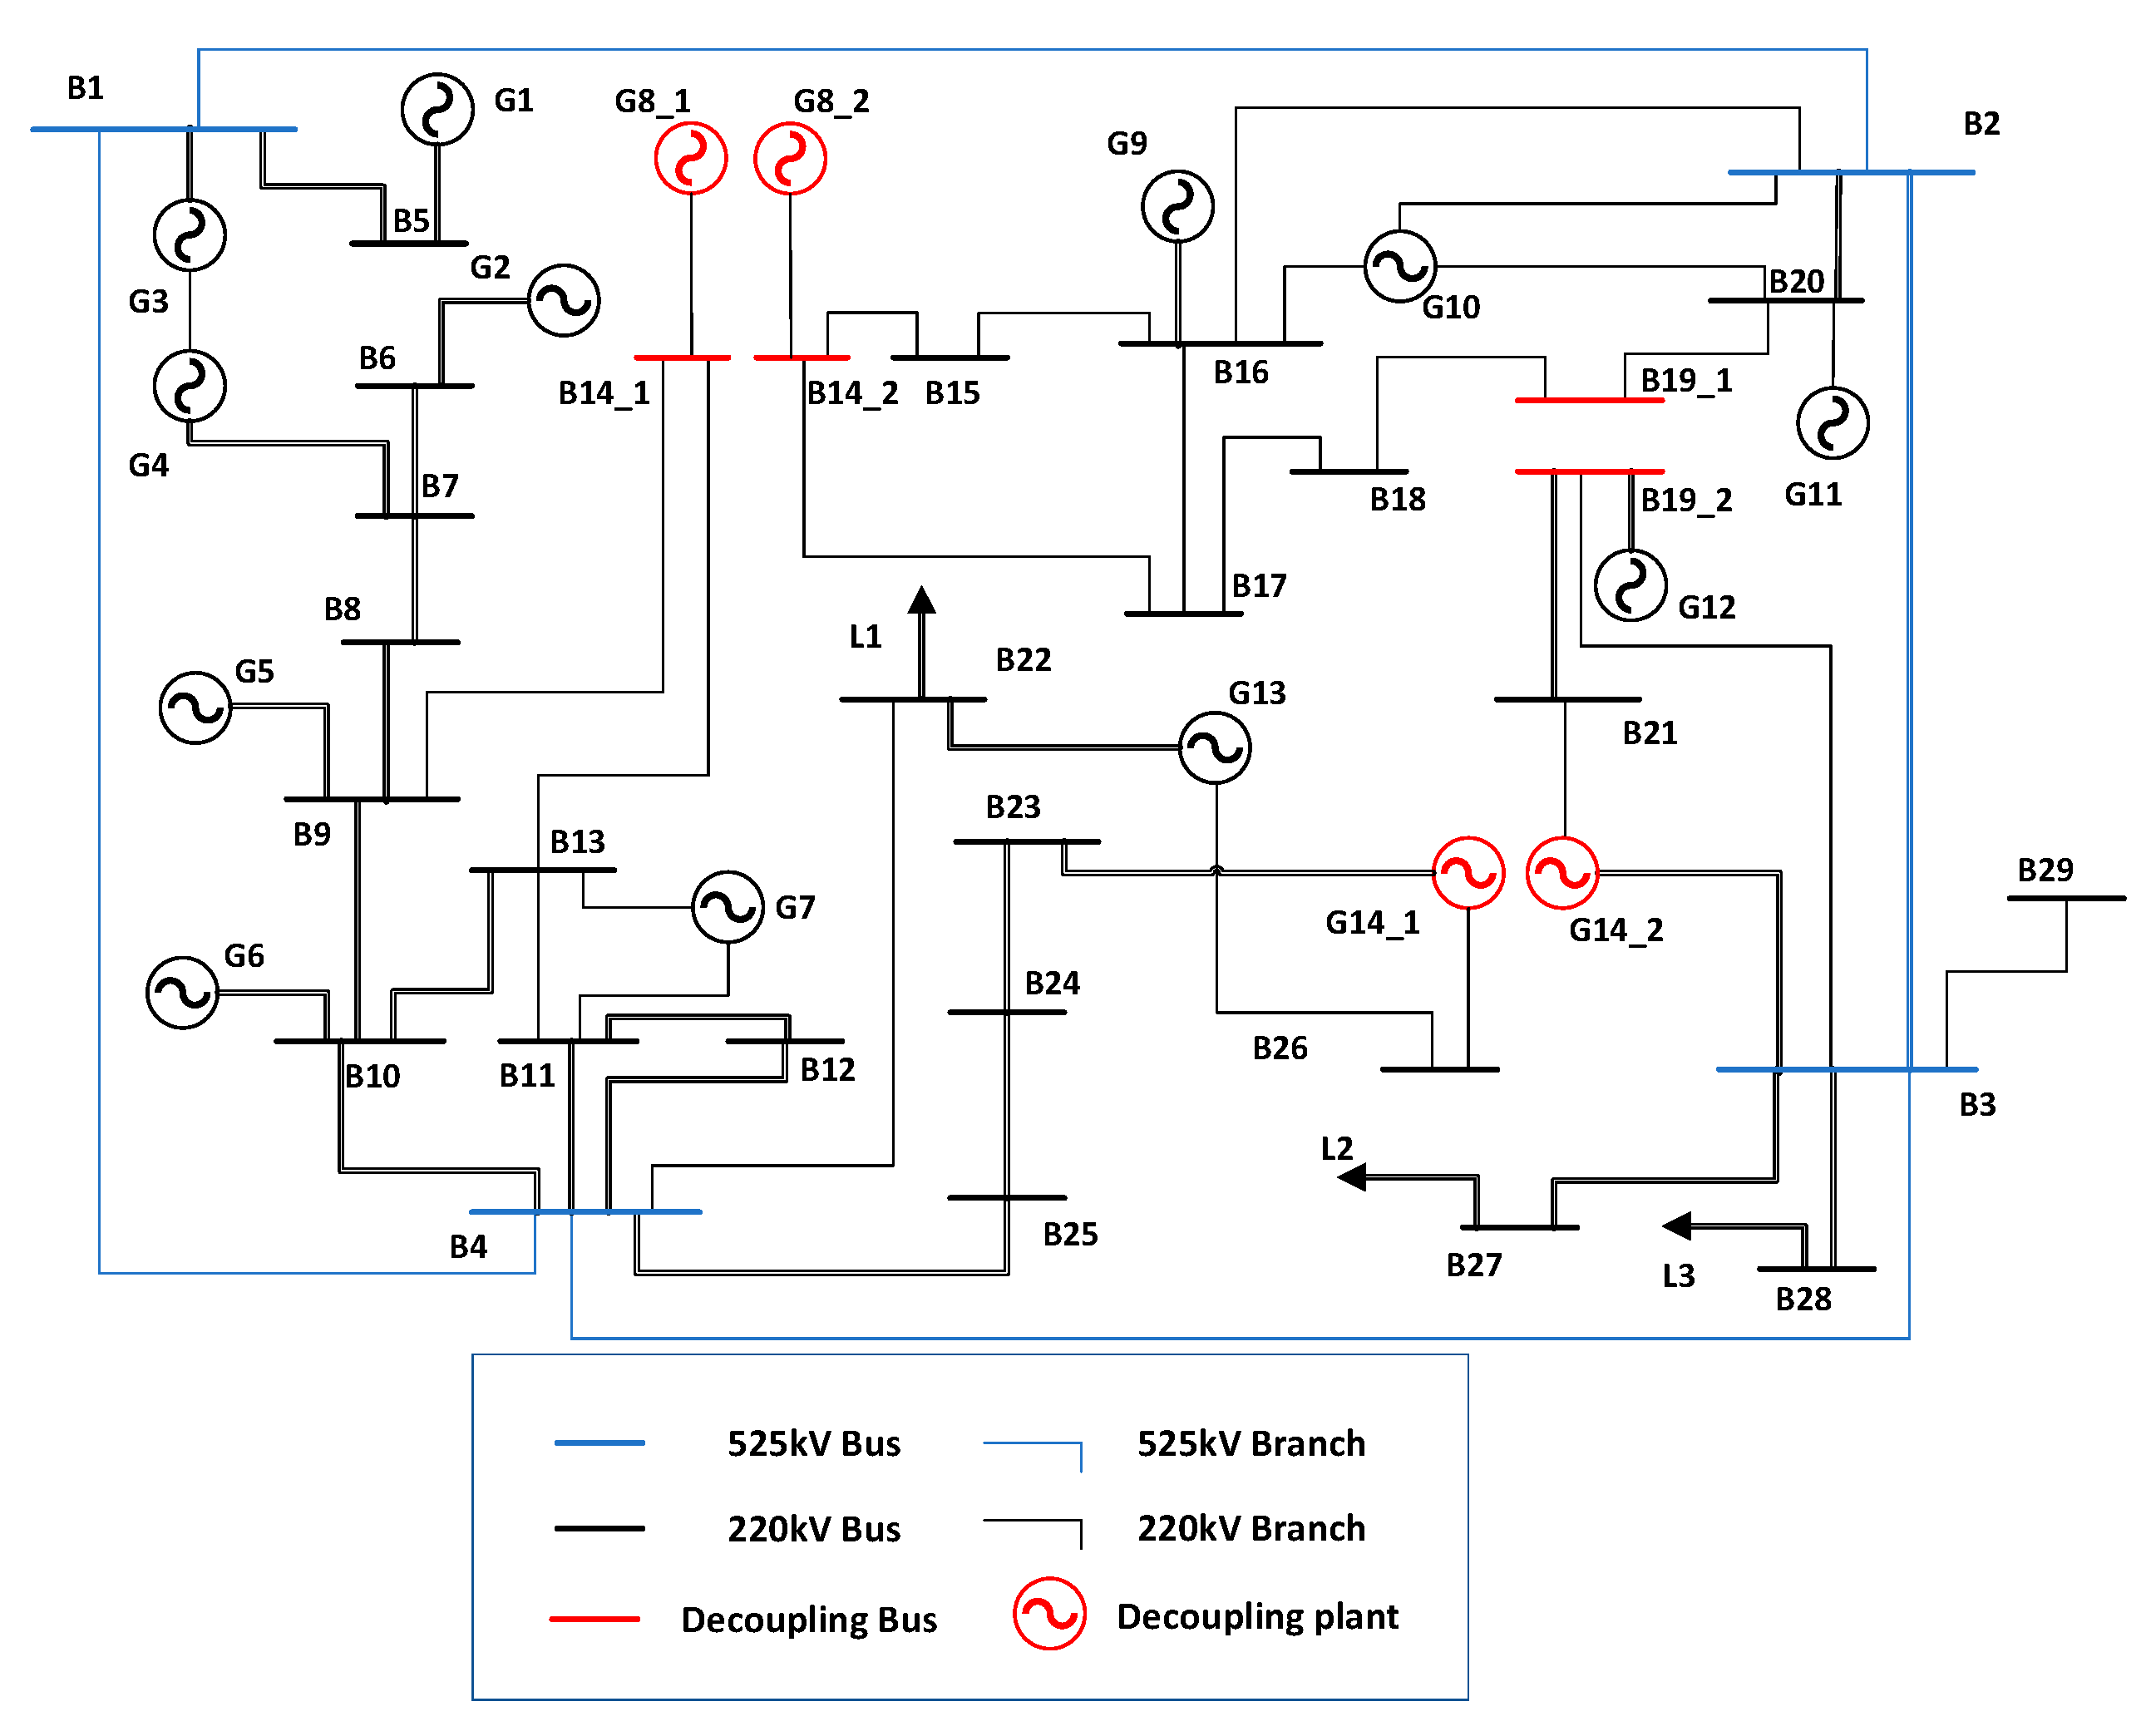
As shown in Table 1, the key buses with the risk of short-circuit current exceeding the limit are mainly concentrated in Region 2 and Region 3. Next, in order to reduce the short-circuit current level of the grid by using decoupling technology, it is necessary to disconnect Region 2 and Region 3 from other areas with close electrical distance. Decoupling is carried out at buses B14, B19, G8, and G14. The system operates in partitioned mode, and some inter-area connecting lines are disconnected. The diagram of the test system after loop decoupling is shown in Figure 6.
After loop decoupling, the short-circuit currents at all nodes return to the normal range. The operational stability of the decoupled test system is analyzed below. It is found that there exists a risk of large-scale blackouts in Region 2 and Region 4. When line B3-B4 and line B1-B4 are, respectively, in outage and N-1 fault states, a wide-area blackout will occur in Region 4. At buses B2 and B4, there are two transformers each. When the two transformers on the same bus are, respectively, in outage and N-1 fault states, large-scale blackout risks will occur in Region 2 and Region 4, respectively. It is found that the large-scale blackout risk indicators increases sharply after decoupling. And the blackout risk indicator of Region 2 is 640.1 MW, and the indicator of Region 4 is 1040.8 MW.
According to the detection results of the large-scale blackout risk indicator, the areas to be reinforced are identified as Region 2 and Region 4, while the area with the highest electrical strength is Region 3, which has the lowest blackout risk indicator. To enhance the grid’s stability support, MMC–HVDC technology is required to connect Region 2 and Region 4 with the electrically stronger Region 3. Therefore, the locations of the MMC–HVDC units are determined between buses B17-B3, G13-G14_1, and B26-B27. The capacity design is shown in Table 2. To ensure operational stability under extreme conditions in the project, each MMC–HVDC unit is equipped with a long-term overload capability of 1.2 times its rated capacity. Then, the diagram of the load center grid after adding MMC–HVDC is shown in Figure 7.
The short-circuit current margin indicators and the large-scale blackout risk indicators before and after the application of the enhancement scheme are listed in Table 3. As shown in Table 3, the short-circuit currents levels have returned within acceptable engineering limits, offering sufficient safety margins. And the large-scale blackout risk indicators before and after adding MMC–HVDC units are presented in Table 4. After the integration of MMC–HVDC, the large-scale blackout risk is significantly reduced compared to the decoupling structure without MMC–HVDC, nearly equivalent to that under the original system structure before the grid reinforcement. Following the reconstruction, the issue of excessive short-circuit current in the test grid has been effectively resolved, eliminating the blackout risk caused by the loop decoupling.
The load of the provincial power grid shows a year-on-year increasing trend. To further verify the effectiveness of the proposed structural optimization method under high-load scenarios, two new operating conditions—1.2 times and 1.5 times the rated load, are added based on the original test system. Analysis of the receiving-end grid reinforcement and reconstruction schemes is then continued under these conditions.
As illustrated in Figure 4, after optimizing the structure of the receiving-end grid, the optimized strategies for both high-load scenarios still adopt the combined approach of network de-looping and MMC–HVDC technologies. The de-looping scheme remains consistent with that of the original test system and is depicted in Figure 6. Under the 1.2 times load condition, the MMC–HVDC capacity remains unchanged from the original scheme. However, under the 1.5 times load condition, the existing MMC–HVDC capacity is insufficient to meet the system’s power transmission and stability control requirements, necessitating an adjustment in MMC–HVDC capacity configuration. Specifically, the B17–B3 MMC–HVDC link connects Region 2 and Region 3 and serves as a core corridor for balancing power transmission in high-load areas. The MMC–HVDC capacity of the B17–B3 corridor can be increased to 1.2 times the rated 600 MVA, i.e., 720 MVA, aligning with its long-term overload capability. This upgrade matches the power transfer needs from Region 2 to Region 3 under the 1.5 times load condition, effectively reducing line overload risk and short-circuit current pressure.
The next section analyzes the impact of the grid reinforcement and reconstruction schemes on power system security and stability under different loading scenarios, as outlined in Table 5.
The results analysis indicates that under different load conditions of the power grid, the grid structure reinforcement and reconstruction scheme improves the short-circuit current margin, ensuring that the busbar short-circuit current remains within the safety limit, with no risk of short-circuit current exceeding the threshold. Additionally, the blackout risk indicator significantly decreases, preventing cascading failures caused by load transfer. The voltage stiffness indicator remains above 0.955, and the AC corridor utilization exceeds 0.5, ensuring stability in high-load scenarios. Overall, and for each indicator, the proposed method effectively improves the AC/DC power balance relationship under both 1.2 and 1.5 times the rated load conditions. By optimizing the structure, it achieves coordinated control of short-circuit current, power transfer, and stability, further demonstrating the effectiveness and adaptability of the method.
The existing studies mainly focus on the application of either MMC technology or decoupling as a single approach in grid structure reconstruction [12,13,14]. Pure decoupling can effectively reduce short-circuit currents at a relatively low cost, but it significantly increases the risk of large-scale blackouts and offers only moderate stability improvement. The use of MMC–HVDC alone achieves high performance in all aspects—short-circuit reduction, blackout prevention, and stability enhancement, but comes with high implementation costs. In contrast, the proposed hybrid approach, which combines decoupling and MMC–HVDC, achieves high margins in all key indicators while maintaining a balanced trade-off between performance and cost, making it a more practical and robust solution for receiving-end grid reconstruction.

6. Conclusions

This paper establishes a multidimensional indicator evaluation system of the AC/DC strong–weak balance relationship intended for the receiving-end power grid and proposes a power grid stability enhancement strategy by combining network decoupling technology with the MMC–HVDC configuration. The main conclusions are as follows.
(1)
A quantitative method for the strength balance relationship of the receiving-end power grid in AC/DC hybrid grids is proposed, evaluating both grid strength under normal operation and operational safety and reliability under fault conditions, thereby establishing a multidimensional indicator evaluation system for the AC/DC strong–weak balance relationship.
(2)
By integrating the multidimensional indicator evaluation system with electrical parameters under different grid operating conditions, a rationality evaluation model for the AC/DC strength balance relationship based on the entropy weight method is developed, along with a complete evaluation process for assessing the rationality of the AC/DC strength balance relationship in the receiving-end power grid.
(3)
To address the issue of an unreasonable AC/DC strong–weak balance relationship and common problems in AC/DC power grids such as excessive short-circuit current and uncontrollable power flow, this paper proposes a power grid stability enhancement strategy that combines network decoupling technology with Modular Multilevel Converter HVDC (MMC–HVDC). This strategy leverages the advantages of network decoupling to reduce short-circuit current and prevent overloads, alongside the flexible active and reactive power regulation capabilities of MMC–HVDC, forming a MMC–HVDC-based structural optimization method for the receiving-end power grid, thereby providing stability assurance for the grid. The simulation of a typical test power grid system confirms that this enhancement approach effectively optimizes power flow behavior and stability, thereby enhancing the grid’s operational safety and efficiency.
While the proposed strategy effectively enhances the AC/DC strength balance and stability of receiving-end grids, practical implementation faces several key challenges that warrant attention. Firstly, the high capital cost of MMC–HVDC systems limits large-scale deployment [27]. Secondly, network decoupling relies on real-time communication between partitioned regions to coordinate power flow adjustments, introducing potential control delays that may degrade transient stability during fault recovery [28]. Additionally, the performance of the strategy is influenced by high penetration of renewable energy. In future research, efforts will be made to strengthen the development of relevant control algorithms and hardware-in-the-loop testing technologies to ensure the rapid response of decoupling control. Additionally, technical and economic analyses will be enhanced to optimize grid reinforcement and reconstruction schemes, achieving a balance between performance and cost.

Author Contributions

Conceptualization, H.C. and M.Y.; Methodology, M.Y.; Software, M.Y.; Validation, H.C. and G.W.; Formal analysis, H.C. and M.Y.; Investigation, X.H. and Q.W.; Data curation, M.Y.; Writing—original draft, M.Y.; Writing—review & editing, M.Y. and G.W.; Visualization, G.W. and Y.H.; Supervision, G.W. and Y.H.; Project administration, G.W.; Funding acquisition, H.C., X.H. and Q.W. All authors have read and agreed to the published version of the manuscript.

Funding

This research was supported by the Science and Technology Project of the State Grid Electric Power Co., Ltd. (Grant number: J2024157).

Data Availability Statement

The original contributions presented in this study are included in the article. Further inquiries can be directed to the corresponding author.

Conflicts of Interest

Authors Hui Cai, Xingning Han and Quanquan Wang were employed by the company State Grid Jiangsu Electric Power Co., Ltd., with Science and Technology Project of State Grid Electric Power Co., Ltd. (Grant number: J2024157). The remaining authors declare that the research was conducted in the absence of any commercial or financial relationships that could be construed as a potential conflict of interest.

References

  1. Papadis, E.; Tsatsaronis, G. Challenges in the decarbonization of the energy sector. Energy 2020, 205, 118025. [Google Scholar] [CrossRef]
  2. Impram, S.; Nese, S.V.; Oral, B. Challenges of renewable energy penetration on power system flexibility: A survey. Energy Strategy Rev. 2020, 31, 100539. [Google Scholar] [CrossRef]
  3. Liang, X.; Abbasipour, M. HVDC transmission and its potential application in remote communities: Current practice and future trend. IEEE Trans. Ind. Appl. 2022, 58, 1706–1719. [Google Scholar] [CrossRef]
  4. Yuan, S.; Chen, D.; Chen, T.; Tang, W.; Ma, S.; Luo, Y.; Song, Y.; Ren, J.; Zi, P.; Wang, Q.; et al. Coordinated control of multi-HVDC participating in three defense line at the receiving end of the power system with strong DC and weak AC. Electr. Power 2018, 51, 72–79. [Google Scholar]
  5. Majidi-Qadikolai, M.; Baldick, R. Stochastic transmission capacity expansion planning with special scenario selection for integrating N-1 contingency analysis. IEEE Trans. Power Syst. 2016, 31, 4901–4912. [Google Scholar] [CrossRef]
  6. Liu, B.; Wang, W.; Zhang, J.; Cheng, J.; Dong, Z.; Xu, Z. Active Power Coordination Control Method of Converter Stations of MMCDC System and UPFC in Jiangsu Power Grid Interconnected with the LargeScale Wind Power. South. Power Syst. Technol. 2024, 18, 138–145. [Google Scholar] [CrossRef]
  7. Lin, S.; Yang, Y.; Liu, M.; Xie, Y.; Lu, Y. Static voltage stability margin calculation of power systems with high wind power penetration based on the interval optimisation method. IET Renew. Power Gener. 2020, 14, 1728–1737. [Google Scholar] [CrossRef]
  8. Saha, S.; Saleem, M.I.; Roy, T.K. Impact of high penetration of renewable energy sources on grid frequency behaviour. Int. J. Electr. Power Energy Syst. 2023, 145, 108701. [Google Scholar] [CrossRef]
  9. Liu, Y.; Song, Y.; Wang, Z.; Shen, C. Optimal emergency frequency control based on coordinated droop in multi-infeed hybrid AC-DC system. IEEE Trans. Power Syst. 2021, 36, 3305–3316. [Google Scholar] [CrossRef]
  10. Bai, E.; Xu, J. Hierarchical Frequency Modulation Control Strategy for Large-Capacity AC/DC Hybrid Power System. J. Electr. Eng. Technol. 2024, 19, 2149–2158. [Google Scholar] [CrossRef]
  11. Jose, K.; Joseph, T.; Liang, J.; Ugalde-Loo, C.E. Auxiliary dead-band controller for the coordination of fast frequency support from multi-terminal HVDC grids and offshore wind farms. IET Renew. Power Gener. 2018, 12, 1444–1452. [Google Scholar] [CrossRef]
  12. Sun, S.; Zhou, G.; Song, Y.; Tang, X.; Zhou, Y.; Yuan, Z. Research on Measures to Limit Short-Circuit Current by Changing the Structure of the Power Grid. Energies 2025, 18, 2098. [Google Scholar] [CrossRef]
  13. Zhang, W.; Guo, R.; Shi, Y.; Tang, Y.; Lin, Y. A Power Grid Partitioning Method for Short-Circuit Current Considering Multi-Scenario Security with an Improved Direct Current Model. Energies 2023, 16, 7332. [Google Scholar] [CrossRef]
  14. Akbarzadeh Aghdam, P.; Khoshkhoo, H. Voltage stability assessment algorithm to predict power system loadability margin. IET Gener. Transm. Distrib. 2020, 14, 1816–1828. [Google Scholar] [CrossRef]
  15. Sau-Bassols, J.; Prieto-Araujo, E.; Gomis-Bellmunt, O.; Hassan, F. Series interline DC/DC current flow controller for meshed HVDC grids. IEEE Trans. Power Deliv. 2017, 33, 881–891. [Google Scholar] [CrossRef]
  16. Zhong, X.; Zhu, M.; Chi, Y.; Liu, S.; Cai, X. Composite DC power flow controller. IEEE Trans. Power Electron. 2019, 35, 3530–3542. [Google Scholar] [CrossRef]
  17. Lotfjou, A.; Fu, Y.; Shahidehpour, M. Hybrid AC/DC transmission expansion planning. IEEE Trans. Power Deliv. 2012, 27, 1620–1628. [Google Scholar] [CrossRef]
  18. Xin, H.; Zhang, F.; Yu, Y.; Gan, D.; Xu, Q. Generalized short circuit ratio for multi-infeed DC systems: Definition and theoretical analysis. Proc. CSEE 2016, 36, 633–647. [Google Scholar] [CrossRef]
  19. Lee, D.H.A. Voltage stability assessment using equivalent nodal analysis. IEEE Trans. Power Syst. 2015, 31, 454–463. [Google Scholar] [CrossRef]
  20. Lee, D.H.A.; Andersson, G. An equivalent single-infeed model of multi-infeed HVDC systems for voltage and power stability analysis. IEEE Trans. Power Deliv. 2015, 31, 303–312. [Google Scholar] [CrossRef]
  21. Shao, Y.; Tang, Y. Analysis of influencing factors of multi-infeed HVDC system interaction factor. Power Syst. Technol 2013, 37, 794–799. [Google Scholar] [CrossRef]
  22. Wu, X.; Lan, Q.; Li, Z.; Zhuang, K.; Miao, Y.; Li, W. Frequency characteristics of East China Power Grid after bipolar locking of ultra-high voltage direct current (UHVDC). J. Eng. 2017, 2017, 1237–1241. [Google Scholar] [CrossRef]
  23. Dai, Z.; Wang, J.; Pan, X.; Teng, Z.; Qin, L. A comprehensive power flow evaluation method for a transmission section with UHVAC/DC integration. Power Syst. Prot. Control 2020, 48, 65–72. [Google Scholar] [CrossRef]
  24. Xu, Z. Reasonable definition and calculation method of power grid strength under the background of new type power systems. High Volt. Eng. 2022, 48, 3805–3819. [Google Scholar] [CrossRef]
  25. Dong, H.; Xu, Z.; Qian, Y.; Si, D.; Song, P.; Xing, F. General Principle of Asynchronous Segment for AC/DC Synchronous Power Systems. High Volt. Eng. 2017, 43, 2167–2174. [Google Scholar] [CrossRef]
  26. Cai, H.; Yan, M.; Gao, S.; Zhou, T.; Wang, G.; Huang, Y. Coupling Characteristic Analysis and Coordinated Planning Strategies for AC/DC Hybrid Transmission Systems with Multi-Infeed HVDC. Electronics 2025, 14, 2294. [Google Scholar] [CrossRef]
  27. Nami, A.; Liang, J.; Dijkhuizen, F.; Demetriades, G.D. Modular multilevel converters for HVDC applications: Review on converter cells and functionalities. IEEE Trans. Power Electron. 2014, 30, 18–36. [Google Scholar] [CrossRef]
  28. Li, H.; Shi, Y. Distributed model predictive control of constrained nonlinear systems with communication delays. Syst. Control Lett. 2013, 62, 819–826. [Google Scholar] [CrossRef]
Figure 1. Multidimensional evaluation indicator system diagram for the AC/DC strong–weak balance relationship.
Energies 18 04216 g001
Figure 2. Evaluation flowchart for the rationality of AC/DC strong–weak balance for receiving-end grid.
Energies 18 04216 g002
Figure 3. Schematic diagram of a bipolar MMC–HVDC system at sending-end and receiving-end grids.
Energies 18 04216 g003
Figure 4. Flowchart of the structural enhancement method for the receiving-end power grid.
Energies 18 04216 g004
Figure 5. The diagram of the test power grid before enhancement scheme.
Energies 18 04216 g005
Figure 6. The diagram of the test system after loop decoupling.
Energies 18 04216 g006
Figure 7. The diagram after integrating MMC–HVDC.
Energies 18 04216 g007
Table 1. Short-circuit current margin indicators that do not meet the requirements.
Bus IDVoltage Level/kVShort-Circuit Current Margin Indicator/%
B19220−11.42
B3525−16.56
G14220−22.84
B16220−33.14
B3220−89.08
Table 2. Locations and capacities of MMC–HVDC.
MMC–HVDC Units Number Locations Voltage Level/kV Rated Capacity/MVA
1B17-B3320600
2G13-G14_1320300
3B26-B27320600
Table 3. Short-circuit current margin indicators before and after MMC enhancement scheme.
Bus NameVoltage Level (kV)Short-Circuit Current Margin Indicator Before Enhancement/%Short-Circuit Current Margin Indicator After Enhancement/%
B19220−11.4228.17
B3525−16.5629.82
G14220−22.8431.88
B16220−33.1425.54
B3220−89.088.53
Table 4. Blackout risk indicators of Region 2 and Region 4 before and after adding MMC–HVDC.
Region NameBlackout Risk Indicator Before Adding MMC–HVDC/MWBlackout Risk Indicator After Adding MMC–HVDC/MW
Region 21040.8120.8
Region 4640.10
Table 5. The effectiveness analysis of grid enhancement and reconstruction schemes under different loading scenarios.
Evaluation IndicatorsOriginal Operating Condition1.2 Times Load Condition1.5 Times Load Condition
Short-Circuit Current Margin Indicator/%−89.08→8.53 (B3)−102.60→8.40 (B3)−142.60→5.82 (B3)
Blackout Risk Indicator/MW1040.8→120.8
(Region 2)
1250.5→150.2
(Region 2)
1650.3→210.7
(Region 2)
Disclaimer/Publisher’s Note: The statements, opinions and data contained in all publications are solely those of the individual author(s) and contributor(s) and not of MDPI and/or the editor(s). MDPI and/or the editor(s) disclaim responsibility for any injury to people or property resulting from any ideas, methods, instructions or products referred to in the content.