Article

Dynamic Comparative Assessment of Long-Term Simulation Strategies for an Off-Grid PV–AEM Electrolyzer System

1
Department of Engineering Science, Guglielmo Marconi University, Via Paolo Emilio 29, 00192 Rome, Italy
2
ENEA—Italian Agency for New Technologies, Energy and Sustainable Economic Development, Via Anguillarese 301, 00123 Rome, Italy
3
CREAT—Energy Research Center, eCampus University, 22060 Novedrate, Italy
*
Author to whom correspondence should be addressed.
Energies 2025, 18(15), 4209; https://doi.org/10.3390/en18154209 (registering DOI)
Submission received: 30 June 2025 / Revised: 29 July 2025 / Accepted: 6 August 2025 / Published: 7 August 2025

Abstract

Among the various renewable-powered pathways for green hydrogen production, solar photovoltaic (PV) technology represents a particularly promising option due to its environmental sustainability, widespread availability, and declining costs. However, the inherent intermittency of solar irradiance presents operational challenges for electrolyzers, particularly in terms of stability and efficiency. This study presents a MATLAB-based dynamic model of an off-grid, DC-coupled solar PV-Anion Exchange Membrane (AEM) electrolyzer system, with a specific focus on realistically estimating hydrogen output. The model incorporates thermal energy management strategies, including electrolyte pre-heating during startup, and accounts for performance degradation due to load cycling. The model is designed for a comprehensive analysis of hydrogen production by employing a 10-year time series of irradiance and ambient temperature profiles as inputs. The results are compared with two simplified scenarios: one that does not consider the equipment response time to variable supply and another that assumes a fixed start temperature to evaluate their impact on productivity. Furthermore, to limit the effects of degradation, the algorithm has been modified to allow the non-sequential activation of the stacks, resulting in an improvement of the single stack efficiency over the lifetime and a slight increase in overall hydrogen production.

1. Introduction

In light of the environmental and geopolitical events of recent years, it has become clear that the energy transition is an undeniable and urgently needed process for tackling not only climate change, the effect of which is causing noticeable disruptions in the fragile equilibrium of our ecosystem, in terms of rising sea levels, unprecedented heat waves, and wildfires [1], but also to mitigate the risk associated with the energy dependence on foreign countries, which poses a considerable threat to societal wealth from the perspective of economic growth [2]. In 2024, each national government within the European Union (EU) committed to transitioning to the implementation phase of most of the Fit for 55 policies that aim to achieve the ambitious climatic target of limiting the EU’s greenhouse gas emissions by at least 55% by 2030 [3]. One of these initiatives involves the implementation of regulatory targets and policies, as well as coordinating the deployment of infrastructure to facilitate the widespread adoption of hydrogen technology [4].
As of the end of 2023, the cumulated hydrogen production across the EU reached 11.2 Mt [5], accounting for approximately 6% of the global total [6]. However, the majority of hydrogen is still produced by utilizing conventional methods, encompassing steam methane reforming (SMR) and by-product production from hydrocarbons [7]. While the carbon footprint of such hydrogen can be partially mitigated through carbon capture technologies, a broader transition toward cleaner and more sustainable production pathways is increasingly anticipated.
Over the past decade, several power-to-hydrogen facilities utilizing electricity for hydrogen production via water electrolysis have proliferated. As of September 2024, the total hydrogen production capacity from water electrolysis reached 385 MWel involving either demonstration or commercial application, with plans of achieving 844 projects amounting to 8.9 Mt of hydrogen produced annually by 2030 [8]. If electricity is provided by carbon-free power sources, such as renewables like solar or wind, the hydrogen produced has no associated carbon dioxide, aligning with declared decarbonization targets.
The rapid expansion of installed photovoltaic (PV) capacity in recent years, combined with favourable grid integration and high energy conversion efficiency, makes the coupling of solar PV with water electrolysis a highly promising zero-emission solution for sustainable hydrogen generation [9]. Extensive references can be found in the literature discussing several topological possibilities for connecting solar PV to an electrolyzer. In directly coupled hydrogen production systems, the operating point is established by the intersection of the electrolyzer I-V curve and the solar array I-V curve [10]. A method to effectively match the two characteristic curves is proposed by Zhou et al. [11], whereas Khalilnejad et al. [12] presented a genetic algorithm to optimize the maximum hydrogen generation rate, as well as determine minimum excess power and minimum energy transfer loss. Laoun et al. [13] almost contemporarily published a study detailing a multi-objective optimization model with the same research goal. However, although all studies agree that the primary advantage of a directly coupled configuration is the minor cost and complexity of the overall plant, most affirm that integrating a converter allows for an improvement in the energy transfer rates by permitting the operation with Maximum Power Point Tracking (MPTT), extracting the maximum power from the PV array [14,15,16,17]. Therefore, the system’s adaptability to variable solar irradiation and ambient temperature is enhanced [18].
In the last couple of decades, several water splitting technologies have been developed; nevertheless, only low-temperature hydrogen production through alkaline electrolysis (AEL), proton exchange membrane electrolysis (PEMEL), and Anion Exchange Membrane electrolysis (AEM) have reached a satisfactory level of market readiness. On the contrary, high-temperature electrolysis is still undergoing advancements, showing promising potential, but is recommended primarily in scenarios where heat is supplied from another process [19]. Among these, AEL stands out as the most technologically mature, characterized by a Technology Readiness Level (TRL) exceeding 9 [20], achieving efficiency at a stack level between 50 and 68% based on the lower heating value (LHV) of hydrogen, corresponding to an electricity consumption of 47 kWh and 66 kWh per kg of hydrogen produced, respectively [21]. In AEL, the electrodes, generally made of nickel, are separated by a porous material and surrounded by an aqueous potassium hydroxide solution (KOH) with a typical concentration of 25–30% wt [22], while the membrane is conductive for OH ions. The main advantage of AEL is its cost effectiveness, which is attributed to employing relatively inexpensive materials for the electrodes and the transport layer. In addition, AEL possesses a high durability and tolerance to impurities, guaranteeing an extended lifetime and, consequently, a reduced impact on operating costs [23]. However, due to the high lower limit of minimum load (20–40% of the maximum capacity), AEL proves to be not flexible with intermittent sources like renewables. Furthermore, it requires a thick membrane to prevent gas mixing and operates only at a low current density, resulting in a bulky stack design [24]. To overcome these drawbacks towards more efficient systems, ongoing research is focusing on developing next-generation separators capable of accommodating high currents with minimal losses while effectively mitigating gas crossover [25].
Differently from AEL, PEMEL utilizes a solid electrolyte consisting of a thin polymer membrane, generally made of Nafion material, that allows the conduction of H+ ions. It achieves a slightly higher efficiency at a partial load, ranging from 60–68%LHV (49 kWh/kg and 56 kWh/kg) [26]. The small membrane thickness reduces gas crossover, thereby increasing the purity of the hydrogen produced and enabling PEMEL to deliver a fast and flexible response across a wide range of power inputs (5–10% minimum load of the design capacity) [27]. In addition, it can operate at higher temperatures and current densities, in contrast to AEL, resulting in a more compact design and improved gas pressure delivery [28]. One of the major barriers hindering the widespread adoption of PEMEL is the requirement of scarce and expensive materials, such as platinum, ruthenium, and iridium, to mitigate the corrosive effect of the acid environment on the electrodes and catalyst layers [29].
AEM technology features similarities with PEMEL design as it includes a semipermeable membrane inserted between two electrodes, but unlike the latter, the separator facilitates the transport of negatively charged OH- ions. Thanks to this design, the potential for electrolyte and gas leakages is reduced. Furthermore, the AEM facility uses an alkaline solution with a lower concentration than AEL (1–10% wt). Thus, the catalysts and electrodes are subjected to less corrosion, allowing for the use of inexpensive core materials [30]. Recent advancements in the market have demonstrated an increase in stack efficiency by up to 68%LHV (or 49 kWh/kg) [31]. Despite its promising potential, AEM technology still lacks large-scale production capabilities (TRL of 4–6) and some improvements are necessary, as tests have revealed poor chemical stability, such as extreme sensitivity to carbon dioxide intrusion, leading to a decline in system performance and, inevitably, lifetime [32].
A critical challenge to be faced in this type of electrolyzer is the oxygen evolution reaction (OER), which is thermodynamically and kinetically more demanding than the two electron hydrogen evolution reaction (HER) [33]. This drawback is intensified by the comparatively low OH activity and the additional ionic transport resistance of the polymer membrane that further slows the anodic kinetics compared with a classic liquid alkaline cell [34]. Consequently, even when ohmic losses are minimized, the anode overpotential accounts for approximately half of the total cell voltage in AEM stacks [35].
As a result, intensive research efforts are currently focused on the development of highly active, stable, and cost-efficient OER catalysts that can operate under alkaline conditions reaching promising results. Techno-economic modelling of 1 MW AEM systems shows that each additional 100 mV of OER overpotential increases the hydrogen production cost by about 5–7 % [36]. Thus, anode activity and lifetime directly influence CAPEX (via catalyst loading, active area, and replacement intervals) and OPEX (via electricity demand). Encouragingly, a new generation of Earth-abundant catalysts has already pushed the practical benchmark below ≈ 250 mV at 10 mA/cm2 while demonstrating multi-day operational stability. For example, Cr-doped amorphous CoCrO has been shown to deliver an overpotential of 268 mV at 10 mA/cm2 in 1 M KOH and drive an AEM single cell to 1.5 A/cm2 at 2.1 V for 120 h with <5 mV/h degradation, indicating long service intervals and a low replacement cost [37]. Likewise, a self-supporting NiFe LDH “nanoflower” electrode proved an overpotential of 208 mV at 10 mA/cm2 without any precious metals [38]. Additionally, an industrially scalable, defect-rich NiFe-LDH anode that sustains 1 A cm−2 at only 1.69 V and 70 °C has been reported, demonstrating large-current, noble metal-free operation [39]. A comprehensive review of the structure–activity trends of transition metal hydroxyl oxides can be found in Zhang et al. [40].
Together, these results show that state-of-the-art, non-noble metal anodes satisfy the performance thresholds needed to keep both stack capital cost and electricity demand competitive in large-scale AEM electrolyzers.
Driven by significant investments in the transition to green energy, the industrial and research communities have shown a growing interest in modelling electrolyzers. Consequently, in recent years, the literature has seen an increased number of studies focusing on small-scale AEL and PEMEL systems [41]. Various approaches, characterized by rising levels of accuracy, have been employed for this purpose. A mathematical model describing the relationship between the cell voltage and current for a 1 kW PEM stack with varying operating parameters, without considering the temperature distribution within the stack, has been proposed by Brezak et al. [42]. Almost simultaneously, Möller et al. [43] developed a Simulink model for a single 5 kW stack integrated into a decentralized energy system designed for residential applications with a very narrow simulation resolution, therefore neglecting the changes in the condition of the components. The model precision can be improved by developing semi-empirical and empirical models that better define the thermodynamics involved in the generation process [44,45,46].
More recently, large-scale electrolyzer research has received growing attention primarily due to its potential to support power system frequency [47]. Tuinema et al. [48] have presented a detailed electrical model outlining the operation of a MW-scale electrolyzer. Similarly, Xu et al. [49] developed a 2 MW PEMEL system model, assuming a fixed efficiency, within a broader system incorporating a hydrogen refuelling station and various power generation sources. Additionally, a grid-scale plant has been proposed by Huang et al. [50] with the aim of enhancing frequency response within a wind-dominated electricity generation system.
However, despite the numerous respected publications in this field, there remains a scarcity of studies that explicitly incorporate the concept of electrolyzer startup time management [51] and thoroughly substantiate its potential impacts [52]. In addition, there is a notable absence of research focusing on the effects of electrolyte heating requirements and degradation due to load cycling. Indeed, most existing work primarily concentrates on delineating and mitigating fundamental degradation mechanisms [53] or on evaluating the electrochemical durability and activity of cells [54,55]. On the contrary, long-term modelling that integrates these operational parameters into hydrogen production simulations is conspicuously absent from the current literature.
This work addresses these gaps by presenting an hourly resolution model of an off-grid DC-linked solar PV plant coupled with a 1 MW AEM electrolyzer over a 10-year operational period. The model has been developed and simulated using MATLAB R2022b (version 9.13) [56]. The aim is to provide a realistic estimation of hydrogen production by dynamically simulating the thermal energy management of the electrolyte for adequate operation startup. Additionally, the model accounts for the decrease in renewable power generation and the increase in electrolysis power demand caused by degradation. The results are then compared with two simplified scenarios: one that neglects the equipment response time to variable supply and another that assumes a fixed start temperature of the electrolyte solution. Furthermore, an improvement scenario is investigated, wherein an algorithm for the non-sequential activation of the stacks’ power on is introduced to mitigate degradation effects.

2. Materials and Methods

In this work, four case studies involving the operation of an AEM electrolyzer powered by electricity from an on-site photovoltaic plant are analyzed and compared: (1) Case zero—the electrolyzer starts its operation and hydrogen production as soon as power is available. This scenario does not consider the equipment response time or performance variation during the operation. (2) Base case—a startup time is implemented to warm up the electrolyte solution from 15 °C to the setpoint temperature of 55 °C, allowing for nominal hydrogen flow. It is assumed that the startup temperature is consistently 15 °C for each repetitive cycle of operation. (3) Advanced case—each power on of the electrolyzer is driven by the electrolyte heat exchange, enabling a warm startup, benefiting from the energy stored by the fluid. Furthermore, this scenario considers the effect of load cycles on the degradation of membrane electrode assembly (MEA). (4) Improved case—the heat exchange process is improved by using an insulated electrolyte tank. The operational performance is enhanced by improving the power on sequence of the stacks based on the maximum efficiency of the single stack.
Green hydrogen production is achieved in all scenarios by utilizing a 1 MW electrolyzer system coupled with 1.6 MW of a nominal solar PV power plant. The latter is composed of an optimal number of strings, each of them coupled to its own DC/DC converter with MPPT. These converters feed a common DC bus while allowing every string to operate at its individual optimum voltage and current, thereby maximizing overall PV yield. Downstream of the common DC bus, as implemented in the commercial AEM system used as reference, each electrolyser stack is fed by its own dedicated DC/DC converter. Figure 1 illustrates a simplified schematic diagram of the coupled PV–electrolyzer system, including the closed electrolyte circuit representing the balance of plant (BoP) under investigation in this study.

2.1. Input Data

2.1.1. PV System

The PV production P P V (W) has been estimated by means of Equation (1), in which g t i (W/m2) represents the hourly solar irradiance in the area of Rome that actually occurred in the decades 2010–2020, extrapolated using the PVGIS database [57]. The data refers to a fixed-tilt PV configuration whose slope, determined via PVGIS optimization to maximize annual energy yield, is set to 36° for this simulation. η P V (%) is the module efficiency for a 700 W heterojunction PV bifacial panel [58]; A P V is the total surface area of the PV plant (m2). In line with peer-reviewed techno-economic analyses, the facility is specified with a solar-to-electrolyzer nominal capacity ratio of 1.6:1, a configuration demonstrably minimizing the levelized cost of hydrogen for stand-alone solar-powered systems [59,60,61]. Based on these data, the resulting number of solar panels included in the simulation is 2571. The model also accounts for panel degradation, incorporating a 1% reduction in nominal production during the first year of operation and a linear performance degradation of 0.3% annually, as specified by the manufacturer as follows:
P P V =   g t i · η P V · A P V
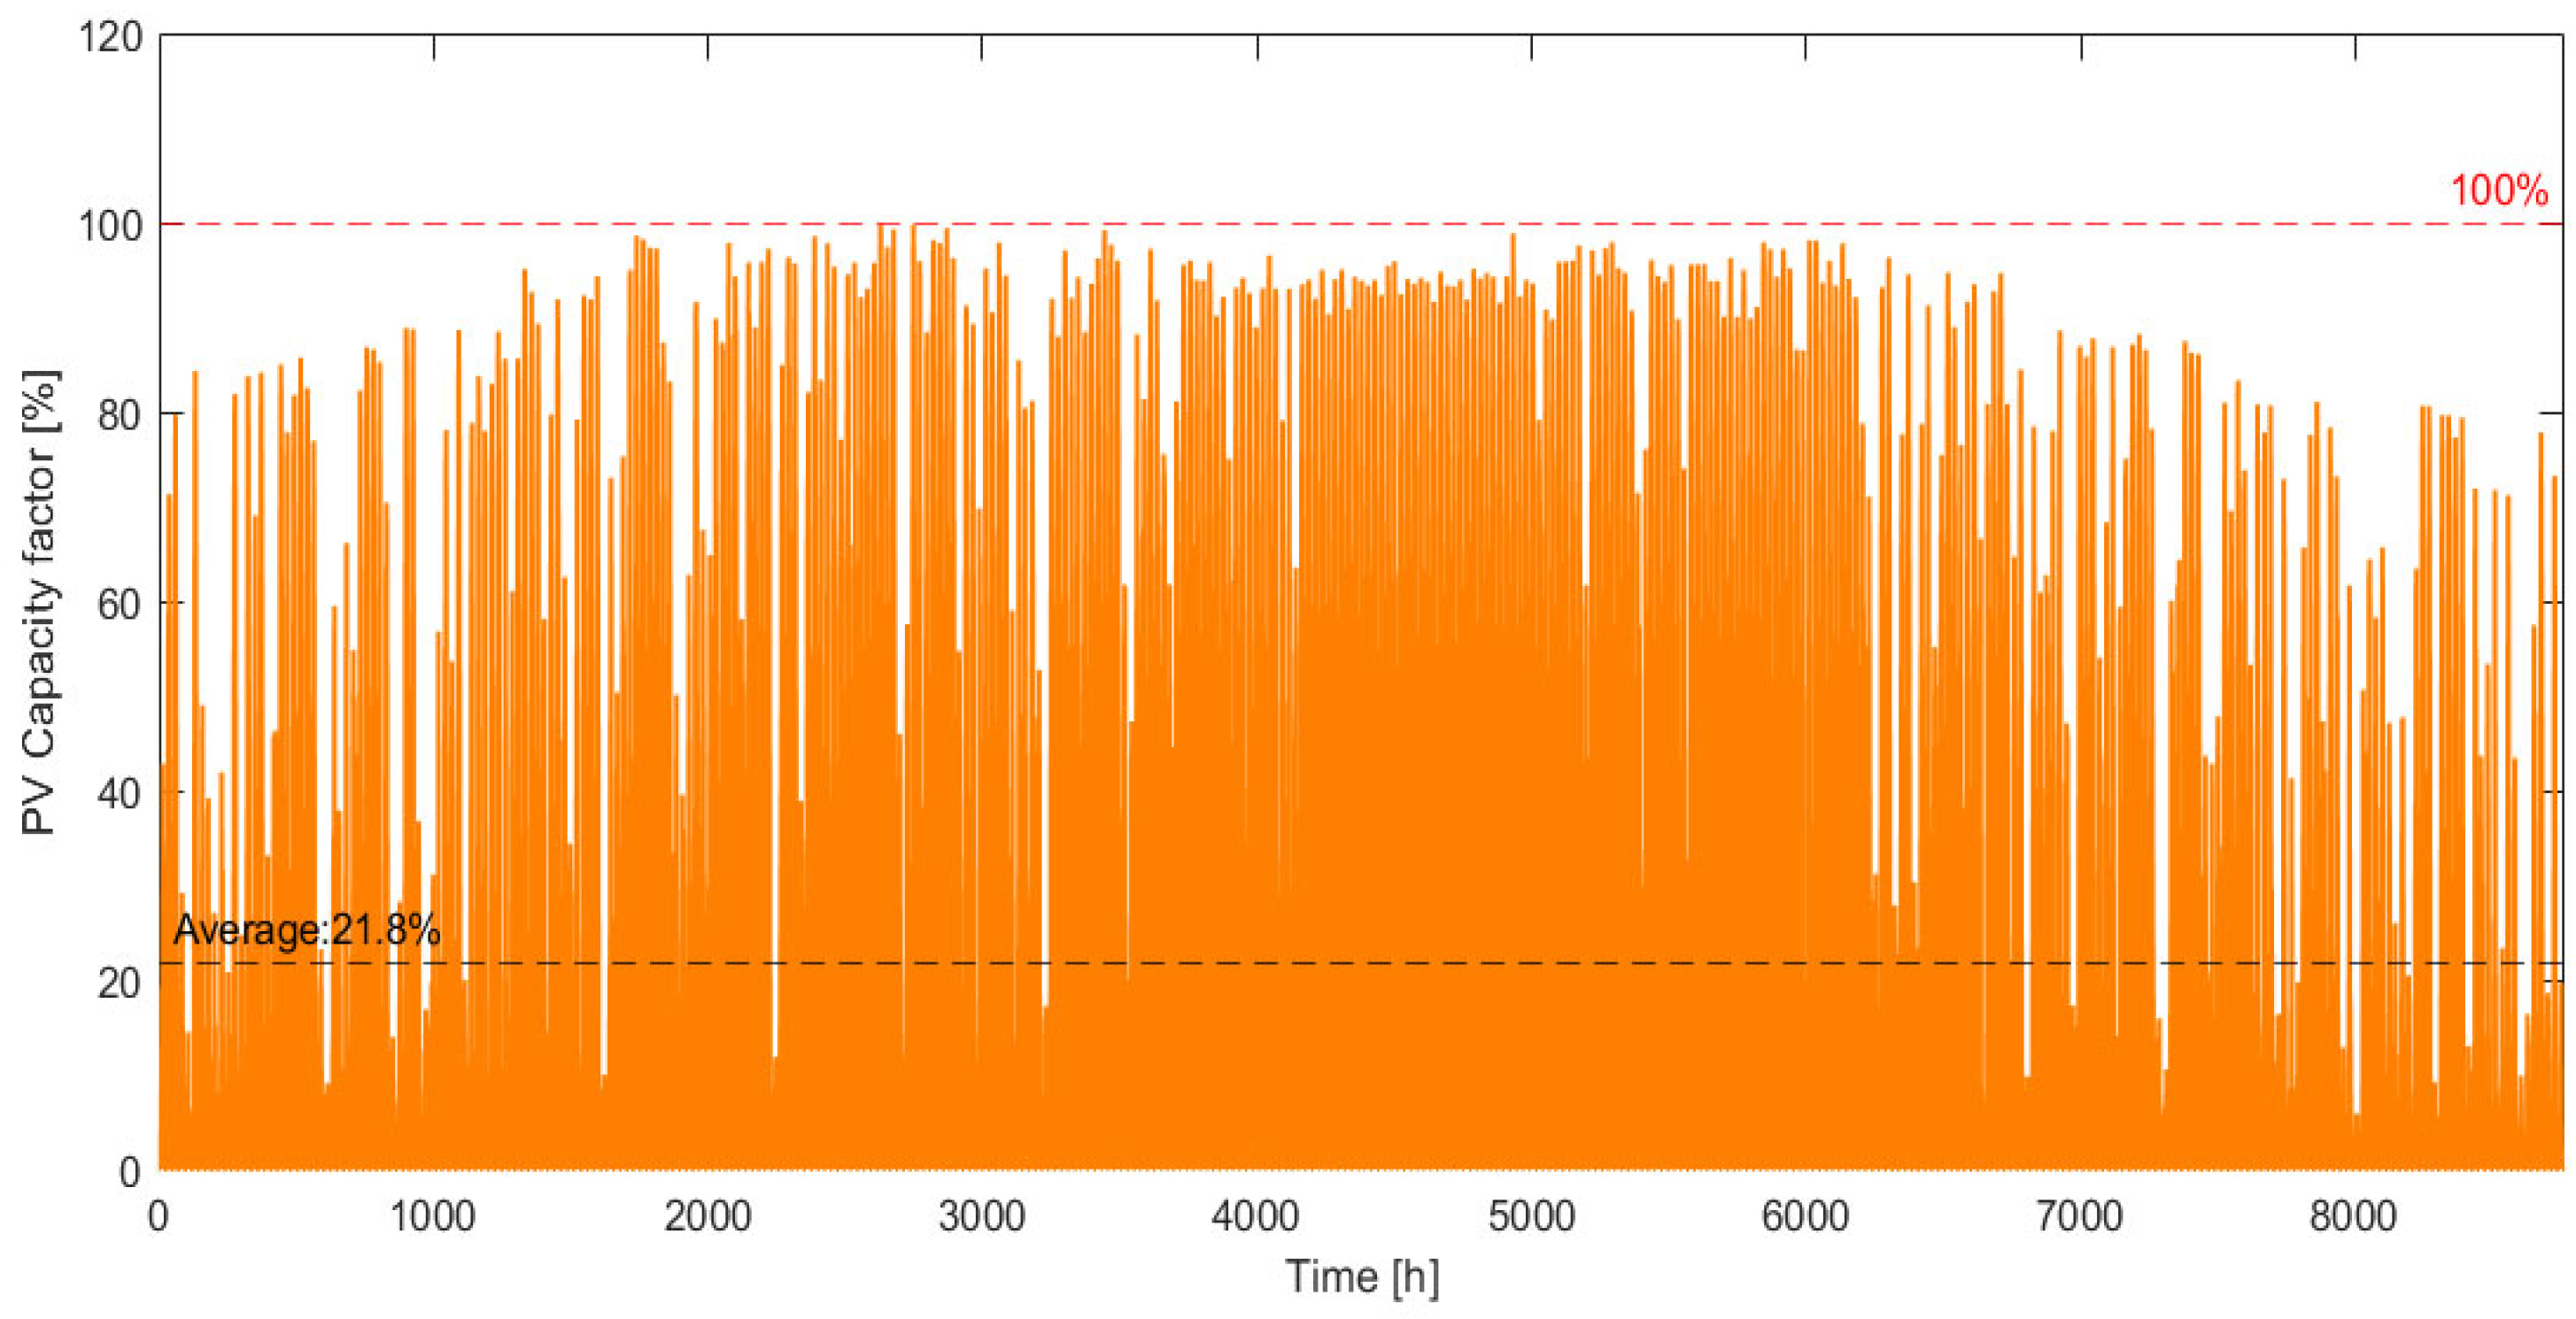
At each timestep of the simulation, the capacity factor ( C F , in %) of the plant was computed and defined as the ratio between the actual energy produced by the PV at each t over the maximum possible energy generation in the same period according to Equation (2). An illustrative profile for the final year of analysis (2020), along with the mean annual capacity factor of 21.8%, is shown in Figure 2.
C F = P P V   · t / ( P P V , n o m · t )

2.1.2. The DC/DC Converter

Due to the variability in the PV source, energy conversion devices such as DC/DC converters are needed to increase the stability of the dynamic system and reduce power losses [15]. Commercial converters are characterized by an efficiency that varies depending on the load, with peak efficiency typically occurring at the nominal rating. At this point, the efficiencies can reach 98% or higher, surpassing those achieved at lower loads. The ranges and efficiencies were determined by re-elaborating on the datasheet provided in [62].
P D C C F < 0.2 = P P V i d x 1 · 0.85
P D C 0.2 < C F < 0.4 = P P V i d x 2 · 0.9
P D C C F > 0.4 = P P V i d x 3 · 0.98

2.1.3. AEM Electrolyzer

A 1 MW modular AEM electrolyzer consisting of two equal sets of 21 stacks, each absorbing about 500 kW at the beginning of life, is selected for the modelling. The system uses an aqueous electrolyte containing 1% w/v potassium hydroxide (KOH). Electrolyte circulation between the tank and the stack modules is maintained by a centrifugal pump [63,64]. The unit produces hydrogen with a purity of ≥99.9 vol%, which can be upgraded to ≥99.999 vol% via a downstream dryer.
Hydrogen production starts when the electrolyte temperature reaches 35 °C, with maximum production achieved at 55 °C. While higher operating temperatures generally enhance reaction rates and reduce the electrical resistance in the cell, thus improving overall electrochemical performance [65], several studies have demonstrated that it is advisable to operate the AEMEL below 60 °C. This restriction is due to the membrane’s glass transition temperature, which can adversely affect its integrity and consequently diminish the electrolyzer’s performance [66,67].
Under nominal conditions, the system efficiency is 62.5%LHV, which allows the production of 210 Nm3/h of hydrogen. At partial loads, with the possibility of going down to 3% of the nominal production rate, the efficiency decreases as the system can only reduce the BoP capacity to a limited extent.
According to the manufacturer, the dynamic operation of the electrolyzer implies a degradation rate ( D R ) of 0.4% of cell voltage over 1000 h. Therefore, a correction was applied, shifting the power absorbed hourly by a linear relationship P s i n g l e , s t a c k · ( 1 + D R ) depending on the operating hours at the single stack level [68]. Although this value originates from manufacturer specifications, it aligns well with degradation rates reported in the literature. For example, an experimental study on large-scale AEM electrolyzers subjected to extended operation found a baseline degradation rate of approximately 5.23 μV/h [69]. This corresponds to a voltage loss of about 0.29% over 1000 h, closely matching the one assumed in this work. In addition, start–stop cycling has been shown to contribute further to performance decay, with one study reporting voltage degradation in the range of 10–26 μV per cold start [70]. When integrated over an annual operation schedule involving frequent shutdowns, this transient degradation may contribute up to 0.2%/year of additional voltage loss. Taken together, these independent findings support the assumption adopted in this study and confirm that the modelled performance degradation reflects realistic operational trends.

2.2. Dynamic Operation Under Variable Conditions

The intrinsic intermittency of solar irradiation necessitates management systems to cope with fluctuations in operational states, such as transitioning from inactive to active phases and adjusting operating parameters, such as temperature and pressure. Although some studies have observed that dynamic operation under variable conditions can positively affect MEA degradation and shows no relevant additional performance decay when combining thermal cycles and load cycles [63,64], it still causes efficiency variations, mainly due to the impact of the BoP. Therefore, rapid and effective response times, along with maintaining a high ramping rate to adapt to changes in the power supply, are fundamental for fully exploiting the potential of solar resources.
In general, the initiation of operations for an electrolyzer can occur under a condition known as cold startup, in which the entire system needs to be heated to reach the regime and start the actual production. Alternatively, a warm startup verifies when the system is kept on standby or shut down for a short period of time without losing the benefit from the energy stored in the electrolyzer. This state is also known as hot standby.
The temperature change in the KOH solution depends on the amount of heat absorbed during system activation or released due to the heat exchange. The heat transfer occurs through conduction between the liquid and the tank walls and convection with the ambient surroundings. In such scenarios, it is common to apply an analogy with electrical systems by defining an overall heat transfer coefficient, U , related to the total thermal resistance, R t o t . For a radial cylindrical system, R t o t is expressed as shown in Equation (8) [71,72].
Q U · A · T
U / A = 1 / R t o t
R t o t = R c o n d + R c o n v = ln ( r e x t / r i n t ) 2 π · L · k + 1 2 π · r e x t · L · h a i r
where r e x t and r i n t the external and internal tank radius, respectively; L is the tank height; k is the thermal conductivity of steel or the insulating layer (33.6 W/mK or 0.035 W/mK), [72,73]; and h a i r is the heat transfer for still air (25 W/m2K) [73].

2.3. Simulation

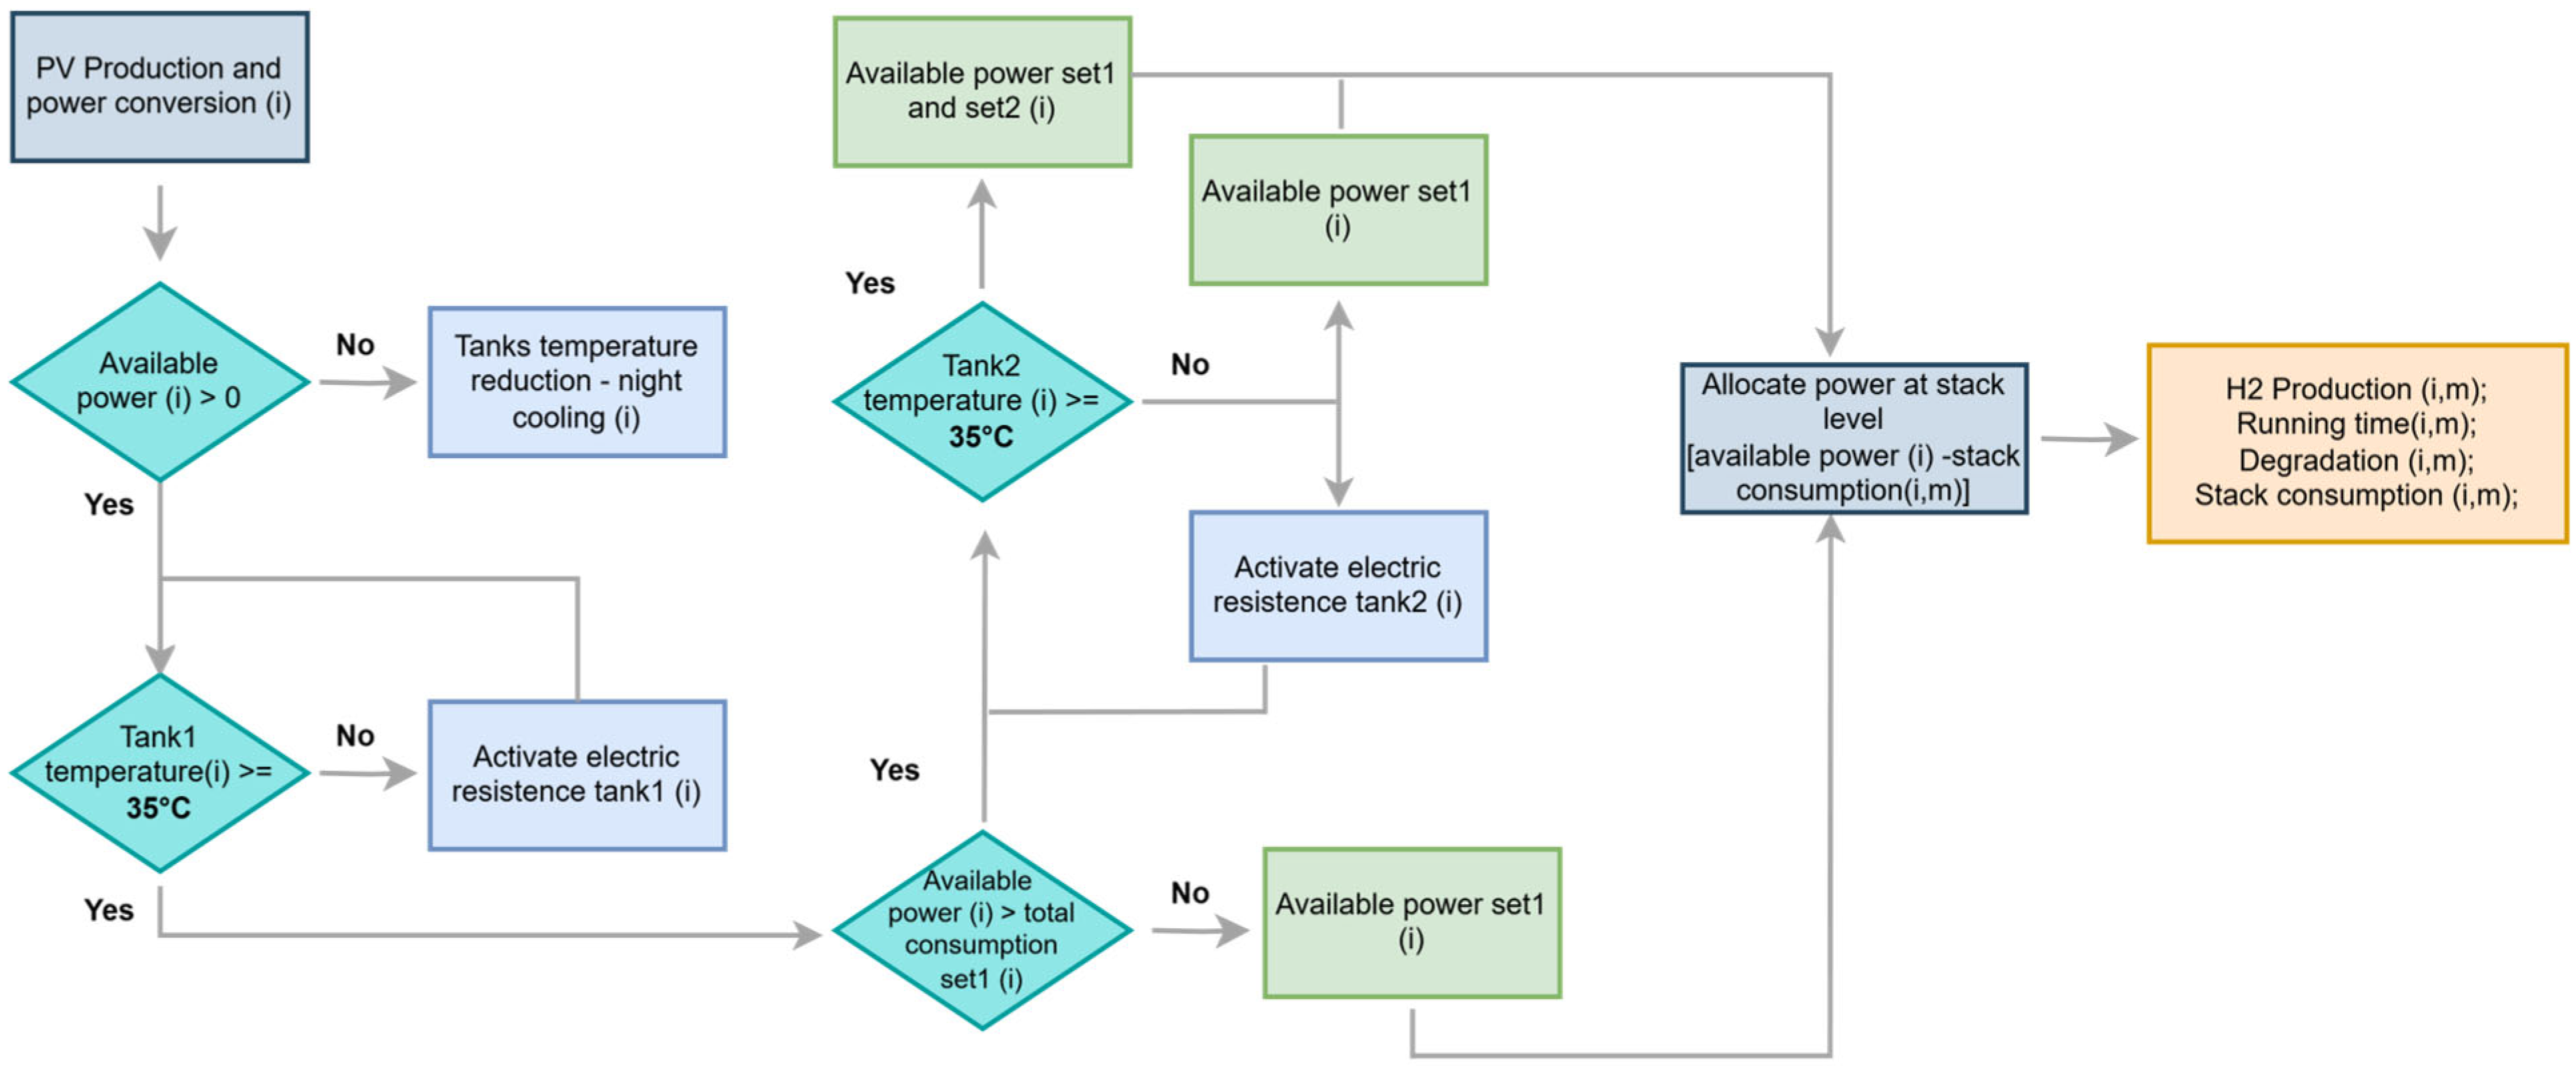
Hydrogen production has been simulated following a time-based approach and the design interdependence of the singular components. The simulation begins with evaluating the electrolyte temperature in combination with power availability and the system’s general condition. If there is PV production, the algorithm will check the temperature condition of the electrolyte tank connected to the first 500 kW set.
If the tank temperature is below 35 °C, an electrical resistance is activated to increase the electrolyte temperature; if the PV production overcomes the maximum power absorption of the first set, including auxiliary loads, the same activities are performed on the second electrolyte tank. The equations that evaluate the electrolyte temperature also consider the thermal energy as a secondary output of the electrolysis process ( P E L · ( 1 η s y s ) ) and the general thermal exchange of the electrolyte to the tank walls and with the surrounding environment.
The available power is then allocated at an individual stack level (m = number of stacks). The allocation logic that handles this process varies in the different simulation scenarios. In the first three cases, it envisages hydrogen production following a predetermined sequence of strings, commencing with the first stack and proceeding with the subsequent ones until the available energy source is completely exhausted. For each stack, the algorithm also evaluates the total running time and the degradation level, computing the exact total power required to compensate for its decay, the power level at which it is operated and, in combination with the related efficiency, the resulting hydrogen production. The electrolyte tanks’ thermal exchange, previously introduced, helps to correctly evaluate the heat dissipated during the night and, thereby, the starting condition of the following day. The flow chart of the simulation is represented in Figure 3.
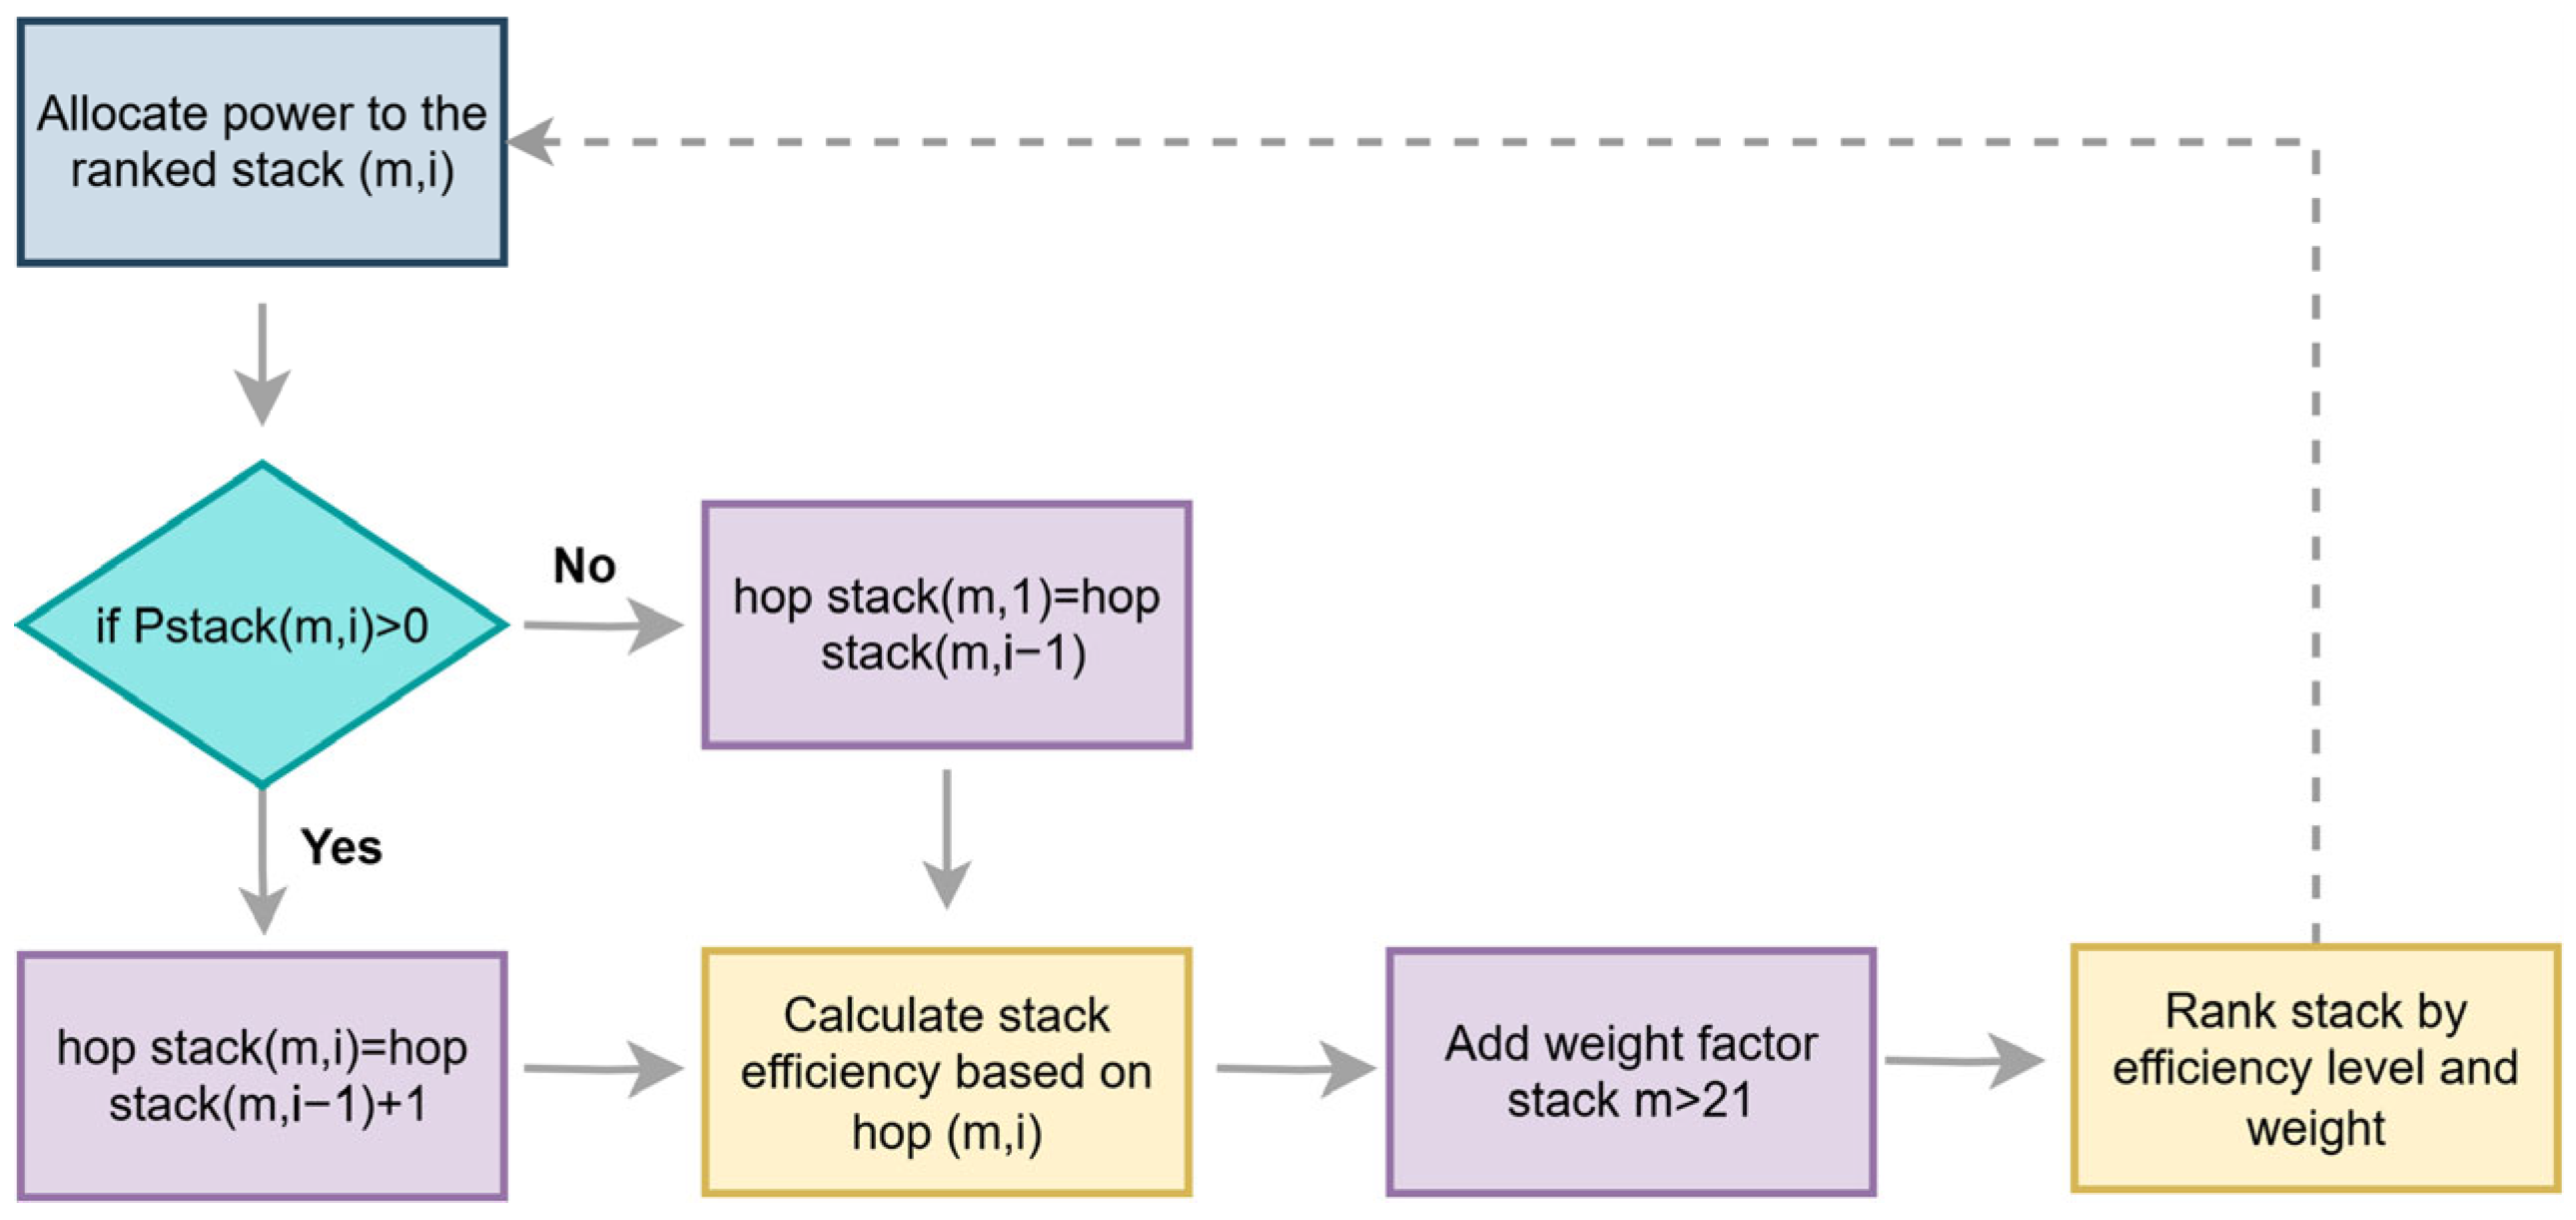
In the improved simulation scenario, the electrolyte tanks benefit from an insulating layer that drastically improves the conduction coefficient; additionally, the power allocation at the stack level is performed by preferring the more efficient or less degraded stacks. This results in a reduction in the energy dedicated to increasing the electrolyte temperature to the starting condition, as well as the more homogeneous degradation of the stacks. Figure 4 shows the algorithm for the stack logic operation in the improved scenario.

3. Results

In order to conduct a precise and comprehensive analysis of the performance of the electrolyzers and evaluate the impact of long-term degradation, simulations were carried out over a 10-year period referring to the actual meteorological conditions in the area of Rome from 2010–2020.

3.1. Electrical Power Distribution

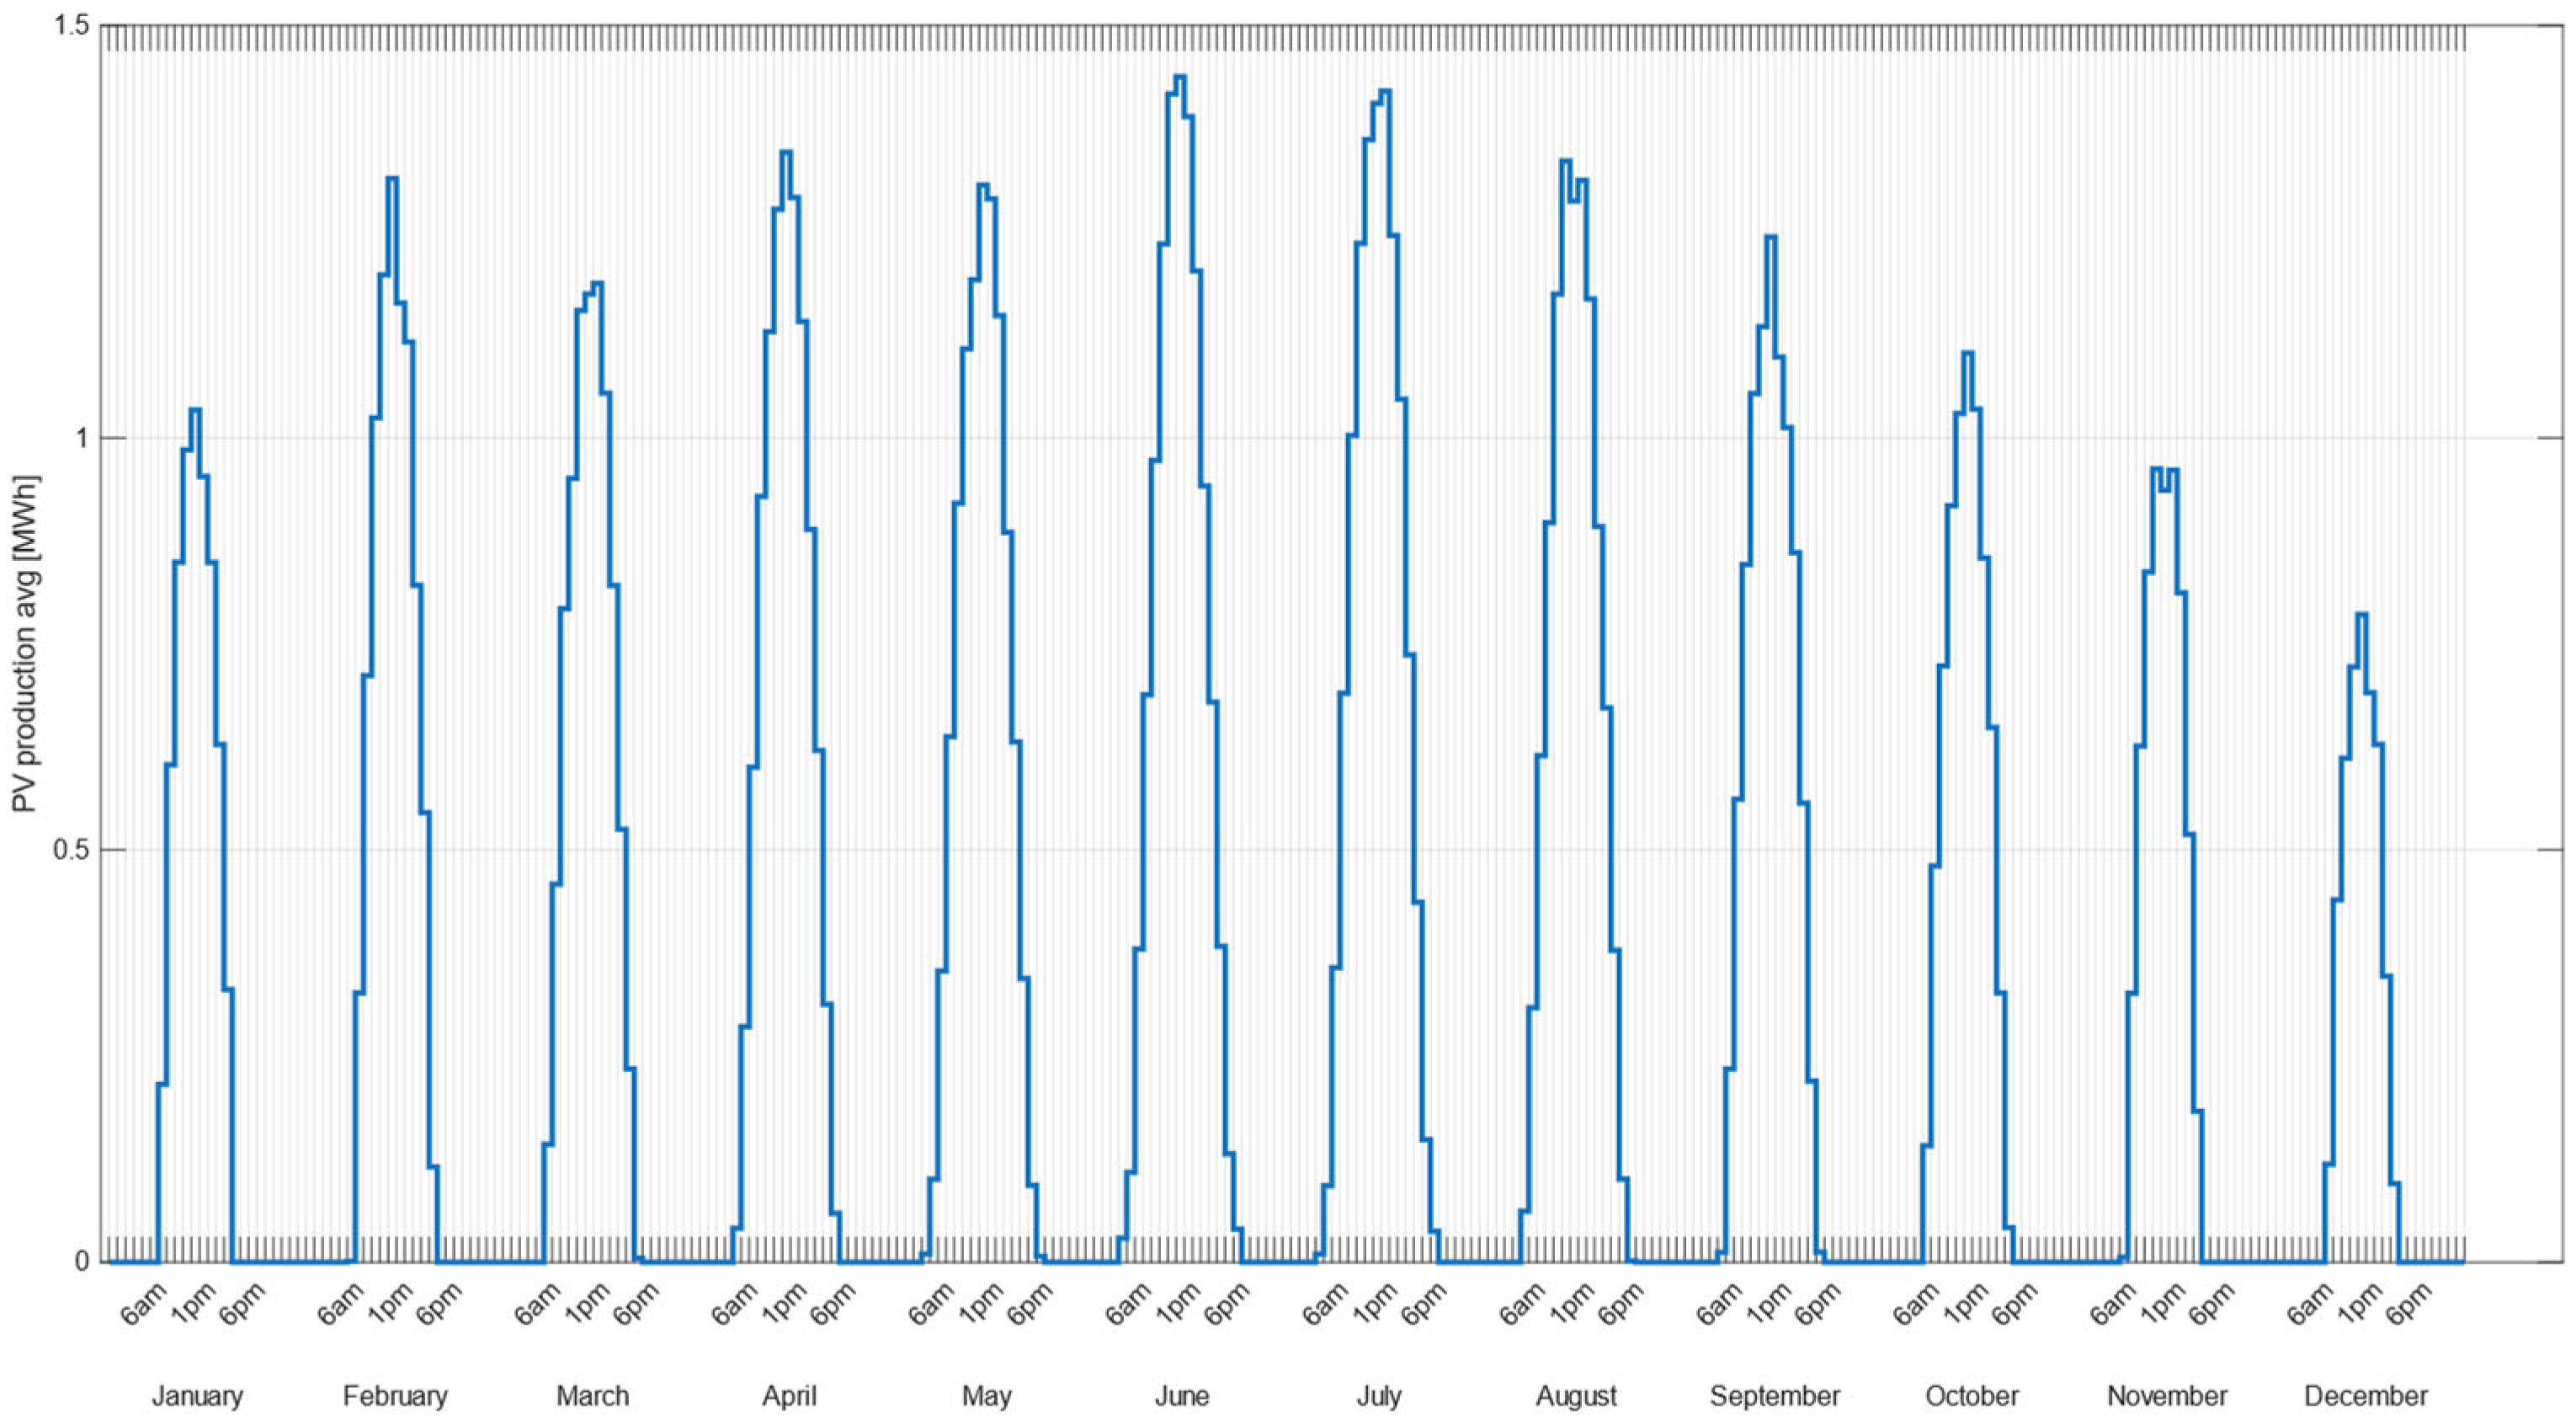
Figure 5 illustrates the average hourly PV production profile, P ¯ P V m , h , computed for each hour h of the day and for each month m of a representative year, considering all days N m   of the respective month. The calculation accounts for module degradation as described in Section 2.1.1. The formula used to obtain the values shown in Figure 5 is as follows:
P ¯ P V m , h = 1 N m k = 1 N m P P V ( m , h )
Each curve represents, on average, the characteristic PV production trend throughout the day: ramping up after sunrise, peaking around midday, and declining toward the evening. Higher overall yields are observed in the summer months, with production reaching nominal capacity, excluding system losses, around 1 p.m., while winter months exhibit significantly lower yields.
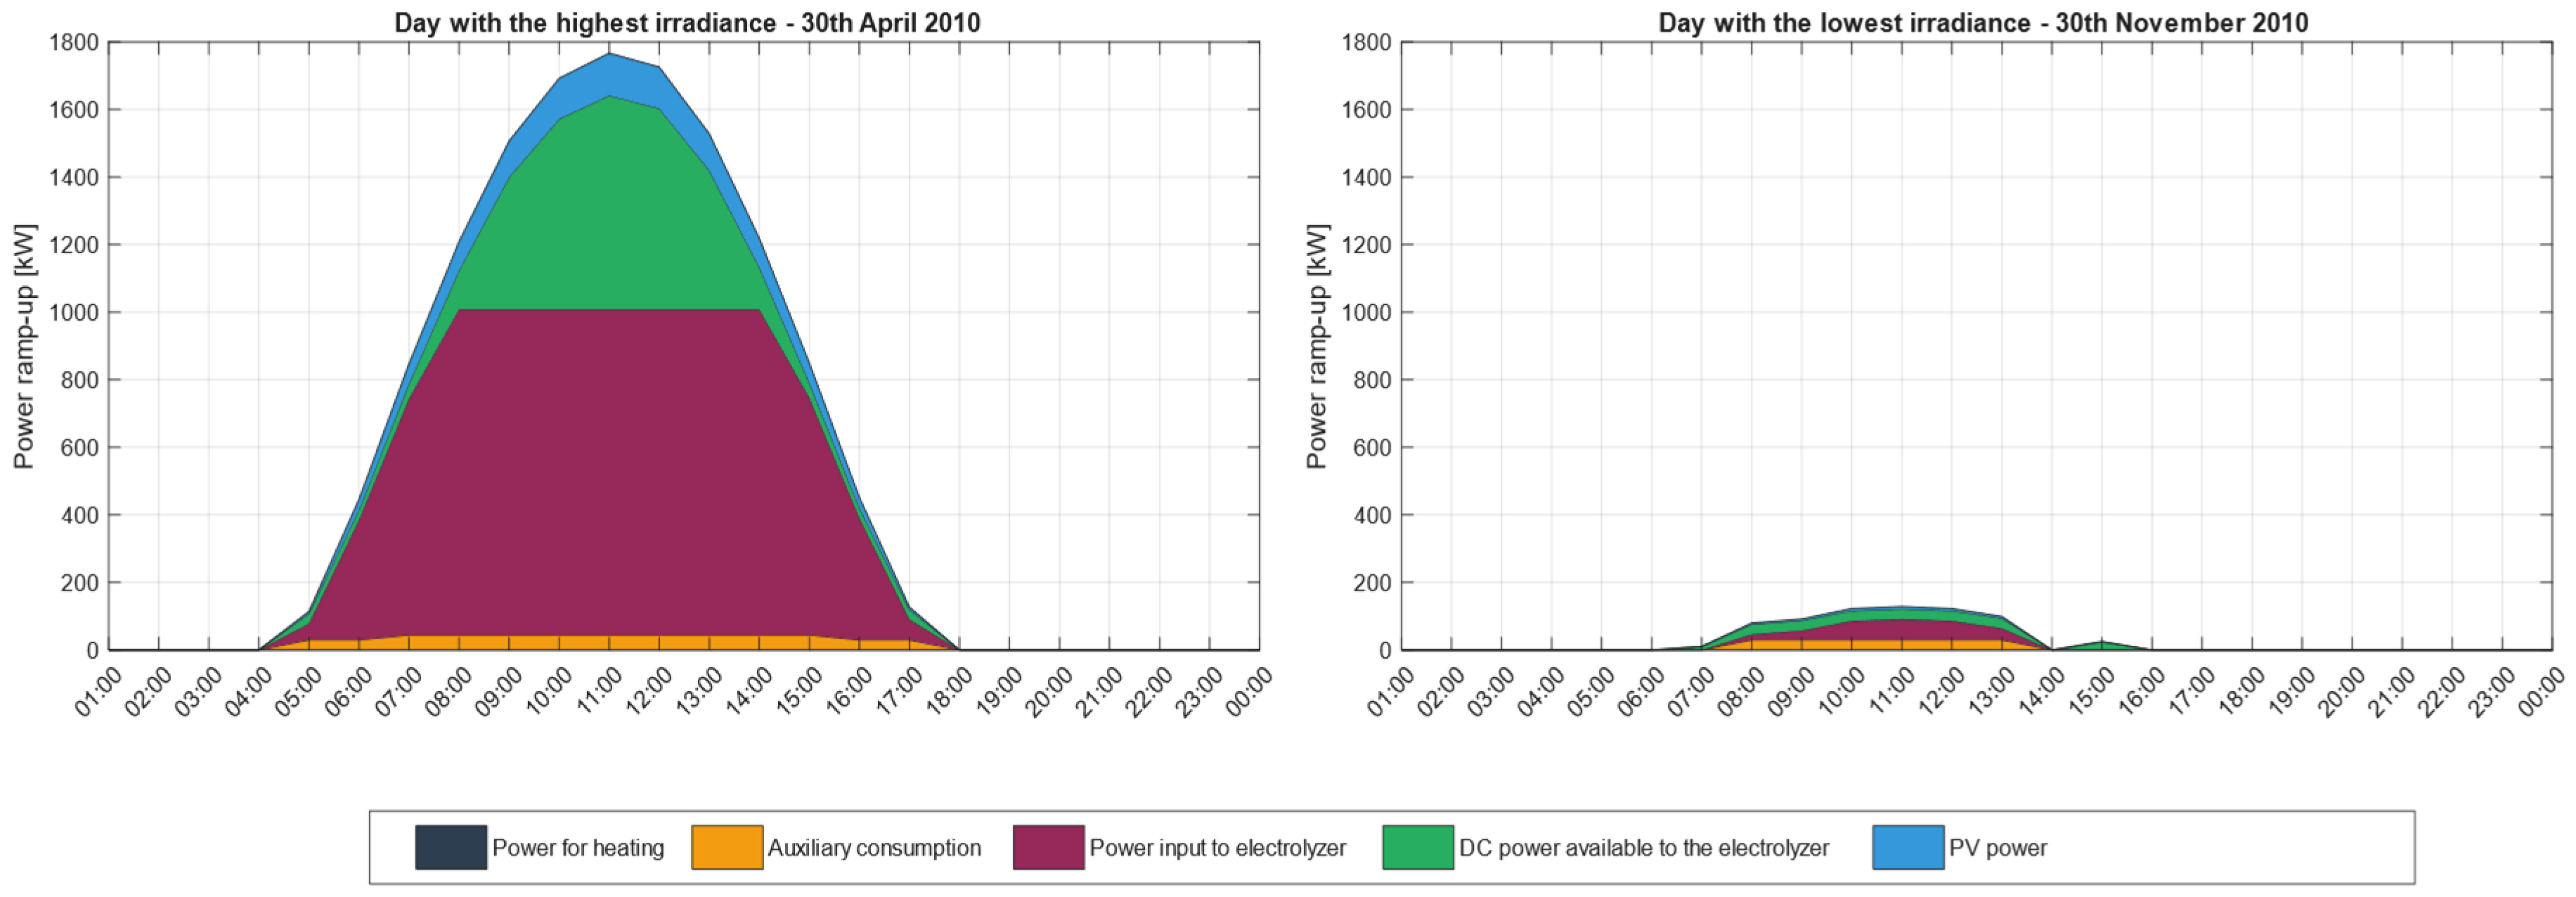
The total electrical power distribution among the various elements included in the simulation for the improved case is depicted in Figure 6. For clarity, the days with the highest and lowest registered daily irradiance for the year 2010, according to PVGIS data, are considered. The day with the highest irradiance is characterized by high capacity factors, capable of exceeding the nominal power of the PV plant between 11 am and 1 pm. The power consumed by the DC/DC converter is approximately 7.3% of the available power. The electrolyzer operates at the rated input of 1059 kW for seven hours and at partial load down to about 3% of its nominal power in the morning and between 5 pm and 6 pm before shutting off. On the day with the lowest irradiance, the power losses due to the power conversion system are negligible as a consequence of insufficient power production. Despite the low irradiance, the electrolyzer still maximizes hydrogen production, owing to the high modularity of its cell stack design. In addition, on both high- and low-irradiance days, the thermal insulation of the electrolyte tank maintains the temperature above 35 °C, enabling a warm startup under all circumstances. Consequently, the resistance is not activated, and the “Power for heating” profile is absent from both distributions in Figure 6. Lastly, auxiliary system loads require approximately 44 kW when operating at full capacity.

3.2. Hydrogen Production

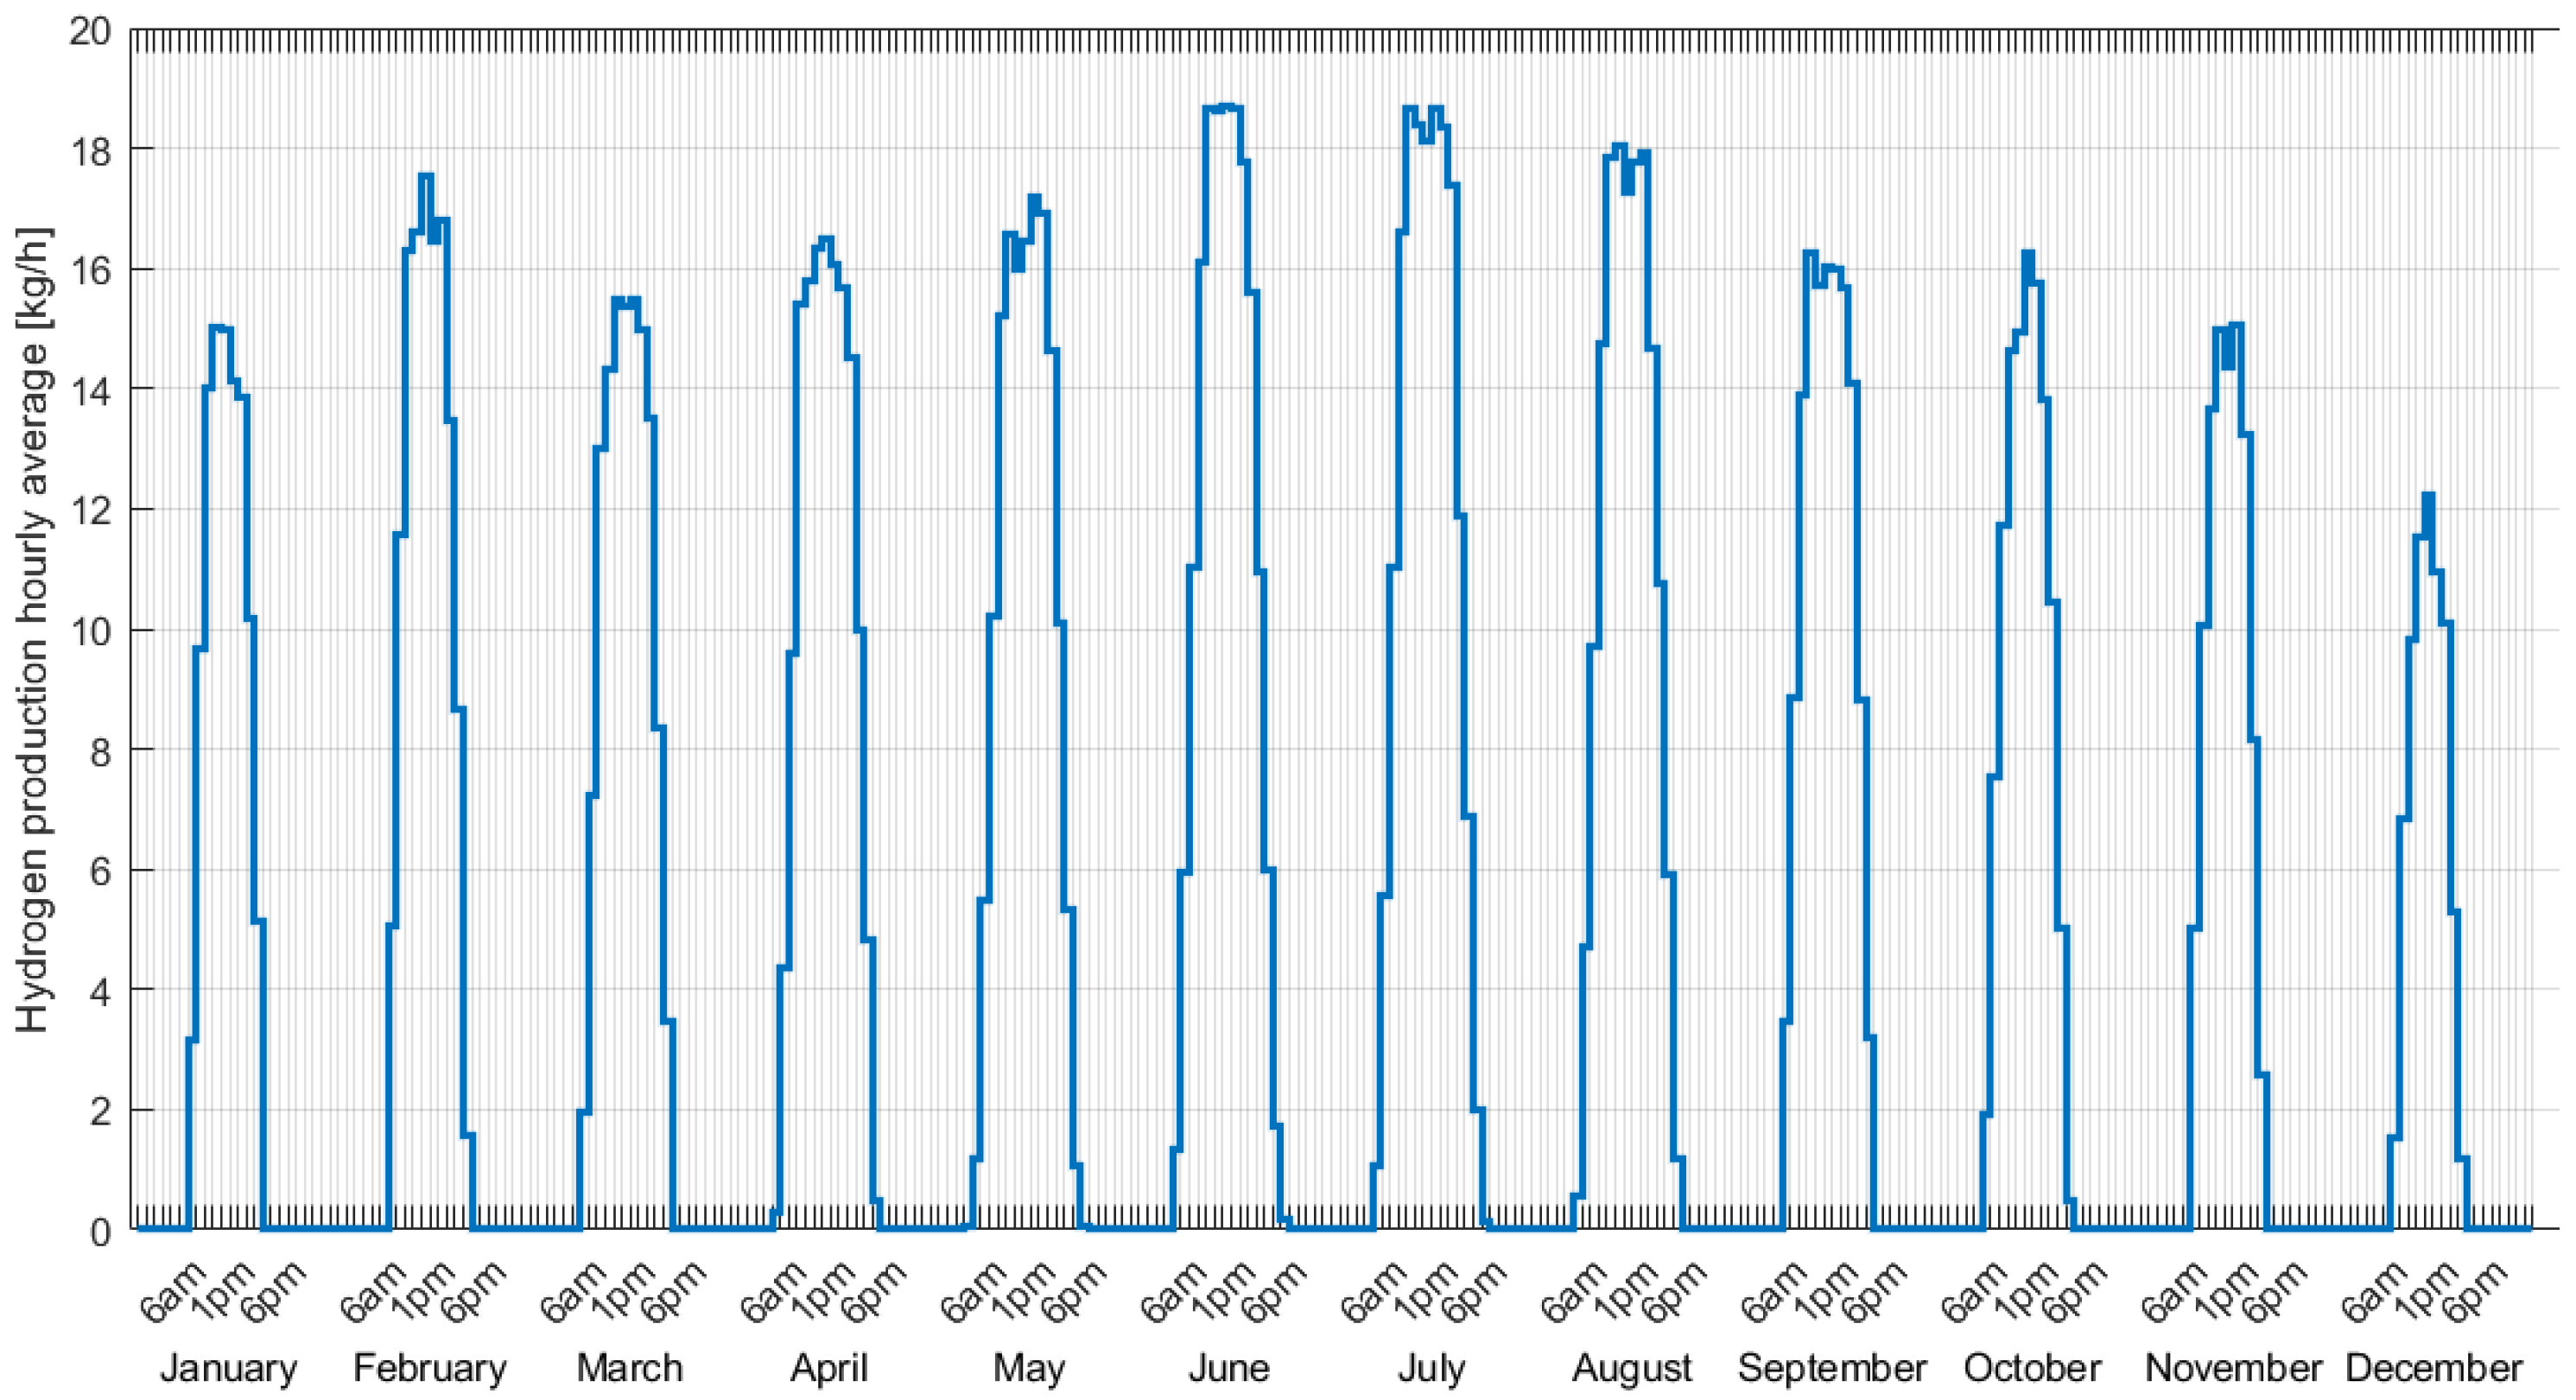
Figure 7 illustrates the average hourly hydrogen production profile, m ¯ H 2 m , h , computed for each hour h of the day and for each month m of a representative year, considering all days N m   of the respective month. The formula is as follows:
m ¯ H 2 m , h = 1 N m k = 1 N m m H 2 ( m , h )
This figure clearly demonstrates the robustness of the proposed model, which makes it possible to identify and quantify the hydrogen production even in non-nominal conditions, such as early in the day or near sunset, and thereby enhancing integration with the photovoltaic system. During the winter months, peak production averages around 14–16 kg/h, whereas in the summer it approaches the nominal value of just over 18 kg/h.
The model’s dynamic and flexible behaviour is even more evident in Figure 8, which highlights daily production for both the day with the highest solar irradiance and the day with the lowest irradiance in 2010. This day-by-day analysis accounts for transient phases associated with system warmup, starting from the available electrical energy and including any losses.
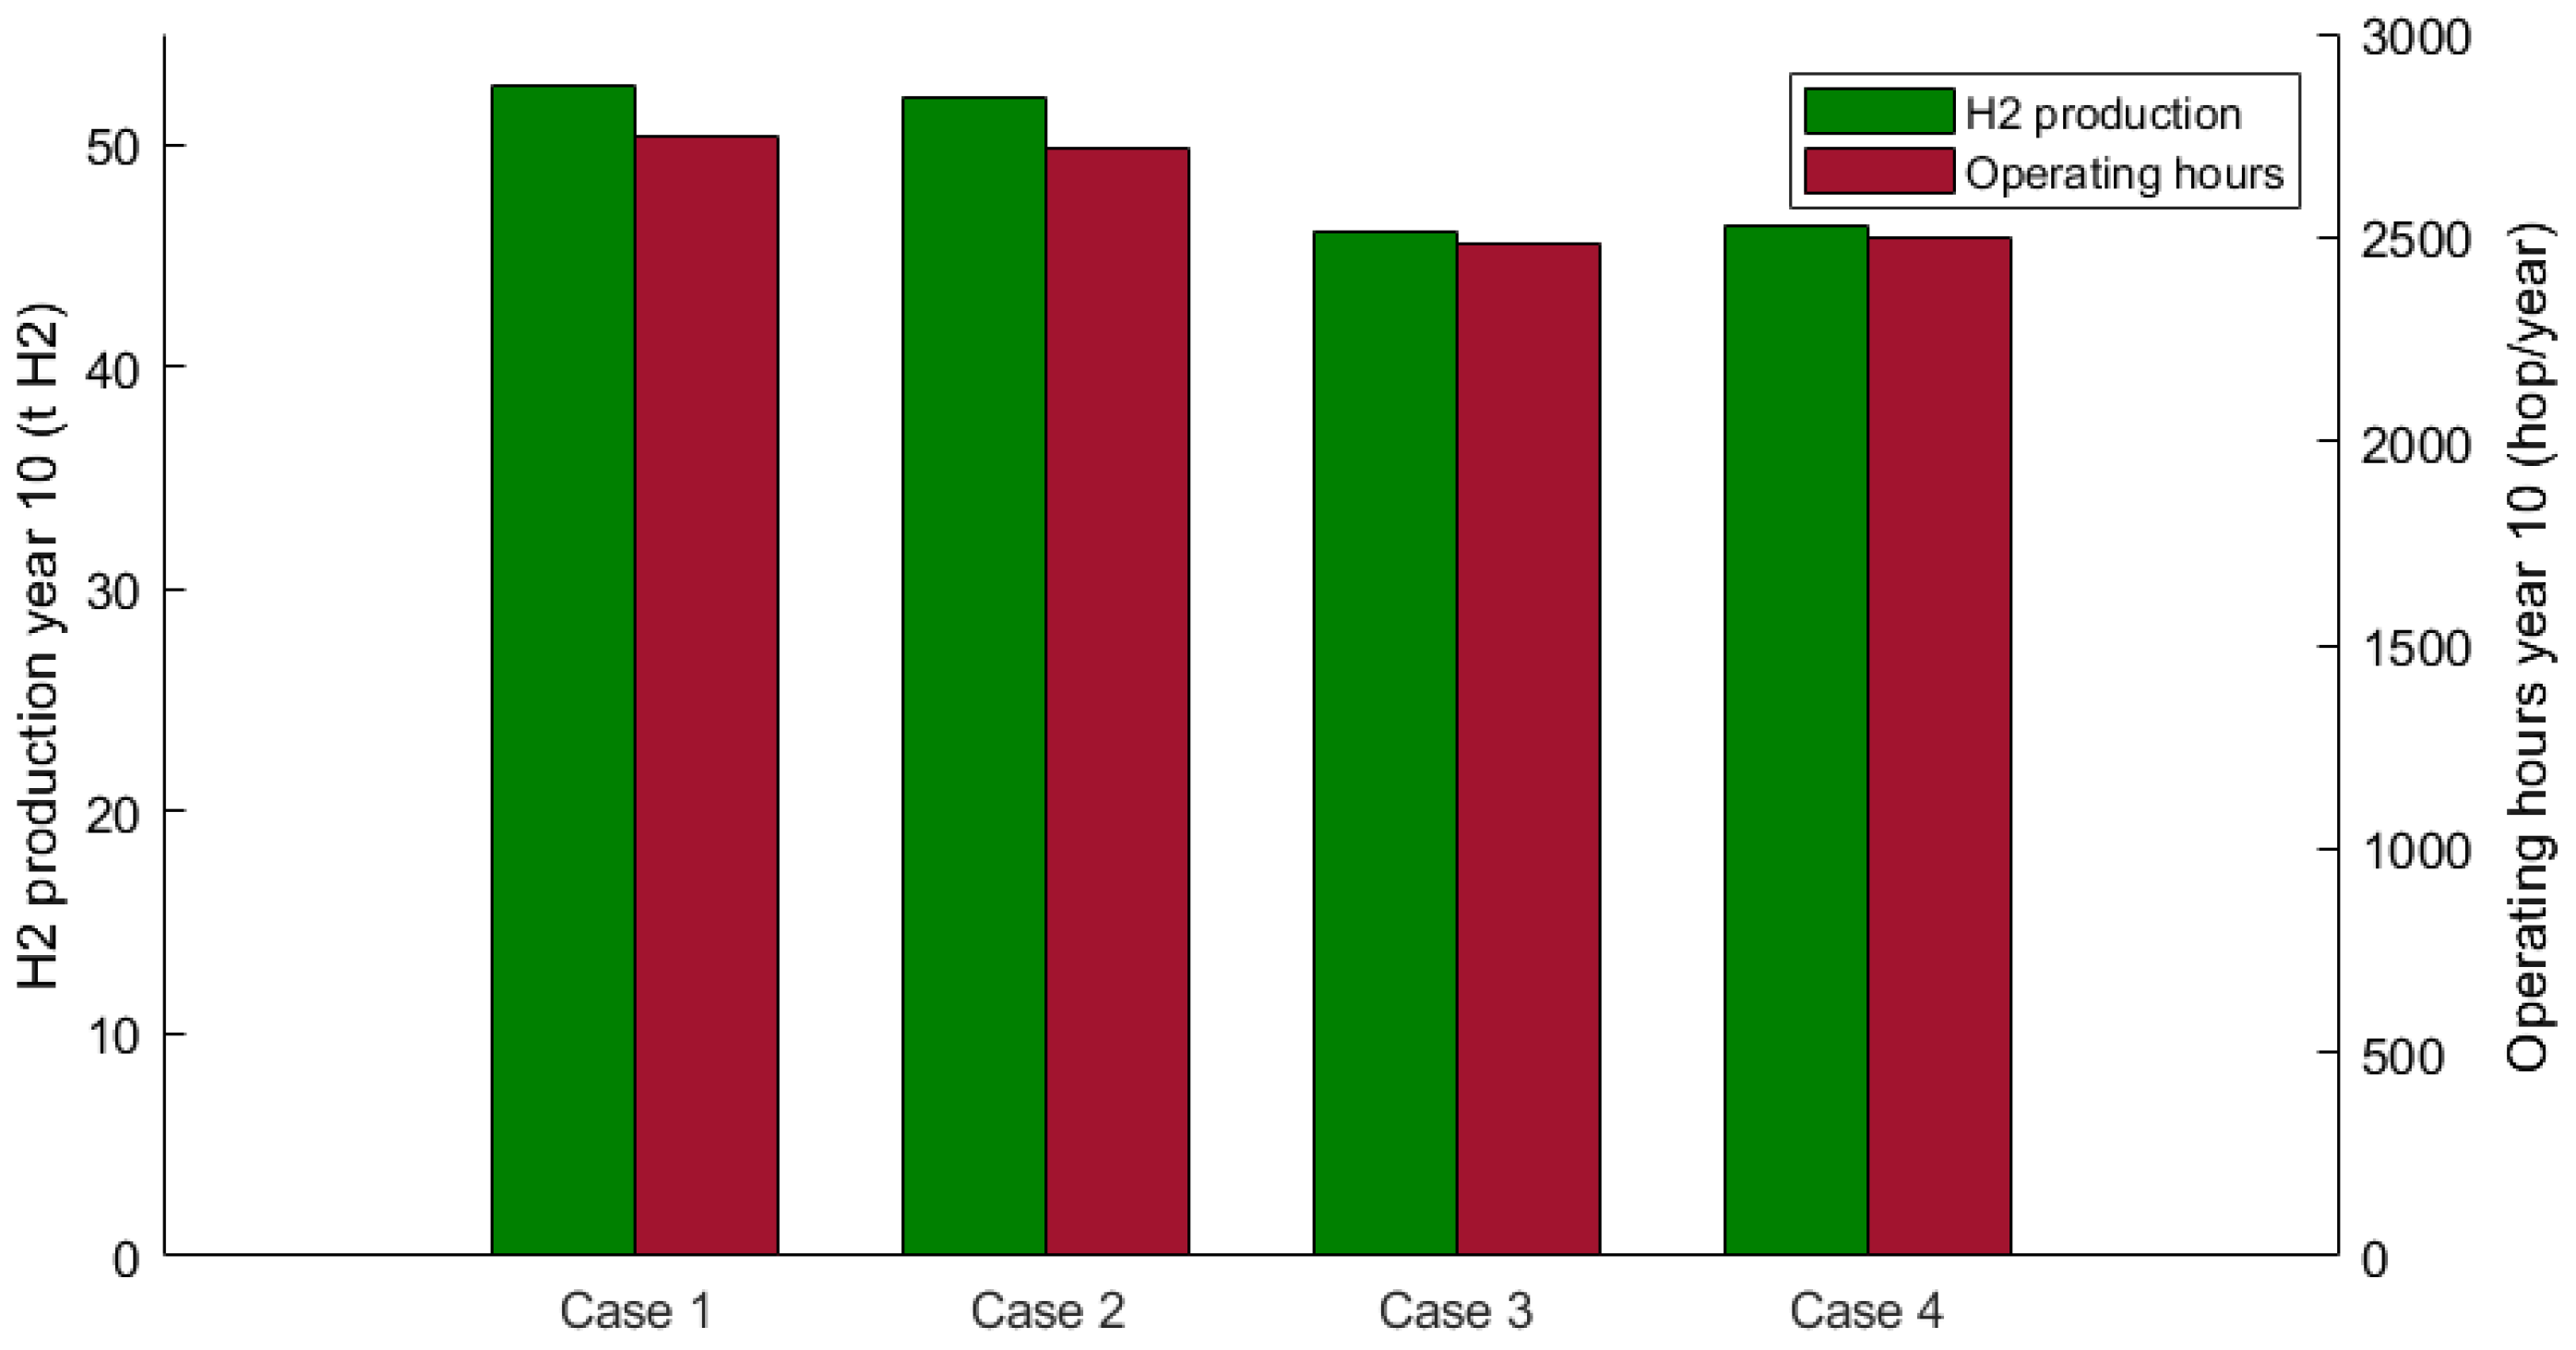
Finally, a comparison of the scenarios investigated, showing the results for the last period of operation, is illustrated in Figure 9. It evidences no significant variation, around 1%, in the hydrogen production between case 1 and case 2. The latter differs by incorporating the heating operation of the electrolyte to the set point temperature required for initiating hydrogen production. This implies that, due to the allocation logic, the first stacks in case 2 operate for fewer hours since they cannot produce during transitional hours, though this impact is marginal. Differently, in cases 3 and 4, the effects of the annual degradation on the PV cells and MEA are introduced in addition to the thermal cycling of the electrolyte. This combination leads to a reduction in the available power over the years and jointly an increase in the electrical consumption of the electrolyzer.
Consequently, there is an overestimation of the amount of hydrogen produced in the first cases by approximately 11% and a reduction in the operating hours from an average of 2744 to 2499 in cases 1 and 4, respectively. Furthermore, the mitigation of the degradation effect in case 4, achieved through the improvement of stack utilization, results in a slight performance increase of about 0.5%. This improvement is more evident when simulating the set inversion, allowing a more distributed utilization of all 42 stacks.
Indeed, it was observed that the first five stacks of the initial 500 kW set exceed the expected lifetime of 35,000 h, whereas the latter stacks are activated for only one-third of the operating hours.

3.3. Stack Efficiency Comparison

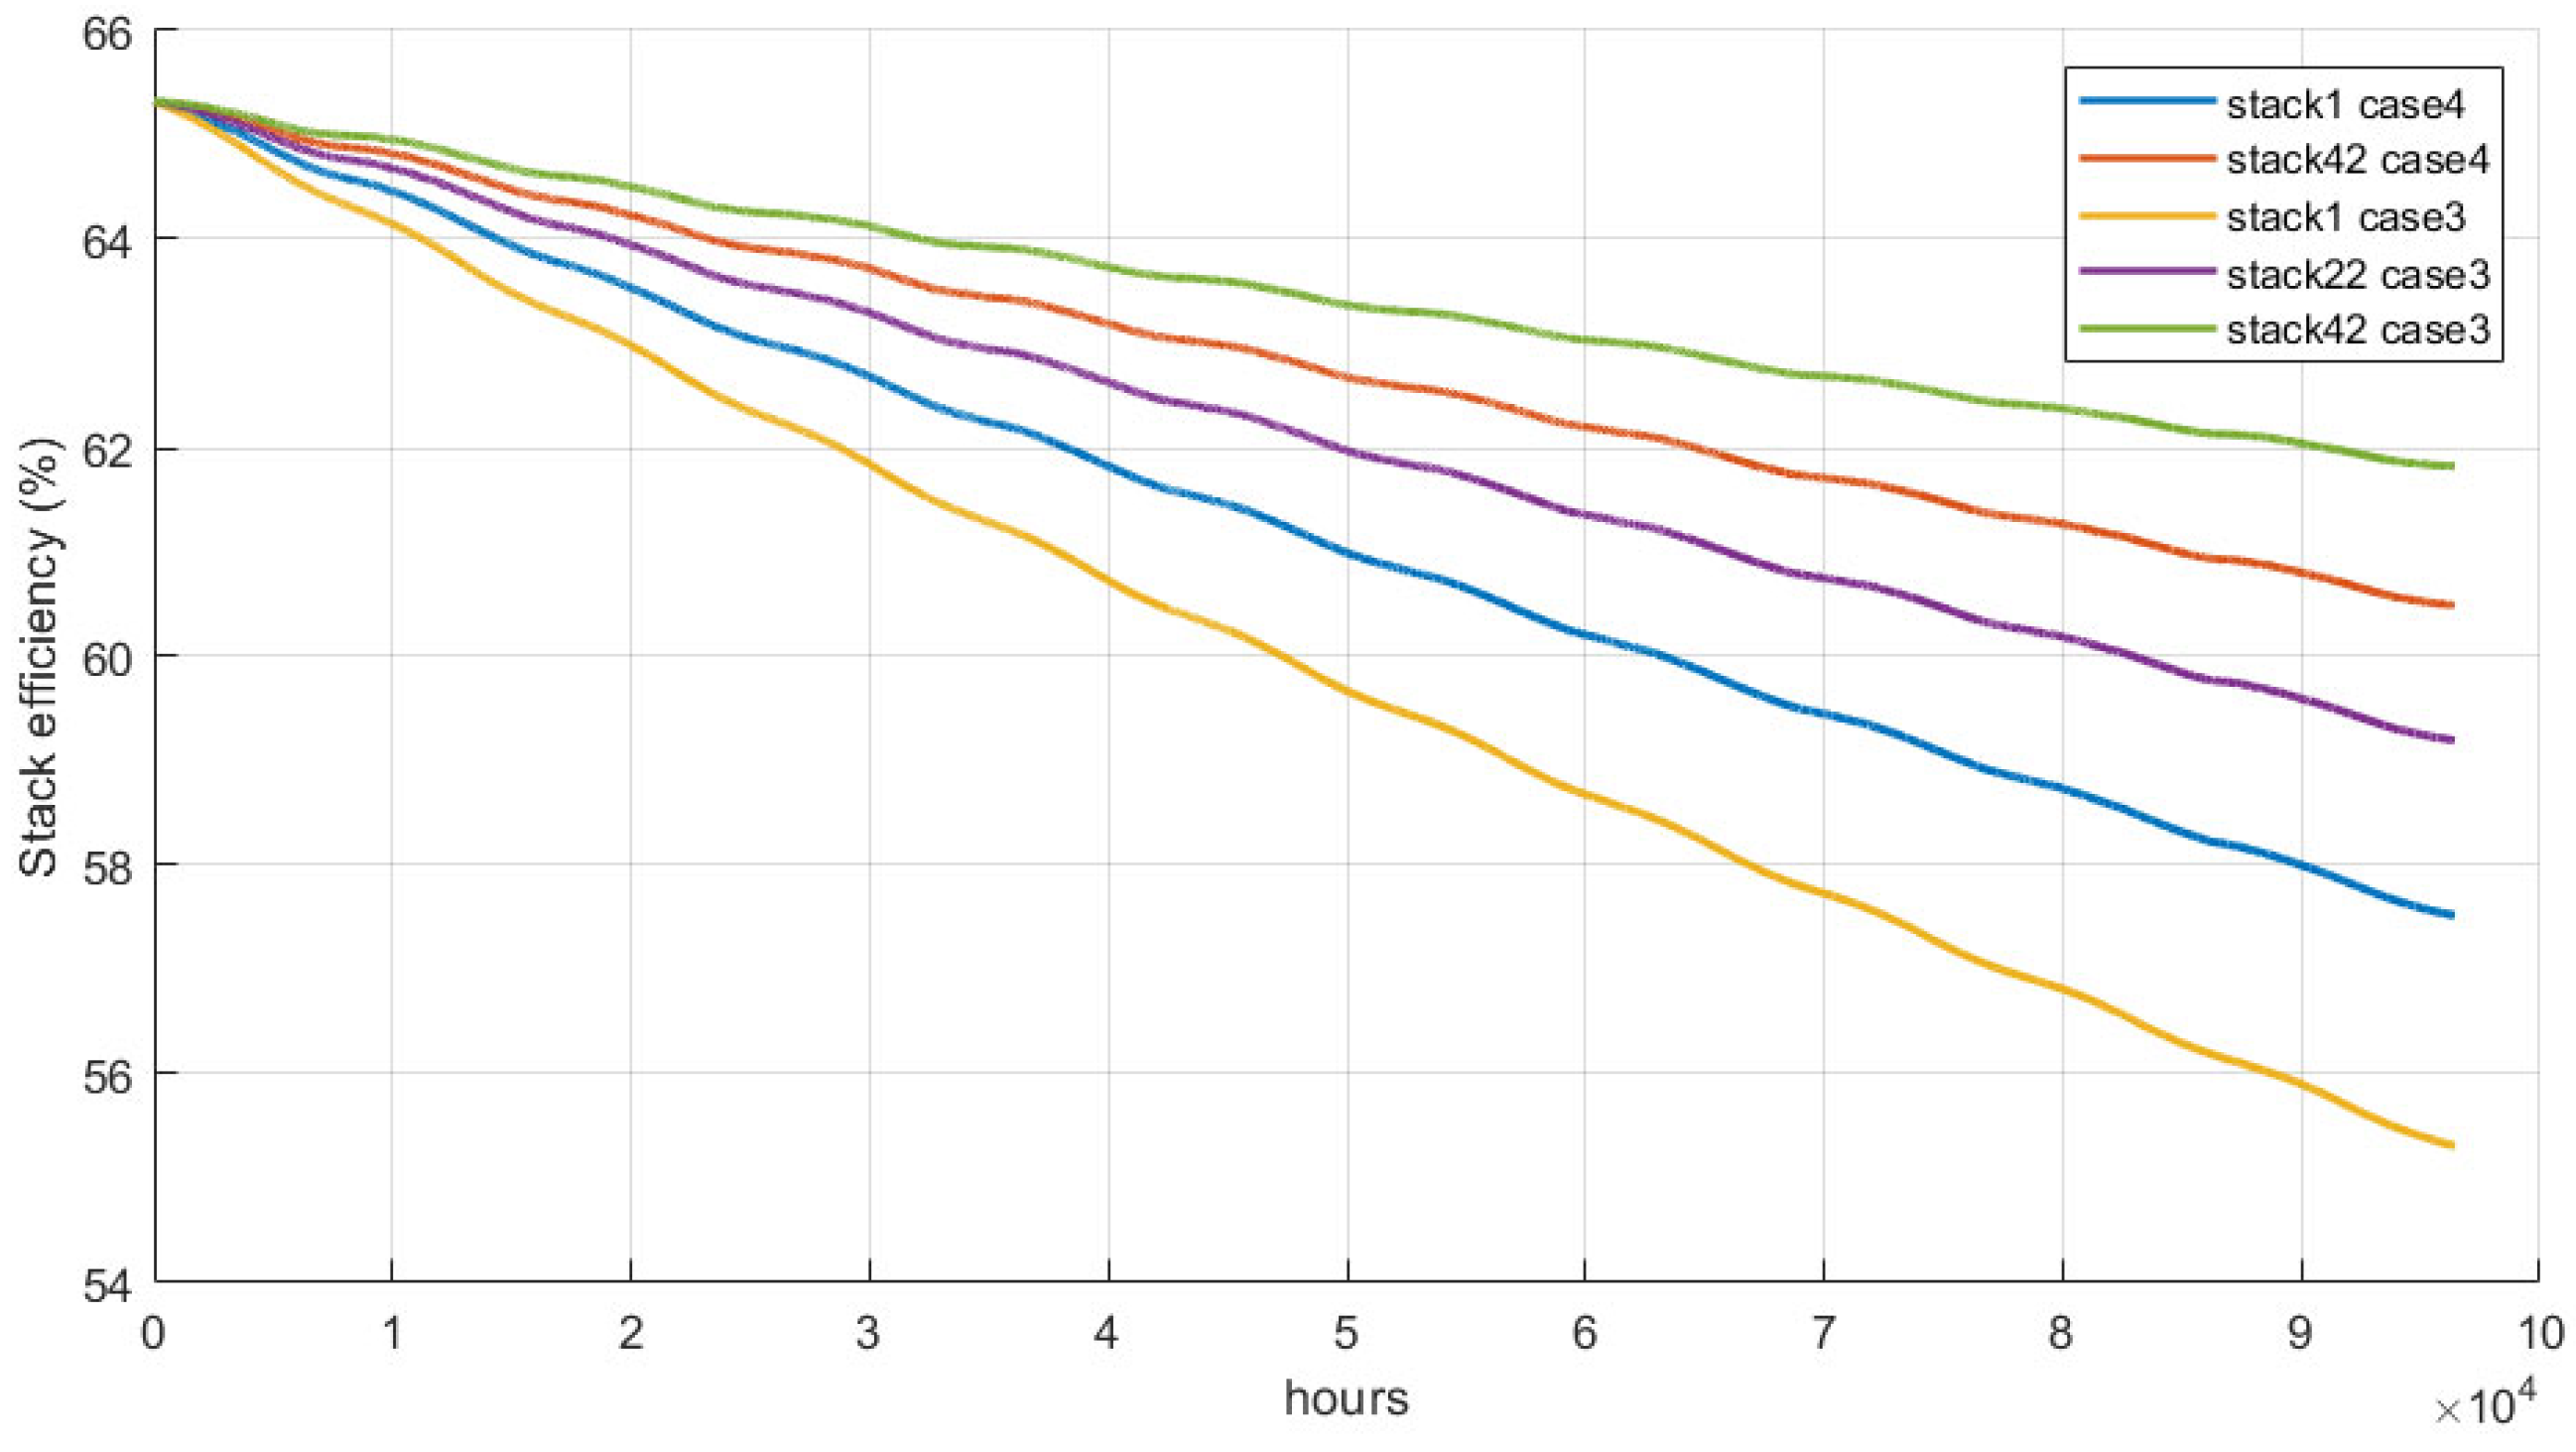
Even if a better logic for using the stacks, as simulated in case 4, does not produce a significant variation in the total hydrogen production over a decade of electrolyzer operation, it nonetheless exerts a more pronounced effect on stack efficiency (here referred to LHV). Specifically, after the 10th year, stack 1 in case 3 reaches the end of its operational lifespan, with its efficiency declining to 55%, down from nearly 65% initially.
Conversely, in case 4, the non-sequential activation strategy allows for a recovery of efficiency on the same stack of 3%. Consequently, both stacks 1 and 42 exhibit similar trends, with the efficiency disparity in the final year of operation being halved compared with case 3. The comparison of the efficiency variation in the stacks for the two cases from the start to the end of the simulation is represented in Figure 10.

3.4. Electrolyzer Operation

As anticipated in the Section 2, electrolyzers typically function in three distinct states: production, where optimal pressure and temperature conditions are established to activate the stack and generate hydrogen; hot standby, a transient state in which the electrolyzer is maintained at an intermediate temperature below its optimal operating temperature without performing electrolysis; and cold standby, occurring when the electrolyzer has been inactive long enough to necessitate pre-heating before actual production starts. The results, as illustrated in Figure 11, indicate that in case 2, this condition prevails during months with low solar irradiation, reaching a minimum of 37.5% of total operations in June. In case 3, the prevalence of this condition is significantly reduced, and in scenario 4, it is eliminated altogether. This improvement is attributed to the better matching of the available electrical power from solar energy and the reduced impact of degradation, thereby increasing the proportion of time during which production occurs, particularly during months with higher levels of solar energy production, such as June, where a notable increase of 5% in renewable energy output is observed.

4. Conclusions

In this paper, off-grid DC-linked solar PV-Anion Exchange Membrane (AEM) electrolyzer systems are modelled in MATLAB with the aim of providing a more realistic estimation of hydrogen production. This is achieved by dynamically simulating the thermal energy management of the electrolyte to ensure adequate startup operations. It incorporates an increased power demand due to load cycle degradation effects and a decrease in renewable energy power due to PV module decay. The simulations are conducted over a 10-year-long time horizon with an hourly resolution, considering solar irradiation in the area of Rome, Italy. The results are compared with two simplified scenarios: one that does not account for the equipment’s response time to variable supply and another that assumes a fixed startup temperature of 15 °C. Additionally, an improved scenario is also considered, including a non-sequential activation logic for the stacks to mitigate degradation effects primarily affecting the first order of stacks.
The results show that neglecting annual degradation effects and, to a lesser extent, the thermal cycling of the electrolyte leads to an overestimation of the amount of hydrogen produced by approximately 11% and a reduction in operating hours by about 9%. An improvement in the utilization level of the stacks results in a slight performance increase of about 0.5% to 1.2% when simulating the set inversion, with a more pronounced effect on stack efficiency. Indeed, a non-sequential power on of the stacks enables for the more distributed utilization of all 42 stacks, recovery of efficiency and, ultimately, improved lifetime. Finally, in the improved scenario, the inactive periods are reduced thanks to the better matching of the available electrical power from solar energy, increasing the proportion of production periods relative to cold and hot standby conditions.
Although this study proposes a more in-depth methodology for assessing the productivity of a coupled PV–electrolysis system, significant insights should come from integrating economic analysis with technical performance data. Therefore, future works should include a comprehensive assessment of the costs associated with these systems. This would involve evaluating the capital and operational expenditures and accurately estimating replacement costs when stack degradation necessitates it. Moreover, the proposed model would benefit from experimental validation using data from the real-world operation of a megawatt-scale setup. Lastly, although the modelling of thermal dynamics was primarily aimed at ensuring the accurate estimation of system availability and hydrogen production, particularly by accounting for the time needed to reach minimum operating temperature during startup, the current analysis does not provide a detailed evaluation of transient thermal gradients within the electrolyte or the potential impacts of extreme environmental conditions. These aspects merit further investigation and represent promising directions for future model enhancements.

Author Contributions

Conceptualization, R.C., E.B. and C.B.; methodology, R.C., D.V. and C.B.; software, R.C. and D.V.; data curation, E.B., C.B. and L.D.Z.; writing—original draft preparation, R.C. and D.V.; writing—review and editing, E.B. and L.D.Z.; supervision, C.B. All authors have read and agreed to the published version of the manuscript.

Funding

This work was conducted under the ‘Accordo di Programma MASE-ENEA sulla Ricerca di Sistema Elettrico—Piano Triennale di Realizzazione 2022–2024′—Integrated project ‘Hydrogen technologies’, which is supported by the ‘Fund for financing Research activities’ established at ‘Cassa per i servizi energetici e ambientali (CSEA)’.

Data Availability Statement

The original contributions presented in this study are included in the article. Further inquiries can be directed to the corresponding author.

Acknowledgments

Umberto Di Matteo is gratefully acknowledged for his support in project management and funding acquisition. The authors have reviewed and edited the output and take full responsibility for the content of this publication.

Conflicts of Interest

The authors declare no conflicts of interest.

Abbreviations

η Efficiency, %
AArea, m2
g t i Global tilted irradiance, W/m2
HHeat transfer coefficient, W/m2K
idxIndex
KConductivity, W/mK
LTank height, m
PPower, kW
QHeat transfer, W
RThermal Resistance, Km2/W
TTime, h
TTemperature, K
UOverall heat transfer coefficient, W/m2K
wtWeight percent
Acronyms
AELAlkaline Electrolysis
AEMAnion Exchange Membrane Electrolysis
BoPBalance of Plant
CFCapacity Factor
DCDirect Current
DFDegradation Rate
ELElectrolyzer
EUEuropean Union
GTIGlobal Tilted Irradiance
H+Hydrogen Ions
HERHydrogen Evolution Reaction
HRSHydrogen Refuelling Station
I-V Current-Voltage
KOHPotassium Hydroxide
LHVLower Heating Value
MEAMembrane Electrode Assembly
MPTTMaximum Power Point Tracking
OEROxygen Evolution Reaction
OHHydroxide Ion
PEMELProton Exchange Membrane Electrolysis
PVPhotovoltaic
SMRSteam Methane Reforming
TRLTechnology Readiness Level
Subscripts
condConduction
convConvection
elElectrical
extExternal
intInternal
nomNominal
sysSystem
totTotal

References

  1. Wolf, E.; Fung, I.; Hoskins, B.; Mitchell, J.F.B.; Palmer, T.; Santer, B. Climate Change: Evidence & Causes. 2020. The Royal Society. Available online: https://www.nap.edu/catalog/18373 (accessed on 1 February 2024).
  2. Sarsar, L.; Echaoui, A. Empirical analysis of the economic complexity boost on the impact of energy transition on economic growth: A panel data study of 124 countries. Energy 2024, 294, 130712. [Google Scholar] [CrossRef]
  3. European Council. Fit for 55. European Green Deal. Available online: https://www.consilium.europa.eu/en/policies/green-deal/fit-for-55-the-eu-plan-for-a-green-transition/ (accessed on 1 February 2024).
  4. Farrell, N. Policy design for green hydrogen. Renew. Sustain. Energy Rev. 2023, 178, 113216. [Google Scholar] [CrossRef]
  5. European Hydrogen Observatory. Hydrogen Production. Available online: https://observatory.clean-hydrogen.europa.eu/hydrogen-landscape/production-trade-and-cost/hydrogen-production (accessed on 27 November 2024).
  6. IEA. World Energy Outlook; IEA: Paris, France, 2024. [Google Scholar]
  7. Aminov, R.Z.; Bairamov, A.N.; Filippov, S.P. Comprehensive assessment of the effectiveness of the hydrogen production and transportation system. Int. J. Hydrogen Energy 2024, 86, 1358–1375. [Google Scholar] [CrossRef]
  8. Hydrogen Europe. Clean Energy Monitor; Hydrogen Europe: Brussels, Belgium, 2024. [Google Scholar]
  9. Jia, J.; Seitz, L.C.; Benck, J.D.; Huo, Y.; Chen, Y.; Ng, J.W.D.; Bilir, T.; Harris, J.S.; Jaramillo, T.F. Solar water splitting by photovoltaic-electrolysis with a solar-to-hydrogen efficiency over 30%. Nat. Commun. 2016, 7, 13237. [Google Scholar] [CrossRef]
  10. Van, L.P.; Hoang, L.H.; Duc, T.N. A comprehensive review of direct coupled photovoltaic-electrolyser system: Sizing techniques, operating strategies, research progress, current challenges, and future recommendations. Int. J. Hydrogen Energy 2023, 48, 25231–25249. [Google Scholar] [CrossRef]
  11. Zhou, Z.; Zhang, S.; Zhong, Y.; Sun, Z.; Peng, Y. A predictive control method for multi-electrolyzer off-grid hybrid hydrogen production systems with photovoltaic power prediction. Int. J. Hydrogen Energy 2024, 84, 383–393. [Google Scholar] [CrossRef]
  12. Khalilnejad, A.; Abbaspour, A.; Sarwat, A.I. Multi-level optimization approach for directly coupled photovoltaic-electrolyser system. Int. J. Hydrogen Energy 2016, 41, 11884–11894. [Google Scholar] [CrossRef]
  13. Laoun, B.; Khellaf, A.; Naceur, M.W.; Kannan, A.M. Modeling of solar photovoltaic-polymer electrolyte membrane electrolyzer direct coupling for hydrogen generation. Int. J. Hydrogen Energy 2016, 41, 10120–10135. [Google Scholar] [CrossRef]
  14. Gallardo, F.; García, J.; Ferrario, A.M.; Comodi, G.; Chiu, J.N. Assessing sizing optimality of OFF-GRID AC-linked solar PV-PEM systems for hydrogen production. Int. J. Hydrogen Energy 2022, 47, 27303–27325. [Google Scholar] [CrossRef]
  15. Şahin, M.E. A photovoltaic powered electrolysis converter system with maximum power point tracking control. Int. J. Hydrogen Energy 2020, 45, 9293–9304. [Google Scholar] [CrossRef]
  16. Benghanem, M.; Chettibi, N.; Mellit, A.; Almohamadi, H. Type-2 fuzzy-logic based control of photovoltaic-hydrogen production systems. Int. J. Hydrogen Energy 2023, 48, 35477–35492. [Google Scholar] [CrossRef]
  17. Mohammadi, A.; Mehrpooya, M. A comprehensive review on coupling different types of electrolyzer to renewable energy sources. Energy 2018, 158, 632–655. [Google Scholar] [CrossRef]
  18. Mallapragada, D.S.; Gençer, E.; Insinger, P.; Keith, D.W.; O’Sullivan, F.M. Can Industrial-Scale Solar Hydrogen Supplied from Commodity Technologies Be Cost Competitive by 2030? Cell Rep. Phys. Sci. 2020, 1, 100174. [Google Scholar] [CrossRef]
  19. Vostakola, M.F.; Ozcan, H.; El-Emam, R.S.; Horri, B.A. Recent Advances in High-Temperature Steam Electrolysis with Solid Oxide Electrolysers for Green Hydrogen Production. Energies 2023, 16, 3327. [Google Scholar] [CrossRef]
  20. IRENA. Green Hydrogen Cost Reduction; Scaling up Electrolysers to Meet the 1.5 C Climate Goal; International Renewable Energy Agency: Abu Dhabi, United Arab Emirates, 2020; Available online: www.irena.org/publications (accessed on 27 November 2024).
  21. Lopez, V.A.M.; Ziar, H.; Haverkort, J.W.; Zeman, M.; Isabella, O. Dynamic operation of water electrolyzers: A review for applications in photovoltaic systems integration. Renew. Sustain. Energy Rev. 2023, 182, 113407. [Google Scholar] [CrossRef]
  22. Lange, H.; Klose, A.; Lippmann, W.; Urbas, L. Technical evaluation of the flexibility of water electrolysis systems to increase energy flexibility: A review. Int. J. Hydrogen Energy 2023, 48, 15771–15783. [Google Scholar] [CrossRef]
  23. Abdelsalam, R.A.; Mohamed, M.; Farag, H.E.Z.; El-Saadany, E.F. Green hydrogen production plants: A techno-economic review. Energy Convers. Manag. 2024, 319, 118907. [Google Scholar] [CrossRef]
  24. Hu, S.; Guo, B.; Ding, S.; Yang, F.; Dang, J.; Liu, B.; Gu, J.; Ma, J.; Ouyang, M. A comprehensive review of alkaline water electrolysis mathematical modeling. Appl. Energy 2022, 327, 120099. [Google Scholar] [CrossRef]
  25. Aili, D.; Kraglund, M.R.; Rajappan, S.C.; Serhiichuk, D.; Xia, Y.; Deimede, V.; Kallitsis, J.; Bae, C.; Jannasch, P.; Henkensmeier, D.; et al. Electrode Separators for the Next-Generation Alkaline Water Electrolyzers. Am. Chem. Soc. 2023, 8, 1900–1910. [Google Scholar] [CrossRef]
  26. Xu, G.; Wu, Y.; Tang, S.; Wang, Y.; Yu, X.; Ma, M. Optimal design of hydrogen production processing coupling alkaline and proton exchange membrane electrolyzers. Energy 2024, 302, 131827. [Google Scholar] [CrossRef]
  27. Han, B.; Steen, S.M.; Mo, J.; Zhang, F.Y. Electrochemical performance modeling of a proton exchange membrane electrolyzer cell for hydrogen energy. Int. J. Hydrogen Energy 2015, 40, 7006–7016. [Google Scholar] [CrossRef]
  28. Hernández-Gómez, Á.; Ramirez, V.; Guilbert, D. Investigation of PEM electrolyzer modeling: Electrical domain, efficiency and specific energy consumption. Int. J. Hydrogen Energy 2020, 45, 14625–14639. [Google Scholar] [CrossRef]
  29. Patonia, A.; Poudineh, R. Cost-Competitive Green Hydrogen: How to Lower the Cost of Electrolysers? Oxford Institute for Energy Studies: Oxford, UK, 2022. [Google Scholar]
  30. Park, Y.S.; Liu, F.; Diercks, D.; Braaten, D.; Liu, B.; Duan, C. High-performance anion exchange membrane water electrolyzer enabled by highly active oxygen evolution reaction electrocatalysts: Synergistic effect of doping and heterostructure. Appl. Catal. B Environ. 2022, 318, 121824. [Google Scholar] [CrossRef]
  31. Vincent, I.; Bessarabov, D. Low cost hydrogen production by anion exchange membrane electrolysis: A review. Renew. Sustain. Energy Rev. 2018, 81, 1690–1704. [Google Scholar] [CrossRef]
  32. Zignani, S.C.; Faro, M.L.; Carbone, A.; Italiano, C.; Trocino, S.; Monforte, G.; Aricò, A. Performance and stability of a critical raw materials-free anion exchange membrane electrolysis cell. Electrochim. Acta 2022, 413, 140078. [Google Scholar] [CrossRef]
  33. Li, S.; Xin, Z.; Luo, Y.; Pan, J.; Liao, G.; Li, Q.; Sun, Y.; Feng, Z.; Tan, R. Recent advances in the development of single atom catalysts for oxygen evolution reaction. Int. J. Hydrogen Energy 2024, 82, 1081–1100. [Google Scholar] [CrossRef]
  34. Kim, J.H.; Jo, H.J.; Han, S.M.; Kim, Y.J.; Kim, S.Y. Recent advances in electrocatalysts for anion exchange membrane water electrolysis: Design strategies and characterization approaches. Energy Mater. 2025, 5, 500099. [Google Scholar] [CrossRef]
  35. Du, N.; Roy, C.; Peach, R.; Turnbull, M.; Thiele, S.; Bock, C. Anion-Exchange Membrane Water Electrolyzers. Am. Chem. Soc. 2022, 122, 11830–11895. [Google Scholar] [CrossRef]
  36. Titheridge, L.J.; Marshall, A.T. Techno-economic modelling of AEM electrolysis systems to identify ideal current density and aspects requiring further research. Int. J. Hydrogen Energy 2024, 49, 518–532. [Google Scholar] [CrossRef]
  37. Li, S.; Liu, T.; Zhang, W.; Wang, M.; Zhang, H.; Qin, C.; Zhang, L.; Chen, Y.; Jiang, S.; Liu, D.; et al. Highly efficient anion exchange membrane water electrolyzers via chromium-doped amorphous electrocatalysts. Nat. Commun. 2024, 15, 1–11. [Google Scholar] [CrossRef]
  38. Guo, D.; Chi, J.; Yu, H.; Jiang, G.; Shao, Z. Self-Supporting NiFe Layered Double Hydroxide ‘Nanoflower’ Cluster Anode Electrode for an Efficient Alkaline Anion Exchange Membrane Water Electrolyzer. Energies 2022, 15, 4645. [Google Scholar] [CrossRef]
  39. Silva, A.S.-D.; Hartert, A.; Oestreicher, V.; Romero, J.; Jaramillo-Hernández, C.; Muris, L.J.J.; Thorez, G.; Vieira, B.J.C.; Ducourthial, G.; Fiocco, A.; et al. Scalable synthesis of NiFe-layered double hydroxide for efficient anion exchange membrane electrolysis. Nat. Commun. 2025, 16, 6138. [Google Scholar] [CrossRef]
  40. Zhang, Z.J.; Xu, H.M.; Huang, C.J.; Shuai, T.Y.; Zhan, Q.N.; Li, G.R. Recent advances in the synthesis of transition metal hydroxyl oxide catalysts and their application in electrocatalytic oxygen evolution reactions. Nanoscale 2024, 16, 19970–19997. [Google Scholar] [CrossRef] [PubMed]
  41. Falcão, D.S.; Pinto, A.M.F.R. A review on PEM electrolyzer modelling: Guidelines for beginners. J. Clean. Prod. 2020, 261, 121184. [Google Scholar] [CrossRef]
  42. Brezak, D.; Kovač, A.; Firak, M. MATLAB/Simulink simulation of low-pressure PEM electrolyzer stack. Int. J. Hydrogen Energy 2023, 48, 6158–6173. [Google Scholar] [CrossRef]
  43. Möller, M.C.; Krauter, S. Hybrid Energy System Model in Matlab/Simulink Based on Solar Energy, Lithium-Ion Battery and Hydrogen. Energies 2022, 15, 2201. [Google Scholar] [CrossRef]
  44. Tjarks, G.; Gibelhaus, A.; Lanzerath, F.; Müller, M.; Bardow, A.; Stolten, D. Energetically-optimal PEM electrolyzer pressure in power-to-gas plants. Appl. Energy 2018, 218, 192–198. [Google Scholar] [CrossRef]
  45. Toghyani, S.; Fakhradini, S.; Afshari, E.; Baniasadi, E.; Jamalabadi, M.Y.A.; Shadloo, M.S. Optimization of operating parameters of a polymer exchange membrane electrolyzer. Int. J. Hydrogen Energy 2019, 44, 6403–6414. [Google Scholar] [CrossRef]
  46. Ruuskanen, V.; Koponen, J.; Kosonen, A.; Hehemann, M.; Keller, R.; Niemelä, M.; Ahola, J. Power quality estimation of water electrolyzers based on current and voltage measurements. J. Power Sources 2020, 450, 227603. [Google Scholar] [CrossRef]
  47. IRENA. Geopolitics of the Energy Transformation: The Hydrogen Factor; International Renewable Energy Agency: Abu Dhabi, United Arab Emirates, 2022. [Google Scholar]
  48. Tuinema, B.W.; Adabi, E.; Ayivor, P.K.; Suárez, V.G.; Liu, L.; Perilla, A.; Ahmad, Z.; Torres, J.L.R.; van der Meijden, M.A.; Palensky, P. Modelling of large-sized electrolysers for realtime simulation and study of the possibility of frequency support by electrolysers. IET Gener. Transm. Distrib. 2020, 14, 1985–1992. [Google Scholar] [CrossRef]
  49. Xu, X.; Hu, W.; Liu, W.; Wang, D.; Huang, Q.; Huang, R.; Chen, Z. Risk-based scheduling of an off-grid hybrid electricity/hydrogen/gas/refueling station powered by renewable energy. J. Clean. Prod. 2021, 315, 128155. [Google Scholar] [CrossRef]
  50. Huang, C.; Zong, Y.; You, S.; Traholt, C. Analytical Modeling and Control of Grid-Scale Alkaline Electrolyzer Plant for Frequency Support in Wind-Dominated Electricity-Hydrogen Systems. IEEE Trans. Sustain. Energy 2023, 14, 217–232. [Google Scholar] [CrossRef]
  51. Matute, G.; Yusta, J.M.; Correas, L.C. Techno-economic modelling of water electrolysers in the range of several MW to provide grid services while generating hydrogen for different applications: A case study in Spain applied to mobility with FCEVs. Int. J. Hydrogen Energy 2019, 44, 17431–17442. [Google Scholar] [CrossRef]
  52. Stansberry, J.M.; Brouwer, J. Experimental dynamic dispatch of a 60 kW proton exchange membrane electrolyzer in power-to-gas application. Int. J. Hydrogen Energy 2020, 45, 9305–9316. [Google Scholar] [CrossRef]
  53. Wallnöfer-Ogris, E.; Brouwer, J. A review on understanding and identifying degradation mechanisms in PEM water electrolysis cells: Insights for stack application, development and research. Int. J. Hydrogen Energy 2024, 65, 381–397. [Google Scholar] [CrossRef]
  54. Batalla, B.S.; Laube, A.; Hofer, A.; Struckmann, T.; Bachmann, J.; Weidlich, C. Degradation studies of proton exchange membrane water electrolysis cells with low platinum group metals—Catalyst coating achieved by atomic layer deposition. Int. J. Hydrogen Energy 2022, 47, 39719–39730. [Google Scholar] [CrossRef]
  55. Höglinger, M.; Kartusch, S.; Eder, J.; Grabner, B.; Macherhammer, M.; Trattner, A. Advanced testing methods for proton exchange membrane electrolysis stacks. Int. J. Hydrogen Energy 2024, 77, 598–611. [Google Scholar] [CrossRef]
  56. MATLAB, Version 9.13 (R2022b); MathWorks, Inc.: Natick, MA, USA, 2022.
  57. Photovoltaic Geographical Information System (PVGIS). Version 5.2; 2017. Available online: https://re.jrc.ec.europa.eu/pvg_tools/en/#MR (accessed on 3 July 2024).
  58. Heterojunction Hyper-Ion Series Bifacial Module. 2024. Available online: https://en.risenenergy.com/ (accessed on 3 July 2024).
  59. Marocco, P.; Gandiglio, M.; Santarelli, M. Optimal design of PV-based grid-connected hydrogen production systems. J. Clean. Prod. 2024, 434, 140007. [Google Scholar] [CrossRef]
  60. Vizza, D.; Caponi, R.; Bocci, E.; Del Zotto, L.; Bassano, C. Cost effective hydrogen production of coupled photovoltaic and electrolyzer systems considering plant lifetime and geographical location. Energy Convers. Manag. X 2025, 27, 101136. [Google Scholar] [CrossRef]
  61. Lopez, V.A.M.; Ziar, H.; Zeman, M.; Isabella, O. Optimization of a stand-alone PV system for efficient hydrogen production using an alkaline water electrolyzer. In Proceedings of the 23rd World Hydrogen Energy Conference: Bridging Continents by H2, WHEC, Istanbul, Turkey, 26–30 June 2022; International Association for Hydrogen Energy, IAHE: Miami, FL, USA, 2022; pp. 1020–1022. [Google Scholar]
  62. EPC Bidirectional DC/DC Converters. 2024. Available online: https://epicpowerconverters.com/products/dc-dc-converters/ (accessed on 3 July 2024).
  63. Rakousky, C.; Reimer, U.; Wippermann, K.; Kuhri, S.; Carmo, M.; Lueke, W.; Stolten, D. Polymer electrolyte membrane water electrolysis: Restraining degradation in the presence of fluctuating power. J. Power Sources 2017, 342, 38–47. [Google Scholar] [CrossRef]
  64. Siracusano, S.; Trocino, S.; Briguglio, N.; Pantò, F.; Aricò, A.S. Analysis of performance degradation during steady-state and load-thermal cycles of proton exchange membrane water electrolysis cells. J. Power Sources 2020, 468, 228390. [Google Scholar] [CrossRef]
  65. Mulk, W.U.; Aziz, A.R.A.; Ismael, M.A.; Ghoto, A.A.; Ali, S.A.; Younas, M.; Gallucci, F. Electrochemical hydrogen production through anion exchange membrane water electrolysis (AEMWE): Recent progress and associated challenges in hydrogen production. Int. J. Hydrogen Energy 2024, 94, 1174–1211. [Google Scholar] [CrossRef]
  66. Azam, A.M.I.N.; Ragunathan, T.; Zulkefli, N.N.; Masdar, M.S.; Majlan, E.H.; Yunus, R.M.; Shamsul, N.S.; Husaini, T.; Shaffee, S.N.A. Investigation of Performance of Anion Exchange Membrane (AEM) Electrolysis with Different Operating Conditions. Polymers 2023, 15, 1301. [Google Scholar] [CrossRef]
  67. Bender, G.; Dinh, H.N. HydroGEN: Low-Temperature Electrolysis (LTE) and LTE/Hybrid Supernode; National Renewable Energy Laboratory (NREL): Golden, CO, USA, 2020. [Google Scholar]
  68. Kuhnert, E.; Mayer, K.; Heidinger, M.; Rienessel, C.; Hacker, V.; Bodner, M. Impact of intermittent operation on photovoltaic-PEM electrolyzer systems: A degradation study based on accelerated stress testing. Int. J. Hydrogen Energy 2024, 55, 683–695. [Google Scholar] [CrossRef]
  69. Campbell-Stanway, C.; Becerra, V.; Prabhu, S. Techno-economic analysis with electrolyser degradation modelling in green hydrogen production scenarios. Int. J. Hydrogen Energy 2025, 106, 80–95. [Google Scholar] [CrossRef]
  70. Gladik, A.; Riedel, M.; Eichel, R.A. Anion exchange membrane electrolysis at work—Investigating impact of starting parameters and start–stop operation on cold start behavior and degradation. J. Power Sources 2025, 628, 235878. [Google Scholar] [CrossRef]
  71. Bergman, T.L.; Incropera, F.P.; DeWitt, D.P.; Lavine, A.S. Fundamentals of Heat and Mass Transfer; John Wiley & Sons: Hoboken, NJ, USA, 2011. [Google Scholar]
  72. Peet, M.J.; Hasan, H.S.; Bhadeshia, H.K.D.H. Prediction of thermal conductivity of steel. Int. J. Heat Mass Transf. 2011, 54, 2602–2608. [Google Scholar] [CrossRef]
  73. Yener, T.; Yener, Ş.Ç.; Mutlu, R. Convection Coefficient Estimation of Still Air Using an Infrared Thermometer and Curve-Fitting. J. Eng. Technol. Appl. Sci. 2019, 4, 95–103. [Google Scholar] [CrossRef]
Figure 1. Schematic diagram of the coupled PV–electrolyzer system through a power conversion system and relative auxiliaries. The black line indicates the electrical connection; the blue and red lines represent the cold and hot electrolyte flows, respectively; the green line denotes the hydrogen output stream.
Energies 18 04209 g001
Figure 2. Time series of the PV capacity factor for the year 2020. The straight black line represents the annual average CF, equal to 21.8%.
Energies 18 04209 g002
Figure 3. Flow chart of simulation model.
Energies 18 04209 g003
Figure 4. Flow chart of the stack logic operation in the improved scenario.
Energies 18 04209 g004
Figure 5. Hourly average PV production over a representative year, illustrating the typical daily profile for each month.
Energies 18 04209 g005
Figure 6. Total electrical power distribution in the optimized scenario: comparison between maximum and minimum irradiance days in 2010.
Energies 18 04209 g006
Figure 7. Hourly average hydrogen production over a representative year, illustrating the typical daily profile for each month.
Energies 18 04209 g007
Figure 8. Hydrogen production in the optimized scenario: comparison between maximum and minimum irradiance days in 2010.
Energies 18 04209 g008
Figure 9. Comparison of hydrogen production and operating hours across different scenarios for the final year of operation (2020).
Energies 18 04209 g009
Figure 10. Comparison of the stack efficiency over time for case 3 and case 4.
Energies 18 04209 g010
Figure 11. Quantitative representation of the electrolyzer’s operational state for the last year of simulation.
Energies 18 04209 g011
Disclaimer/Publisher’s Note: The statements, opinions and data contained in all publications are solely those of the individual author(s) and contributor(s) and not of MDPI and/or the editor(s). MDPI and/or the editor(s) disclaim responsibility for any injury to people or property resulting from any ideas, methods, instructions or products referred to in the content.