Article

Multi-Seasonal Risk Assessment of Hydrogen Leakage, Diffusion, and Explosion in Hydrogen Refueling Station

1
Sichuan Special Equipment Inspection and Research Institute, Chengdu 610100, China
2
Technology Innovation Center of Hydrogen Storage-Transportation and Fueling Equipments for State Market Regulation, Chengdu 610100, China
3
Hebei Key Laboratory of Low Carbon and High Efficiency Power Generation Technology, North China Electric Power University, Baoding 071003, China
4
College of New Energy, China University of Petroleum (East China), Qingdao 266580, China
*
Author to whom correspondence should be addressed.
Energies 2025, 18(15), 4172; https://doi.org/10.3390/en18154172
Submission received: 29 May 2025 / Revised: 28 July 2025 / Accepted: 4 August 2025 / Published: 6 August 2025

Abstract

To reveal the influence mechanisms of seasonal climatic factors (wind speed, wind direction, temperature) and leakage direction on hydrogen dispersion and explosion behavior from single-source leaks at typical risk locations (hydrogen storage tanks, compressors, dispensers) in hydrogen refueling stations (HRSs), this work established a full-scale 1:1 three-dimensional numerical model using the FLACS v22.2 software based on the actual layout of an HRS in Xichang, Sichuan Province. Through systematic simulations of 72 leakage scenarios (3 equipment types × 4 seasons × 6 leakage directions), the coupled effects of climatic conditions, equipment layout, and leakage direction on hydrogen dispersion patterns and explosion risks were quantitatively analyzed. The key findings indicate the following: (1) Downward leaks (−Z direction) from storage tanks tend to form large-area ground-hugging hydrogen clouds, representing the highest explosion risk (overpressure peak: 0.25 barg; flame temperature: >2500 K). Leakage from compressors (±X/−Z directions) readily affects adjacent equipment. Dispenser leaks pose relatively lower risks, but specific directions (−Y direction) coupled with wind fields may drive significant hydrogen dispersion toward station buildings. (2) Southeast/south winds during spring/summer promote outward migration of hydrogen clouds, reducing overall station risk but causing localized accumulation near storage tanks. Conversely, north/northwest winds in autumn/winter intensify hydrogen concentrations in compressor and station building areas. (3) An empirical formula integrating climatic parameters, leakage conditions, and spatial coordinates was proposed to predict hydrogen concentration (error < 20%). This model provides theoretical and data support for optimizing sensor placement, dynamically adjusting ventilation strategies, and enhancing safety design in HRSs.

1. Introduction

Against the urgent backdrop of global energy decarbonization, promoting the transformation of energy structure toward a clean, low-carbon, and sustainable direction has become a core task of the international community. Renewable energies such as wind and solar energy, due to their clean and pollution-free characteristics, are regarded as key options to replace fossil fuels [1,2]. However, their inherent intermittency and volatility have restricted large-scale and high-proportion applications [3]. As a clean and efficient secondary energy carrier, hydrogen energy shows great potential. Hydrogen production via water electrolysis driven by renewable energies like wind, solar, and hydropower is not only an important approach to obtain hydrogen energy but also can effectively address the intermittency issue of renewable energies [4,5]. According to the statistics of the International Energy Agency (IEA), the global demand for hydrogen exceeded 95 million tons in 2022, with China ranking among the top in the world, with an annual output of 37.81 million tons [6].
As the core energy carrier to achieve the goal of “dual-carbon”, hydrogen energy has become a critical path for the deep decarbonization of global transportation by virtue of its characteristics of zero carbon emissions during use and a high heating value (i.e., the heat of combustion per unit mass, approximately 142 MJ/kg, significantly higher than that of conventional fossil fuels such as gasoline (~46 MJ/kg) and lithium-ion batteries (~0.5–0.8 MJ/kg)) [7,8]. The construction scale of hydrogen refueling stations (HRSs), as the infrastructure for the commercial promotion of hydrogen fuel cell electric vehicles, directly affects the large-scale development of the hydrogen energy industry. As of 2023, China has built over 350 HRSs, accounting for 40% of the global total, and plans to increase this number to 5000 by 2035. However, hydrogen has the characteristics of a low ignition energy (0.02 mJ), wide explosion limit (4% to 75% volume fraction), and high diffusion rate, etc. If the typical risky equipment in an HRS (such as hydrogen storage tanks, compressors, hydrogen refueling machines, etc.) leaks, it is prone to form flammable cloud masses, posing an extremely high risk of explosion and combustion [9]. In recent years, accidents such as the explosion of the Gangneung hydrogen power facility in South Korea and the leakage of an HRS in California, United States, have occurred frequently [10,11], highlighting the urgency for research on hydrogen leakage and diffusion behavior and risk prevention and control.
Based on the above background, some scholars in China and abroad have conducted researches on the general laws of hydrogen leakage, diffusion, and explosion in HRSs. In terms of experimental research, Tanaka et al. [12] established a 1:1 physical model of a hydrogen refueling station to investigate hydrogen dispersion and explosion behavior under realistic conditions, systematically analyzing the effects of nozzle diameter (0.8–8.0 mm), release pressure (40 MPa), and ignition timing on overpressure distribution. Their key finding revealed a logarithmic relationship: peak overpressure decreases linearly with increased ignition delay time. Shirvill et al. [13] focused on releases within a simulated high-pressure dispensing area, utilizing a dummy vehicle and dispenser units to replicate station congestion. Their experiments included both premixed hydrogen–air cloud ignitions (5.4 m × 6.0 m × 2.5 m) and ignited jet releases (≤40 MPa). A critical conclusion was that ignition timing significantly impacts hazard severity—early ignition of high-pressure jets generated higher localized overpressures than larger, lower-turbulence clouds ignited later, highlighting the importance of rapid leak detection and isolation systems. De et al. [14] experimentally investigated hydrogen dispersion in a confined small-scale enclosure (0.47 m × 0.33 m × 0.20 m), analyzing the effects of leak location and flow rate on stratification. Their results indicated that laminar leaks (Re < 1000) formed persistent stratified layers near the ceiling, while turbulent jets (Re > 4000) promoted rapid homogenization. Niu et al. [15] conducted full-scale experiments using an on-board high-pressure release system, systematically investigating the effects of nozzle geometry (circle/triangle/square), leakage pressure (20–70 MPa), and environmental wind. They found that axial concentration decay follows self-similarity laws regardless of nozzle shape or pressure; environmental wind interacts with obstacles, causing localized hydrogen accumulation (concentration exceeding 4% flammability limit) on the column’s inner side, significantly increasing fire/explosion risks under specific wind directions. In terms of numerical simulation research, Kim et al. [16] simulated hydrogen leak dispersion and explosion scenarios at a Korean hydrogen fueling station using the CFD tool FLACS. They first validated leak models (for hole sizes of 0.5–1.0 mm and pressures of 100–400 bar) against experimental data, showing good agreement within 5 m. Then, they analyzed four explosion scenarios (storage tank, production facility, dispenser, dispenser with wall) to determine safety distances based on a blast pressure threshold (0.1226 bar). Kiyotaka et al. [17] analyzed the consequences and hazards of explosion and thermal radiation after hydrogen leakage for an organic hydride HRS being studied in Japan. Wang et al. [18] conducted numerical simulation of the leakage behavior of high-pressure hydrogen storage tanks in an HRS using the Fluent software, quantifying the influence of wind speed, wind direction, and detector position on the diffusion of hydrogen clouds. Liang et al. [19] simulated hydrogen leakage and explosion scenarios at China’s first renewable hydrogen refueling station using FLACS. They analyzed the impact of wind speed, leakage direction, and wind direction on flammable cloud formation and explosion consequences. The key findings included identifying a maximum hazard distance: a harmful distance of 35.7 m (1% fatality probability) and lethal distance of 18.8 m (100% fatality) when wind opposed the leakage direction at 90 MPa storage. Yang et al. [20] established a 1:4-scale experimental platform for hydrogen leakage diffusion in refueling areas to validate CFD models (FLACS). Their key findings included the following: the layout of buildings/equipment significantly alters hydrogen jet paths and combustible cloud shapes; for dispenser/tank leaks, the hydrogen equivalence ratio near the ignition point dictates initial flame speed/surface area, critically impacting explosion severity; for compressor leaks, the distance from ignition to obstacles and obstacle size are key factors determining explosion outcomes. Liu et al. [21] compared the distribution patterns of combustible clouds in various areas of an HRS under different wind speeds through FLACS and discovered the nonlinear influence of delayed ignition time on explosion intensity.
In the aforementioned studies, significant progress has been achieved in researching the risks of hydrogen leakage, diffusion, and explosion in HRSs. However, in-depth analysis reveals that existing research still exhibits limitations: Experimental studies are constrained by safety restrictions and costs, mostly focusing on single hydrogen-containing vessels or scaled-down models, which fail to fully replicate the equipment layout and complex environmental conditions of an actual HRS. Although numerical simulations offer greater flexibility, most studies either rely on simplified/virtual HRS models or only focus on the independent impacts of specific variables (such as leakage size, leakage amount, assumed wind speed, wind direction). They have not systematically explored the coupling effects between actual multi-seasonal climate parameters, leakage conditions, and equipment layouts, making it difficult to reflect the evolution laws of hydrogen diffusion and explosion risks in real HRSs under the influence of complex environments. Therefore, in this work, a full-scale 3D model of a physical HRS in Xichang, Sichuan Province is constructed. The typical seasonal climate and environmental data of the area where the HRS is located are taken as the initial calculation conditions. Combined with the FLACS numerical simulation software, the influence mechanism of different climatic conditions on hydrogen leakage diffusion and gas cloud explosion behavior at typical risk locations within the HRS is obtained. An empirical formula for the hydrogen leakage scale, including environmental and climatic conditions and the structural size conditions of the HRS, is proposed. The influence mechanisms of different leakage locations, leakage directions, and environmental parameters in the four seasons on hydrogen diffusion and explosion behavior are systematically explored, providing strong support and guarantees for the healthy development of the hydrogen energy industry.

2. Mathematical Model

2.1. Numerical Methods

The FLACS v22.2 (Flame Acceleration Simulator), a computational fluid dynamics (CFD) software platform developed by Gexcon AS (Bergen, Norway), has been extensively utilized for predictive modeling and risk assessment of combustible gas diffusion, combustion, and explosion scenarios. Its core algorithm adopts the finite volume method (FVM) combined with the semi-implicit method (SIMPLE algorithm) of the pressure-coupled equations system to solve the conservation equations of mass, momentum, energy, and components, enabling high-fidelity simulations of the gas flow, turbulent mixing, and chemical reaction kinetics processes in complex environments [22]. FLACS uses the Subgrid Model to deal with the turbulence effect, adopts the k − ε turbulence model to close the equations, and introduces the Eddy Dissipation Concept (EDC) to simulate the turbulent combustion process [23]. Its unique “virtual jet” model can accurately capture the under-expanded jet characteristics when high-pressure hydrogen leaks, and effectively predict the distribution range and explosion hazard of combustible cloud masses [24,25,26,27].
FLACS has performed outstandingly in the field of hydrogen energy safety and has been verified to accurately simulate high-pressure hydrogen leakage and diffusion, under-expanded jet characteristics, and explosion overpressure distribution [16,20,21,28,29]. It is particularly suitable for quantitative risk analysis in scenarios such as HRSs and hydrogen storage facilities [30]. However, it is noted that while the k − ε turbulence model in FLACS offers computational efficiency for large-scale engineering simulations, its performance in high-velocity hydrogen jet scenarios requires critical evaluation against high-fidelity methods like large eddy simulation (LES) and direct numerical simulation (DNS). LES/DNS resolves finer turbulent structures and transient features of high-speed jets but incurs significantly higher computational costs. To quantitatively compare these approaches, Table 1 summarizes key differences in accuracy and resource requirements for hydrogen jet simulations, based on the established literature [31].

2.2. Control Equation

The control equations for the numerical simulation of hydrogen leakage and diffusion include the momentum equation, mass equation, energy equation, and species equation. The general form of the control equation can be expressed as follows:
t ρ + x ρ u + y ρ v + z ρ w = x Γ x + y Γ y + z Γ z + S
where ρ is the fluid density in kg/m3; u , v , and w represent the velocity components in the x, y, and z directions, respectively, in m/s; is a general variable; Γ is the generalized diffusion coefficient; and S is the generalized source term.
Due to the relatively high pressure of hydrogen storage, the Reynolds number of the hydrogen leakage is relatively large, so the turbulence model chosen is the standard k ε model. The control equation for turbulent kinetic energy k is as follows:
t ρ k + x i ρ k μ i = x i μ + μ t σ k k x j + G k + G b ρ ε Y M + S k
where μ is the molecular dynamic viscosity, reflecting the internal friction force between fluid molecules, in Pa·s; μ i is the turbulent viscosity in Pa·s; μ t is the turbulent dynamic viscosity, embodying the viscous effect generated by the momentum exchange between fluid microclusters in turbulent motion, in Pa·s; G k and G b represent the turbulent kinetic energy increments generated by the mean velocity gradient and buoyancy forces, respectively; Y M represents the contribution of fluctuating expansion in compressible flow; σ k is the Prandtl number for turbulent kinetic energy; and S k is the source term.
The control equation for the dissipation rate ε is as follows:
t ρ ε + x i ρ ε μ i = x i μ + μ t σ ε ε x j + C 1 ε ε k G k + C 3 ε G b C 2 ε ρ ε 2 k + S ε
where C 1 ε ,   C 2 ε , and C 3 ε are empirical constants in the model, and σ ε is the Prandtl number for the dissipation rate.

2.3. Mass Flow

When the fuel is hydrogen, the injection velocity after expanding to the ambient pressure is typically in the range of 600 m/s. Under standard conditions (such as 0 °C and atmospheric pressure), the speed of sound in hydrogen is approximately 1290 m/s. For a specified mass flow m ˙ (or volume flow V ˙ and density ρ ), the velocity u at the outlet should not be above the speed of sound. The following relations apply for the conditions at the outlet:
m ˙ = ρ V ˙ = ρ u A
p V = n R T = m M R T = m R T
where m ˙ is the mass flow at the leak outlet ( k g / s ); u is the velocity at the leak outlet ( m / s ); A is the area of the leakage outlet ( m 2 ); p   =   p a b m is the outlet environmental pressure (Pa); R is the ideal gas constant (8314.3 J / k g · K ); R =   R /M is the specific gas constant ( J / k g · K ) ; M is the mole weight ( k g / k m o l ), for hydrogen (M = 2.016 k g / k m o l ); and T is the temperature at the outlet (K). The gas density ρ ( k g / m 3 ) at the outlet is
ρ = m V = p R T

2.4. Software Applicability Verification

For the numerical simulation study of hydrogen leakage diffusion, the above simulation model was first applied and compared with the hydrogen leakage diffusion experiments conducted by Pitts et al. [32] to verify the accuracy of the proposed simulation model.
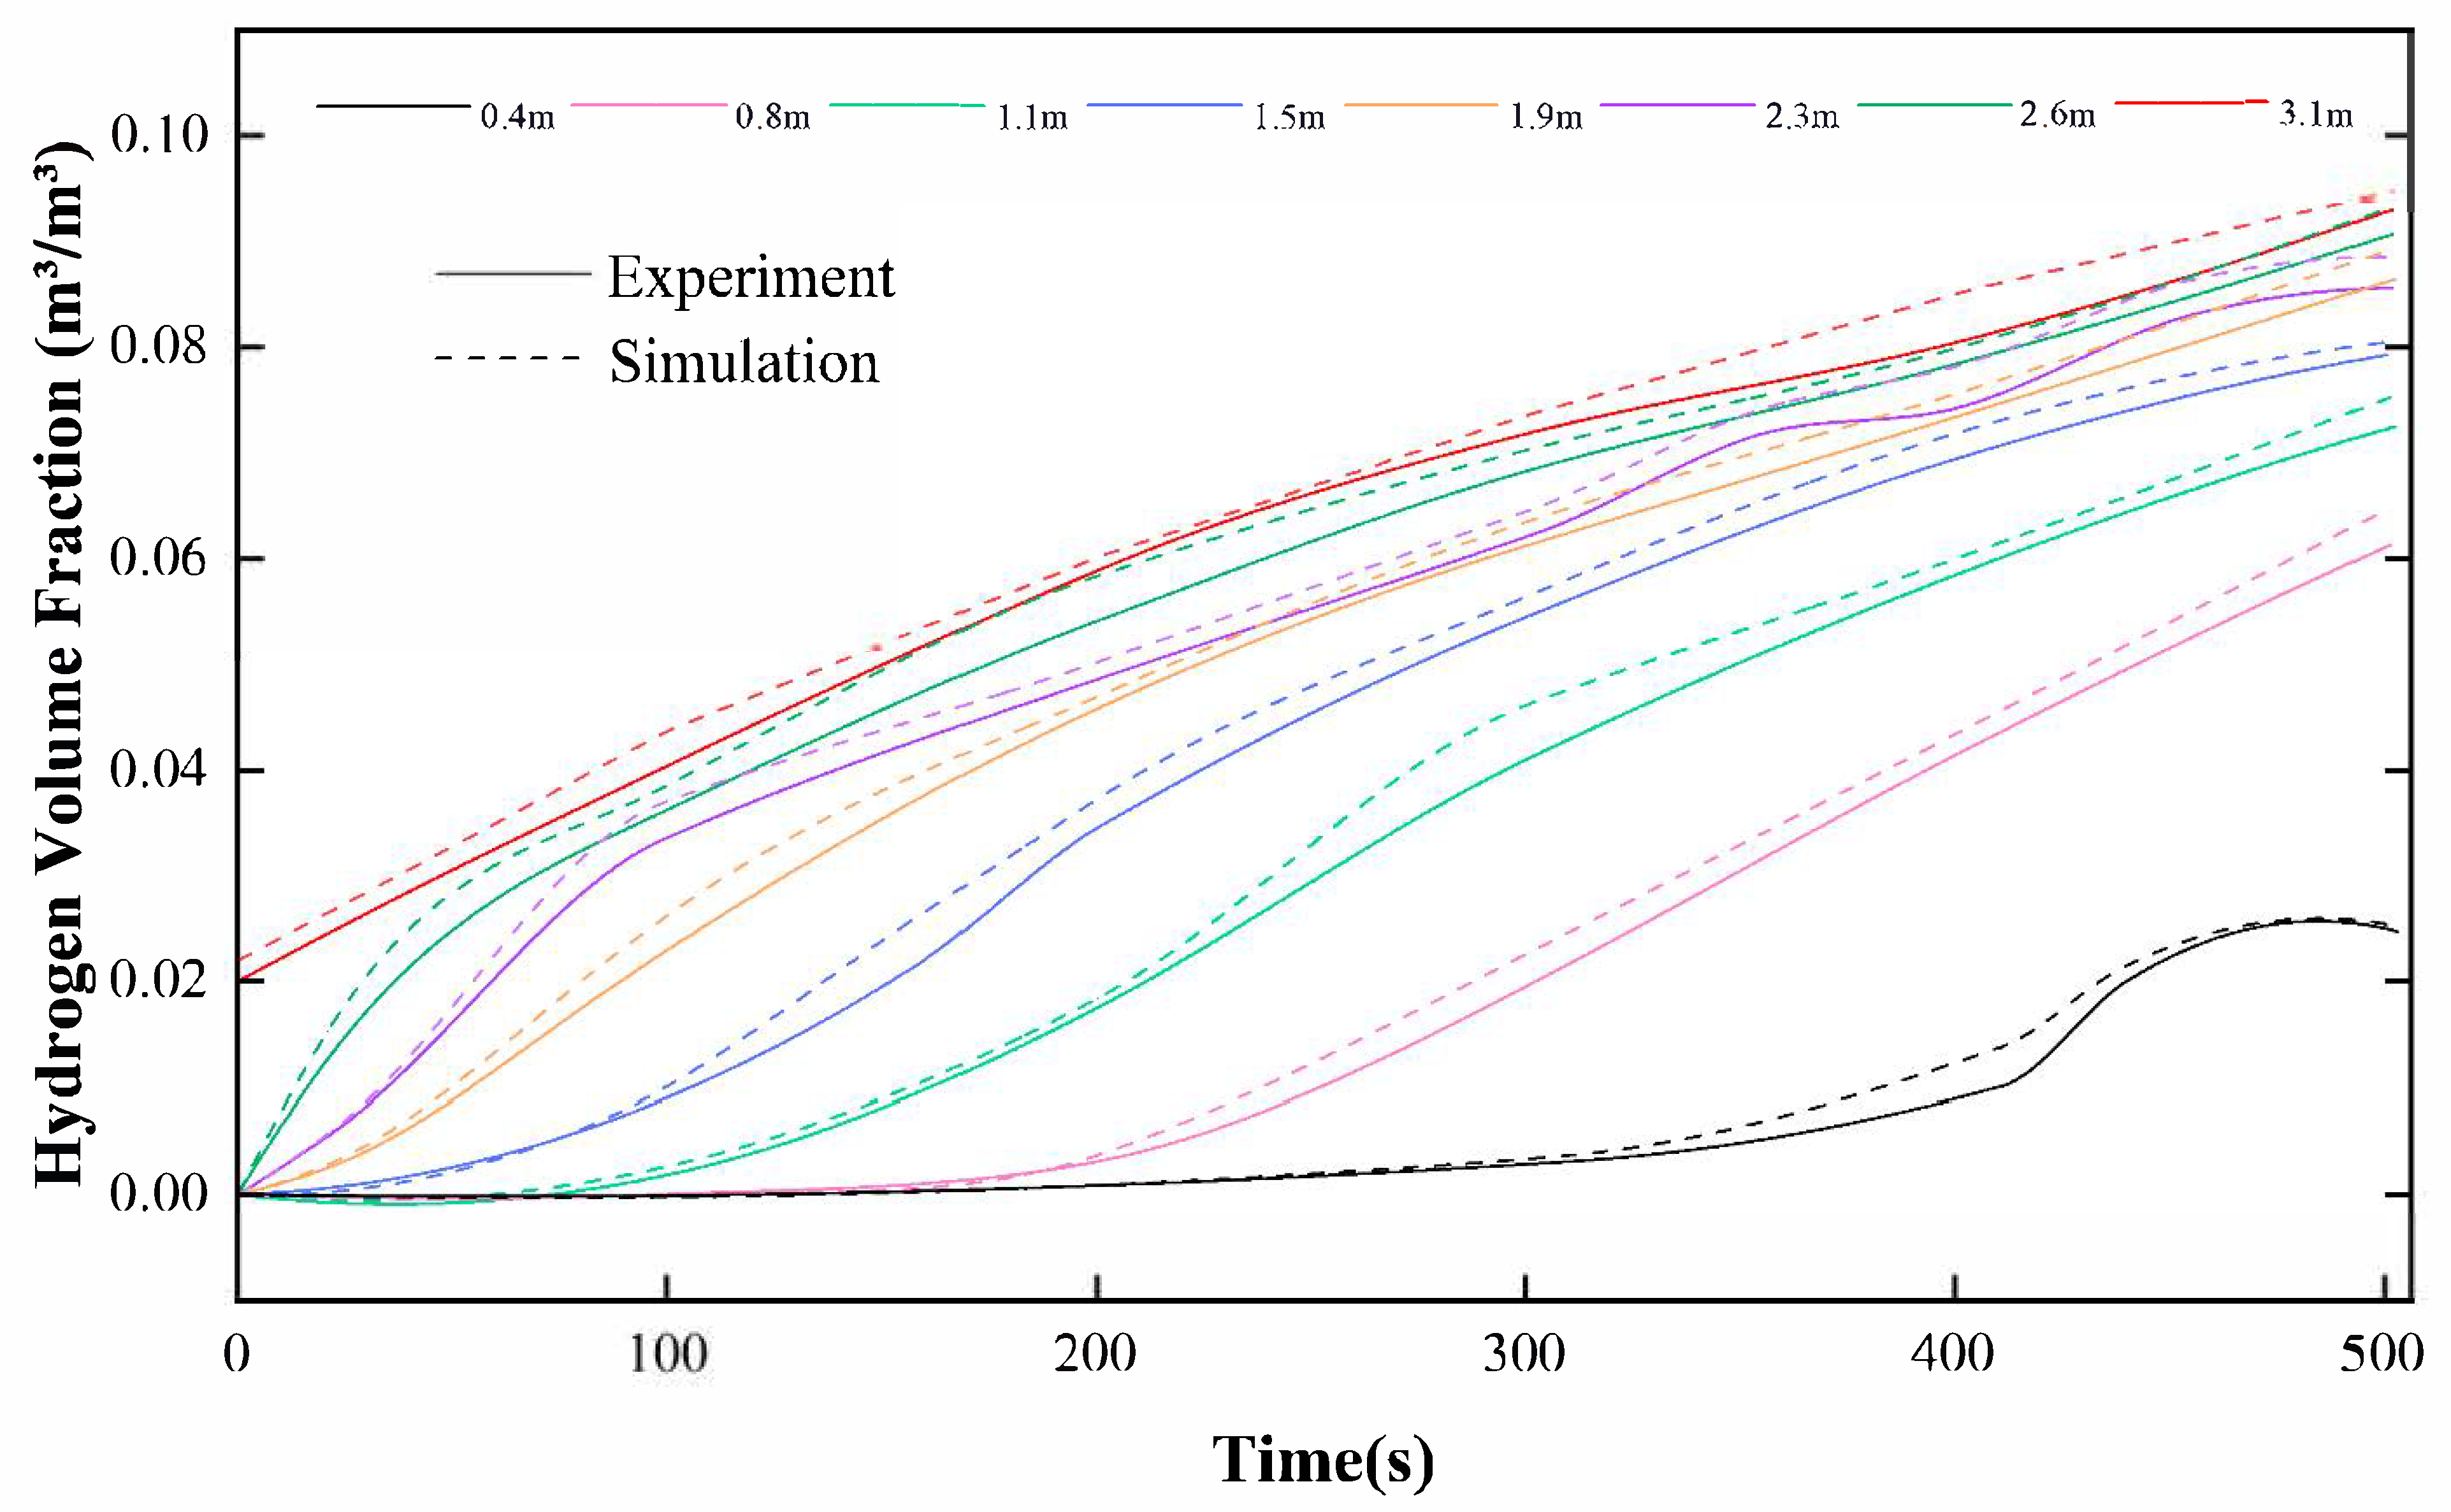
As shown in Figure 1, the hydrogen leakage and diffusion experiment area built by Pitts et al. was a space with both length and width of 6.1 m and a height of 3.05 m. Two 0.2 m × 0.2 m-square ventilation vents were positioned 2.3 m above ground on the right wall. A steel container (15 cm height × 30.5 cm length × 30.5 cm width) served as the hydrogen release source at the floor center, delivering continuous hydrogen discharge at a 956 L/min volumetric flow rate through its top aperture for 506 s. Eight hydrogen concentration sensors were arranged 0.4 m, 0.8 m, 1.1 m, 1.5 m, 1.9 m, 2.3 m, 2.6 m, and 3.1 m directly above the leakage source to continuously monitor the hydrogen concentration variations throughout the experiment.
In this work, the physical model corresponding to the experiment was established using the FLACS software (as shown in Figure 2). Grid division was performed during the simulation to ensure the accuracy of the simulation results. The entire simulation area was divided into 34,632 grid, the grid of the core area was set to 0.05 m to more accurately simulate the diffusion and flow of combustible hydrogen in the core area. All other initial conditions were set to be the same as those in the experiment.
The proposed simulation model was implemented to simulate the above experimental scenario. A comparative analysis of hydrogen volumetric concentrations between the simulated and experimental values is presented in Figure 3. It can be observed that the simulated values are slightly higher than the experimental values, with the relative error being less than 10%. The existing literature indicates that the typical relative error of FLACS simulation results is usually within the range of 5% to 15% [15,28], demonstrating the model’s reliability in characterizing hydrogen leakage scenarios.

3. Research Methodology

3.1. Geometric Model

Xichang City in Sichuan Province, a hydrogen energy demonstration hub in southwestern China, features an HRS with typical subtropical humid climate characteristics, making it an ideal case for studying climate impacts on hydrogen safety. Based on the actual layout of the Xichang HRS, a full-scale 3D numerical model was constructed using the FLACS software. The physical model (Figure 4a) was developed at a 1:1 scale via the FLACS-CASD module and the model spans a rectangular area of 65 m (east–west) × 55 m (north–south). The coordinate system is set with the southwest corner of the site as the origin, the X-axis as the due-east direction, the Y-axis as the due-north direction, and the Z-axis vertically upward as the positive direction. The +Y direction represents the true north direction. The numerical simulation calculation domain is set as the three-dimensional space of −20 to 70 m on the X-axis (east–west direction), −20 to 70 m on the Y-axis (north–south direction), and 0 to 60 m on the Z-axis (vertical direction). Key equipment includes two hydrogen tube trailers, two sets of 45 MPa compressors with matching hydrogen storage tanks, and two hydrogen dispensers. Auxiliary facilities include the station building, canopy, and walls. The top of the station building is the highest point of the entire station, with a height of 9 m.

3.2. Initial Condition Settings

This work focuses on three high-risk leakage positions within the HRS: compressors, hydrogen storage tanks, and hydrogen dispensers. The leak coordinates are (11.05, 7.15, 1.25), (13.25, 22.05, 0.95), and (40.75, 36.5, 1.55), as shown by asterisks in Figure 4a. Multi-scenario simulations were conducted based on seasonal climate characteristics. Sichuan Province exhibits a subtropical humid climate, with prevailing southeast winds in summer and northwest winds in winter. The initial conditions for the numerical simulations integrated local environmental parameters (measured on-site using portable meteorological instruments across different seasons) and regional macroclimate data published by the China Meteorological Administration. A three-dimensional wind speed component ( V x , V y , V z ) was established based on wind direction and speed. For each leakage point (hydrogen storage tank, compressor, hydrogen dispenser), the influence of the different climatic conditions of the four seasons on the hydrogen leakage and diffusion behavior was studied. For each season, the climatic parameters of that season (Table 2) were fixed, and six leakage scenarios with leakage along the ±X, ±Y, and ±Z axes were systematically investigated. The climate parameters are shown in Table 2.
To systematically analyze the dynamic parameter distribution characteristics during hydrogen leakage, diffusion, and explosion within the HRS, 36 monitoring points were set based on the spatial layout of the station. These points were distributed across four parallel planes, with each plane configured in a 3 × 3 grid (Figure 5). The monitoring points covered the vertical space of the tallest building within the station (with a station building height of 9 m). The specific coordinate values were set as shown in Table 3.

3.3. Grid Independence Verification and Division

The FLACS software adopts an independent Cartesian grid, which is not attached to the modeling entity. Mesh partitioning is a critical step in ensuring the precision of numerical simulations. Excessively small grids may lead to prolonged simulation duration and excessive computational resource consumption, while overly large grids can compromise the reliability of simulation results [31]. The grid division in FLACS-CFD adheres to the principle of “refinement in core regions and gradual stretching in peripheral regions”. The core area (proximal to leakage points) employs a uniform and refined grid, while the regions outside the core area adopt a grid-stretching strategy to gradually increase the grid size. This approach ensures the rationality of the simulation while reducing the computational load. To verify the impact of the grid size on the simulation results, five distinct grid configurations were specifically designed (as shown in Table 4). Taking the compressor leaks along the +X direction as the research subject, the simulation assumes leakage initiation at the 10th second, with a duration of 30 s. The same leakage rate was adopted for the five grid sizes.
The hydrogen concentration distribution maps were compared and analyzed on the cross-section of Z = 1.1 m under different grid sizes at 24 s of leakage, as shown in Figure 6. It is found that the concentration distribution graphs of the first four graphs were relatively similar, while the differences between Figure 6d and the other four graphs are more obvious. Based on these observations, it can be preliminarily concluded that a grid size between 0.15 m and 0.4 m is relatively reasonable.
Special attention was given to the hydrogen concentration curves at the monitoring point M37 (13.05, 7.15, 1.25) under different grid sizes, as illustrated in Figure 7. The smaller the core-region grid size, the greater the number of grids, resulting in higher calculation accuracy but higher computational cost. It can be found that as the core-region grid size decreases, the measured hydrogen concentration shows an upward trend. When the grid size is reduced below 0.2 m, the resulting hydrogen concentration no longer shows significant changes. In particular, the concentration values obtained from the 0.15 m and 0.20 m grids are nearly identical, measuring 0.74 m 3 / m 3 and 0.738 m 3 / m 3 , respectively. The 0.15 m grid and 0.2 m grid correspond to numbers of grid of 62,100 and 51,772, respectively. To reduce the number of grids and save computational resources and time, a grid size of 0.20 m was ultimately selected for the core region. In regions outside the core area, a progressive grid-stretching strategy was adopted with a maximum stretching factor of 1.2. The grid size outside the core area gradually increased from 0.2 m to 1.2 m, ensuring a smooth transition of the flow field from the core area to the periphery. The three-dimensional computational domain was discretized using polyhedral meshes. The grid division diagram is shown in Figure 4b. This approach controlled the total grid number to 51,772 while ensuring the simulation accuracy of the jet field, significantly improving the computational efficiency.

3.4. Leakage Diffusion Analysis

Based on the conditions outlined in Table 2, this work investigates the effects of different leakage directions and seasonal climatic variations on hydrogen diffusion at an HRS. The simulations focused on three high-risk pieces of equipment, including the hydrogen dispenser (40.75, 36.5, 1.55), compressor (11.05, 7.15, 1.25), and hydrogen storage tank (13.25, 22.05, 0.95), as shown in Figure 4a. The starting time of the leakage was set as the 10th second to make the external wind field reach a stable state, with leakage lasting for 30 s, and the total simulation time being 60 s. A consistent mass flow rate of 2 kg/s was applied across all three leakage scenarios.

3.4.1. Influence of Leakage Direction

Figure 8, Figure 9, Figure 10 and Figure 11 show the hydrogen cloud maps at 14 s after the leakage; it is at approximately this point that the coverage area of the hydrogen cloud is the largest. It can be seen from Figure 8, Figure 9, Figure 10 and Figure 11e that the hydrogen leakage direction and the distribution of obstacles have a significant impact on safety risks. When hydrogen leaks vertically upward in the +Z direction without any obstruction, the combustible hydrogen gas cloud forms a vertically elongated ellipsoidal shape, exhibiting slight tilting under wind effects. This does not affect any equipment within the station, so the possibility of an explosion is nearly zero.
In Figure 8, with hydrogen leakage along the +X, −X, and −Z directions (Figure 8a,b,f), the hydrogen cloud concentrates around the compressors and hydrogen storage tanks, exhibiting elevated explosion risk if an ignition source is present. When leaking in the −Y direction (Figure 8d), the hydrogen cloud spreads upward along the wall, with a relatively low risk of danger. For +Y direction leakage (Figure 8c), as there are no obstacles blocking it, the hydrogen jet spreads upwards under the influence of wind.
In Figure 9b, when the hydrogen jet encounters a 2.5 m high wall in the station, the cloud undergoes laminar diffusion along the top of the wall, with a smaller danger. The remaining four leakage directions (+X, ±Y, −Z) (Figure 9a,c,d,f) exhibit varying degrees of diffusion and spread, spreading to the compressors, long-tube trailers, and the surrounding area of the station building. Particularly in the case of vertical downward leakage in the −Z direction (Figure 9f), the hydrogen gas concentrates near the ground and forms a radial diffusion cloud, resulting in a large-area combustible hydrogen cloud, with an extremely high explosion risk.
It can be seen from Figure 10a–c,f that when a hydrogen dispenser leaks, the combustible hydrogen gas cloud mainly concentrates in the upper or external areas of the station, with minimal impact on the equipment and personnel in the station. When leaking in the +Z direction (Figure 10e), the hydrogen gas disperses in all directions upward due to the shelter of the dispenser canopy. When leakage occurs in the −Y direction (Figure 10d), the hydrogen cloud concentrates around the station building and spreads toward the long-tube trailers and hydrogen storage tanks, creating a significant risk. Enhanced ventilation measures should be implemented in this scenario.
In Figure 11, when hydrogen leaks along the −X and −Y directions (Figure 11b,d), the hydrogen cloud tends to gather in the upper area, with a lower possibility of danger. Leakage in the +Y direction (Figure 11c) may pose a fire hazard if personnel are using open flames. When hydrogen leaks in the +X direction (Figure 11a), the hydrogen cloud spreads toward the vicinity of the station building, potentially resulting in harm to personnel. Leakage in the −Z direction (Figure 11f) leads to the hydrogen cloud covering the compressors, hydrogen storage tanks, and long-tube trailers, which poses a significant risk.
A comparative analysis of the above four figures reveals that, in contrast to leakage scenarios of the compressor and hydrogen storage tank, leakage from the hydrogen dispensers does not significantly diffuse to other critical equipment within the station, presenting a lower risk. It is recommended to install multiple concentration sensors around the compressor and hydrogen storage tank. In addition, downward-directed leaks from the storage tank will generate ground-hugging hydrogen clouds, which significantly expand the hazardous zone. The installation of ground ventilation slots near the storage tank is proposed to accelerate the diffusion of ground-hugging hydrogen gas.

3.4.2. Influence of Seasonal Climate

Figure 12 illustrates the hydrogen diffusion cloud maps under different seasonal conditions for the compressor leaking along the +X direction. The numerical simulation results reveal that the hydrogen cloud predominantly concentrates in the vicinity of the compressors, hydrogen storage tanks, and their overhead regions, with no diffusion toward the station building or hydrogen dispenser areas. The seasonal wind field characteristics exert significant influences on hydrogen diffusion behavior: when the southeast/south wind prevails in spring and summer, the wind effect prompts the hydrogen cloud to migrate outside the station. Although this reduces the risk inside the station, it leads to the accumulation of hydrogen around the hydrogen storage tank and an increase in the concentration of flammable gas. Under autumn and winter conditions, dominated by north/northwest winds, hydrogen concentrations intensify near the compressor while diminishing around the storage tank.
Figure 13 shows the hydrogen diffusion cloud maps of the hydrogen storage tank leaking along the −Z direction under different seasonal conditions. The results indicate that during spring (southeast wind) and summer (south wind), hydrogen clouds predominantly cluster near the compressor, storage tank, and long-tube trailer, with a heightened hazard. In contrast, autumn (north wind) and winter (northwest wind) conditions eliminate diffusion toward the long-tube trailer but exacerbate the hydrogen concentrations near the compressor.
Figure 14 demonstrates the diffusion situation for hydrogen dispenser leaks along the −Y direction. Under the influence of the southeast wind in spring and the south wind in summer, the hydrogen cloud mass that could have gathered near the station building is blown outside the station, reducing the possibility of risk occurrence. However, during autumn and winter, the hydrogen cloud is concentrated near the station building and further diffuses toward the long-tube trailer and storage tank, amplifying the hazard possibility.
Figure 12, Figure 13 and Figure 14 demonstrate that southeast and south winds during spring and summer promote outward hydrogen cloud migration, reducing the risk to equipment within the station but inducing localized accumulation near storage tanks. Ventilation measures around the hydrogen storage tanks should be strengthened. Autumn/winter northerly/northwesterly winds intensify hydrogen concentrations near the compressor and station building, necessitating prioritized optimization of equipment spacing and enhancing the ventilation in the compressor and station building areas. This work confirms that the coupling effect between the wind field and the equipment layout significantly affects the three-dimensional distribution characteristics of leaked hydrogen.

3.5. Empirical Formula

To quantify the influence mechanism of environmental parameters and leakage directions on the distribution of the hydrogen concentration, this work analyzes the hydrogen leakage diffusion laws at three typical risk locations within the HRS: hydrogen storage tanks, compressors, and hydrogen dispensers. For each leakage location, combined with the seasonal environmental parameters (wind speed components, V x , V y , V z ; average temperature, T) shown in Table 2 and six leakage directions (±X/Y/Z axis directions), a total of 72 leakage scenarios (3 leakage locations ×4 seasons ×6 directions) were constructed. For each leakage scenario, the hydrogen volume concentration at 36 spatial monitoring points was recorded at times t = 15 s, 25 s, 35 s, and 45 s. On this basis, we propose an empirical formula for the hydrogen leakage concentration that incorporates environmental climate conditions and the structural dimensions of the HRS, which takes the form of a nonlinear multivariate function, as shown in Formula (7). This is based on the FLACS simulation data of 72 leakage scenarios, with environmental climate, HRS structural dimensions, and leakage parameters as independent variables and the hydrogen concentration value as the dependent variable. The parameters in the empirical formula are solved using the least-squares curve fitting (lsqcurvefit) optimization method.
C = A · x L a · y W b · z H c · V x + α D x v v d + V y + α D y v v e + V z + α D z v v f · T T 0 g · t t 0 h + B , 0 x L , y W , z H 1
where C represents the hydrogen concentration ( m 3 / m 3 ), while A and B denote empirical coefficients. The spatial coordinates (x, y, z) correspond to positions within the HRS; W, L, and H represent the width (55 m), length (65 m), and height (10 m) of the HRS. The velocity term V x + α D x v v d + V y + α D y v v e + V z + α D z v v f combines the effects of the leakage direction and environmental wind, where V x ,   V y ,   V z represents the environmental wind velocity components, α is the weighting coefficient for the leakage direction, D x ,   D y ,   D z is the leakage direction, and v is the leakage velocity. Notably, the vertical wind component is neglected for ground-level atmospheric conditions; thus, V z = 0. T represents the temperature (K), and t is time (s). The ambient temperature T 0 = 293.15 K and the leakage duration t 0 = 60 s.
The parameters of the empirical Formula (7) for the hydrogen storage tanks, compressor, and hydrogen dispenser are listed in Table 5. The goodnesses of fit (R2) is all higher than 0.85, and all coefficients pass the significance test (p < 0.01), indicating that the fitting results are statistically significant.
Figure 15 compares the FLACS simulation values and empirical formula prediction values of hydrogen concentration under three leakage positions. The horizontal axis in the figure represents the hydrogen volume concentration obtained from the software simulation (m3/m3), and the vertical axis represents the fitting values calculated by the empirical formula (m3/m3), with ±20% error control lines added. It can be clearly observed from the figure that all data points are distributed within the ±20% error range, indicating that the fitting results of the empirical formula are in good agreement with the numerical simulation results. This verifies the applicability and reliability of the proposed formula for this HRS under different leakage scenarios.
The empirical formulas integrate seasonal climatic parameters with leakage direction variables, thereby constructing a multi-dimensional analytical framework that incorporates meteorological conditions, leakage locations, and spatial concentration predictions, which provides data support for comprehensive risk assessment of hydrogen leakage and diffusion processes. This formula can be used to predict the hydrogen concentration distribution under different seasons and leakage directions in similar HRSs (with the same equipment layout and environmental conditions), providing a reference for the risk assessment of HRSs. Although the direct application of this formula is limited to similar HRSs, the methodology established in this work—combining multi-scenario simulations of environmental conditions, leakage conditions, and equipment layout with data fitting to derive an empirical formula for hydrogen concentration distribution—possesses universal applicability. This framework can be extended to risk assessment research for other HRSs. Researchers can refer to this methodological framework to construct site-specific empirical models tailored to the layout and climate characteristics of their target stations, thereby supporting safety design and risk mitigation strategies.

4. Simulation Results and Analysis of Hydrogen Explosion

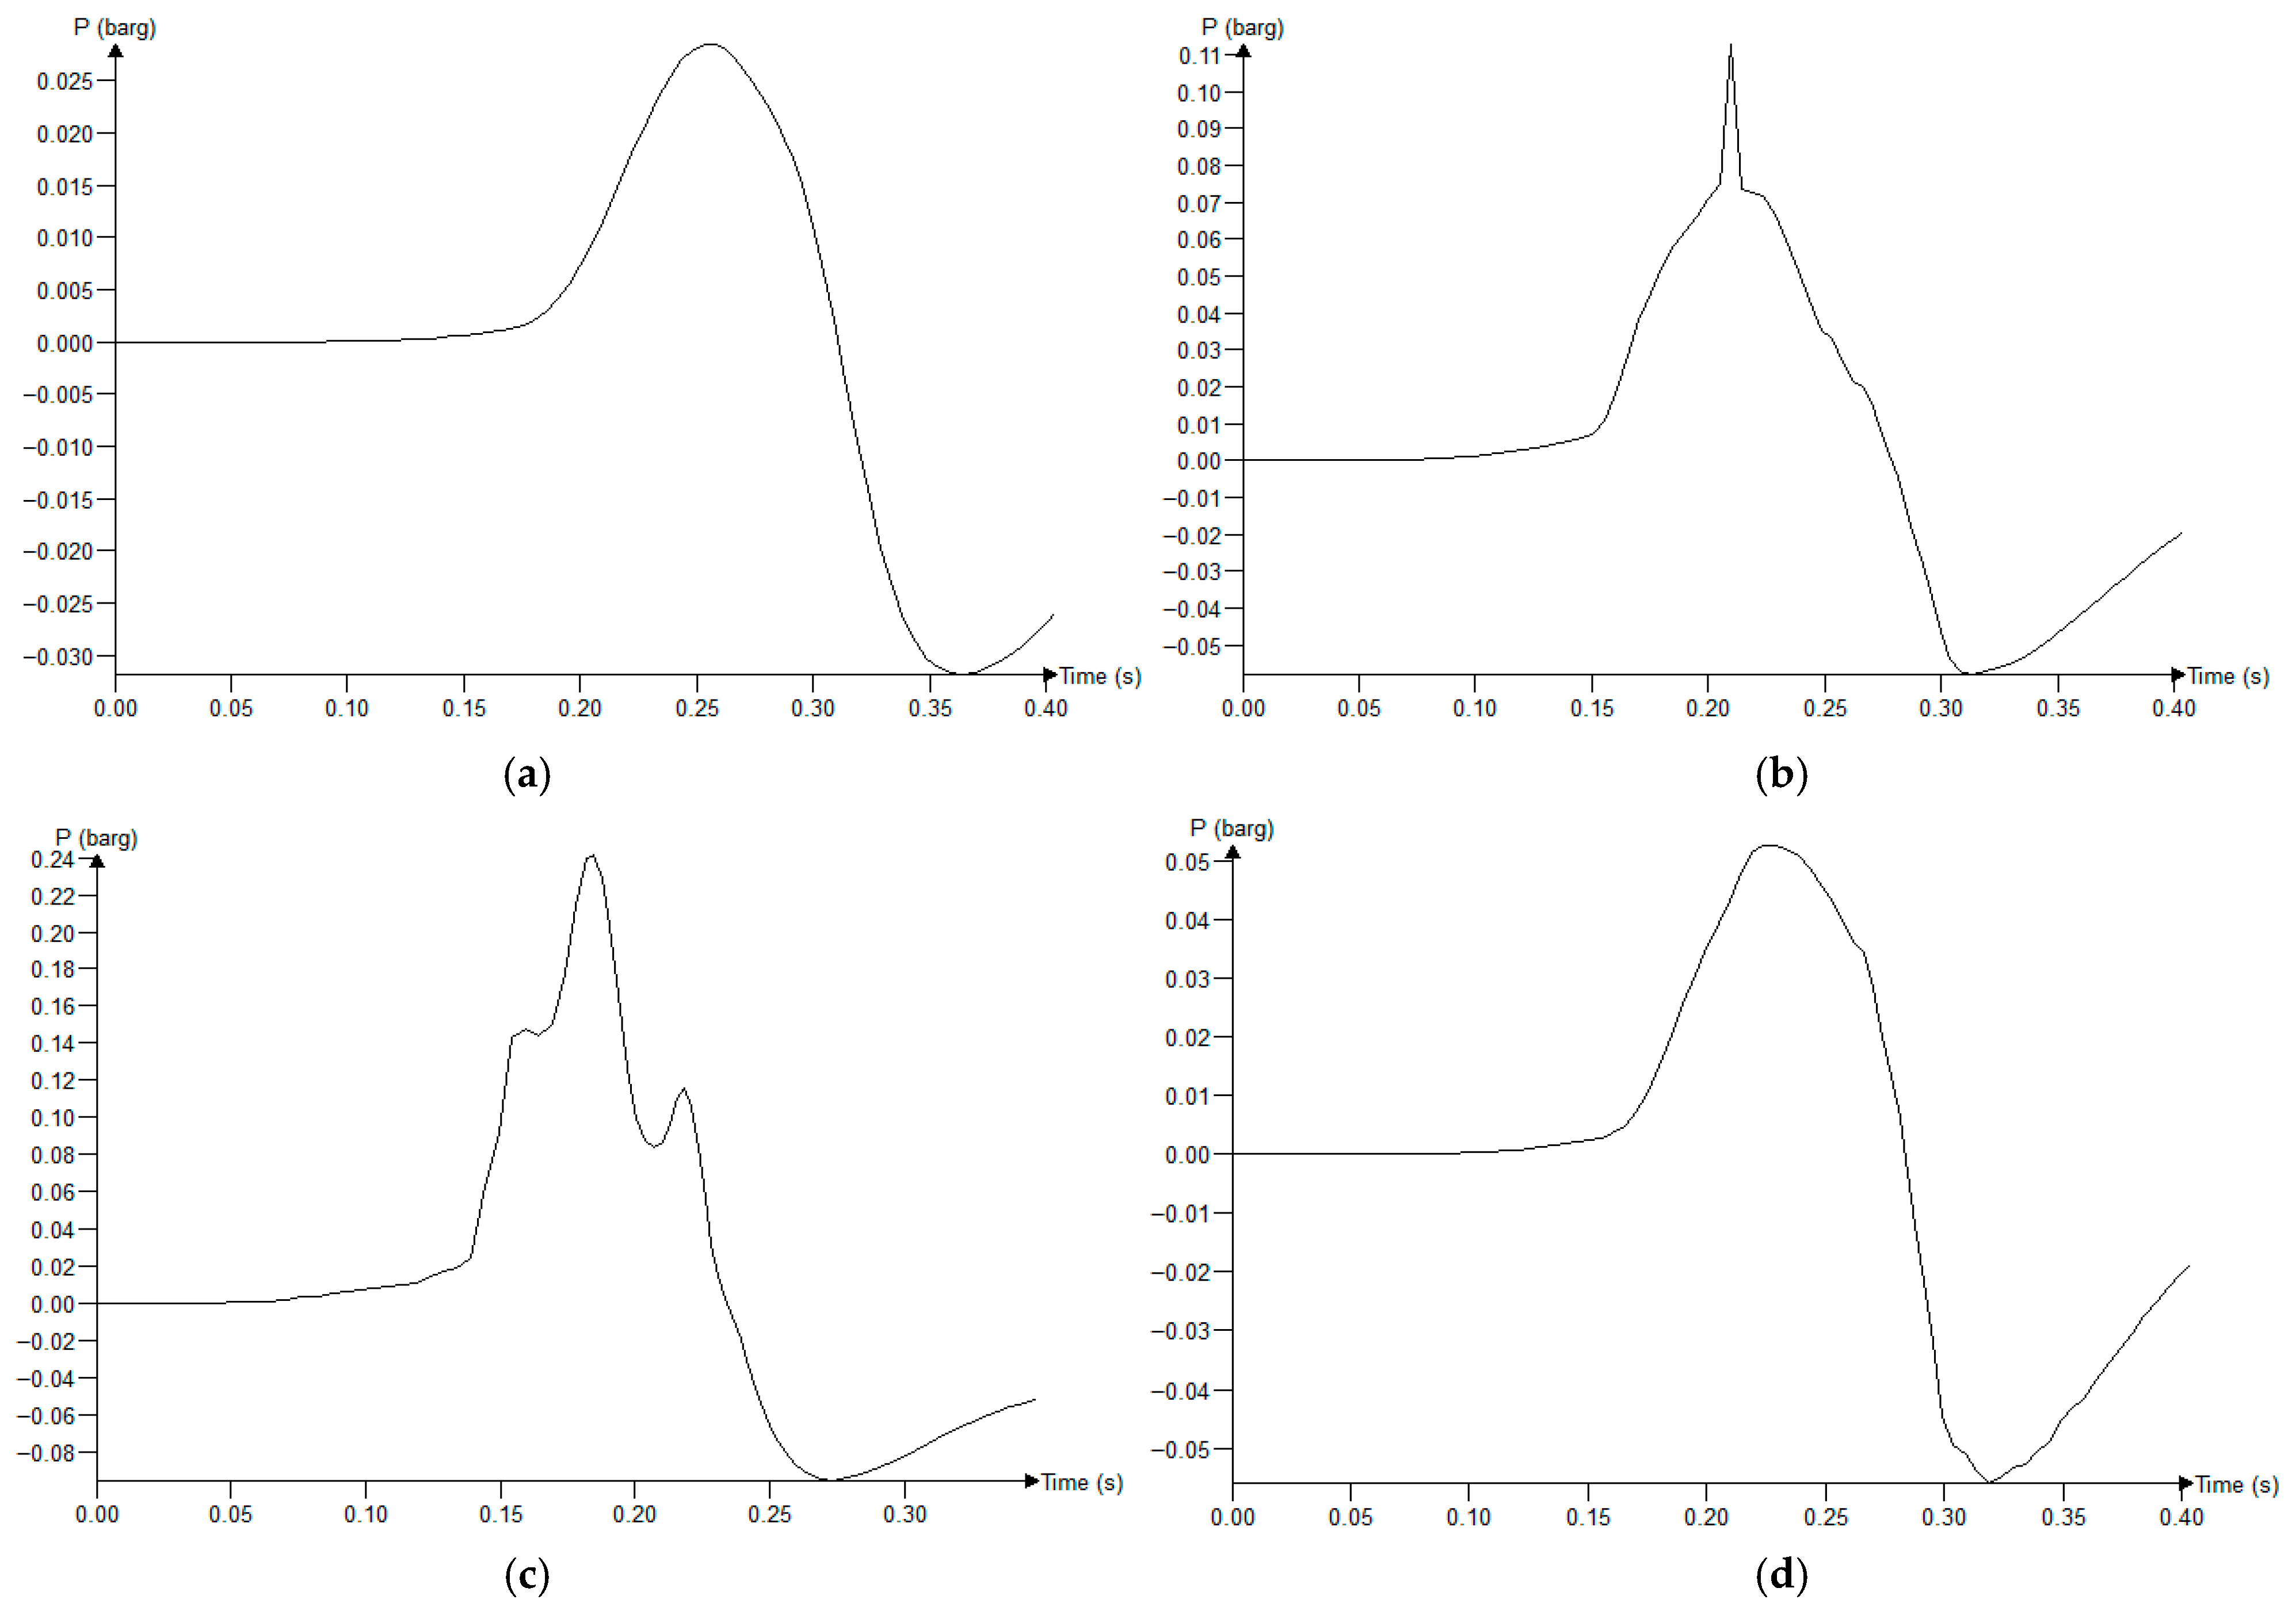
In the study in the previous section, by comparing the influences of different leakage directions and seasonal characteristics on hydrogen leakage, it was found that when leakage occurs from the hydrogen storage tank in the −Z direction in summer, the hazardous area is significantly larger compared to other leakage situations due to the ground-hugging diffusion characteristics of the hydrogen cloud, requiring prevention and control. Furthermore, the hydrogen storage tank is located in a relatively congested area, and when leakage occurs, hydrogen spreads to many buildings and equipment within the station. Therefore, this work selected the scenario of leakage from the storage tank in the −Z direction during summer for hydrogen explosion simulation. In this leakage scenario, tests were conducted to measure the pressure changes over time after ignition under hydrogen concentrations of 10%, 35%, 55%, and 70%, respectively, as shown in Figure 16. A hydrogen concentration of 10% corresponds to a lean combustion state, while 70% corresponds to a rich combustion state (the flammable range of hydrogen is 4–75%). The results indicate that the pressure generated by the explosion is relatively higher when the concentration is 55%. Therefore, we decided to ignite the flammable hydrogen cloud at 18 s after the leakage occurs (i.e., at 28 s of the total duration). The coordinates of the ignition source are (13.25, 22.05, 0.95), where the hydrogen concentration is 55%.
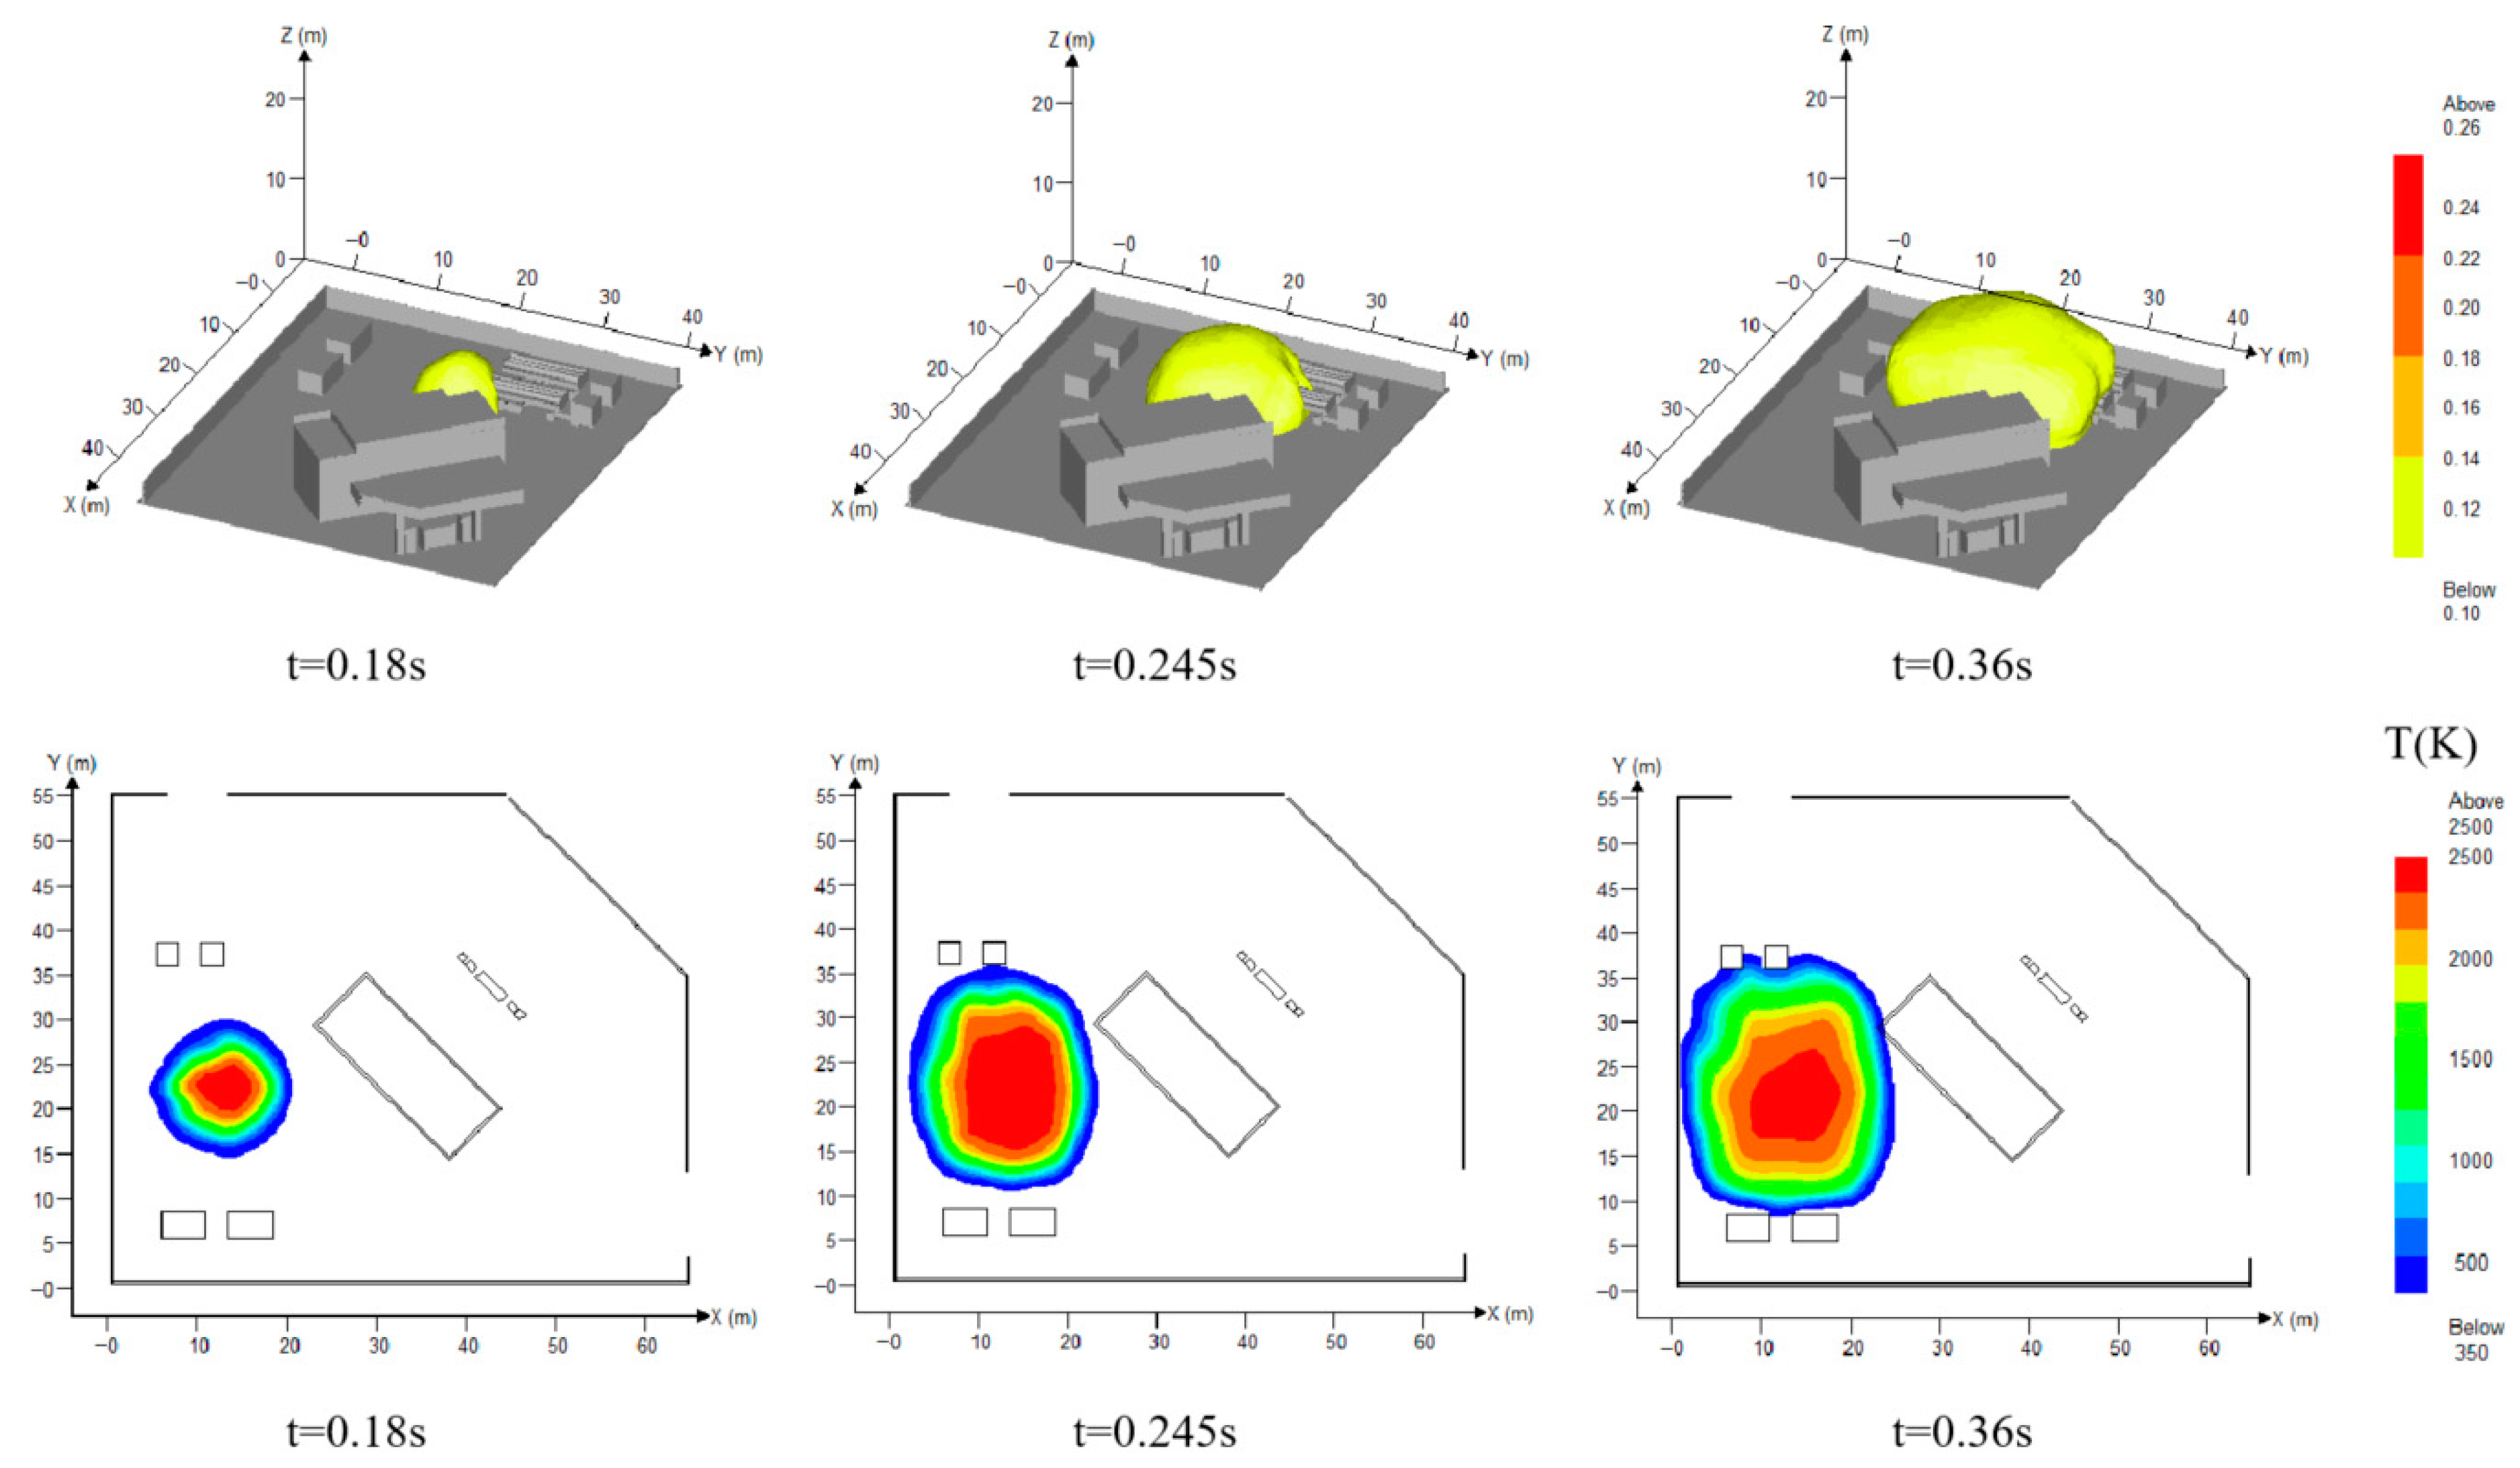
Figure 17 and Figure 18, respectively, show the explosion pressure and the distributions of flame and temperature after ignition. Considering the maximum possible harm to the human body, the pressure and temperature at Z = 2 m are taken for analysis. From Figure 17, it can be observed that the pressure wave is generated at t = 0.15 s and then rapidly expands in all directions. At t = 0.195 s, the pressure wave reaches the office building, and a large area of the maximum pressure wave is observed near the hydrogen storage tank and long-tube trailers. At t = 0.22 s, the pressure-wave center shifts to the long-tube trailers, and the shock wave begins to affect the hydrogen dispensers. At t = 0.24 s, the pressure wave starts to weaken from the explosion center. By t = 0.36 s, the overpressure within the station has completely dissipated. The maximum pressure is approximately 0.25 barg (gauge pressure, i.e., the pressure is higher than atmospheric pressure), located near the explosion point. In the office area, the maximum pressure is 0.07 barg. Glasstone et al. [33] classify overpressure effects into six hazard levels. According to the overpressure criteria, the explosion zone can cause minor-to-moderate injuries to individuals, while the office area may experience complete glass breakage, resulting in potential harm to personnel. From Figure 18, it is evident that after the explosion occurs, the flame rapidly spreads outward from the explosion center (at about 150~200 m/s). For approximately 0.36 s, the long-tube trailer body and the hydrogen storage tank are fully surrounded by the flames. The temperature in the explosion zone ranges from 350 K to 2500 K, which is sufficient to cause harm to both humans and equipment.
It is particularly important to note that when high-pressure hydrogen (>13 MPa) leaks downward (in the −Z direction), obstacles may cause jet auto-ignition and lead to explosions, which further exacerbates the risk [34]. Based on the above analysis, we recommend installing ground ventilation slots near the storage tanks to accelerate the diffusion of ground-hugging hydrogen gas and installing fast-response explosion suppression systems (such as high-pressure water mist or inert-gas injection devices) in high-risk areas such as the hydrogen storage tanks and long-tube trailers, which can suppress flame propagation in the early stages of an explosion. Notably, ventilation slots offer lower operational costs and are prioritized for routine leak management, while explosion suppression systems, despite higher upfront costs, are critical for mitigating catastrophic failures in high-risk zones.

5. Analysis and Discussion

This work focuses on the risk analysis of hydrogen leakage, diffusion, and explosion in a Xichang refueling station under varying climatic conditions. By establishing a full-scale model based on typical climatic characteristics of Sichuan Province and conducting FLACS simulations, the seasonal wind fields and leakage orientations affecting hydrogen cloud dispersion and explosion mechanisms were systematically investigated. The key findings are summarized as follows:
  • Under the leakage scenarios analyzed in this work (considering specific leakage rates, directions, and environmental conditions), it can be seen that, in comparison with leakage from compressors and hydrogen storage tanks, leakage from dispensers poses lower risks to station equipment. However, the coupling between leakage direction and wind fields may still cause risks in station building areas. It is recommended to deploy multiple concentration sensors around compressors and storage tanks.
  • Southeast/south winds during spring and summer promote outward migration of hydrogen clouds, reducing on-site risks, but may cause localized accumulation near storage tanks. Conversely, north/northwest winds in autumn and winter significantly increase hydrogen concentrations near compressors and station buildings. Special attention should be paid to strengthening ventilation measures.
  • Downward (−Z direction) leaks from storage tanks generate ground-hugging clouds with the largest diffusion range. If an ignition source is encountered, such scenarios exhibit explosion overpressure peaks of 0.25 barg and flame temperatures exceeding 2500 K, requiring priority prevention and control. We recommend installing ground ventilation slots near the storage tanks to accelerate the diffusion of ground-hugging hydrogen gas, and adding rapid-response explosion suppression systems.
  • An empirical formula integrating climatic parameters and leakage directions was proposed to address the insufficient generalizability of traditional models. This formula can be used to predict the hydrogen concentration distribution under different seasons and leakage directions in similar HRSs (with the same equipment layout and environmental conditions), providing a reference for the risk assessment of HRSs. In addition, this method can also be applied to other HRSs. In the actual construction of HRSs, it is suggested to optimize ground ventilation facilities, dynamically adjust the sensor layout based on the empirical formula and seasonal wind field characteristics, and optimize equipment spacing to enhance risk prevention and control capabilities.
  • Although small-scale experiments (such as wind tunnel tests) can provide valuable supplementary verification, conducting full-scale, multi-season, and multi-parameter coupled experiments has significant limitations in terms of cost and safety. This study ensured the reliability of the research results through three means: strict verification of grid independence, systematic multi-scenario coupling analysis covering 72 working conditions, and construction of empirical formulas (prediction error < 20%).
  • However, this work focused on single-leakage scenarios; future studies should extend dynamic analysis to multi-leakage scenarios and complex meteorological conditions. In addition, the impact of long-term hydrogen exposure on leakage rate and explosion severity has not been studied either. Future studies can further introduce a leakage rate correction coefficient after long-term hydrogen exposure of materials (such as obtaining the variation law of the leakage aperture under different exposure durations through fatigue experiments), and analyze the impact of leakage rate changes on explosion overpressure and flame temperature in combination with explosion dynamics models, so as to more comprehensively evaluate the long-term operation risks of hydrogen refueling stations.

Author Contributions

Conceptualization, Y.L., Y.Z. and G.Z.; investigation, H.H.; methodology, Y.S.; software, B.D.; supervision, Y.S.; writing—original draft, H.H.; writing—review and editing, H.H. All authors have read and agreed to the published version of the manuscript.

Funding

This research was funded by the Open Research Project of the Technology Innovation Center of Hydrogen Storage-Transportationand Fueling Equipments for State Market Regulation (Grant No. TICHE2023002).

Data Availability Statement

Data is contained within the article.

Conflicts of Interest

The authors declare no conflicts of interest.

References

  1. Eroi, T. Wind Power and Solar Photovoltaics Found to Have Higher Energy Returns than Fossil Fuels. Nat. Energy 2024, 9, 775–776. [Google Scholar] [CrossRef]
  2. Gielen, D.; Boshell, F.; Saygin, D.; Bazilian, M.D.; Wagner, N.; Gorini, R. The Role of Renewable Energy in the Global Energy Transformation. Energy Strategy Rev. 2019, 24, 38–50. [Google Scholar] [CrossRef]
  3. Behboodi, S.; Chassin, D.P.; Crawford, C.; Djilali, N. Renewable Resources Portfolio Optimization in the Presence of Demand Response. Appl. Energy 2016, 162, 139–148. [Google Scholar] [CrossRef]
  4. Li, X.; Ye, T.; Meng, X.; He, D.; Li, L.; Song, K.; Jiang, J.; Sun, C. Advances in the Application of Sulfonated Poly(Ether Ether Ketone) (SPEEK) and Its Organic Composite Membranes for Proton Exchange Membrane Fuel Cells (PEMFCs). Polymers 2024, 16, 2840. [Google Scholar] [CrossRef] [PubMed]
  5. Song, Y.; Ji, K.; Duan, H.; Shao, M. Hydrogen Production Coupled with Water and Organic Oxidation Based on Layered Double Hydroxides. Exploration 2021, 1, 20210050. [Google Scholar] [CrossRef] [PubMed]
  6. International Energy Agency. Global Hydrogen Review 2023; OECD: Paris, France, 2023. [Google Scholar] [CrossRef]
  7. Shu, K.; Guan, B.; Zhuang, Z.; Chen, J.; Zhu, L.; Ma, Z.; Hu, X.; Zhu, C.; Zhao, S.; Dang, H.; et al. Reshaping the Energy Landscape: Explorations and Strategic Perspectives on Hydrogen Energy Preparation, Efficient Storage, Safe Transportation and Wide Applications. Int. J. Hydrogen Energy 2025, 97, 160–213. [Google Scholar] [CrossRef]
  8. Boettcher, S.W. Introduction to Green Hydrogen. Chem. Rev. 2024, 124, 13095–13098. [Google Scholar] [CrossRef]
  9. Hu, Q.; Zhang, X.; Hao, H. A Review of Hydrogen-Air Cloud Explosions: The Fundamentals, Overpressure Prediction Methods, and Influencing Factors. Int. J. Hydrogen Energy 2022, 48, 13705–13730. [Google Scholar] [CrossRef]
  10. Genovese, M.; Blekhman, D.; Dray, M.; Fragiacomo, P. Hydrogen Losses in Fueling Station Operation. J. Clean. Prod. 2020, 248, 119266. [Google Scholar] [CrossRef]
  11. Genovese, M.; Fragiacomo, P. Hydrogen Refueling Station: Overview of the Technological Status and Research Enhancement. J. Energy Storage 2023, 61, 106758. [Google Scholar] [CrossRef]
  12. Tanaka, T.; Azuma, T.; Evans, J.A.; Cronin, P.M.; Johnson, D.M.; Cleaver, R.P. Experimental Study on Hydrogen Explosions in a Full-Scale Hydrogen Filling Station Model. Int. J. Hydrogen Energy 2007, 32, 2162–2170. [Google Scholar] [CrossRef]
  13. Shirvill, L.C.; Roberts, T.A.; Royle, M.; Willoughby, D.B.; Gautier, T. Safety Studies on High-Pressure Hydrogen Vehicle Refuelling Stations: Releases into a Simulated High-Pressure Dispensing Area. Int. J. Hydrogen Energy 2012, 37, 6949–6964. [Google Scholar] [CrossRef]
  14. De Stefano, M.; Rocourt, X.; Sochet, I.; Daudey, N. Hydrogen Dispersion in a Closed Environment. Int. J. Hydrogen Energy 2019, 44, 9031–9040. [Google Scholar] [CrossRef]
  15. Niu, Y.; Ma, Z.; Jiang, B.; Li, P.; Zuo, J.; Kou, Y.; Liang, G. Experimental Study on High-Pressure Hydrogen Leakage and Diffusion in Full-Scale Hydrogen Refueling Stations. Int. J. Hydrogen Energy 2025, 135, 351–360. [Google Scholar] [CrossRef]
  16. Kim, E.; Park, J.; Cho, J.H.; Moon, I. Simulation of Hydrogen Leak and Explosion for the Safety Design of Hydrogen Fueling Station in Korea. Int. J. Hydrogen Energy 2013, 38, 1737–1743. [Google Scholar] [CrossRef]
  17. Tsunemi, K.; Yoshida, K.; Yoshida, M.; Kato, E.; Kawamoto, A.; Kihara, T.; Saburi, T. Estimation of Consequence and Damage Caused by an Organic Hydride Hydrogen Refueling Station. Int. J. Hydrogen Energy 2017, 42, 26175–26182. [Google Scholar] [CrossRef]
  18. Wang, Y.; Zhao, L.; Lv, X.; He, T. Numerical Simulation and Risk Mitigation Strategies for Hydrogen Leakage at Vehicle Hydrogenation Stations. Int. J. Hydrogen Energy 2025, 111, 735–750. [Google Scholar] [CrossRef]
  19. Liang, Y.; Pan, X.; Zhang, C.; Xie, B.; Liu, S. The Simulation and Analysis of Leakage and Explosion at a Renewable Hydrogen Refuelling Station. Int. J. Hydrogen Energy 2019, 44, 22608–22619. [Google Scholar] [CrossRef]
  20. Yang, Z.; Chen, Z.; Han, X.; Chen, G.; Wang, X. Numerical and Experimental Studies on the Evolution Characteristics of High-Pressure Hydrogen Leakage and Explosion Accidents in Hydrogen Refueling Stations. Int. J. Hydrogen Energy 2025, 142, 580–595. [Google Scholar] [CrossRef]
  21. Liu, K.; He, C.; Yu, Y.; Guo, C.; Lin, S.; Jiang, J. A Study of Hydrogen Leak and Explosion in Different Regions of a Hydrogen Refueling Station. Int. J. Hydrogen Energy 2023, 48, 14112–14126. [Google Scholar] [CrossRef]
  22. Lucas, M.; Atanga, G.; Hisken, H.; Mauri, L.; Skjold, T. Simulating Vented Hydrogen Deflagrations: Improved Modelling in the CFD Tool FLACS-Hydrogen. Int. J. Hydrogen Energy 2021, 46, 12464–12473. [Google Scholar] [CrossRef]
  23. Moen, A.; Mauri, L.; Narasimhamurthy, V.D. Comparison of K-ε Models in Gaseous Release and Dispersion Simulations Using the CFD Code FLACS. Process Saf. Environ. Prot. 2019, 130, 306–316. [Google Scholar] [CrossRef]
  24. Hall, J.E.; Hooker, P.; O’Sullivan, L.; Angers, B.; Hourri, A.; Bernard, P. Flammability Profiles Associated with High-Pressure Hydrogen Jets Released in Close Proximity to Surfaces. Int. J. Hydrogen Energy 2017, 42, 7413–7421. [Google Scholar] [CrossRef]
  25. Edelia, E.M.; Winkler, R.; Sengupta, D.; El-Halwagi, M.M.; Mannan, M.S. A Computational Fluid Dynamics Evaluation of Unconfined Hydrogen Explosions in High Pressure Applications. Int. J. Hydrogen Energy 2018, 43, 16411–16420. [Google Scholar] [CrossRef]
  26. Bénard, P.; Hourri, A.; Angers, B.; Tchouvelev, A. Adjacent Surface Effect on the Flammable Cloud of Hydrogen and Methane Jets: Numerical Investigation and Engineering Correlations. Int. J. Hydrogen Energy 2016, 41, 18654–18662. [Google Scholar] [CrossRef]
  27. Hu, J.; Christopher, D.M.; Li, X. Simplified Partitioning Model to Simulate High Pressure Under-Expanded Jet Flows Impinging Vertical Obstacles. Int. J. Hydrogen Energy 2018, 43, 13649–13658. [Google Scholar] [CrossRef]
  28. Middha, P.; Hansen, O.R.; Grune, J.; Kotchourko, A. CFD Calculations of Gas Leak Dispersion and Subsequent Gas Explosions: Validation against Ignited Impinging Hydrogen Jet Experiments. J. Hazard. Mater. 2010, 179, 84–94. [Google Scholar] [CrossRef]
  29. Holborn, P.G.; Benson, C.M.; Ingram, J.M. Modelling Hazardous Distances for Large-Scale Liquid Hydrogen Pool Releases. Int. J. Hydrogen Energy 2020, 45, 23851–23871. [Google Scholar] [CrossRef]
  30. Juwari, J.; Wicaksono, A.D.M.; Arbianzah, T.; Anugraha, R.P.; Handogo, R. Simulation of Dispersion and Explosion in Petrol Station Using 3D Computational Fluid Dynamics FLACS Software. J. Adv. Res. Fluid Mech. Therm. Sci. 2023, 2, 113–135. [Google Scholar] [CrossRef]
  31. Gexcon AS. FLACS-CFD V22.2 User’s Manual. 2023; pp. 82–88. [Google Scholar]
  32. Pitts, W.M.; Yang, J.C.; Blais, M.; Joyce, A. Dispersion and Burning Behavior of Hydrogen Released in a Full-Scale Residential Garage in the Presence and Absence of Conventional Automobiles. Int. J. Hydrogen Energy 2012, 37, 17457–17469. [Google Scholar] [CrossRef]
  33. Glasstone, S.; Dolan, P.J. The Effects of Nuclear Weapons. In Astoria; University of Pittsburgh Press: Pittsburgh, PA, USA, 2017; pp. 62–63. [Google Scholar] [CrossRef]
  34. Mironov, V.N.; Penyazkov, O.G.; Ignatenko, D.G. Self-Ignition and Explosion of a 13-MPa Pressurized Unsteady Hydrogen Jet under Atmospheric Conditions. Int. J. Hydrogen Energy 2015, 40, 5749–5762. [Google Scholar] [CrossRef]
Figure 1. The experimental area for hydrogen leakage and diffusion built by Pitts et al.
Energies 18 04172 g001
Figure 2. Physical model, monitoring point distribution, and grid division diagram.
Energies 18 04172 g002
Figure 3. Comparison of experimental and simulated values of hydrogen concentration in sensors.
Energies 18 04172 g003
Figure 4. Geometric model and mesh division diagram. (a) Geometric model; (b) mesh division.
Energies 18 04172 g004
Figure 5. Spatial distribution diagram of monitoring points.
Energies 18 04172 g005
Figure 6. Hydrogen concentration distribution cross-section at Z = 1.1 m under different grid sizes at 24 s of leakage. (a) 0.15 m; (b) 0.2 m; (c) 0.3 m; (d) 0.4 m; (e) 0.5 m.
Energies 18 04172 g006
Figure 7. Hydrogen concentration curves at M37 point under different grid sizes.
Energies 18 04172 g007
Figure 8. Hydrogen diffusion cloud maps under different leakage directions of the compressor in spring (southeast wind).
Energies 18 04172 g008
Figure 9. Hydrogen diffusion cloud maps under different leakage directions of hydrogen storage tank in summer (south wind).
Energies 18 04172 g009
Figure 10. Hydrogen diffusion cloud maps under different leakage directions of hydrogen dispenser in autumn (north wind).
Energies 18 04172 g010
Figure 11. Hydrogen diffusion cloud maps under different leakage directions of hydrogen storage tank in winter (northwest wind).
Energies 18 04172 g011
Figure 12. Hydrogen diffusion cloud maps for +X direction leakage from the compressor in different seasons.
Energies 18 04172 g012
Figure 13. Hydrogen diffusion cloud maps for −Z direction leakage from the hydrogen storage tank in different seasons.
Energies 18 04172 g013
Figure 14. Hydrogen diffusion cloud maps for −Y direction leakage from the hydrogen dispenser in different seasons.
Energies 18 04172 g014
Figure 15. Comparison diagram of FLACS simulation values and empirical formula fitting values of hydrogen concentration under different leakage positions. (a) Hydrogen storage tank; (b) compressor; (c) hydrogen dispenser.
Energies 18 04172 g015
Figure 16. Pressure curve graphs of explosion at different initial concentrations of hydrogen after leakage in the Z-direction of the summer hydrogen storage tank. (a) 10%; (b) 35%; (c) 55%; (d) 70%.
Energies 18 04172 g016
Figure 17. Explosion pressure distribution of hydrogen storage tanks in the −Z direction in summer (Z = 2 m).
Energies 18 04172 g017
Figure 18. Flame shape and temperature diagram (Z = 2 m) of hydrogen storage tank in the −Z direction in summer.
Energies 18 04172 g018
Table 1. Critical comparison of turbulence models for high-velocity hydrogen jet simulations.
ModelAccuracy for High-Velocity JetsComputational CostKey LimitationsApplicability to HRS Scenarios
k − εModerate (empirical constants limit transient precision)Low (efficient for large-scale geometries)Under-predicts strong shear/curvature effectsSuitable for full-scale HRS models
LESHigh (resolves large-scale turbulence)Very high (10–50 × k − ε cost)Requires fine grids; subgrid model dependenceLimited to small domains/single scenarios
DNSHighest (resolves all turbulent scales)Extremely high (prohibitive for industry cases)Restricted to simple geometries/low ReNot feasible for full-scale HRS models
Table 2. Seasonal climate parameters.
SeasonAverage Wind Speed (m/s)Wind DirectionAverage Temperature (°C)
V x V y V z
Spring
(March to May)
−2.122.120Southeast20
Summer
(June to August)
020South25
Autumn
(September to November)
0−2.50North18
Winter
(December to February)
1.63−1.630Northwest10
Table 3. Coordinates of monitoring points (X,Y,Z).
PointCoordinates (m)PointCoordinates (m)PointCoordinates (m)PointCoordinates (m)
M1(16.25, 13.75, 0.25)M10(16.25, 13.75, 3.25)M19(16.25, 13.75, 6.25)M28(16.25, 13.75, 9.25)
M2(30.55, 13.75, 0.25)M11(30.55, 13.75, 3.25)M20(30.55, 13.75, 6.25)M29(30.55, 13.75, 9.25)
M3(48.75, 13.75, 0.25)M12(48.75, 13.75, 3.25)M21(48.75, 13.75, 6.25)M30(48.75, 13.75, 9.25)
M4(16.25, 27.55, 0.25)M13(16.25, 27.55, 3.25)M22(16.25, 27.55, 6.25)M31(16.25, 27.55, 9.25)
M5(30.55, 27.55, 0.25)M14(30.55, 27.55, 3.25)M23(30.55, 27.55, 6.25)M32(30.55, 27.55, 9.25)
M6(48.75, 27.55, 0.25)M15(48.75, 27.55, 3.25)M24(48.75, 27.55, 6.25)M33(48.75, 27.55, 9.25)
M7(16.25, 41.25, 0.25)M16(16.25, 41.25, 3.25)M25(16.25, 41.25, 6.25)M34(16.25, 41.25, 9.25)
M8(30.55, 41.25, 0.25)M17(30.55, 41.25, 3.25)M26(30.55, 41.25, 6.25)M35(30.55, 41.25, 9.25)
M9(48.75, 41.25, 0.25)M18(48.75, 41.25, 3.25)M27(48.75, 41.25, 6.25)M36(48.75, 41.25, 9.25)
Table 4. Control group for grid independence verification.
NumberWind ConditionsCompressor Leakage LocationLeak DirectionCore-Region Grid Size (m)Grid Count
#1No wind(13.25, 22.05, 0.95)+X0.1562,100
#2No wind(13.25, 22.05, 0.95)+X0.251,772
#3No wind(13.25, 22.05, 0.95)+X0.336,504
#4No wind(13.25, 22.05, 0.95)+X0.425,725
#5No wind(13.25, 22.05, 0.95)+X0.521,780
Table 5. Parameters of Formula (7) for different leakage locations.
AabcdefghαB
Hydrogen storage tank−0.06510.2640.14880.10.76020.74220.6820.10.10.34590.0587
Compressor−0.81810.10010.10.10010.39860.27770.5760.10.10.03070.6538
Hydrogen dispenser3.07380.118.2230.1300.92092.47170.10.10.74850.0058
Disclaimer/Publisher’s Note: The statements, opinions and data contained in all publications are solely those of the individual author(s) and contributor(s) and not of MDPI and/or the editor(s). MDPI and/or the editor(s) disclaim responsibility for any injury to people or property resulting from any ideas, methods, instructions or products referred to in the content.