Article

Performance Improvement of Proton Exchange Membrane Fuel Cell by a New Coupling Channel in Bipolar Plate

1
School of Mechanical Engineering, Hebei University of Science and Technology, Shijiazhuang 050018, China
2
School of Mechanical Engineering, Yanshan University, Qinhuangdao 066000, China
*
Author to whom correspondence should be addressed.
Energies 2025, 18(15), 4068; https://doi.org/10.3390/en18154068 (registering DOI)
Submission received: 30 June 2025 / Revised: 13 July 2025 / Accepted: 29 July 2025 / Published: 31 July 2025
(This article belongs to the Special Issue Advanced Energy Storage Technologies)

Abstract

The geometric design of flow channels in bipolar plates is one of the critical features of proton exchange membrane fuel cells (PEMFCs), as it determines the power output of the fuel cell and has a significant impact on its performance and durability. The function of the bipolar plate is to guide the transfer of reactant gases to the gas diffusion layer and catalytic layer inside the PEMFC, while removing unreacted gases and gas–liquid byproducts. Therefore, the design of the bipolar plate flow channel is directly related to the water and thermal management of the PEMFC. In order to improve the comprehensive performance of PEMFCs and ensure their safe and stable operation, it is necessary to design the flow channels in bipolar plates rationally and effectively. This study addresses the limitations of existing bipolar plate flow channels by proposing a new coupling of serpentine and radial channels. The distribution of oxygen, water concentrations, and temperature inside the channel is simulated using the multi-physics simulation software COMSOL Multiphysics 6.0. The performance of this novel design is compared with conventional flow channels, with a particular focus on the pressure drop and current density to evaluate changes in the output performance of the PEMFC. The results show that the maximum current density of this novel design is increased by 67.36% and 10.43% compared to straight channel and single serpentine channels, respectively. The main contribution of this research is the innovative design of a new coupling of serpentine and radial channels in bipolar plates, which improves the overall performance of the PEMFC. This study provides theoretical support for the design of bipolar plate flow channels in PEMFCs and holds significant importance for the green development of energy.

1. Introduction

The proton exchange membrane fuel cell (PEMFC) has attracted attention due to its advantages of higher energy utilization efficiency and potential to address the energy crisis. As one of the most promising energy conversion devices, the PEMFC emits energy in the form of electrical energy through the electrochemical reaction of hydrogen and oxygen, and only water is produced in this process. This achieves true zero pollution, which helps overcome the dependence on primary energy sources such as oil [1,2,3,4]. The performance of fuel cells can be improved through various methods, such as using Zn-doped lithium aluminum titanium phosphate ceramic electrodes [5] and optimizing the reactant flow path. The core structure of the PEMFC is a hydrogen–oxygen electrochemical reaction unit consisting of a bipolar plate and a membrane electrode. Hydrogen and oxygen are fed into the fuel cell stack through channels in the bipolar plates, where they combine to form water in the presence of a catalyst. This electrochemical reaction releases electricity and heat. At present, the actual conversion rate of electric energy in most stacks is about 50~55%, and the remaining energy is released as heat energy [6]. The flow channel of bipolar plates could change the flow mode of gas in the flow field, which can make the gas fill the whole flow field reasonably. Therefore, the channel structure of bipolar plates is the key factor affecting the performance of PEMFCs [7]. As is known to all, conventional flow channels have been studied sufficiently, such as the straight channel and the serpentine channel; however, their flow fields are too simple to meet the developing needs of PEMFCs [8,9,10]. Now many scholars are beginning to try new bipolar plate channels to improve the performance of PEMFCs.
Furthermore, the critical factors in fuel cell operation involve the management of air intake/exhaust, temperature, and humidity. Proper control of temperature and humidity ensures stable and continuous performance even in low-temperature environments. An uneven air distribution can lead to imbalanced power generation within the stack, potentially causing localized cell reversal and damaging the stack [11]. Air-cooled fuel cell stacks typically employ a self-aspirating structure, where an intake fan regulates airflow to adjust stack temperature. The optimal operating temperature range for fuel cell stacks is generally between 30 °C and 70 °C for stable performance. However, insufficient membrane electrode assembly (MEA) humidity reduces the availability of water, which acts as a catalyst in the reaction, leading to slower reaction kinetics or decreased efficiency. Conversely, excessive water accumulation can block the gas diffusion layer (GDL), impairing mass transport. These issues are closely related to the role of bipolar plates [12]. Bipolar plates serve to conduct electrons generated in the MEA to the external circuit while facilitating the removal of reaction heat and water. Bipolar plates account for approximately 70–80% of the total weight and 40–50% of the cost of a PEMFC [13]. The flow field design of bipolar plates directly influences the electrochemical performance and internal mass transport processes of PEMFCs. Therefore, innovative flow field designs hold significant potential for improving fuel cell efficiency. Liu et al. investigated the effects of channel structure on the performance of fuel cells and found that straight channel offer a low pressure drop but struggle with water management [14]. Peng et al. designed three types of serpentine channels for comparison with straight channels. The results indicate that the serpentine channels have larger effective water removal but higher parasitic power loss [15]. A honeycomb-like flow channel was investigated by Zhang’s group; this structure enhanced gas diffusion but increased manufacturing complexity [16]. Zuo et al. proposed a novel rotating radial flow channel and studied the effects of different rotational speeds on the flow characteristics and electrochemical reactions of reactants [17]. The results showed that this rotating radial flow channel effectively improved the problem of the uneven distribution of reactants and enhanced output performance. It can be seen from the above research that improving the performance of PEMFCs by optimizing the flow channel structure is of great significance.
Based on the advantages and disadvantages of traditional bipolar plate channels, this paper proposes a new composite channel that combines the drainage characteristics of serpentine channels and the flow distribution characteristics of radial channels. Subsequently, the simulation model of the channel is established in detail, and the influence of the channel on the oxygen concentration, cathode channel water concentration, pressure drop, and current density in the PEMFC is investigated.

2. Mathematical Model
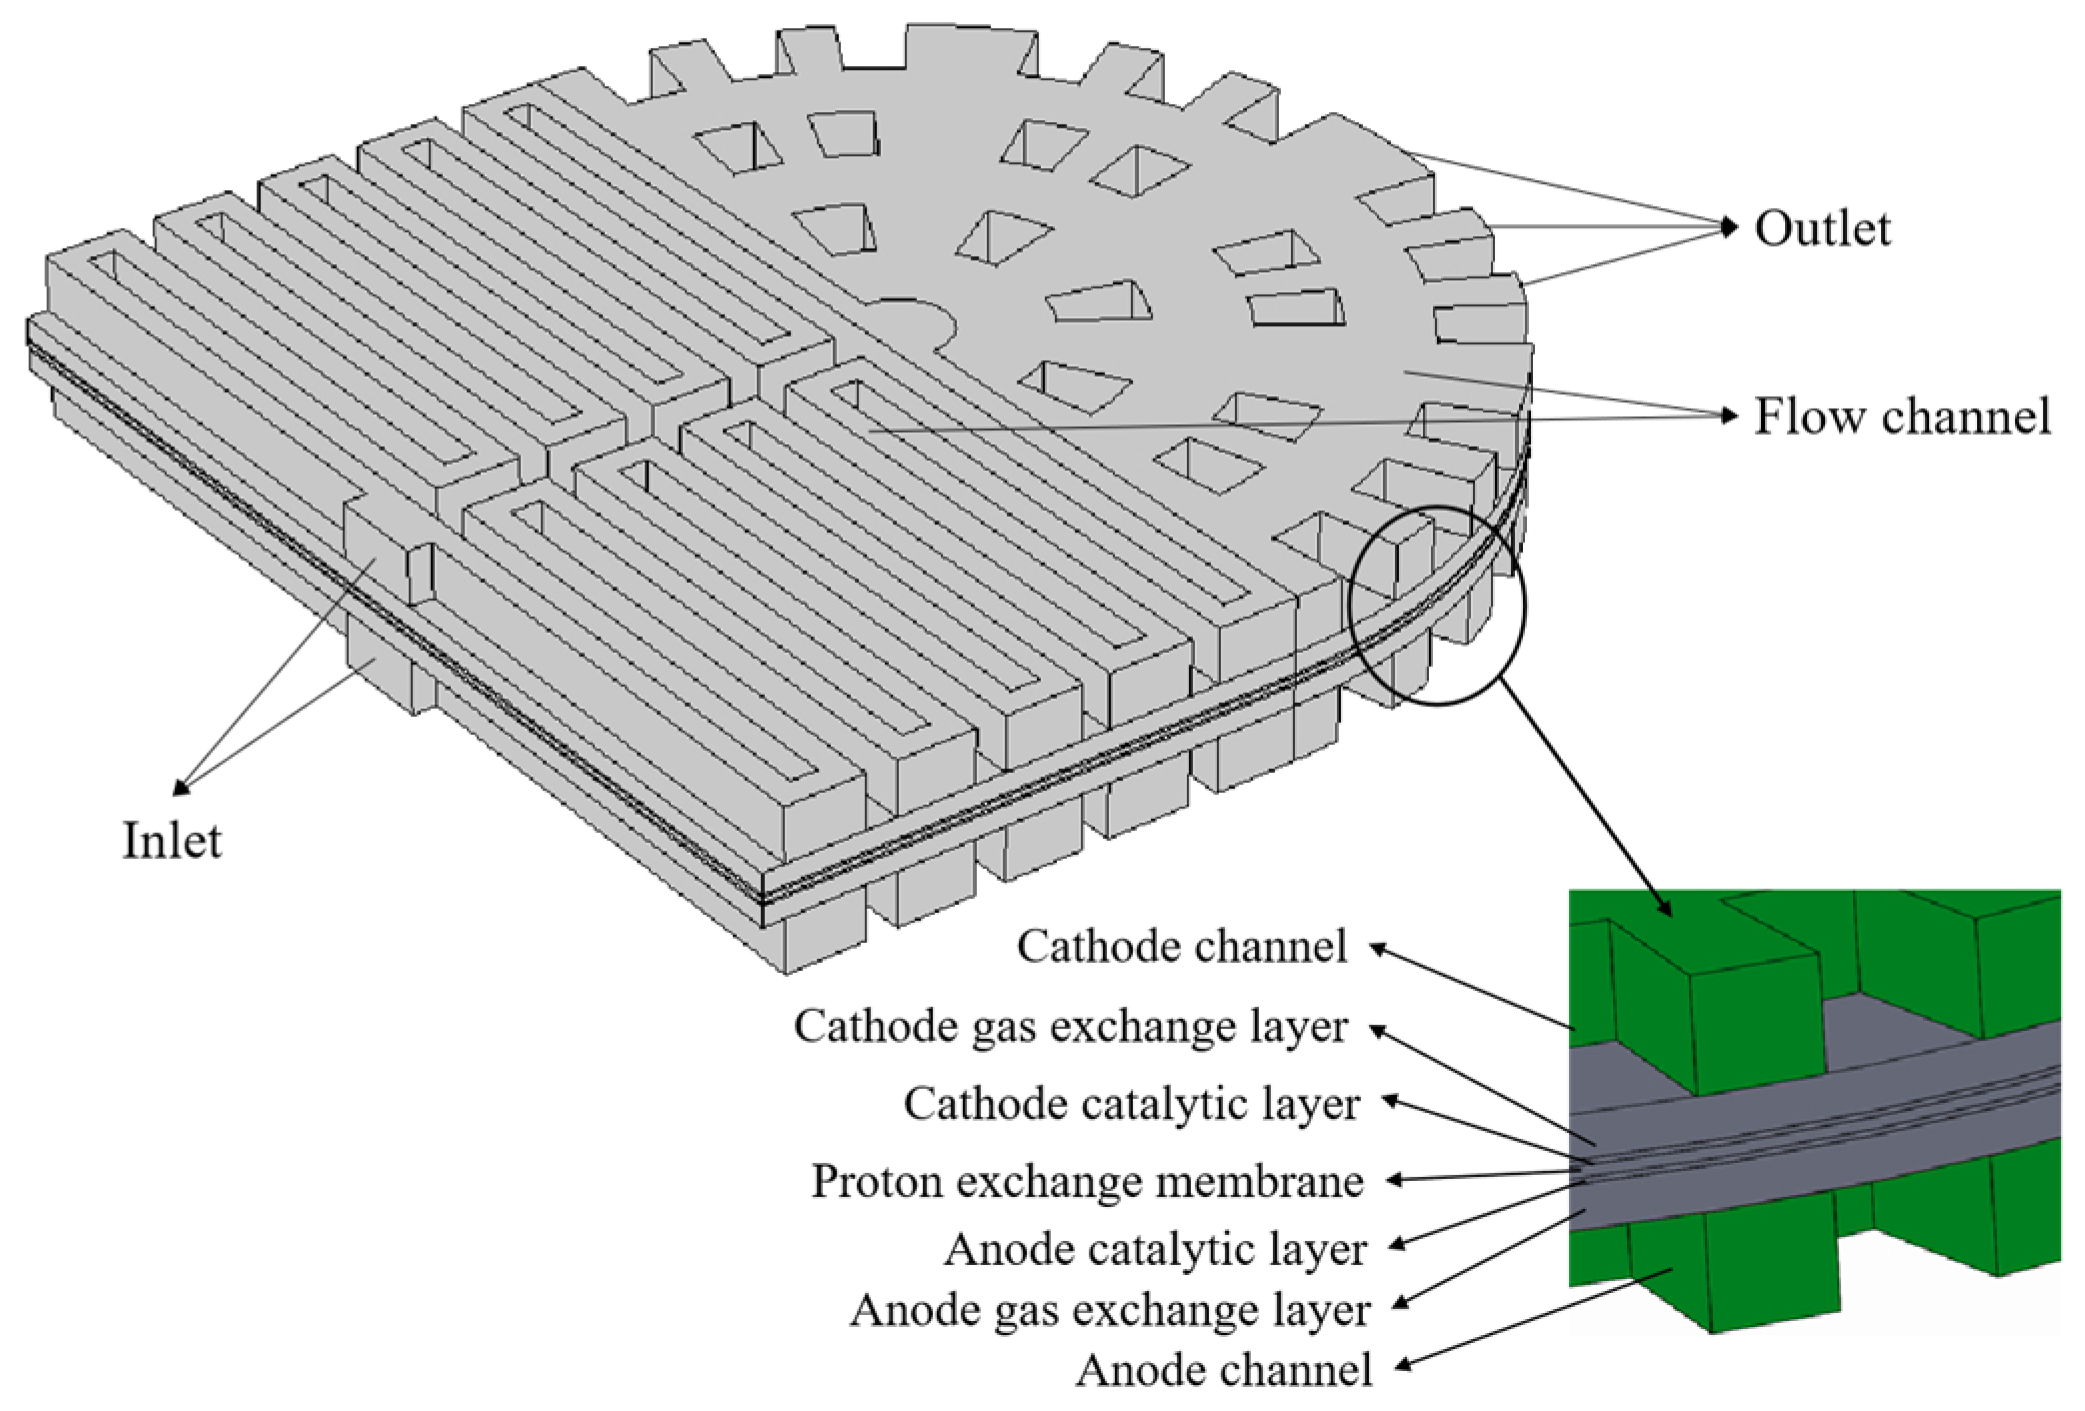
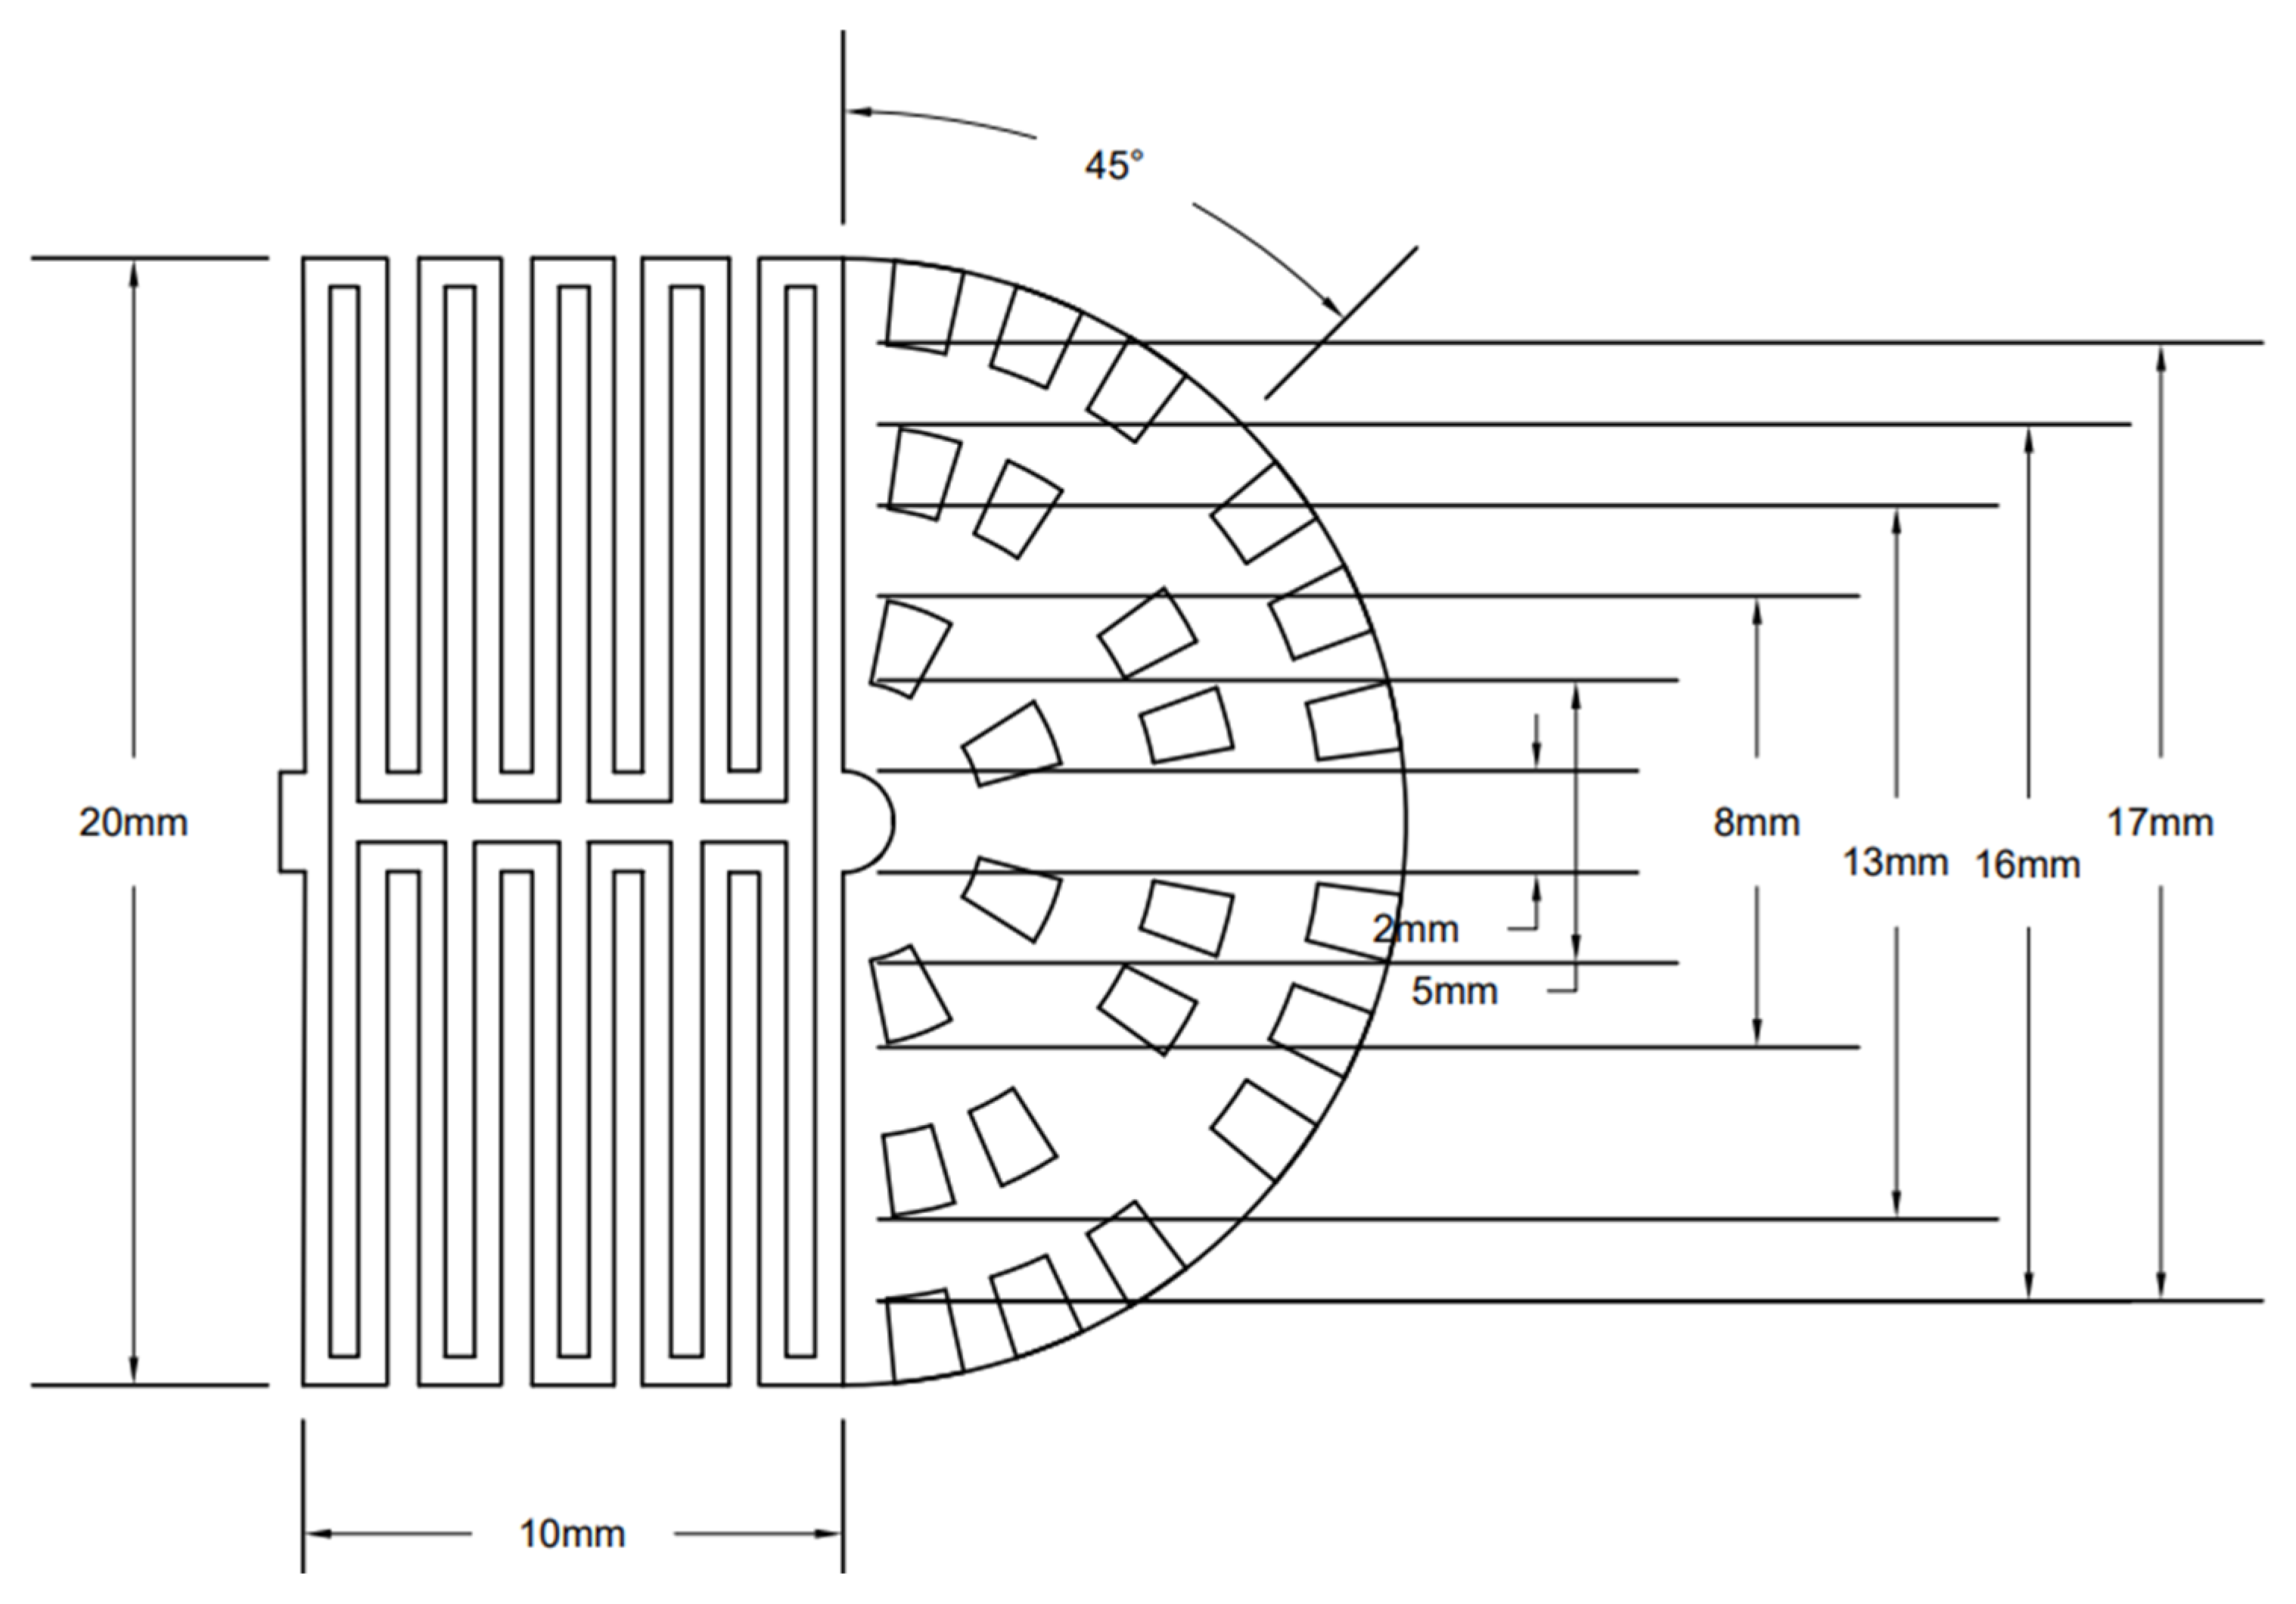
2.1. Model Geometry

This study used COMSOL Multiphysics to establish and simulate the flow channel model. Specifically, the symmetric double-serpentine channel and radial channel are combined into a new channel, where the two serpentine channels are arranged in an axisymmetric distribution and connected to the radial channel at the end of the outlet of the serpentine channel. The three-dimensional geometric model of a PEMFC with a new flow channel is shown in Figure 1. The inlet of the fuel cell is set in the serpentine flow channel on one side of the bipolar plate, and the outlet is set at the four peripheral edges on the other side of the bipolar plate. The reaction gas first enters the first stage’s double-serpentine channel and then enters the second stage’s radial channel. Under the separation effect of the rib plates in the radial channel, the flow from the end of the serpentine channel is scattered towards the outlet of the radial channel, completing the combination of the serpentine channel and the radial channel. The end of the serpentine channel in the front part is the center of the radial channel in the back part. And two rings of ribs are arranged around the center periphery in sequence, with the number of ribs increasing in each stage. Use the end of the symmetric double-serpentine channel as the center of the radial channel, and arrange multiple graded ribs around the outer circumference in sequence. The graded rib blocks divide the radial channel into four fan-shaped regions, each of which is equipped with an outlet. The rib plates are arranged in a staggered manner along the direction of gas flow in each fan-shaped area. Each fan-shaped area contains the same number and size of rib blocks of the same level, with a total of 3 arc-shaped flow channels and 5 rows of longitudinal flow channels. The arc-shaped flow channels of each level increase sequentially. The specific geometric dimensions of the new coupling channel are shown in Figure 1. To show the full dimension of the plates, a schematic diagram of the planar structure of the new coupling flow channel is provided in Figure 2. The activation area is approximately 357 mm2, the depth of the channel is 1 mm, the thickness of the gas diffusion layer is 0.38 mm, the thickness of the catalytic layer is 0.05 mm, and the thickness of the proton exchange membrane is 0.1 mm.

2.2. Governing Equations

This paper employs COMSOL Multiphysics software to conduct simulation calculations for the model. The specific equations are as follows:

2.2.1. Mass Conservation Equation

The conservation of mass equation ensures the conservation of the mass of fluids, such as hydrogen, air, and water vapor, and is the foundation of fluid flow simulation. In the flow channels, the mass conservation equation is used:
ε ρ t + · ε ρ v = S m
In the formula, ρ is the fluid density (kg/m3); ε is the porosity of the porous medium; v is velocity vector (m); and S m is the quality source term, indicating the mass change caused by electrochemical reactions or phase transitions per unit volume. In PEMFCs, it is defined as the sum of hydrogen consumption, oxygen consumption, water generation, and liquid water evaporation/condensation.
For the anode and cathode channels, ε = 1 and S m = 0; for the anode and cathode diffusion layers, ε = 0.4 and S m = 0.
S m a = S H 2 = M H 2 2 F i a
S m c = S H 2 O + S O 2 = M H 2 O 2 F i c M O 2 4 F i c
In the formula, M H 2 , M H 2 O , and M O 2 are the molar mass fractions of H2, H2O, and O2, respectively; F is Faraday’s constant; i is current density; and subscripts a and b, respectively, represent the anode and cathode.

2.2.2. Conservation Equation of Electric Current

The conservation of charge equation determines the potential distribution of protons and electrons, directly affecting the output voltage of the battery.
· κ s e f f s + S s = 0
· κ m e f f m + S m = 0
In the formula, κ s e f f is the solid phase conductivity; κ m e f f is the membrane phase conductivity; s is the solid phase potential; m is the membrane phase potential; S s is an electronic current source term; and S m is a proton current source term.
According to the principle of charge conservation, S s + S m = 0 .
For the anode catalytic layer, S s = S m < 0 .
For the cathode catalytic layer, S s = S m > 0 .
The remaining areas, S s = S m = 0 .

2.2.3. Conservation Equation of Momentum

The momentum conservation equation describes the flow behavior of the reactant gas in the channel and porous electrode, which affects the transfer rate of reactants.
ε ρ v t + · ε ρ v v = ε p + · ε μ v + S v
In the formula, p is the fluid pressure; μ is dynamic viscosity; and S is a momentum source term. The left two terms of the conservation of dynamics equation represent the transient term and convective momentum flux, while the first two terms on the right represent the momentum transfer caused by pressure and viscosity, respectively.

2.2.4. Electrochemical Equation

The electrochemical kinetics equation directly relates the local current density and overpotential, which is the key to performance simulation.
S a = j a , r e f C H 2 C H 2 , r e f λ a e a a F η a R T e a c F η a R T
S c = j c , r e f C O 2 C O 2 , r e f λ c e a c F η c R T e a a F η c R T
In the formula, S a is the anodic electrochemical source term; S c is the cathodic electrochemical source term; j a , r e f is the exchange current density for anode reference; j c , r e f is the exchange current density for cathode reference; C H 2 and C O 2 are the molar concentrations of hydrogen and oxygen, respectively; C H 2 , r e f and C O 2 , r e f are the reference molar concentrations of hydrogen and oxygen, respectively; and λ a and λ c are the positive and negative concentration indices, respectively. In this equation, λ a and λ c are the anode and cathode transfer coefficients, respectively.

2.2.5. The Formation and Transport Equation of Liquid Water

The species transfer equation (component conservation) predicts the concentration distribution of each component (hydrogen, oxygen, and water), which directly affects the electrochemical reaction rate.
r w = C r m a x 1 s p w p s a t R T M H 2 O S ρ l
ε ρ l s t + ρ l v l s = r w
In the formula, r w is the condensation rate of water; C r is a constant; p w is the vapor pressure of water; p s a t is the saturated water vapor pressure; and ρ l is the density of water.

2.2.6. Conservation Equation of Heat Transport

Temperature affects membrane conductivity, reaction kinetics, and water management, which are the core of thermal management.
ρ c p T t + · ( ρ c p v T ) = ( k T ) + S q
In the formula, ρ is fluid density; c p is specific heat capacity; T is temperature; v is fluid velocity vector; k is thermal conductivity; and S q is a heat source term.

2.3. Assumptions and Initial Conditions of the Model

In this study, five geometric designs were compared, as shown in Figure 3: a straight channel, a single-serpentine channel, a symmetric double-serpentine channel, a radial channel, and a new coupling channel. The study first established three-dimensional models of hydrogen fuel cells with five different flow channels in SOLIDWORKS 2018 software, and then imported them into COMSOL Multiphysics field simulation software for further research. The structure of each geometric model from top to bottom consists of a cathode channel, cathode gas exchange layer, cathode catalytic layer, proton exchange membrane, anode catalytic layer, anode gas exchange layer, and anode channel (seen in Figure 1). For the convenience of modeling and simulation, the anode and cathode of each model use the same flow channel.
A three-dimensional two-phase non-isothermal model based on specific assumptions was established. Firstly, it is assumed that the fuel cell operates under steady-state conditions. Secondly, the influence of gravity-coupled contact resistance inside the fuel cell can also be ignored. Finally, the flow inside the PEMFC is also considered laminar. The boundary conditions of the model are defined in Table 1.
This study is based on the COMSOL multiphysics simulation software, and simulates it by setting boundary conditions and model parameters. The main material parameters and operating parameters in the model are shown in Table 2.

2.4. Grid Division and Independence Verification

All models in this work were meshed using the built-in meshing module of COMSOL Multiphysics. The computational domain mesh was manually controlled and divided into two categories. The proton exchange membrane and catalyst layer regions used structured meshes, while the flow channel and GDL used free tetrahedral meshes. The transition between the two types of meshes used conical meshes to solve the cross flow from channel to channel, and boundary layers were added near the ribs for mesh refinement. In order to reduce the influence of the number of grids on the calculation results, after the convergence of the model calculation, the influence of the boundary layer was ignored due to the assumption that the fluid is laminar and the Reynolds number is small. The current density measured at 0.6 V was used as the monitoring parameter. Five grids with different numbers of grids (10,000, 165,433, 283,563, 362,219, and 453,558) were used for grid independence verification, and the changes in polarization curves with different numbers of grids were verified (Figure 4). The results indicate that the difference in current density between 362,219 and 453,558 units does not exceed 0.13%. To balance the relationship between computing resources and accuracy, this study used a unit count of 362,219 for subsequent simulations.

2.5. Experimental Verification of the Accuracy of PEMFC Mathematical Model

When using simulation software to analyze the mathematical model of the PEMFC, certain ideal conditions are introduced, and the complex and ever-changing environment in reality may lead to discrepancies between the calculated results of the mathematical model and the experimental test results. In order to verify the accuracy of the simulation model, this study conducted experiments to validate the accuracy of the PEMFC mathematical model, and based on this validation result, calibrated the mathematical model to a certain extent. The experimental testing of this study relies on the YD-II fuel cell testing platform of a certain company to test graphite material parallel straight bipolar plate single cells. The experimental data generated based on the fuel cell testing platform is compared and analyzed with the parallel straight channel simulation data generated by COMSOL simulation software. Based on the comparison results, the mathematical model of the PEMFC is calibrated to make the software simulation process as realistic and reliable as possible.

2.5.1. Experimental Preparation

Based on the considerations of processing conditions and time costs, this experiment commissioned a professional manufacturer in China to process and produce graphite bipolar plates with parallel straight channels. In addition, during the construction of fuel cell single cells, the DuPont Nafion N117 membrane was used as the proton exchange membrane, and Toray TGP-H-120 carbon paper substrate was used as the diffusion layer. The effective active area of the membrane electrode was 400 mm2 (20 mm × 20 mm), corresponding to the size specification of the bipolar plate flow channel area of 20 mm × 20 mm. The width and height of the rib plate, as well as the width and depth of the flow channel, were all 1 mm. Sealing rings were bonded around the anode and cathode graphite plates, and temperature and pressure measuring holes were set above. Bipolar plates are made of graphite and have good mechanical properties, conductivity, and corrosion resistance. The end plate is made of aluminum alloy, which reduces the overall mass of the stack while ensuring sufficient mechanical strength and gas channel sealing. Finally, it is assembled into parallel straight channel PEMFC single cells for experimental testing. This fuel cell testing platform mainly includes an anode supply system, battery management system, electronic load system, safety protection system, and data acquisition system, which are used for performance testing of assembled PEMFC single cells. The gas supply system needs to control the temperature, humidity, pressure, and flow rate of the gas. The humidification system needs to maintain the temperature of the humidification liquid within a certain range to maintain stability. The battery management system and electronic load are responsible for controlling the output voltage, current, operating temperature, and other parameters of the fuel cell.

2.5.2. Experimental Results and Error Analysis

Firstly, perform an air tightness test on the assembled single cell. With the gas outlet of the single cell closed, pressurize the gas inlet of the single cell and observe the pressure gauge pointer. If the pointer remains stationary, the air tightness of the single cell is considered qualified. Subsequently, connect the single cell with qualified airtightness to the YD-II fuel cell testing platform and perform nitrogen purging. The nitrogen flow rate is set to 1.5 L/min, and the purging time is 60 s. The purpose of purging is to eliminate oxygen to ensure the accuracy of data during the operation of a single cell. In order to prevent the proton exchange membrane from hardening and increasing the resistance of the electrolyte, the reaction gas is first humidified through a humidification chamber before entering the catalytic layer. Heat the fuel cell through the end plate heating function of the fuel cell testing platform, and start testing when the single cell is working smoothly. The inlet boundary conditions adopted in this experiment are the excess coefficients of the simulated cathode and anode. Linear sweep voltammetry is used to set the voltage range of the single cell to 0.2–0.9 V and the step size to 0.1 V for discharge. At the same time, various indicators of the single cell are monitored on the YD-II fuel cell testing platform, and the experimental polarization curve is recorded. Maintain each step in the polarization curve for one minute before increasing to the next current density. Based on the polarization curve, the efficiency of a single cell under different conditions can be checked to derive the performance of the fuel cell. Finally, the experimental polarization curve will be compared with the simulated polarization curve, and the differences will be analyzed to validate the mathematical model established in this study.
Figure 5 shows the comparison of polarization curves between parallel-straight-channel single-cell experiments and simulations. It can be seen that when the current density is low, the simulation and experimental results are basically consistent; when the current density is high, there is a significant difference between simulation and experiment. This phenomenon has been validated in reference. The PEMFC exhibits activation polarization, ohmic polarization, and concentration polarization phenomena. Numerical simulation is quite idealized, but due to the differences between the external environment and ideal environment during actual operation of PEMFC, the simulation curve is slightly larger than the experimental value at high current density, slightly better than the experimental value. Secondly, the simulation results and experimental test results of parallel-DC-channel single cells can clearly distinguish the three polarization stages, and the overall trend is not different, indicating that the simulation is relatively accurate. The difference between experimental data and numerical data is also caused by the discretization method used in grid partitioning in COMSOL. The finer the grid, the more accurate the generated solution, which comes at the cost of sacrificing computation time.

3. Results and Discussion

3.1. Polarization Curve and Power Density Curve

According to the polarization curves of the PEMFC, with five different flow fields shown in Figure 6a, the lower the cell potential, the more pronounced the concentration polarization. At high operating voltages, there is almost no significant difference in current density among the five flow field structures. The reason is that under high voltage, activation polarization is the dominant factor, and activation loss is mainly related to the characteristics of the membrane. In the numerical simulation process, the membrane parameters adopted for the five flow fields are consistent and remain unchanged during operation. As the working voltage decreases, the difference in current density of fuel cells in different channels gradually increases. The reason is that under low voltage, the concentration polarization of the PEMFC is severe, and the concentration of reaction gases has a significant impact on the performance of the PEMFC. Under the same operating voltage, the current density of different structural flow fields is as follows: new coupling channel > symmetric double serpentine channel > single serpentine channel > radial channel > straight channel. It can be clearly seen that the maximum current density of the new coupling channel is significantly higher than the other four channels. According to the specific data of numerical simulation, at 0.2 V, the maximum current densities of these five channels are 0.87681 A/cm2 for the straight channel, 1.32883 A/cm2 for the single-serpentine channel, 1.3847 A/cm2 for the symmetric double-serpentine channel, 1.29093 A/cm2 for the radial channel, and 1.46749 A/cm2 for the new coupling channel. It is obvious that the gain effect of the new coupling channel is the best, and its maximum current density is increased by 67.36% and 10.43%, respectively, compared to the straight channel and the single-serpentine channel, fully reflecting the superiority of the electrochemical performance of the new coupling channel. According to the power density curves of the PEMFC for five different channels shown in Figure 6b, the maximum power density of the five different flow channels is as follows: new coupling channel > symmetric double serpentine channel > single serpentine channel > radial channel > straight channel. This power density curve can further demonstrate that the output performance of the new coupling flow channel battery has been improved compared to other channels. In addition, as shown in Figure 6, in our study, when the operating voltage of the PEMFC is greater than 0.6 V, the battery voltage is higher and located in the electrochemical polarization region. When the operating voltage is less than 0.6 V, the battery is located in the ohmic polarization region. In the ohmic polarization region, the decrease in voltage is proportional to the increase in current, and the main factor affecting the curve is the internal resistance of the battery. Based on the analysis of the polarization curve of the PEMFC above, in order to reduce the impact of concentration polarization on the performance of the PEMFC, the state of fuel cells at a working voltage of 0.6 V was taken as the research object in this study.

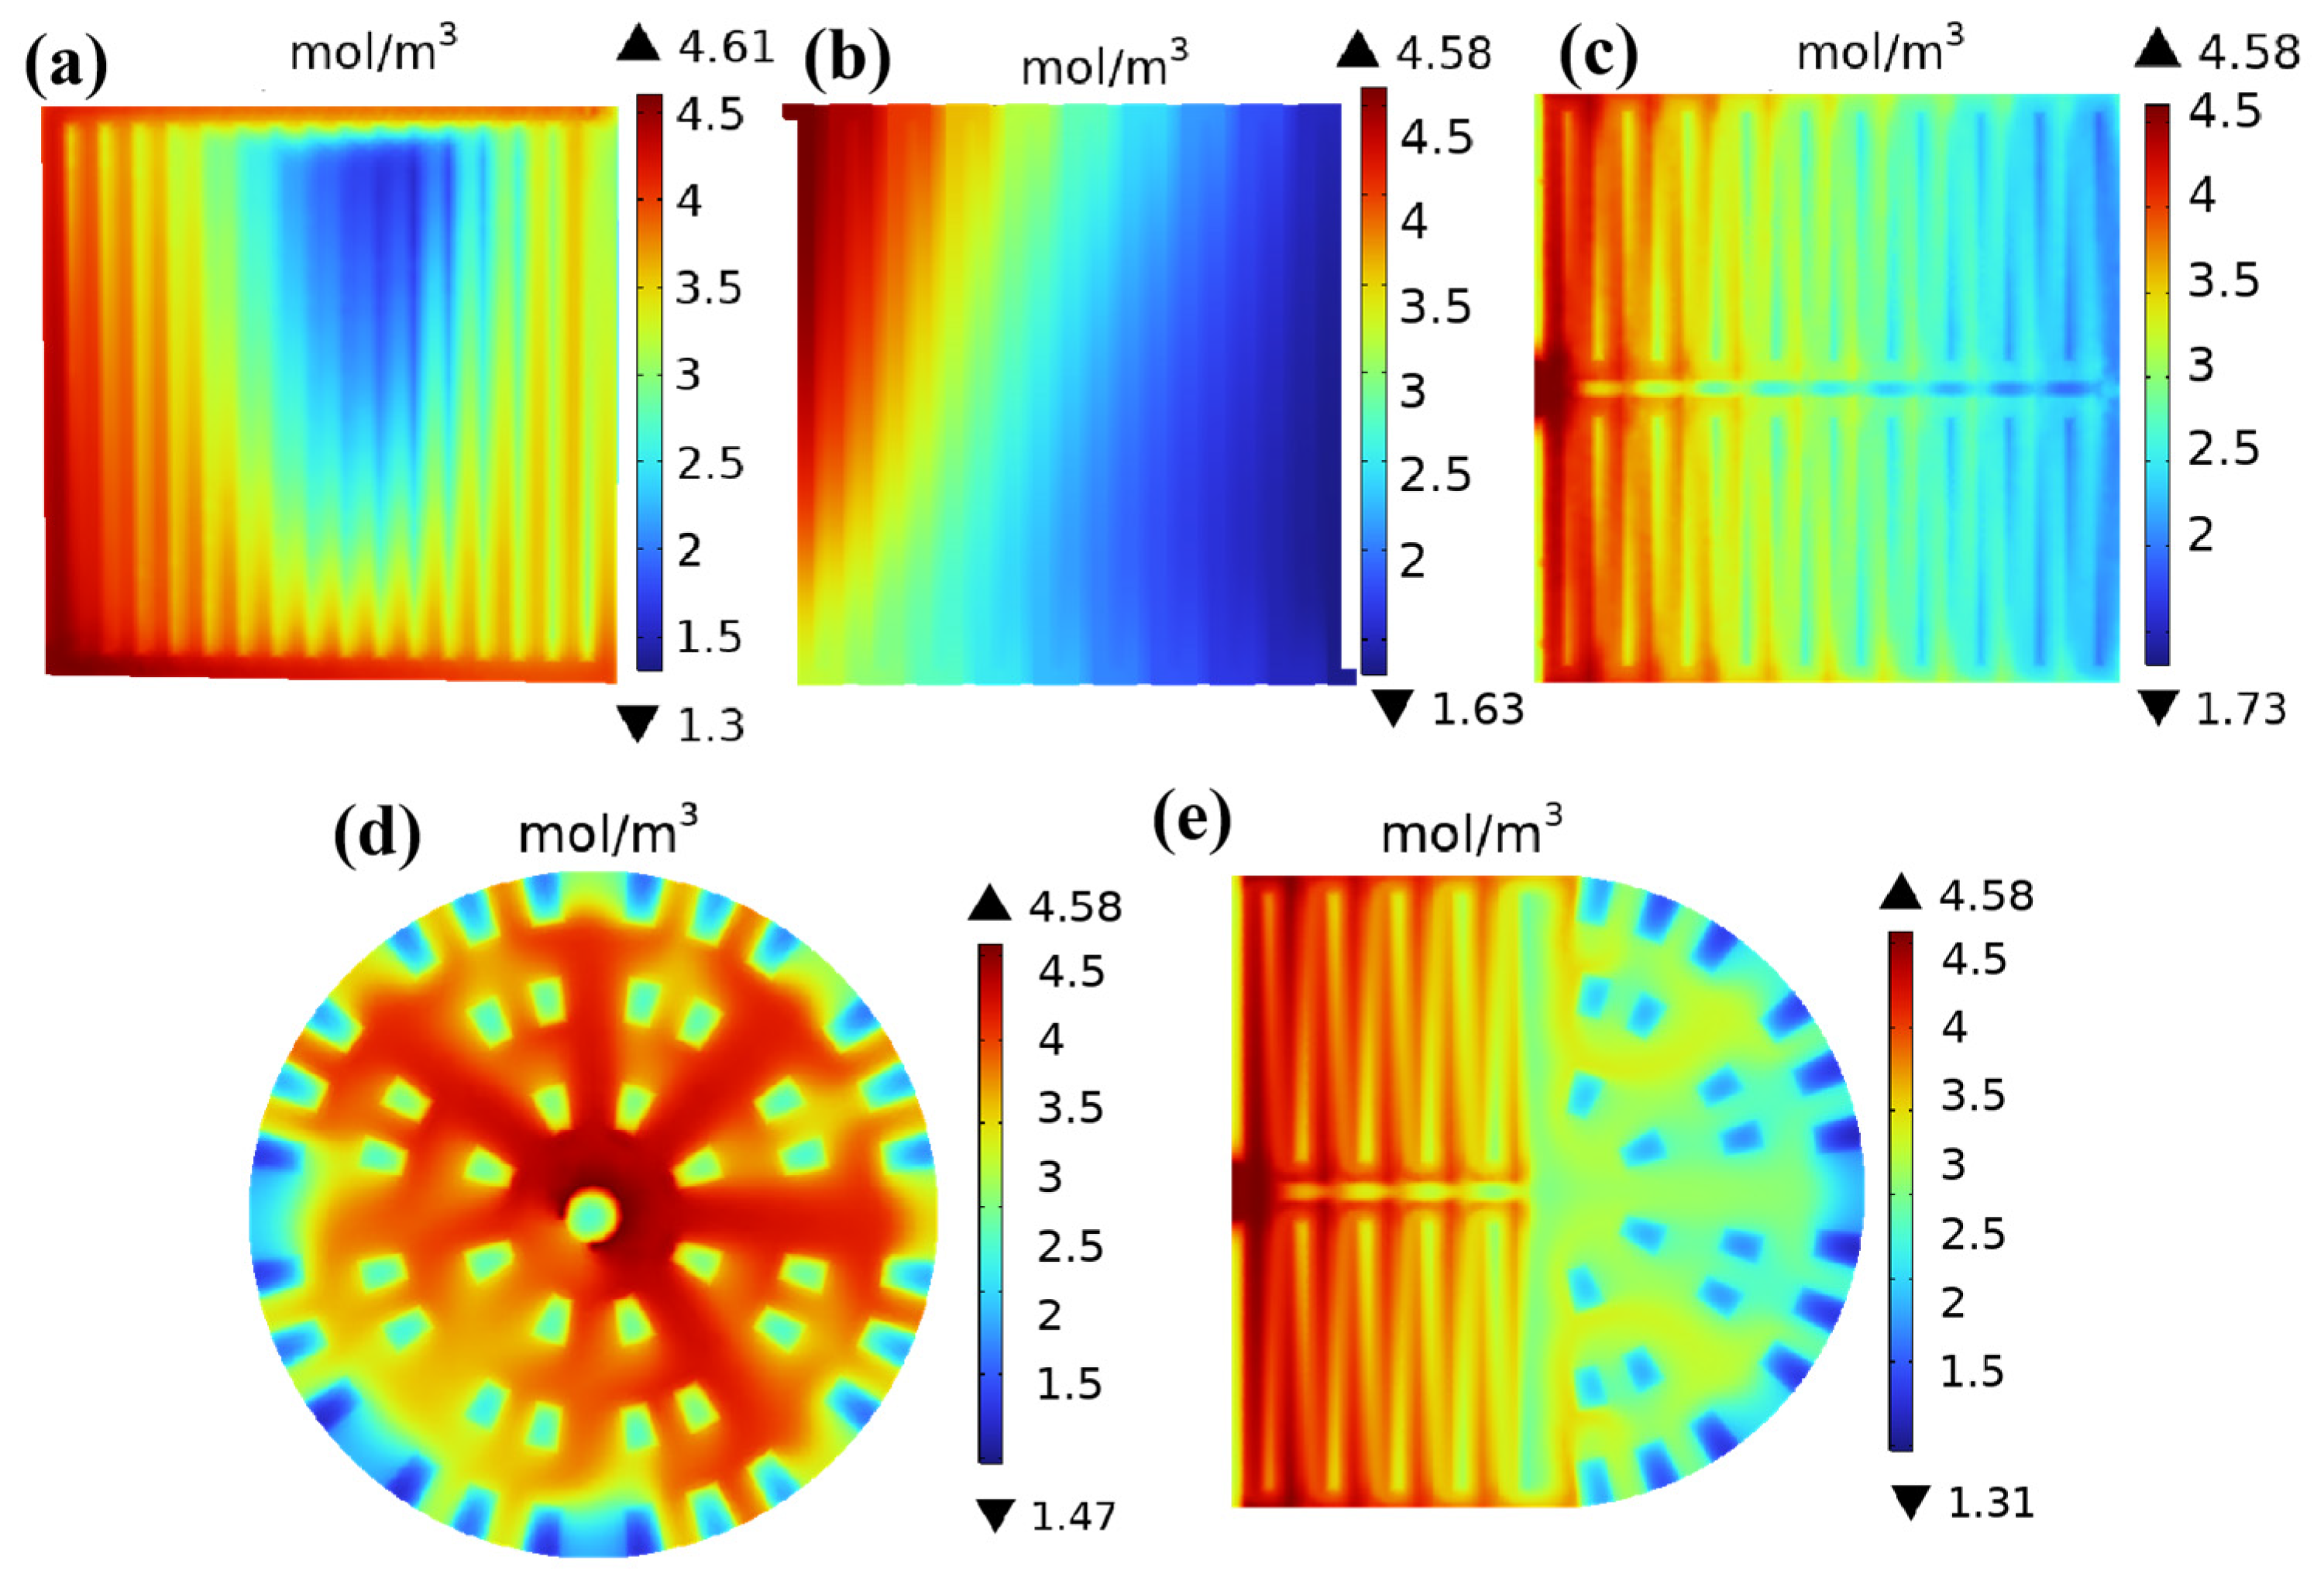
3.2. Oxygen Distribution at the Interface Between Cathode Channel and Gas Diffusion Layer with Different Channels

In the geometric design of the new bipolar plate flow field, the distribution of oxygen is also one of the key factors determining the operating cost of fuel cells. The ideal situation is for the gas to be evenly distributed in the pipeline, and the distribution of oxygen will affect the pressure drop and velocity inside the battery, as well as the discharge of by-product water after electrochemical reaction. The oxygen transport equation is used to describe the transfer and consumption process of oxygen (O2) on the cathode side. The oxygen transport equation can be expressed by the following formula:
( ρ Y O 2 ) t + · ( ρ v Y O 2 ) = ( ρ D O 2 e f f Y O 2 ) + S O 2
In the formula, ρ is gas mixture density; Y O 2 is the mass fraction of oxygen; D O 2 e f f is the effective diffusion coefficient of oxygen; v is the velocity vector; S O 2 is an oxygen consumption source term; and is the gradient operator.
The study selected the working state with a voltage of 0.6 V for research. Figure 7 shows the oxygen concentration distribution of the cathode channel gas diffusion layer for five different flow field structures at a working voltage of 0.6 V. As shown in Figure 7, the oxygen concentration gradually decreases from the inlet to the outlet of the flow channel. This is mainly because as the electrochemical reaction in the membrane electrode progresses, the reactants are gradually consumed, resulting in the lowest oxygen concentration near the outlet position. Figure 7a shows the oxygen concentration distribution in the cathode channel gas diffusion layer of a straight channel. In the straight channels, the oxygen concentration in edge channels is significantly higher than that in the middle channels, and the oxygen consumption along the gas flow direction is also relatively small in edge channels. The highest and lowest oxygen concentration values are 4.61 mol/m3 (edge channels) and 1.3 mol/m3 (middle channels), respectively. It can be seen from Figure 7a that there is a significant shortage of gas supply in the middle channels, which is due to water flooding inside the straight channels. Figure 7b shows the oxygen concentration distribution in the cathode channel gas diffusion layer of a single-serpentine channel, indicating that the oxygen concentration gradually decreases with the direction of fluid flow. The highest oxygen concentration of 4.58 mol/m3 appears at the inlet, and the lowest oxygen concentration of 1.63 mol/m3 appears at the outlet. As can be seen from Figure 7b, there is insufficient gas supply in the latter half of the serpentine channel, which is due to the single-serpentine channel being too long and the pressure drop inside the channel being too large. Figure 7c shows the oxygen concentration distribution in the cathode channel gas diffusion layer of a symmetric double-serpentine channel, which is similar to a single-serpentine flow channel. The oxygen concentration gradually decreases with the direction of fluid flow, with the highest oxygen concentration of 4.58 mol/m3 occurring at the inlet and the lowest oxygen concentration of 1.73 mol/m3 occurring at the outlet. Compared with a single-serpentine flow channel, the phenomenon of insufficient gas supply in the latter half of the symmetric double-serpentine flow channel has been significantly alleviated. Figure 7d shows the distribution of oxygen concentration in the cathode channel gas diffusion layer of the radial channel. The highest and lowest oxygen concentrations are 4.58 mol/m3 and 1.47 mol/m3, respectively. It can be seen that the lowest oxygen concentration is at the outlet, and the radial flow channel as a whole exhibits a very high oxygen concentration. This is because the inlet is located at the center of the flow field, and there is no right angle inside the channel, making the gas flow extremely smooth. This is also consistent with the characteristics of the radial flow channel that can ensure gas distribution uniformity, mentioned in the Introduction [18]. Figure 7e shows the oxygen concentration distribution in the cathode channel gas diffusion layer of the new coupling channel, with the highest and lowest oxygen concentrations being 4.58 mol/m3 and 1.31 mol/m3, respectively. From the data, the maximum oxygen concentration difference in the new coupling channel is 3.27 mol/m3, which is smaller than that of the parallel straight channel (3.31 mol/m3), but still higher than that of the single-serpentine channel (2.95 mol/m3), symmetric double-serpentine channel (2.85 mol/m3), and radial channel (3.11 mol/m3). However, it can be clearly seen from the oxygen cloud map that the oxygen concentration distribution of the new coupling flow channel structure is the most uniform. This is because the lowest oxygen concentration region of the new coupling channel only exists at the outlet and irregular ribs. The oxygen concentration distribution of all flow field structures is not significantly different in the areas near the inlet and outlet. However, in the central region, other flow field structures have varying degrees of lower oxygen concentration regions in the gas diffusion layer, where the oxygen reduction reaction rate is particularly low and the electrochemical reaction is difficult to continue. Generally speaking, the oxygen flow in the channel is only in the in-plane direction, while the irregular ribs in the latter half of the new coupling channel can generate a velocity component perpendicular to this direction, resulting in enhanced forced convection across the plane and increased oxygen transport in the gas diffusion layer. So, unlike traditional serpentine channels, the presence of radial channels in the new coupling channel can effectively prevent the phenomenon of insufficient gas concentration at the end of the channel. This also proves the fact that compared to traditional straight channels and serpentine channels, fuel cells using the new coupling channel will be cheaper because the oxygen transfer pumping power required for the flow field of the new coupling channel will be lower. Therefore, this design helps improve the thermal coupling and thermal management of the cell, ultimately enhancing the performance of the fuel cell.

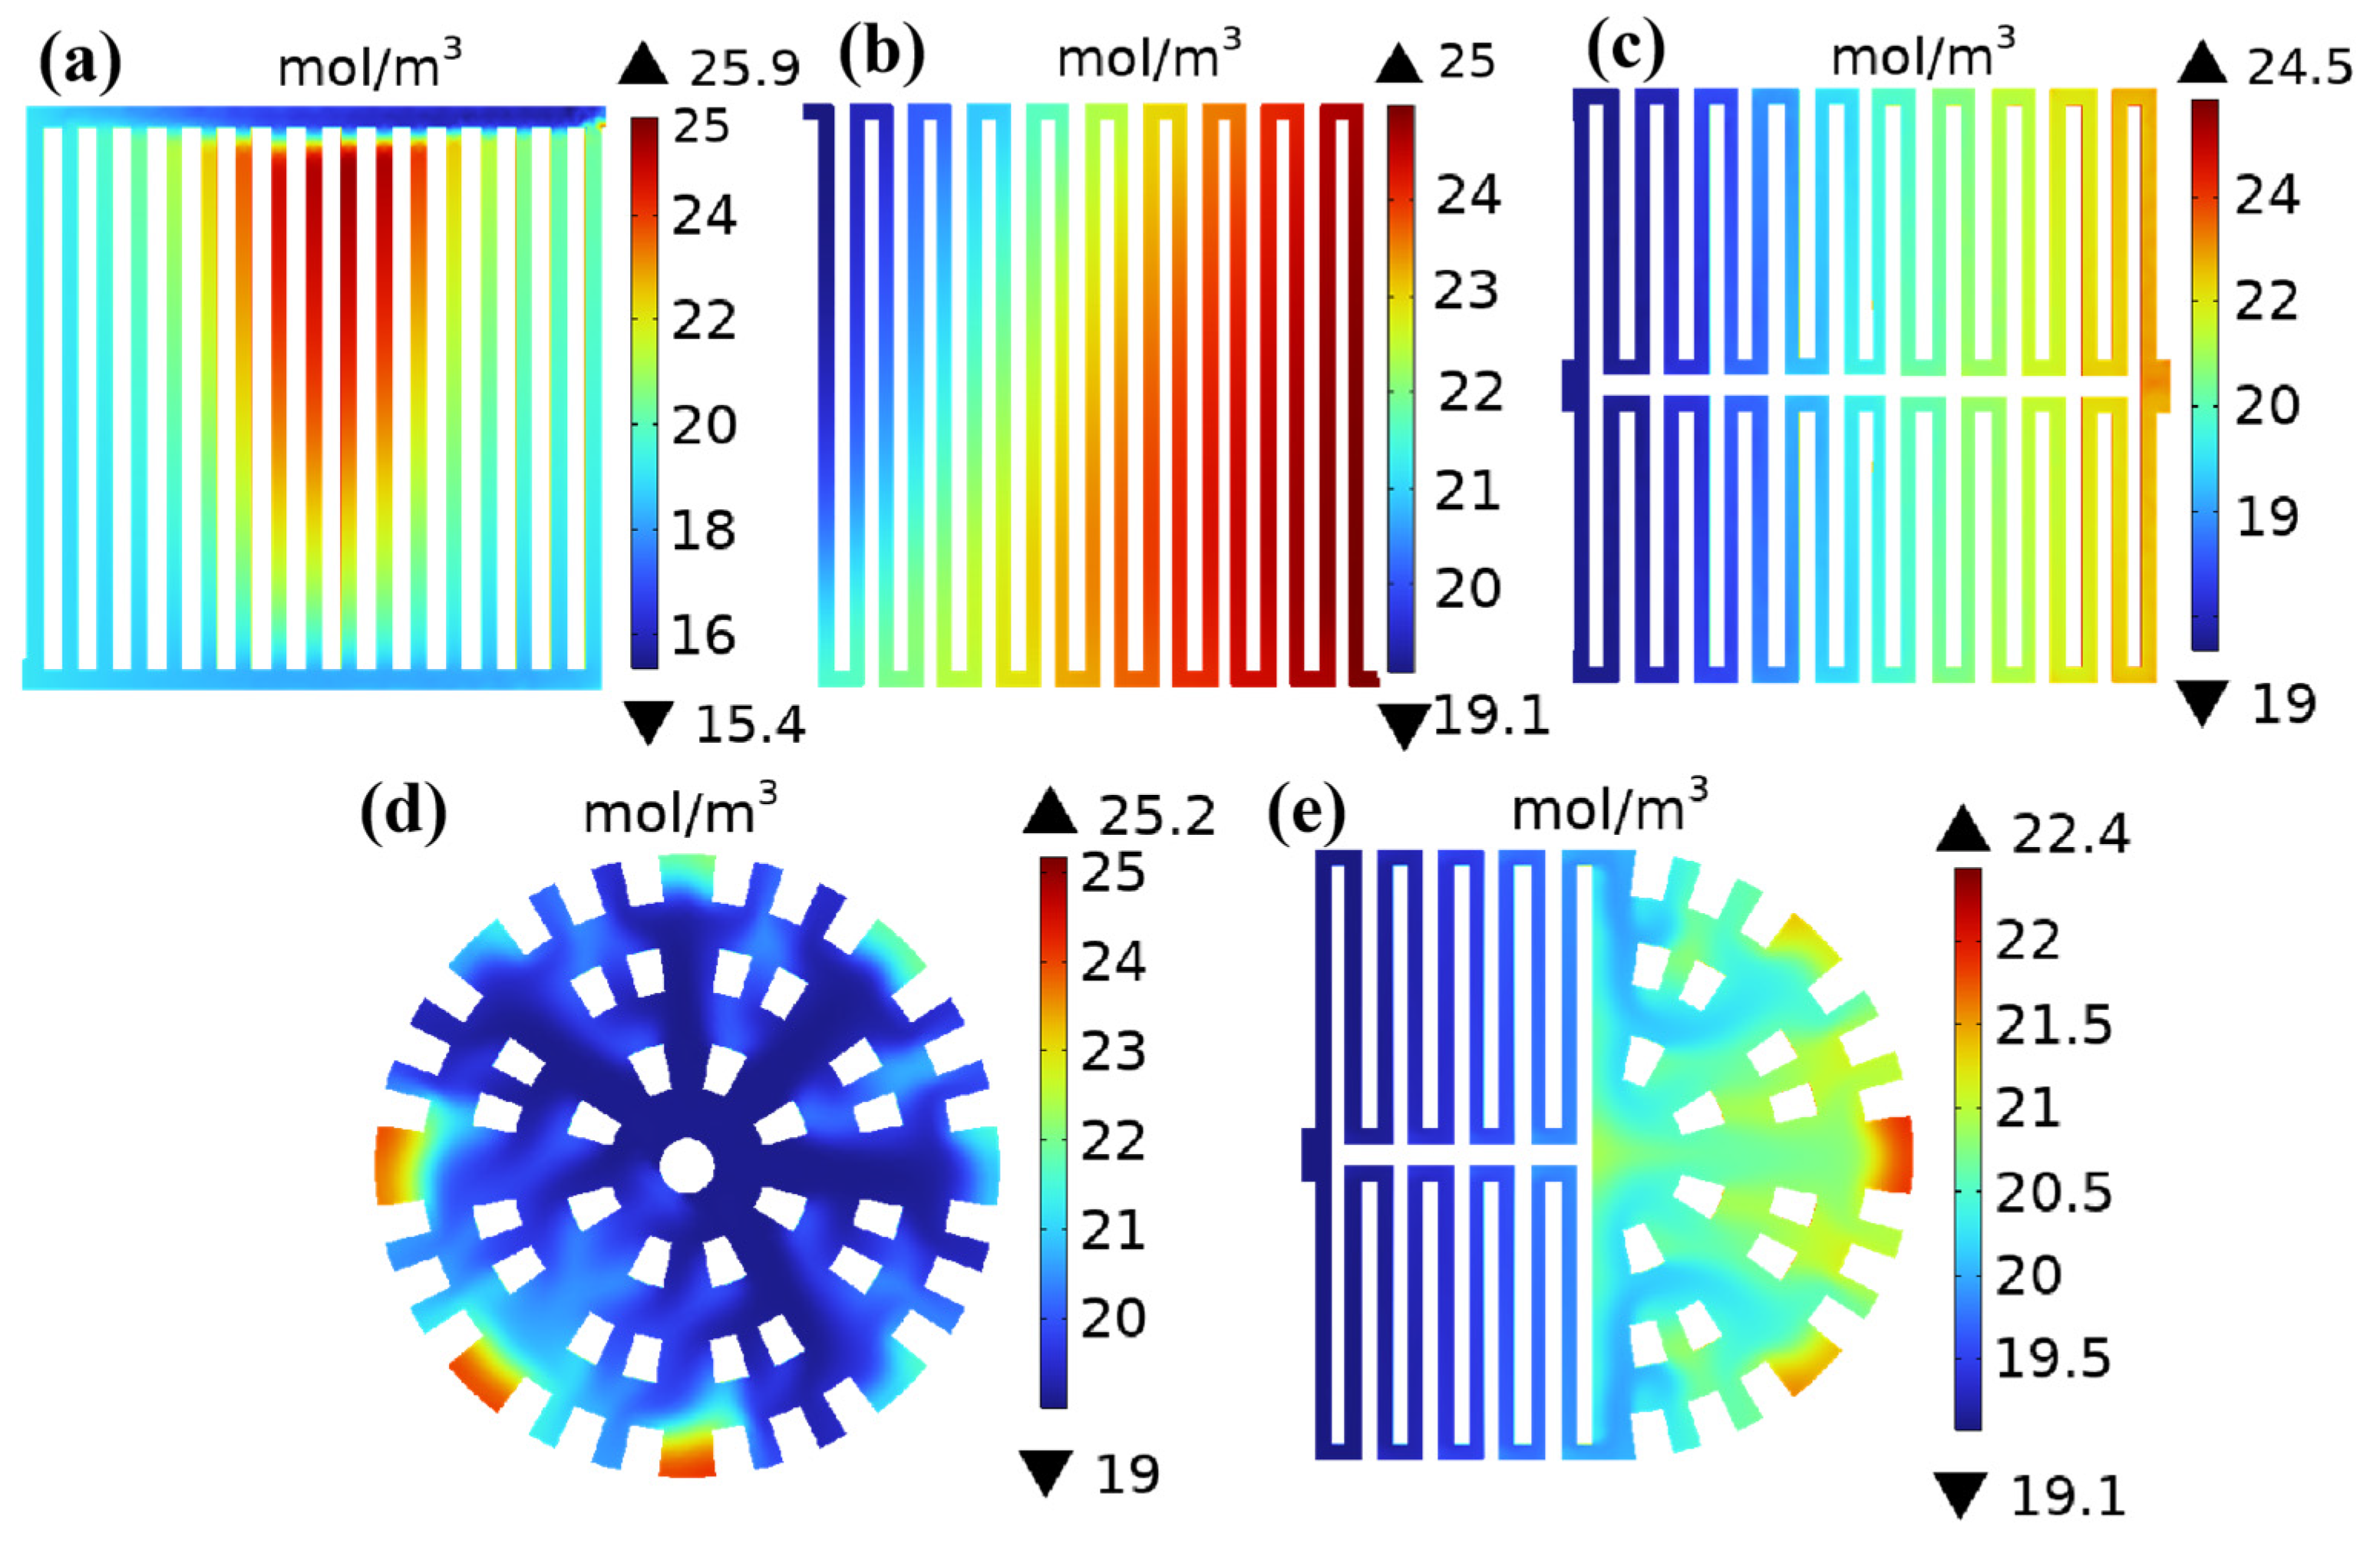
3.3. Distribution of Water Content in Cathode Channels with Different Flow Field Structures

Based on the established numerical model, simulation analysis is conducted on the generation of liquid water on the cathode side of a PEMFC model. If the water concentration is too high, the excess water generated cannot be discharged in a timely manner, which can easily cause blockage of the flow channel and affect the performance of the cell. Due to the decisive role of the structure of the cathode channel in the performance of PEMFC, this study focuses on the distribution of water concentration in the cathode side channel and analyzes the influence of the channel on the flow field of the bipolar plate in PEMFC. The transport of cathode moisture content requires simultaneous consideration of the transfer process of water vapor (H2O (v)) and liquid water (H2O (l)) and can be expressed by the following formula.
( ρ Y v ) t + · ( ρ v Y v ) = ( ρ D v e f f Y v ) + S v
In the formula, ρ is gas mixture density; Y v is the mass fraction of steam; D v e f f is the effective diffusion coefficient of steam; v is the velocity vector; S v is a steam consumption source term; and is the gradient operator.
( ε ρ l s ) t + ( ρ l K k r l μ l ρ l ) = m ˙ p h a s e
In the formula, ε is the porosity of porous media; ρ l is liquid water density; s is liquid water saturation; K is the inherent permeability of porous media; k r l is relative permeability; μ l is liquid hydrodynamic viscosity; and m ˙ p h a s e is the phase transition rate.
The difference in water concentration has a critical impact on battery performance, durability, and stability, and its importance needs to be evaluated in conjunction with specific application scenarios. Figure 8 shows the water content distribution in the cathode channel of five different flow field structures under a working voltage of 0.6 V. As shown in Figure 8, the water content in the cathode channel of the five different flow field structures generally increases gradually from the inlet to the outlet direction. This is mainly due to the increasing amount of water produced as the reaction progresses, and the water content gradually accumulates as the reaction gas moves towards the outlet, resulting in higher water content closer to the outlet. Figure 8a shows the distribution of water content in the cathode channel of a straight channel, with a maximum water concentration of 25.9 mol/m3 and a minimum water concentration of 15.4 mol/m3; Figure 8b shows the distribution of water content in the cathode channel of a single-serpentine channel, with a maximum water concentration of 25 mol/m3 and a minimum water concentration of 19.1 mol/m3; Figure 8c shows the water content distribution in the cathode channel of a symmetric double-serpentine channel, with the highest water concentration value of 24.5 mol/m3 and the lowest water concentration value of 19 mol/m3; Figure 8d shows the distribution of water content in the cathode channel of the radial channel, with the highest water concentration value of 25.2 mol/m3 and the lowest water concentration value of 19 mol/m3; and Figure 8e shows the water content distribution in the cathode channel of the new coupling channel. It can be clearly observed that the highest water concentration value occurs near the outlet, at 22.4 mol/m3, and the lowest water concentration value occurs near the inlet, at 19.1 mol/m3. According to the cloud map shown, it can be clearly seen that water flooding has occurred inside the parallel straight channel, which is also the reason for the low oxygen concentration in the cathode channel gas diffusion layer of the parallel straight channel (Figure 7a). The higher water content greatly reduces the diffusion efficiency of oxygen inside the parallel straight channel. The asymmetry of the geometric structure of single- and double-serpentine channels improves the drainage performance of parallel straight channels. The maximum water concentration differences in the cathode channels with different channel structures are 10.5 mol/m3, 5.9 mol/m3, 5.5 mol/m3, 6.2 mol/m3, and 3.3 mol/m3, respectively. It can be seen that the maximum concentration difference in the new coupling channel is the smallest, which also indicates that its overall water content distribution is the most uniform. This is because the cross-sectional area of the second half of the flow channel of the new coupling flow field is gradually decreasing, causing the flow velocity of the gas participating in the reaction to gradually increase, forcing more oxygen to reach the diffusion layer and catalytic layer, improving the quality transfer of oxygen [19]. At the same time, the increase in gas flow velocity will help remove liquid water, prevent water flooding at the cathode of the fuel cell, ensure ideal water management inside the cell, and improve the performance of the PEMFC at a low cell voltage, reducing the influence of concentration polarization and thus enhancing the overall performance of the fuel cell [20].

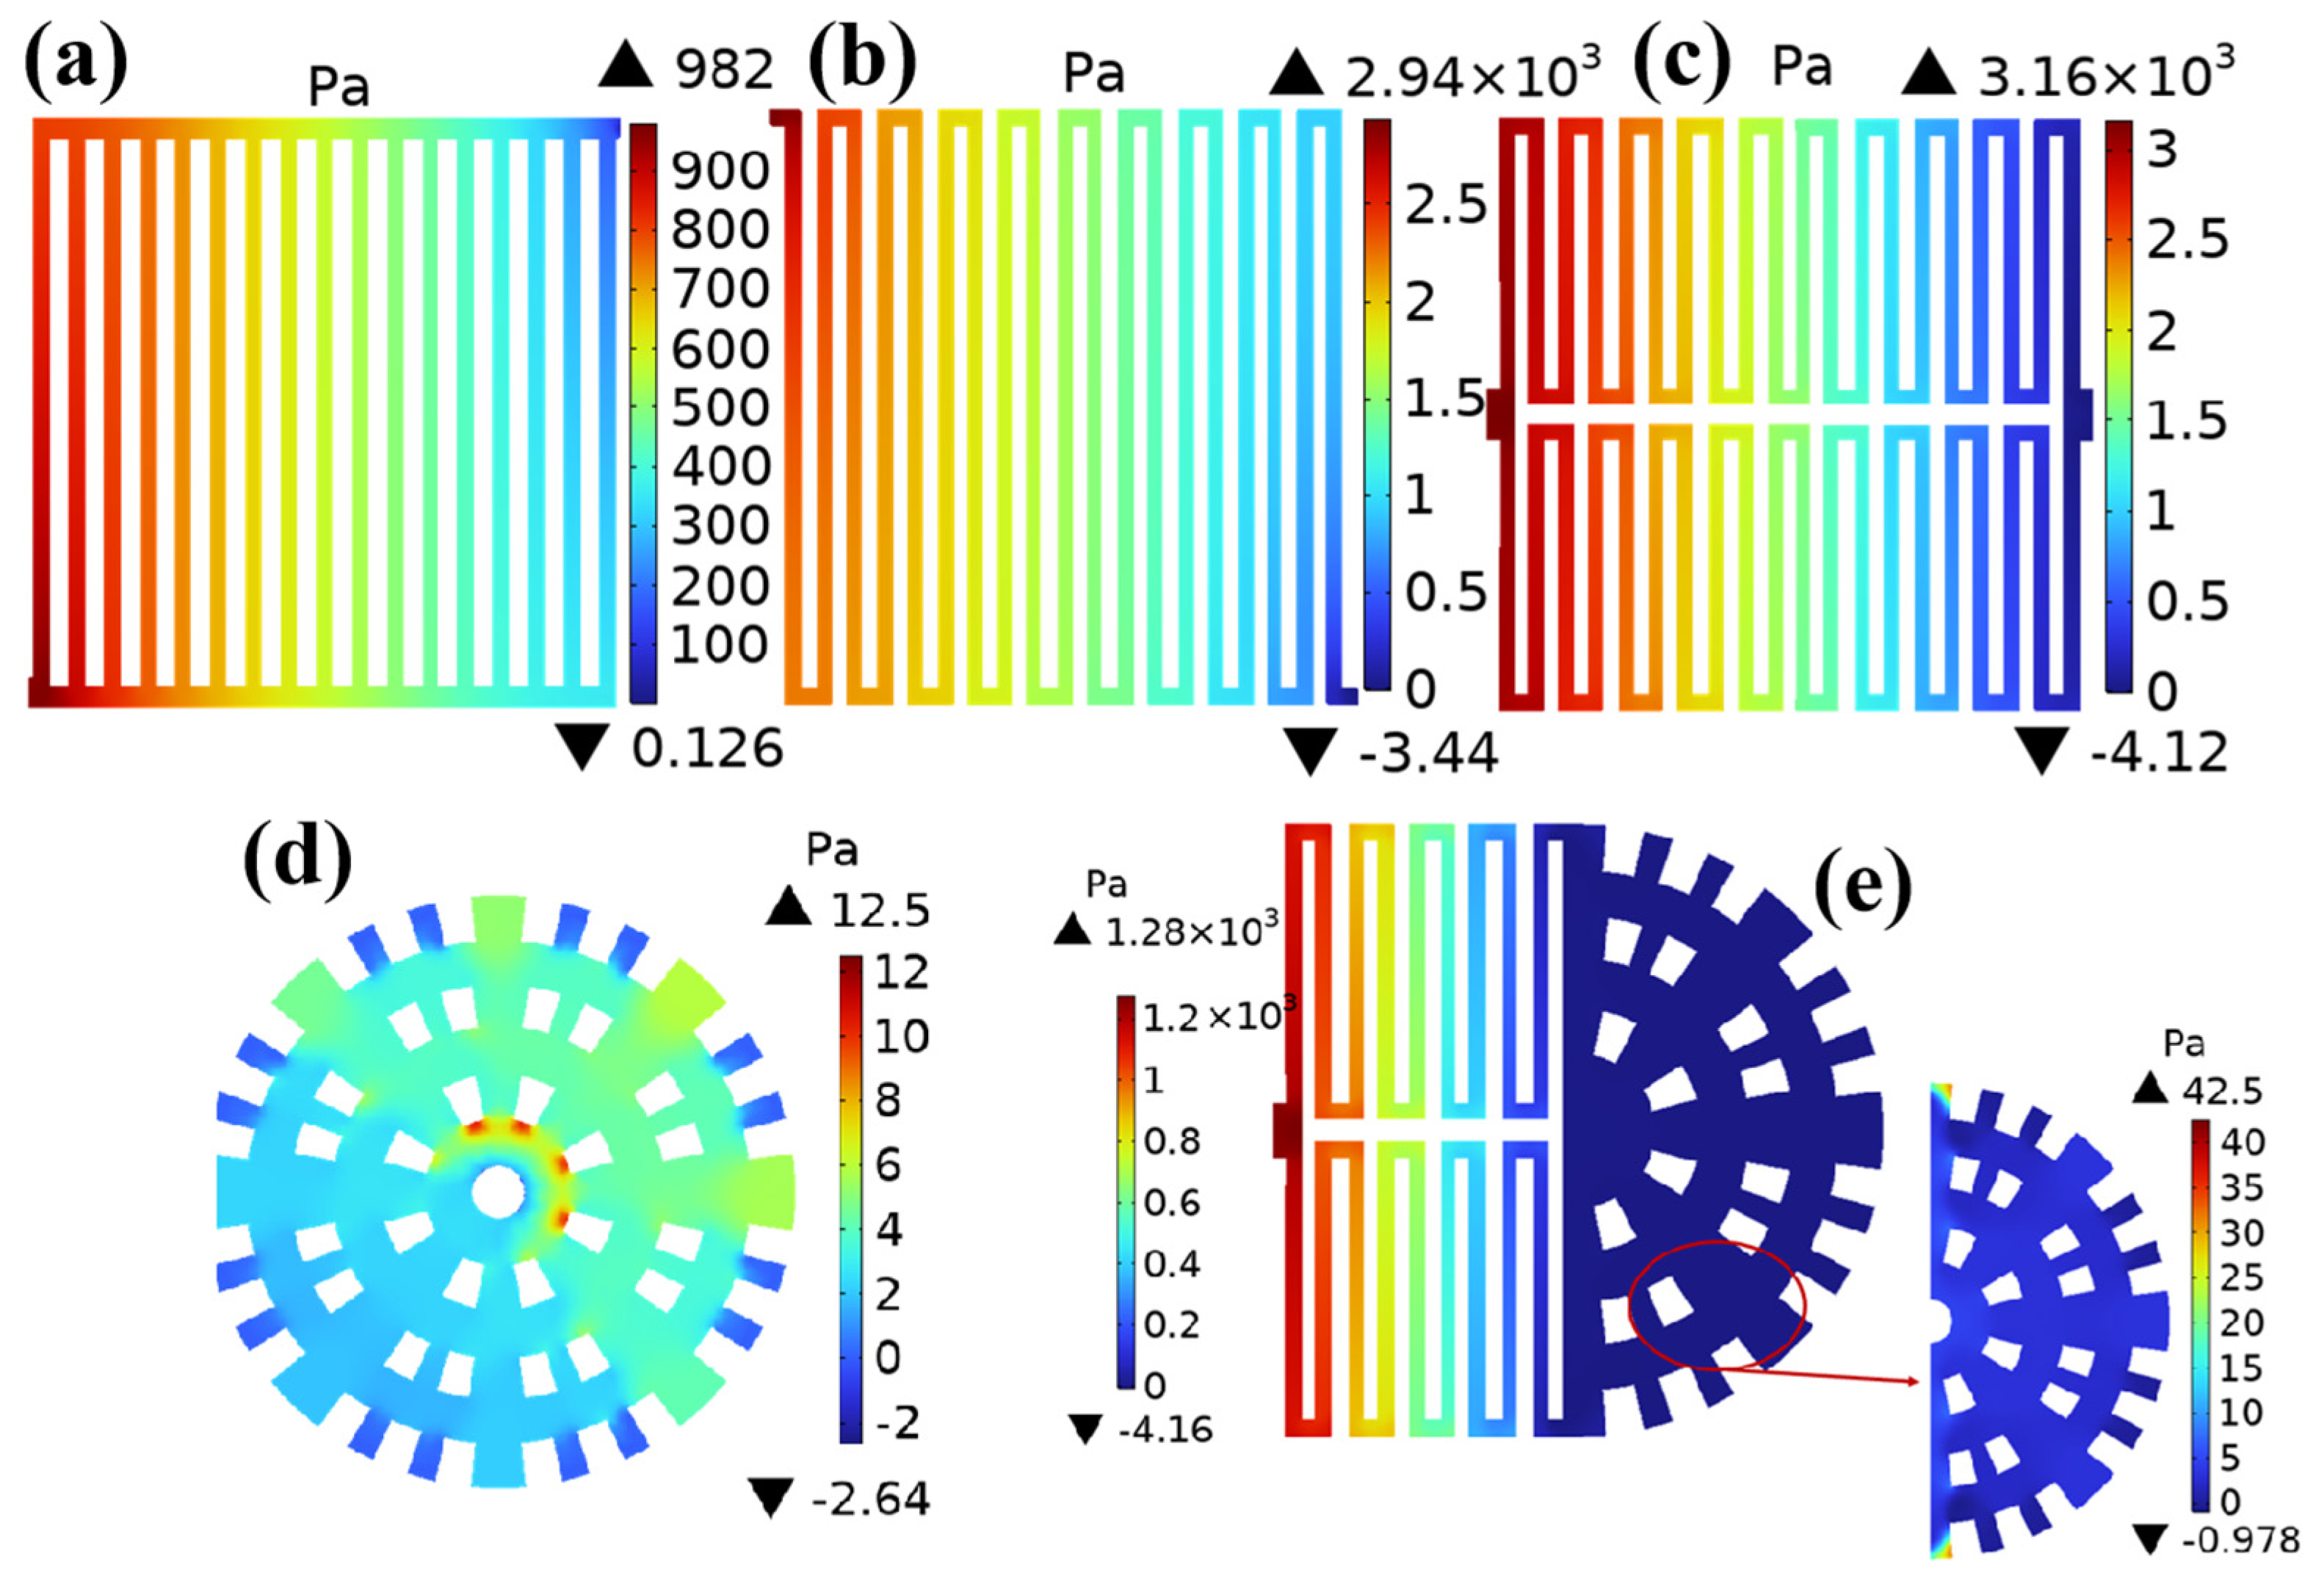
3.4. Cathodic Channel Pressure Drop with Different Flow Field Structures

The working pressure of the PEMFC has a significant impact on the battery reaction. Increasing the pressure is beneficial for improving the mass transfer rate of the reaction gas from the electrode diffusion layer to the catalytic layer and reducing concentration polarization. From a dynamic perspective, increasing gas pressure is also beneficial for improving exchange current density and reducing activation overpotential: under the same overpotential, an increase in current density leads to improved PEMFC performance, accompanied by more heat generation, which will increase the internal temperature of the PEMFC. Channels with a high pressure drop require greater pumping power to transport reaction gases, resulting in significant parasitic energy loss and reduced PEMFC efficiency [21]. Therefore, pressure drop is also one of the important considerations in channel design [22].
Figure 9 shows the inlet and outlet pressures and pressure drops of five different channels in the cathode channel under a working voltage of 0.6 V. The pressure drops of the parallel straight channel, single-serpentine channel, symmetric double-serpentine channel, radial channel, and new coupling channel are 981.874 Pa, 2943.44 Pa, 3164.12 Pa, 15.14 Pa, and 1284.16 Pa, respectively. Through data comparison, it was found that the pressure drop of the radial channel reduces nearly 2.5 times compared to that of the symmetric double-serpentine channel. This is because gas is diverted after entering the flow field. It is already diverted before entering the flow channel. Moreover, regardless of whether it is a single-serpentine flow channel or a symmetric double-serpentine flow channel, the internal gas path is longer and there are more inflection points, so the pressure in the flow channel has significantly decreased. Due to the structural design of traditional parallel straight channels and serpentine channels being in the form of parallel channels, fuel cells are prone to water blockage in certain channels during actual operation, which can affect the performance of the entire channel. Even if one of the channels exhibits the above phenomenon, the other channel can still work normally in the symmetric double-serpentine channel, thus improving its performance. The new coupling channel, as a coupling of dual flow fields, has a pressure drop of 1284.16 Pa, which has significantly decreased and is only higher than the pressure drop of parallel straight channels. From the pressure drop distribution of the cathode channel with five different flow field structures shown in Figure 9, it can be seen that the pressure drop of the new coupling channel is significantly better than that of the single-serpentine channel and the symmetric double-serpentine channel. As reported, it is known that an appropriate pressure drop can effectively discharge the liquid water generated during the operation of the PEMFC, but an excessive pressure drop leads to significant power loss in the air compressor. The significant change in pressure drop of the new coupling flow channel is essentially the result of the interaction between the gas flow modes of the two channels. Due to the non-monotonic variation in the coupling flow channel, its pressure drop depends on the influence of the diversion effect and resistance distribution on the dominant region [23]. Overall, the new coupling flow field can reduce the power loss of the air compressor less, while also having good drainage performance.

3.5. Current Density at the Interface Between Cathode Gas Diffusion Layer and Catalyst Layer with Different Flow Field Structures

Current density is the intensity of current per unit area when passing through a PEMFC, which can be expressed in A/cm2. Figure 10 shows the current density distribution at the interface between cathode gas diffusion layer and catalyst layer for five different channels under a working voltage of 0.6 V. Figure 10a shows the current density at the interface between the cathode gas diffusion layer and the catalyst layer in a straight channel. As shown in the figure, the maximum current density of the straight channel is 0.703 A/cm2, and the minimum current density is 0.079 A/cm2; Figure 10b shows the current density of the cathode gas diffusion layer catalyst layer in the single-serpentine channel, with a maximum current density value of 1.05 A/cm2 and a minimum current density value of −1.21 A/cm2; and Figure 8c shows the current density of the cathode gas diffusion layer–catalyst layer in the symmetric double-serpentine channel. It can be seen that the distribution is relatively uniform, with the highest current density value of 1.66 A/cm2 and the lowest current density value of −1.6 A/cm2; Figure 10d shows the current density of the cathode gas diffusion layer–catalyst layer in the radial channel, with the highest current density value of 2.52 A/cm2 and the lowest current density value of −0.343 A/cm2; and Figure 8e shows the current density of the cathode gas diffusion layer–catalyst layer in the new coupling channel. It can be clearly seen that the abrupt high current density is almost non-existent, and the impact can even be ignored, with a current density of 0.751 A/cm2 and a minimum current density of 0.244 A/cm2. Through image comparison and data analysis, it can be seen that the overall current density distribution at the interface between the cathode gas diffusion layer and the catalyst layer of the new coupling channel is superior to that of the parallel straight channel and the single- and double-serpentine channels. The circuit density distribution is relatively uniform and has no abrupt changes. Therefore, it can also be predicted that in the future, the concentration polarization of PEMFCs using this new coupling flow field will be relatively small, and their performance will be improved compared to PEMFCs using straight channel and single/double-serpentine channels [24]. The higher the oxygen concentration, the higher the current density, and the better the performance of the PEMFC.
The current density results in Figure 10 show a positive correlation with oxygen concentration distribution (Figure 7). This is consistent with the viewpoint stated in published research articles; that is, the concentration of reactants on the catalyst surface is closely related to the current density, and the higher the current density, the lower the concentration of reactants. Meanwhile, by comparing and observing Figure 10, it can be observed that the current density in the area directly below the region with high oxygen content in these five different flow field structures is significantly lower than that in the area directly below the rib plate.

3.6. Temperature at the Interface with Different Flow Field Structures

The thermal management of PEMFCs is a key factor affecting their performance and lifespan. The design of the flow channel directly affects the distribution of reaction gases and heat dissipation efficiency. At present, parallel flow channels, serpentine flow channels, and radial flow channels are the three mainstream designs, but there is still insufficient systematic comparative research on their heat dissipation performance. This study presents a new coupling flow channel to enhance the overall performance of proton exchange membrane fuel cells.
Numerical simulation was defined as follows: at the inlets, the gas flow velocity was set as 0.6 m/s, with specified temperature, humidity, and pressure parameters. The outlet adopted a pressure boundary condition, typically maintained at atmospheric pressure (101 kPa). For thermal management, the convective heat transfer coefficient for air-cooling is set to 25 W/(m2K). These simulation parameters were carefully selected based on actual experimental conditions that we established in Section 2.5. The temperature distribution of five different flow field structures is compared in Figure 11. The figure shows that the maximum temperatures of straight channel, single-serpentine channel, symmetric double-serpentine channel, radial channel, and new coupling channel are 83 °C, 80.1 °C, 71.8 °C, 81.4 °C, and 80.8 °C, respectively. The double-serpentine channel has the best heat dissipation performance and high temperature uniformity, because the gas path is the longest, the forced convection heat transfer is sufficient, and the turbulent flow is enhanced at the intersection area of the channel, breaking the thermal boundary layer. The direct current gas path is short, and convective heat transfer is weak, resulting in the worst heat dissipation effect and localized high temperatures. Although the heat dissipation of the new coupling channel is not as good as that of the double-serpentine channel, its temperature distribution is relatively uniform. Considering factors such as heat dissipation requirements and pressure drop limitations, it is still an acceptable channel.

4. Conclusions

A new coupling channel is proposed based on the advantages of fuel cell structures with double-serpentine channels and radial channels. Through numerical simulation analysis of the polarization curves, power density curves, oxygen and water concentrations in the cathode channel, and pressure drop of the straight channel, single-serpentine channel, symmetric double-serpentine channel, radial channel, and new coupling channel, the following conclusions were drawn:
(1) Compared with the traditional straight channel, single-serpentine channel, symmetric double-serpentine channel, and radial channel, the new coupling channel exhibits better output performance. The ultimate current density of the new coupling channel is 1.46749 A/cm2, which is 67.36% and 10.43% higher than the traditional straight channel and the single-serpentine channel, respectively.
(2) The new coupling channel alleviates the problems of insufficient oxygen supply and uneven distribution of water concentration in the rear channel of the straight channel, single-serpentine channel, and symmetric double-serpentine channel. The oxygen concentration distribution uniformity of the new coupling channel is the best and can enhance the transmission of oxygen on the surface of the catalytic layer. The proton exchange membrane of the new coupling flow field has a uniform water content distribution, so it can be predicted that it can effectively improve the performance of PEMFCs.
(3) The new coupling channel, as a coupling of dual flow fields, has a pressure drop of 1284.16 Pa, which has significantly decreased and is only higher than the pressure drop of the parallel straight channel.
(4) The maximum power density of the new coupled flow field is 0.47901 W/cm2, and it can be clearly seen from the power density curve that its output performance is significantly improved compared to the other flow fields.
(5) Although the heat dissipation of the new coupling channel is not as good as that of the double-serpentine channel, its temperature distribution is relatively uniform. Considering factors such as heat dissipation requirements and pressure drop limitations, it is still an acceptable channel.

Author Contributions

Conceptualization, Q.S.; methodology, Q.S.; software, S.Y.; validation, S.Y.; formal analysis, H.L.; resources, Y.J.; data curation, D.C.; writing—original draft preparation, Q.S. and S.Y.; writing—review and editing, Q.S.; visualization, G.W.; project administration, Y.L.; funding acquisition, Q.S. All authors have read and agreed to the published version of the manuscript.

Funding

This research was funded by Science Research Project of Hebei Education Department, grant number QN2022160, the National Natural Science Foundation of China, Grant number 52375284, and the Major Support Project in Hebei Province, Grant number 24294501Z.

Data Availability Statement

The raw data supporting the conclusions of this article will be made available by the authors on request.

Conflicts of Interest

The authors declare no conflicts of interest.

Abbreviations

The following abbreviations are used in this manuscript:
PEMFCProton exchange membrane fuel cell
MEAMembrane electrode assembly
GDLGas diffusion layer

References

  1. Lu, K.; Zhang, J.; Ding, H.; Wang, Z.; Pan, X. Numerical and experimental investigation of 3D flow field bipolar plates for PEMFCs by metal 3D printing. Fuel 2024, 357, 129699. [Google Scholar] [CrossRef]
  2. Bégot, S.; Harel, F.; Lepiller, V.; Saidouni, W.H. A new cooling circuit and its control strategies for the thermal management of PEMFC in rapid startup application. Int. J. Hydrogen Energy 2023, 48, 344–352. [Google Scholar] [CrossRef]
  3. Lee, H.; Jeong, S.; Song, J.; Kim, M.; Chu, C.; Lee, Y.; Kim, D.; Kim, M. Influence of PEMFC degradation on its performance in different temperature and relative humidity conditions. J. Mech. Sci. Technol. 2023, 37, 420–431. [Google Scholar] [CrossRef]
  4. Sahin, H. Hydrogen refueling of a fuel cell electric vehicle. Int. J. Hydrogen Energy 2024, 75, 604–612. [Google Scholar] [CrossRef]
  5. Zhu, Q.-C.; Ma, J.; Huang, J.-H.; Mao, D.-Y.; Wang, K.-X. Realizing long-cycling solid-state Li-CO2 batteries using Zn-doped LATP ceramic electrolytes. Chem. Eng. J. 2024, 482, 148977. [Google Scholar] [CrossRef]
  6. Wang, Y.D.; Meyer, Q.; Tang, K.; McClure, J.E.; White, R.T.; Kelly, S.T.; Crawford, M.M.; Iacoviello, F.; Brett, D.J.L.; Shearing, P.R.; et al. Large-scale physically accurate modelling of real proton exchange membrane fuel cell with deep learning. Nat. Commun. 2023, 14, 112–124. [Google Scholar] [CrossRef]
  7. Wilberforce, T.; Olabi, A.G.; Monopoli, D.; Dassisti, M.; Sayed, E.T.; Abdelkareem, M.A. Design optimization of proton exchange membrane fuel cell bipolar plate. Energy Convers. Manag. 2023, 277, 350–361. [Google Scholar] [CrossRef]
  8. Müller, M.-V.; Giorgio, M.; Hausmann, P.; Kinlechner, L.; Heinzel, A.; Schwämmlein, J. Investigation of the effect of carbon post- vs. pre-coated metallic bipolar plates for PEMFCs-start-up and shut-down. Int. J. Hydrogen Energy 2022, 47, 133–142. [Google Scholar] [CrossRef]
  9. Xu, Q.; Zhao, J.; Chen, Y.; Liu, S.; Wang, Z. Effects of gas permeation on the sealing performance of PEMFC stacks. Int. J. Hydrogen Energy 2021, 46, 734–742. [Google Scholar] [CrossRef]
  10. Paul, C.O.; Ikram, B.B.; Wilfred, E.; Paul, C.U. Nafion degradation mechanisms in proton exchange membrane fuel cell (PEMFC) system: A review. Int. J. Hydrogen Energy 2021, 46, 556–562. [Google Scholar]
  11. Zhou, Y.; Chen, B. Investigation of optimization and evaluation criteria for flow field in proton exchange membrane fuel cell: A critical review. Renew. Sustain. Energy Rev. 2023, 185, 113584. [Google Scholar] [CrossRef]
  12. Mojica, F.; Rahman, A.M.; Mora, M.J.; Ocon, D.J.; Chuang, A.Y.P. Experimental study of three channel designs with model comparison in a PEM fuel cell. Fuel Cells 2020, 20, 51–60. [Google Scholar] [CrossRef]
  13. Rahimi-Esbo, M.; Rahgoshay, S.; Hassani, M.; Dadashi, K.F. Novel design and numerical evaluating of a cooling flow field in PEMFC with metallic bipolar plates. Int. J. Hydrogen Energy 2020, 43, 678–682. [Google Scholar] [CrossRef]
  14. Liu, Y.; Xu, Y.; Liu, J.; Xiang, M.; Sun, B.; Ya, Y.; Cheng, X. Effects of bipolar plate flow channel configuration on thermal-electric performance of direct ammonia solid oxide fuel cell: Part II—Promoting in-cell ammonia endothermic decomposition via a novel parallel S-type channel arrangement. Int. J. Hydrogen Energy 2024, 55, 1217–1233. [Google Scholar] [CrossRef]
  15. Peng, L.; Yi, P.; Lai, X. Design and manufacturing of stainless steel bipolar plates for proton exchange membrane fuel cells. Int. J. Hydrogen Energy 2014, 39, 21127–21153. [Google Scholar] [CrossRef]
  16. Zhang, S.; Liu, S.; Xu, H.; Liu, G.; Wang, K. Performance of proton exchange membrane fuel cells with honeycomb-like flow channel design. Energy 2022, 239, 122102. [Google Scholar] [CrossRef]
  17. Zuo, Q.; Ouyang, Y.; Chen, W.; Li, Q.; Ma, Y.; Xia, X.; Ouyang, M. Flow characteristics analysis and performance evaluation of a novel rotary proton exchange membrane fuel cell. Int. J. Hydrogen Energy 2024, 50, 1391–1405. [Google Scholar] [CrossRef]
  18. Wang, J. Barriers of scaling-up fuel cells: Cost, durability and reliability. Energy 2015, 80, 560–571. [Google Scholar] [CrossRef]
  19. Lee, Y.I.; Kim, M.S. Effect of gradient anode flow field designs on polymer electrolyte membrane fuel cells. Int. J. Hydrogen Energy 2024, 50, 1324–1337. [Google Scholar] [CrossRef]
  20. Chen, C.; Wang, C.; Zhang, Z. Numerical investigation of the water transport and performance of proton exchange membrane fuel cell with an imitating river flow field. Energy Convers. Manag. 2023, 276, 116532. [Google Scholar] [CrossRef]
  21. Li, W.; Zhang, Q.; Wang, C.; Yan, X.; Shen, S.; Xia, G.; Zhu, F.; Zhang, J. Experimental and numerical analysis of a three-dimensional flow field for PEMFCs. Appl. Energy 2017, 195, 278–288. [Google Scholar] [CrossRef]
  22. Ceballos, J.O.; Ordoñez, L.C.; Sierra, J.M. Numerical simulation of a PEM fuel cell: Effect of tortuosity parameters on the construction of polarization curves. Int. J. Hydrogen Energy 2022, 47, 30291–30302. [Google Scholar] [CrossRef]
  23. Zhou, Y.; Chen, B.; Meng, K.; Zhou, H.; Chen, W.; Zhang, N.; Deng, Q.; Yang, G.; Tu, Z. Optimization and evaluation criteria of water-gas transport performance in wave flow channel for proton exchange membrane fuel cell. Int. J. Hydrogen Energy 2023, 48, 20717–20733. [Google Scholar] [CrossRef]
  24. Celik, E.; Karagoz, I. Performance assessment of a four-pass serpentine proton exchange membrane fuel cell with non-humidified cathode and cell state estimation without special measurement. Int. J. Hydrogen Energy 2022, 47, 9382–9394. [Google Scholar] [CrossRef]
Figure 1. The geometric model calculation domain of the new coupling channel in the PEMFC.
Energies 18 04068 g001
Figure 2. The schematic diagram of the planar structure of the new coupling flow channel.
Energies 18 04068 g002
Figure 3. Three-dimensional models of PEMFCs with five different flow channels.
Energies 18 04068 g003
Figure 4. The variation in current density with the number of grids.
Energies 18 04068 g004
Figure 5. Simulation and experimental comparison of PEMFC polarization curve with straight channel.
Energies 18 04068 g005
Figure 6. Polarization plot (a) and power density plot (b) of five channels in bipolar plate.
Energies 18 04068 g006
Figure 7. Oxygen distribution in the cathode flow channel gas diffusion layer with five different flow field structures: (a) straight channel; (b) single-serpentine channel; (c) symmetric double-serpentine channel; (d) radial channel; and (e) new coupling channel.
Energies 18 04068 g007
Figure 8. Water content distribution in the cathode flow channel with five different flow field structures: (a) straight channel; (b) single-serpentine channel; (c) symmetric double-serpentine channel; (d) radial channel; and (e) new coupling channel.
Energies 18 04068 g008
Figure 9. Distribution of pressure drop in the cathode flow passage with five different flow field structures: (a) straight channel; (b) single-serpentine channel; (c) symmetric double-serpentine channel; (d) radial channel; (e) and new coupling channel.
Energies 18 04068 g009
Figure 10. The interfacial current density of cathode gas diffusion layer–catalyst layer with five different flow field structures: (a) straight channel; (b) single-serpentine channel; (c) symmetric double-serpentine channel; (d) radial channel; and (e) new coupling channel.
Energies 18 04068 g010
Figure 11. The temperature with five different flow field structures: (a) straight channel; (b) single-serpentine channel; (c) symmetric double-serpentine channel; (d) radial channel; (e) and new coupling channel.
Energies 18 04068 g011
Table 1. The boundary conditions of the model.
No.Boundary Condition Description
1The anode gas diffusion layer (GDL) boundary facing the flow pattern rib is set to zero potential, and the corresponding boundary on the cathode side is set to battery potential. All other external boundaries are insulated
2All wall boundary conditions are slip free
3Gas laminar flow into the inlet of the anode and cathode
4Negative and anode outlet pressure conditions ρo = 0
5The gases of the anode (H2) and cathode (O2) are ideal gases
6The flow of gas in the channel is laminar and incompressible
7All porous media are considered isotropic and uniform
8Ignore the gravity effect
9Neglecting resistance potential drop in solid components
10All internal boundaries are continuous
Table 2. Main operating parameters.
ParametersValueUnit
GDL porosity0.4-
GDL penetration rate1 × 10−13m2
GDL conductivity222S/m
Anode inlet velocity2m/s
Cathode feed velocity2m/s
Molecular mass of H20.002kg/mol
Molecular mass of N20.028kg/mol
Molecular mass of H2O0.018kg/mol
Molecular mass of O20.032kg/mol
H2-H2O binary diffusion coefficient1.1684 × 10−4m2/s
N2-H2O binary diffusion coefficient3.2682 × 10−5m2/s
O2-N2 binary diffusion coefficient3.0466 × 10−5m2/s
O2-H2O binary diffusion coefficient3.5807 × 10−5m2/s
Oxygen reference concentration40.88mol/m3
Hydrogen reference concentration40.88mol/m3
Volume fraction of electrolyte phase0.3-
Porous electrode gas diffusion volume fraction0.3-
Permeability (porous electrode)2 × 10⁻⁴m2
Disclaimer/Publisher’s Note: The statements, opinions and data contained in all publications are solely those of the individual author(s) and contributor(s) and not of MDPI and/or the editor(s). MDPI and/or the editor(s) disclaim responsibility for any injury to people or property resulting from any ideas, methods, instructions or products referred to in the content.

