
Cooperative Game-Theoretic Scheduling for Low-Carbon Integrated Energy Systems with P2G–CCS Synergy

Abstract
1. Introduction
2. Multi-Agent IES
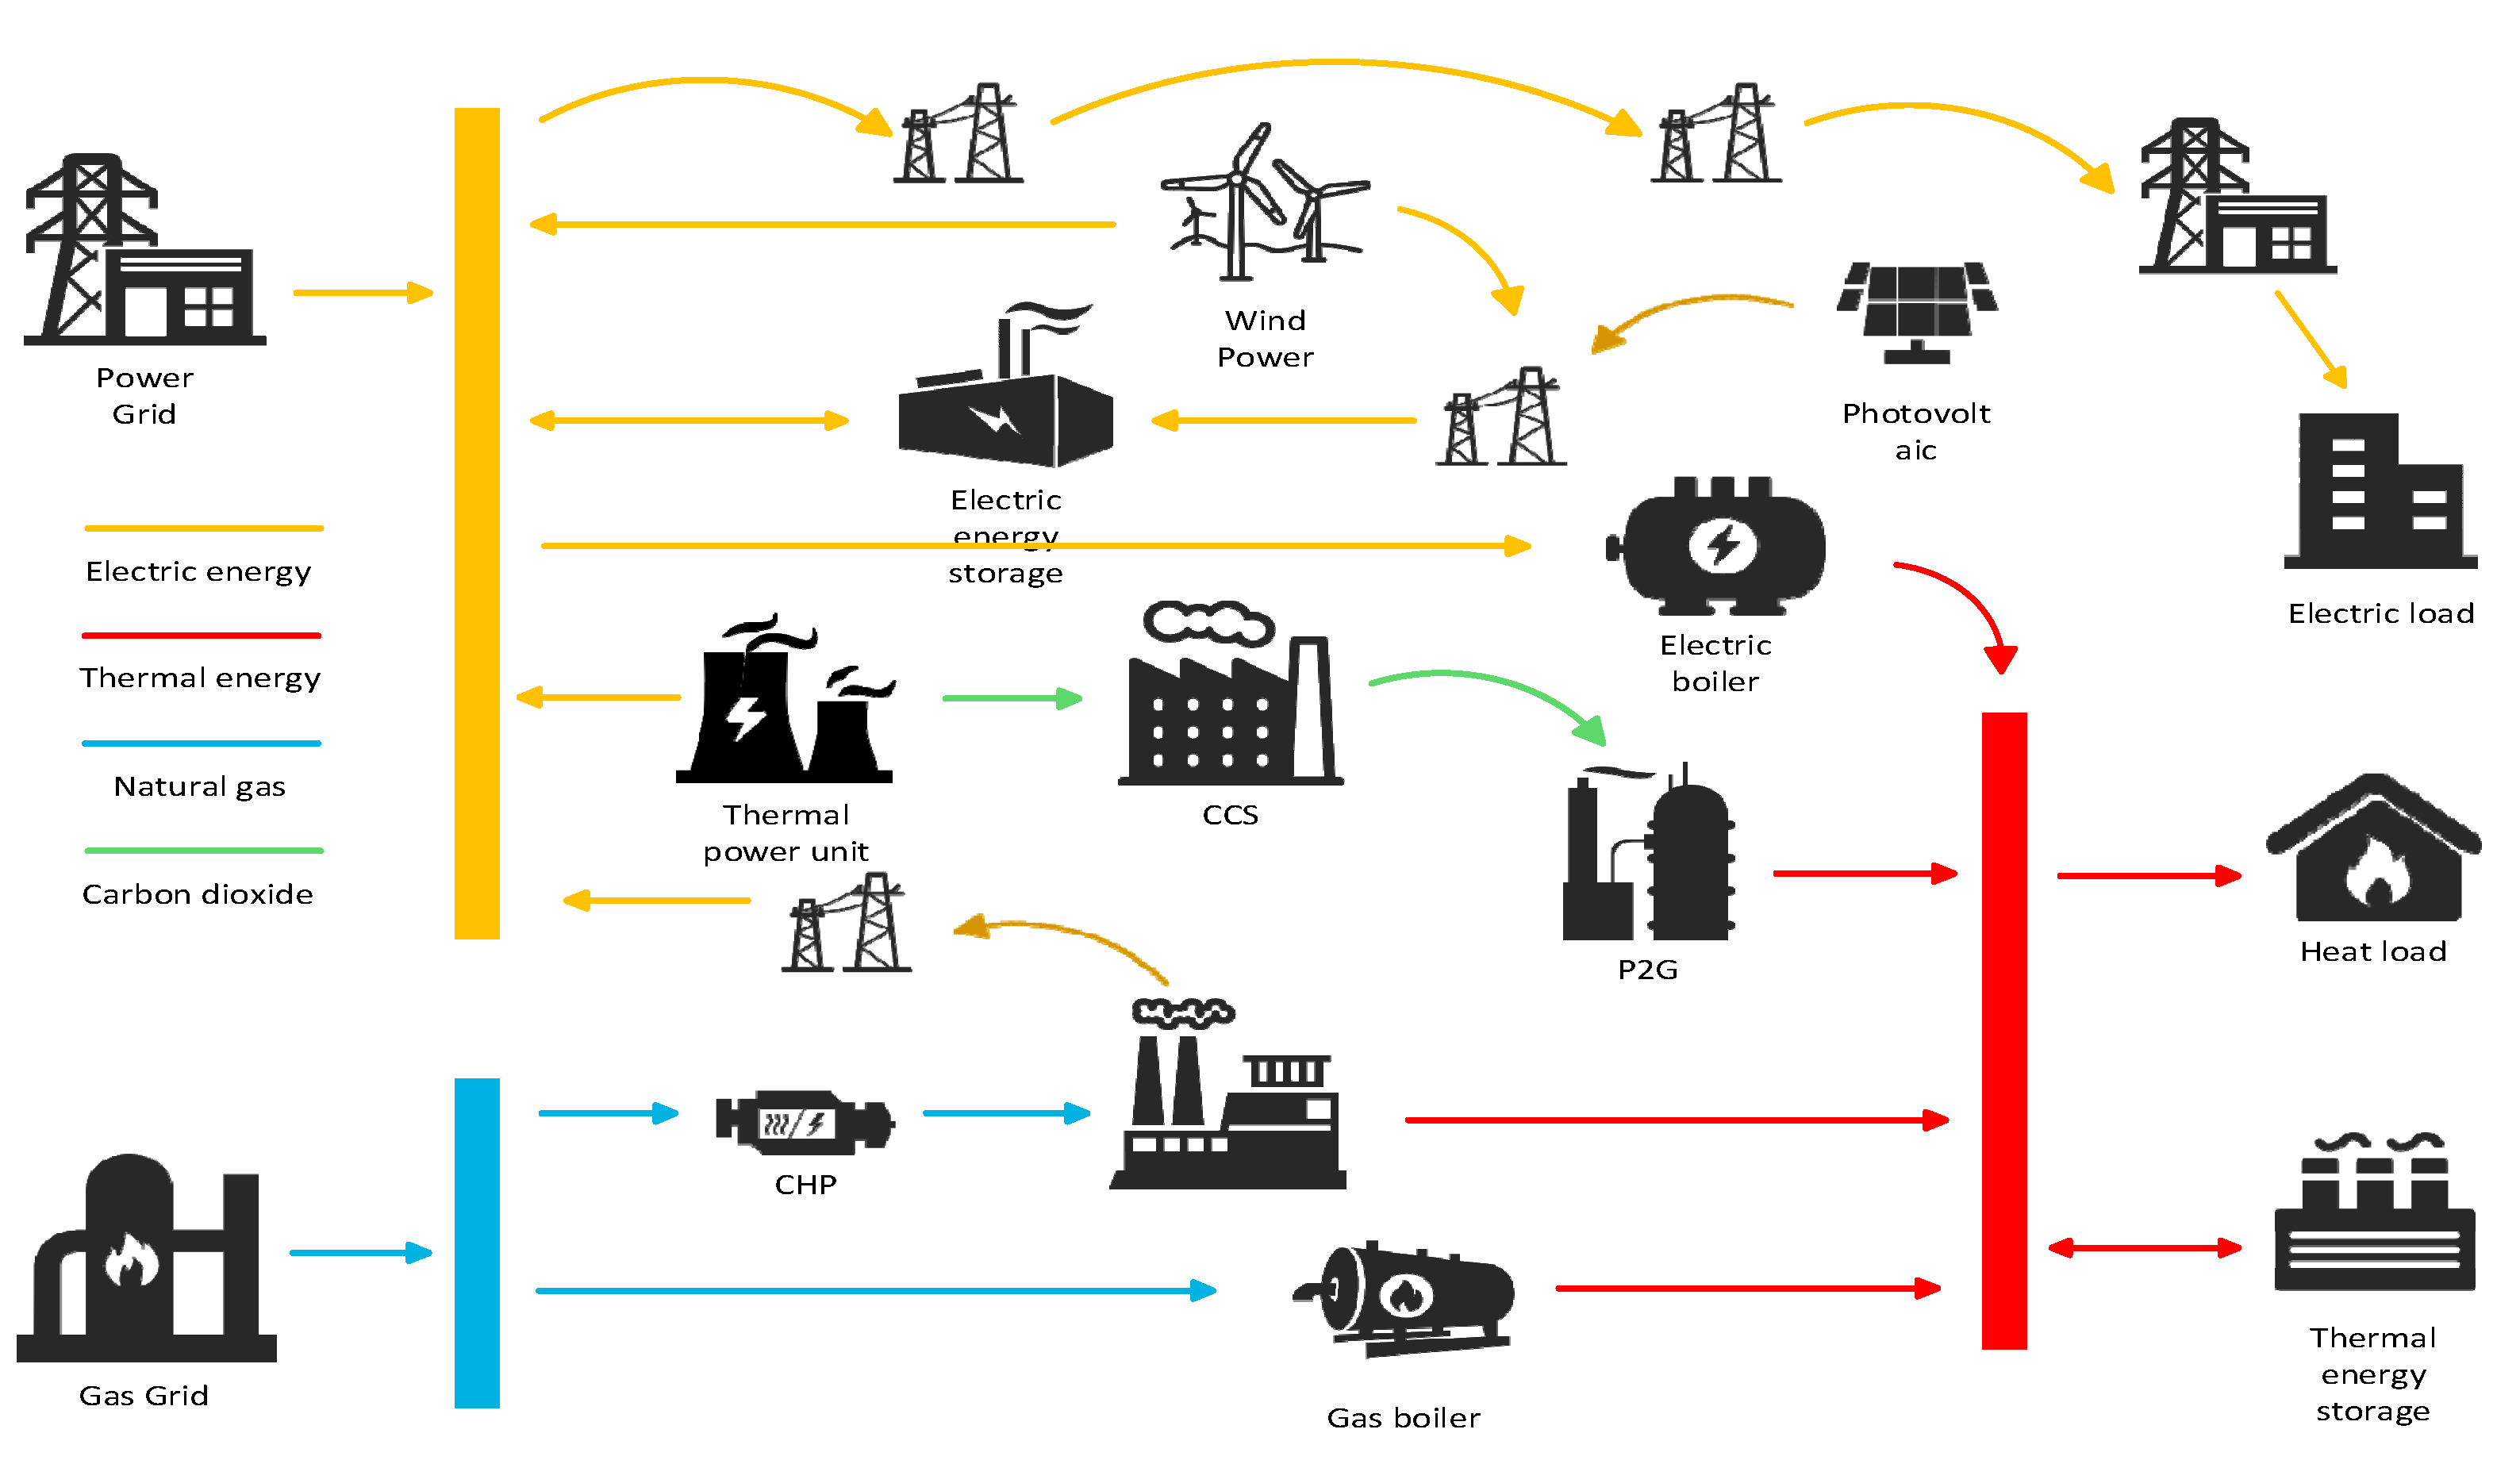
2.1. IES Architecture
2.2. IES Mathematical Model
2.2.1. P2G Equipment
2.2.2. CHP Equipment
2.2.3. CCS Facilities
2.2.4. Gas Boilers and Electric Boilers
2.2.5. Electrical and Thermal Energy Storage
- (1)
- Electrical energy storage:where is the charge state of the lithium battery at moment t; is the charging power of the lithium battery at moment t; is the discharging power of the lithium battery at moment t; and are the charging and discharging efficiencies of the lithium battery, respectively; and are the charging and discharging states of the lithium battery, respectively; and are the maximum and minimum values of the charging and discharging power of the lithium battery, respectively; and are the minimum and maximum charging states of the lithium battery, respectively; and and refer to the charging state of the lithium battery in the charging and discharging cycle at the initial moment and the final moment, respectively.
- (2)
- Thermal energy storage:where and are the heat storage and heat release states of the equipment, respectively; and are the heat storage and heat release power of the equipment at time t, respectively; and and are the maximum and minimum values of the heat storage and heat release power of the equipment, respectively.
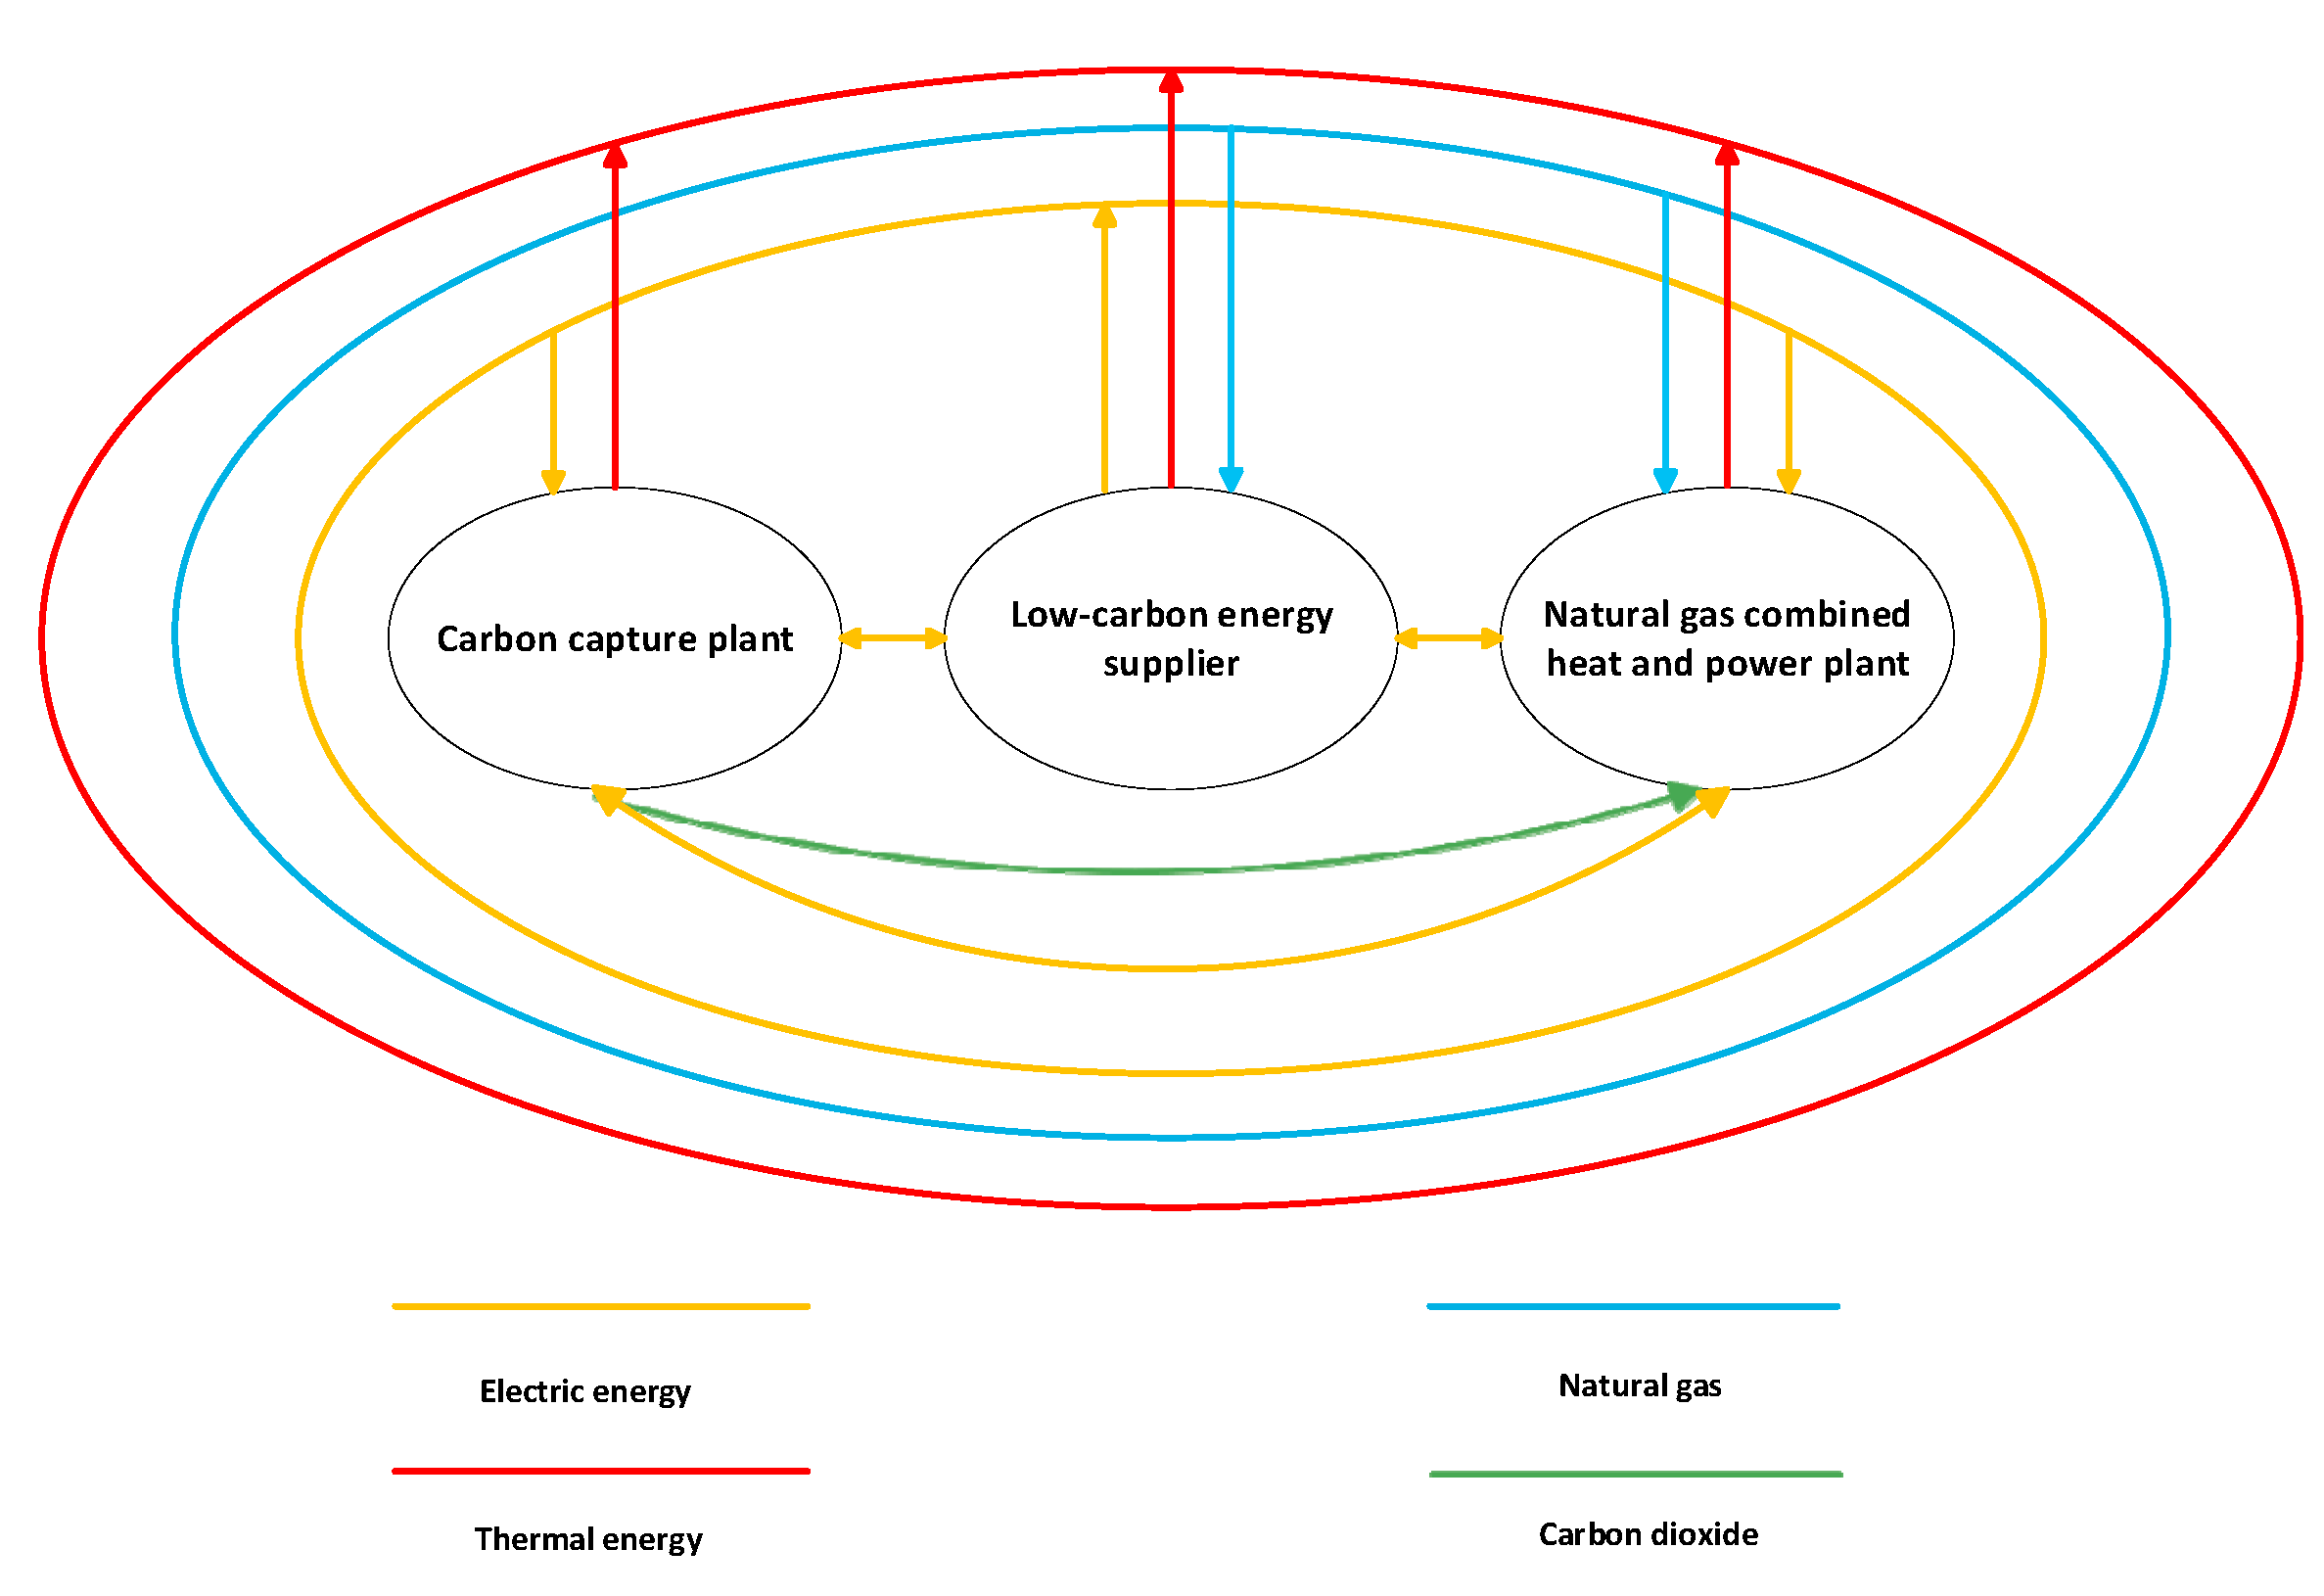
3. Cooperative Game-Based Multi-Agent Operational Model for IES
- (1)
- Individual rationality: Each participant must receive a higher benefit from cooperation than it would achieve individually.
- (2)
- Collective rationality: The total benefits of cooperation must exceed the sum of the benefits each participant would achieve acting alone.
- (1)
- Renewable energy suppliers joining the cooperative union can sell electricity to the grid, supply power directly to carbon capture and electricity-to-gas facilities at an agreed price, and pay the corresponding over-the-grid charges.
- (2)
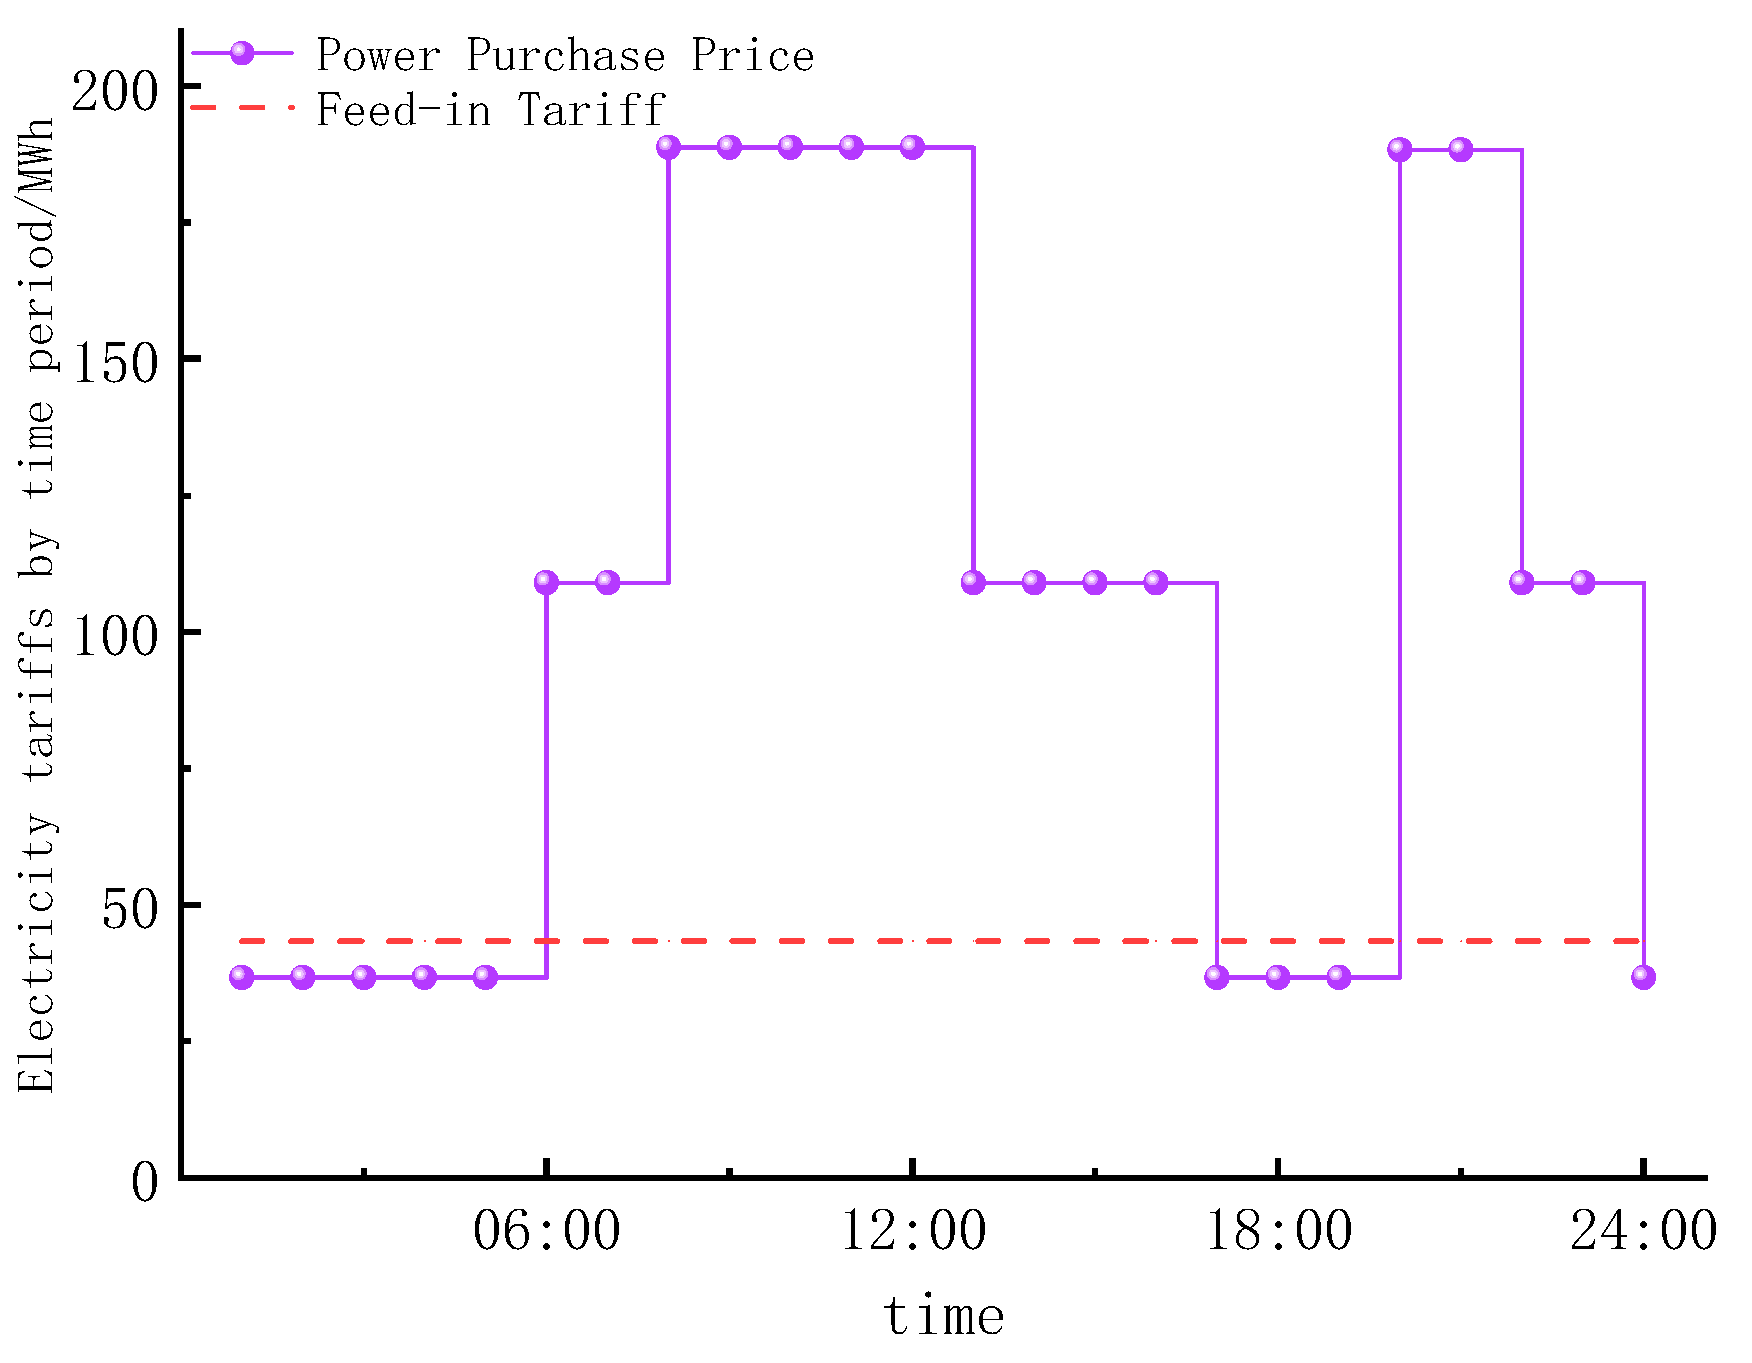
- Carbon capture power plants in the union can purchase electricity directly from renewable energy suppliers to meet the energy needs of their carbon capture equipment, in addition to buying power from the grid. Decisions on electricity procurement are influenced by varying electricity rates at different times of day. The captured CO2 can also be sold to CCS facilities.
- (3)
- Cogeneration plants in the union can buy electricity directly from renewable energy suppliers to meet the energy needs of their P2G facilities, in addition to grid power purchases. Purchasing decisions follow time-of-use tariffs.
- (4)
- Entities not part of the cooperative union are not allowed to transmit electricity to or from other participants. Thermal power plants—which hold a monopoly on heat services within the system—only account for their operating costs, excluding revenues from heat sales.
3.1. Objective Function and Constraints
3.1.1. Optimization Objective
3.1.2. Restrictive Condition
- (1)
- Renewable energy capacity constraints:
- (2)
- Union operational constraints:
- (3)
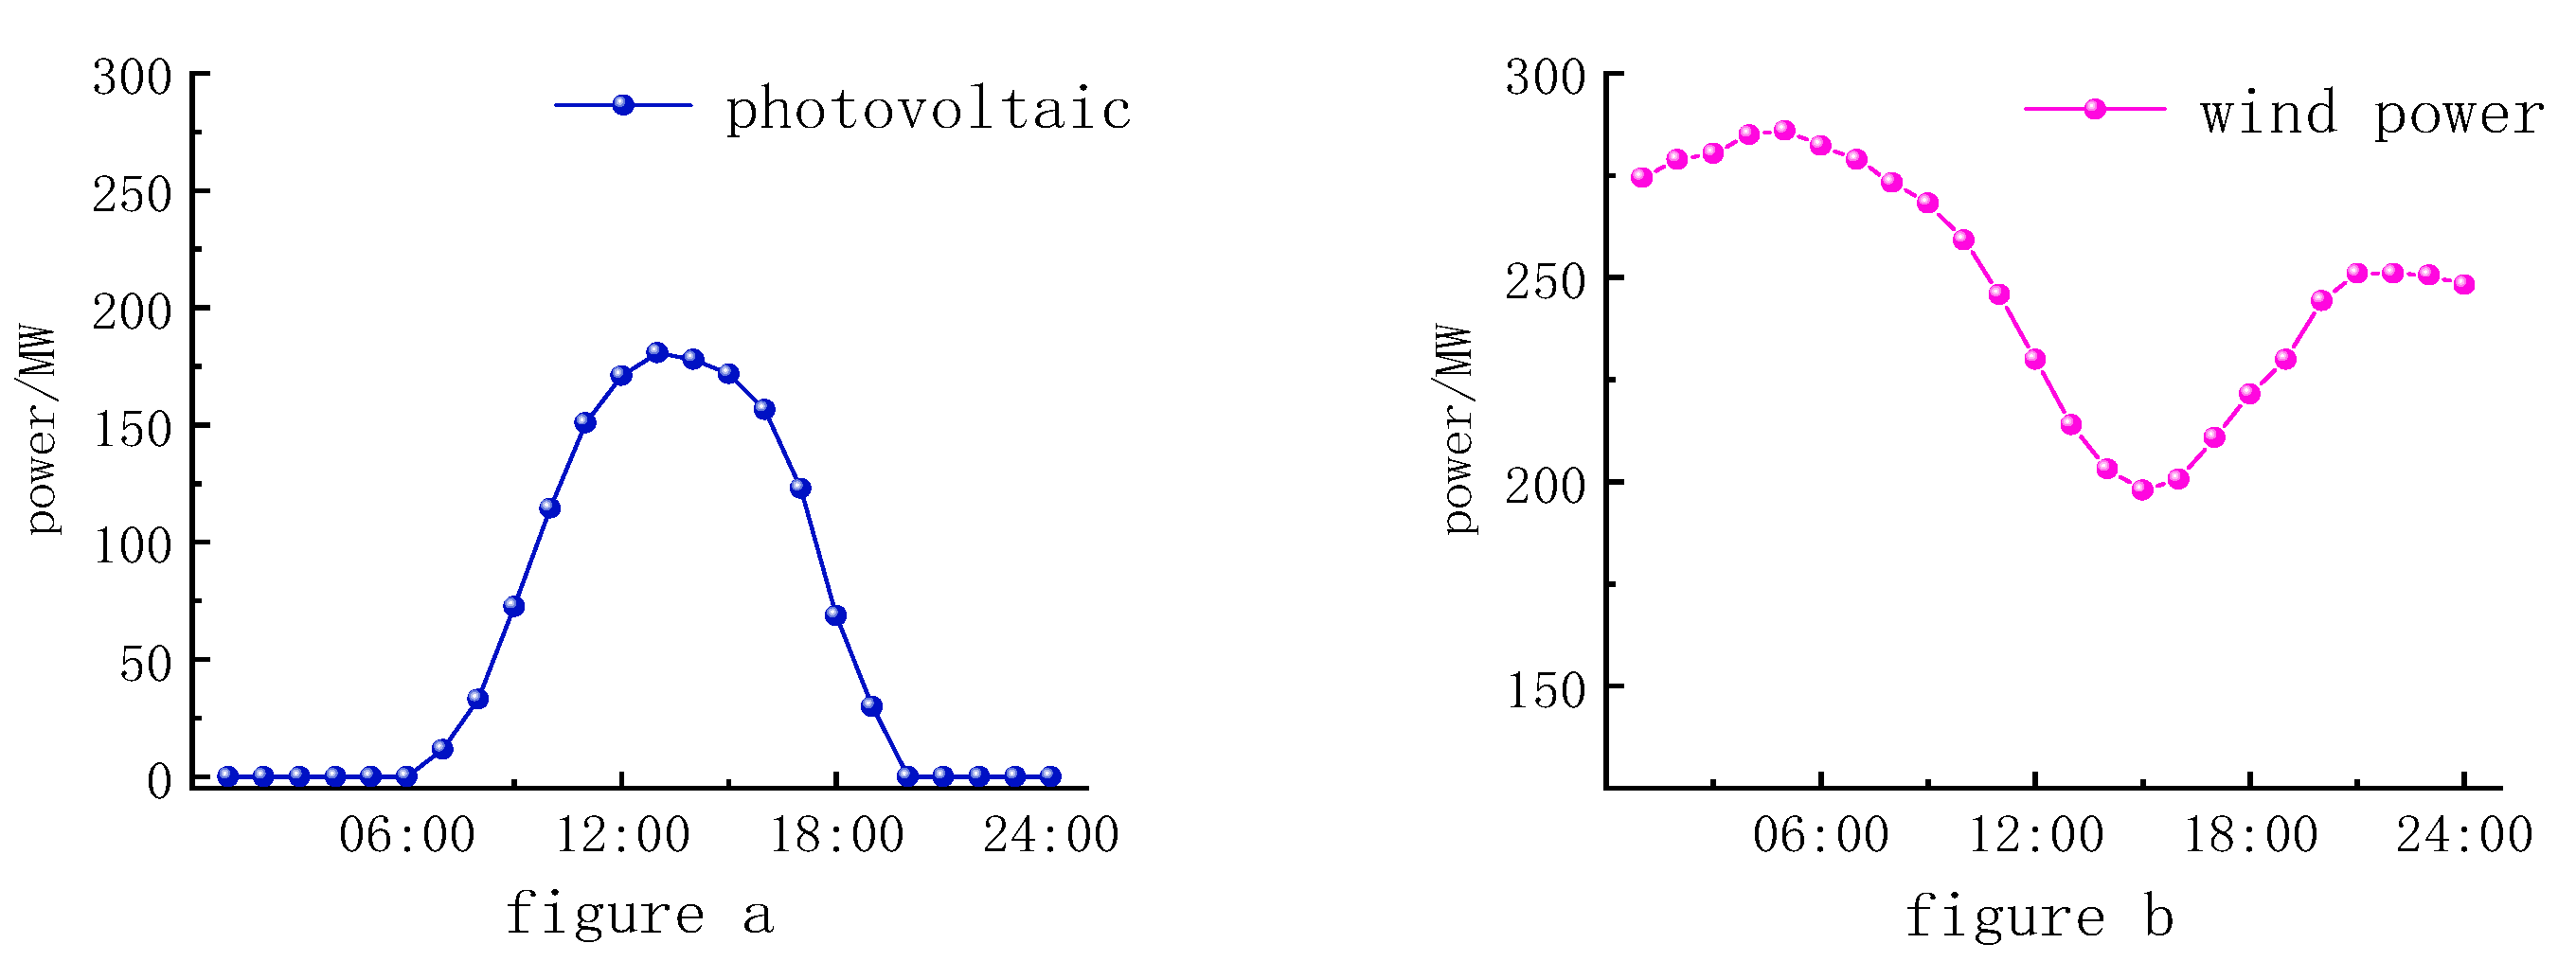
- Electric power balance constraints:where is the actual power of renewable energy suppliers at time t, is the power purchased from the grid at time t, is the electric load at time t, is the power of renewable energy feed-in at time t, and is the power of carbon capture plant feed-in at time t.
3.2. Algorithm and Optimization Solution
3.2.1. Gray Wolf Optimization Algorithm
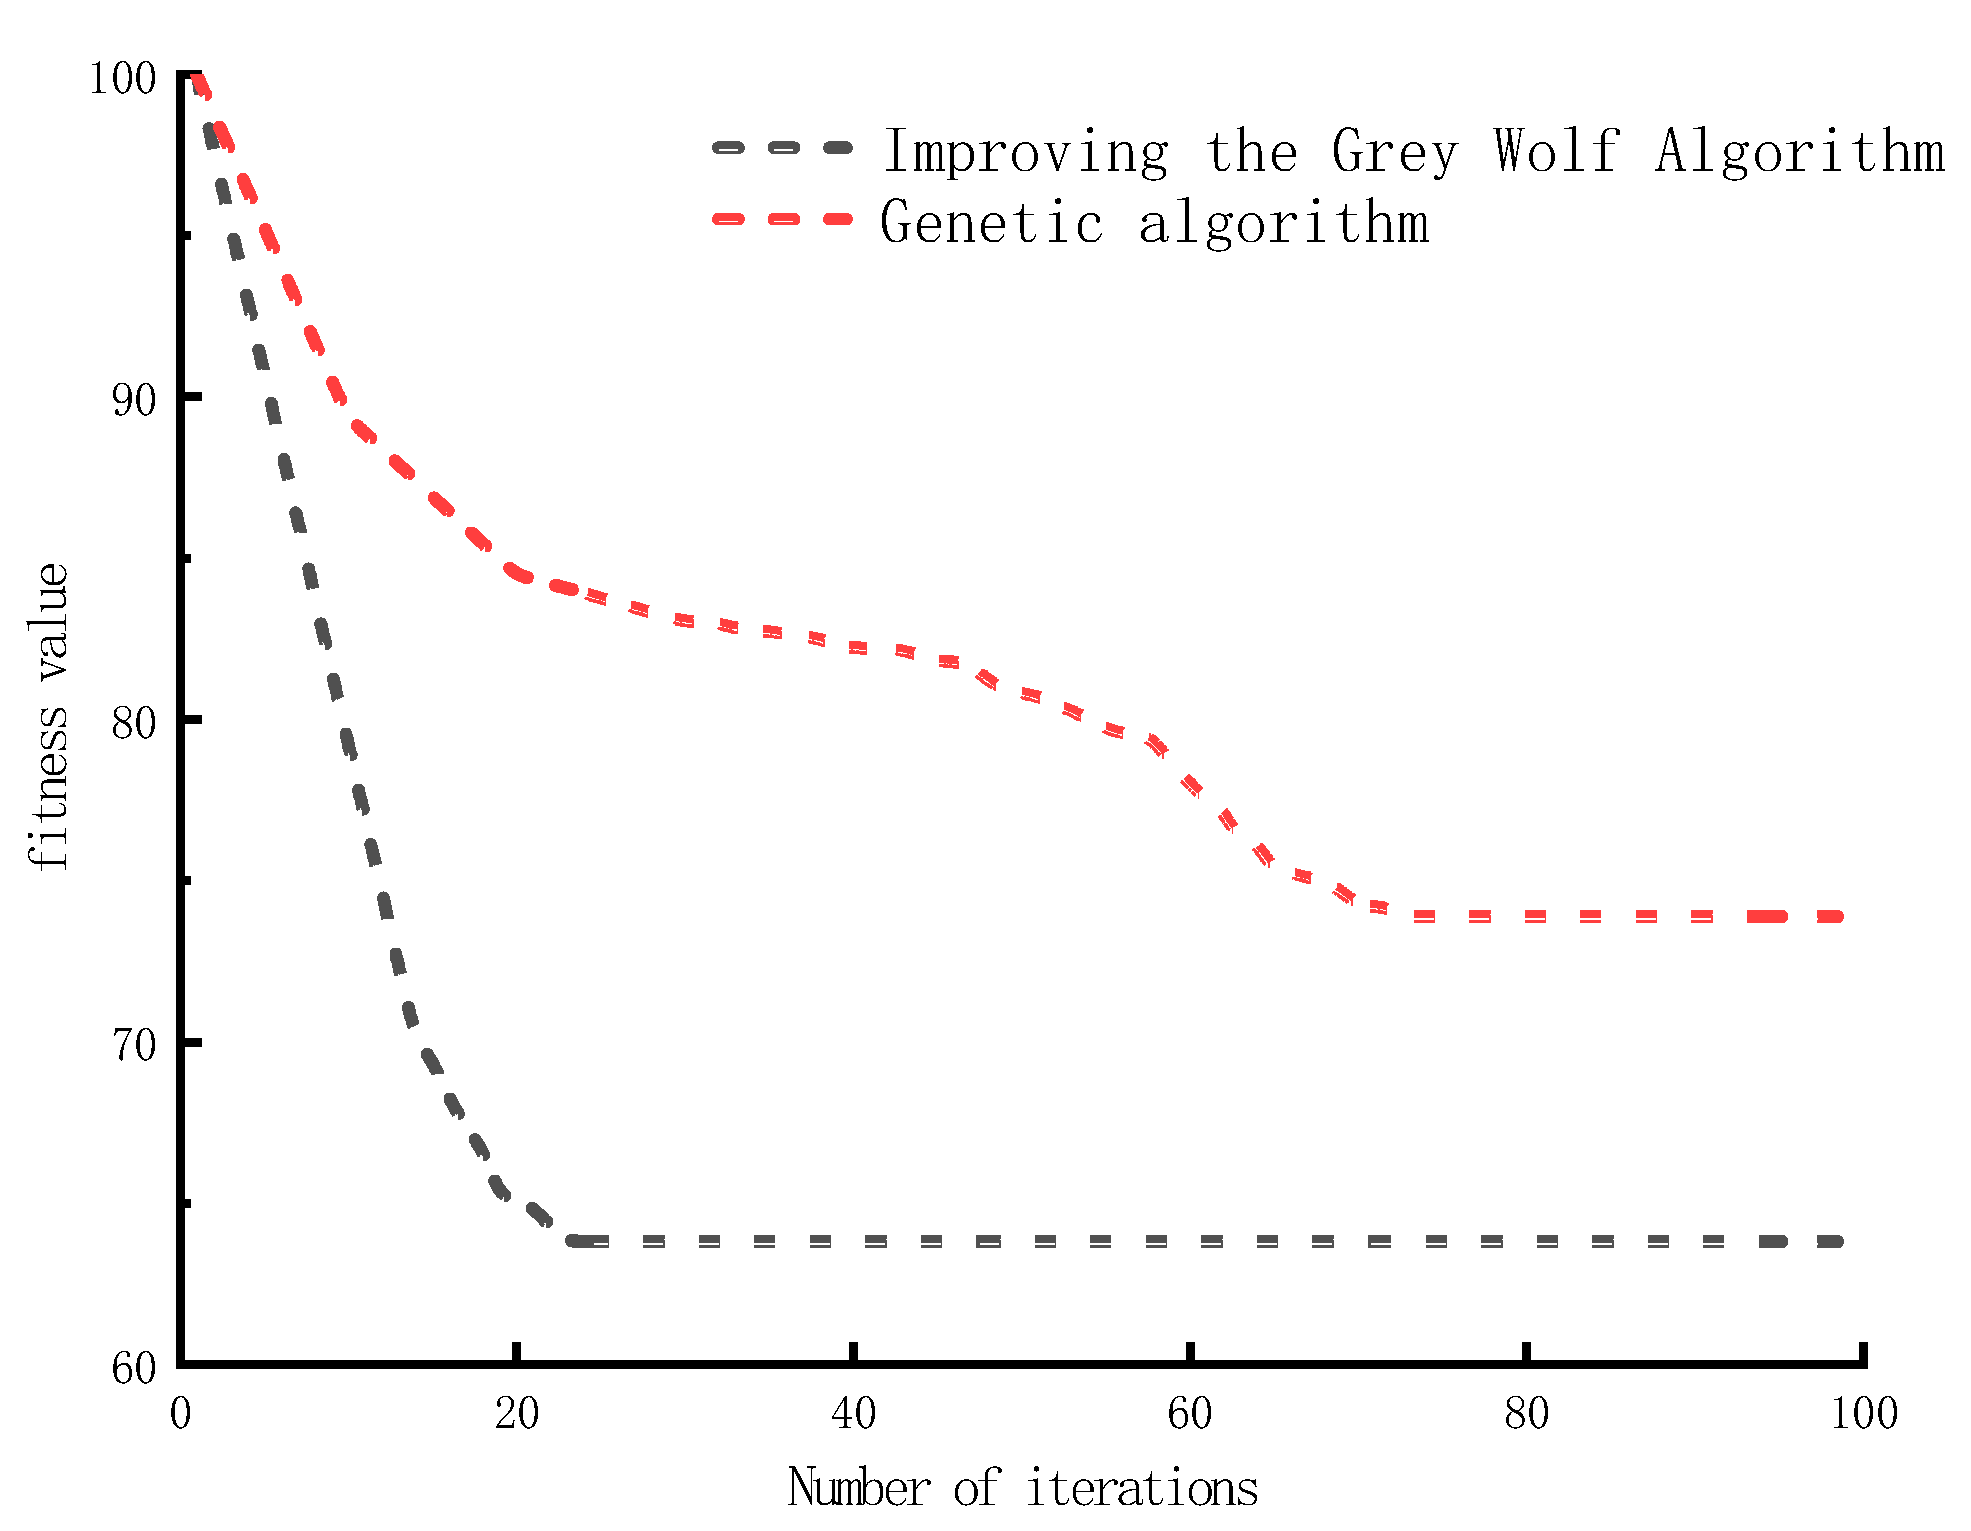
3.2.2. Improved Gray Wolf Optimization Algorithm
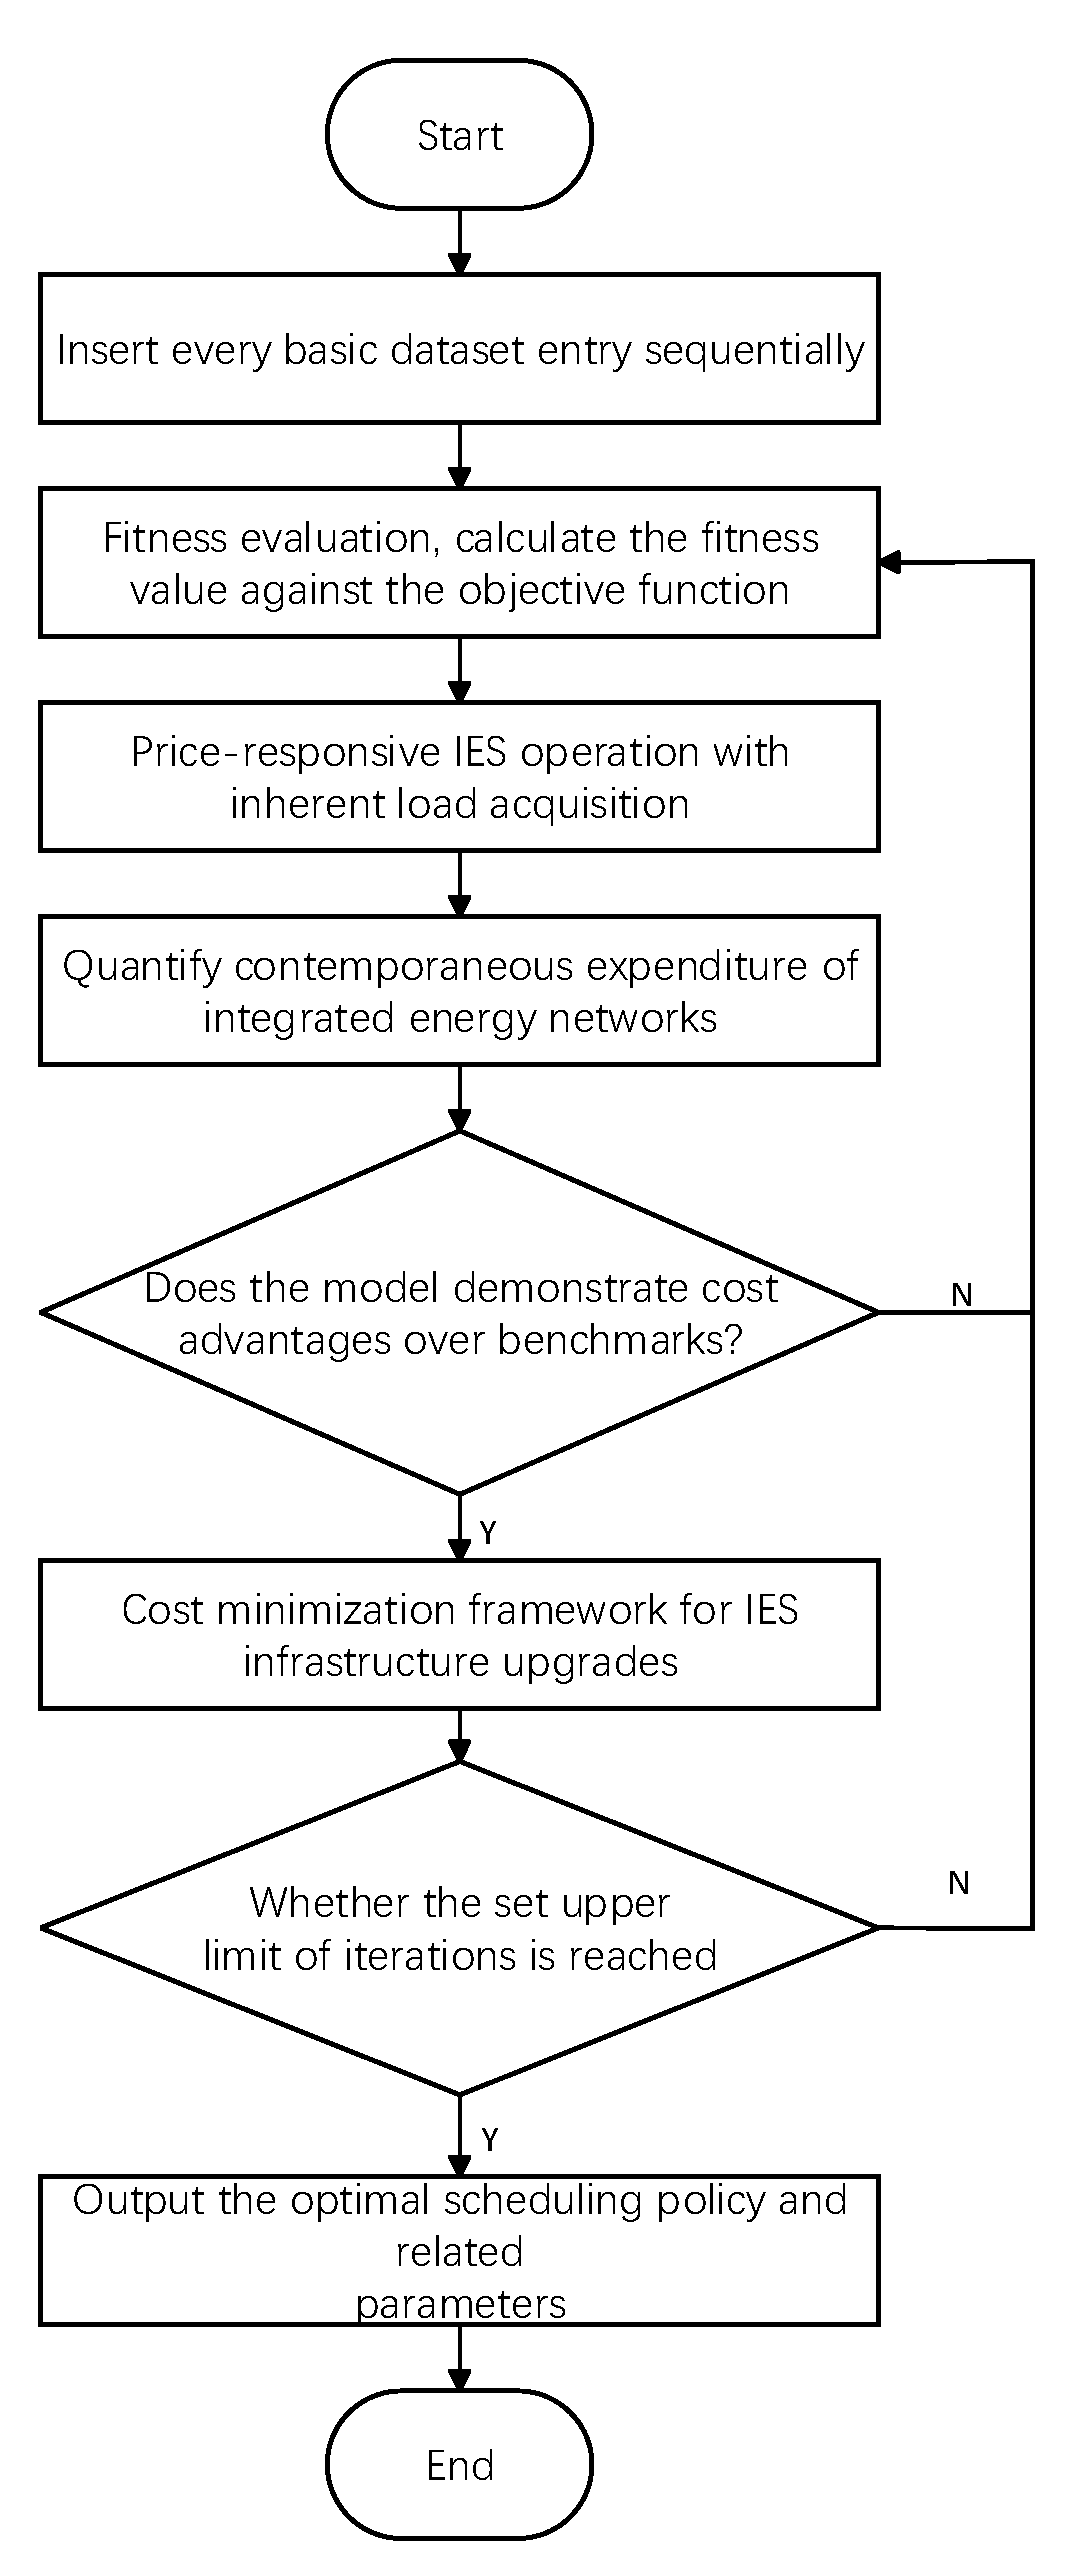
3.2.3. Solution Algorithm and Steps
3.2.4. Optimization of the Solution Process
4. Case Study Analysis
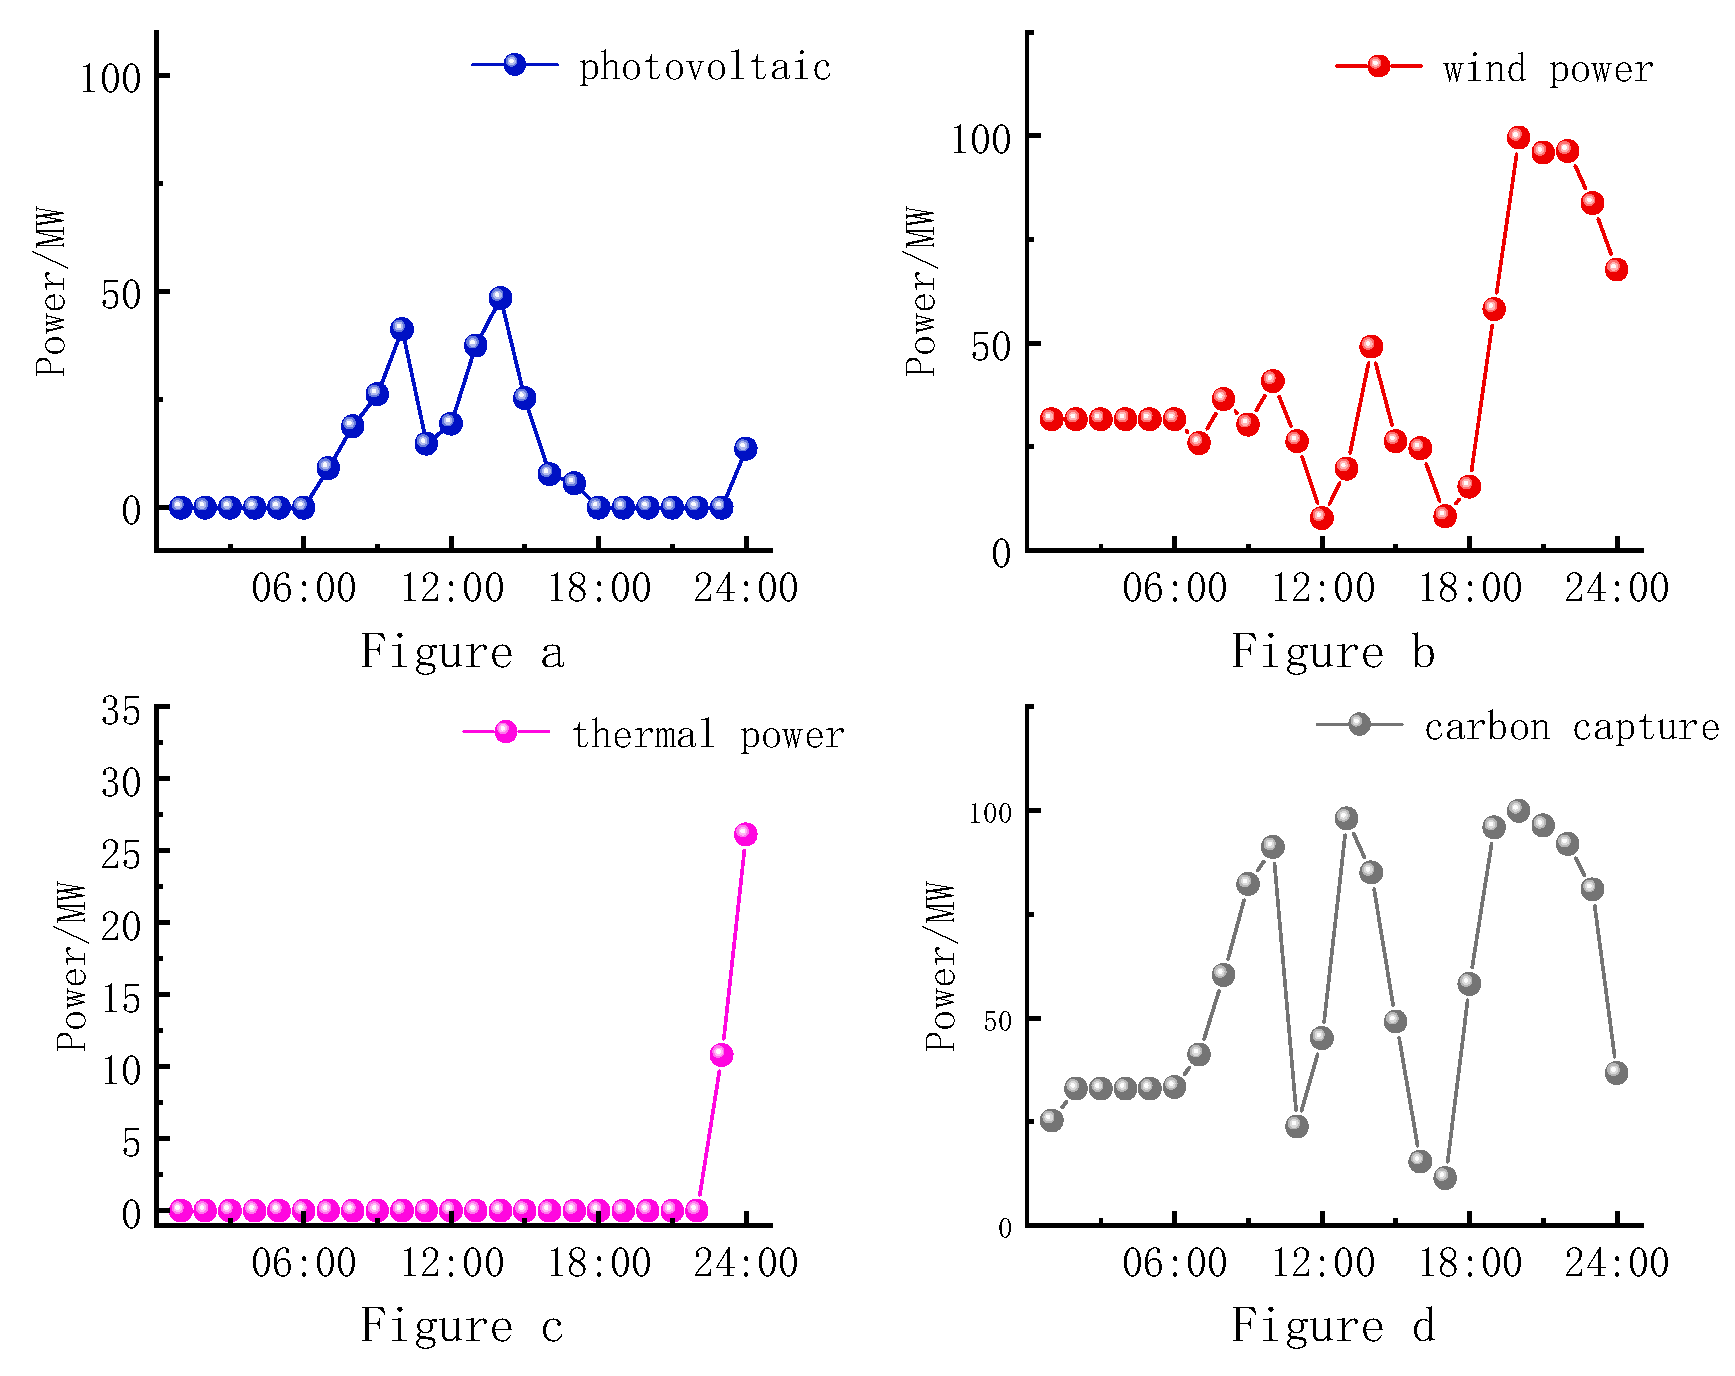
4.1. Operation Analysis
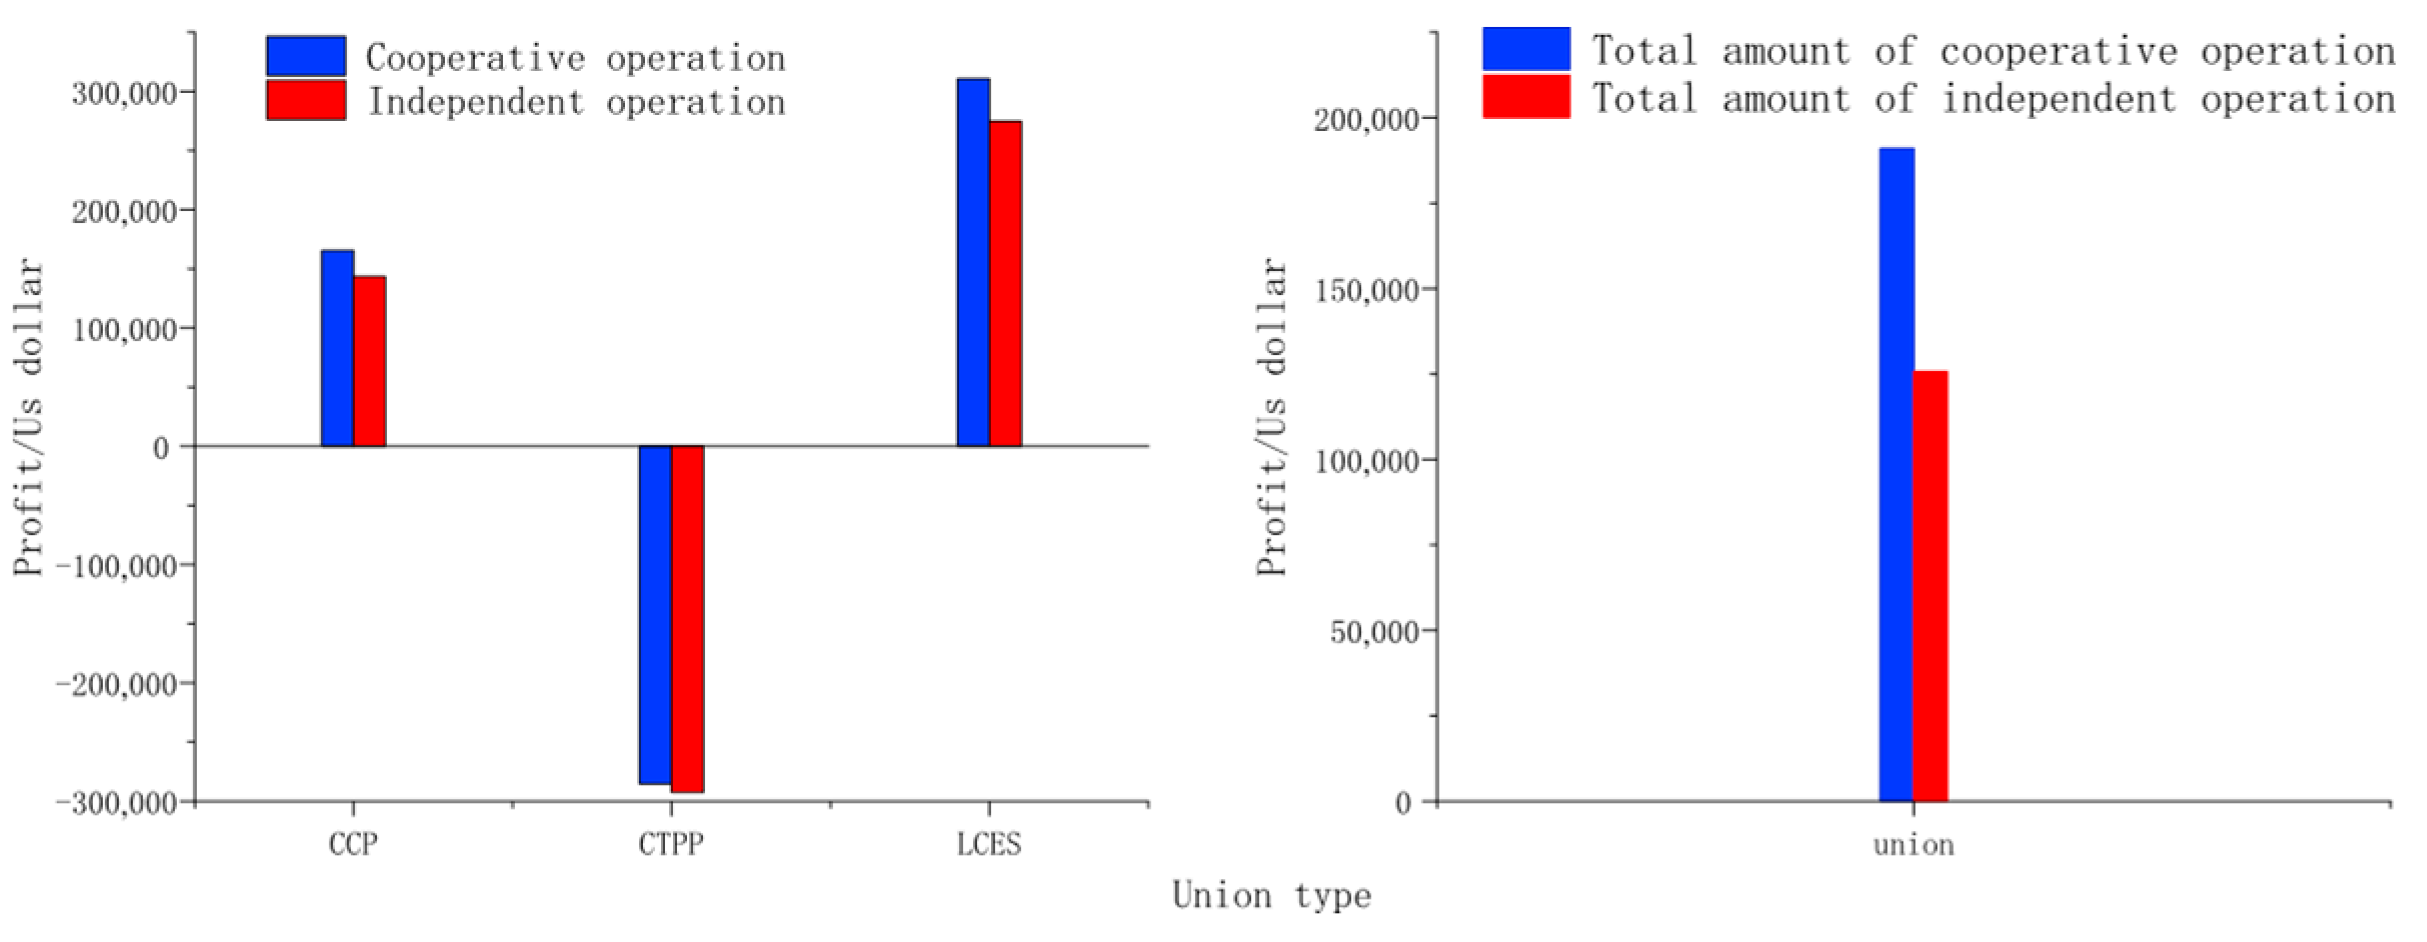
4.2. Cooperative Union Rationalization Validation
- (1)
- Individual conditions:
- (2)
- Conditions of cooperation:
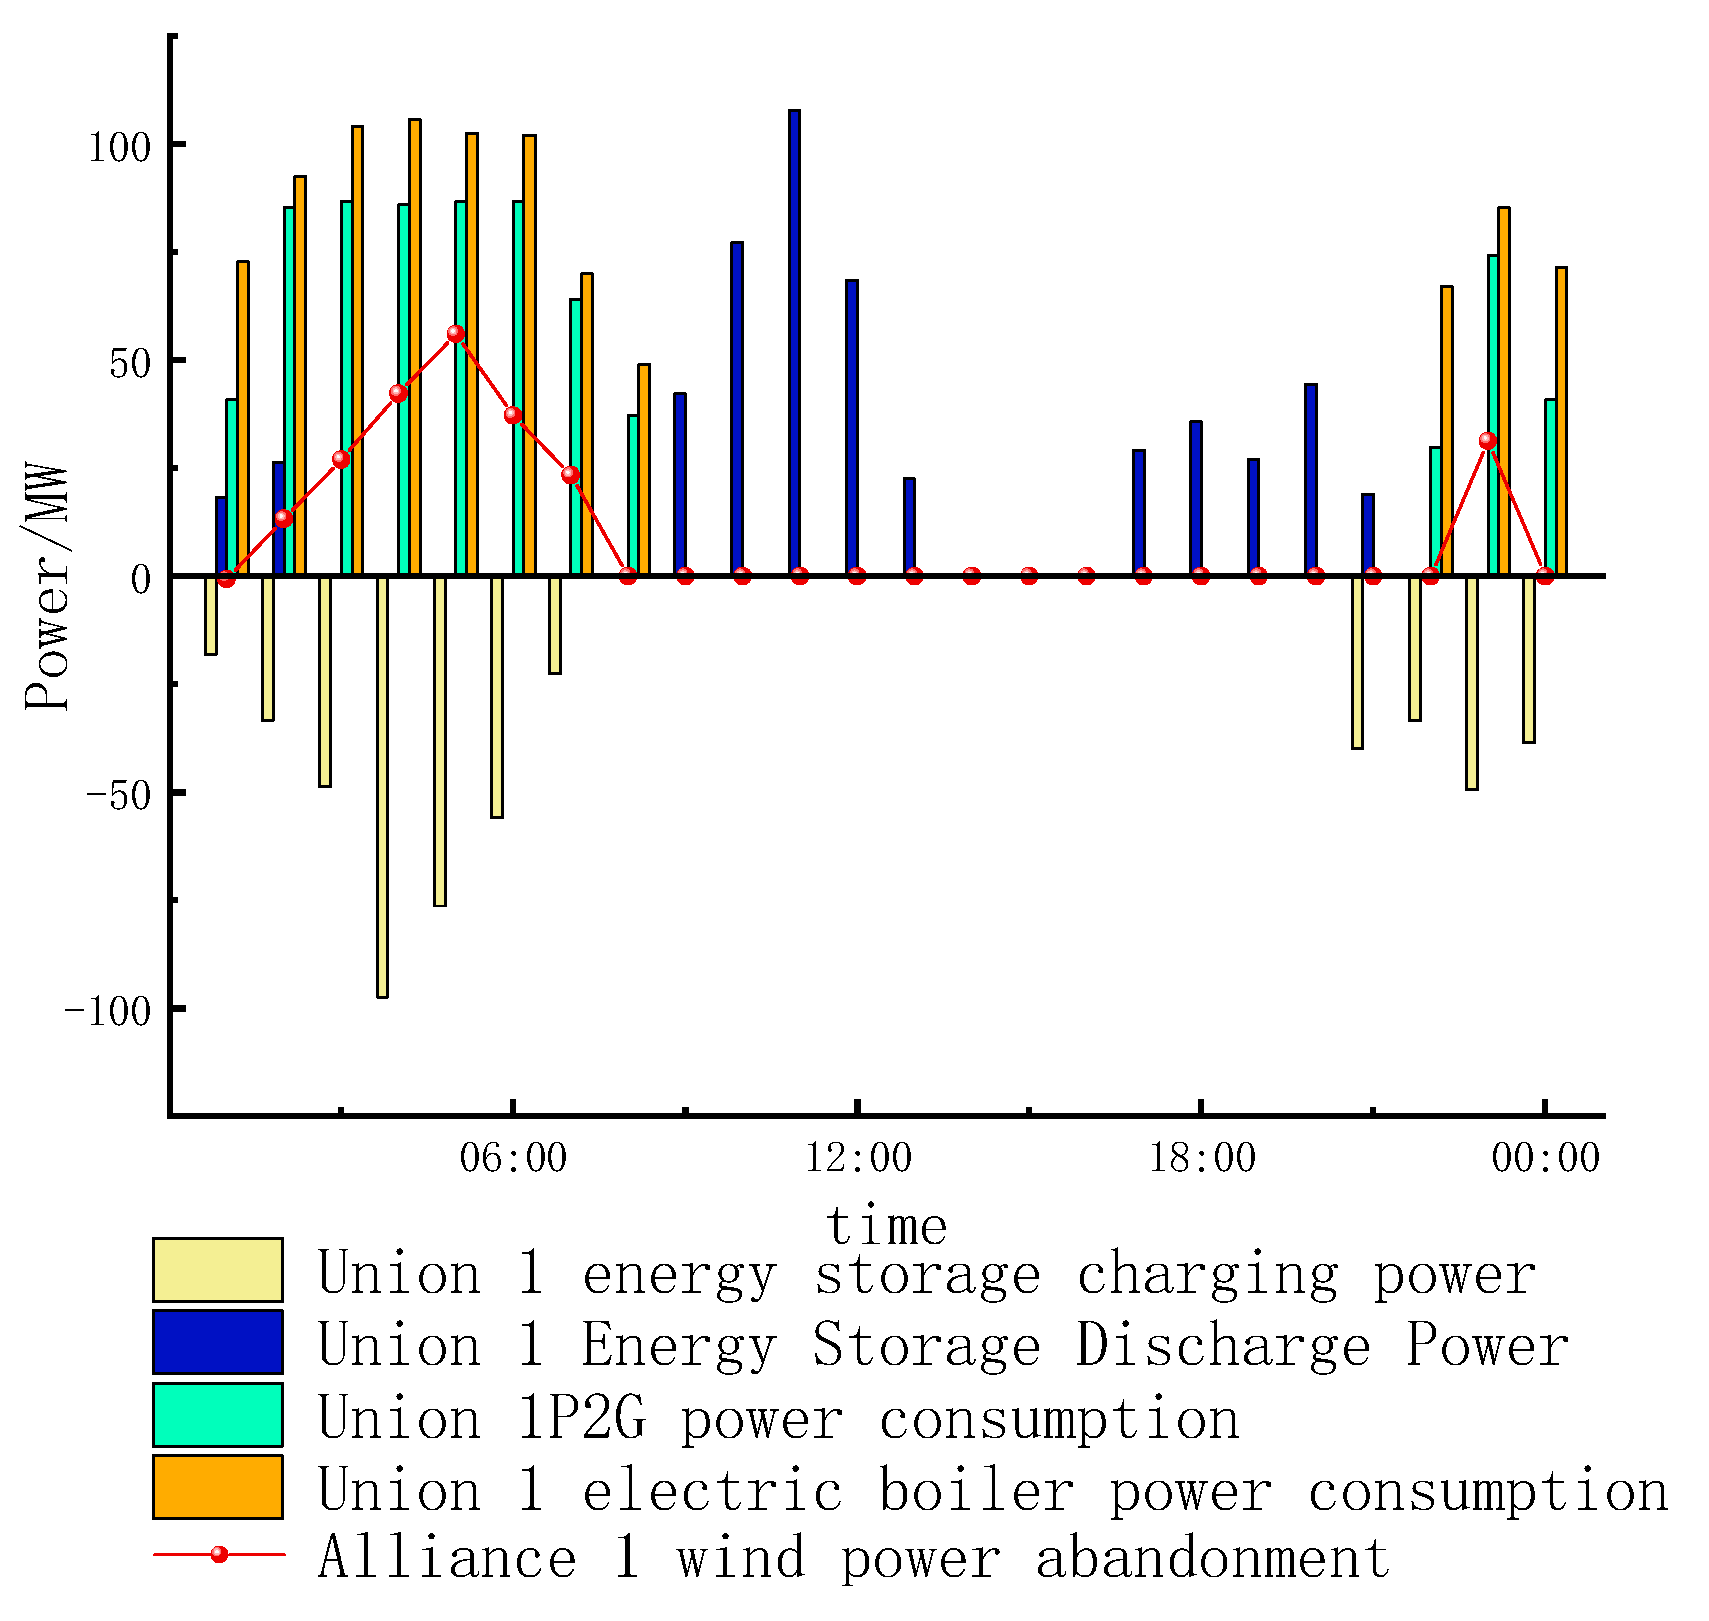
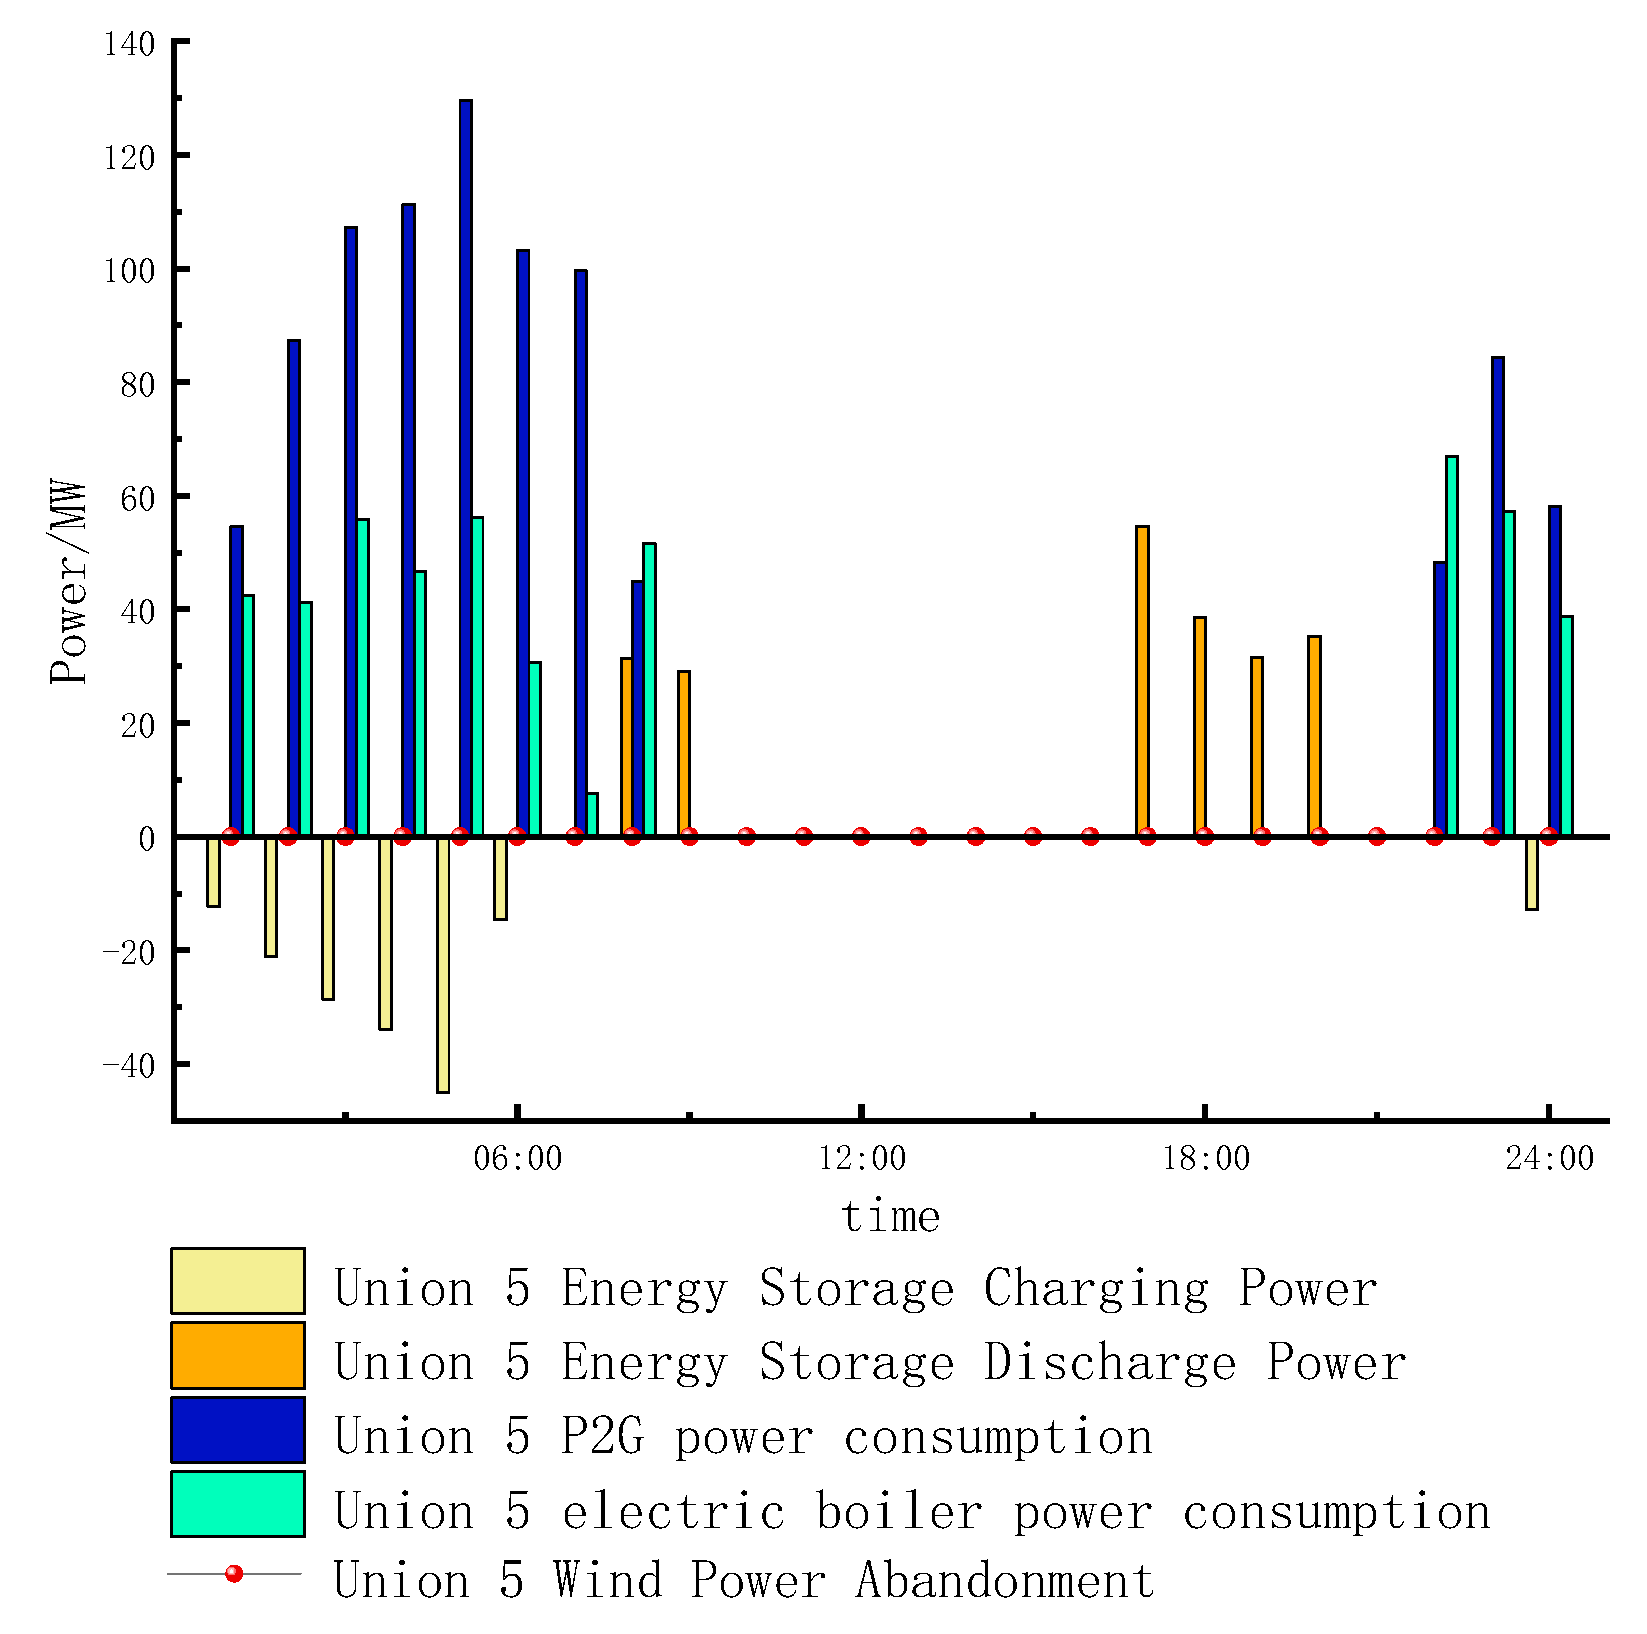
4.3. Analysis of Electrochemical Energy Storage Output Results
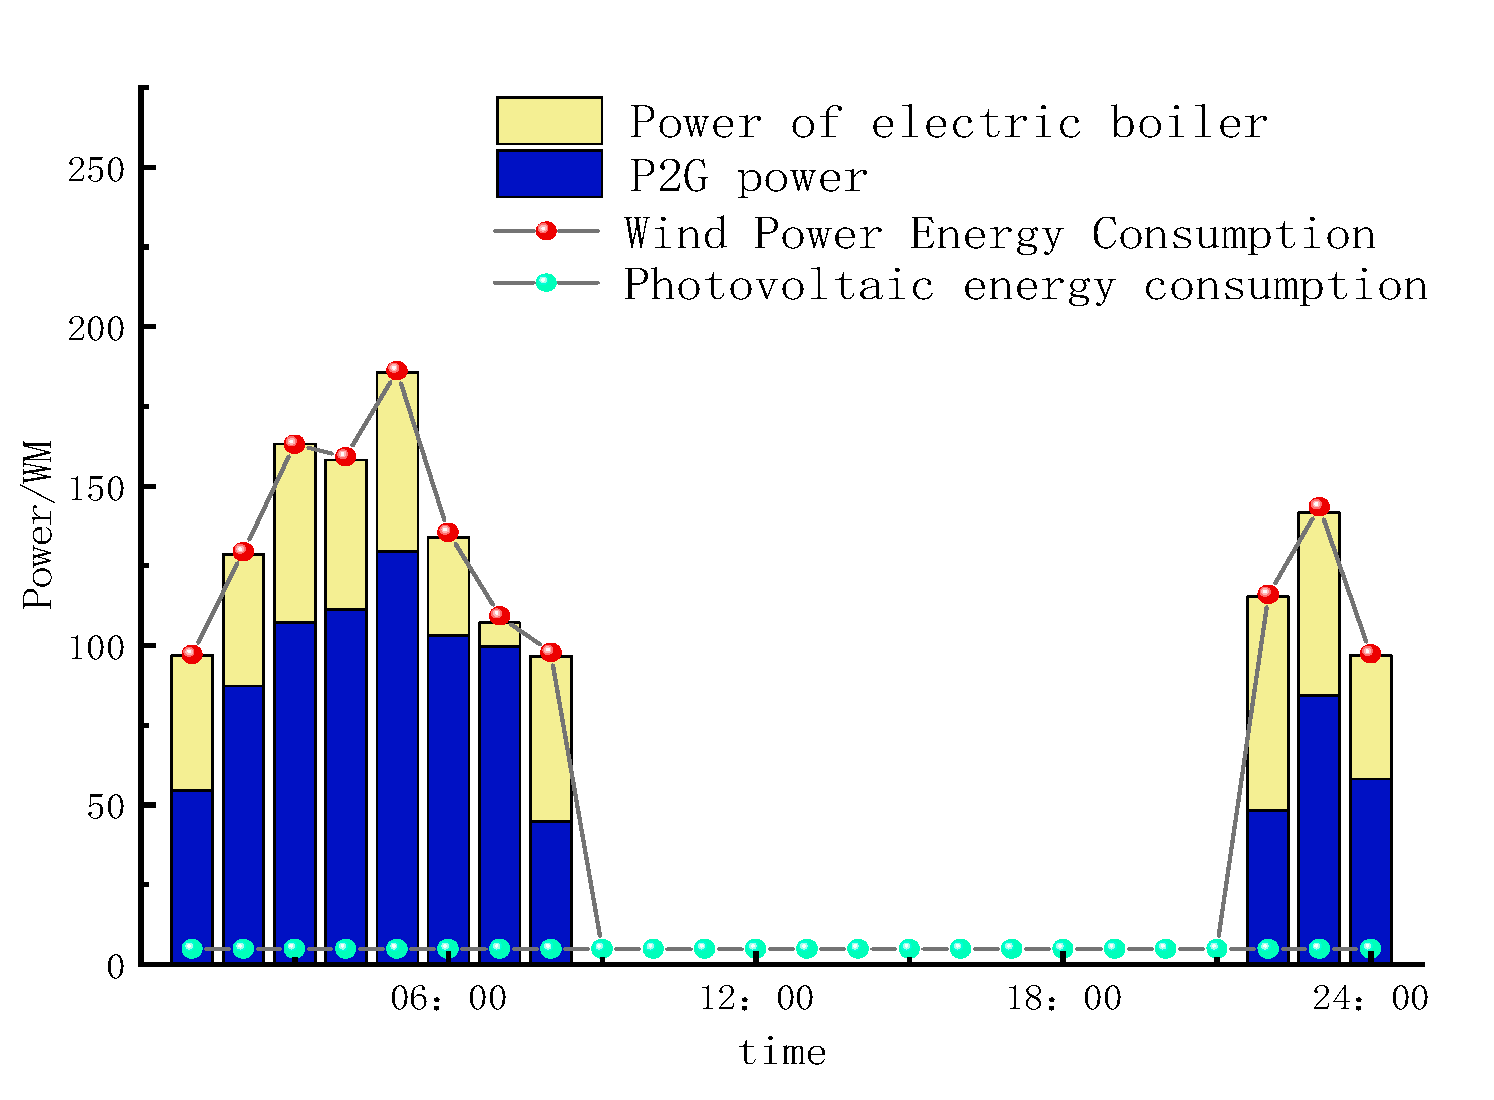
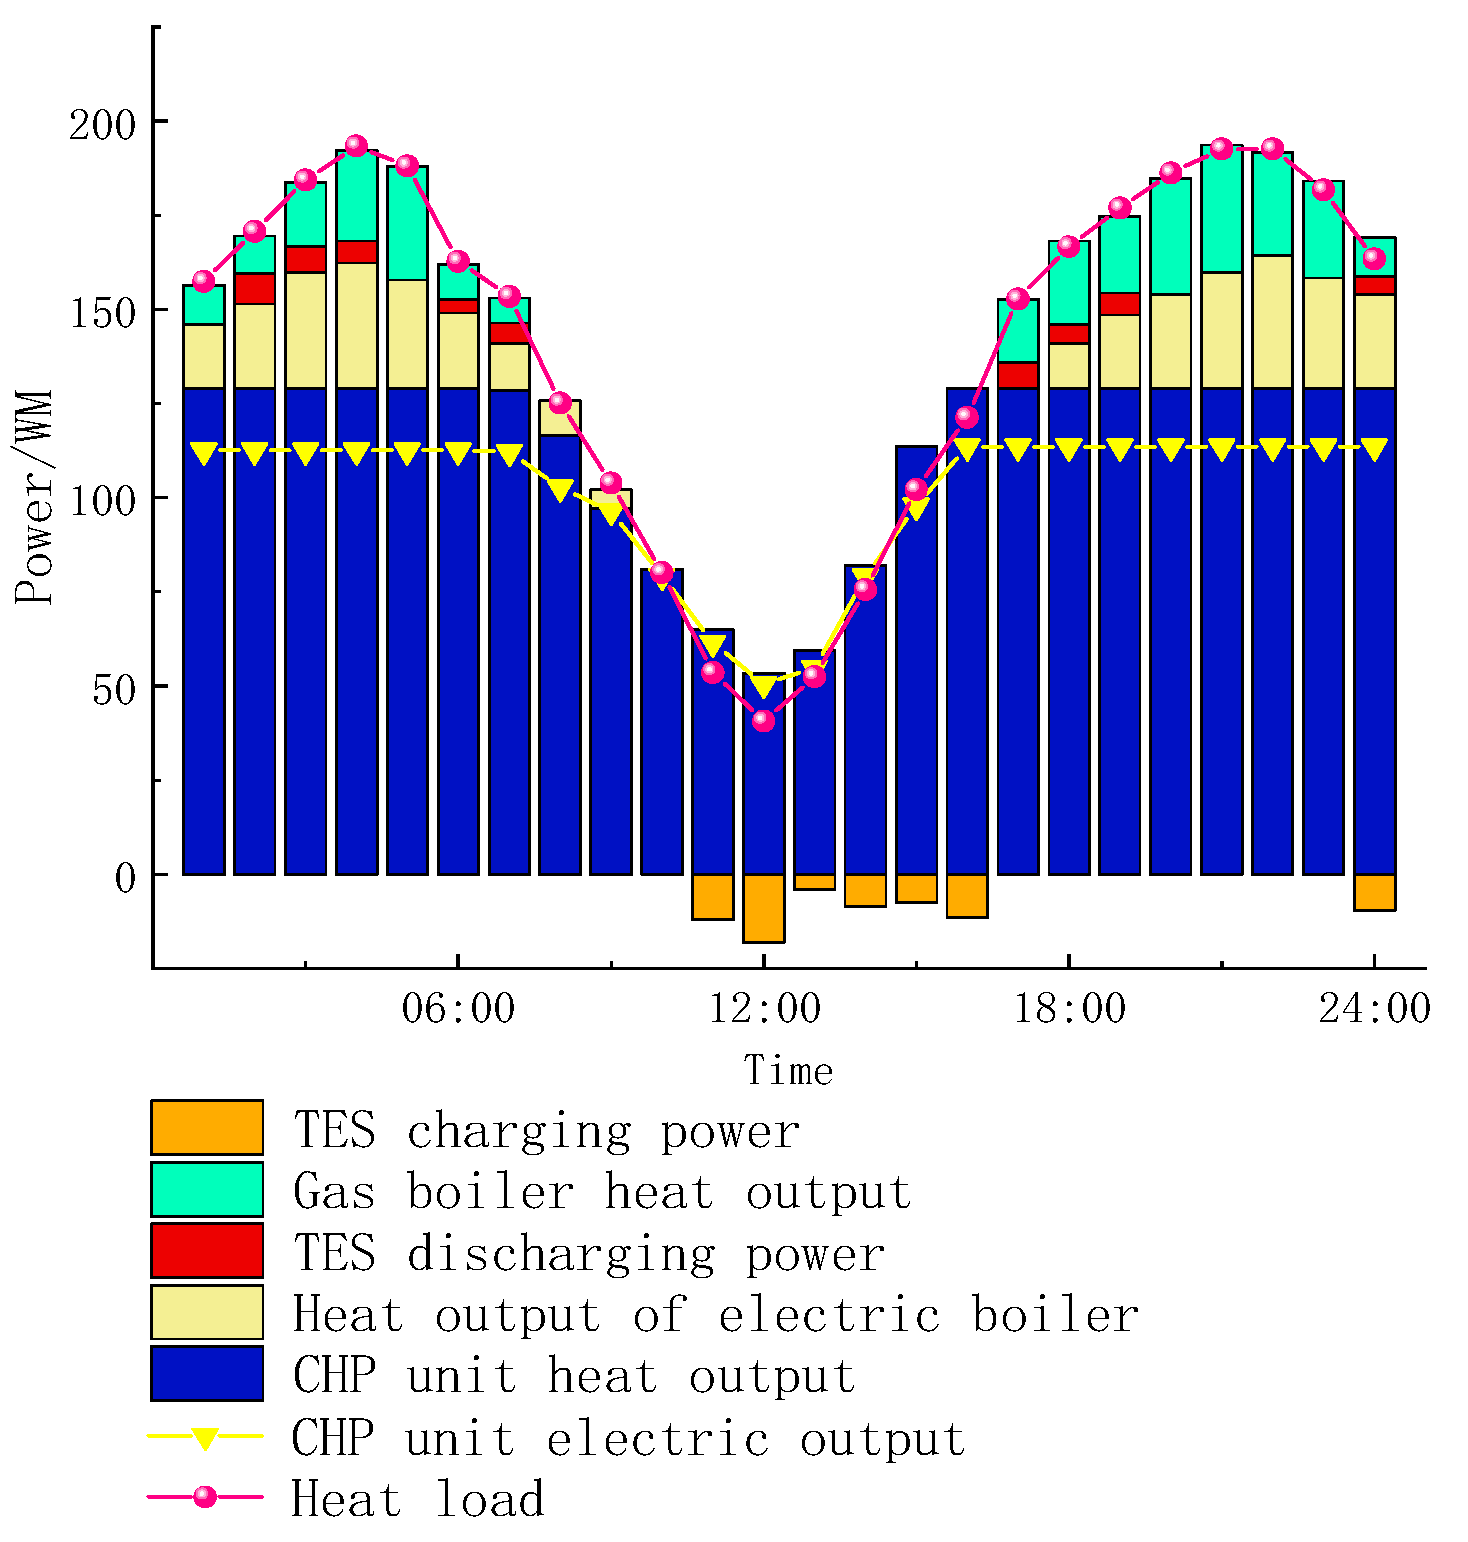
4.4. Optimized Scheduling Analysis
4.5. Analysis of Carbon Emission Reduction Results of Cooperative Unions
5. Conclusions
- The integrated CCS–EB–P2G system significantly enhances wind power utilization, load management flexibility, and global optimization performance. The IGWO algorithm efficiently solves the complex scheduling problem.
- Adopting an energy entity alliance operation mode and utilizing the Shapley value method for profit distribution substantially improves overall economic benefits compared with those under independent operation, effectively coordinating the conflict between individual rationality and collective interests.
- Deep collaboration among CCS, P2G, and EB within the coalition simultaneously reduces carbon emission intensity and carbon trading costs, achieving synergistic enhancements in environmental and economic performance.
Author Contributions
Funding
Institutional Review Board Statement
Data Availability Statement
Conflicts of Interest
References
- Li, X.J.; Yang, X.; Liu, X.B.; Wang, Y.W.; Hao, G.J.; Wang, M.Y. Research on Carbon Neutral Grid Enterprises’ Low Carbon Transition Strategies and Benefit Assessment. In Proceedings of the 4th International Conference on Environmental Resources and Energy Engineering, Zhuhai, China, 23–25 February 2024; p. 7. [Google Scholar]
- Li, W.C.; Gao, B.; Wang, B.R.; Xi, J.K.; Wang, X.P.; Zuo, S.Q.; Li, Z.Z. Research on Smart City Construction Based on Ubiquitous Power Internet of Things Technology. Technol. Innov. Appl. 2022, 12, 20–23. [Google Scholar]
- Zhang, Y.; Wang, X.Y.; Wang, S.C. Study on low-carbon transformation path of European and American petrochemical companies. Contemp. Pet. Petrochem. 2024, 32, 1–7. [Google Scholar]
- Wang, Y.; Qiao, B.; Tan, Z.K.; Sun, Z.N.; Yu, F.; Liang, S.K.; Li, Y. Study on the carbon footprint impact analysis method of integrated energy system operation in low-carbon park considering multi-domain dynamic characteristics. J. Phys. Conf. Ser. 2024, 2771, 012003. [Google Scholar] [CrossRef]
- Wang, Y.; Wang, W.; Li, X.; Yu, W. Enhanced Management of Unified Energy Systems Using Hydrogen Fuel Cell Combined Heat and Power with a Carbon Trading Scheme Incentivizing Emissions Reduction. Processes 2024, 12, 1358. [Google Scholar] [CrossRef]
- Liu, Y.F.; Sun, B.C. Green and low-carbon industrial park design strategy. China Textile. 2024, 8, 99–101. [Google Scholar]
- Liu, H.; Wang, D.; Jia, H.J.; Dou, Z.L.; Zhang, C.Y.; Wang, S.C. Construction and analysis of energy carbon security domain model of electric-gas-hydrogen integrated energy system. Power Grid Technol. 2025, 49, 73–83. [Google Scholar]
- Yang, Y.L.; Wu, X.G.; Zang, Z.Y.; Jin, R.; Zang, C.; Li, S.Y.; Yi, P.Y. Integrated energy system optimization and scheduling method considering the source and load coordinated scheduling of thermal-storage electric boilers and electric vehicles. Front. Energy Res. 2023, 11, 1237781. [Google Scholar] [CrossRef]
- Zhang, G.; Yan, Q.; Wang, R.; Yan, Y.; Mu, Q.; Wang, M.; Shao, Z. Optimal Scheduling of Building Integrated Energy System Based on Improved Sparrow Search Algorithm. In Proceedings of the 42nd Chinese Control Conference, Tianjin, China, 24–26 July 2023; p. 7. [Google Scholar]
- Zhang, N.; Chen, J.; Liu, B.; Ji, X. Optimized Scheduling of Integrated Energy Systems with Integrated Demand Response and Liquid Carbon Dioxide Storage. Processes 2024, 12, 292. [Google Scholar] [CrossRef]
- Gao, C.C. Optimized Operation Study of Regional Integrated Energy-Based Multi-Microgrid Based on Game Theory; Xi’an University of Technology: Xi’an, China, 2024. [Google Scholar] [CrossRef]
- Wu, N.; Wang, Z.P.; Li, X.Y.; Lei, L.; Qiao, Y.P.; Huang, J.; Linghu, J.Q. Research on real-time coordinated optimization scheduling control strategy with supply-side flexibility in multi-microgrid energy systems. Renew. Energy 2025, 238, 121976. [Google Scholar] [CrossRef]
- Zhang, Y.M.; Li, J.R.; Xing, Q.J.; Yang, M.; Ye, P.F. Optimal scheduling of electricity-gas-heat integrated energy system with coordination of flexibility and reliability. Sustain. Energy Technol. Assess. 2024, 71, 103968. [Google Scholar] [CrossRef]
- Tang, X.Y.; Hu, Y.; Geng, Q.; Xu, X.X. Multi-time scale optimal scheduling of integrated energy system considering multi-energy flexibility. Power Syst. Autom. 2021, 45, 81–90. [Google Scholar]
- Hua, H.C.; Du, C.; Chen, X.Y.; Kong, H.; Li, K.; Liu, Z.; Naidoo, P.; Lv, M.; Hu, N.; Fu, M.; et al. Optimal dispatch of multiple interconnected-integrated energy systems considering multi-energy interaction and aggregated demand response for multiple stakeholders. Appl. Energy 2024, 376, 124256. [Google Scholar] [CrossRef]
- Zou, Y.Q.; Yang, G.H.; Zheng, H.F.; Yi, J.C.; Hu, R.K. Research on Economic Dispatch of Integrated Energy System with P2G. Electrotech. Electric. 2020, 3, 12–15+35. [Google Scholar]
- Zhang, X.; Li, Y.; Ma, Q.; Liu, L. Research on the Development of Carbon Capture, Utilization and Storage Technology in China. Strateg. Study CAE 2021, 23, 70–80. [Google Scholar] [CrossRef]
- Chen, D.; Liu, F.; Liu, S. Optimization and scheduling of virtual power plants with P2G-CCS coupling and gas hydrogen blending based on tiered carbon trading. Power Syst. Technol. 2022, 46, 2042–2054. [Google Scholar]
- Zhu, Q.; Lin, H.; Zhang, Y. Optimization scheduling of virtual power plants with P2G-CCS considering wind power consumption. Smart Power 2023, 51, 77–83. [Google Scholar]
- Wang, Y.; Ma, Z.; Zhou, Q.; Dong, H. Optimization and scheduling of multi energy cooperative games that balance fairness. Acta Energiae Solaris Sin. 2022, 43, 482–492. [Google Scholar]
- Chen, F.; Liang, H.; Gao, Y.; Yang, Y.; Chen, Y. Research on Double-Layer Optimal Scheduling Model of Integrated Energy Park Based on Non-Cooperative Game. Energies 2019, 12, 3164. [Google Scholar] [CrossRef]
- Duan, J.; Xie, J.; Zhao, X.; Chang, Y.; Ge, Y. Cooperative gain allocation strategy for wind solar water storage multi-agent complementary power generation system based on improved Shapley value method. Electr. Power Autom. Equip. 2024, 44, 22–30. [Google Scholar]
- Zhang, S.H.; Zhang, X.; Zhang, R.; Gu, W.; Cao, G. N-1 Evaluation of Integrated Electricity and Gas System Considering Cyber-Physical Interdependence. IEEE Trans. Smart Grid, 2025; Early Access. [Google Scholar] [CrossRef]
- IEC Standard 60034-30-2:2022; International Electrotechnical Commission (IEC). Rotating Electrical Machines—Part 30-2: Efficiency Classes of Variable Speed AC Motors (IE-Code). IEC: Geneva, Switzerland, 2022.


| Main Body | Parameter | Numerical Value |
|---|---|---|
| P2G | Upper limit of output, MW | 198 |
| Lower limit of output, MW | 0 | |
| Conversion efficiency | 0.62 | |
| CO2 consumption coefficient, (t/MWh) | 0.27 | |
| CHP | Upper limit of output, MW | 135 |
| Lower limit of output, MW | 0 | |
| Low combustion calorific value of natural gas, (MJ/m3) | 41 | |
| CCS | Energy consumption coefficient, (t/MWh) | 0.285 |
| Carbon emission intensity coefficient, (t/MWh) | 0.94 | |
| Carbon emission quota coefficient, (t/MWh) | 0.73 | |
| EB | Upper limit of output, MW | 100 |
| Lower limit of output, MW | 10 | |
| Electrical efficiency | 0.8 | |
| Thermal efficiency | 0.8 | |
| GB | Upper limit of output, MW | 100 |
| Lower limit of output, MW | 30 | |
| Gas turbine thermal efficiency | 0.69 | |
| Lithium battery | Upper limit of charging and discharging power, MW | 100 |
| Lower limit of charging and discharging power, MW | 0 | |
| Charging efficiency coefficient | 0.94 | |
| Discharge efficiency coefficient | 0.94 | |
| Price | Cost coefficient of carbon capture power plant, (USD/MW2) | 0.00031 |
| Cost coefficient of carbon capture power plant, (USD/MW) | 17.3 | |
| Cost coefficient of carbon capture power plant, USD | 970 | |
| Unit natural gas price, (USD/m3) | 0.419 | |
| Carbon trading price, (USD/t) | 14.286 | |
| Cost coefficient of wind curtailment punishment, (USD/MWh) | 40 | |
| Penalty cost coefficient for abandoning light, (USD/MWh) | 35 | |
| Carbon sequestration cost coefficient, (USD/t) | 4.89 | |
| Unit CO2 price, (USD/t) | 120 | |
| P2G cost coefficient, (USD/MWh) | 20 | |
| Cost coefficient of internet fees, (USD/MW2) | 0.0046 | |
| Cost coefficient of internet fees, (USD/MW) | 1.548 |
| Members | CCP | CTPP | LCES | |
|---|---|---|---|---|
| Type of Union | ||||
| Union 1 | 0 | 0 | 0 | |
| Union 2 | 1 | 1 | 0 | |
| Union 3 | 1 | 0 | 1 | |
| Union 4 | 0 | 1 | 1 | |
| Union 5 | 1 | 1 | 1 | |
| Type of Union | LCES | CCP | CTPP | Total Profit |
|---|---|---|---|---|
| Union 1 | 2748.69 | 1433.97 | −2925.36 | 1257.30 |
| Union 2 | 2880.40 | 1627.55 | −3294.24 | 1213.71 |
| Union 3 | 2867.91 | 1713.21 | −3234.77 | 1346.35 |
| Union 4 | 2957.75 | 1334.35 | −3038.36 | 1253.74 |
| Union 5 | 3304.44 | 1706.51 | −3101.62 | 1909.33 |
| TP | Total Profit |
|---|---|
| CTR | Carbon trading revenue |
| PES | Proceeds from electricity sales |
| WCG | Wheeling charge |
| OC | P2G operating cost |
| CP | Cost of gas purchases |
| CSC | Carbon sequestration costs |
| FC | Fuel cost |
| WPV | Wind power and photovoltaic abandonment penalties |
| NEM | New-energy maintenance system maintenance costs |
| CU | Cooperative union |
| ×100 | ||||||||||
|---|---|---|---|---|---|---|---|---|---|---|
| CU | NEM | WPV | FC | CSC | CP | OC | WCG | PES | CTR | TP |
| 1 | −794.62 | −74.18 | −1053.23 | −142.82 | −3575.64 | −165.91 | 0 | 7157.53 | −93.83 | 1257.3 |
| 2 | −797.31 | −74.18 | −1703.81 | −148.31 | −2928.48 | −281.25 | 0 | 7165.85 | −18.8 | 1213.71 |
| 3 | −854.18 | −74.18 | −1548.72 | −191.42 | −3158.37 | −193.85 | −21.63 | 7193.81 | 194.89 | 1346.35 |
| 4 | −582.21 | 0 | −1354.68 | −331.62 | −3347.11 | −261.68 | −99.69 | 7126.36 | 104.37 | 1253.74 |
| 5 | −582.21 | 0 | −1354.68 | −329.46 | −2895.07 | −243.36 | −127.81 | 7126.36 | 315.56 | 1909.33 |
| S | Weighting Factor | ||
|---|---|---|---|
| 1433.97 | 0 | 1/3 | |
| −1666.69 | −2925.36 | 1/6 | |
| 4581.12 | 2748.69 | 1/6 | |
| 1909.33 | −80.61 | 1/3 | |
| S | Weighting Factor | ||
|---|---|---|---|
| −2925.36 | 0 | 1/3 | |
| −1666.69 | 1433.97 | 1/6 | |
| −80.61 | 2748.69 | 1/6 | |
| 1909.33 | 4581.12 | 1/3 | |
| S | Weighting Factor | ||
|---|---|---|---|
| 2748.69 | 0 | 1/3 | |
| 4581.12 | 1433.97 | 1/6 | |
| −80.61 | −2925.36 | 1/6 | |
| 1909.33 | −1666.69 | 1/3 | |
| Carbon Dioxide | Exhaust, t | Earnings |
|---|---|---|
| Union 1 | 6743.94 | −10,485.83 |
| Union 2 | 5192.41 | 8352.67 |
| Union 3 | 4146.38 | 19,536.42 |
| Union 4 | 4127.44 | −3582.51 |
| Union 5 | 5772.59 | 24,785.03 |
Disclaimer/Publisher’s Note: The statements, opinions and data contained in all publications are solely those of the individual author(s) and contributor(s) and not of MDPI and/or the editor(s). MDPI and/or the editor(s) disclaim responsibility for any injury to people or property resulting from any ideas, methods, instructions or products referred to in the content. |
© 2025 by the authors. Licensee MDPI, Basel, Switzerland. This article is an open access article distributed under the terms and conditions of the Creative Commons Attribution (CC BY) license (https://creativecommons.org/licenses/by/4.0/).
Share and Cite
Liu, H.; Ye, S.; Yin, C.; Wang, L.; Zhang, C. Cooperative Game-Theoretic Scheduling for Low-Carbon Integrated Energy Systems with P2G–CCS Synergy. Energies 2025, 18, 3942. https://doi.org/10.3390/en18153942
Liu H, Ye S, Yin C, Wang L, Zhang C. Cooperative Game-Theoretic Scheduling for Low-Carbon Integrated Energy Systems with P2G–CCS Synergy. Energies. 2025; 18(15):3942. https://doi.org/10.3390/en18153942
Chicago/Turabian StyleLiu, Huijia, Sheng Ye, Chengkai Yin, Lei Wang, and Can Zhang. 2025. "Cooperative Game-Theoretic Scheduling for Low-Carbon Integrated Energy Systems with P2G–CCS Synergy" Energies 18, no. 15: 3942. https://doi.org/10.3390/en18153942
APA StyleLiu, H., Ye, S., Yin, C., Wang, L., & Zhang, C. (2025). Cooperative Game-Theoretic Scheduling for Low-Carbon Integrated Energy Systems with P2G–CCS Synergy. Energies, 18(15), 3942. https://doi.org/10.3390/en18153942