Article

Optimal Configuration of Distributed Pumped Storage Capacity with Clean Energy

1
College of Electrical Engineering and New Energy, China Three Gorges University, Yichang 443000, China
2
Key Laboratory of Hubei Province for Operation and Control of Cascade Hydropower Stations, China Three Gorges University, Yichang 443002, China
*
Author to whom correspondence should be addressed.
Energies 2025, 18(15), 3896; https://doi.org/10.3390/en18153896
Submission received: 11 June 2025 / Revised: 4 July 2025 / Accepted: 18 July 2025 / Published: 22 July 2025

Abstract

Aiming at the economic problems of industrial users with wind power, photovoltaic, and small hydropower resources in clean energy consumption and trading with superior power grids, this paper proposes a distributed pumped storage capacity optimization configuration method considering clean energy systems. First, considering the maximization of the investment benefit of distributed pumped storage as the upper goal, a configuration scheme of the installed capacity is formulated. Second, under the two-part electricity price mechanism, combined with the basin hydraulic coupling relationship model, the operation strategy optimization of distributed pumped storage power stations and small hydropower stations is carried out with the minimum operation cost of the clean energy system as the lower optimization objective. Finally, the bi-level optimization model is solved by combining the alternating direction multiplier method and CPLEX solver. This study demonstrates that distributed pumped storage implementation enhances seasonal operational performance, improving clean energy utilization while reducing industrial electricity costs. A post-implementation analysis revealed monthly operating cost reductions of 2.36, 1.72, and 2.13 million RMB for wet, dry, and normal periods, respectively. Coordinated dispatch strategies significantly decreased hydropower station water wastage by 82,000, 28,000, and 52,000 cubic meters during corresponding periods, confirming simultaneous economic and resource efficiency improvements.

1. Introduction

With the advancement of the “double carbon” goal, the development of clean energy power generation technologies, such as wind power, photovoltaics, and hydropower, has provided a powerful boost for energy transformation and low-carbon development. Compared with traditional thermal power generation, new energy power generation technologies have significant advantages in reducing pollution and greenhouse gas emissions [1,2]. With the development of clean energy, an increasing number of industrial users, especially those with small hydropower plants, have joined the ranks of wind power and photovoltaic power generation, providing power for energy self-sufficiency and an opportunity for energy management optimization [3,4].
However, industrial users of wind and hydro resources face a double dilemma in electricity trading [5]. During the peak period of electricity pricing, because wind power and photovoltaic power generation are greatly affected by climatic conditions and the adjustment ability of small hydropower is limited, these users have to rely on an external power grid to supplement electricity, which increases the cost of electricity purchase under the two-part electricity price. During periods of low electricity pricing, although some wind power, photovoltaic, and small hydropower resources can be used spontaneously or sold to the power grid, their power utilization and economic benefits are limited due to their inability to fully absorb surplus electricity and low electricity prices to the superior power grid [6]. Existing research has discussed users’ coping strategies in the process of purchasing and selling electricity. Reference [7] effectively adapts to the fluctuation of time-of-use electricity prices through the time sequence transfer of users’ electricity load and realizes the optimization of electricity purchase cost. In [8], a robust interval optimization model of price-based demand response considering the uncertainty of wind power and load was proposed for the optimal scheduling decision of users’ direct power purchase. Reference [9] optimizes the economy of industrial users’ purchase and sale of electricity by configuring energy storage; in Reference [10], aiming at the demand of the time-of-use electricity price mechanism over the background of new electricity price policies, a peak–valley time-of-use electricity price bi-level optimization model with the maximum profit of electricity retailers and the minimum cost of high-energy users is constructed. However, the above research fails to consider the power purchase cost and income dilemma of users during the peak and valley periods of electricity prices and ignores the collaborative optimization of demand electricity and electricity charges under the two-part electricity price, which leads to the limited economy of the optimization strategy.
Since the National Energy Administration issued the “Medium and Long-term Development Plan for Pumped Storage (2021–2035)” [11], pumped storage, as a mature energy storage technology, has been widely used in peak-shaving and valley-filling power systems, as well as in the promotion of new energy consumption [12], which presents economic benefits for users to purchase electricity. At present, many scholars have studied the configuration of the pumped storage capacity. In [13], considering the randomness and volatility of wind and solar power generation, a multi-energy complementary capacity optimization configuration model was constructed. Based on the two-part electricity price, a multi-objective optimization model was proposed in the literature [14]. The NSGA-II algorithm was used to optimize the pumped storage capacity configuration of the local power grid. Reference [15] proposed an optimal configuration model for a seawater desalination wind–solar–water complementary power generation system based on new energy. However, the above research mainly focused on centralized pumped storage power stations. Limited by factors such as geographical location and hydrological conditions, not all regions are suitable for the construction of pumped storage power stations. Distributed pumped storage power stations have high scheduling flexibility, a short construction period, and a low initial investment cost, which can better coordinate and optimize scheduling with small hydropower in the basin [16]. Reference [17] constructed a mixed-integer programming model with distributed pumped storage and multiple flexible resources and verified its flexibility through two-stage optimization. In [18], a joint planning method for a transmission network and distributed pumped storage was proposed, which realized the integration of wind and solar energy through two-stage optimization. In [19,20], it was suggested that the best way to integrate virtual power plants into South Africa ‘s national grid is to explore its potential in optimizing renewable energy utilization and enhancing grid stability and flexibility. In both [21,22], a day-ahead optimization model was proposed for managing renewable energy communities that integrate a variety of distributed small-scale energy storage systems and provide auxiliary services for the power system while maximizing the self-use of the community. The effectiveness of this model was verified by actual cases. Distributed pumped storage can not only effectively balance the fluctuation of different types of energy but also coordinate the utilization efficiency of hydropower in the basin, thus improving economic benefits. Therefore, by building a distributed pumped storage power station and using the “time-shift” characteristics of pumped storage, the industry can not only fully tap into the potential of clean energy utilization but also improve the operational economy of industrial users.
In the existing research, there are some problems in the pumped storage configuration of clean energy systems, such as geographical constraints, the insufficient coordinated scheduling of small hydropower basins, and insufficient economic optimization under two-part electricity prices. To this end, this paper proposes a distributed pumped storage capacity optimization configuration method that quantifies the hydraulic connection between power stations by constructing a basin hydraulic coupling matrix model and realizes multi-station coordinated scheduling to reduce water abandonment. At the same time, a two-layer optimization framework is established. The upper layer optimizes the allocation of pumped storage capacity, and the lower layer coordinates electricity demand and electricity sales revenue with the goal of minimizing user operating costs and considers the hydraulic coupling relationship between small hydropower and pumped storage power stations. The alternating direction multiplier method and CPLEX solver are used to solve the problem. The example shows that this method can not only improve the utilization rate of clean energy but also significantly reduce the user’s electricity cost through peak–valley arbitrage and demand optimization.

2. Construction of Clean Energy System

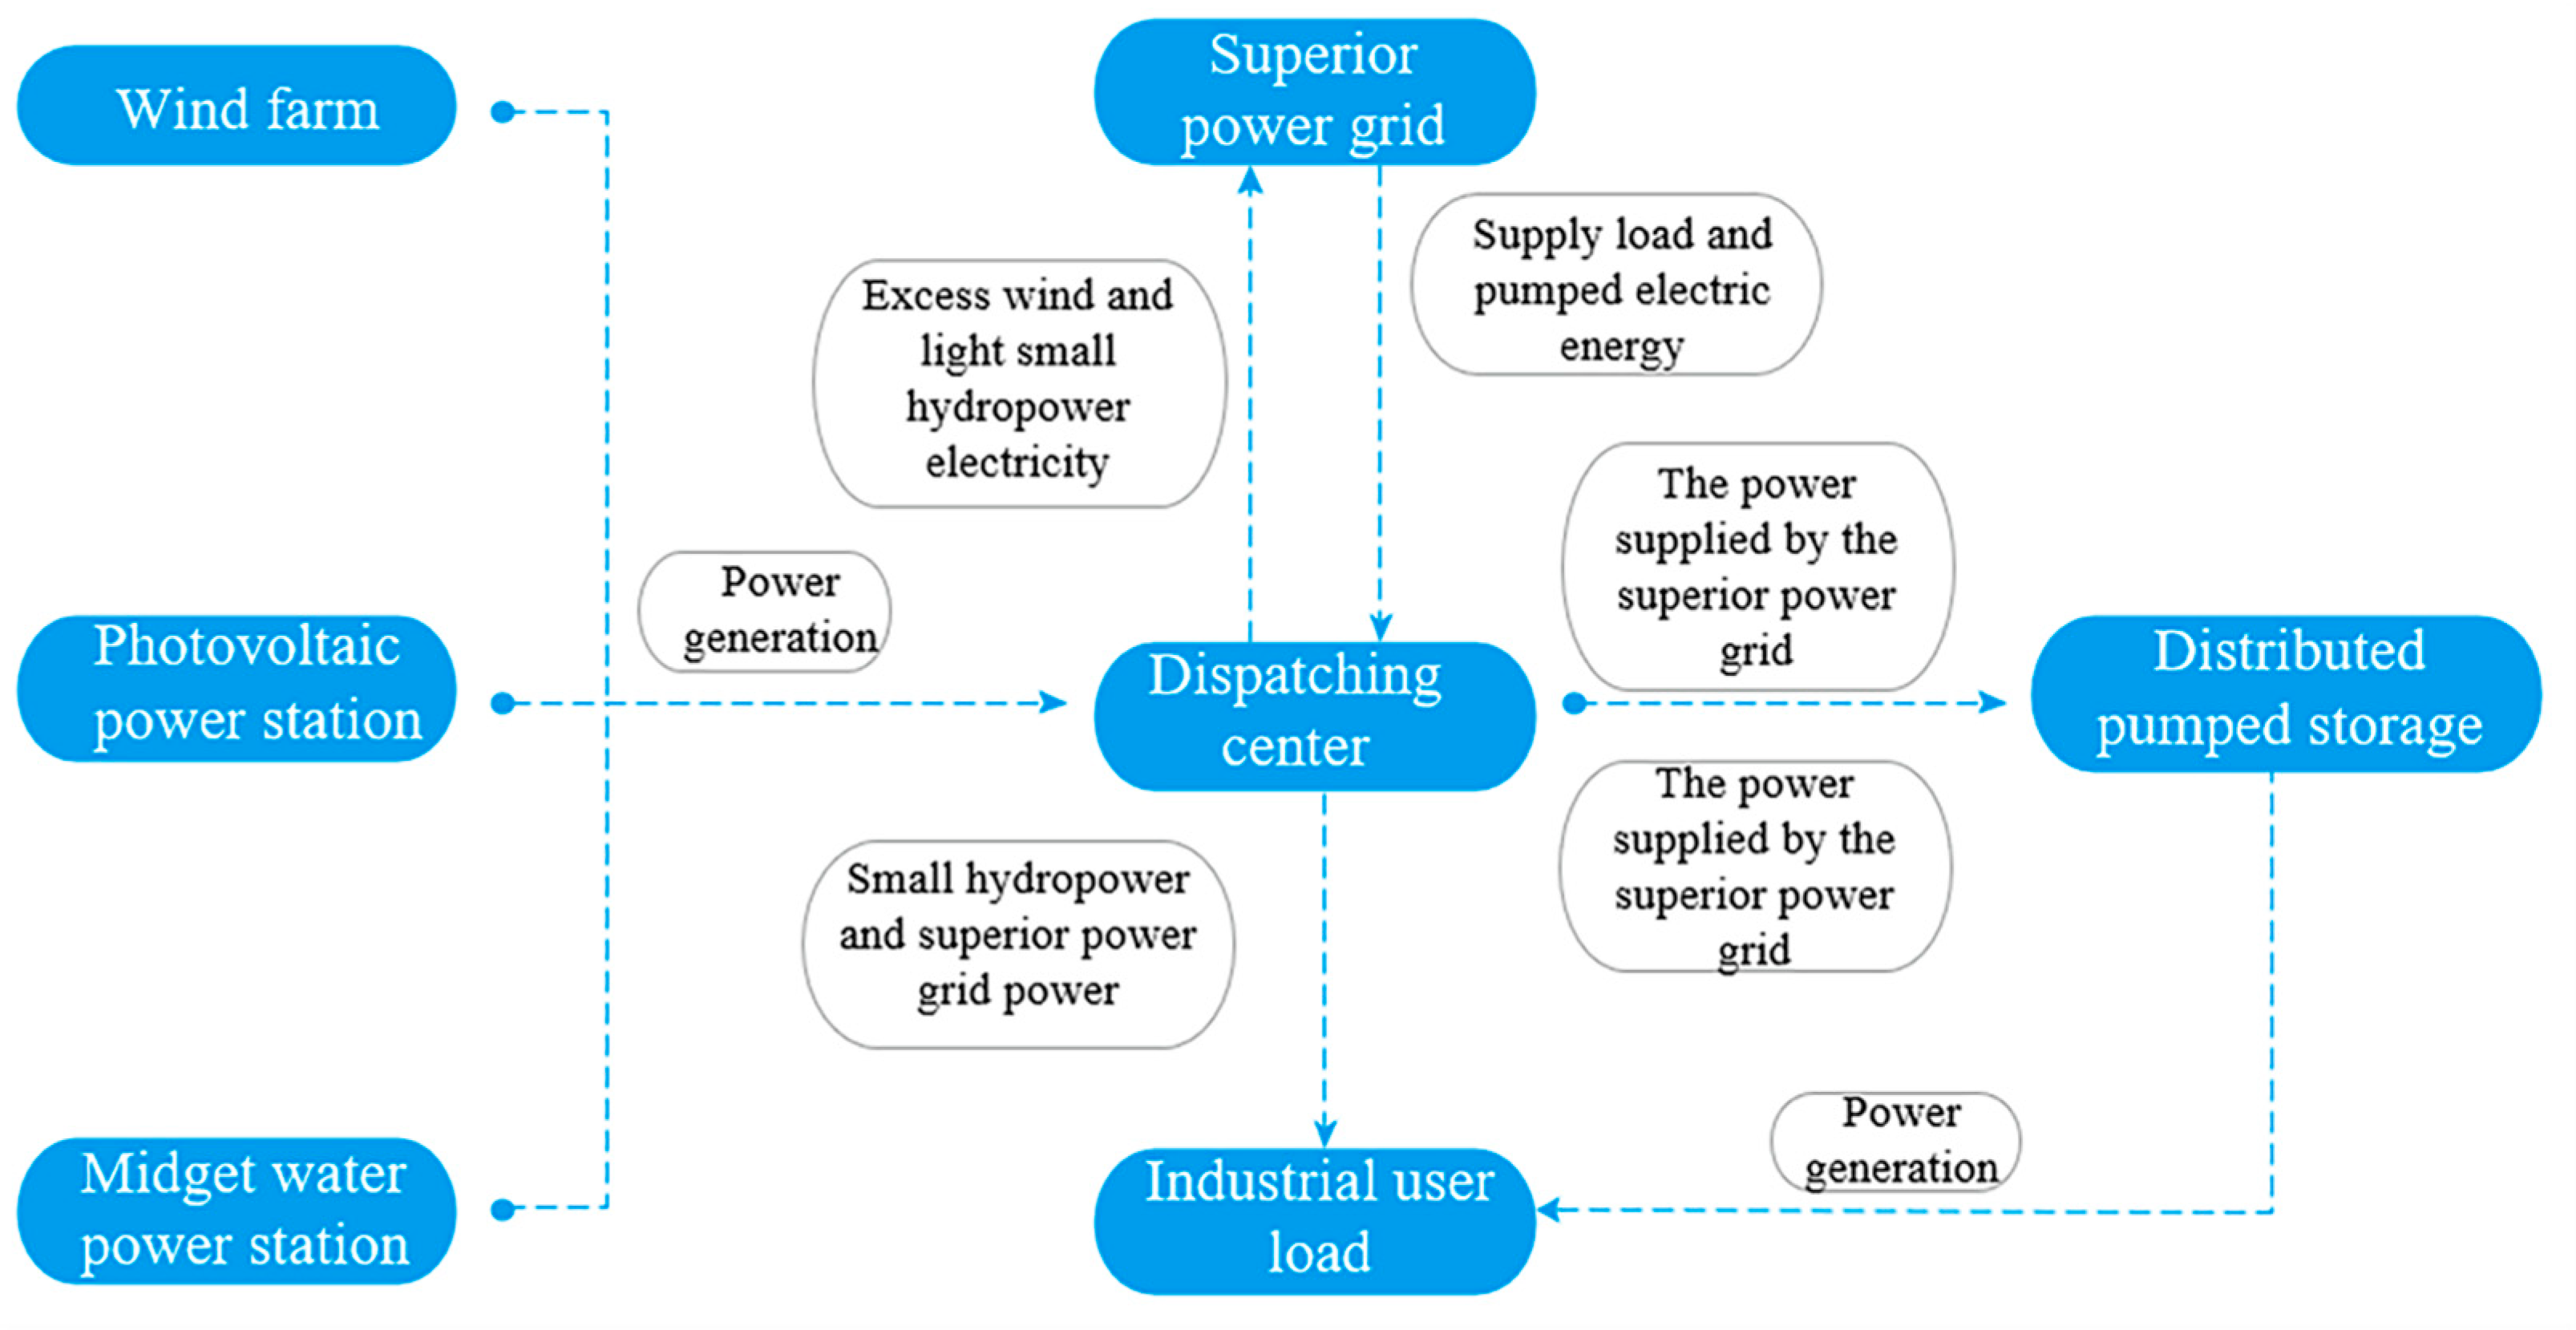
2.1. Electricity Purchase Billing Rules and System Structure Operation Mechanism

For some industrial users, the electricity charge for purchasing electricity from a superior power grid mainly includes two parts: demand electricity charges and electricity charges. Among these, at present, industrial users adopt the method of charging according to actual demand and calculate the maximum demand recorded by the actual purchase of electricity from the higher power grid every month, that is, the maximum value of the average purchase power per 15 min in January multiplied by the demand price. This paper studies this kind of billing form, and the electricity charge is calculated according to the user’s real-time purchase amount multiplied by the electricity price of the corresponding period.
In this study, an industrial user with wind power, photovoltaic, and hydropower resources in China is considered as the research object, and a wind–solar–water–pumping multi-energy complementary clean energy system is constructed. As shown in Figure 1, the system is mainly composed of wind farms, photovoltaic power stations, hydropower stations, distributed pumped storage power stations, industrial user loads, and control centers. During the period of low electricity price, if the output of wind power, photovoltaic power, and hydropower is greater than the user load, the pumped storage power station will start its pumping mode and use the excess electric energy for energy storage. If the outputs of wind, photovoltaic, and hydropower are not sufficient to support the pumping demand, power is purchased from the superior power grid to meet the pumping operation. On the contrary, during the peak period of electricity price, if the output of wind, solar, and hydropower is not sufficient to meet the power load of industrial users, the pumped storage power station will start its power generation mode to compensate for the difference, and the insufficient part will purchase electricity from the superior power grid.

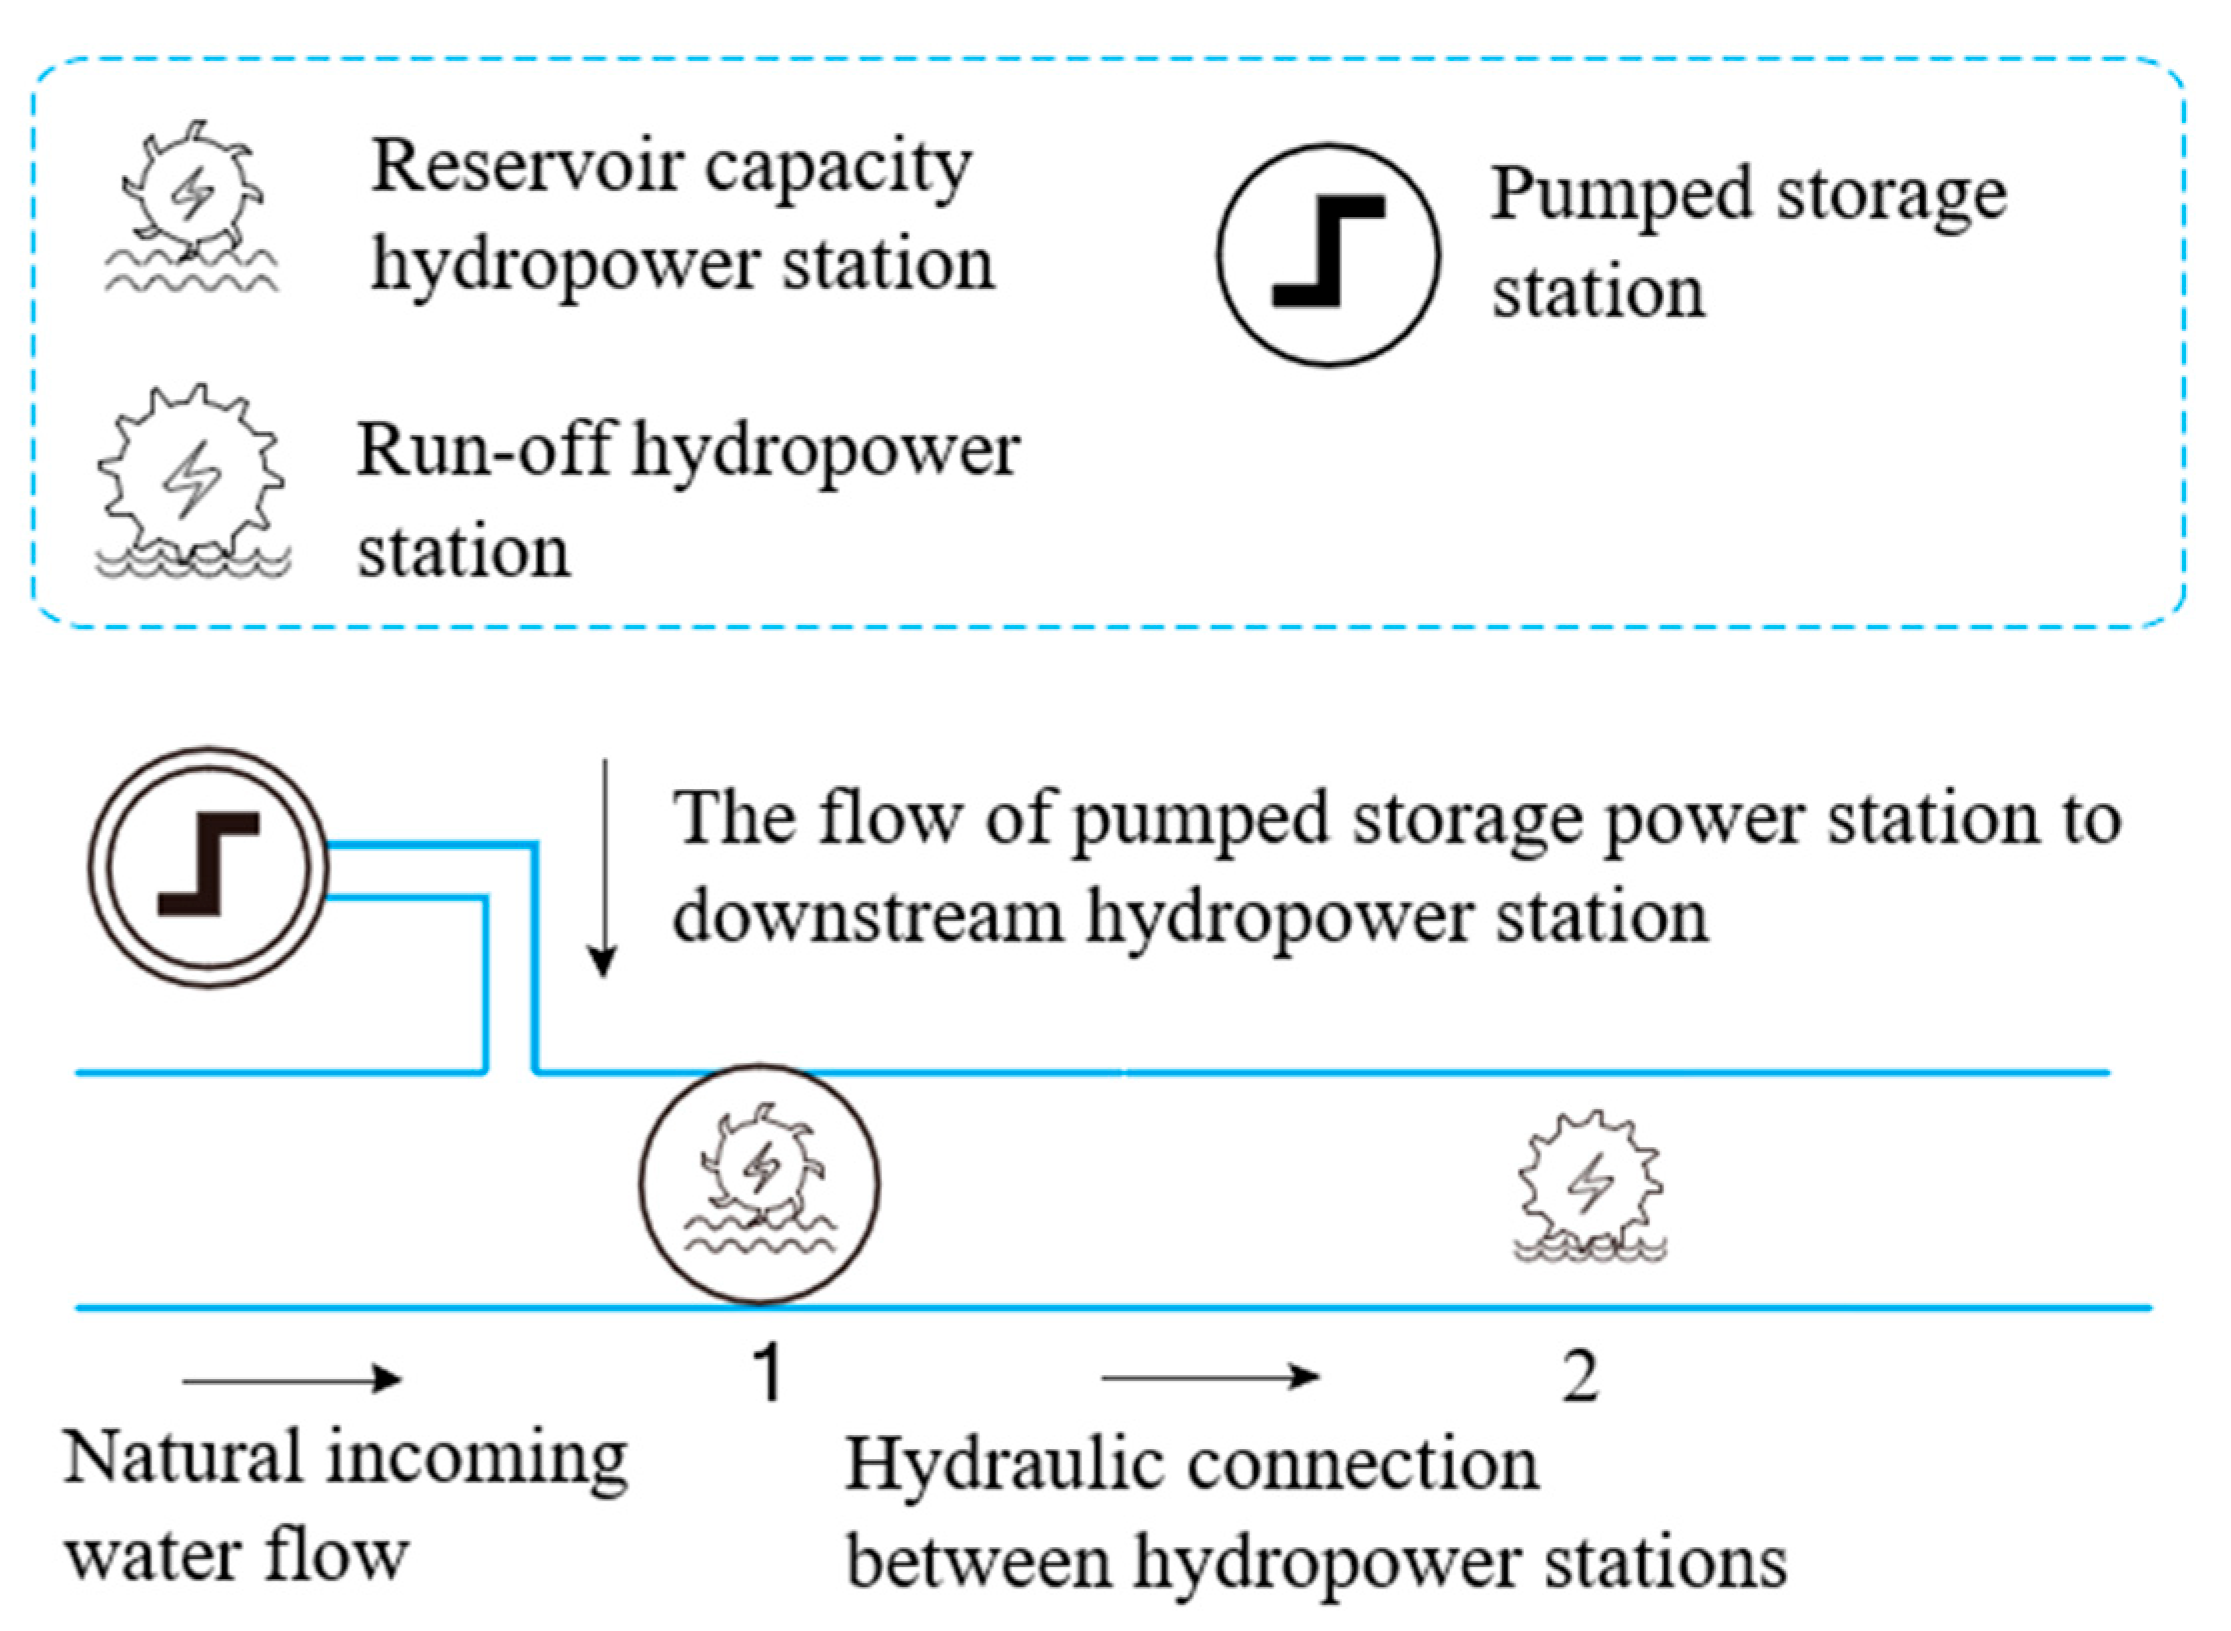
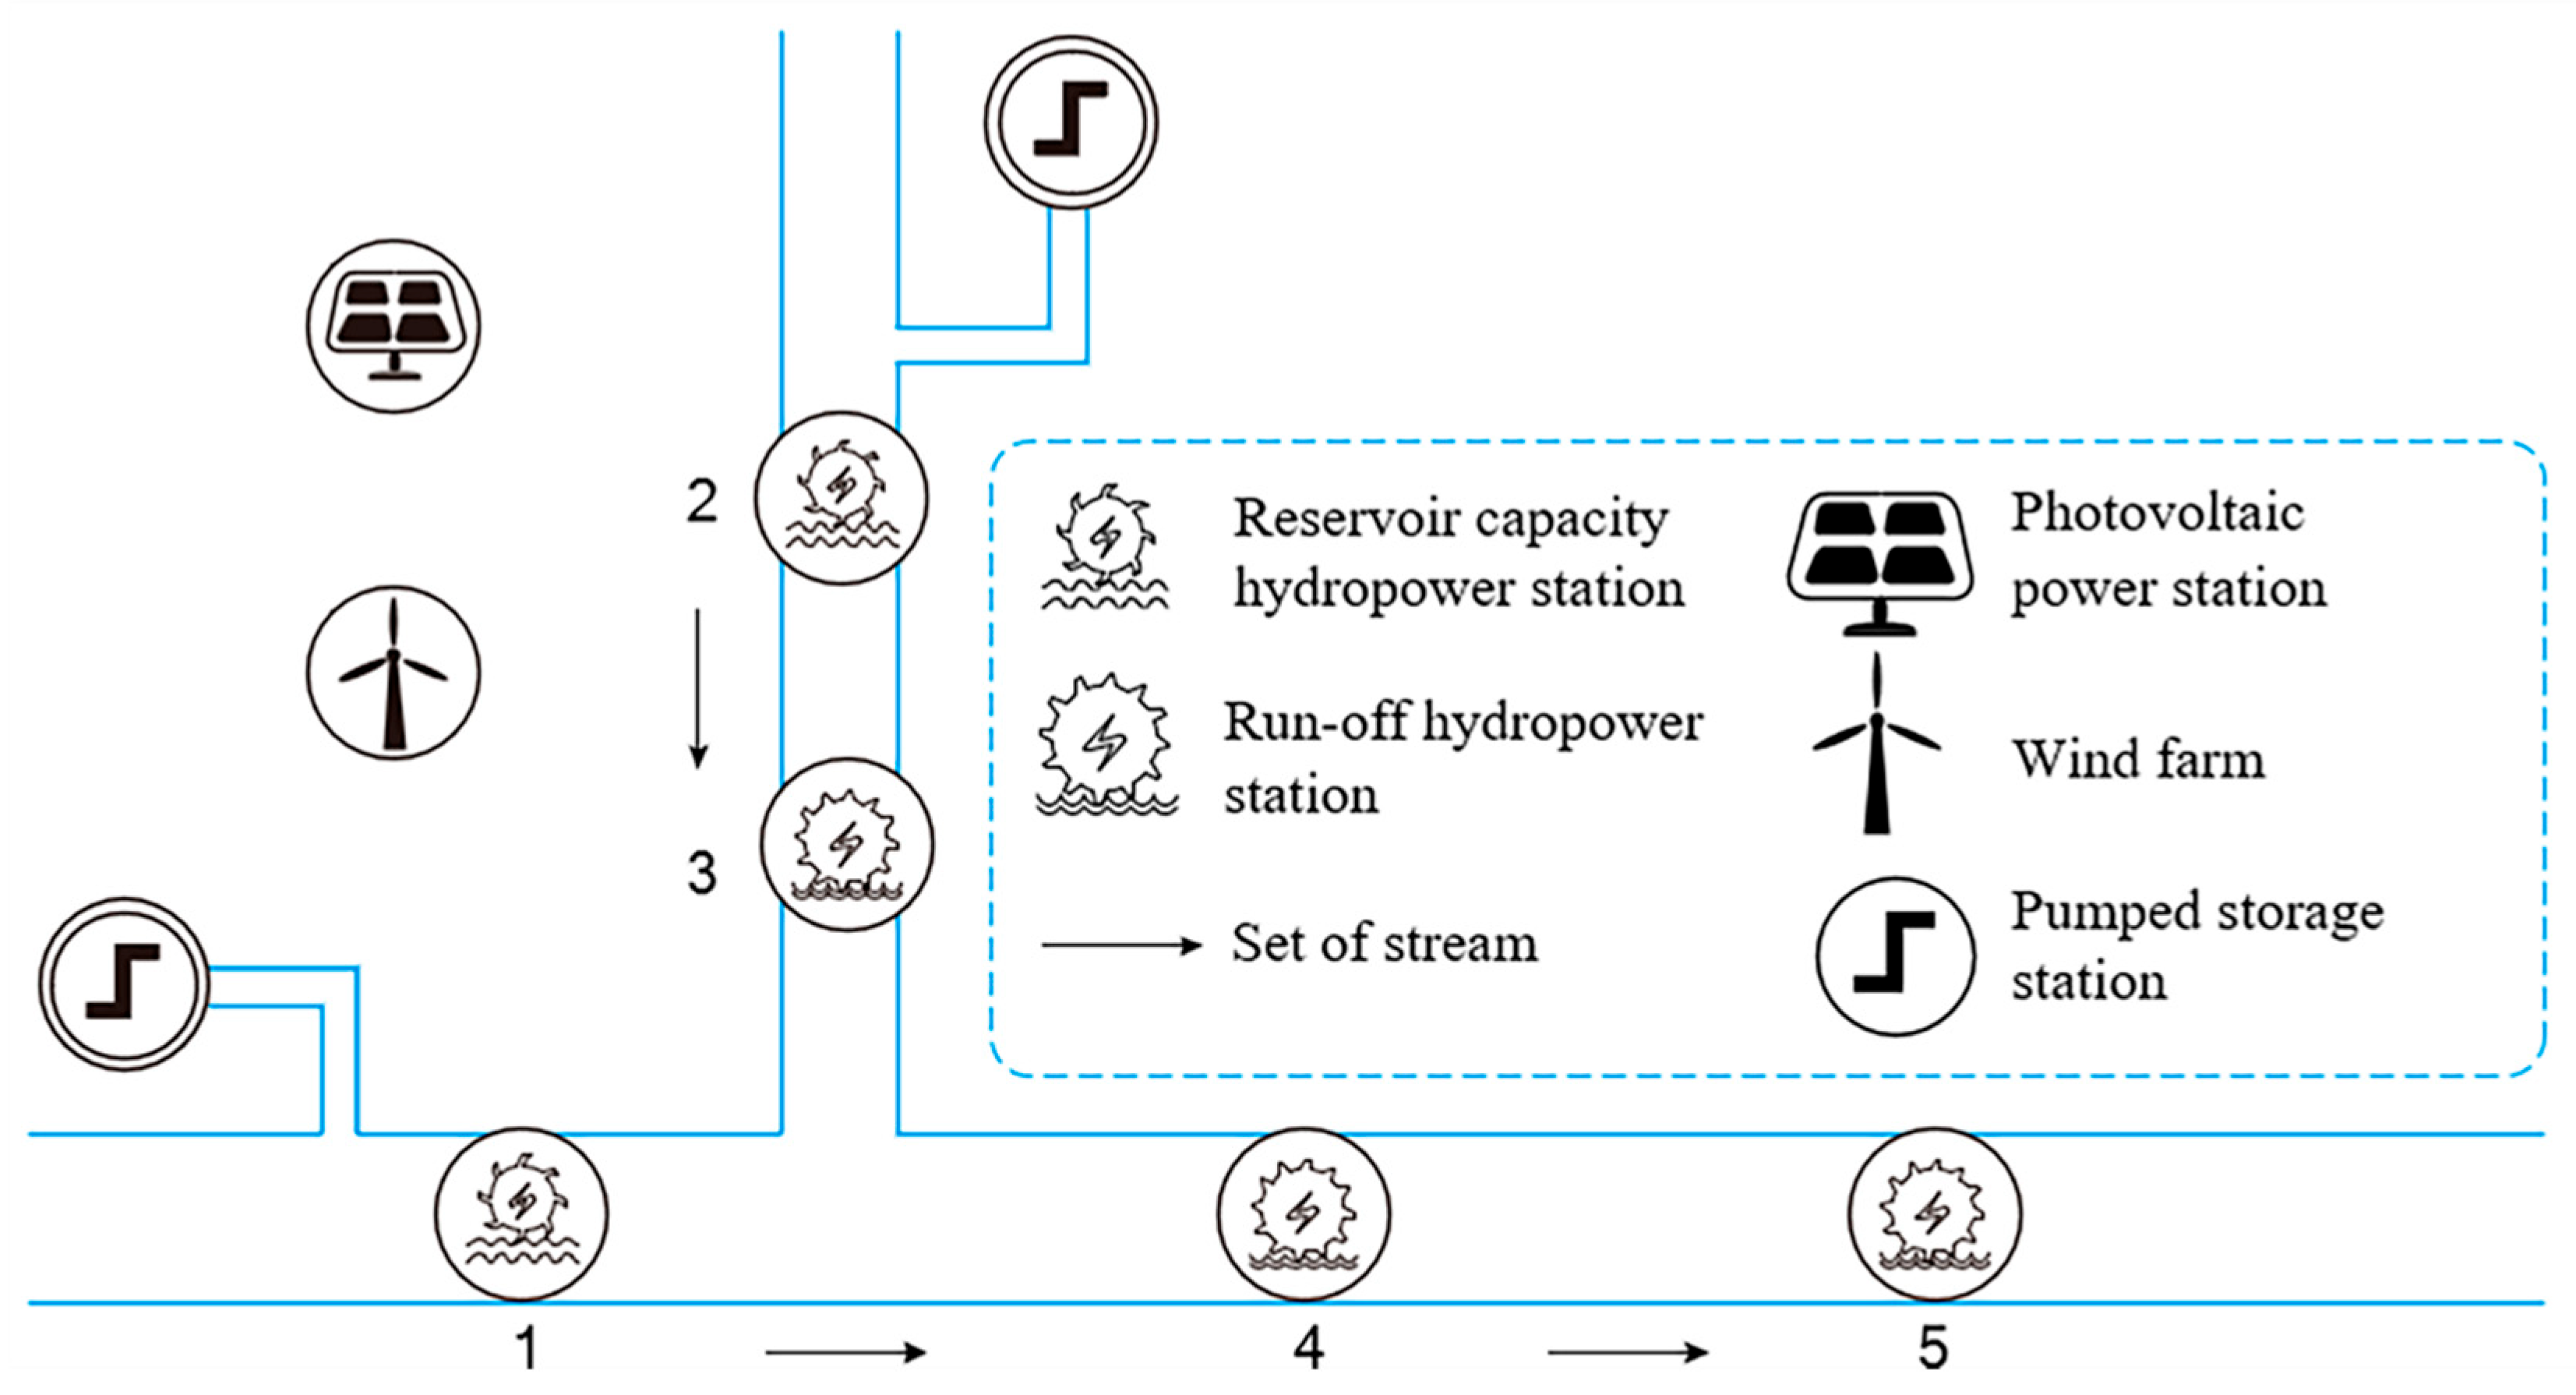
2.2. Basin Network Hydraulic Connection Coupling Characteristic Matrix

In the cascade hydropower system, the outflow of the upstream hydropower station directly constitutes the main water source of the downstream hydropower station, and there is an evident hydraulic coupling relationship between the two. In addition, the construction of pumped storage power stations in the basin will further affect the original hydraulic coupling relationship. If the hydraulic connection between the upstream and downstream power stations is not effectively coordinated, it will not only lead to a reduction in the utilization rate of hydropower resources but may also lead to the aggravation of the problem of abandoned water or a decrease in the utilization rate of the water head due to the unreasonable flow distribution. Therefore, the construction of an accurate watershed hydraulic correlation model is helpful for formulating a more scientific and reasonable operational optimization strategy.
Based on the modeling method of topology and branch impedance in the power network theory, this study constructs a type of hydropower station and assesses whether there is a hydraulic coupling relationship between hydropower stations, and the relationship between the hydropower stations and pumped storage power stations is then input into a matrix set to characterize the coupling characteristics of the hydropower stations and pumped storage power stations. The matrix set can flexibly adjust the operation parameter assignment of each power station according to different operation scenarios and realize efficient storage and convenient calls of relevant information. The specific construction method is as follows:
(1)
Type vector of hydropower station M t
M t = d i N × 1 ,
where M t is the type of n watershed network node. The element M t takes 1 or 0 (i = 1, 2, 3 … n), and the corresponding nodes are the nodes of the hydropower station with a storage capacity and the nodes of the runoff hydropower station.
(2)
Water area correlation matrix M c
M c = c i j N × N ,
where M c is the flow direction of N hydropower stations; c i j is the M c element value; c i j = 0 indicates that there is no hydraulic connection between node i and j ; c i j = 1 indicates that the flow direction is node j flowing to node i ; and c i j = 1 indicates that the flow direction is i flowing to node j .
(3)
Correlation matrix between hydropower station and pumped storage M w
M w = e n i M × N ,
where M W indicates the connection between the hydropower station and pumped storage, e n i = 0 indicates that there is no hydraulic connection between the pumped storage power station n and hydropower station i , and e n i = 1 indicates that there is a hydraulic connection between the pumped storage power station n and hydropower station i and the pumped storage power station flows to the hydropower station.
In Figure 2, the hydraulic connection between the hydropower stations is shown. This paper considers the hydraulic coupling relationship between hydropower stations and the hydraulic coupling relationship between pumped storage power stations and hydropower stations.

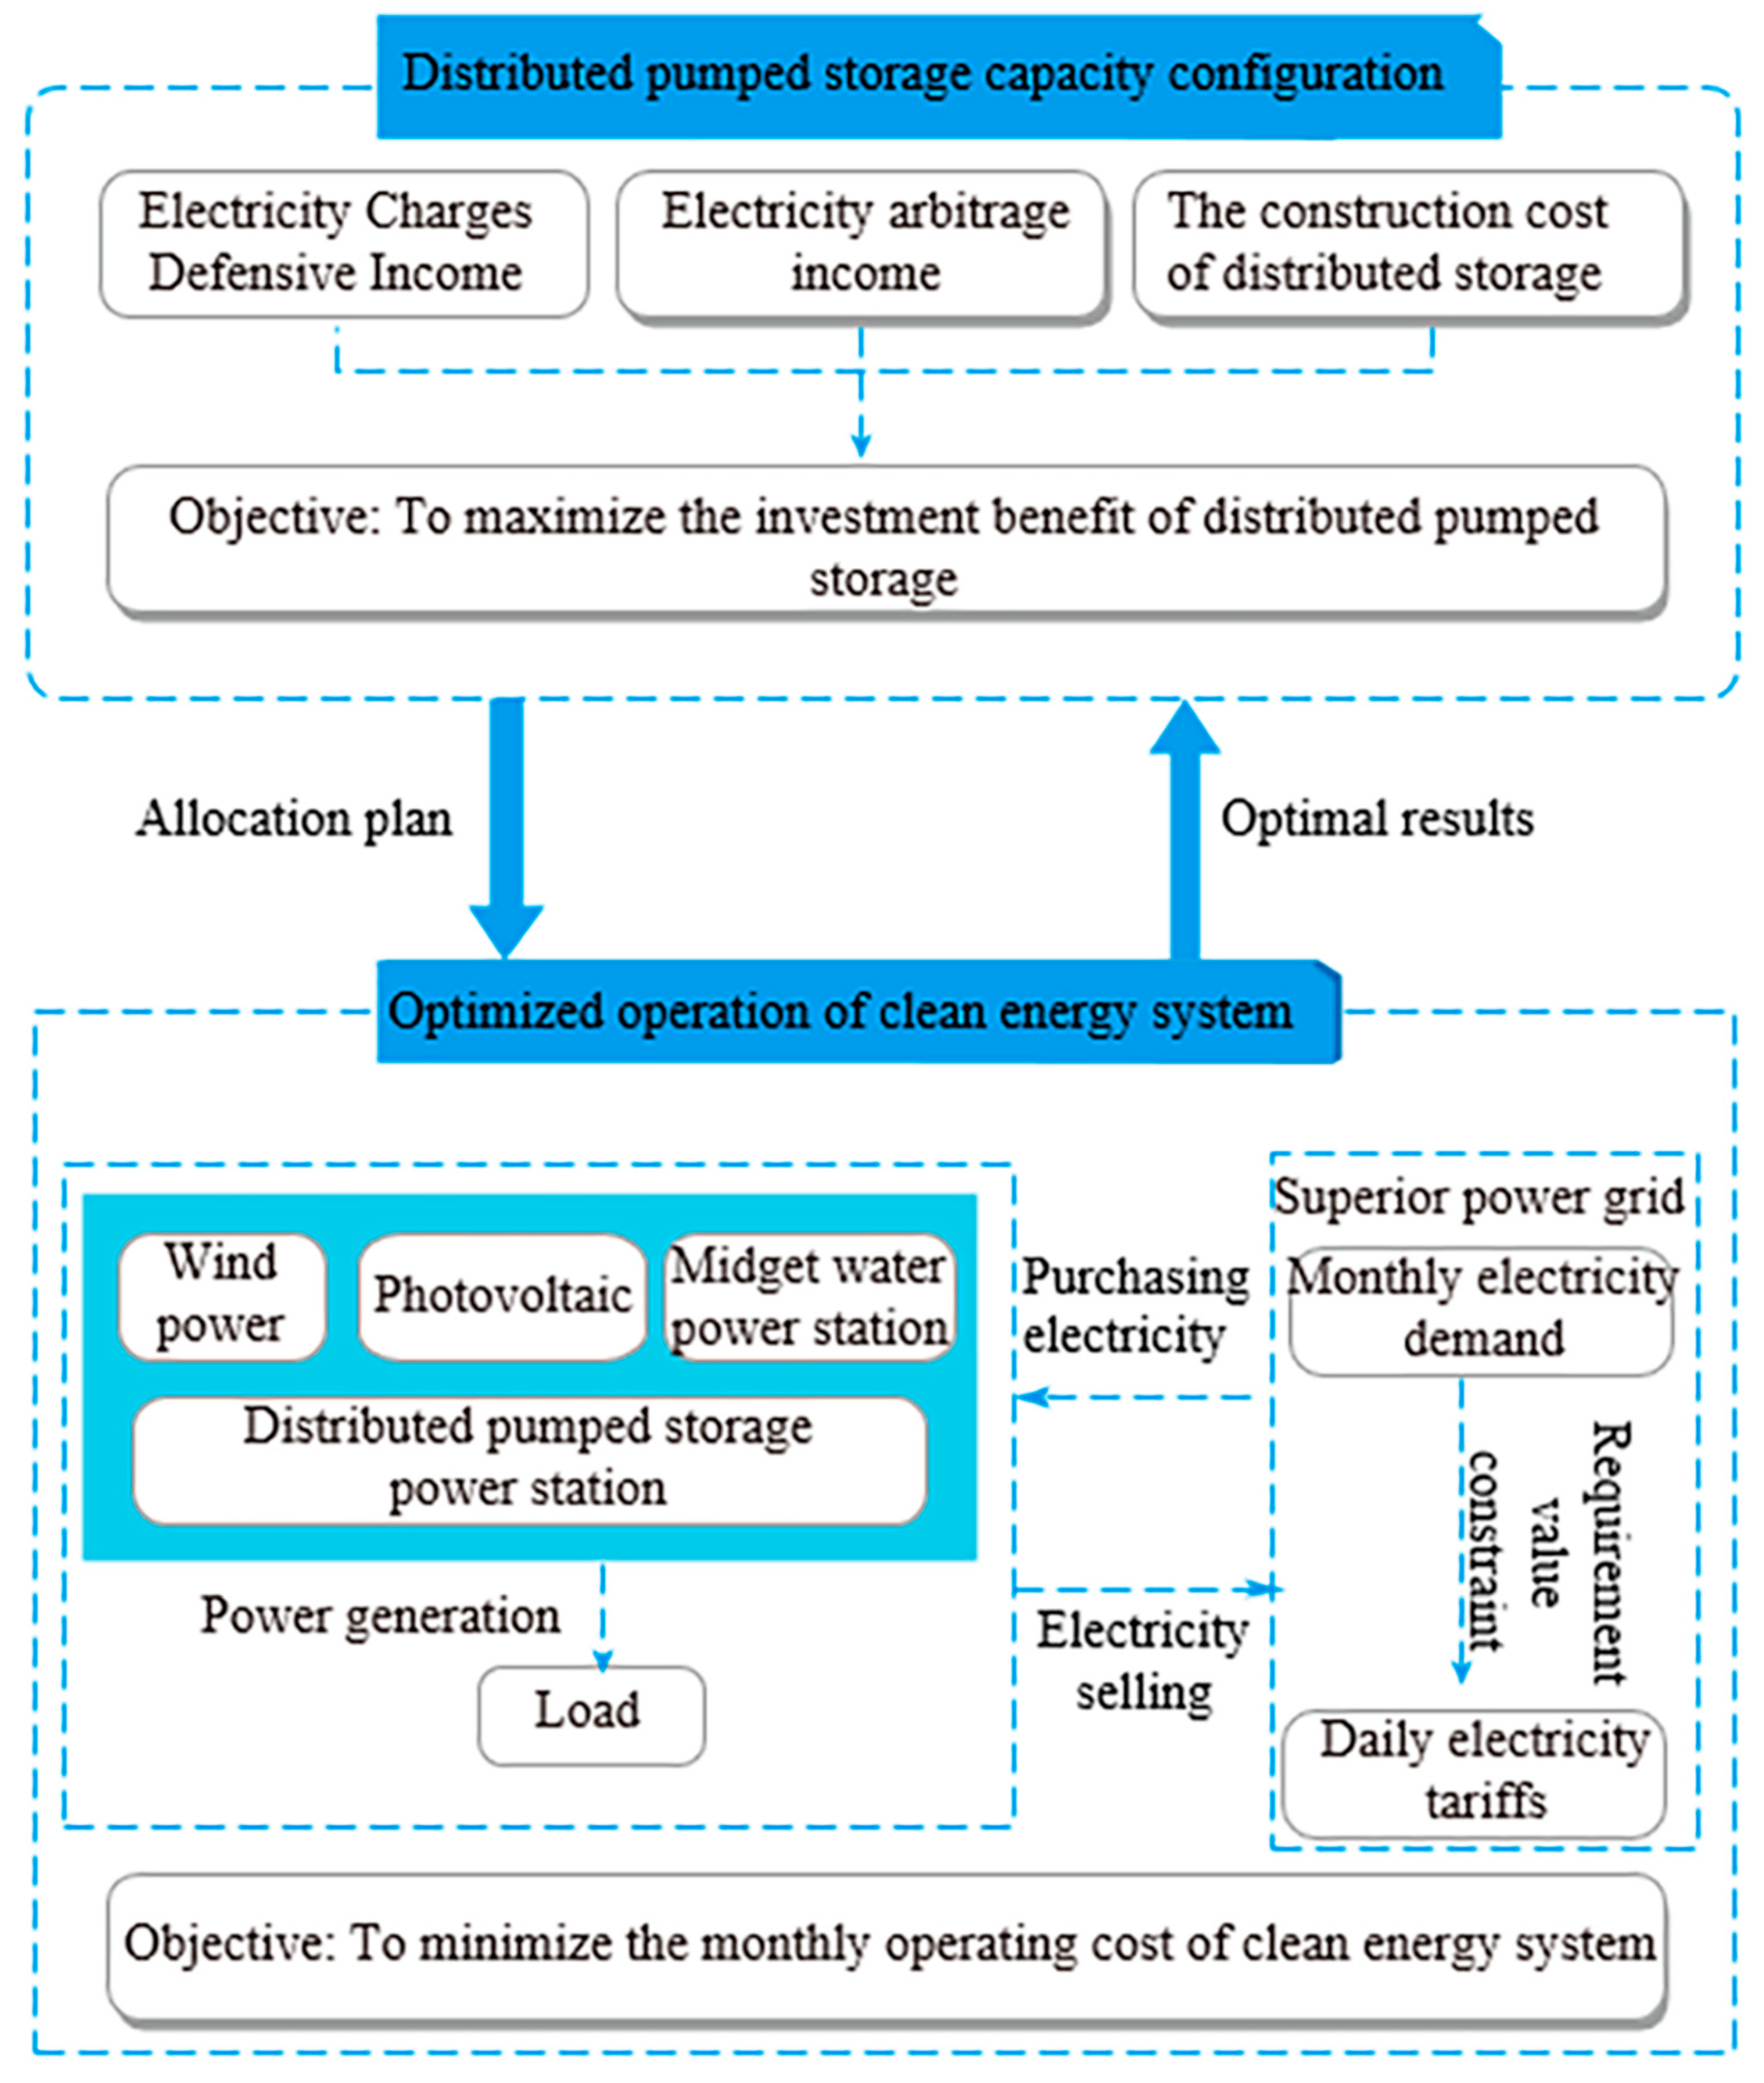
2.3. Capacity Optimization Configuration Framework of Distributed Pumped Storage Power Station with Clean Energy System

This study constructs a distributed pumped storage power station capacity optimization configuration framework for clean energy systems, as shown in Figure 3. The framework adopts a two-layer optimization structure in which the upper layer is used for capacity allocation. Considering the defensive income of pumped storage demand, arbitrage income of the electricity charge, and construction cost of distributed pumped storage, the allocation scheme of the installed capacity is optimized to maximize its investment benefit while optimizing the pumped storage, power generation, and electricity purchase demand, and the results are transmitted to the lower layer of the model.
The lower layer is used to simulate the optimal operation of the clean energy system considering the hydraulic coupling relationship between the hydropower station and the pumped storage power station, the electric energy supplied by the clean energy to the user load, and the electric energy transaction between the system and the upper power grid. This layer aims to minimize the monthly operating cost of the clean energy system, optimize the operation strategy of pumped storage with the maximum demand for electricity purchase as the constraint, and feed the updated operation plan back to the upper layer. Through alternating iterations of the two-layer model, the optimal combination of capacity configuration and operation strategy is finally obtained.

3. Two-Layer Optimal Allocation Model of Distributed Pumped Storage Capacity with Clean Energy System

3.1. Upper Distributed Pumping Capacity Configuration Model

3.1.1. Objective Function

The upper model maximizes the investment benefit of the distributed pumped storage as the objective function to optimize the installed capacity of the pumped storage to be built by users. The investment benefit mainly includes three parts: the defensive income of electricity demand, arbitrage income of the electricity price, and investment cost of distributed pumped storage. Industrial users adopt a two-part electricity price, in which the demand electricity price is calculated by multiplying the peak value of the average purchase power of 15 min in the month by the demand price, and the electricity price is calculated according to the time-of-use electricity price and the actual electricity consumption. The specific expression for the objective function is as follows:
m a x F 1 = C f , l + d = 1 D l C d C z , p 12 T a ,
where C f , l is the monthly demand defense income in month l ; C d is the daily electricity arbitrage income on day d ; C z , p is the investment cost of building distributed pumped storage; T a is the duration of the project; and D l is the number of running days in month l .
Users build and discharge pumped storage during peak hours to reduce their actual maximum demand, thereby generating monthly demand defense benefits. The calculation formula is as follows:
C f , l = m l n = 1 M P L p , l n , g ,
where, m l is the demand price in month l ; M is the total number of pumped storage power stations; n is the power station serial number; and P L p , l n , g is the power generation power of pumped storage power station l when the user purchases the maximum power in month n .
The time-of-use electricity price mechanism is adopted for the electricity purchase of industrial users. Pumped storage is charged during the valley electricity price period and discharged during the peak electricity price period. The peak–valley electricity price difference can be used to generate the electricity charge income of the pumped storage. The specific calculation methods are as follows.
C d = t = 1 Z m t ( n = 1 M P d , t n , g n = 1 M P d , t n , p ) Δ t ,
where m t is the electricity price at time t ; P d , t n , g is the power generation of the n power station at t moment on day d ; P d , t n , p is the power purchased from the power grid at time t on day d of the n pumping station; Z is the total number of daily time points; and Δ t is the length of the time window.
The investment cost of the pumped storage power stations includes their construction, operation and maintenance, and turbine replacement costs. The specific expressions are as follows:
C z , p = n = 1 M C i n + C o + C r C i n = C n , p P n , r p + C n , p i + C n , v V n C o = a = 1 T a C o , p P n , r p + C o , w V n 1 + r a C r = C n , r e p P n , r p 1 + r T p C n , r e p P n , r p 1 + r T a T p N x + 1 T a T p ,
where, C i n is the construction cost of the distributed pumped storage; C r is the replacement cost of the turbine; C o is the operation and maintenance cost of the pumped storage power station; C n , p is the unit price per kilowatt of the installed capacity of the reversible pump turbine of the n pumped storage power station; P n , r p is the installed capacity of the n pumped storage power station; C n , v is the unit storage capacity construction cost of the n pumped storage power station; C n , p i is the cost of erecting water pipelines; C o , p is the unit operation and maintenance cost of the installed capacity; r is the discount rate; V n is the storage capacity volume of the pumped storage power station n ; C o , w is the operation and maintenance cost of the unit storage capacity; C n , r e p is the unit capacity replacement cost of the turbine of the n pumped storage power station; the whole life cycle of the turbine is T p ; and N x is the number of replacements in the project’s life.

3.1.2. Constraints

(1)
Pumping storage unit installed capacity constraints
0 P n , r p P r p , max ,
where P r p , max is the upper limit of the installed capacity of a pumped storage power station.
(2)
The storage capacity constraint of pumped storage power station
V min V n V max ,
where V min and V max are the lower and upper limits of upstream storage volume, respectively.

3.2. Operation Optimization of Lower Clean Energy System

3.2.1. Objective Function

The optimal operation of the lower level minimizes the monthly comprehensive cost of the clean energy system. The monthly comprehensive cost includes the electricity tariffs, electricity demand tariffs, unsuitable costs, and electricity sales revenue. The objective function is expressed as follows:
min F 2 = E g E s ,
where E g is the cost to purchase electricity for the system and E s is the electricity sales revenue of the system.
The monthly electricity purchase cost of the system is divided into electricity demand and electricity consumption. The calculation method is as follows:
E g = E l + d = 1 D E d ,
E l = m l P l , max s y , g ,
E d = t = 1 Z m t P d , t s y , g Δ t ,
P d , t s y , g = D e , d , t n = 1 M P d , t n , g + n = 1 M P d , t n , p i = 1 N P d , t i , g P d , t w P d , t v ,
where E l is the electricity demand for the month of l ; E d is the electricity charge on the d day of the month; P l , max s y , g is the maximum purchase power of industrial users in month l ; i is the serial number of the hydropower station; D e , d , t is the total load of industrial users at time t on day d ; P d , t i , g is the power generation of the i hydropower station at time t on day d ; P d , t w is the wind power generation power at time t on day d ; P d , t v is the photovoltaic power generation at time t on day d ; and P d , t s y , g is the purchase power of the clean energy system.
The electricity sales revenue from the comprehensive cost of the system is calculated as follows:
E s = t = 1 Z m s , t P d , t s y , s Δ t ,
P d , t s y , s = P d , t w + P d , t v + k = 1 N P d , t i , g + n = 1 M P d , t n , g n = 1 M P d , t n , p D e , d , t ,
where m s , t is the electricity price at time t , and P d , t s y , s is the electricity sales power of the clean energy system.

3.2.2. Constraint Conditions

(1)
Output power constraint
0 P d , t w P w , max ,
0 P d , t v P v , max ,
P min i , g P d , t i , g P max i , g ,
where P w , max is the upper limit of the output power of the photovoltaic power station, P v , max is the upper limit of the output power of the wind farm, P max i , g is the maximum power generation of the hydropower station, and P min i , g is the minimum power generation of the station.
(2)
System power balance
D e , d , t + n = 1 M P d , t n , p + P d , t s y , s = n = 1 M P d , t n , g + i = 1 N P d , t i , g + P d , t w + P d , t v + P d , t s y , g ,
(3)
Sectional constraints [23]
0 n = 1 M P d , t n , g n = 1 M P d , t n , p + i = 1 N P d , t i , g + P d , t w + P d , t v P max z ,
where P max z is the maximum power of the output line transmission of the new energy system for industrial users.
(4)
Operation constraints of pumped storage power station
x d , t n , g + x d , t n , p 1 ,
x d , t n , g P min n , g P d , t n , g x d , t n , g P max n , g ,
x d , t n , p P min n , p P d , t n , p x d , t n , p P max n , p ,
where x d , t n , g and x d , t n , p are in the operation mode of the pumped storage power station on the d day’s t period, and their pumping and power generation states are characterized by binary variables: when the variable value is 1, it means that the power station is in the corresponding pumping or power generation state; when the variable value is 0, it means that the power station is not in this state. P min n , g and P max n , g are the minimum and maximum power generation of the pumped storage power station n in the power generation state, and P min n , p and P max n , p are the minimum pumping power and maximum pumping power of the pumped storage power station n in the pumping state, respectively.
(5)
Operation constraints of hydropower station in basin
P d , t i , g = g η i h H d , t i , h Q d , t i , h ,
where η i h is the power generation efficiency of the basin hydropower station i ; g is the acceleration due to gravity; H d , t i , h and Q d , t i , h are the net water head and power generation flow of the hydropower station i in the basin at time t on day d .
(6)
Constraints of hydropower station output and upper and lower limits of reservoir capacity
min 0 , d i V min i , h V d , t i , h max 0 , d i V max i , h ,
P min i , g P d , t i , g P max i , g ,
where V min i , h and V max i , h are the lower and upper limits of the storage capacity of the hydropower station i . P min i , g and P max i , g are the minimum and maximum outputs of hydropower station i , respectively.
(7)
Reservoir capacity constraint of pumped storage power station
V d , t + 1 n = V d , t n + Q d , t n , r Q d , t n , q Q d , t n , s Δ t ,
where V d , t n is the storage capacity of the pumped storage power station at time t on day d , and Q d , t n , r , Q d , t n , q , and Q d , t n , s are the inflow flow, abandoned water flow, and power generation discharge flow, respectively, at time t on day d of the pumped storage power station.
(8)
Spatial coupling relationship constraint of hydropower station
Q d , t i , r e q = i , j M max ( c i j , 0 ) Q d , t j , r ,
Q d , t r = Q d , t h + Q d , t o ,
where Q d , t i , r e q represents the hydraulic associated flow between the hydropower station i and other hydropower stations at time t on day d ; Q d , t r , Q d , t h , and Q d , t o represent the discharge flow, power generation flow, and abandoned water flow of the hydropower station at time t on day d .
(9)
Reservoir balance of hydropower station in basin
min ( 0 , d i ) V d , t i = min ( 0 , d i ) V d , t i + ( Q d , t i , r e q + D d , t i , q Q d , t i , q Q d , t i , s ) Δ t ,
D d , t i , q = n , i H max ( e n i , 0 ) ( Q d , t n , q + Q d , t n , s ) ,
where D d , t i , q is the associated flow of hydropower station i and the pumped storage; V d , t i , Q d , t i , q , and Q d , t i , s are the reservoir capacity, abandoned water flow, and power generation flow of hydropower station i at time t on day d ; and H represents the collection of pumped storage and hydropower stations in the basin.
(10)
Hydropower station power generation flow constraints
Q min i , h Q d , t i , h Q max i , h ,
(11)
Discharge constraint of small hydropower
Q min i , s Q d , t i , s Q max i , s ,
(12)
Reservoir capacity constraints at the beginning and end of scheduling
V d , 0 n = V d , 96 n ,
where V d , 0 n is the storage capacity of the pumped storage power station n at the initial time of scheduling on day d , and V d , 96 n is the storage capacity of pumped storage power station n at the beginning and end of the scheduling on day d .
(13)
Purchase and sale of electricity mutually exclusive constraints
P d , t s y , g × P d , t s y , p = 0 ,
(14)
Purchasing and selling power transmission constraints
P min s y , s P d , t s y , s P max s y , s ,
P min s y , g P d , t s y , g P max s y , g ,
where P min s y , s and P max s y , s are the minimum and maximum power of the system to sell electricity to the superior power grid, respectively, and P min s y , g and P max s y , g are the minimum and maximum power of the system to purchase electricity from the superior power grid.
(15)
Load power constraint
D d , t + n = 1 M P d , t n , p D max , l ,

4. Model Solving

The alternating Direction Method of Multipliers is a distributed optimization algorithm that combines dual decomposition and the augmented Lagrangian method. It has the advantages of strong decomposition, reliable convergence, and a high parallel efficiency [24]. The algorithm supports time slice parallel computing, which significantly improves the efficiency of solving monthly scale optimization problems. It can solve the two subproblems of complex global problems alternately. Simultaneously, the Lagrangian multiplier is used to coordinate the hydraulic coupling constraints and storage capacity continuity requirements across the time slices. The optimal operation model of the lower system constructed in this study belongs to a multiconstraint nonlinear optimization problem, which contains several complex nonlinear constraints. Because the nested solution of multiple optimization algorithms may lead to a significant decrease in the solution efficiency, this study first linearizes the nonlinear constraints in the model to improve the overall optimization efficiency and computational stability.

4.1. Model Transformation

Equation (36) consists of two decision variables. Because the system purchase power and the system sale power are subject to the above power constraints, two 0–1 variables are introduced to linearize Equation (36). The specific expressions are as follows:
β d , t s y , s P min s y , s P d , t s y , s β d , t s y , s P max s y , s P d , t s y , g β d , t s y , g P min s y , g P d , t s y , g β d , t s y , g P max s y , g 0 β d , t s y , s + β d , t s y , g 1 ,
where β d , t s y , g and β d , t s y , s are the state variables of power purchase and sale of the system, respectively. β d , t s y , g , β d , t s y , s 0 , 1 , and β d , t s y , g = 1 indicate that the system is in a state of power purchase at the time of day d , and β d , t s y , s indicates that the system is in a state of power sale at the time of day d .
For Equations (22)–(24), because P min n , g , P max n , g , P min n , p , and P max n , p in the above constraints are related to the installed capacity, they are multiplied by x d , t n , g and x d , t n , p to form a nonlinear constraint. In this study, McCormick was used to transform double nonlinear constraints into linear constraints. The specific expressions are as follows:
ω 1 x d , t n , g Y min ω 1 Y + x d , t n , g Y max Y max ω 1 Y + x d , t n , g Y min Y min ω 1 x d , t n , g Y max ρ n , min g ω 1 P d , t n , g ρ n , max g ω 1 ,
ω 2 x d , t n , p Y min ω 2 Y + x d , t n , p Y max Y max ω 2 Y + x d , t n , p Y min Y min ω 2 x d , t n , p Y max ρ n , min p ω 2 P d , t n , p ρ n , max p ω 2 ,
where ω 1 and ω 2 are transformed linear variables, and Y , Y min , and Y max are the installed capacity, minimum installed capacity, and maximum installed capacity of the pumped storage power station, respectively. ρ n , min g and ρ n , max g are the lower limit of pumped storage power generation and the conversion coefficient of the installed capacity, and the upper limit of pumped storage power generation and the conversion coefficient of the installed capacity, respectively. ρ n , min p and ρ n , max p are the upper limits of the pumped storage pumping power, conversion coefficient of the installed capacity, lower limit of the pumped storage pumping power, and conversion coefficient of the installed capacity, respectively.

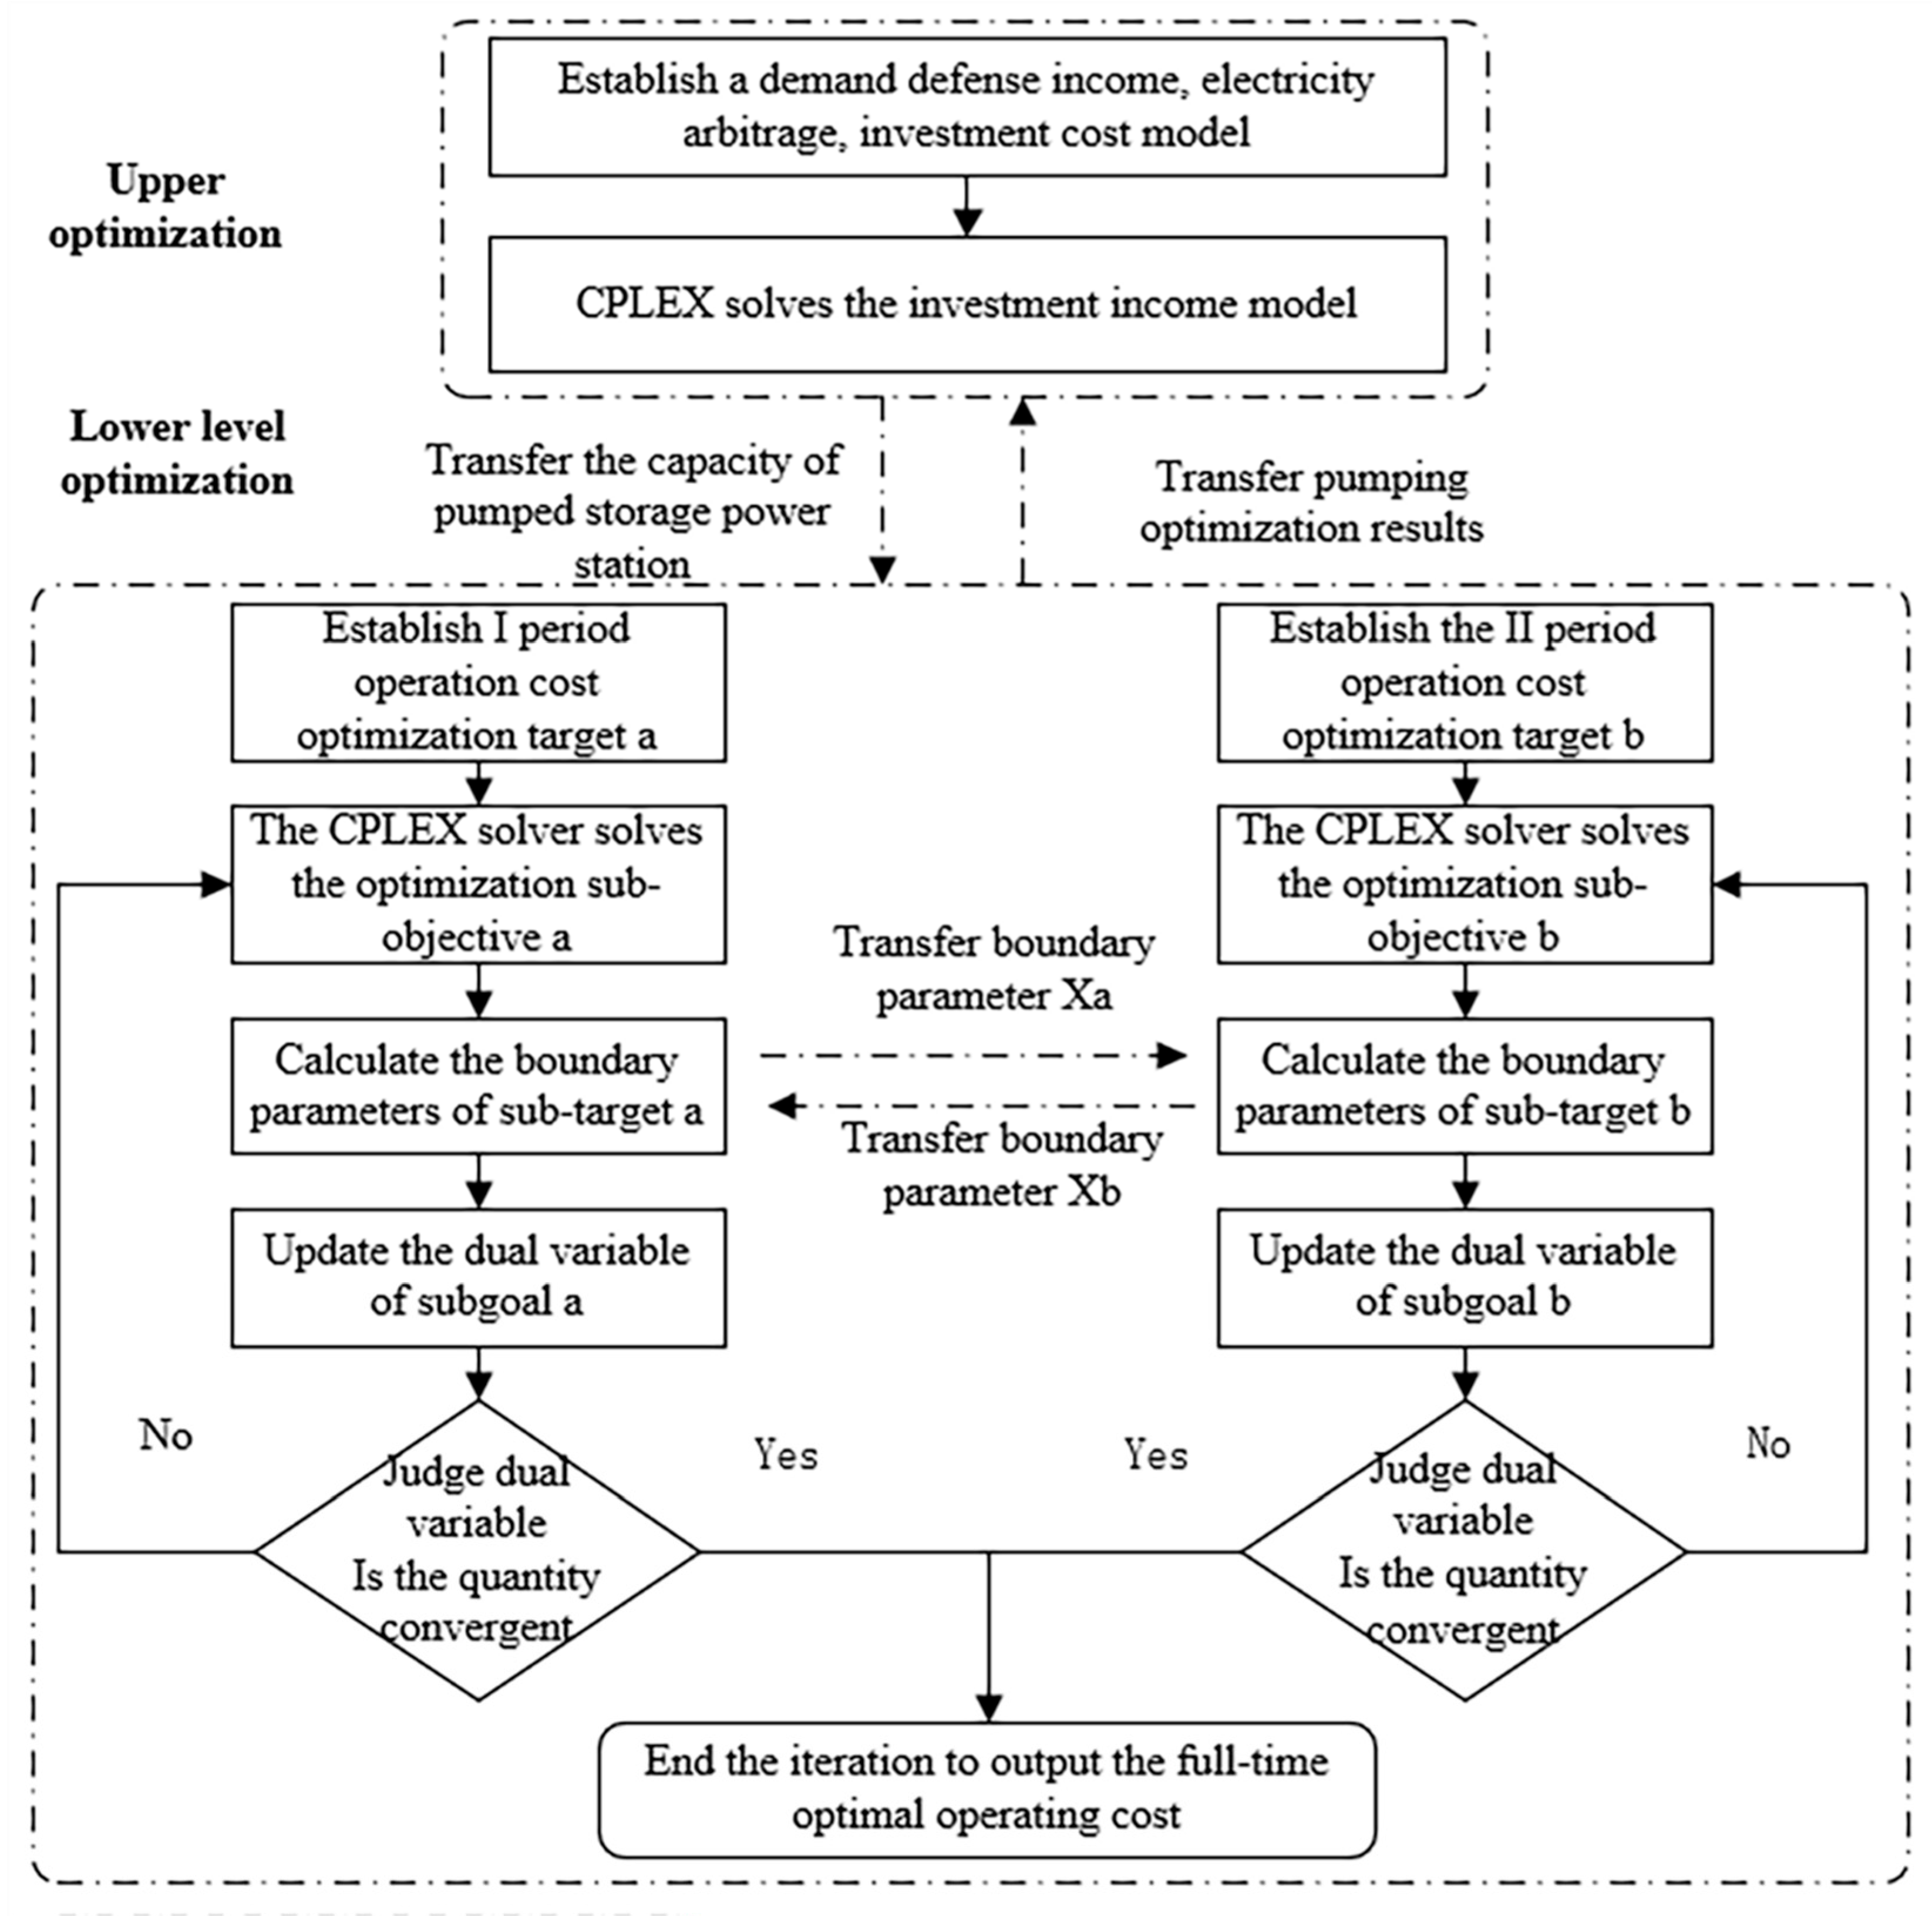
4.2. Solving Process

The model-solving process is shown in Figure 4. The specific solving steps are as follows:
1.
Initialize the parameters, divide the time slice in the scheduling period, describe the probability characteristics of the wind power, photovoltaic power, and load according to the distribution function proposed in reference [20], input the wind and solar load forecasting curve, and describe the engineering parameters and capacity constraints of the pumped storage power station.
2.
Initialize the variables of the ADMM algorithm, including the Lagrange multiplier, penalty coefficient, and initial solution of the upper-layer pumped storage capacity configuration scheme problem.
3.
The operational cost optimization model are established for each time slice, and the CPLEX solver is used to solve it. Operation strategies such as hydropower output, pumped storage power, and storage capacity in this period are obtained, and the boundary parameters and their corresponding dual variables with other periods are calculated.
4.
CPLEX solves the pumped storage capacity allocation problem, updates the pumped storage capacity, coordinates the storage capacity continuity constraints for each time period, and updates the dual variables and boundary parameters.
5.
The convergence of the dual variable in the current iteration is determined. If the convergence accuracy is satisfied, the optimal capacity configuration and full-time operation strategy of the pumped storage power station are the output. Otherwise, Step 3 is returned, and iterative optimization is continued. The updated boundary parameters and dual variables are transmitted for the next round of the solution.

5. Example Analysis

5.1. Example Setting

Example Parameter Setting
This study considers industrial users of wind, light, and hydropower in China as an example to verify the effectiveness of the proposed model and solution method. We set up three typical monthly scenarios of wet, dry, and peaceful months. The total installed capacity of the wind farm was 20 MW, and the total installed capacity of the photovoltaic power station was 8 MW. The peak–valley time-of-use electricity prices of industrial users are listed in Table 1. The electricity charge was 40 RMB/(kW·month). Considering the current conditions of industrial users to build pumped storage units and the common specifications of pump turbines, a wind–solar–water–pumped storage system was constructed. The basin schematic structure of the hydropower stations and pumped storage is shown in Figure 5, including two pumped storage power stations and five hydropower stations. The installed and reservoir capacities of the hydropower station are listed in Table 2 and the other construction. Other relevant parameters are shown in Table 3 [25,26,27,28,29,30,31].

5.2. Analysis of Example Results

5.2.1. Capacity Configuration Result Analysis

According to the pumped storage parameters in Table 4, after the capacity configuration optimization, the installed capacity of pumped storage power station 1 is 8.58 MW, and the reservoir capacity is 780,000 m3; the installed capacity of pumped storage power station 2 is 6.12 MW, and the storage capacity is 590,000 m3.
It can be further seen from the transaction between the system and the superior power grid before and after the configuration of pumped storage in Table 5 that compared with the unconfigured pumped storage scheme, the maximum purchase power of the system in different typical months is reduced after the configuration of pumped storage, which decreases by 11.48 MW, 13.52 MW, and 13.61 MW in the wet month, dry month, and normal month, respectively. Simultaneously, operating costs were reduced by 2.3642 million RMB, 1.716 million RMB, and 2.128 million RMB, respectively. Among them, the operating cost of the wet month had the largest decrease. This is because the basin had abundant water during the wet season. After the optimal scheduling is combined with the hydraulic coupling relationship, the downstream small hydropower has a stronger power generation capacity owing to the upstream pumped storage water, which effectively reduces the power purchase demand for the upper power grid, thereby reducing the system’s operating cost. In addition, after the configuration of pumped storage, the electricity sales revenue of the system in three typical months was reduced by 199,700 RMB, 318,600 RMB, and 205,500 RMB, respectively, compared with the unconfigured scheme. When the clean energy output exceeds the load demand, the system prioritizes the use of excess energy for pumped storage energy storage, reducing the amount of electricity used to sell electricity to the superior power grid, thereby reducing the system’s electricity sales revenue.
Figure 6 shows the system operation of industrial users on the maximum power purchase day in a typical month. Pumped storage plays a “time shift” role; that is, during the low-load period, the power required by the user load is lower than the total output of wind power, photovoltaic power, and small hydropower, and the remaining clean energy is used for the pumped storage power station. Owing to the low electricity purchase price at this time, the insufficient part of the electricity is supplemented by the superior power grid during the peak load period. When the output of wind–solar–hydropower cannot meet the load demand, the pumped storage power station generates electricity, thus effectively reducing the amount of electricity purchased from the superior power grid during the peak period. During the peak period of the electricity price and the period when the clean energy output is greater than the load, because the electricity price of selling electricity to the superior power grid is higher than the electricity purchase price during the trough period, the system preferentially sells surplus wind, solar, hydro, and electricity power to further reduce the system operation cost. Simultaneously, the system purchase power is controlled below the maximum demand to realize the demand defense strategy and improve the economy of the overall operation. The electricity with a lower purchase cost stored in the low electricity price period is released and used in the peak period, which not only makes use of the peak–valley price difference to achieve arbitrage, but also effectively reduces the user’s monthly maximum demand power, thus greatly reducing the demand electricity expenditure. Although this operation mode reduces electricity sales revenue, it achieves double savings in electricity purchase costs and electricity demand charges by optimizing energy use periods and reducing peak electricity consumption.

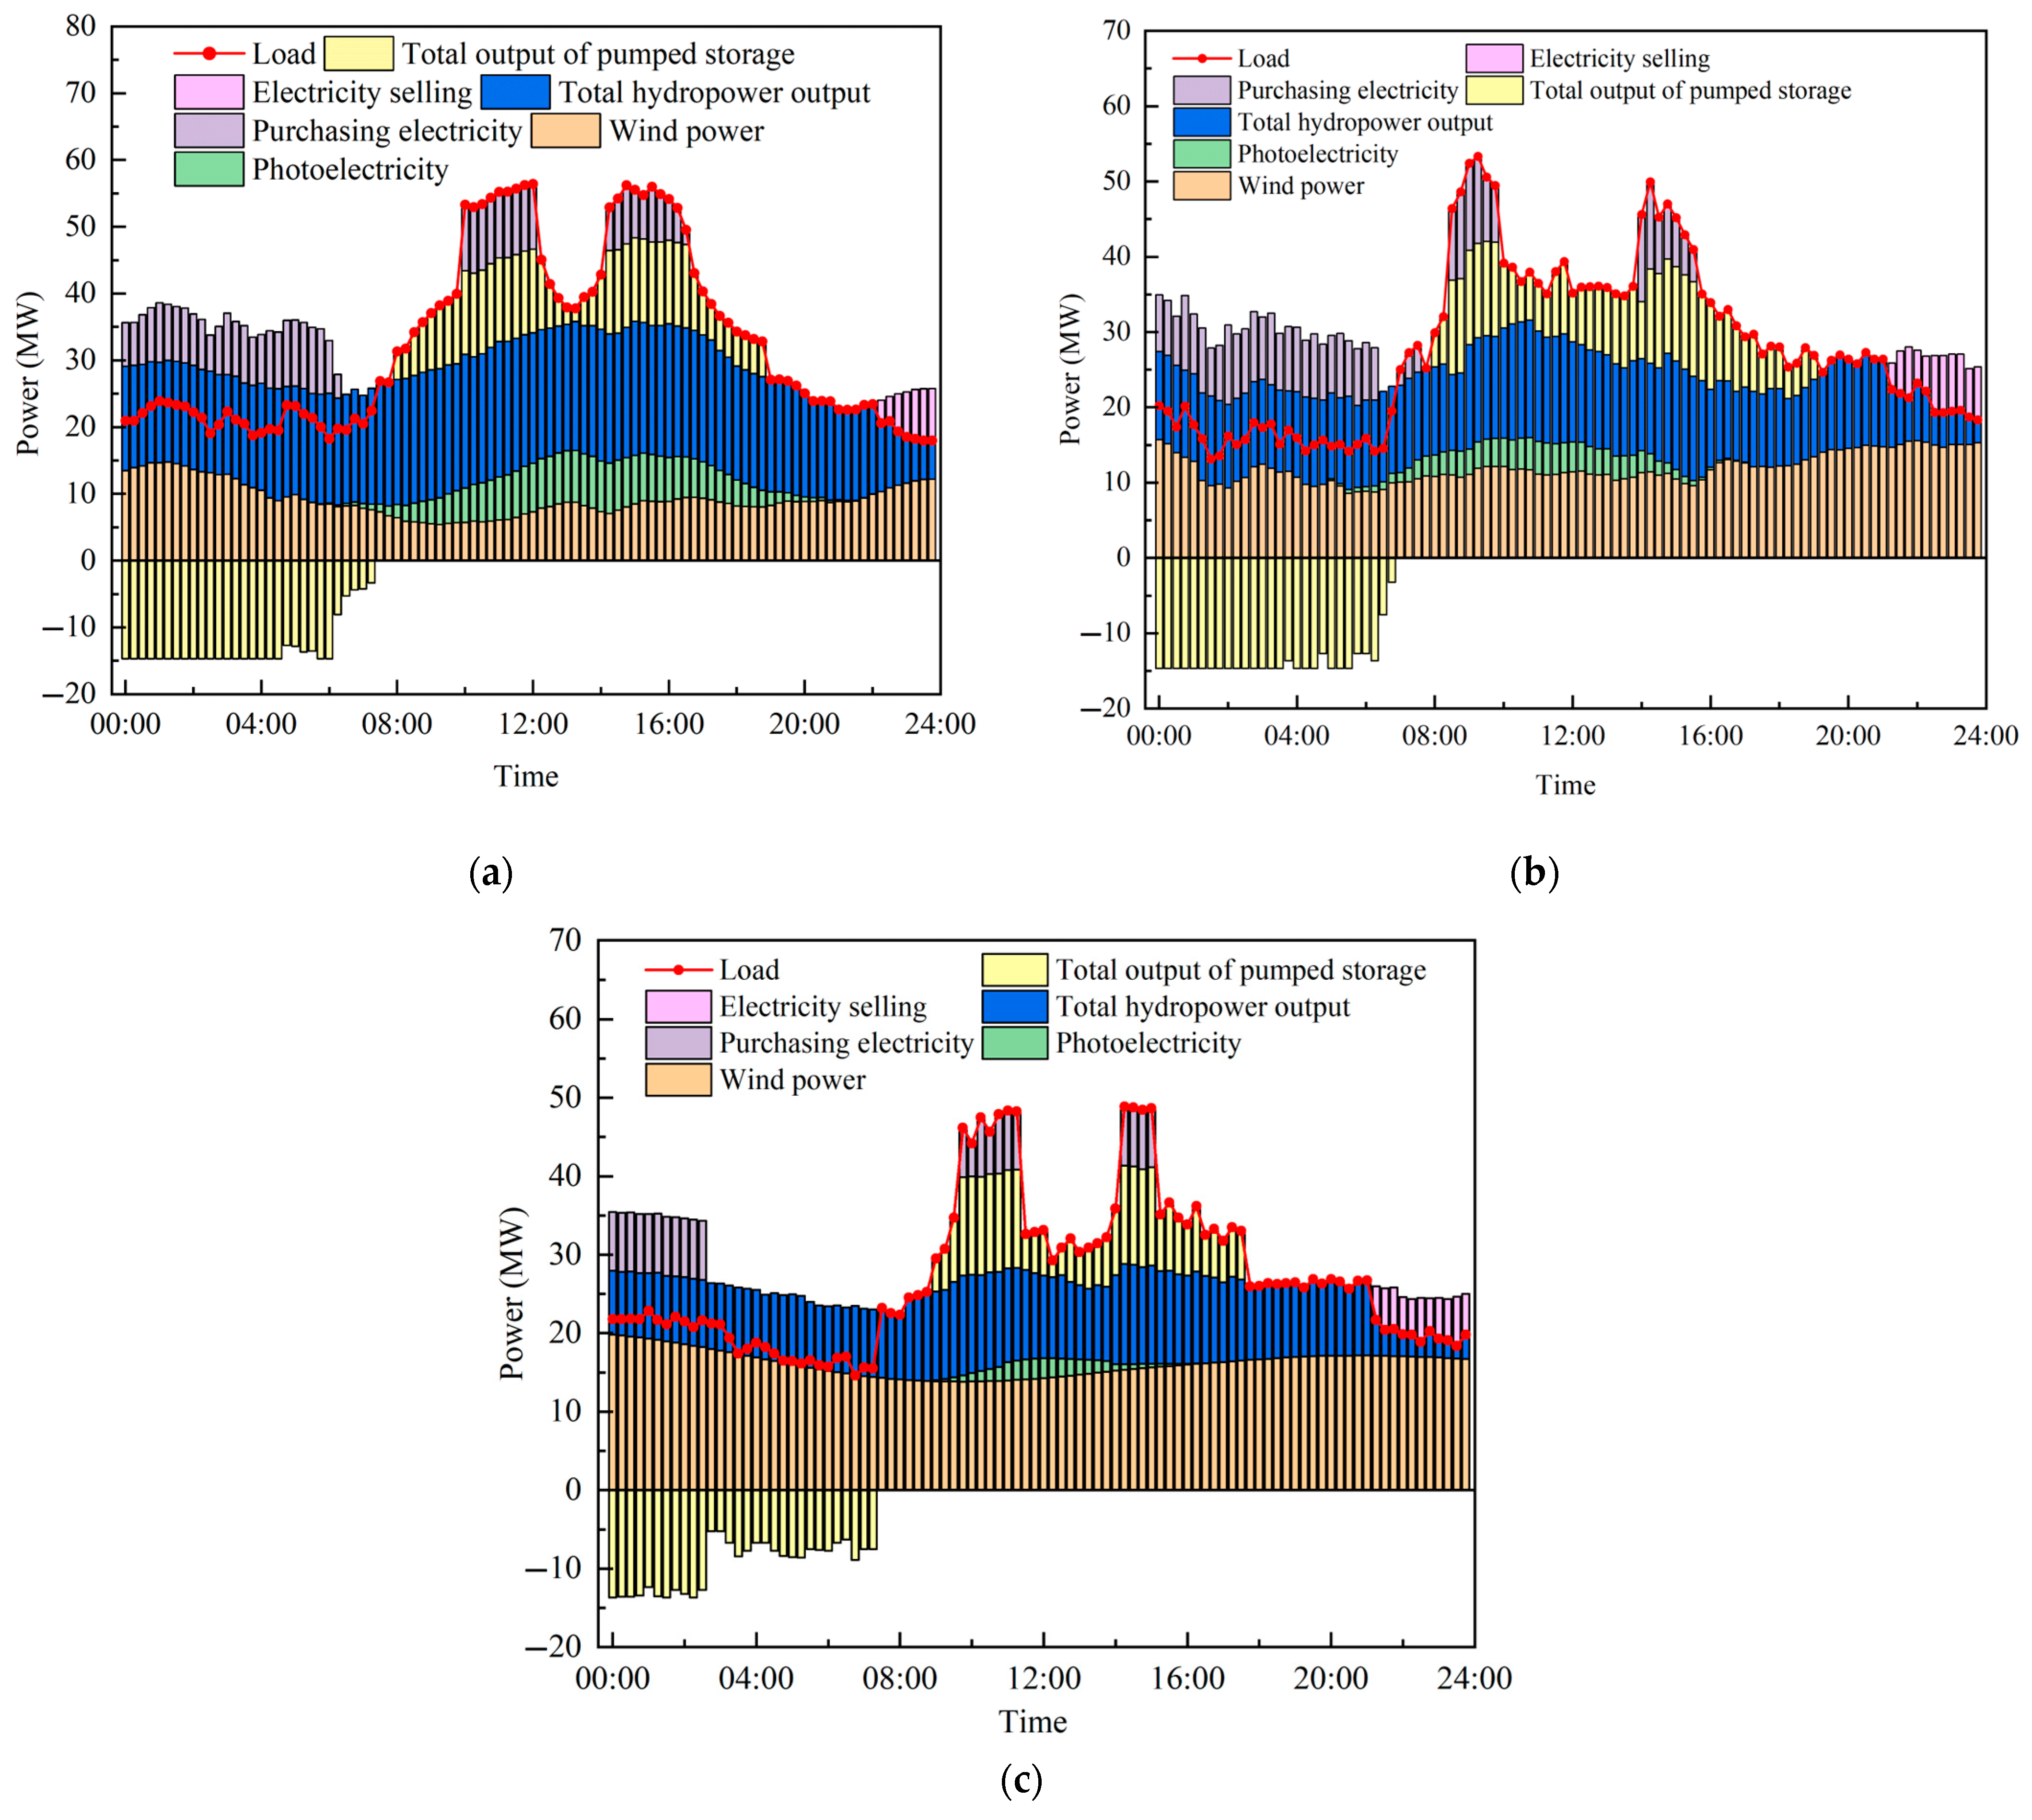
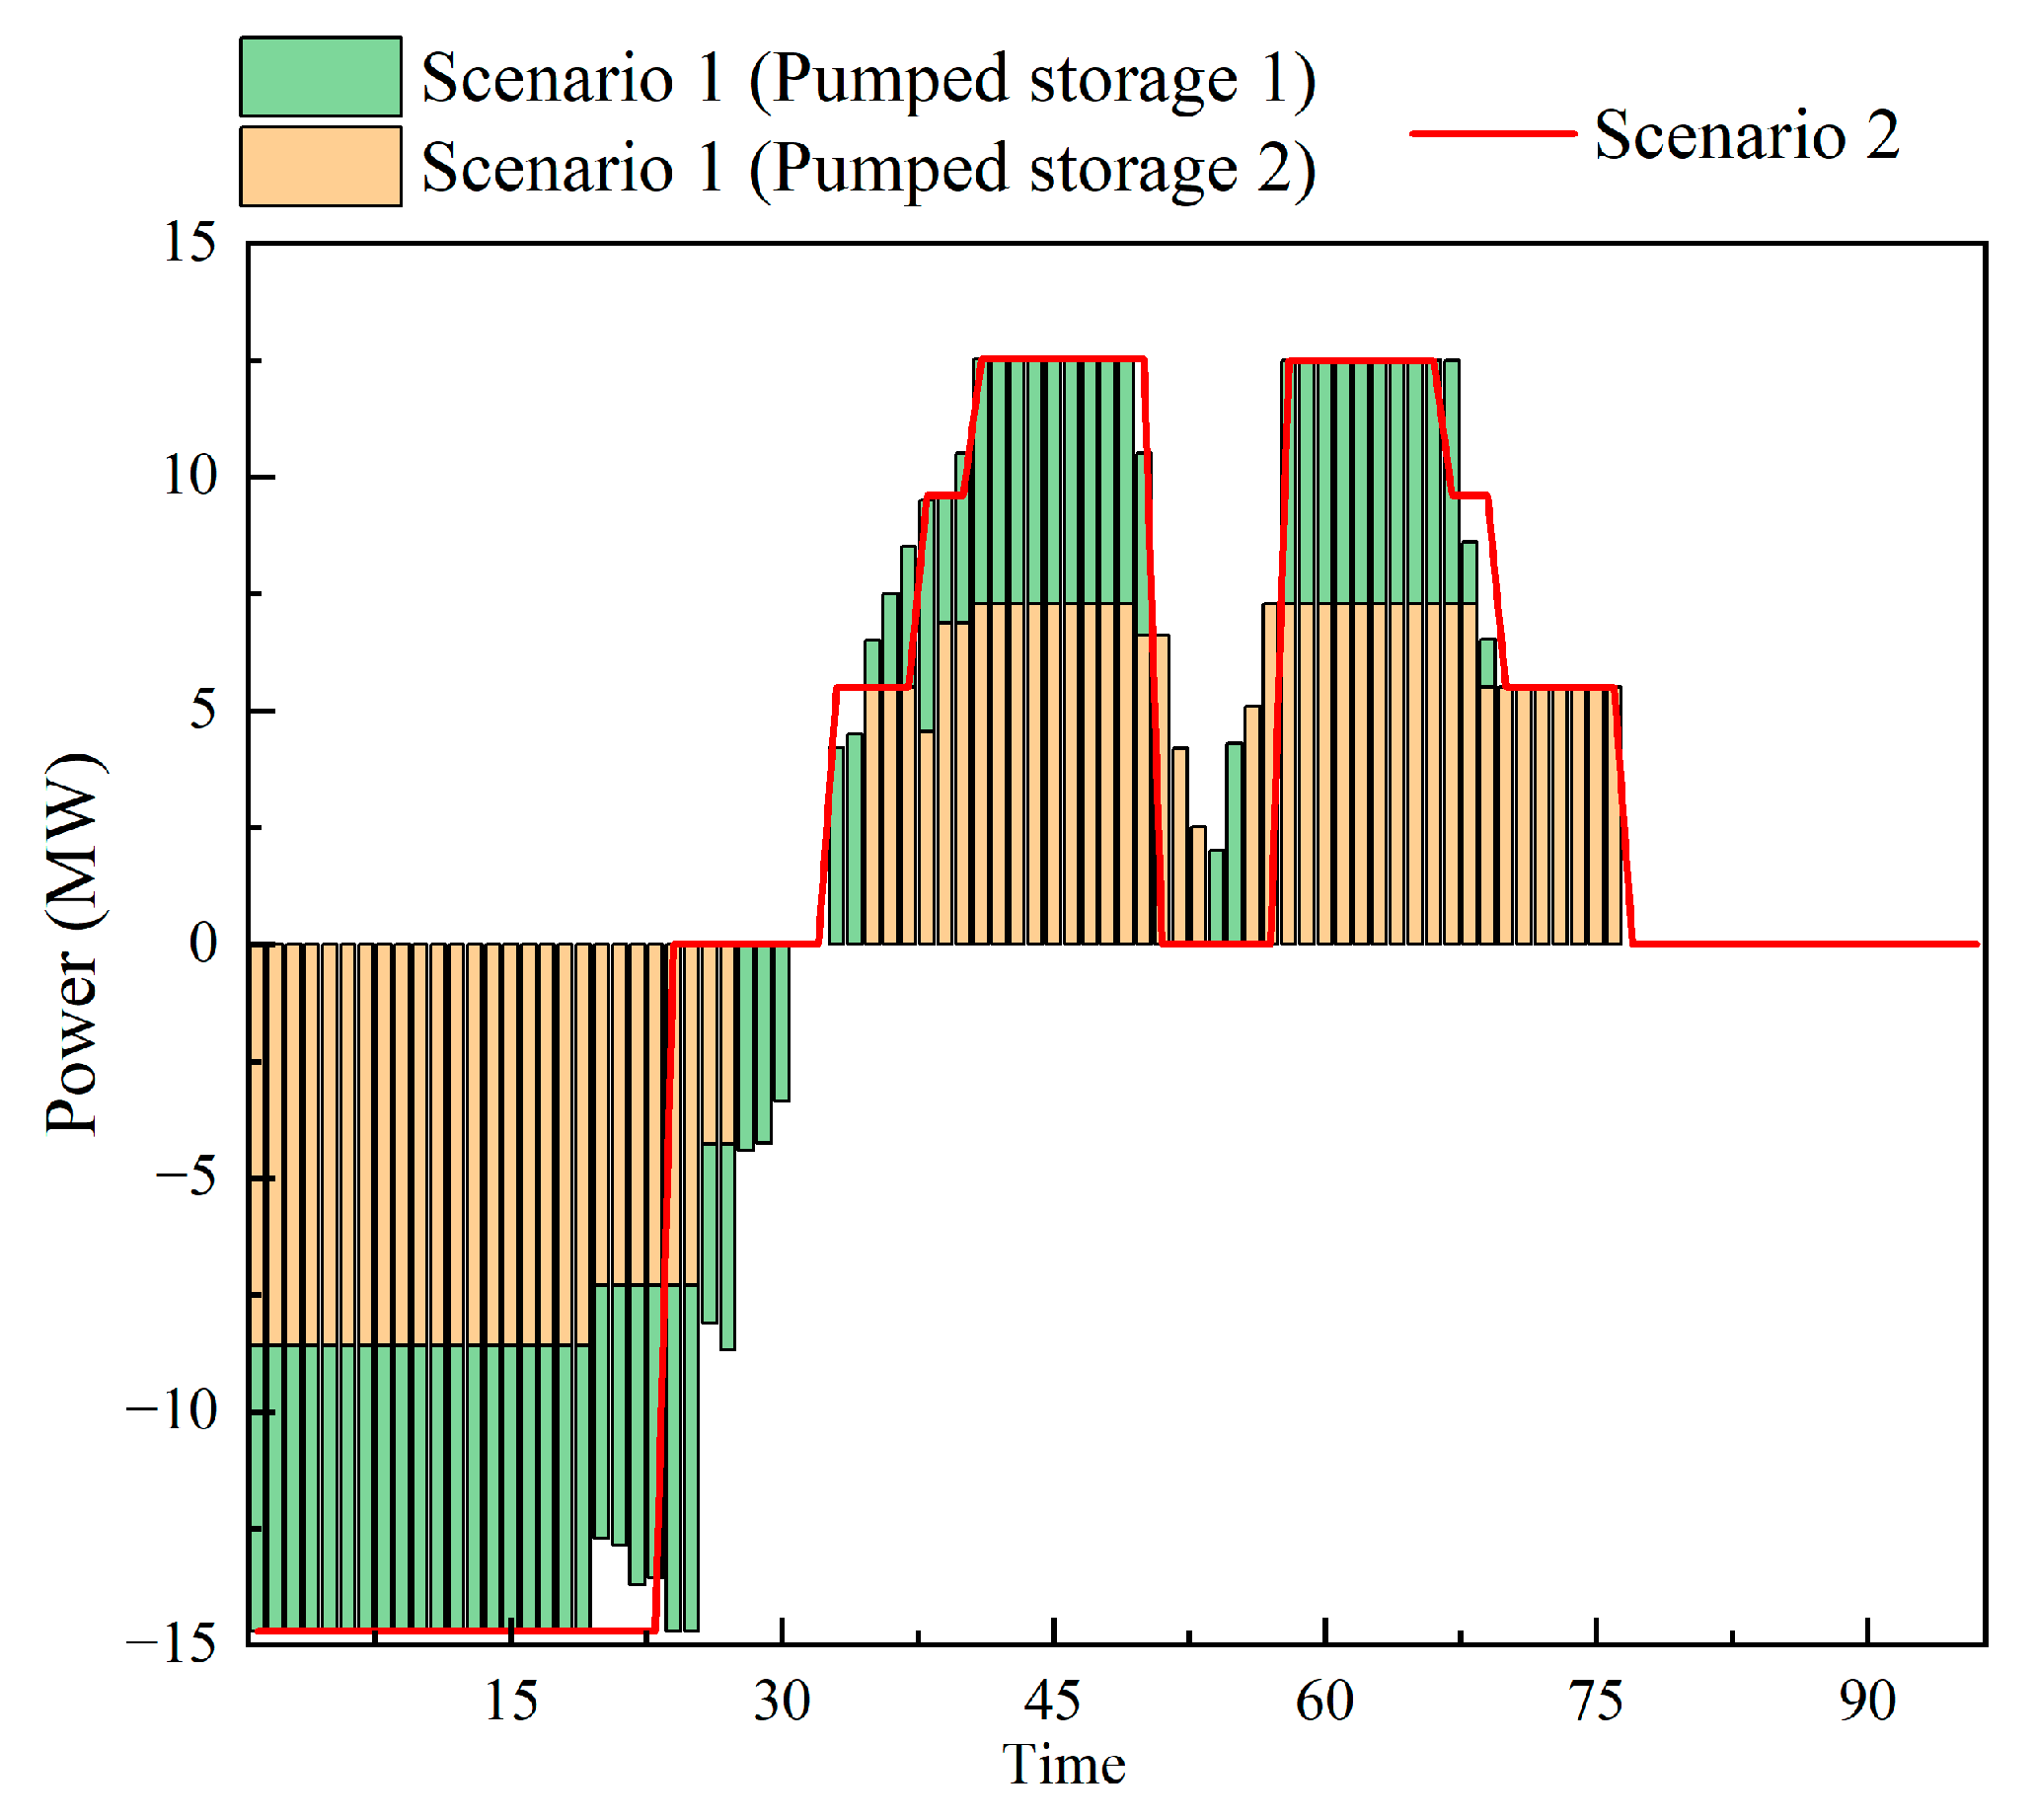
5.2.2. Impact of Distributed Pumped Storage on System Operation

To highlight the advantages of building distributed pumped storage in this study, the following two scenarios were set up for the analysis.
Scenario 1: The distributed pumped storage configuration is adopted to optimize the operation of pumped storage power stations upstream of hydropower stations 1 and 2.
Scenario 2: The centralized pumped storage configuration is adopted, and only a single pumped storage power station with the same capacity is built upstream of hydropower station 1 to optimize the scheduling of the system.
Figure 7 shows the water level change trend of hydropower station 1 under different scenarios on the day of maximum power purchase in the wet month. In Scenario 2, owing to the superposition of the natural inflow and concentrated discharge of the upstream pumped storage power station during the peak load period, the inflow of hydropower station 1 is greater than the outflow, and the water level continues to rise. When the water level reaches the upper limit of the reservoir capacity, some of the excess water is discarded, resulting in a waste of water resources. In contrast, scenario 1 adopts the optimal scheduling strategy of distributed pumped storage to adjust the outflow during the power generation period so that the operating water level of hydropower station 1 is controlled within a reasonable water level range, which effectively reduces the loss of abandoned water. At the same time, the relationship between the inflow and outflow of the hydropower station is coordinated during the low-load period to avoid the influence of the discharge volume during the peak period due to the early release of the storage capacity and to ensure the power generation capacity of the downstream hydropower station.
Figure 8 shows the operation of pumped storage power stations under different scenarios on the maximum power purchase day of the wet month. Because the pumped storage power station configured in this study is functional, its operational flexibility is better than that of the traditional fixed-speed unit, it is not limited by operation constraints such as the minimum stable output duration, and it can quickly respond to user load fluctuations. In Figure 7 and Figure 8, it can be seen that in Scenario 1 that pumped storage power station 1 controls the inflow to the downstream hydropower station by flexibly adjusting the power generation output during the peak load period and effectively avoids the problem of water abandonment caused by the water level overrun. Simultaneously, pumped storage power station 2 further reduces the system’s dependence on power purchase from the superior power grid by optimizing the output distribution. During the low-load period, the two pumped storage power stations operate in coordination to realize pumped storage, effectively absorb the excess clean energy in the system, and reduce the reverse power transmission to the superior power grid, as well as to realize the local consumption of energy while improving the economy of the overall operation of the system and the efficiency of clean energy utilization.
Figure 9 shows a comparison of the abandoned water volume of each hydropower station during typical months under different situations. Compared with Scenario 2, the abandoned water volume of the hydropower stations in Scenario 1 decreased by 82,000 m 3, 52,000 m3, and 28,000 m3 in the wet, normal, and dry months, respectively. The amount of abandoned water was reduced by 27.79%, 21.05%, and 15.34% in the wet, normal, and dry months, respectively. The abandoned water volume of the hydropower stations in Scenario 1 decreased significantly under all hydrological conditions in the year, indicating that hydropower stations in Scenario 1 have a stronger coordination ability of water resources in the basin. Through the coordinated operation of distributed pumped storage power stations, Scenario 1 can disperse the discharge pressure and effectively reduce the phenomenon of water abandonment according to the water storage capacity of different hydropower stations and the current water inflow situation to further strengthen the overall utilization efficiency of water resources and the coordinated operation ability of the system in the whole basin while improving local dispatching efficiency.
Table 6 lists the economic benefits of the system for different situations. Combined with Table 5 and the above analysis, it can be seen that compared with scenario 2, although the annual investment cost and annual electricity sales income of scenario 1 increased by 491,800 RMB and 223,900 RMB, respectively, owing to the flexible adjustment of the output of distributed pumped storage, the annual electricity purchase cost is reduced by 2.6254 million RMB by reducing the purchase of electricity from the higher power grid during the peak period. It can be seen that the distributed pumped storage constructed in this paper can use the hydraulic coupling relationship of small hydropower in the basin to exert its flexible adjustment ability and improve the economy of enterprise operation. Table 7 summarizes the differences between centralized pumped storage and distributed pumped storage in their system cost, operational flexibility, and water abandonment.

5.2.3. The Influence of Capacity Configuration on the Optimization Results

In order to further illustrate the influence of pumped storage capacity on the economy of industrial users, the capacity of the pumped storage power stations configured in Table 5 is compared and analyzed as “ P ” to 0.5 P , 0.75 P , 1.25 P , and 1.5 P , and the changes in the annual operating cost and annual investment benefit of pumped storage are evaluated. The results are listed in Table 8. The results show that the pumped storage capacity and the annual operating cost of the system first decrease and then increase, while the annual investment benefit shows the opposite trend. When the pumped storage capacity increases to a certain level, the increase in electricity-saving benefits brought about by the new capacity gradually decreases, and it is difficult to offset the increase in the construction and operation costs of pumped storage, which ultimately leads to an increase in the comprehensive cost of the system and a decrease in the expected benefits of pumped storage. Therefore, in the allocation of pumped storage capacity, the investment cost and operating income of the system should be integrated, and the optimal capacity scheme should be selected within a reasonable capacity allocation interval to achieve the dual optimization of economy and resource utilization efficiency.

6. Conclusions

To improve the utilization of clean resources by industrial users with wind, solar, and hydropower and the economy of trading with a superior power grid, this paper proposes a distributed pumped storage capacity optimization configuration method with a clean energy system. The main conclusions are as follows.
(1)
The construction of a distributed pumped storage power station can give full flexibility to its regulation. In a period of low load, it can effectively absorb excess clean energy and reduce the system’s power sales to the higher power grid. During the peak load period, energy storage is released to reduce the demand for electricity and thus the electricity purchased from the superior power grid, thereby improving the overall economy of industrial users during operation.
(2)
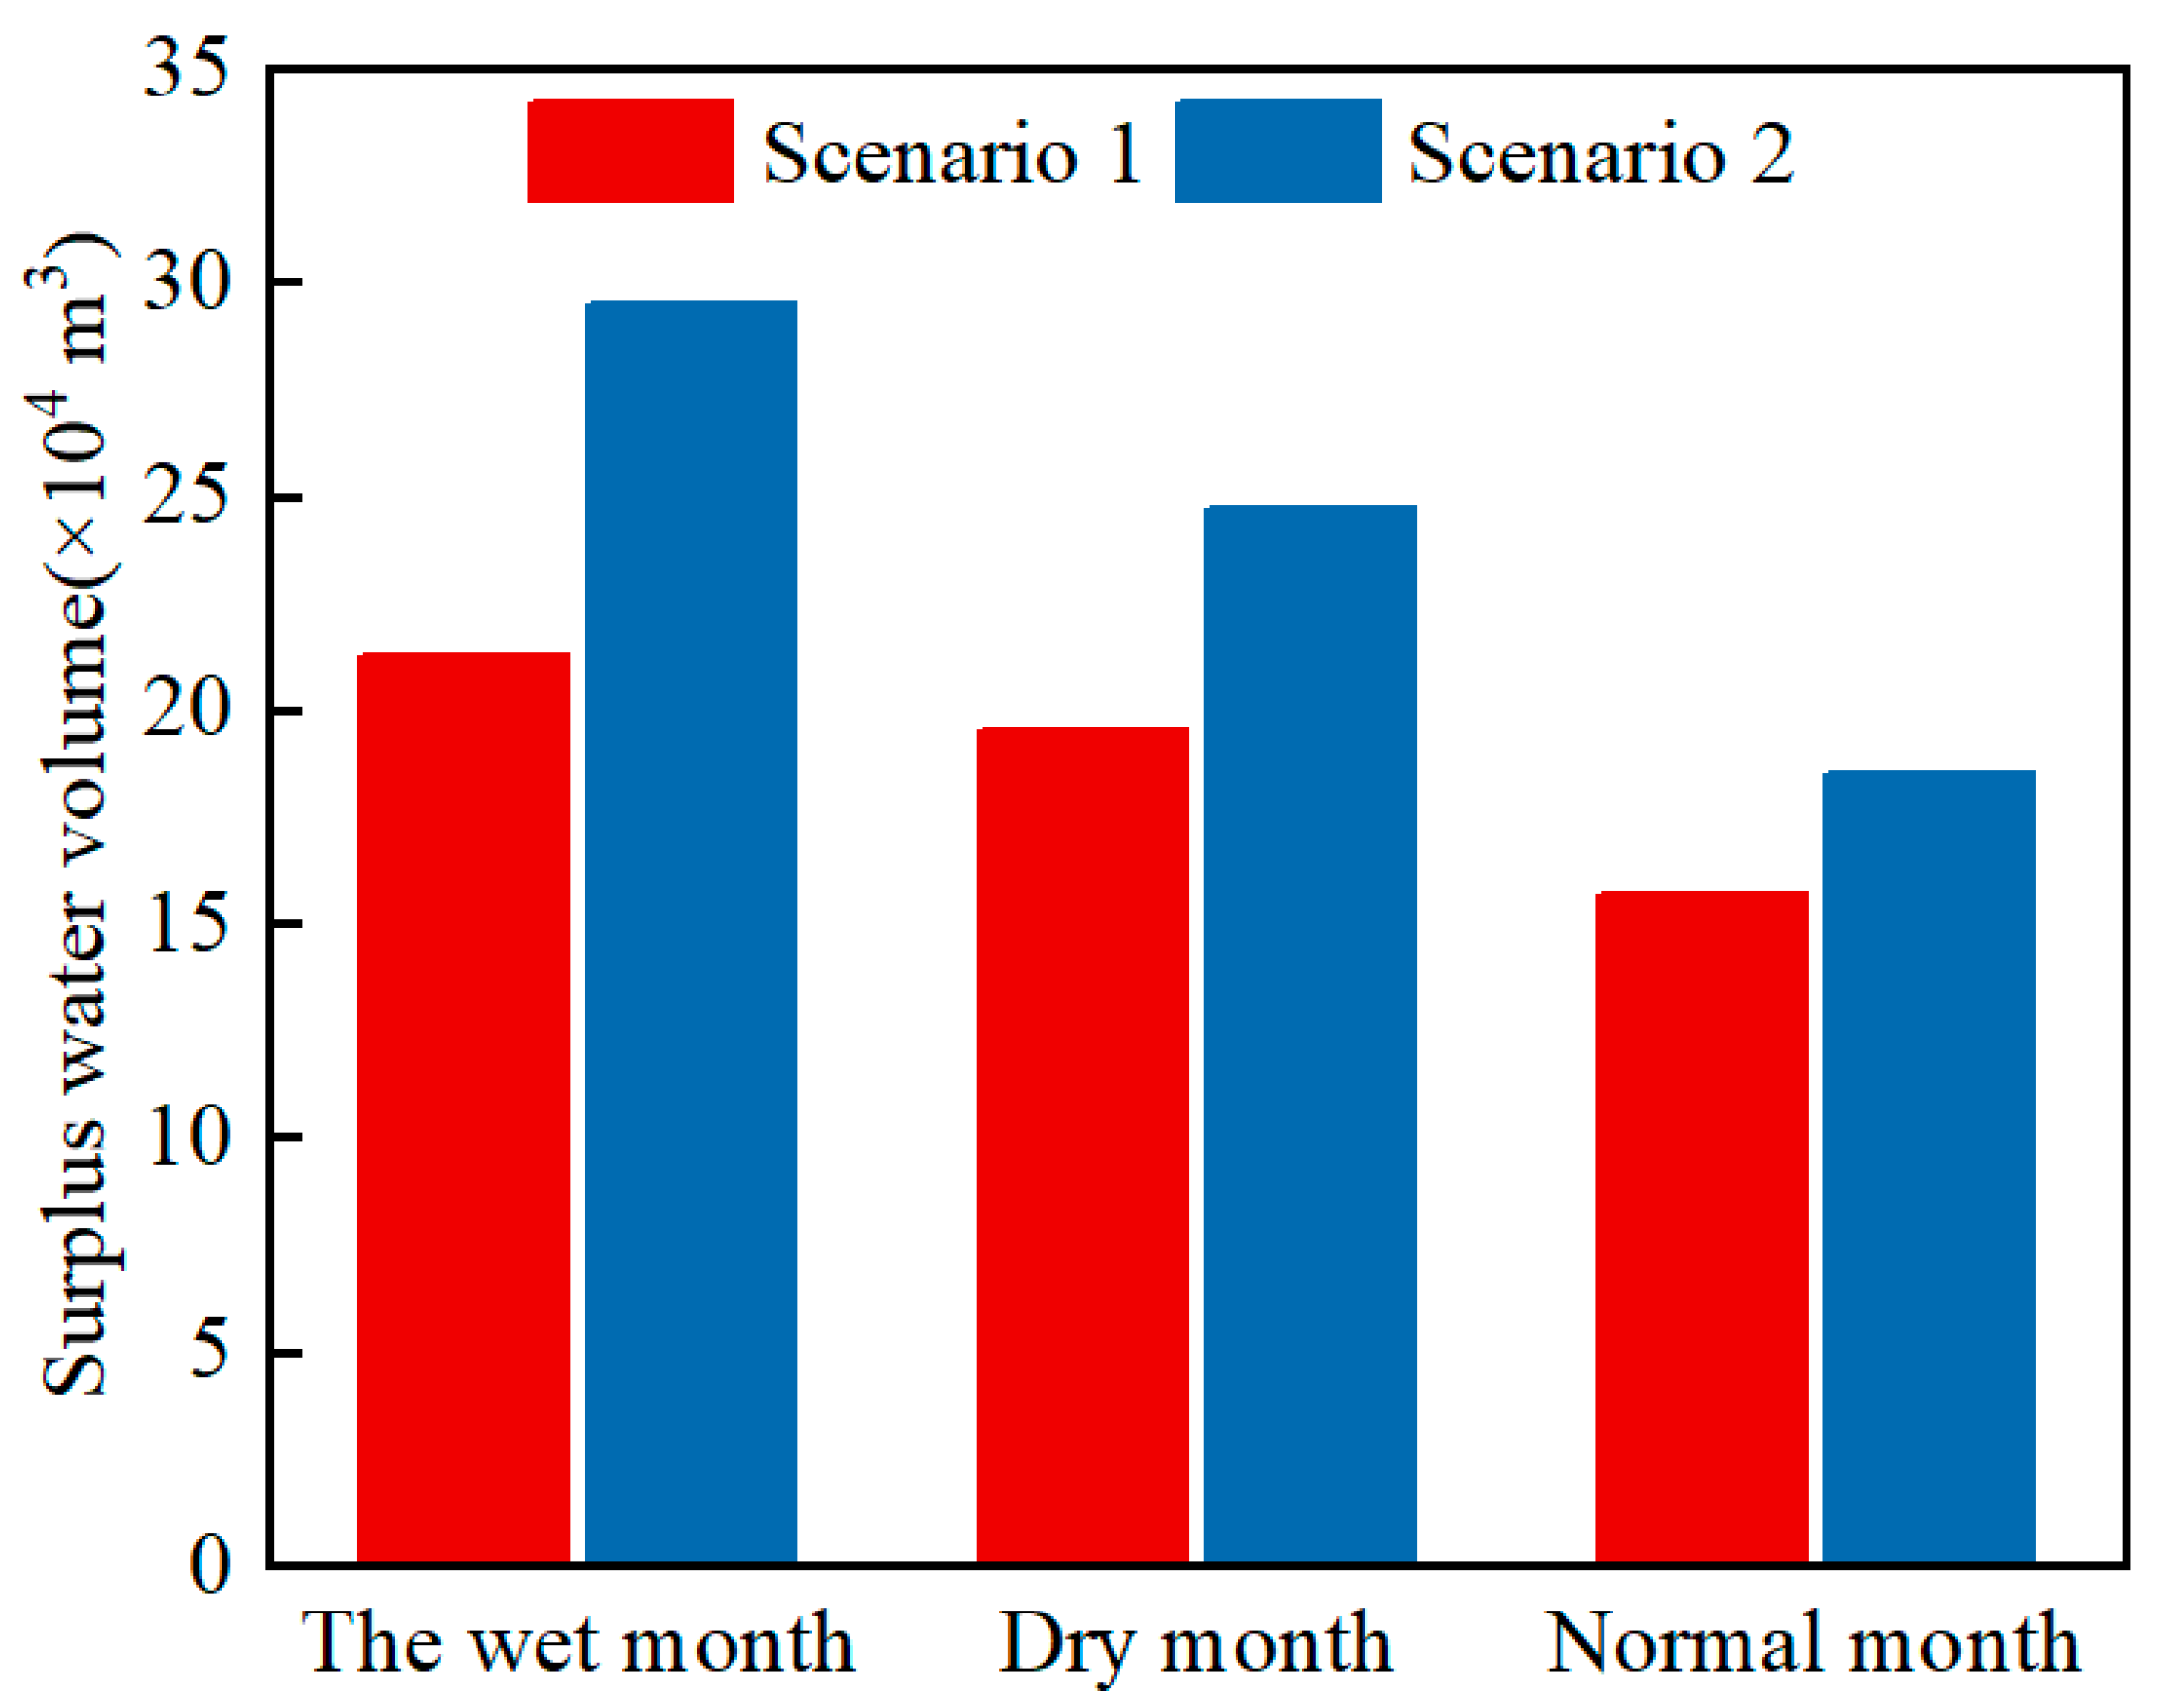
Compared with the construction of a centralized pumped storage power station, the distributed pumped storage power station combined with the hydraulic coupling characteristics of the basin can flexibly adjust the water resource allocation in the region, effectively reduce the water abandonment phenomenon of the hydropower station, and improve the consumption level of clean energy to further improve the comprehensive operation efficiency of the system.
Although this study verifies the optimization effect of the distributed pumped storage system, there are still some limitations worth exploring. The model has strong applicability in regions with similar geographical conditions and a two-stage electricity price mechanism, but it is limited by hydrological characteristics, differences in electricity price policies, and the insufficient handling of uncertainties. When it is extended to other regions, parameters and optimization strategies need to be adjusted accordingly. In the future, the following directions can be explored: First, deepening uncertainty modeling; establishing a joint probability distribution model of wind, light, and hydrology; and combining robust optimization or stochastic programming methods to quantify the impact of prediction errors and climate fluctuations on the system so as to improve the anti-risk ability of the configuration scheme. Second, a multi-level collaborative framework should be constructed to integrate demand-side response resources and pumping operations and expand the optimization of source–network–load–storage total factors. At the same time, multi-dimensional indicators such as carbon emission reduction targets and ecological flow constraints are introduced to form an economy–environment–society comprehensive decision-making mechanism. In addition, it is necessary to carry out pilot projects in typical river basins to verify the actual effectiveness of the hydraulic coupling matrix, as well as to explore the policy adaptability of technical iterations such as new variable speed units, seawater pumping, and storage-to-power market reforms such as spot electricity prices and green certificate transactions, so as to fully support the efficient consumption of clean energy under the goal of “double carbon”.

Author Contributions

Conceptualization, Y.W. and W.H.; methodology, Y.W.; software, Y.W.; validation, Y.W.; formal analysis, W.H.; investigation, W.H.; data curation, H.Z.; writing—original draft preparation, H.Z.; writing—review and editing, X.L.; visualization, Z.O.; supervision, Z.O. All authors have read and agreed to the published version of the manuscript.

Funding

This research was funded by the Hubei Provincial Natural Science Foundation Joint Fund Project, grant number 2022CFD167.

Institutional Review Board Statement

Not applicable.

Informed Consent Statement

Not applicable.

Data Availability Statement

The data supporting the findings of this study are available from the corresponding author, Y.W., upon reasonable request. The data are not publicly available due to data will be used for follow-up studies.

Conflicts of Interest

The authors declare no conflicts of interest.

References

  1. IEA. World Energy Outlook 2022; IEA: Paris, France, 2022. [Google Scholar]
  2. Li, C.; Wang, N.; Shen, X.; Zhang, Y.; Yang, Z.; Tong, X.; Maréchal, F.; Wang, L.; Yang, Y. Energy Planning of Beijing Towards Low-Carbon, Clean and Efficient Development in 2035. CSEE J. Power Energy Syst. 2024, 10, 913–928. [Google Scholar] [CrossRef]
  3. Liu, S.; Ye, W.; Wu, Y.; Ye, Z. An Improved Tiered Electricity Pricing Scheme Considering Energy Saving and Carbon Reduction, Cross-Subsidy Handling, and User Demands. Energies 2025, 18, 2610. [Google Scholar] [CrossRef]
  4. Blasuttigh, N.; Negri, S.; Massi Pavan, A. Optimal ATECO-Based Clustering and Photovoltaic System Sizing for Industrial Users in Renewable Energy Communities. Energies 2025, 18, 763. [Google Scholar] [CrossRef]
  5. Gan, W.; Ai, X.; Fang, J.; Yan, M.; Yao, W.; Zuo, W.; Wen, J. Security constrained co-planning of transmission expansion and energy storage. Appl. Energy 2019, 239, 383–394. [Google Scholar] [CrossRef]
  6. Zhao, X.; Wang, Y.; Wang, B. Review on market implementation and scheduling model considering flexibility mining of differentiated industrial high energy load. J. Electr. Technol. 2025, 2025, 2043–2062+2161. [Google Scholar]
  7. Liu, S.; Xu, J.; Xing, C.; Liu, Y.; Tian, E.; Cui, J.; Wei, J. Study on Dynamic Pricing Strategy for Industrial Power Users Considering Demand Response Differences in Master–Slave Game. Sustainability 2023, 15, 12265. [Google Scholar] [CrossRef]
  8. Wan, Q.; Liu, W. Robust interval optimization scheduling for direct power purchase of large users considering wind load uncertainty. Sol. Energy J. 2022, 2022, 347–355. [Google Scholar]
  9. Hu, D.; Wang, T. Optimizing Power Demand Side Response Strategy: A Study Based on Double Master–Slave Game Model of Multi-Objective Multi-Universe Optimization. Energies 2023, 16, 4009. [Google Scholar] [CrossRef]
  10. Zhang, L.; Tian, C.; Li, Z.; Yin, S.; Xie, A.; Wang, P.; Ding, Y. The Impact of Participation Ratio and Bidding Strategies on New Energy’s Involvement in Electricity Spot Market Trading under Marketization Trends—An Empirical Analysis Based on Henan Province, China. Energies 2024, 17, 4463. [Google Scholar] [CrossRef]
  11. National Energy Administration of the People’s Republic of China. Medium and Long-Term Development Plan of Pumped Storage (2021–2035); National Energy Administration of the People’s Republic of China: Beijing, China, 2021.
  12. Legacy, M.R.J.; Wyk, E.V.; Brinkerhoff, J. Pumped Hydro Energy Storage: A Multi-Reservoir Continuous Supply Hydroelectric Generation and Storage System. In Proceedings of the 2024 IEEE Electrical Energy Storage Application and Technologies Conference (EESAT), San Diego, CA, USA, 29–30 January 2024; pp. 1–4. [Google Scholar]
  13. Wang, X.; Li, G.; Ji, S. Research on capacity optimization configuration of complementary power generation system considering wind-solar uncertainty. J. Power Eng. 2024, 2024, 1750–1759. [Google Scholar]
  14. Yao, J.; Wang, M.; Zhao, H. Optimal allocation of pumped storage capacity of local power grids considering cost recovery. Hydroelectr. Energy Sci. 2022, 2022, 208–211+197. [Google Scholar]
  15. Liu, B.; Zhou, B.; Yang, D.; Yang, Z.; Cui, M. Optimal capacity planning of combined renewable energy source-pumped storage and seawater desalination systems. Glob. Energy Interconnect. 2019, 2, 310–317. [Google Scholar] [CrossRef]
  16. Yang, Y.; Li, Z.; Mandapaka, P.V.; Lo, E.Y.M. Risk-averse restoration of coupled power and water systems with small pumped-hydro storage and stochastic rooftop renewables. Appl. Energy 2023, 339, 120953. [Google Scholar] [CrossRef]
  17. Jing, H.; Zhao, H.; Yao, W. Flexible resource planning for new energy power generation systems with distributed pumped storage. Electr. Power Autom. Equip. 2023, 2023, 117–123+173. [Google Scholar]
  18. Xu, Q.; Shi, C.; Jing, H. Joint planning of transmission network and distributed pumped storage for new power systems. Power Syst. Prot. Control 2024, 2024, 128–137. [Google Scholar]
  19. Williams, M.-J.; Chang, C.-K. The Optimal Integration of Virtual Power Plants for the South African National Grid Based on an Energy Mix as per the Integrated Resource Plan 2019: A Review. Energies 2024, 17, 6489. [Google Scholar] [CrossRef]
  20. Seward, W.; Qadrdan, M.; Jenkins, N. Quantifying the value of distributed battery storage to the operation of a low carbon power system. Appl. Energy 2022, 305, 117684. [Google Scholar] [CrossRef]
  21. Brusco, G.; Menniti, D.; Pinnarelli, A.; Sorrentino, N. Renewable Energy Community with distributed storage optimization to provide energy sharing and additional ancillary services. Sustain. Energy Grids Netw. 2023, 36, 101173. [Google Scholar] [CrossRef]
  22. Muqbel, A.; Al-Awami, A.T.; Parvania, M. Optimal Planning of Distributed Battery Energy Storage Systems in Unbalanced Distribution Networks. IEEE Syst. J. 2022, 16, 1194–1205. [Google Scholar] [CrossRef]
  23. Duan, J.; Liu, F.; Yang, Y. Optimal operation for integrated electricity and natural gas systems considering demand response uncertainties. Appl. Energy 2022, 323, 119455. [Google Scholar] [CrossRef]
  24. Zhao, Z.; Yu, Z.; Kang, Y.; Wang, J.; Cheng, C.; Su, H. Hydro-photovoltaic complementary dispatch based on active regulation of cascade hydropower considering multi-transmission channel constraints. Appl. Energy 2025, 377, 124573. [Google Scholar] [CrossRef]
  25. Li, Y.; Hong, F.; Ge, X.; Zhang, X.; Zhao, B.; Wu, F. Optimal Capacity Configuration of Pumped-Storage Units Used to Retrofit Cascaded Hydropower Stations. Energies 2023, 16, 8049. [Google Scholar] [CrossRef]
  26. Li, Y.; Li, O.; Wu, F.; Ma, S.; Shi, L.; Hong, F. Multi-Objective Capacity Optimization of Grid-Connected Wind–Pumped Hydro Storage Hybrid Systems Considering Variable-Speed Operation. Energies 2023, 16, 8113. [Google Scholar] [CrossRef]
  27. Zhai, H.; Fan, W.; Zhang, Y. Research on the Two-Part Tariff Mechanism of Pumped Storage Power Stations: Analysis Based on the Construction of Pricing Calculation Models for Electricity Price Profit and Capacity Price. Price Theory Pract. 2022, 09, 178–182. [Google Scholar]
  28. Liu, Z.; Zhang, L.; Kou, P. Capacity Optimization Configuration of grid-connected Wind Power—Photovoltaic—pumped storage—Battery System. J. Power Eng. 2023, 43, 1151–1159. [Google Scholar] [CrossRef]
  29. Luo, B.; Chen, Y.; Miao, S. A joint short-term operation model for wind power and hybrid pumped-storage hydropower plant. J. Hydraul. Eng. 2023, 54, 955–966. [Google Scholar]
  30. Pan, P.; Chen, G.; Shi, H.; Zha, X.; Huang, Z. Distributed Robust Optimization Method for Active Distribution Network with Variable-Speed Pumped Storage. Electronics 2024, 13, 3317. [Google Scholar] [CrossRef]
  31. Zhong, H.; Liu, H.; Shi, Y. Optimal allocation of pumped storage reservoir capacity considering the aggregation effect of small hydropower and agricultural irrigation. Power Syst. Prot. Control 2025, 53, 1–13. [Google Scholar] [CrossRef]
Figure 1. Clean energy joint operation system.
Energies 18 03896 g001
Figure 2. River basin hydraulic relationship diagram of hydropower station.
Energies 18 03896 g002
Figure 3. Distributed pumped storage capacity optimization configuration framework with clean energy system.
Energies 18 03896 g003
Figure 4. Model-solving flow chart.
Energies 18 03896 g004
Figure 5. Watershed diagram of clean energy system.
Energies 18 03896 g005
Figure 6. The maximum power purchase day of operation of the system under different typical months. (a) The wet month; (b) normal month; and (c) dry month.
Energies 18 03896 g006
Figure 7. The water level change in hydropower station 1 on the maximum power purchase day of the wet month in different situations.
Energies 18 03896 g007
Figure 8. Operation of pumped storage power station on maximum power purchase day of wet month under different situations.
Energies 18 03896 g008
Figure 9. Comparison of abandoned water volume of typical month at hydropower stations in different situations.
Energies 18 03896 g009
Table 1. Peak–valley time-of-use electricity price of industrial users.
ElectrovalenceTime IntervalElectricity Purchase Price
(RMB/KW·h)
Electricity Sales Price
(RMB/KW·h)
Valley price0:00~8:000.31390.1567
Flat peak electricity price12:00~17:00
21:00~24:00
0.64180.3205
Peak load price8:00~12:00
17:00~21:00
1.06970.4803
Table 2. Parameters of hydropower stations.
Power Station NumberEfficiencyInstalled Capacity (MW)Type of Hydropower StationMaximum Storage Capacity (×104 m3)
10.937.00Reservoir capacity hydropower station35.20
20.885.00Reservoir capacity hydropower station22.10
30.943.52Run-off hydropower station0
40.903.26Run-off hydropower station0
50.934.20Run-off hydropower station0
Table 3. Parameters of the operating cost and capacity of clean energy systems.
ParameterNumerical Value
C p  (RMB/kW)2100
C o , w  [RMB/(m3/year)]14
C o , p  [RMB/(kW/year)]21
C n , r e p  (RMB/kW)2100
C v  (RMB/m3)500
C 1 , p i  (10,000 RMB)40
C 2 , p i  (10,000 RMB)50
η 0.05
V max i , h  (×104 m3)35.20
P r p , max  (MW)50
V max n  (×104 m3)100
T a  (Year)25
D l , max  (MW)45.72
P max s y , s  (MW)45.72
P max s y , g  (MW)20.52
Table 4. Pumped storage parameters.
ParameterPumped Storage Station 1Pumped Storage Station 2
Installed capacity (MW)8.586.12
Storage capacity (×104 m3)78.0059.00
Table 5. Transactions between the system and the superior power grid before and after the configuration of pumped storage.
StateMaximum Power Purchase (MW)Electricity Charge
(10,000 RMB/Month)
Electricity
Demand (10,000 RMB/Month)
Electricity Sales Revenue (10,000 RMB/Month)Operating Cost (10,000 RMB/Month)
Wet monthNot configured21.39365.4185.5630.15420.82
Configuration9.91154.9439.6410.18184.40
Dry monthNot configured21.05224.1784.2045.35259.02
Configuration7.5370.7930.1213.4987.42
Normal monthNot configured25.14303.98100.5638.82365.72
Configuration11.53127.5946.1218.27155.44
Table 6. Economic comparison of system operation under different situations.
Annual Investment Cost (10,000 RMB)Annual Electricity Purchase Cost (10,000 RMB)Annual Electricity Sales Revenue (10,000 RMB)
Scenario 1539.501876.81167.76
Scenario 2490.322139.35190.15
Table 7. Comparison of centralized pumped storage and distributed pumped storage.
Centralized Pumped StorageDistributed Pumped Storage
Cost effectivenessThe annual electricity purchase cost is 21.3935 million RMBThe annual electricity purchase cost is 18.7681 million RMB
Operational flexibilityThe regulation capacity of a single power station is limitedMulti-power station cooperative scheduling, as shown in Figure 7
Effect on abandoned waterAbandoned water in wet, normal, and dry months amounted to 295,000 m3, 247,000 m3, and 182,000 m3Amount of abandoned water decreased by 27.79%, 21.05%, and 15.34% in wet, normal, and dry months
Table 8. Economic comparison of system optimization scheduling under different capacity configurations.
Total Capacity of Pumped StorageSystem Annual Operating Cost (10,000 RMB)Pumped Storage Annual
Investment Benefit (10,000 RMB)
0.5 P 1995.661023.54
0.75 P 1845.321153.01
P 1709.411280.04
1.25 P 1827.211132.42
1.5 P 1874.321085.30
Disclaimer/Publisher’s Note: The statements, opinions and data contained in all publications are solely those of the individual author(s) and contributor(s) and not of MDPI and/or the editor(s). MDPI and/or the editor(s) disclaim responsibility for any injury to people or property resulting from any ideas, methods, instructions or products referred to in the content.

