The platform emerges as a response to the increasing regulatory requirements, at the national and European levels, aimed at decarbonising the building sector within the context of sustainable development. With many European regulations expected to be mandatory for Member States, regions, and municipalities, having tools that integrate relevant data and indicators across multiple levels of decision making and territorial scales is essential to align local planning with European objectives. In this regard, the Retabit platform can play a crucial role within public policy frameworks by facilitating coordination among different levels of government and promoting a cohesive response to sustainability and energy transition guidelines.
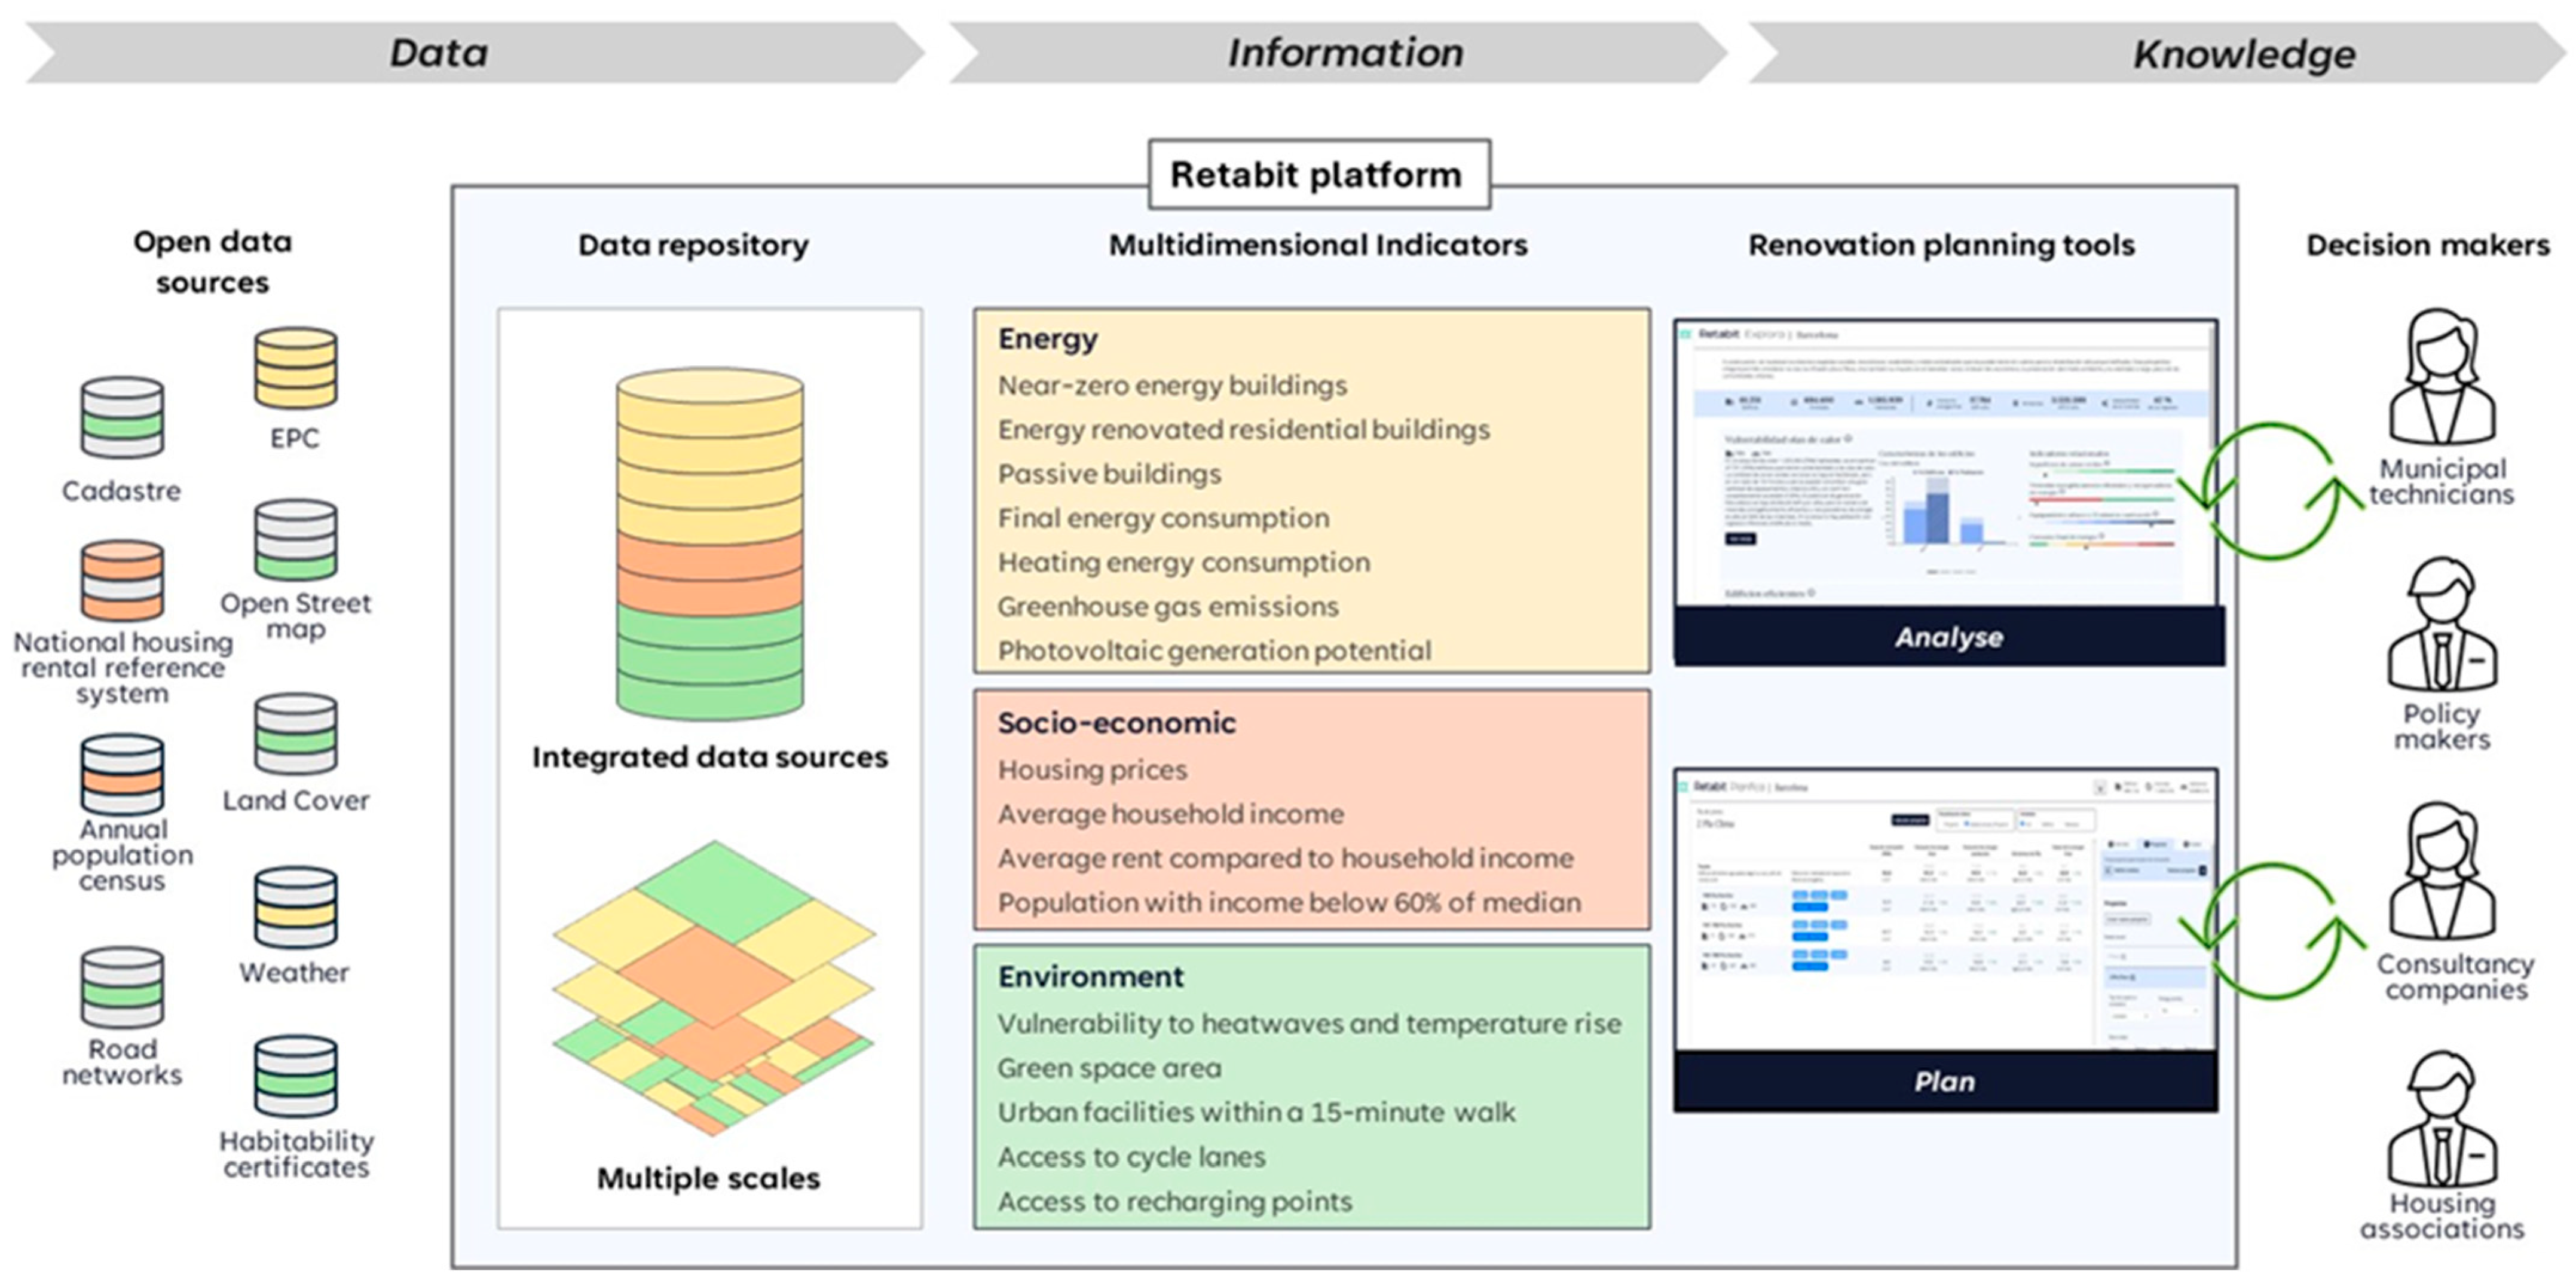
The Retabit platform transforms raw data into actionable information that, when paired with the expertise of decision-makers, becomes valuable knowledge. This shared understanding fosters evidence-based strategies for building renovation and urban sustainability, enabling experts to turn insights into meaningful policy and action.
4.2. Multidimensional Indicators
The identification of indicators was based on a methodology described in Ibañez Iralde et al. [
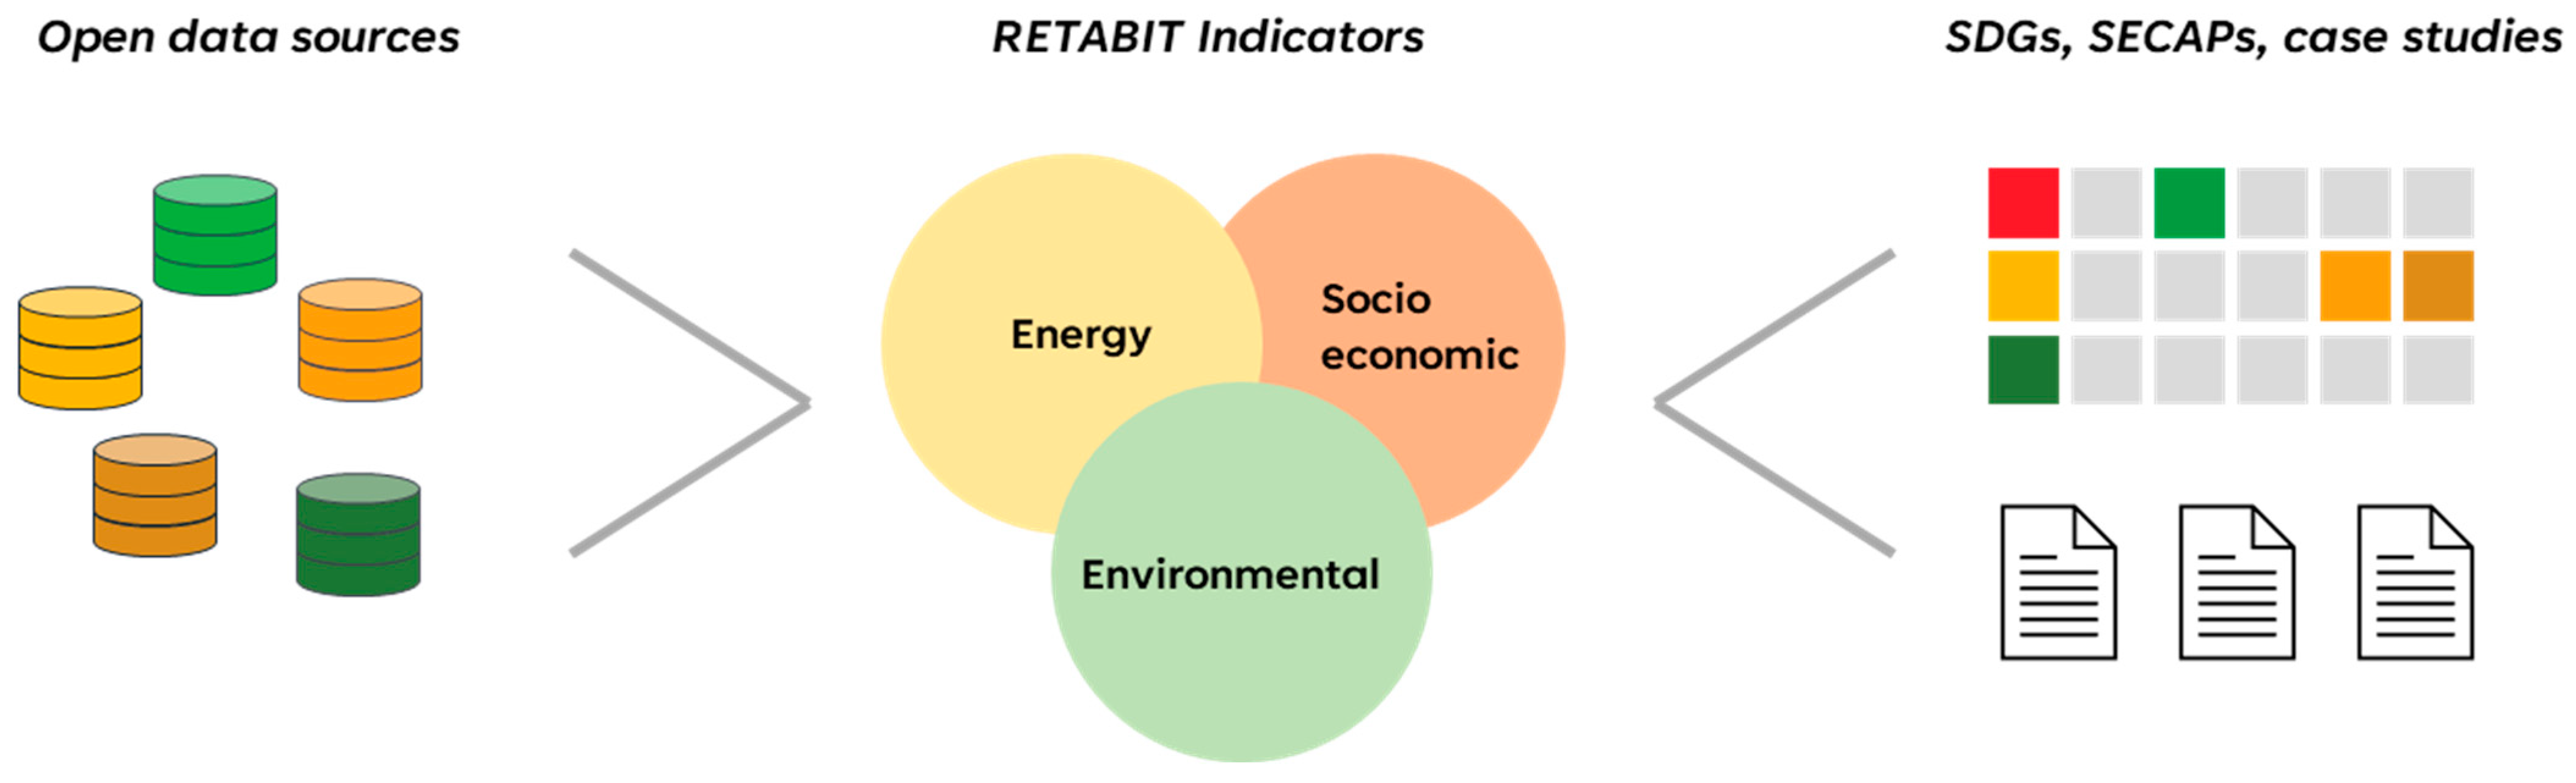
32]. The study began by conducting a comprehensive review of scientific and grey literature to identify local and regional indicator frameworks aligned with the Sustainable Development Goals (SDGs) and Sustainable Energy and Climate Action Plans (SECAPs). Using a five-step methodology, the study gathered over 185 documents and platforms from international databases, institutional reports, and professional networks. Subsequently, eight representative case studies were then selected based on their granularity and coverage at the local and regional level (e.g., Barcelona, Los Angeles). Ultimately, this process yielded a total of 745 indicators, capturing a wide array of approaches to localising and monitoring sustainable development. To narrow down the initial set of 745 indicators to a refined list of 114 a multi-stage methodology was applied. The initial indicators were then filtered based on five key criteria: (1) inclusion in more than one source, (2) relevance to multiple SDG targets, (3) alignment with SECAP indicators, (4) availability from open data sources at the lowest possible scale (i.e., dwelling, building, census tract, or district), and (5) exclusion of indicators based solely on locally developed surveys. After merging duplicates and consolidating redundant indicators, a list of 114 unique indicators was consolidated.
The 114 indicators were then used as a starting point to identify the final list of indicators relevant to the project. As a first step, due to the project’s scope, only indicators directly or indirectly related to residential buildings and retrofitting were retained. Then, two filtering stages were applied. The first was based on data availability and its potential for regular updating, and the second on the expected granularity of the KPIs at the building and district level. After applying these filters, 36 KPIs remained (
Figure 2).
A preliminary set of 36 KPIs was initially developed and subsequently refined through a selection process. The methodology for calculating these indicators varies depending on data granularity: when data are available at the building level, indicators are calculated directly; when only broader spatial data (e.g., census tracts) are available, a downscaling procedure is applied. Expressing all indicators uniformly at the building scale enables consistent aggregation to higher spatial levels—census tract, district, municipal, or regional—supporting accurate and flexible analysis of the building stock.
This refinement process evaluated the applicability of each KPI across spatial scales, their aggregation/disaggregation potential, data availability, and unit standardization. It also ensured methodological soundness by verifying calculation methods through literature review. Ultimately, only 16 KPIs met the necessary standards.
Based on this analysis, a harmonized set of 16 indicators were proposed (
Table 3), aligned with criteria from SDGs, SECAPs, and relevant case studies. These indicators are designed to be calculable at the building level using open urban data sources, enabling a holistic approach to building renovation. Detailed descriptions of the indicators across energy, environmental, and socio-economic domains are provided in the following sub-sections.
4.2.1. Energy Domain
Near-zero energy buildings: This indicator identifies buildings classified as near-zero energy buildings (nZEB) in Spain’s Building Technical Code (Código Técnico de la Edificación, CTE) and aligned with EU Directive 2010/31/EU. Specifically, nZEBs are characterised by very low non-renewable primary energy consumption, primarily achieved through energy-efficient construction features and building systems for heating, cooling, ventilation, and domestic hot water. The CTE criteria, updated in 2019 (Royal Decree 732/2019), set clear limits for energy performance, combining standards for building envelope design with thresholds for total primary energy use calculated according to the UNE-EN ISO 52000-1:2019 standard [
33], and stipulate that most of the consumed energy must originate from renewable sources. This indicator specifically adopts the NRPEC (non-renewable primary energy consumption) metric as its reference. Consequently, for buildings in Catalonia, nZEB classification depends on compliance with established NRPEC thresholds, differentiated by climatic zones (B, C, D, and E), as defined in the CTE DB-HE (
Table 4).
Buildings whose calculated NRPEC values from the EPC databases fall below these limits are classified as near-zero energy buildings. This indicator thus serves as a critical benchmark for evaluating urban sustainability, energy performance, and the transition toward high efficiency building standards.
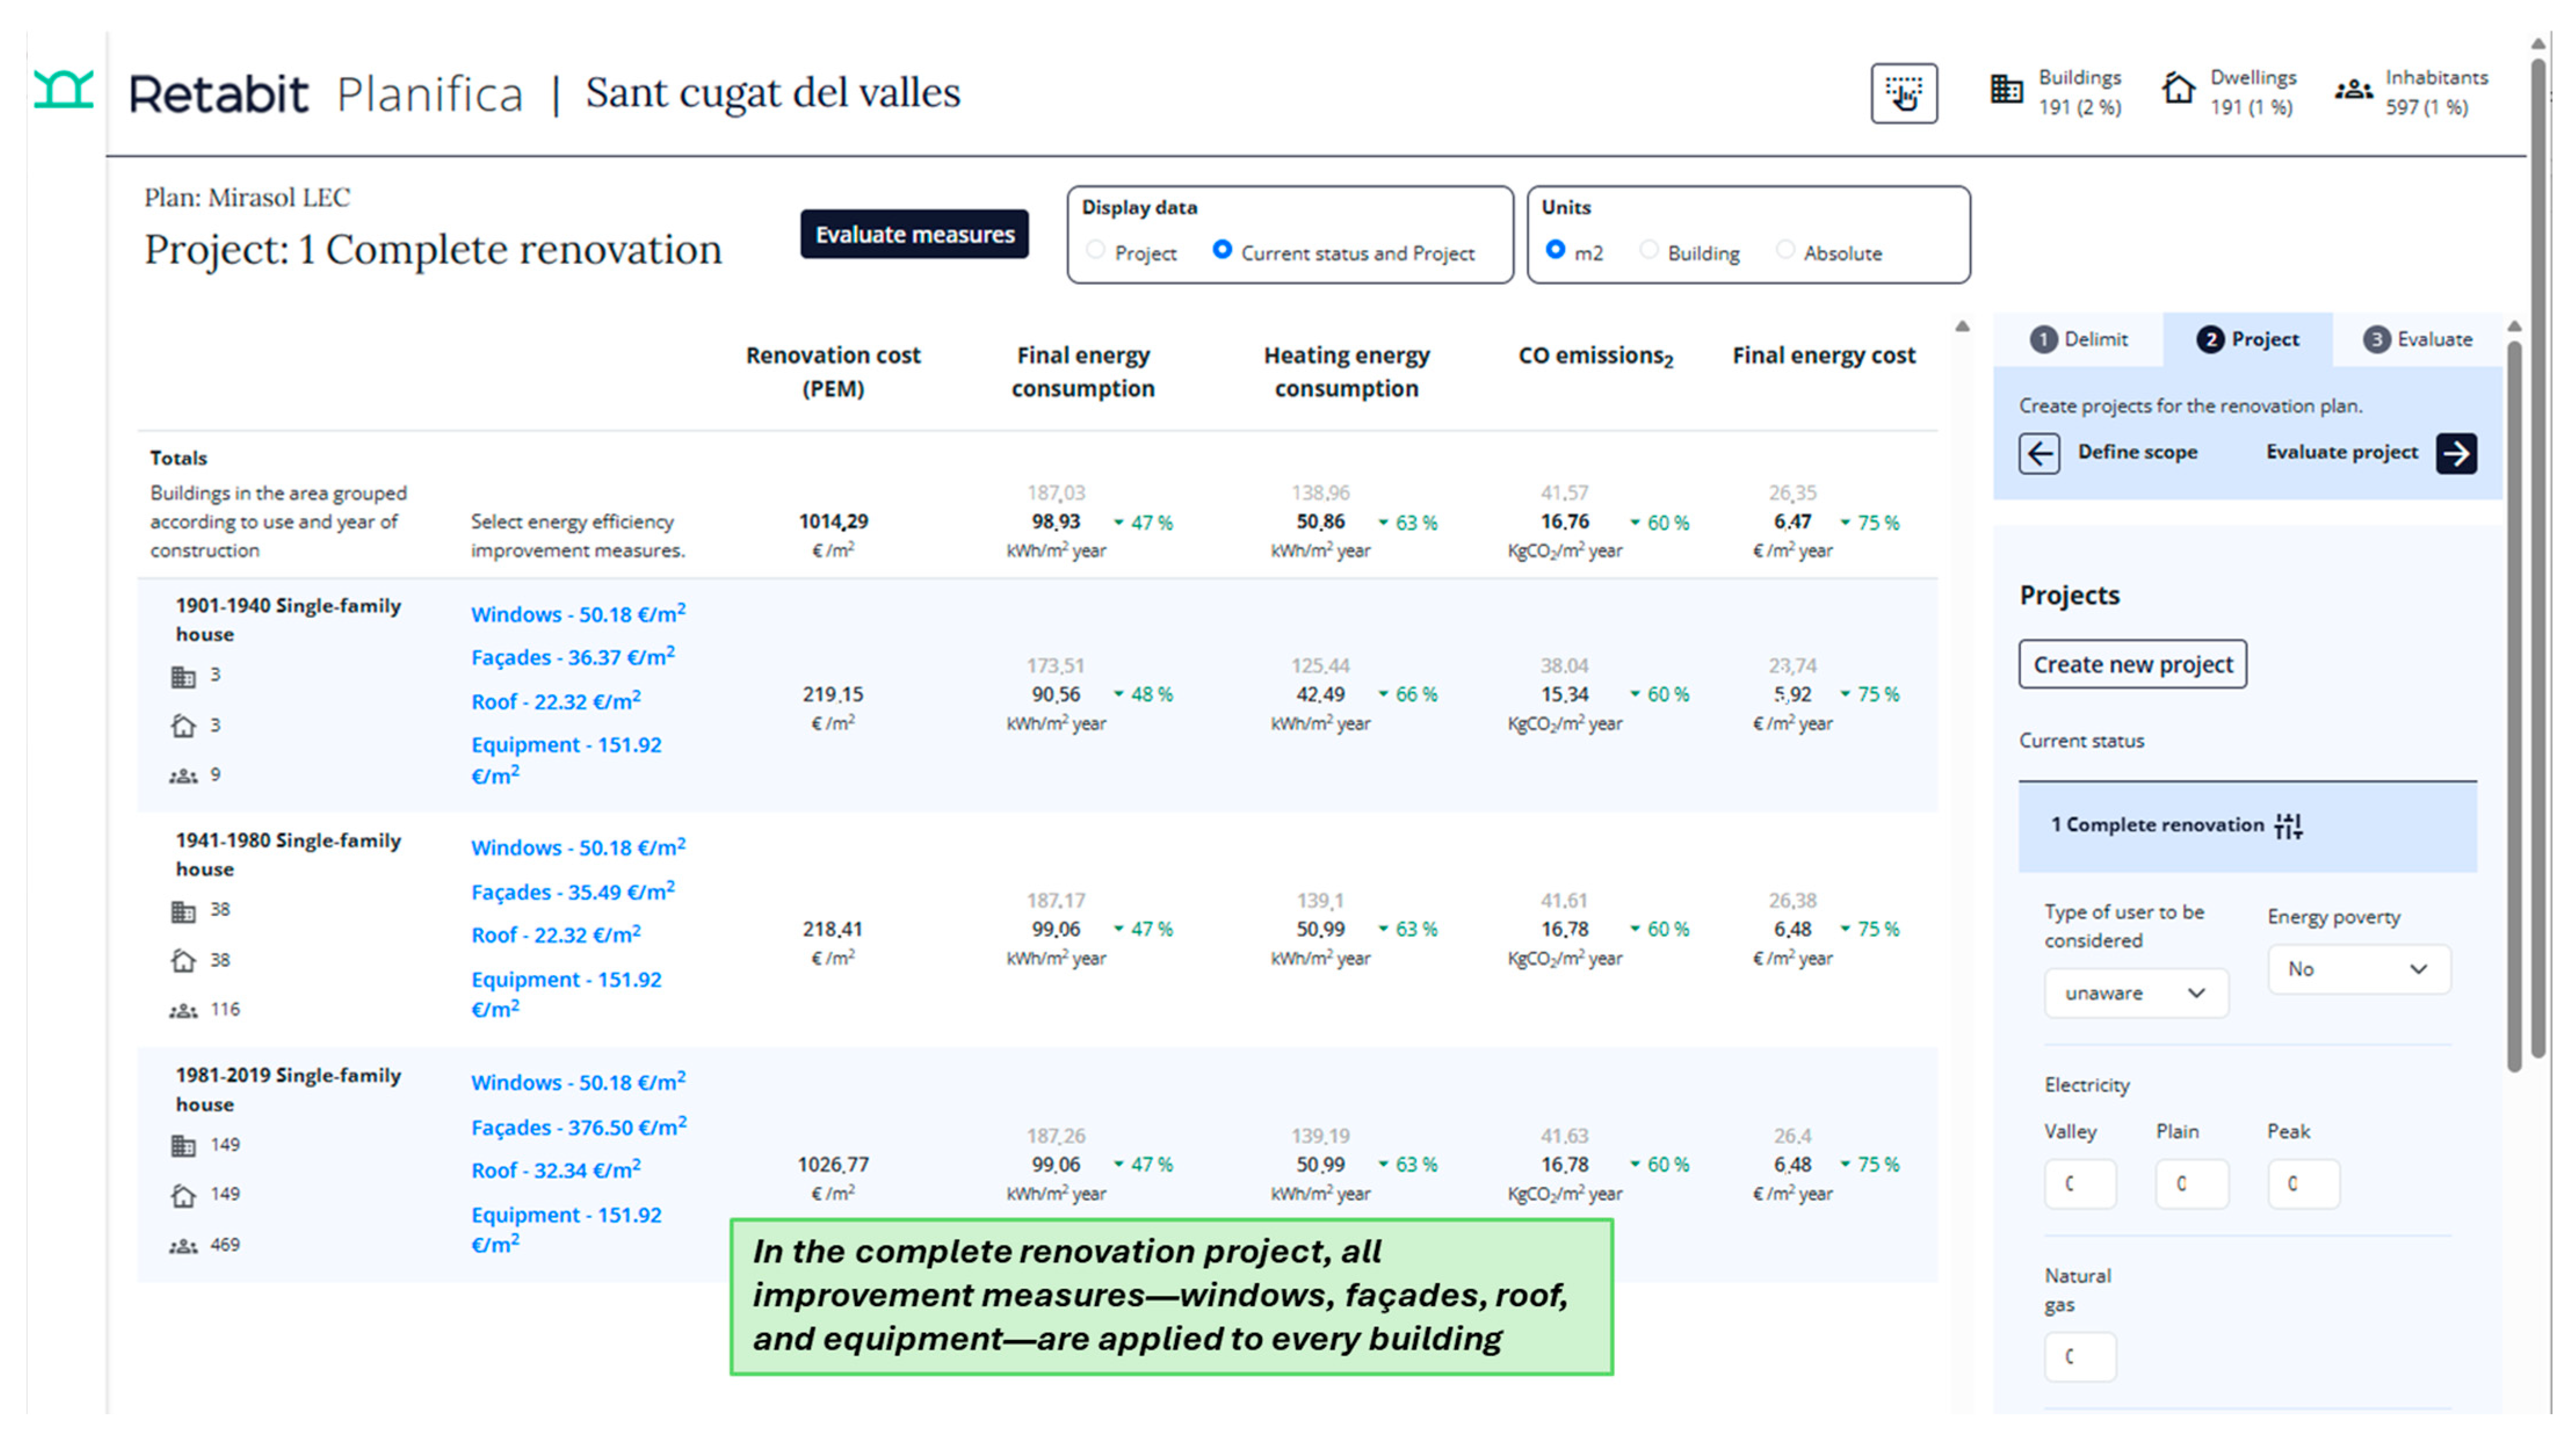
Energy-renovated residential buildings: This energy indicator identifies existing residential buildings that, after undergoing refurbishment, achieve a non-renewable primary energy consumption (NRPEC) low enough to be deemed efficient under the CTE. Such buildings promote a rational use of energy for heating, domestic hot water, cooling, and ventilation, keeping consumption within sustainable limits even though they do not reach the nearly zero-energy building benchmark. By pinpointing these upgraded structures, the indicator supports assessments of progress toward climate-mitigation goals and guides policy incentives for energy retrofits in the existing housing stock.
The reference framework is the 2019 revision of the CTE, which transposed Directive 2010/31/EU and tightened requirements on total primary energy use—calculated with UNE-EN ISO 52000-1:2019 [
33]—together with minimum envelope performance standards. For refurbished or change-of-use buildings, the CTE sets differentiated NRPEC limits by climatic zone.
Table 5 shows the relevant ceilings for Catalonia as defined in the CTB DB-HE0.
The indicator is derived by retrieving each building’s non-renewable primary energy demand from the official Energy Performance Certificate (EPC) database managed by the Catalan Institute for Energy (ICAEN) and comparing it with the climatic zone thresholds established in CTE DB-HE0. Buildings whose NRPEC does not exceed the relevant threshold (55–80 kWh/m2·year, depending on zone B–E) are classified as energy-renovated. The result may be reported as a binary attribute at the building scale or, when aggregated, as the proportion of energy-renovated dwellings within a given spatial unit, providing a concise yet robust measure of refurbishment-driven energy efficiency across the residential stock.
Passive buildings: This energy indicator identifies residential buildings whose calculated annual space-heating demand and space-cooling demand are each ≤15 kWh/m2·year. The limit adopts the Passivhaus standard adapted to temperate climates, a benchmark that closely aligns with the 2019 CTE and with the EU EPBD EU/2024/1275, which charts a transition from nearly-zero-energy buildings (nZEB) to zero-emission buildings (ZEB). The indicator is relevant because many existing buildings cannot feasibly reach the ZEB target; identifying stock that already operates at Passivhaus-level demand helps planners prioritise deep-renovation resources elsewhere and supports policies that scale up renewable on-site generation for ultra-low-demand buildings.
The indicator is derived by retrieving each building’s certified heating and cooling demand from ICAEN’s EPC database. The indicator can be reported either as a binary attribute per building or aggregated (e.g., share of passive buildings per census section).
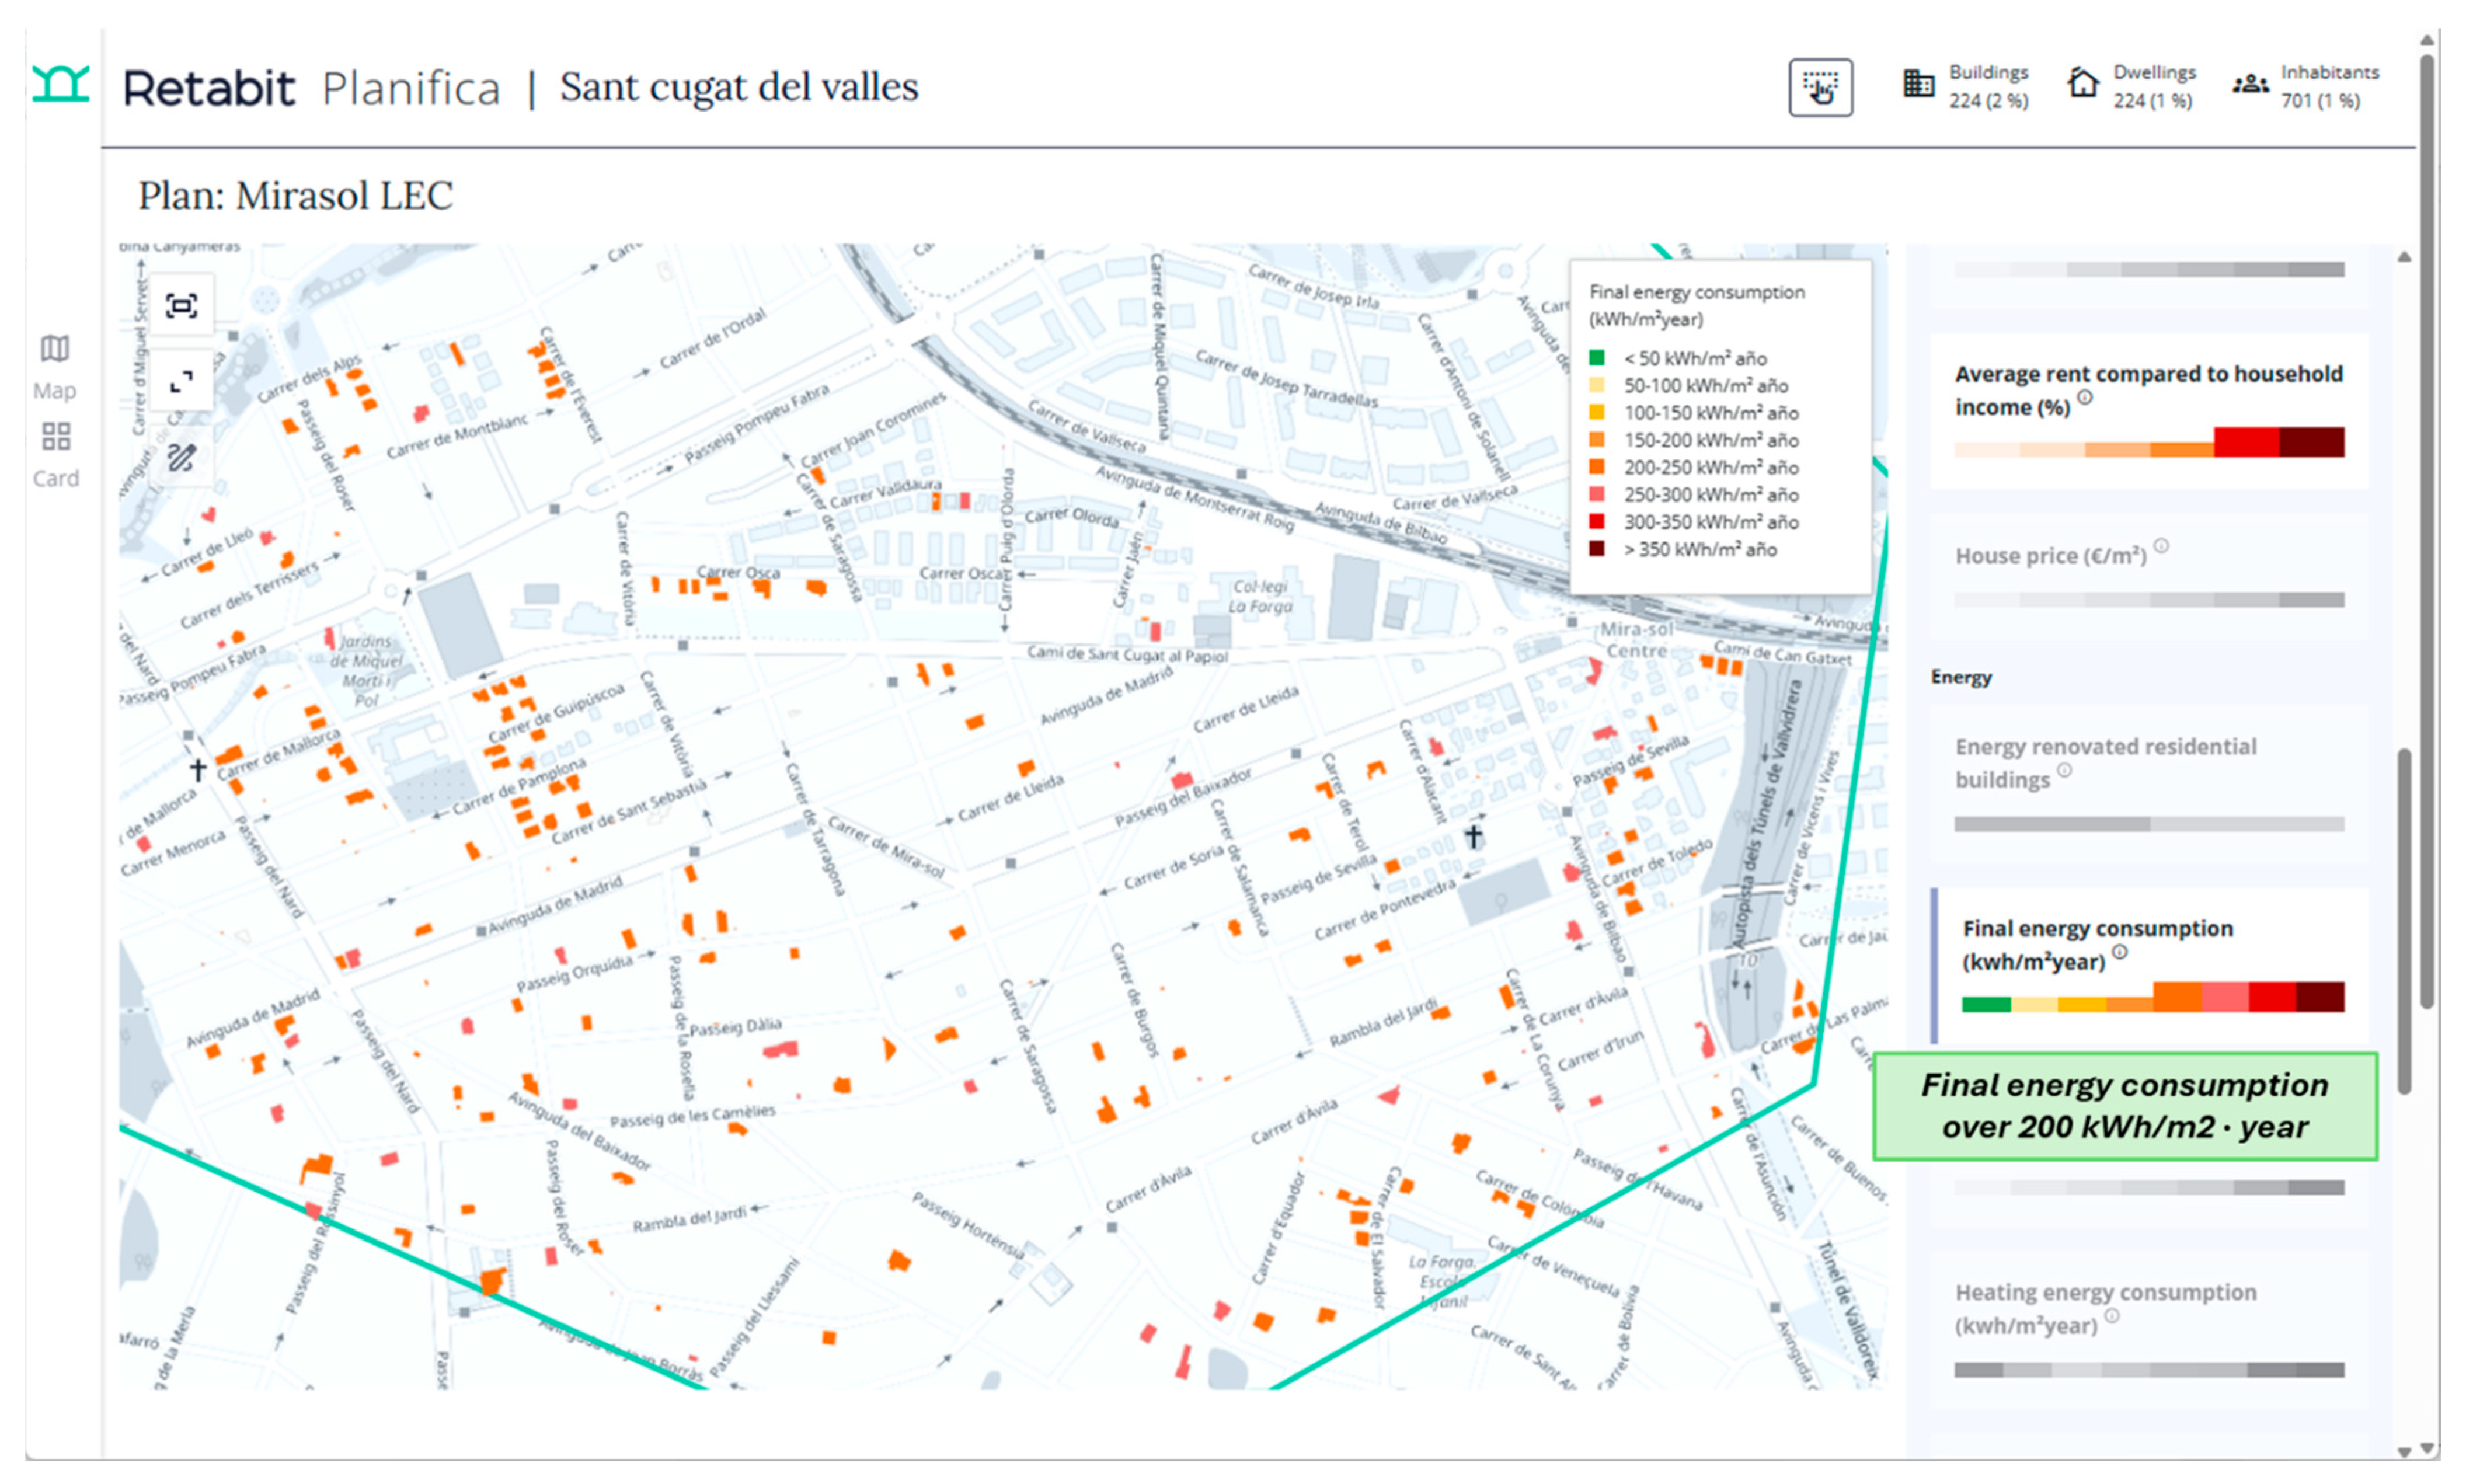
Final energy consumption: This energy indicator quantifies the total final energy (kWh/m2·year) consumed by a building and not produced by on-site renewable sources. It encompasses the energy demand for space heating, domestic hot-water production, space cooling, and mechanical ventilation in each dwelling. By focusing on final energy rather than primary energy, the metric reflects the amount billed to occupants at the point of supply, facilitating direct comparison with utility invoices and enabling combined analyses with economic indicators. The indicator is derived from the building’s EPC, which provides standardised simulations of energy performance under normalised operating and occupancy conditions. Because large-scale in-situ metering is seldom feasible, the EPC serves as the most widely available information source for estimating a building’s final energy demand.
Where available, the EPC database for Catalonia provides pre-computed final energy indicator extracted from individual EPC records. Retabit adopts this value directly when a valid certificate exists for the building or dwelling. When an EPC is absent, the indicator is estimated through a regression model based on the XGBoost algorithm that forms part of the platform’s data-ingestion workflow. The model was trained on a curated data set of approximately one million EPC certificates and employs year of construction, conditioned floor area, principal building use, and climatic zone as predictors. The same machine-learning pipeline is applied to other key performance indicators that depend on EPC variables (e.g., heating energy consumption and operational carbon intensity) thereby guaranteeing a consistent, building-level set of metrics across the urban stock.
Heating energy consumption: This energy indicator quantifies the total non-renewable primary energy consumption devoted exclusively to space-heating systems in a building, expressed in kilowatt-hours per square metre of conditioned floor area and year (kWh/m2·year). By isolating the portion of energy that is neither generated in situ nor sourced from renewables, the metric reveals the effectiveness of the building’s heating systems and its ability to ensure thermal comfort during winter without relying on fossil-based resources. Assessing heating-related NRPEC is pivotal for diagnosing the environmental performance of the building stock and for prioritising retrofit actions that reduce carbon intensity, improve occupant well-being, and facilitate the integration of on-site renewable heat production. High values highlight opportunities for envelope improvements, system upgrades, or the substitution of conventional boilers with low-emission technologies (e.g., heat pumps, biomass, or district heating sourced from renewables).
The indicator is derived directly from the EPC database following the same methodology as the Final energy consumption indicator.
CO2 emissions: This energy indicator quantifies the operational carbon footprint of a building, expressed as kilograms of CO2 emitted per square metre of conditioned floor area per year (kg CO2/m2·year). It captures carbon emissions attributable to the building’s energy use under standard operating and occupancy conditions, thereby providing a direct measure of environmental impact during the use phase.
Monitoring in-use emissions is critical for benchmarking progress towards the decarbonisation targets set by European and national legislation—most notably the latest EPBD recast, which requires the progressive transformation of the stock into zero-emission buildings. In conjunction with non-renewable primary energy demand, carbon intensity is a core performance metric for evaluating whether existing buildings comply with, or fall short of, the forthcoming regulatory standards.
The indicator is derived from the EPC, where annual CO2 emissions are reported as a principal output alongside NRPEC. For buildings holding a valid certificate, the certified value, previously normalised by floor area, is directly adopted as indicator. For buildings lacking an official EPC, CO2 emissions are estimated using a machine learning workflow that infers missing values based on building typology, construction period, climatic zone, and system characteristics.
This indicator is extracted directly from the EPC database, applying the methodology used for the Final energy consumption indicator.
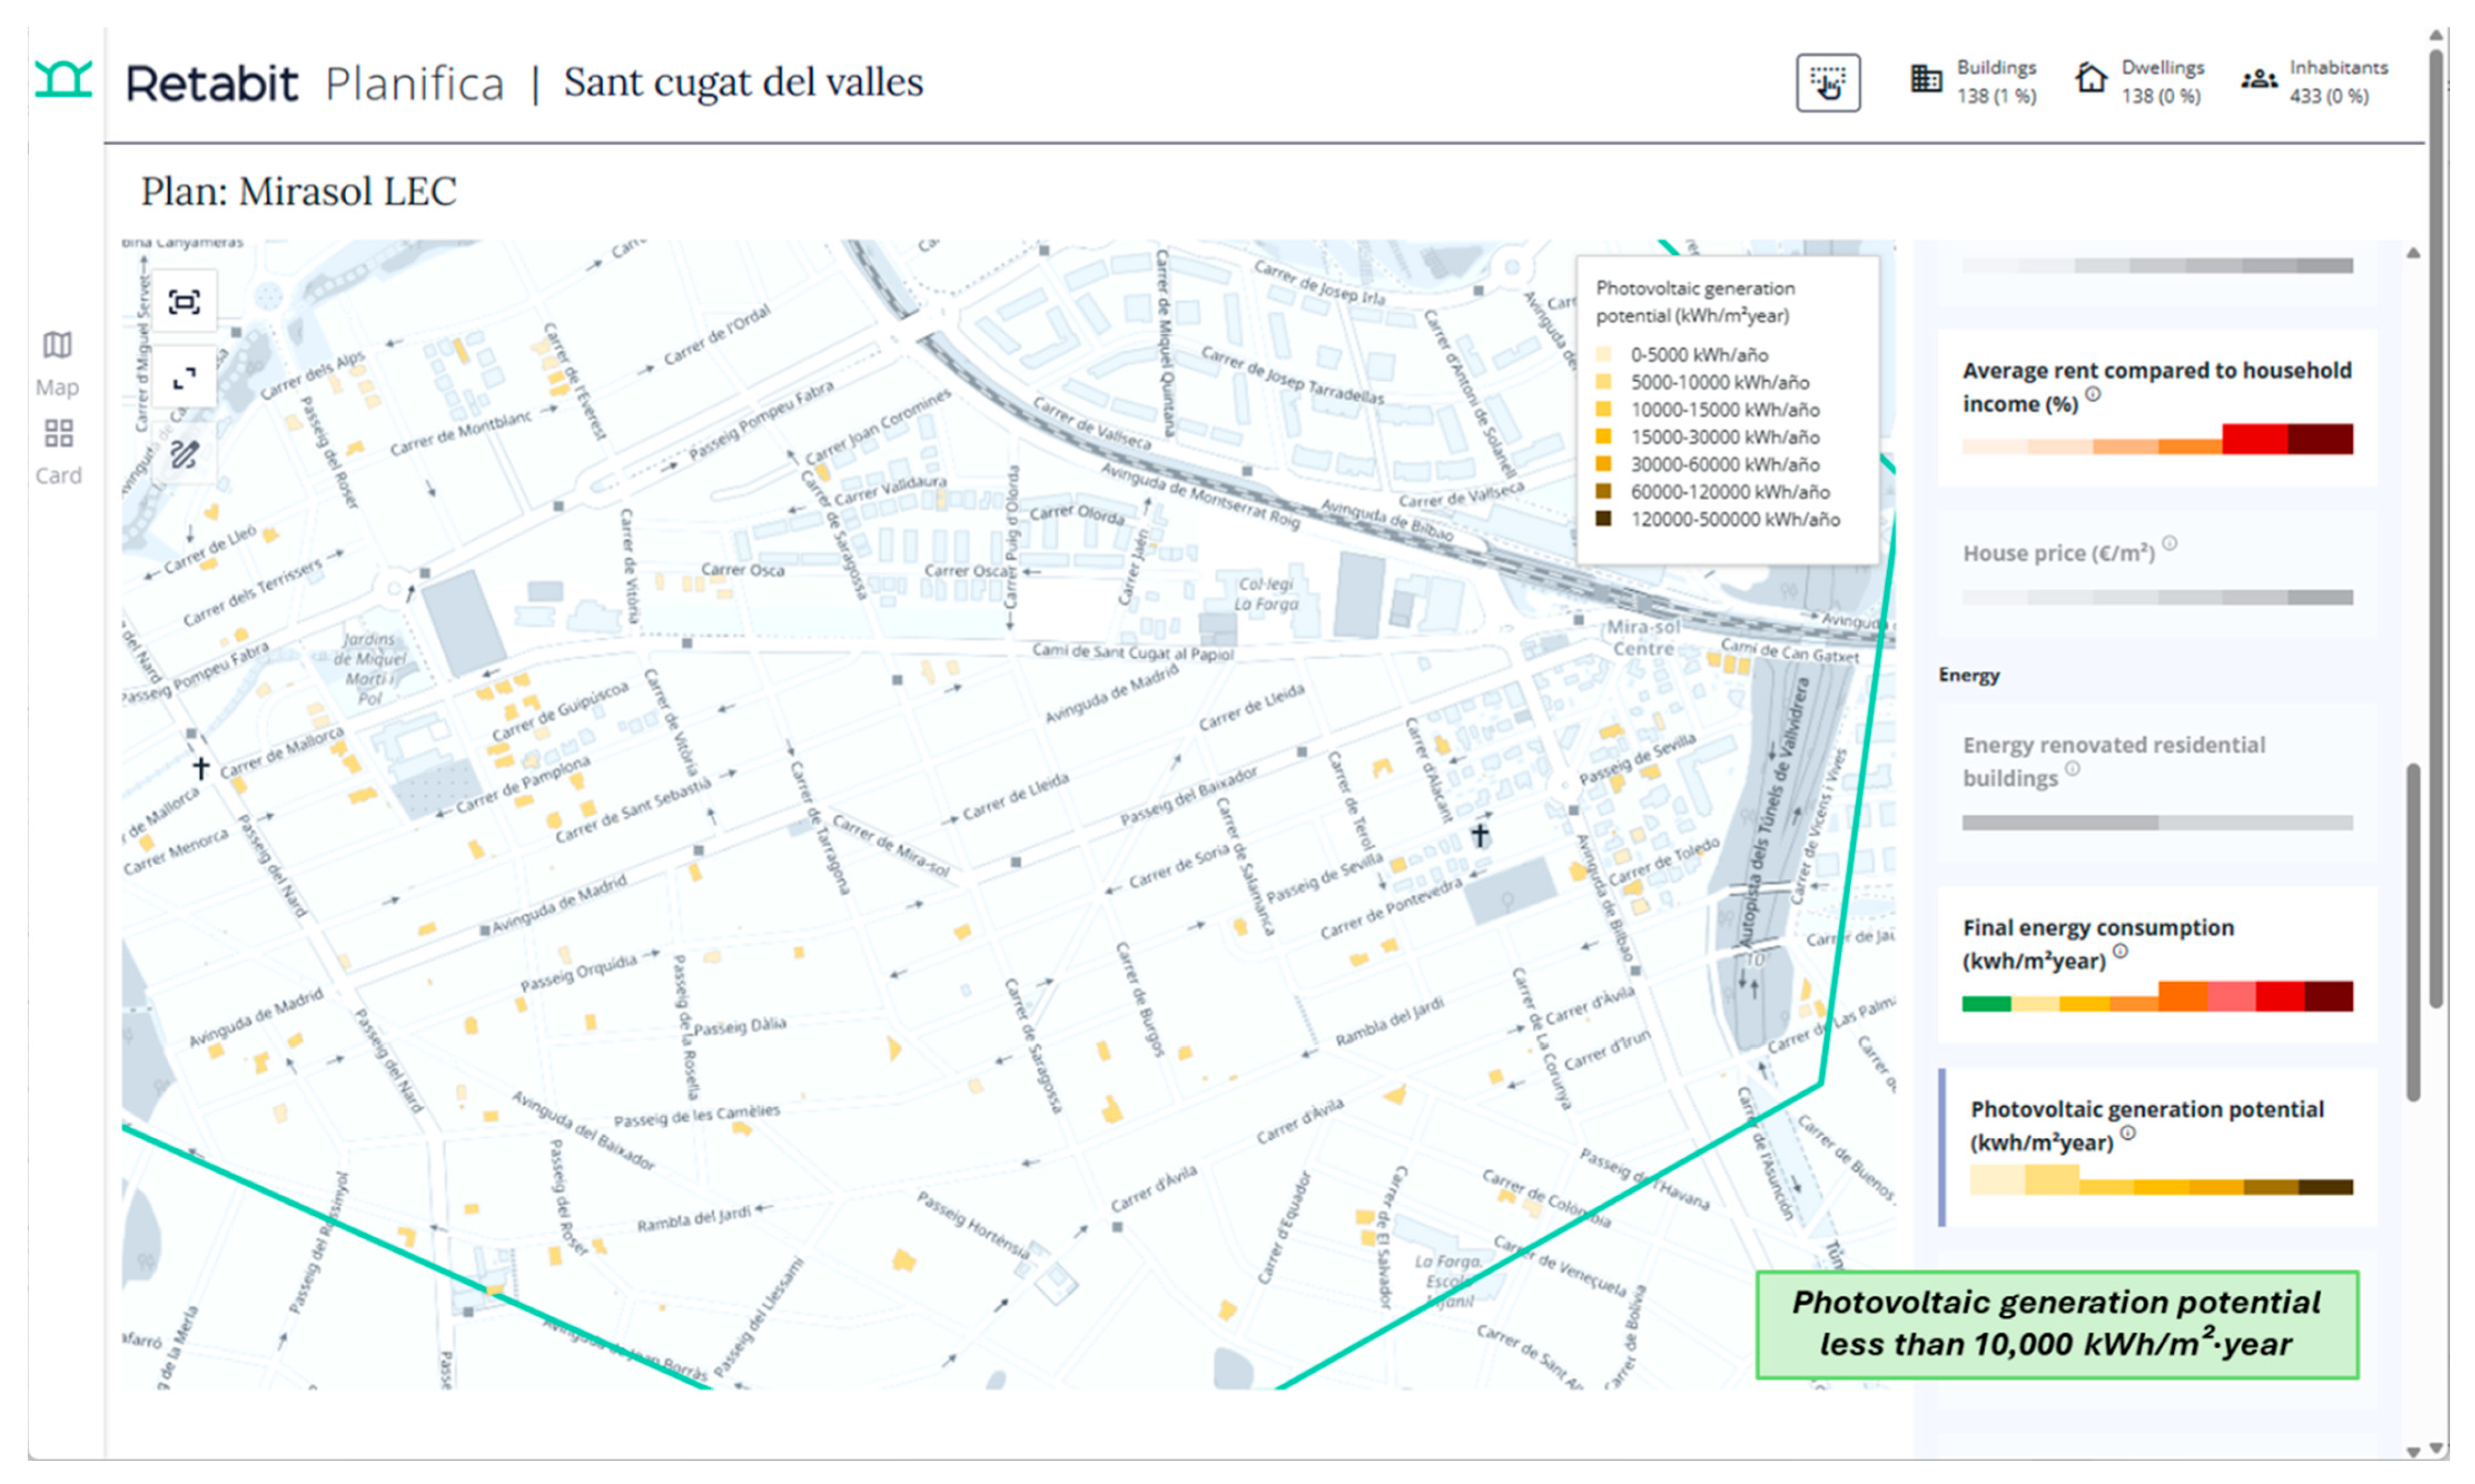
Photovoltaic generation potential: This energy indicator estimates the annual electrical output a building could generate from a photovoltaic (PV) system installed on its roof, expressed in kilowatt-hours per square metre of roof area per year (kWh/m2·year). The indicator reveals the relative suitability of individual buildings for solar energy capture, informs cost benefit assessments of retrofits, and supports urban planning for distributed renewable capacity.
The estimate is produced with the Photovoltaic Geographical Information System (PVGIS) of the Joint Research Centre of the European Commission [
34]. The PVGIS combines satellite-derived irradiance data with a validated PV performance model to give location specific generation values. For each roof, the process begins by extracting its footprint from cadastral data. This footprint, defined as the polygon above the uppermost inhabited storey, is overlaid with a two-metre square grid representing the space needed for each PV module plus a service corridor. A conservative nominal module power of 450 W is used to avoid overestimating the installed peak power. This value was selected following a market survey, which showed that most silicon monocrystalline products targeted at the residential and micro-PV segments fell within the 430–450 W range.
A roof-specific horizon profile is generated to refine the shading input supplied by the PVGIS. First, a local digital elevation model and three-dimensional building envelopes are constructed by extruding cadastral footprints with a constant storey height and the reported number of floors. For each roof centroid, a ray is cast at one-degree intervals through 360° in the horizontal plane. Along every azimuth, the algorithm records the first intersection with the terrain or with an extruded building surface; the corresponding elevation angle from the roof plane to the top of that obstacle is then computed. The resulting 360 values—one for each degree of azimuth—are exported as a comma-separated horizon file, replacing the default PVGIS horizon, which has a resolution of 90 m and cannot account for near-field obstructions such as neighbouring buildings. In this way the PV performance simulation accounts for site-specific shading conditions, yielding a more accurate estimate of the photovoltaic generation potential.
Because detailed information on roof slope is unavailable at large scale, all roofs are treated as essentially flat, with a maximum pitch of 5° as permitted by national building regulations. Panels are modelled as lying in the plane of the roof and oriented to the south, which maximises annual yield under local climatic conditions. Row spacing follows the IDAE (Instituto para la Diversificación y Ahorro de la Energía, which is the Institute for the Diversification and Saving of Energy in Spain) guideline:
where
d is the row spacing,
h is the panel height, and
Φ is the site latitude. Applying this relation to the southern and northern limits of Catalonia (40.5° N and 42.8° N) gives a minimum spacing of 0.31 m. Combining this distance with the horizontal projection of a standard 2.1 m × 1.15 m panel and a 0.5 m maintenance aisle results in an effective allocation of about 4 m
2 for each module.
Additional PVGIS inputs include a fixed aggregate loss factor of 14 per cent, which accounts for cabling, inversion, degradation, and other system losses, and a shading profile constructed from a detailed digital model of building heights together with the PVGIS horizon data. The PVGIS provides the annual energy yield for the hypothetical PV array, and dividing this value by the roof area produces the indicator expressed in kWh/m2·year.
4.2.2. Socio-Economic Domain
Housing prices: This indicator captures the average rental price per square metre (€/m2) of dwellings within each residential building. It serves as a key metric for assessing housing affordability and economic pressure in urban areas, enabling the identification of zones with heightened market tension. Moreover, it facilitates the analysis of socio-economic segregation and gentrification patterns, contributing to the formulation of public policies aimed at regulating and planning the housing market.
The indicator is derived from the State Reference System for Rental Housing Prices (Sistema Estatal de Referencia de Precios del Alquiler de Vivienda, SERPAVI), managed by the Ministry of Housing and Urban Agenda of Spain [
35]. This public dataset provides benchmark rental price indices aligned with the objectives of Law 12/2023, of 24 May, on the Right to Housing [
36]. The law establishes that, in areas declared as having a strained housing market, rental prices—particularly those set by large property owners or for units not previously let in the last five years—must not exceed the maximum limit established by these reference indices.
SERPAVI provides price indices at the level of the census section, distinguishing between single-family and multi-family dwellings. For the calculation of this indicator, rental price values from SERPAVI are spatially joined to their corresponding georeferenced census sections throughout Catalonia. These values are classified into housing affordability categories using quantile-based intervals, enabling comparative assessment across the territory as follows:
≤10th percentile: 0–4.1 €/m2
10th–25th percentile: 4.1–5.5 €/m2
25th–50th percentile: 5.5–7 €/m2
50th–75th percentile: 7–12.3 €/m2
75th–90th percentile: 12.3–19.5 €/m2
≥90th percentile: 19.5–20 €/m2
Average household income: This indicator represents the average annual net income of all individuals residing within a household, expressed in euros (€), and is calculated for the aggregate of households located in a given building. It serves as a key metric for analysing income distribution in urban areas and contributes to the identification of zones at risk of social exclusion and economic segregation. Furthermore, it offers essential contextual information for studies on housing accessibility, gentrification, and inequalities in the distribution of financial resources.
The indicator is based on the average household income data provided by the INE (Instituto Nacional de Estadística, the Spanish National Statistics Institute), specifically derived from the Living Conditions Survey (Encuesta de Condiciones de Vida) [
37]. According to the INE, average annual net household income is defined as “[…] the net annual income of household members after deducting income tax, wealth tax, and social security contributions, and including received transfers.” These incomes can include various sources such as “[…] employment earnings, net self-employment income, social benefits, private pension schemes unrelated to employment, capital and property income, inter-household transfers, income received by minors, and tax return outcomes.” [
37].
The INE provides this data across several levels of territorial disaggregation, including municipalities, districts, and census sections by province. For the calculation of this indicator, the mean annual net income per household at the census section level is used. Through georeferencing techniques, these income values are assigned to the corresponding census sections and subsequently linked to each building based on its location. This enables a spatialised and building-level representation of household income distribution across an urban area, supporting detailed socio-economic analysis and policy development.
Average rent compared to household income: This economic indicator quantifies the percentage (%) of average household income that households within a given building would need to allocate towards rent payments. The calculation is based on an estimated rental price derived from the average dwelling area within the building, combined with reference rental values provided by the SERPAVI [
35].
Comparative analysis of rental prices relative to household income highlights urban areas experiencing heightened economic stress, potentially leading to housing affordability problems. Such circumstances may result in the displacement of vulnerable populations towards lower-cost neighbourhoods, reinforcing socio-economic segregation and exacerbating issues such as overcrowding, diminished access to essential services, reduced employment opportunities, and overall lower quality of life. Additionally, allocating a substantial proportion of household income to housing may limit residents’ financial capacity to address other fundamental needs, including healthcare, further deteriorating living conditions.
The indicator is calculated by dividing two indicators: Housing prices and Average household income. Specifically, the process involves determining the average dwelling surface area for all residential units within the building, using cadastral data. This area is then multiplied by the building-specific rental price indicator to estimate the rental cost. The resulting estimated cost is then compared with the average household income, resulting in the indicator expressed as a percentage. This indicator provides valuable insight into economic vulnerability, housing affordability, and the potential socio-economic impacts associated with disproportionate rental expenditure.
Population with income below 60% of median: This indicator measures the proportion of residents within each building whose economic status places them at risk of poverty, defined by having household incomes below the established poverty threshold. Specifically, this threshold is set at 60% of the median annual net household income for Catalonia, reflecting a commonly accepted measure of relative poverty. Identifying populations at risk of poverty enables targeted interventions in socio-economic support, housing rehabilitation programmes, and the provision of social housing. Furthermore, it informs policy planning aimed at reducing social exclusion and alleviating the economic burden of housing for vulnerable households.
The indicator is calculated by comparing the average household income per building to the poverty threshold, based on official income statistics. Income data are obtained from the Living Conditions Survey, which provides geographically disaggregated figures at the levels of census sections, municipalities, districts, provinces, and regions (i.e., Comunidades Autónomas). For this indicator, census-section-level income data is used, georeferenced, and assigned to each building based on its location within the corresponding census section.
Additionally, regional-level data from the INE for Catalonia is used to determine the poverty threshold, defined as 60% of Catalonia’s median annual net household income. The indicator is calculated by comparing the average income of each georeferenced building against this poverty threshold, thereby identifying buildings whose average household income places their residents below the established poverty line.
4.2.3. Environmental Domain
Vulnerability to heatwaves and temperature rise: This indicator assesses the level of vulnerability of buildings to extreme heat events, such as heat waves and rising summer temperatures, expressed on a scale from 0 to 9. It reflects the combined impact of urban heat island effects, reduced thermal comfort, and increased health risks for residents, particularly in areas with limited green infrastructure and high population density. The indicator enables the identification of zones most exposed to thermal risk and least equipped to adapt, supporting urban planning strategies aimed at climate change mitigation and resilience. The indicator builds upon the methodology established by the Oficina Catalana del Canvi Climàtic [
38] through the SAL02 index (‘Empitjorament del confort climatic’, deterioration of climate comfort) but adapts it to the census section scale using open-access data sources available at this level of granularity. It integrates three sub-indicators:
Projected summer temperature increase,
Urban population density, and
Proportion of urban green space.
- -
Projected summer temperature increase: This sub-indicator estimates the expected rise in average summer temperatures for each census section, based on historical climatological data from the Spanish Meteorological Agency (AEMET) and adjusted using a climate adaptation factor: 1.8 for coastal areas and 1.9 for inland and Pyrenean regions. The formula used is: Projected temperature increase = T + f, where T is the historical summer average and f is the climate zone factor. Based on the resulting value, a score of 1 (low), 2 (medium), or 3 (high) is assigned.
- -
Urban population density: This sub-indicator is derived from the number of inhabitants per census section, divided by the built-up urban area (in m2), using data from the National Statistics Institute and cadastral records. The resulting population density is classified as follows:
Low density (≤2500 inhab./km2)
Medium density (urban core > 5000 inhabitants but not exceeding 20,000 at ≤5000 inhab./km2)
High density (urban core > 20,000 inhabitants and ≤5000 inhab./km2)
- -
Proportion of urban green space: This component calculates the proportion of green space relative to the urban land area within each census section, using georeferenced urban planning data. The formula applied is green space ratio = Sv/A’ where Sv is the surface area of green zones and A’ is the total urban land area. The classification is as follows:
To calculate the final vulnerability score, the three sub-indicators are combined using the formula defined by the Oficina Catalana del Canvi Climàtic [
38]:
The result yields a vulnerability score between 0 (no vulnerability) and 9 (maximum vulnerability). This value provides a spatialised, quantitative assessment of thermal risk at the building level, enabling planners and policymakers to prioritise interventions in areas most in need of passive cooling measures and green infrastructure.
Green space area: This indicator quantifies the total area of green spaces, expressed in hectares, within a 400 m radius of a given building. It serves as a proxy for assessing the environmental quality social wellbeing, and public health benefits of the surrounding urban environment. The 400 m threshold aligns with internationally recognised standards, including those proposed by Atiqul Haq [
39] and UN-Habitat [
40], which identify this distance as the maximum acceptable for ensuring equitable, walkable access to public green spaces. A minimum of 1 hectare of green space within this radius is recommended to promote urban sustainability and enhance residents’ well-being.
The calculation of this indicator utilises high-resolution land cover data provided by the ICGC (Institut Cartogràfic i Geològic de Catalunya, Catalonia’s Cartographic and Geological Institute). This dataset, with a spatial resolution of 1 m and thematic resolution encompassing 41 land cover classes, is derived from orthophotos and other remote sensing sources. The classification system used aligns with the INSPIRE land cover classification system, facilitating harmonisation with European datasets.
For each building, a circular buffer with a radius of 400 m is generated from the centroid of its footprint. This buffer is then spatially intersected with the land cover dataset to isolate green space classes falling within the defined perimeter. These include urban green zones as well as various categories of natural vegetation such as dense and sparse forests, shrublands, and grasslands, as classified in the dataset. The resulting intersected areas are then calculated in hectares to determine the total amount of accessible green space per building.
Urban facilities within a 15 min walk: This indicator measures the number of different facilities located within a walking distance equivalent to 15 min from a given building. Facilities are categorised into five functional groups: care, education, provisioning, entertainment, and transport. The indicator captures spatial accessibility to everyday services and amenities, providing insight into the degree of social vulnerability and urban segregation. Its relevance lies in identifying disparities in access to key services and in supporting evidence-based strategies for inclusive urban planning and development. The definition and methodology are informed by the framework established by Ferrer-Ortiz et al. [
41] which adapts the 15 min city concept to the context of Barcelona. Walking distances are derived from time thresholds assigned to each facility type and converted into metric units using an average walking speed of 72 m per minute. This speed, established by the meta-analysis conducted by Bohannon and Andrews [
42], represents a population-weighted mean across age and gender groups. A tolerance margin of 100 m is added to each distance to account for spatial imprecision due to parcel geometry and building typologies. For example, a facility with a threshold of 10 walking minutes would correspond to a radius of 820 m (72 m/min × 10 min + 100 m). These calibrated distances are used to define accessibility buffers for each facility category (
Table 6).
To calculate the indicator, a proximity-based spatial analysis is conducted to identify which facilities are located within the defined walking distance of each building. For each of the 24 facility categories, a distance threshold—derived from the conversion of walking time into metres—is applied using the centroid of the building footprint as the reference point. A facility is considered accessible if it is located within the corresponding distance radius.
Access to cycle lanes: This indicator measures the presence of cycling infrastructure within walking distance of residential buildings. It reflects the potential of the immediate urban environment to encourage active and sustainable modes of transport such as bicycles, scooters, or roller skates. This indicator highlights the degree to which urban design encourages non-motorised mobility, contributing to environmental sustainability, public health, and inclusive urban accessibility.
The methodological framework follows the spatial accessibility approach detailed in the previous indicator
Urban facilities within a 15 min walk, using building centroids and distance-based buffers to assess proximity. Specifically for this indicator, a maximum walking time of 5 min to the nearest cycle lane is considered adequate, in line with the thresholds defined by Ferrer-Ortiz et al. [
41]. This threshold is converted into a distance of 460 m using an average walking speed of 72 m per minute, with an additional 100 m margin to account for spatial deviations. A cycle lane is considered accessible if it lies within this distance from the building centroid.
Access to recharging points: This indicator evaluates the adequacy of electric vehicle (EV) recharging infrastructure in proximity to residential buildings. Rather than measuring only the presence or number of recharging points, the indicator assesses the ratio between supply (available charging outlets) and demand (estimated number of dwellings), thereby reflecting the capacity of the surrounding area to support a transition toward electric mobility. This measure is particularly relevant in dense urban areas, where private parking is limited and public infrastructure becomes essential for enabling widespread EV adoption. The methodological framework is consistent with the spatial accessibility model used in previous indicators such as Urban facilities within a 15 min walk and Access to cycle lanes. A maximum walking distance of 460 m is used, corresponding to a 5 min walk. Each building is represented by the centroid of its ground-floor footprint, derived from georeferenced cadastral data. Around each centroid, a 460 m accessibility buffer is created to identify nearby recharging points.
The indicator is calculated by aggregating the number of recharging outlets and the number of dwellings within each buffer zone. It expresses the result as a percentage of adequacy, based on a reference standard of one outlet per ten dwellings. The final value is obtained using the formula
where a result of 100 indicates full adequacy (i.e., one outlet per ten dwellings). Values above or below this threshold indicate an over- or under-provision of infrastructure relative to the estimated residential demand. This approach allows for a more nuanced interpretation of access, going beyond spatial proximity to consider actual capacity and potential usage pressure. The outlets considered are those included in the dataset provided by the Open Data Portal of Catalonia [
43].


 ,
, 


