Abstract
This study presents a novel predictive framework for estimating electric vehicle (EV) charging demand in smart cities, contributing to the advancement of data-driven infrastructure planning through behavioural and spatial data analysis. Motivated by the accelerating regional demand accompanying EV adoption, this work introduces HCB-Net: a hybrid deep learning model that combines Convolutional Neural Networks (CNNs) for spatial feature extraction with Extreme Gradient Boosting (XGBoost) for robust regression. The framework is trained on user-level survey data from two demographically distinct UK regions, the West Midlands and the North East, incorporating user demographics, commute distance, charging frequency, and home/public charging preferences. HCB-Net achieved superior predictive performance, with a Root Mean Squared Error (RMSE) of 0.1490 and an score of 0.3996. Compared to the best-performing traditional model (Linear Regression, ), HCB-Net improved predictive accuracy by 13.5% in terms of , and outperformed other deep learning models such as LSTM () and GRU (), which failed to capture spatial patterns effectively. The hybrid model also reduced RMSE by approximately 23% compared to the standalone CNN (RMSE = 0.1666). While the moderate indicates scope for further refinement, these results demonstrate that meaningful and interpretable demand forecasts can be generated from survey-based behavioural data, even in the absence of high-resolution temporal inputs. The model contributes a lightweight and scalable forecasting tool suitable for early-stage smart city planning in contexts where telemetry data are limited, thereby advancing the practical capabilities of EV infrastructure forecasting.
1. Introduction
The rapid adoption of electric vehicles (EVs) is reshaping urban mobility and necessitating the development of a robust and efficient charging infrastructure, particularly in smart cities. As governments worldwide implement policies to reduce carbon emissions and encourage sustainable transport, EVs are emerging as a key solution to combat climate change and improve air quality. The UK has set ambitious targets to phase out the purchase of new internal combustion engine (ICE) vehicles, with a growing emphasis on enhancing EV accessibility and infrastructure to support this transition by 2035 [1,2]. As EV adoption accelerates, concerns regarding power grid stability and demand fluctuations have emerged. Clusters of simultaneous charging, particularly during peak evening hours, can lead to load imbalances, strain local transformers, and reduce energy efficiency. Studies have demonstrated that uncoordinated charging patterns result in load peaks that challenge distribution network capacity and necessitate costly infrastructure upgrades. For instance, Souza et al. (2025) proposed a valley-filling heuristic to flatten EV charging loads, thereby improving energy efficiency and preventing instability in local grids [3]. Such findings highlight the need for demand forecasting tools that account for user preferences and technical grid constraints, particularly within the evolving context of smart cities and intelligent energy systems.
England’s regions are witnessing a notable surge in EV adoption, leading to an increasing demand for reliable and accessible charging points. However, existing charging networks in these areas face significant challenges, including insufficient coverage, disparate geographic distribution, and issues related to charging station reliability. Many EV users express accessibility concerns, long waiting times, and the poor functionality of charging stations, highlighting the urgent need for strategic planning as well as expansion of the infrastructure [4,5]. A well-designed network is essential to alleviate range anxiety, a common concern among EV owners and a barrier to adoption, and to facilitate seamless travel across urban and suburban areas [6].
Smart cities are integrating advanced technologies such as artificial intelligence (AI), machine learning (ML), and the Internet of Things (IoT) to optimise urban mobility solutions. These technologies provide an opportunity to enhance the efficiency of EV charging demand by leveraging predictive analytics based on real-time data monitoring [7,8]. Moreover, integrating EV charging with smart grids can enable bidirectional energy transfer through Vehicle-to-Grid (V2G) and Grid-to-Vehicle (G2V) systems, improving overall energy efficiency and grid stability [9].
Central Research Question
To address current limitations in predictive modelling of EV charging demand, this study poses the following research question:
Can a hybrid deep learning (DL) model, combining Convolutional Neural Networks (CNN) and Extreme Gradient Boosting (XGBoost), achieve higher accuracy in predicting spatial and behavioural patterns of EV charging demand, compared to conventional ML or stand-alone DL models?
Research Hypotheses
- : There is no significant improvement in prediction accuracy using the hybrid HCB-Net model compared to conventional models.
- : The HCB-Net model delivers significantly greater predictive accuracy and improved spatial forecasting of EV charging demand in smart cities.
1.1. Aims
The primary aim of this study is to develop and evaluate a hybrid deep learning model (HCB-Net) that significantly outperforms traditional ML and stand-alone DL techniques in forecasting EV charging demand. This work seeks to advance the field by explicitly integrating user-level behavioural and spatial characteristics into demand forecasting models.
Specific objectives include:
- To benchmark HCB-Net against established models such as Random Forest (RF), XGBoost, SVM, LSTM, and CNN;
- To identify key behavioural and geospatial predictors of EV charging demand through feature engineering;
- To assess regional variations in charging demand using user data from the North East and West Midlands of England;
- To demonstrate that accurate and interpretable demand forecasts can be achieved using survey-derived behavioural data, even where high-resolution sensor data are unavailable;
- To provide actionable recommendations for the strategic planning of EV charging infrastructure in smart cities.
The results of the study confirm that the stated objectives were achieved, with the proposed hybrid model delivering improved predictive accuracy and offering a practical, scalable forecasting tool to support EV infrastructure planning.
1.2. Organisation of This Paper
The remainder of this paper is structured as follows. Section 2 comprehensively reviews existing EV charging demand forecasting models, discussing their methodologies, strengths, and limitations and outlines the proposed HCB-Net framework, detailing the integration of CNN and XGBoost for improved forecasting performance. Section 3 describes the experimental, dataset, collection, preprocessing, and evaluation metrics used to assess the model’s performance. Section 4 presents the results and discussions, including a comparative analysis with traditional forecasting methods. Section 5 explores the practical implications, computational efficiency, and potential applications of the proposed model in smart grid infrastructure planning and summarises the key findings, highlights limitations, and suggests future research directions.
2. Literature Review
2.1. Existing Challenges in EV Charging Demand
Transitioning to EVs is essential to reduce carbon emissions and achieve sustainable urban mobility. However, the rapid growth in EV adoption presents significant challenges in developing an adequate charging infrastructure. Several studies have highlighted the primary concerns faced by EV users, including insufficient charging points, unreliable charging networks, and geographical disparities in infrastructure placement [10]. Research indicates that many urban areas lack sufficient public charging stations, leading to long waiting times and range anxiety among EV owners [11]. Furthermore, rural and suburban regions are particularly underserved, limiting the feasibility of longer-distance EV travel [12].
Reliability is another critical issue, with studies reporting frequent malfunctions and connectivity issues in public charging stations [13]. Many EV users encounter technical faults such as broken chargers, slow charging speeds, and poor user interface designs, which reduce overall satisfaction and adoption rates [14]. Additionally, peak-hour congestion at charging stations due to insufficient fast-charging units remains a key concern, emphasising the need for improved planning and investment [15].
In the context of EV–grid interaction, two primary categories of charging control strategies have emerged in the literature: direct control and indirect control. Direct control involves real-time management of EV charging loads by a central authority (e.g., a utility provider or aggregator), using automated scheduling or power-limiting hardware to manage grid balance. Zahedmanesh et al. [16] developed such a system using an in-house control unit to directly modulate the charging behaviour of plug-in EVs based on system constraints. While this method allows for precise control, it often requires significant infrastructure and user compliance.
Conversely, indirect control uses economic incentives, pricing schemes, or tariff structures to influence charging decisions without imposing direct technical constraints. Bordin and Tomasgard [17] examine how behavioural economics and micro-incentive models can shape charging habits to support grid stability, particularly in urban environments. Indirect strategies rely on the assumption that user preferences and routines can be predicted and nudged through well-designed policies or infrastructure placement.
Although several studies have documented the operational limitations of EV infrastructure, including accessibility concerns, hardware faults, and urban–rural disparity [11,12,13,14], many focus on technical availability or national-scale summaries. There remains a lack of regionally disaggregated insights into how these challenges manifest across localised smart city contexts like the North East and West Midlands of England.
The present study contributes to the indirect control framework by forecasting individual EV user charging demand based on behavioural, spatial, and demographic data. Rather than enforcing charging patterns, this model anticipates demand trends that can inform incentive design, charger deployment, and urban energy planning in smart cities.
2.2. User Charging Behaviour and Preferences
Several studies have examined EV users’ charging behaviours and preferences to determine optimal infrastructure development strategies. Research suggests that many EV users prefer fast-charging stations over standard charging options due to their convenience and reduced charging times [18]. However, fast-charging stations are often limited in availability and may impose higher costs, discouraging frequent use [19].
Studies also indicate that most EV users prefer charging their vehicles at home or workplaces rather than at public charging stations [20]. This trend suggests better integration of residential and workplace charging facilities into future infrastructure plans. Additionally, some users prefer charging from lower battery charge levels and waiting until their battery reaches a critical level before seeking a charging station [21]. This behavioural trend increases demand for charging station data to be available in real time and predictive analytics to optimise the user experience and meet user needs.
Route planning and charging station accessibility are also key considerations for EV users. Many prefer charging stations along major commuting routes and urban centres, highlighting the importance of strategic placement [22]. Integrating EV charging locations with retail centres, office complexes, and leisure facilities has been proposed as an effective way to improve accessibility and encourage widespread adoption [23].
Prior work by Smith et al. (2020) and Rogers (2021) highlighted that older populations are generally slower to adopt EV technology due to both digital barriers and lower tech adoption rates [24,25]. However, these behavioural insights have rarely been integrated into predictive infrastructure planning models. Our study addresses this gap by embedding these demographic variables directly into ML pipelines to quantify their influence on charging demand patterns.
2.3. Role of AI and Deep Learning in EV Charging Demand Forecasting
AI and DL techniques are increasingly used to optimise EV charging demand planning. Recent studies explore the potential of LSTM networks for predicting temporal charging demand trends based on historical usage patterns [26]. LSTMs are well-suited for handling time-series data and can effectively capture fluctuations in charging demand across different times of the day, week, and year [27,28].
A range of ML and DL models have been applied in previous EV demand forecasting studies. Table 1 presents a structured comparison of these models, highlighting their methodological foundations, strengths, and limitations. RF and Support Vector Machines (SVMs) are widely used for structured data problems, providing strong generalisation on small datasets [25]. However, they lack the capability to capture sequential dependencies over time, limiting their applicability for time-sensitive forecasting. Linear Regression (LR) is often employed for baseline comparisons due to its simplicity and interpretability, though it underperforms in the presence of non-linear patterns typical in EV usage data [25]. XGBoost has become prominent in energy-related forecasting tasks due to its scalability, regularisation mechanisms, and superior handling of overfitting in structured datasets [29]. Despite these advantages, it does not natively support temporal modelling.

Table 1.
Comparison of forecasting models for EV charging demand.
DL techniques such as Long Short-Term Memory (LSTM) and Gated Recurrent Units (GRUs) have been widely explored for load and EV charging prediction [26,27]. Their strength lies in modelling long-term temporal dependencies. However, they often require large datasets and may suffer from vanishing gradients or overfitting in small-sample contexts. Although originally developed for image processing, CNNs have been adapted to capture spatial patterns in urban infrastructure and EV charger distribution, demonstrating value in location-sensitive forecasting [30]. Yet, on their own, CNNs lack memory of past states and therefore underperform on purely temporal tasks.
Several hybrid models have been proposed to overcome the limitations of individual model types. These include combinations of LSTM with RF [25], SVM [25], or XGBoost [28]. However, such approaches often require complex integration pipelines and lack spatial interpretability. Our proposed HCB-Net model seeks to address these gaps by combining CNN’s spatial pattern extraction with XGBoost’s regression precision in a unified pipeline, enabling both location awareness and robust forecasting performance.
Table 1 summarises different EV charging forecasting methods and their key attributes, advantages, and limitations. Advanced techniques and XGBoost improve prediction accuracy by reducing overfitting but require careful hyperparameter tuning. DL approaches such as LSTM and GRU excel in handling sequential data, making them suitable for demand forecasting, though they are computationally expensive. CNNs are particularly useful for spatial data analysis but are limited in handling temporal dependencies.
Hybrid models, including LSTM + RF, LSTM + XGBoost, and LSTM + SVM, aim to combine the strengths of DL and ML for enhanced accuracy, albeit at the cost of increased computational complexity. The proposed HCB-Net model has been demonstrated to have superior accuracy, leveraging CNN for spatial feature extraction and XGBoost for regression tasks, making it a promising approach for optimising EV charging demand forecasting (see Table 1).
In addition to temporal forecasting, CNNs have been widely used to analyse spatial patterns in EV infrastructure placement. CNN-based models help identify high-demand regions that require additional charging facilities by processing geospatial data, traffic flow information, and urban development trends [31,32]. This enables urban planners to make informed decisions regarding the optimal distribution of charging stations.
Hybrid DL models that integrate both LSTMs and CNNs have demonstrated superior predictive accuracy in forecasting EV charging needs [30]. These models combine spatial and temporal insights, allowing for a comprehensive understanding of infrastructure requirements. Furthermore, studies incorporating attention mechanisms in DL frameworks have shown promising results in prioritising influential factors such as user demographics, charging habits, and regional energy grid capacities [33].
Recent work continues to expand the understanding of EV charging strategies across both control paradigms. For instance, Lv et al. [34] developed an augmented user equilibrium model to optimise pricing and energy sharing at EV charging stations, effectively accounting for user flexibility and system-level efficiency. Similarly, Altamimi et al. [35] proposed a multi-agent reinforcement learning framework that dynamically adjusts charging strategies using renewable energy sources and storage, aligning with indirect control approaches based on decentralised decision making.
Cavus et al. [36] contributed to the intersection of demand forecasting and optimisation by developing a socio-demographic-aware hybrid DL model for predicting EV charging patterns. This approach bridges predictive modelling with behavioural insight. Complementarily, Cavus et al. [37] introduced a deep-fuzzy logic control architecture for adaptive energy management in grid-connected microgrids, highlighting the integration of learning-based forecasting into real-time operational decisions.
These studies illustrate a broader trend towards hybrid predictive–prescriptive systems. Our present work contributes to this landscape by offering a behaviourally grounded demand forecasting framework that supports data-informed policy, charger deployment, and dynamic energy management strategies in smart cities [38,39].
2.4. Policy and Planning Implications
Previous research has highlighted the importance of government policies and regulatory frameworks in shaping EV charging demand expansion. Successful case studies from countries such as Norway and the Netherlands demonstrate how subsidies, tax incentives, and public-private partnerships can accelerate infrastructure development and encourage EV adoption [40]. In the UK, a range of funding schemes and initiatives, such as the On-Street Residential Chargepoint Scheme (ORCS) and Rapid Charging Fund (RCF), aim to support the expansion of charging networks [1]. However, concerns remain regarding these initiatives’ long-term scalability and financial sustainability, necessitating continuous evaluation and adaptation of policy measures to align with changing needs [41].
The increasing integration of V2G technology is also gaining attention in the literature because it allows EVs to supply power back to the grid during peak demand periods. This bidirectional energy exchange can enhance grid stability, reduce electricity costs, and contribute to the broader smart city energy ecosystem [29]. However, challenges related to grid compatibility, battery degradation, and regulatory constraints must be addressed to realise the potential of V2G systems fully [42].
While national-level strategies (e.g., ORCS, RCF) aim to expand charging access [1,40], few studies provide actionable forecasting tools aligned with local urban planning needs. Existing literature offers general recommendations [41,43] but lacks granular, user-behaviour-driven predictive frameworks that can assist policymakers in real-time infrastructure placement and demand shaping. This research responds to that need by offering a hybrid AI-driven forecasting tool grounded in user data and regional planning relevance.
Recent work has also highlighted the importance of linking demand forecasting with the commercial viability of charging infrastructure, and of understanding the interplay between public perception and investment decisions. Openshaw et al. (2023), for example, investigated how public attitudes towards dynamic wireless charging technologies may affect their market potential and economic viability [44]. Incorporating such considerations into demand models is critical to ensuring that infrastructure deployment strategies are both financially sustainable and aligned with user expectations. At present, there remains a gap in integrated modelling approaches that connect behavioural demand forecasts with infrastructure economics. This study contributes towards addressing this gap by providing user-informed demand insights that could support more economically robust planning. Future work will seek to integrate explicit economic modelling to strengthen this connection further.
2.5. Research Questions
A critical review of the literature identified research gaps. Five key questions to guide this research were defined as follows:
- How can hybrid DL models enhance EV charging demand forecasting accuracy compared to traditional ML approaches?
- What are the key limitations of existing forecasting models, and how can they be addressed using a combination of CNN and XGBoost?
- How does the proposed HCB-Net, the combined CNN and XGBoost model, perform in real-world EV charging scenarios regarding prediction accuracy and computational efficiency?
- What role do spatial and temporal dependencies play in EV charging demand forecasting, and how can they be effectively captured in predictive models?
- How can the findings of this study contribute to optimising EV infrastructure planning in smart cities?The answers to these research questions will provide valuable insights into integrating advanced ML techniques in smart grid applications, facilitating efficient EV charging management and infrastructure development.
2.6. Novelty and Key Contributions
This study addresses key limitations in existing EV charging demand forecasting models, particularly the limited incorporation of behavioural factors, lack of regional focus, and architectural complexity. The research makes several original contributions to the field. First, it presents a hybrid DL model (HCB-Net) that combines CNN-based spatial feature extraction with XGBoost regression, specifically designed to model the spatial and behavioural patterns influencing EV charging demand in smart cities. Second, the model explicitly integrates demographic and behavioural predictors, such as user age, charging preferences, commute distance, and battery capacity, which are often neglected in conventional grid-based or sensor-driven approaches. Third, the model is trained on regional, survey-derived data from two distinct urban regions in England (the North East and West Midlands), enabling the capture of localised charging behaviours and spatial disparities in existing infrastructure. Notably, the framework demonstrates that robust and interpretable demand forecasting can be achieved using lightweight survey data, without the need for high-resolution telemetry or time-series inputs.
Finally, the HCB-Net pipeline is designed to be modular and reproducible, making it readily adaptable to other urban contexts as new behavioural or spatial data become available. These contributions advance the methodological toolkit for data-driven smart city planning, offering practical support for early-stage EV infrastructure development and localised grid management.
3. Methodology
This section outlines the methodological framework for predicting EV charging demand. The proposed approach integrates DL and ML techniques into a unified HCB-Net. The methodology consists of data preprocessing, feature engineering, and model training using a combination of CNNs and XGBoost.
3.1. Data Collection
Data for this study were collected via a structured questionnaire administered to EV users in the West Midlands and the North East of England. The survey gathered insights into charging habits, vehicle specifications, and user preferences to inform predictive models of EV charging demand. This data collection effort aimed to explore charging behaviours across varying urban environments, focusing on regional factors such as urbanisation levels, grid capacity, and socio-economic diversity.
In addition to structured, quantitative items (e.g., Likert scales, binary and categorical choices), the survey also included open-ended questions, allowing respondents to elaborate on their charging habits, preferences, concerns, and motivations. These responses constitute the qualitative data collected in this study.
A basic thematic content analysis was performed to categorise recurring themes, such as cost sensitivity, range anxiety, and infrastructure visibility, from these textual responses. While this qualitative input was not directly used in model training, it played a crucial role in guiding feature engineering decisions and interpreting model outputs, particularly in identifying behavioural patterns corresponding to regional demand trends. For instance, frequent mention of limited public chargers in the North East supported the inclusion of region-specific charging availability flags. Similarly, comments on charging time preferences helped frame temporal feature bins used in preprocessing.
To gain comprehensive insights, a structured questionnaire was developed to collect detailed information on various aspects of EV ownership, usage, and charging patterns. The survey captures demographic characteristics, personality traits, and behavioural tendencies of EV users, as well as their driving habits, mobility patterns, and charging preferences. Furthermore, it explores participants’ experiences with regional charging infrastructure, including accessibility, reliability, cost, and convenience.
The questionnaire comprises 51 carefully designed questions incorporating multiple formats to ensure a nuanced understanding of user perspectives. These include multiple-choice questions to assess general trends, Likert scale questions to gauge attitudes and satisfaction levels, and open-ended questions to provide space for participants to elaborate on their experiences and opinions. By employing this mixed-question format, the study aims to generate both quantitative and qualitative data, facilitating a holistic analysis of the factors shaping EV charging behaviour in the target regions.
Following ethical approval from the Newcastle University Ethics Committee, the survey was hosted on Prolific, a widely used online research platform known for its high-quality and diverse participant pool. The study specifically targeted EV users in the North East and West Midlands regions to ensure relevant and region-specific insights. To achieve a representative sample, participants were recruited based on the following criteria:
- Must be a current EV owner or primary user;
- Must reside in either the North East or the West Midlands.
The survey’s data collection took place from May 2024 to June 2024 for the North East and from October 2024 to November 2024 for the West Midlands.
A total of 256 EV users participated, with 132 respondents from the West Midlands and 124 from the North East of England. The survey was conducted through online platforms and direct outreach, ensuring a diverse and representative sample of EV users in both urban and suburban settings. Table 2 presents the population distribution of the North East region based on the 2021 Census data [45]. The table categorises the population into broad age groups, allowing for a clearer analysis of demographic trends.
Table 2.
Population distribution by age group in the North East region (Census 2021) [45].
The Under 18 category comprises the largest portion of the population, totalling 379,250 individuals. This is followed by the 45–54 and 25–34 age groups, with populations of 254,985 and 242,915, respectively. The 35-44 category is also significant, with 234,545 individuals.
Notably, the population of those aged 55 and above steadily increases, with 229,342 individuals in the 55–64 group and 315,678 in the 65 and over category. This reflects an ageing population trend, which may affect regional healthcare, mobility, and transport infrastructure policies. The lower representation of older individuals in this study’s sample aligns with existing literature, which suggests that older populations are less likely to engage with online surveys and adopt EVs. Understanding these demographic differences is essential for policymakers and researchers when planning future infrastructure developments and survey methodologies.
To ensure the validity of the study sample, a Chi-square contingency test was conducted to compare the sample demographics with the population data of the Northeast and West Midlands regions. The test results indicated that, in terms of gender, the sample was representative of the regional population. However, age distribution analysis revealed that participation numbers for individuals over 55 were lower than expected based on the population data of both regions. This discrepancy may be attributed to lower engagement among older individuals in online surveys, as found in studies examining digital survey participation rates across different age groups. Recent studies confirm this age-related trend: Bosehans et al. [46] explored digital and behavioural barriers among older EV users; Rogers [24] explained these patterns using the diffusion of innovation theory; and Smith et al. [25] empirically demonstrated lower EV adoption rates among individuals aged 55 and over.
Figure 1 compares the North East and West Midlands regions in terms of demographics, education, occupation, income, and ethnicity. The main findings draw attention to both disparate geographical spread and similar trends. Each area has marginally more men than women, indicating a fairly balanced gender ratio, with females: 49–51% and males: 49–51% for the West Midlands and North East, respectively. Most people are between the ages of 25 and 34 years (41%) and 35 and 44 years (23%), indicating a sizeable working-age population. This implies that a sizeable fraction of the population in both areas is probably economically active. Only about 13% of the population is in the youngest age group (18–24 years), suggesting that there are fewer young adults, perhaps because they cycle and walk more actively due to migration for work or study. Additionally, the population is primarily concentrated in the middle age range, as evidenced by the lowest representation of older persons aged 55–64 years (6%) and 65+ years (1–2%).
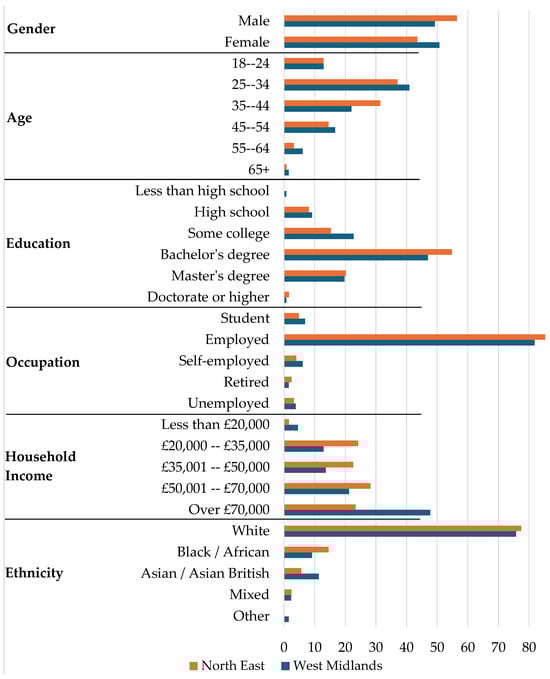
Figure 1.
Demographicdistribution of two regions.
Although there are some minor differences in educational attainment between the two areas, bachelor’s degrees account for 47% of all qualifications. This suggests that around 50% of people in both regions have earned a university degree. Following this, a considerable percentage of respondents continue their education after their first degree, as evidenced by the prevalence of Master’s degrees (20%) and after sixth form some college education (23%). However, less than 1% of people have a doctorate or a lower education than a high school diploma, and only 9% of people have a high school diploma as their highest degree.
In both areas, employment is the most common occupational status, with more than 81% of EV owners being employed. This demonstrates an economic activity in both regions. Since just 6% of people work for themselves, it is likely that most people choose to or can find traditional employment. The small percentage of students (7%) is consistent with the 18–24 age group’s historically lower representation. Relatively low unemployment rates (4%) and retirement (2%) support the notion that most people in both areas are actively working.
The income distribution reveals a significant middle-income section, with the highest percentage of respondents (55%), earning between GBP 20,000 and GBP 70,000. About 16% of people are in the highest income group (above GBP 100,000), with a slightly higher proportion in the West Midlands than in the North East. Similarly, 20% of the population falls into the GBP 70,000–85,000 range, indicating a concentration of people in the upper-middle income range. Conversely, just 4.5% of people are in the lowest income bracket (less than GBP 20,000), indicating that poverty rates are generally low in both areas.
In both areas, the majority of the population (76%) is White, according to the ethnic distribution. Nonetheless, there are statistically significant differences at a 95% confidence level. Compared to the North East, the West Midlands has a somewhat higher percentage of Black and African people (9%) and a larger Asian and Asian British minority (11%). While there is diversity, most of the population are White, as seen by the small minority of Mixed (1.5%) and Other (1.5%) ethnic groupings.
This graphic shows how the North East and West Midlands are mostly similar in terms of education, employment, and income distribution. The population of EV users in these areas is primarily middle-class, highly educated, and employed. Nonetheless, the North East respondents have a marginally higher percentage of employed people and degree holders. At the same time, the West Midlands exhibit marginally higher income earners and a more varied ethnic makeup. The results imply that although social and economic structures are comparable, geographical variations in high-income earners and ethnic variety remain unique.
The data obtained from the regional EV user surveys formed the foundational input for all subsequent modelling tasks. To ensure this dataset could be effectively used for predictive modelling, preprocessing and feature engineering were undertaken to convert raw responses into a machine-readable format.
3.2. Demographic Composition and Generalisability Considerations
The dataset used in this study consists of responses from 256 EV users across two UK regions: the North East and West Midlands. The sample includes participants from diverse demographic backgrounds, with age groups ranging from 18 to 65+, a near-balanced gender distribution (53% male, 47% female), and varied income brackets and educational levels. However, most respondents were early adopters of EV technology, often with higher-than-average environmental awareness and technological literacy. This composition, while reflecting the current EV ownership demographic in the UK, may limit generalisability to broader populations, particularly as EV adoption expands into more diverse socio-economic and geographic groups. Additionally, urban and peri-urban residents are overrepresented in the sample, which could bias demand forecasting outcomes if applied to predominantly rural or underserved areas. Future studies should seek to expand data collection to include more diverse user profiles and geographic contexts to improve model robustness and national scalability.
3.3. Data Preprocessing
Before feeding the dataset into predictive models, cleaning and preparing the data through standardisation and encoding processes was essential. These preprocessing steps served to normalise continuous variables and structure categorical responses, enabling consistent input for ML algorithms. The raw dataset underwent preprocessing to standardise feature values and remove inconsistencies. Let represent the feature space and the corresponding charging demand labels. The min–max scaling technique is applied as follows:
where represents the normalised dataset and and are the minimum and maximum values of the feature set, respectively. Additionally, categorical variables are encoded using one-hot encoding:
where represents the one-hot encoded matrix. Once a clean and consistent dataset was prepared, it was possible to identify and prioritise the most relevant features for model training through a rigorous feature selection and dimensionality reduction process.
3.4. Target Variable Definition
This study aims to predict the average daily charging demand per user, expressed in kilowatt-hours (kWh). This target variable was derived from three survey responses:
- Charging frequency (“How often do you charge your vehicle?”);
- Charging duration (“On average, how long is each charging session?”);
- Vehicle battery capacity (used as a proxy for energy drawn per charge).
From these, a derived estimate of daily demand was calculated using the following formula:
Responses were filtered to ensure realism (e.g., capped frequencies, verified charging durations), and outliers were removed. The resulting target variable is a numerical, continuous value representing the estimated average daily charging demand rather than a specific timestamp.
Therefore, this study does not perform time-series forecasting. Instead, it uses behavioural and spatial variables to estimate the expected daily charging load per user, with applications in infrastructure planning, grid load balancing, and spatial demand mapping.
3.5. Feature Engineering
The feature engineering phase focused on identifying the most predictive variables within the dataset to optimise model performance. The feature set was refined for subsequent modelling using XGBoost-based feature importance scoring and Principal Component Analysis (PCA) techniques.
Following preprocessing, the next step was to extract and select the most informative features for training the predictive models. The original dataset included both categorical and continuous variables drawn from 51 questionnaire items, covering:
- User demographics: age group, gender, income bracket, education level;
- Vehicle specifications: EV type, all-electric range, battery capacity;
- Charging behaviour: charging frequency, preferred time of day, charging duration;
- Geospatial indicators: region, residential postcode category, commute distance, urban/suburban classification;
- Behavioural preferences: willingness to travel for charging, home vs. public charging inclination.
These raw variables were initially examined through descriptive analytics and correlation matrices to identify redundancies. Subsequently, the following steps were employed in the feature engineering process:
- Encoding Categorical Variables: Categorical variables such as region, EV type, and education level were one-hot encoded to preserve their nominal character without imposing ordinal relationships.
- Scaling Continuous Variables: Numerical inputs such as commute distance, charging frequency, and battery capacity were normalised using min–max scaling to ensure compatibility with neural network layers.
- Feature Selection Using XGBoost Importance Ranking: An XGBoost model was trained on the full dataset to compute a feature importance score based on information gain (splitting gain), coverage (frequency of use), and weight (impact on model accuracy). Features with negligible contribution to prediction (less than 1% importance score) were excluded from further modelling.
- Dimensionality Reduction with PCA: Principal Component Analysis (PCA) was applied to the encoded feature space to address potential multicollinearity and reduce noise. Components explaining at least 90% of variance were retained. However, PCA-transformed data was used selectively, primarily for exploratory visualisation and not for feeding into the CNN, where spatial interpretability was needed.
- Final Feature Set: The refined input for HCB-Net included 24 features: 12 numerical, 8 categorical (expanded to 20 columns post-encoding), and 4 geospatial flags. These were reshaped and structured into a matrix input suitable for convolutional processing.
The proposed HCB-Net is designed to combine the strengths of deep learning and gradient-boosted decision trees for improved forecasting of EV charging demand. The architecture comprises two key components: a CNN for spatial feature extraction and an XGBoost regressor for final prediction. The CNN component is responsible for learning high-level spatial and behavioural representations from the input feature matrix, which includes user demographics, commute patterns, and regional indicators. After convolution and pooling operations, the extracted feature maps are flattened into a one-dimensional vector. This vector serves as the input to the XGBoost model, which performs structured learning and non-linear regression.
The rationale for combining CNN and XGBoost lies in their complementary strengths: CNNs are adept at uncovering spatial relationships and patterns within structured data. At the same time, XGBoost excels at capturing interactions and non-linear dependencies in tabular features. This modular design allows HCB-Net to separate feature representation from regression logic, enabling better generalisation and interoperability.
Although this implementation does not explicitly incorporate a formal attention mechanism, the hybrid design allows for the selective weighting of spatial features via convolution filters and importance-weighted splits in the XGBoost component. Future iterations of the model may explore explicit attention layers to further enhance feature discrimination and interpretability, particularly in multi-regional or temporal behavioural data scenarios.
Feature selection is performed to improve model efficiency and eliminate redundant information. Given a feature set F, the selected features are determined using an importance ranking mechanism based on XGBoost’s feature importance score:
where represents the feature importance score, is the gain from feature splits, and represents the Hessian matrix, indicating second-order gradient approximations. Principal Component Analysis (PCA) is also employed to reduce dimensionality:
where Z is the transformed feature set, W is the eigenvector matrix, and X is the original feature matrix. The selected features were then used as inputs to train the proposed hybrid DL model, which will be described in detail in the next section.
3.6. Hybrid Deep Learning Framework
The HCB-Net model is designed to integrate the strengths of DL and traditional ML methods for enhanced EV charging demand forecasting. Specifically, CNNs extract spatial and behavioural patterns from structured input data (e.g., user location, demographics, and commute characteristics), while XGBoost handles the final regression task.
Algorithm 1 outlines the operational flow of the proposed HCB-Net model. The pipeline begins with ingesting and reshaping preprocessed data, including spatial, demographic, and behavioural inputs relevant to EV users. These inputs are structured as two-dimensional tensors and passed through convolutional layers to extract spatial and contextual patterns. Pooling operations are then applied to reduce the dimensionality while retaining essential features. The resulting feature map is flattened into a vector representation suitable for structured learning.
| Algorithm 1 HCB-Net: Hybrid CNN + XGBoost for EV charging demand forecasting. |
|
If the extracted feature vector is non-empty, it is forwarded to the XGBoost regressor, which performs non-LR to produce the final prediction of daily EV charging demand . In cases where feature extraction fails, a condition is raised to ensure model robustness. Finally, the model is evaluated using a suite of performance metrics—MAE, MSE, RMSE, and —to assess both absolute error and goodness-of-fit. This hybrid design allows HCB-Net to capture high-level feature interactions via CNN while benefitting from XGBoost’s capability to model structured, tabular relationships in the final prediction layer.
The choice of algorithms in this study was driven by their known strengths in predictive modelling and their relevance to the nature of the data. CNNs were selected for their ability to capture spatial relationships between behavioural and geographic features. XGBoost was chosen for its strong performance with structured tabular data and robustness against overfitting. LSTM and GRU were tested due to their popularity in sequential modelling, though they underperformed due to the non-temporal nature of the input. Traditional models such as RF, SVM, and LR served as comparative baselines to benchmark the added value of the hybrid approach. LR, in particular, was used as a null model to provide a low-complexity performance reference, as shown in Table 3.
Table 3.
Key hyperparameters for all models used in this study.
This hybrid structure allows the model to leverage CNN’s capability to capture local feature correlations and high-dimensional interactions, essential for interpreting spatial demand trends and usage clustering. Once CNN layers transform and condense the input feature space into informative embeddings, these features are passed into the XGBoost model for prediction. XGBoost’s strength in handling structured data, robustness against overfitting, and interpretability make it a suitable complement to CNNs, mainly when the objective is accurate and explainable demand forecasting.
Building on the engineered feature set, the HCB-Net model was designed to integrate spatial insights through CNN and non-LR capabilities via XGBoost. This section outlines the architecture and functioning of the hybrid model for forecasting EV charging demand. The proposed HCB-Net framework integrates CNNs for spatial feature extraction and XGBoost for final regression predictions. The CNN component applies convolutional operations defined as:
where is the output of the convolution operation at position , is the kernel filter, and represents the input feature matrix. The CNN layer is followed by a pooling operation to reduce dimensionality:
where is the pooled feature map and R defines the pooling region. The output of the CNN pooling layer forms a feature map that encapsulates dominant spatial and behavioural attributes derived from the dataset. These compressed features are then flattened and fed directly into the XGBoost regressor. By separating spatial pattern extraction (CNN) from the decision-making layer (XGBoost), the model benefits from CNN’s generalisation capability in identifying charging hotspots or user routines, while XGBoost interprets these embeddings in the context of the target variable—forecasted charging demand.
The extracted spatial features are then passed into an XGBoost regression model, trained to minimise the objective function:
where is the loss function measuring prediction error and is the regularisation term controlling model complexity. The final prediction is generated as:
where T represents the number of boosting rounds.
While the integration of CNNs and XGBoost has previously been applied in fields such as energy consumption forecasting and traffic flow prediction, this study extends the hybrid approach into the relatively under-explored EV charging demand forecasting domain within the smart city context. The novelty lies not in the reuse of the algorithms themselves, but in:
- The fusion of spatial behaviour data, user demographics, and EV usage patterns within a CNN–XGBoost framework tailored to EV infrastructure planning.
- The modular HCB-Net architecture decouples spatial feature extraction from regression logic, enabling interpretability and flexibility across varied geographic regions.
- Using a region-specific, survey-driven dataset, capturing nuanced behavioural trends from the West Midlands and North East England—two demographically and infrastructurally diverse regions.
- A focus on short-distance travel radius and public-private charging behaviours, which are rarely integrated in previous models.
The contribution is methodological in its context-specific adaptation and empirical validation across regional EV populations, filling a significant gap in urban electrification forecasting literature.
3.7. Model Evaluation Metrics
To evaluate the predictive capabilities of the proposed HCB-Net and benchmark models, four key metrics were employed:
- Mean Absolute Error (MAE): Measures the average magnitude of prediction errors without considering their direction. It offers a straightforward indication of overall prediction accuracy in real-world units.
- Mean Squared Error (MSE): Squares the difference between actual and predicted values, penalising larger errors more heavily. Useful for emphasising instances of poor prediction.
- Root Mean Squared Error (RMSE): The square root of MSE, providing error in the same unit as the output variable. RMSE is particularly suitable for continuous target variables such as charging demand.
- Coefficient of Determination (R2 Score): Represents the proportion of variance in the dependent variable that is predictable from the independent variables. Values closer to 1 indicate a better model fit.
These metrics were chosen for their complementary insights into model performance: MAE and RMSE assess absolute accuracy, while R2 indicates how well the model explains variation in the data.
Since this study involves regression-based forecasting rather than classification, metrics such as accuracy or F1-score were not applicable. Evaluation was conducted using a hold-out test set comprising 30% of the full dataset, with model hyperparameters tuned using five-fold cross-validation on the training set.
This multi-metric approach allows for a robust assessment of each model’s practical reliability, generalisability, and consistency when forecasting EV charging demand across diverse regional and user contexts.
To assess the effectiveness of HCB-Net, standard evaluation metrics are employed, including MAE, MSE, RMSE, and . These are computed as follows:
where represents the actual charging demand, is the predicted value, and is the mean of observed values.
The methodology integrates CNNs and gradient-boosting techniques to enhance EV charging demand prediction accuracy. Equations (1)–(13) detail the preprocessing, feature extraction, predictive modelling, and evaluation phases, ensuring a comprehensive approach to intelligent infrastructure forecasting. The combination of CNN and XGBoost allows HCB-Net to extract spatial dependencies while leveraging boosting techniques for robust forecasting, making it a suitable solution for predictive analytics in EV infrastructure planning.
3.8. Variable Definitions
Group 1: Equations (3) and (4)—Feature Importance and PCA. denotes the feature importance score for feature f, N represents the total number of boosting rounds (trees) or nodes considered, is the gain (information gain) from splitting on feature f at node i, is the Hessian (second-order derivative) at node i, W is the matrix of eigenvectors obtained from the Principal Component Analysis (PCA), Z denotes the transformed feature set in PCA space, and X is the original feature matrix before dimensionality reduction.
Group 2: Equations (5) and (6)—CNN Layer and Pooling. refers to the output of the convolution operation at spatial position , represents the input matrix value at offset , is the convolutional kernel (filter) value at position , k is the kernel size (for example, corresponds to a filter window), the variables m and n are index variables used to iterate over the filter size, is the output of the pooling operation at position , and R denotes the region defined for pooling (e.g., or window).
Group 3: Equations (7) and (8)—XGBoost Objective. represents the overall loss function to be minimised, is the prediction loss for sample i, typically using squared error, T is the number of trees in the boosted ensemble, denotes the regularisation term applied to control the complexity of the function , refers to the output of the t-th decision tree for the input sample , and is the final predicted value for that sample.
Group 4: Equations (9) and (12)—Evaluation Metrics. n indicates the total number of samples in the test set, is the true (ground truth) value for sample i, is the predicted value, and represents the mean of the actual values across all test samples.
3.9. Train–Test Splitting and Overfitting Control
To evaluate the performance of the proposed HCB-Net and baseline models, the dataset was divided into training and test sets using a standard 70:30 split. The training set was used to fit model parameters, while the test set evaluated generalisation performance on unseen data.
The data was randomly shuffled before splitting to ensure fair comparison across all models and avoid sample bias. Since the dataset includes both categorical and continuous variables, stratified sampling was applied based on region (North East and West Midlands) to preserve demographic distribution across both sets.
Several strategies were employed to mitigate overfitting during model training, particularly for DL models. First, five-fold cross-validation was applied on the training set for model tuning in the case of RF, XGBoost, LR, and SVM. Second, early stopping based on validation loss was used for LSTM, GRU, CNN, and the HCB-Net hybrid model to prevent over-training. Additionally, dropout layers and regularisation penalties were incorporated in the CNN architecture to enhance generalisation performance. For XGBoost, key hyperparameters such as maximum tree depth, learning rate, and subsample ratios were optimised using a grid search approach.
Model performance metrics (MAE, RMSE, MSE, and ) were computed using only the test set, ensuring no information from this subset influenced the training process. Using a held-out test set guarantees a robust and unbiased evaluation of the models’ real-world predictive capability.
4. Results and Discussion
The data generated by the questionnaire was used to test each of the models presented in Table 1. The first step in any analysis is determining the statistical significance of the representativeness to regional populations. The performance of the range of ML and DL models for predicting EV charging demand is summarised in Table 4. The table compares models based on four key evaluation metrics: MAE, MSE, RMSE, and score. Lower values of MAE, MSE, and RMSE indicate higher prediction accuracy, while a higher score suggests a better fit to the observed data.
Table 4.
Performance metrics for various models.
While the HCB-Net model achieved the highest performance among all tested methods, its R2 score of 0.3996 indicates a moderate level of predictive accuracy. This value suggests that the model explains approximately 40% of the variance in user-level EV charging demand based on the available features.
In large-scale deployment scenarios or grid-integrated forecasting systems, R2 values exceeding 0.5, 0.7, or even 0.8 are typically expected to ensure operational robustness. However, the relatively lower R2 in this study is influenced by several factors:
- The use of self-reported, survey-based data rather than real-time charging logs or smart meter outputs;
- A limited sample size across just two geographic regions, restricting generalisability;
- The absence of temporal granularity, since the predictions are behavioural-aggregate (e.g., daily demand estimates), not time-series.
Despite these constraints, the proposed framework demonstrates that meaningful and interpretable demand forecasts can still be extracted from behavioural data, making it valuable for early-stage infrastructure planning, policy simulation, or microgrid load estimation in localised smart city contexts.
Future work will incorporate higher-resolution temporal data, smart meter logs, and vehicle telemetry to enhance predictive power and achieve industry-grade accuracy thresholds.
4.1. Survey Sample Representativeness
Before evaluating model performance, the representativeness of the survey sample was assessed to ensure the validity of subsequent analyses. A Chi-square contingency test was applied to compare the sample demographics (age and gender) with regional census data from the North East and West Midlands of England. The test confirmed that the sample was statistically representative in terms of gender across both regions (p > 0.05) but under-represented older age groups, particularly those aged 55 and above. This aligns with findings from prior studies [11,12] that suggested lower digital engagement and slower EV adoption among older populations. Despite this age-related skew, the dataset captures a broad and relevant spectrum of EV user behaviours in urban and suburban contexts.
4.2. Model Performance Comparison
Table 4 summarises the performance of various ML and DL models using four evaluation metrics: MAE, MSE, RMSE, and R2 score. These metrics allow us to assess both absolute error and the goodness-of-fit between predicted and actual EV charging demand.
The proposed HCB-Net model (CNN + XGBoost) outperformed all other models, achieving the lowest RMSE (0.1490) and the highest R2 score (0.3996). This result confirms the benefit of combining CNN’s spatial feature extraction with XGBoost’s robust regression capability. Among traditional ML models, LR and SVMs also performed reasonably well (R2 = 0.3520 and 0.3094, respectively), with LR surprisingly outperforming CNN and LSTM in terms of R2, despite its simplicity. This may be due to the linear nature of certain input features or the limited time-series complexity in the dataset. Notably, LSTM and GRU underperformed significantly, both showing negative R2 scores (−0.3756 and −0.6276, respectively). This suggests that these models failed to capture the temporal dependencies for which they were designed, potentially due to the relatively modest dataset size and low temporal granularity. These findings highlight the importance of data volume and structure when applying recurrent networks.
While a standalone CNN had a moderate performance (R2 = 0.2498), its predictive capability improved significantly when combined with XGBoost in the HCB-Net architecture. This reinforces the value of hybrid modelling, where DL extracts high-level patterns and gradient boosting handles refined regression.
Figure 2 visually compares actual and predicted charging demand across test samples for each model. The HCB-Net model’s predictions most closely follow the actual demand trend, with minimal deviation. In contrast, models like LSTM and GRU display unstable predictions, with noticeable divergence and volatility across test points. Traditional ML models (RF, XGBoost, LR) show relatively consistent but slightly under-responsive behaviour, smoothing over peaks in demand. While capturing some variation, CNN exhibits irregular patterns, possibly due to its limited ability to model non-spatial relationships on its own. Overall, the figure illustrates that hybrid models offer the most balanced and accurate predictions, capturing both spatial trends and generalised demand levels. In contrast, purely sequential models (LSTM, GRU) appear overfitted or misaligned with the nature of the dataset.
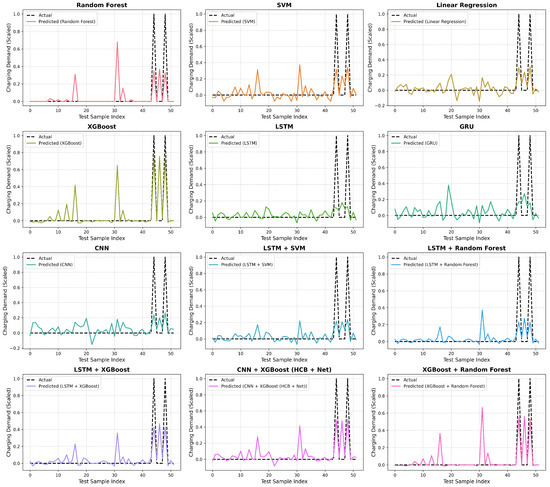
Figure 2.
Model performance comparison for EV charging demand prediction.
The figure shows that different models exhibit varying levels of accuracy and robustness in capturing trends in EV charging demand. Traditional ML models, such as RF and SVM, demonstrate moderate performance but fail to capture temporal dependencies effectively. On the other hand, DL models, including LSTM and GRU, perform better in identifying sequential patterns and capturing long-term dependencies in the charging demand data. The proposed HCB-Net (CNN + XGBoost) model significantly outperforms other approaches by leveraging CNN for spatial pattern recognition and XGBoost for enhanced regression performance. The results indicate that HCB-Net reduces prediction errors and improves overall model accuracy compared to stand-alone ML and DL models. This hybrid approach effectively balances computational efficiency and predictive accuracy, making it a promising candidate for real-world EV charging demand forecasting applications.
Furthermore, the evaluation metrics, such as RMSE and R2, demonstrate that the proposed model performs better than conventional techniques. This improvement highlights the advantage of integrating spatial feature extraction with robust ML regression techniques to enhance forecasting accuracy. Overall, this comparative analysis provides critical insights into the strengths and weaknesses of different forecasting models and validates the effectiveness of the proposed HCB-Net in predicting EV charging demand with high precision.
4.3. Box Plot Analysis of Model Predictions
Figure 3 provides a comparative distribution of model predictions using a box plot. The x-axis represents different models, while the y-axis shows the scaled charging demand. The box plots illustrate the spread, variability, and presence of outliers in each model’s predictions. The central tendency and dispersion of the predicted charging demand vary across models, reflecting the extent of their consistency and robustness.
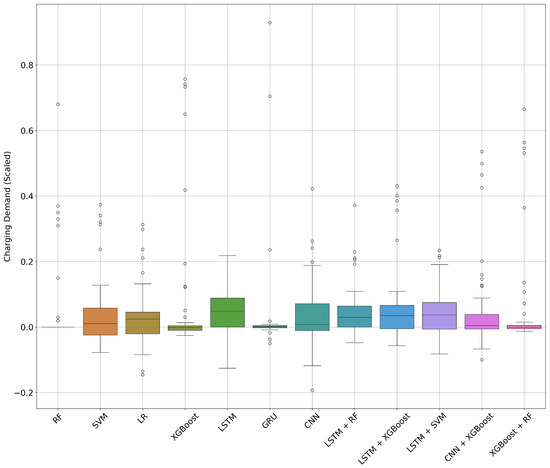
Figure 3.
Distribution of charging demand predictions across models.
DL models, such as LSTM and GRU, exhibit a tighter distribution with fewer extreme values, indicating their ability to generalise effectively. In contrast, traditional models with LR and RF show wider interquartile ranges and more pronounced outliers, suggesting challenges in capturing the complex dependencies in the charging data. The proposed HCB-Net model achieves a balanced distribution, reducing outliers while maintaining a narrow spread, highlighting its effectiveness in making reliable charging demand forecasts.
4.4. User Behavioural Trends Analysis
Figure 4 presents a violin plot analysis comparing EV charging behaviour between the West Midlands and North East regions. The plots illustrate the distribution of responses for different charging-related behaviours, such as EV type, all-electric range, public charging frequency, weekly charging habits, charge duration, and willingness to travel a distance for charging. The density variations in the violin plots reveal distinct user preferences in each region.
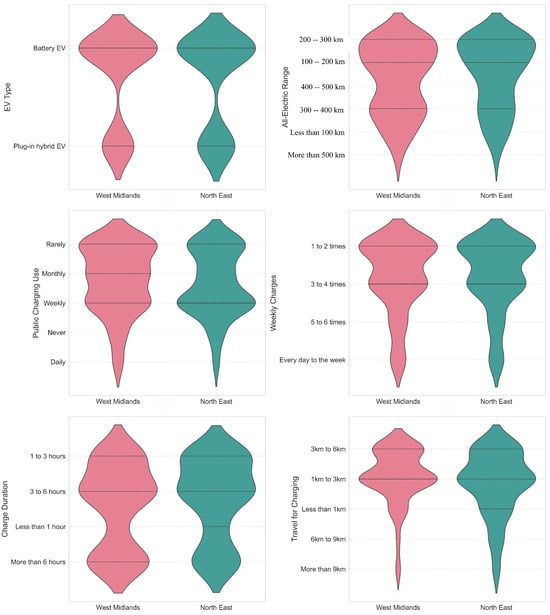
Figure 4.
Comparison of user charging behaviour across regions.
Users in the West Midlands exhibit a more diverse distribution of charging habits, with higher variability in public charging frequency and charge duration. This suggests that the charging infrastructure is more developed or widely adopted. In contrast, the North East region shows a more concentrated distribution, indicating a preference for home charging or fewer public charging opportunities. The findings provide insights into regional charging behaviour, which can inform infrastructure planning and policy decisions for optimising EVs for future adoption.
The integration of qualitative insights enriched the interpretation of the model’s outputs. User narratives about charging inconvenience, cost constraints, and preferences for workplace charging aligned with quantitative predictors of demand, reinforcing the model’s behavioural validity. This mixed-methods approach, although preliminary, points to the value of user-centred forecasting in early-stage smart city planning.
4.5. Charging Demand Forecast
The forecasted demand for EV charging highlights a substantial increase in the need for fast-charging stations, as observed from model predictions in Figure 2. The comparative analysis of ML and DL models indicates that the highest accuracy models, such as HCB-Net (CNN + XGBoost), XGBoost, and RF, demonstrate a rising trend in charging demand across various test samples. This trend suggests that charging facilities must be expanded as EV adoption grows to accommodate increasing usage patterns.
The box plot analysis in Figure 3 further supports this observation by showing that the distribution of predicted charging demand varies across models, with hybrid models providing the most stable and accurate forecasts. The presence of outliers in traditional models such as LSTM and GRU suggests inconsistent demand predictions, which may indicate sudden spikes in charging requirements at specific times. These fluctuations imply the necessity of a reliable fast-charging network that can handle demand surges efficiently.
As illustrated in Figure 4, user behavioural trends show that many EV users prefer integrating charging into their daily commutes and residential areas. The violin plots comparing the West Midlands and North East regions indicate that most users charge their vehicles 1–4 times per week, with a significant portion opting for charging durations of 1–3 h. This preference suggests an increasing reliance on public and home-based fast-charging stations to meet daily commuting needs. Additionally, travel preferences for charging remain concentrated within 1–3 km, implying that new charging points should be installed at convenient locations within urban and suburban areas.
The results from predictive models and user behaviour analysis collectively indicate that EV charging demand must evolve to meet rising demand. Deploying fast-charging stations at strategic locations, such as commercial hubs, residential zones, and major highways, will ensure seamless EV adoption. Furthermore, smart grid integration and dynamic load management can be implemented to effectively balance peak demand periods, thereby preventing overloading and ensuring optimal usage of the charging network.
We acknowledge that traditional behavioural modelling techniques, such as Structural Equation Modelling (SEM) or Confirmatory Factor Analysis (CFA), are well established for analysing survey data and can provide deeper insights into the psychological and socio-demographic drivers of charging behaviour. In contrast, the present study has focused on applying a predictive ML framework to support practical demand forecasting for infrastructure planning. While this approach offers quantitative forecasts of charging demand, it does not fully capture the underlying behavioural mechanisms. A promising direction for future work is to integrate SEM or CFA analyses with the ML pipeline for example, by using latent factors identified through SEM as inputs to forecasting models, thereby combining explanatory richness with predictive power. This would enhance both the interpretability and practical value of the framework for policymakers and transport planners.
4.6. Interpretation of Charging Demand Forecasts and Practical Implications
The charging demand forecasts generated by the HCB-Net model provide valuable insights for practical infrastructure planning in the target regions. The ability of the model to accurately predict average daily charging demand at the user level, based on behavioural and spatial features, highlights the importance of demographic and regional factors in shaping future infrastructure needs. Notably, the model captures regional variation in demand profiles, with users in the West Midlands demonstrating higher variability and greater public charging reliance, whereas North East users exhibit more stable patterns centred on home charging.
These findings suggest that infrastructure investment strategies should be tailored to local contexts: in regions with higher public charging dependency and greater commuting distances, a higher density of fast chargers may be warranted to avoid peak-period congestion and enable flexible travel. Conversely, in areas with strong home-charging preference, investment in grid reinforcement and incentives for smart charging at residential locations could yield greater benefits.
Importantly, the model’s ability to provide interpretable forecasts from behavioural survey data, without requiring high-resolution smart meter inputs, offers a practical tool for planners in regions where real-time telemetry is limited. The forecasts can also inform dynamic pricing, load balancing, and phased infrastructure rollout strategies, supporting the transition towards efficient and user-responsive EV charging networks. In future work, further refinement of temporal granularity will enable more detailed peak load management planning.
It is important to acknowledge that the current model is trained on a relatively modest dataset (256 responses), which imposes certain limitations on its predictive capacity. While the use of survey-derived behavioural and spatial data demonstrates promising results, achieving an of 0.3996, this remains insufficient for highly precise forecasting applications. Moreover, several critical factors known to influence EV charging demand, such as electricity pricing dynamics, weather conditions, seasonal travel patterns, and real-time grid constraints, were not incorporated in the present study due to data availability constraints. The absence of these variables undoubtedly affects model generalisability and limits its immediate applicability for operational decision making. As such, the current framework is best viewed as an early-stage planning tool, capable of informing infrastructure strategy and spatial deployment decisions in data-sparse contexts. Future work will prioritise the integration of dynamic external variables, longitudinal data, and larger-scale behavioural datasets to enhance forecasting robustness and enable real-time applications.
4.7. Policy Implications and Recommendations
The findings from the model performance evaluation, charging demand forecasts, and user behavioural analysis underscore the government intervention’s critical role in expanding and enhancing EV charging demand. The demand for EV charging stations is projected to rise significantly, necessitating proactive measures to ensure accessibility, efficiency, and sustainability. From this comparison of data from two contrasting regions, differences in charging behaviours are influenced by the availability of chargers, frequency of use, duration of charging, and the distance travelled. The advantage of AI with ML and DL is that they are applied in real time, with access to data from chargers.
The algorithms derived from this research can be used to perform the following:
- Short-term forecasting of charging demand can be used to improve the information available to drivers currently using public chargers;
- Monitoring changing needs of users, allowing evidence-based decision making regarding the provision of rapid DC fast chargers in the long term.
One of the key policy recommendations is investment in expanding and upgrading charging networks. The forecasted demand trends highlight the need for fast-charging stations at strategic locations, such as urban centres, residential areas, commercial districts, and major highways. Governments should implement financial incentives, subsidies, and public–private partnerships (PPPs) to accelerate the deployment of high-speed and ultra-fast charging stations to support this expansion. Additionally, regulatory frameworks should ensure that new developments, such as housing estates and commercial complexes, incorporate EV-ready infrastructure for residents, local travellers, and visitors to the regions. These are necessary to support long-term adoption.
A user-centric design approach is essential to enhance the accessibility and convenience of EV charging. As seen in Figure 4, users typically charge their vehicles 1–4 times per week and prefer charging locations within 1–3 km of their routine commute. To accommodate these preferences, policymakers must encourage installing charging points in high-traffic areas, public parking facilities, and workplaces. Furthermore, integrating smart grid technologies and demand-side management strategies can optimise energy distribution, ensuring the charging infrastructure remains reliable without overloading the power grid.
The data-driven forecasting approach proposed in this study can serve as a foundational tool for implementing both direct and indirect EV charging control strategies. In the context of direct control, predicted regional charging load patterns could inform real-time grid management systems that schedule or throttle charging during peak demand periods, especially when integrated with local distribution network data. Conversely, in the context of indirect control, these behavioural forecasts can support the design of dynamic pricing models, incentive programmes, or infrastructure placement strategies aimed at passively influencing user charging decisions without enforcing strict intervention.
As highlighted by Zahedmanesh et al. [16] and Bordin and Tomasgard [17], successful EV–grid integration depends on a well-calibrated mix of control mechanisms. The proposed model provides a data-informed lens through which such mechanisms can be better targeted, particularly in regions where charging behaviours vary spatially and demographically. Integrating such predictive tools with smart city policy design can enable more agile and adaptive planning responses to increasing EV penetration.
In addition to infrastructure expansion, standardisation of charging protocols and interoperability across networks is crucial. EV users should be able to access charging stations seamlessly, regardless of the operator, through universal payment systems, real-time availability updates, and mobile application integration. By implementing the data-driven decision-making processes, informed by the forecasting algorithms developed in this research, authorities can monitor charging patterns, forecast future needs, and allocate resources efficiently.
Finally, to promote widespread EV adoption, policymakers should launch awareness campaigns and incentive programs, such as reduced charging fees, tax benefits, and rebates for EV users. These initiatives will not only encourage more people to transition to electric mobility but also support a sustainable and efficient EV ecosystem in smart cities.
By implementing these recommendations, governments and stakeholders can ensure the successful expansion of EV charging networks, enhancing both user experience and environmental benefits while supporting the long-term growth of EV adoption.
4.8. Predictive–Prescriptive Integration and Future Directions
While the present study focuses on predictive analytics—specifically estimating user-level EV charging demand using ML—the insights generated by the HCB-Net model also offer strong potential for integration with mathematical optimisation frameworks. This connection forms the basis of prescriptive analytics, wherein predictions guide decision making, such as when, where, and how much EV charging should be encouraged or deferred.
In the context of direct control strategies, the forecasted demand could feed into grid-aware scheduling algorithms that allocate charging loads in real time, optimising for network stability or cost. For indirect control strategies, predictions could inform dynamic pricing mechanisms that influence user behaviour through economic incentives. These themes align with the optimisation-based frameworks presented in prior work by Zahedmanesh et al. [16] and Bordin and Tomasgard [17], who, respectively, explored control hardware for load shaping and behavioural incentive design through microeconomic modelling.
Compared to existing fast-charging infrastructure studies, such as Gnann et al. (2018), which focused on empirical utilisation rates and queuing models calibrated with operational charging data [47], the proposed HCB-Net framework complements this line of work by introducing a predictive tool grounded in user-level behavioural and spatial inputs. Unlike queuing or capacity-based approaches, HCB-Net enables forecasting of evolving regional demand patterns based on socio-demographic dynamics, offering planners a forward-looking mechanism that can be adapted as EV markets grow and user behaviours shift. Furthermore, the modular design of HCB-Net aligns with advances in vehicle trajectory modelling seen in recent work, such as Ma et al. (2025) [48], where data-fusion and learning-based techniques improve the reconstruction of complex spatiotemporal patterns. The behavioural modelling and spatial feature extraction capabilities of HCB-Net make it highly applicable to related fields, such as demand-responsive transit systems, dynamic traffic assignment, or the integration of electric mobility into connected and autonomous vehicle (CAV) environments. Thus, this study not only advances EV infrastructure forecasting but also contributes a methodological foundation with wider potential across intelligent transport system applications.
Future research could build on this foundation by integrating HCB-Net with multi-objective optimisation models that balance user satisfaction, charging costs, and grid constraints. Such work would enable the development of fully integrated predictive–prescriptive systems for smart city EV infrastructure management, capable of both forecasting demand and recommending optimal charging strategies in real time.
4.9. Generalisability and Contextual Limitations
While the proposed methodology demonstrates promising results in two English regions—the North East and West Midlands—its broader applicability depends on certain contextual similarities. The model is most transferable to urban or peri-urban areas with:
- Moderate to high EV adoption rates;
- A mix of public and private charging infrastructure;
- Varying levels of user charging autonomy (e.g., home vs. workplace charging);
- Diverse demographic and travel profiles.
These features influence user behaviour and infrastructure demand, which are central to the model’s feature set and architecture. Applying the model in regions with fundamentally different energy pricing, charger accessibility, or mobility patterns (e.g., rural areas, countries with state-controlled utilities) may require local retraining and contextual adaptation.
Notably, while the numerical outputs of the HCB-Net model may not be directly portable, the framework itself—combining behavioural feature extraction with hybrid prediction—is broadly applicable across smart city planning contexts. Future work should involve external validation across more regions and potentially across countries with different EV policies and urban development stages.
4.10. Limitations in Computational Cost and Scalability
While the HCB-Net model demonstrates improved predictive performance, it also presents certain limitations in terms of computational complexity and scalability. The CNN component requires significant training time and memory allocation due to its convolutional and pooling layers, particularly when working with larger input matrices or higher-dimensional feature encodings. Furthermore, the hybrid architecture necessitates sequential training—first through deep feature extraction, followed by XGBoost regression—making the pipeline more resource-intensive than single-model approaches.
Scalability may also be limited when applied to significantly larger datasets or when extended to national-level EV infrastructure planning. Real-time deployment, for example, would require substantial optimisation or simplification of the current architecture, especially in environments with constrained computational infrastructure. Although the current model is efficient enough for offline planning tasks and regional-scale simulations, future versions may benefit from model pruning, parallelisation strategies, or deployment on edge devices to support broader smart city integration.
We also recognise that large-scale behavioural datasets derived from social media platforms, such as Twitter and Reddit, represent a highly promising complementary source for understanding public attitudes, behavioural trends, and emerging perceptions surrounding EV charging demand. Recent studies by Ruan and Lv (2022) [49] and Qian and Gkritza (2024) [50] have demonstrated that natural language processing (NLP) applied to social media data can capture real-time, spatially resolved public sentiment and topic trends, often at far greater scale and timeliness than traditional surveys. Compared to small-scale questionnaire data, such sources could provide broader insights into public discourse, regional concerns, and emerging behavioural shifts related to EV adoption and infrastructure needs. While the present study focused on structured survey data as a first step towards interpretable demand forecasting, future work will explore integrating social-media-derived insights with ML-based behavioural models. This combined approach would enable more scalable, adaptive forecasting and offer a deeper, dynamic understanding of public attitudes, enhancing the relevance of demand modelling for planners and policymakers.
We also acknowledge that the use of CNNs for this type of structured tabular data introduces certain methodological limitations. CNNs are optimally suited to learning spatially correlated or grid-based data structures, such as images or time-series windows, whereas the present feature set, derived from user survey responses, lacks inherent spatial continuity across features. In this study, CNN layers were used primarily to explore potential latent interactions between behavioural and demographic variables, and to test whether convolutional filters could enhance generalisation in a small-sample regime. However, the comparable performance of a simple linear regression model () suggests that DL may not be essential for this particular dataset structure. In future work, we will prioritise more methodologically aligned approaches, such as gradient boosting decision trees (e.g., XGBoost, LightGBM), TabNet, or interpretable ensemble models, which are better suited to tabular data and offer greater explainability for practical transport planning applications.
These limitations do not detract from the model’s utility in exploratory and planning contexts but should be considered when designing real-time, scalable systems for grid operators or mobility platforms.
5. Conclusions
This study presented HCB-Net, a hybrid deep learning framework integrating Convolutional Neural Networks and XGBoost to predict EV charging demand. Using survey-derived behavioural and spatial data from two UK regions—the West Midlands and the North East—the model achieved a Root Mean Squared Error (RMSE) of 0.1490 and an score of 0.3996, outperforming a range of traditional machine learning and standalone deep learning models. While the model demonstrated only moderate predictive accuracy, it provided interpretable and regionally grounded insights into user charging behaviours. The study showed that meaningful demand estimates can be extracted even without high-frequency temporal data, making the framework particularly suitable for cities in the early stages of EV infrastructure development. Beyond methodological innovation, the model offers practical value for smart city planners, utilities, and transport authorities. By identifying key behavioural and geospatial predictors of charging demand, HCB-Net can guide the optimal siting of charging stations, prioritise infrastructure investments in high-demand zones, and inform the design of dynamic pricing or demand response strategies. This is especially valuable for urban regions facing high variability in EV usage or preparing for large-scale transitions to electric mobility. Future work will expand the dataset to include more diverse geographic areas, incorporate smart meter or vehicle telemetry data, and extend the model to support real-time forecasting and prescriptive analytics.
Future Work
While this study has provided valuable insights into EV charging demand forecasting, several avenues for future research remain open.
- Incorporation of Real-time Data: Future work could focus on integrating real-time traffic patterns, weather conditions, and energy grid fluctuations to enhance the accuracy of demand forecasting models.
- Integration of V2G Systems: As V2G technology becomes more prevalent, future studies should explore how bidirectional energy flow affects charging station demand.
- Agent-Based Simulations for Charging Infrastructure: Conducting agent-based simulations to model user behaviour, charging station congestion, and dynamic pricing strategies can provide further insights into optimising the charging network and improved information for the public.
- Geospatial Analysis for Optimal Charging Station Placement: A detailed GIS-based approach could identify optimal charging station locations based on demographics, travel patterns, and urban planning constraints.
Addressing these future directions will allow researchers and policymakers to refine further their EV charging demand predictions. This will ensure a scalable, efficient, and user-friendly charging infrastructure for the widespread adoption of electric mobility.
Author Contributions
Conceptualisation, M.C., H.A., D.D. and M.B.; methodology, M.C., H.A., A.S. and S.D.; software, M.C.; validation, M.C., H.A., D.D. and M.B.; investigation, M.C.; resources, A.S., S.D. and M.C.; writing—original draft preparation, M.C.; writing—review and editing, M.C., D.D. and M.B.; visualisation, M.C. All authors have read and agreed to the published version of the manuscript.
Funding
This research received no external funding.
Data Availability Statement
The data and code are publicly available at https://github.com/cavusmuhammed68/Low_Carbon (accessed on 1 June 2025).
Conflicts of Interest
The authors declare no conflicts of interest.
References
- Chen, T.; Zhang, X.-P.; Wang, J.; Li, J.; Wu, C.; Hu, M.; Bian, H. A review on electric vehicle charging infrastructure development in the UK. J. Mod. Power Syst. Clean Energy 2020, 8, 193–205. [Google Scholar] [CrossRef]
- Brown, W.; King, M.; Goh, Y.M. UK smart cities present and future: An analysis of British smart cities through current and emerging technologies and practices. Emerald Open Res. 2023, 1, 5. [Google Scholar] [CrossRef]
- Souza, G.G.D.; Santos, R.R.D.; Godoy, R.B. Optimizing power grids: A valley-filling heuristic for energy-efficient electric vehicle charging. PLoS ONE 2025, 20, e0316677. [Google Scholar] [CrossRef]
- Hall, D.; Lutsey, N. Emerging Best Practices for Electric Vehicle Charging Infrastructure; The International Council on Clean Transportation (ICCT): Washington, DC, USA, 2017; Volume 54. [Google Scholar]
- Suresh, S.; Renukappa, S.; Abdul-Aziz, A.-R.; Paloo, Y.; Jallow, H. Developments in the UK road transport from a smart cities perspective. Eng. Constr. Archit. Manag. 2021, 28, 845–862. [Google Scholar] [CrossRef]
- Heidrich, O.; Hill, G.A.; Neaimeh, M.; Huebner, Y.; Blythe, P.T.; Dawson, R.J. How do cities support electric vehicles and what difference does it make? Technol. Forecast. Soc. Change 2017, 123, 17–23. [Google Scholar] [CrossRef]
- Razmjoo, A.; Nezhad, M.M.; Kaigutha, L.G.; Marzband, M.; Mirjalili, S.; Pazhoohesh, M.; Memon, S.; Ehyaei, M.A.; Piras, G. Investigating smart city development based on green buildings, electrical vehicles and feasible indicators. Sustainability 2021, 13, 7808. [Google Scholar] [CrossRef]
- Apata, O.; Bokoro, P.N.; Sharma, G. The risks and challenges of electric vehicle integration into smart cities. Energies 2023, 16, 5274. [Google Scholar] [CrossRef]
- Torkey, A.; Abdelgawad, H. Framework for planning of EV charging demand: Where should cities start? Transp. Policy 2022, 128, 193–208. [Google Scholar] [CrossRef]
- Bakker, J.J.; Mom, G.P.A.; Schot, J.W. Contesting Range Anxiety: The Role of Electric Vehicle Charging Infrastructure in the Transportation Transition; Technische Universiteit Eindhoven: Eindhoven, The Netherlands, 2011. [Google Scholar]
- Mashhoodi, B.; van der Blij, N. Drivers’ range anxiety and cost of new EV chargers in Amsterdam: A scenario-based optimization approach. Ann. GIS 2021, 27, 87–98. [Google Scholar] [CrossRef]
- Kumar, T. Alleviating range anxiety with ‘Enroute’: A real-time mobile solution and infrastructure innovation for electric vehicle users. Procedia CIRP 2024, 128, 37–42. [Google Scholar]
- Mohammed, A.; Saif, O.; Abo-Adma, M.; Fahmy, A.; Elazab, R. Strategies and sustainability in fast charging station deployment for electric vehicles. Sci. Rep. 2024, 14, 283. [Google Scholar] [CrossRef] [PubMed]
- Powell, B.; Johnson, C. Impact of Electric Vehicle Charging Station Reliability, Resilience, and Location on Electric Vehicle Adoption; National Renewable Energy Laboratory (NREL): Golden, CO, USA, 2024.
- Yousuf, A.K.M.; Wang, Z.; Paranjape, R.; Tang, Y. An in-depth exploration of electric vehicle charging station infrastructure: A comprehensive review of challenges, mitigation approaches, and optimization strategies. IEEE Access 2024, 12, 51570–51589. [Google Scholar] [CrossRef]
- Zahedmanesh, A.; Muttaqi, K.M.; Sutanto, D. Direct control of plug-in electric vehicle charging load using an in-house developed intermediate control unit. IEEE Trans. Ind. Appl. 2019, 55, 2208–2218. [Google Scholar] [CrossRef]
- Bordin, C.; Tomasgard, A. Behavioural change in green transportation: Micro-economics perspectives and optimization strategies. Energies 2021, 14, 3728. [Google Scholar] [CrossRef]
- Philipsen, R.; Schmidt, T.; Van Heek, J.; Ziefle, M. Fast-charging station here, please! User criteria for electric vehicle fast-charging locations. Transp. Res. Part Traffic Psychol. Behav. 2016, 40, 119–129. [Google Scholar] [CrossRef]
- Sun, X.-H.; Yamamoto, T.; Morikawa, T. Fast-charging station choice behavior among battery electric vehicle users. Transp. Res. Part Transp. Environ. 2016, 46, 26–39. [Google Scholar] [CrossRef]
- Asensio, O.I.; Lawson, M.C.; Apablaza, C.Z. Electric vehicle charging stations in the workplace with high-resolution data from casual and habitual users. Sci. Data 2021, 8, 168. [Google Scholar] [CrossRef]
- Tejaswi, V. Electric Vehicle Charging Behavior: An Analysis of Workplace Charging Heterogeneity to Improve Charging Network Planning. UC San Diego: Climate Science and Policy. 2024. Available online: https://escholarship.org/uc/item/7kp2w0c1 (accessed on 25 June 2025).
- Zhang, Y.; Li, S.; Blythe, P.; Wardle, J.; Herron, C.; Edwards, S.; Li, D.; Ji, Y.; Namdeo, A. Analysis of electric vehicle charging behaviour in existing regional public and workplace charging infrastructure: A case study in the North-East UK. Transp. Eng. 2025, 19, 100309. [Google Scholar] [CrossRef]
- Hardman, S.; Jenn, A.; Tal, G.; Axsen, J.; Beard, G.; Daina, N.; Figenbaum, E.; Jakobsson, N.; Jochem, P.; Kinnear, N.; et al. A review of consumer preferences of and interactions with electric vehicle charging infrastructure. Transp. Res. Part Transp. Environ. 2018, 62, 508–523. [Google Scholar] [CrossRef]
- Rogers, E.M.; Singhal, A.; Quinlan, M.M. Diffusion of innovations. In An Integrated Approach to Communication Theory and Research; Routledge: London, UK, 2014; pp. 432–448. [Google Scholar]
- Smith, B.; Olaru, D.; Jabeen, F.; Greaves, S. Electric vehicles adoption: Environmental enthusiast bias in discrete choice models. Transp. Res. Part D Transp. Environ. 2017, 51, 290–303. [Google Scholar] [CrossRef]
- Shanmuganathan, J.; Victoire, A.A.; Balraj, G.; Victoire, A. Deep learning LSTM recurrent neural network model for prediction of electric vehicle charging demand. Sustainability 2022, 14, 10207. [Google Scholar] [CrossRef]
- Koohfar, S.; Woldemariam, W.; Kumar, A. Performance comparison of deep learning approaches in predicting EV charging demand. Sustainability 2023, 15, 4258. [Google Scholar] [CrossRef]
- Cavus, M.; Dissanayake, D.; Bell, M. Deep-Fuzzy Logic Control for Optimal Energy Management: A Predictive and Adaptive Framework for Grid-Connected Microgrids. Energies 2025, 18, 995. [Google Scholar] [CrossRef]
- Tirunagari, S.; Gu, M.; Meegahapola, L. Reaping the benefits of smart electric vehicle charging and vehicle-to-grid technologies: Regulatory, policy and technical aspects. IEEE Access 2022, 10, 114657–114672. [Google Scholar] [CrossRef]
- Tsalikidis, N.; Koukaras, P.; Ioannidis, D.; Tzovaras, D. Hybrid CNN-LSTM forecasting model for electric vehicle charging demand in smart buildings. In Proceedings of the 2024 6th Global Power, Energy and Communication Conference (GPECOM), Budapest, Hungary, 4–7 June 2024; pp. 590–595. [Google Scholar]
- Hafeez, A.; Alammari, R.; Iqbal, A. Utilization of EV charging station in demand side management using deep learning method. IEEE Access 2023, 11, 8747–8760. [Google Scholar] [CrossRef]
- Cavus, M.; Dissanayake, D.; Bell, M. Next Generation of Electric Vehicles: AI-Driven Approaches for Predictive Maintenance and Battery Management. Energies 2025, 18, 1041. [Google Scholar] [CrossRef]
- Sasidharan, M.P.; Kinattingal, S.; Simon, S.P. Comparative analysis of deep learning models for electric vehicle charging load forecasting. J. Inst. Eng. Ser. 2023, 104, 105–113. [Google Scholar] [CrossRef]
- Lv, S.; Sun, G.; Wei, Z.; Chen, S.; Chen, Z. Optimal pricing and energy sharing of EV charging stations with an augmented user equilibrium model. IEEE Trans. Power Syst. 2023, 39, 4336–4349. [Google Scholar] [CrossRef]
- Altamimi, A.; Ali, M.B.; Kazmi, S.A.A.; Khan, Z.A. Multi-Agent Reinforcement Learning Optimization Framework for On-Grid Electric Vehicle Charging from Base Transceiver Stations Using Renewable Energy and Storage Systems. Energies 2024, 17, 3592. [Google Scholar] [CrossRef]
- Cavus, M.; Ayan, H.; Oyebamiji, O.K.; Dissanayake, D. Deep Charge-Fusion Model: Advanced Hybrid Modelling for Predicting Electric Vehicle Charging Patterns with Socio-Demographic Considerations. Int. J. Transp. Sci. Technol. 2025; in press. [Google Scholar] [CrossRef]
- Cavus, M.; Allahham, A.; Adhikari, K.; Zangiabadia, M.; Giaouris, D. Control of Microgrids Using an Enhanced Model Predictive Controller. In Proceedings of the 11th International Conference on Power Electronics, Machines and Drives (PEMD 2022), Hybrid Conference, Newcastle, UK, 21–23 June 2022; pp. 660–665. [Google Scholar]
- Prajeesh, C.B.; Pillai, A.S.; Khwaja, A.S.; Anpalagan, A. Enhancing Electric Vehicle Charging Infrastructure: A Framework for Efficient Charging Point Management. e-Prime Adv. Electr. Eng. Electron. Energy 2025, 11, 100926. [Google Scholar]
- Cavus, M.; Allahham, A. Spatio-Temporal Attention-Based Deep Learning for Smart Grid Demand Prediction. Electronics 2025, 14, 2514. [Google Scholar] [CrossRef]
- Mastoi, M.S.; Zhuang, S.; Munir, H.M.; Haris, M.; Hassan, M.; Usman, M.; Bukhari, S.S.H.; Ro, J.-S. An in-depth analysis of electric vehicle charging station infrastructure, policy implications, and future trends. Energy Rep. 2022, 8, 11504–11529. [Google Scholar] [CrossRef]
- Qadir, S.A.; Ahmad, F.; Al-Wahedi, A.M.A.B.; Iqbal, A.; Ali, A. Navigating the complex realities of electric vehicle adoption: A comprehensive study of government strategies, policies, and incentives. Energy Strategy Rev. 2024, 53, 101379. [Google Scholar] [CrossRef]
- Dik, A.; Omer, S.; Boukhanouf, R. Electric vehicles: V2G for rapid, safe, and green EV penetration. Energies 2022, 15, 803. [Google Scholar] [CrossRef]
- Wang, S.; Zhuge, C.; Shao, C.; Wang, P.; Yang, X.; Wang, S. Short-term electric vehicle charging demand prediction: A deep learning approach. Appl. Energy 2023, 340, 121032. [Google Scholar] [CrossRef]
- Openshaw, S.; Lu, X.; Pham, H.; Qin, H.; Lukic, S. Investigation of Commercial Viability and Public Perception of Electrified Roadways with Dynamic Wireless Charging. In Proceedings of the IEEE Wireless Power Technology Conference and Expo (WPTCE), San Diego, CA, USA, 4–8 June 2023. [Google Scholar]
- Office for National Statistics (ONS). Census 2021, England and Wales. Available online: https://www.ons.gov.uk/census (accessed on 5 April 2025).
- Bösehans, G.; Bell, M.; Thorpe, N.; Liao, F.; Homem de Almeida Correia, G.; Dissanayake, D. eHUBs—Identifying the potential early and late adopters of shared electric mobility hubs. Int. J. Sustain. Transp. 2023, 17, 199–218. [Google Scholar] [CrossRef]
- Gnann, T.; Funke, S.; Jakobsson, N.; Plötz, P.; Sprei, F.; Bennehag, A. Fast charging infrastructure for electric vehicles: Today’s situation and future needs. Transp. Res. Part Transp. Environ. 2018, 62, 314–329. [Google Scholar] [CrossRef]
- Ma, J.; Roncoli, C.; Ren, G.; Yang, Y.; Wang, S.; Yu, J. An integrated framework for fully sampled vehicle trajectory reconstruction using a fused dataset. J. Intell. Transp. Syst. 2025. [Google Scholar] [CrossRef]
- Ruan, T.; Lv, Q. Public perception of electric vehicles on Reddit over the past decade. Commun. Transp. Res. 2022, 2, 100070. [Google Scholar] [CrossRef]
- Qian, X.; Gkritza, K. Spatial and temporal variance in public perception of electric vehicles: A comparative analysis of adoption pioneers and laggards using Twitter data. Transp. Policy 2024, 149, 150–162. [Google Scholar] [CrossRef]
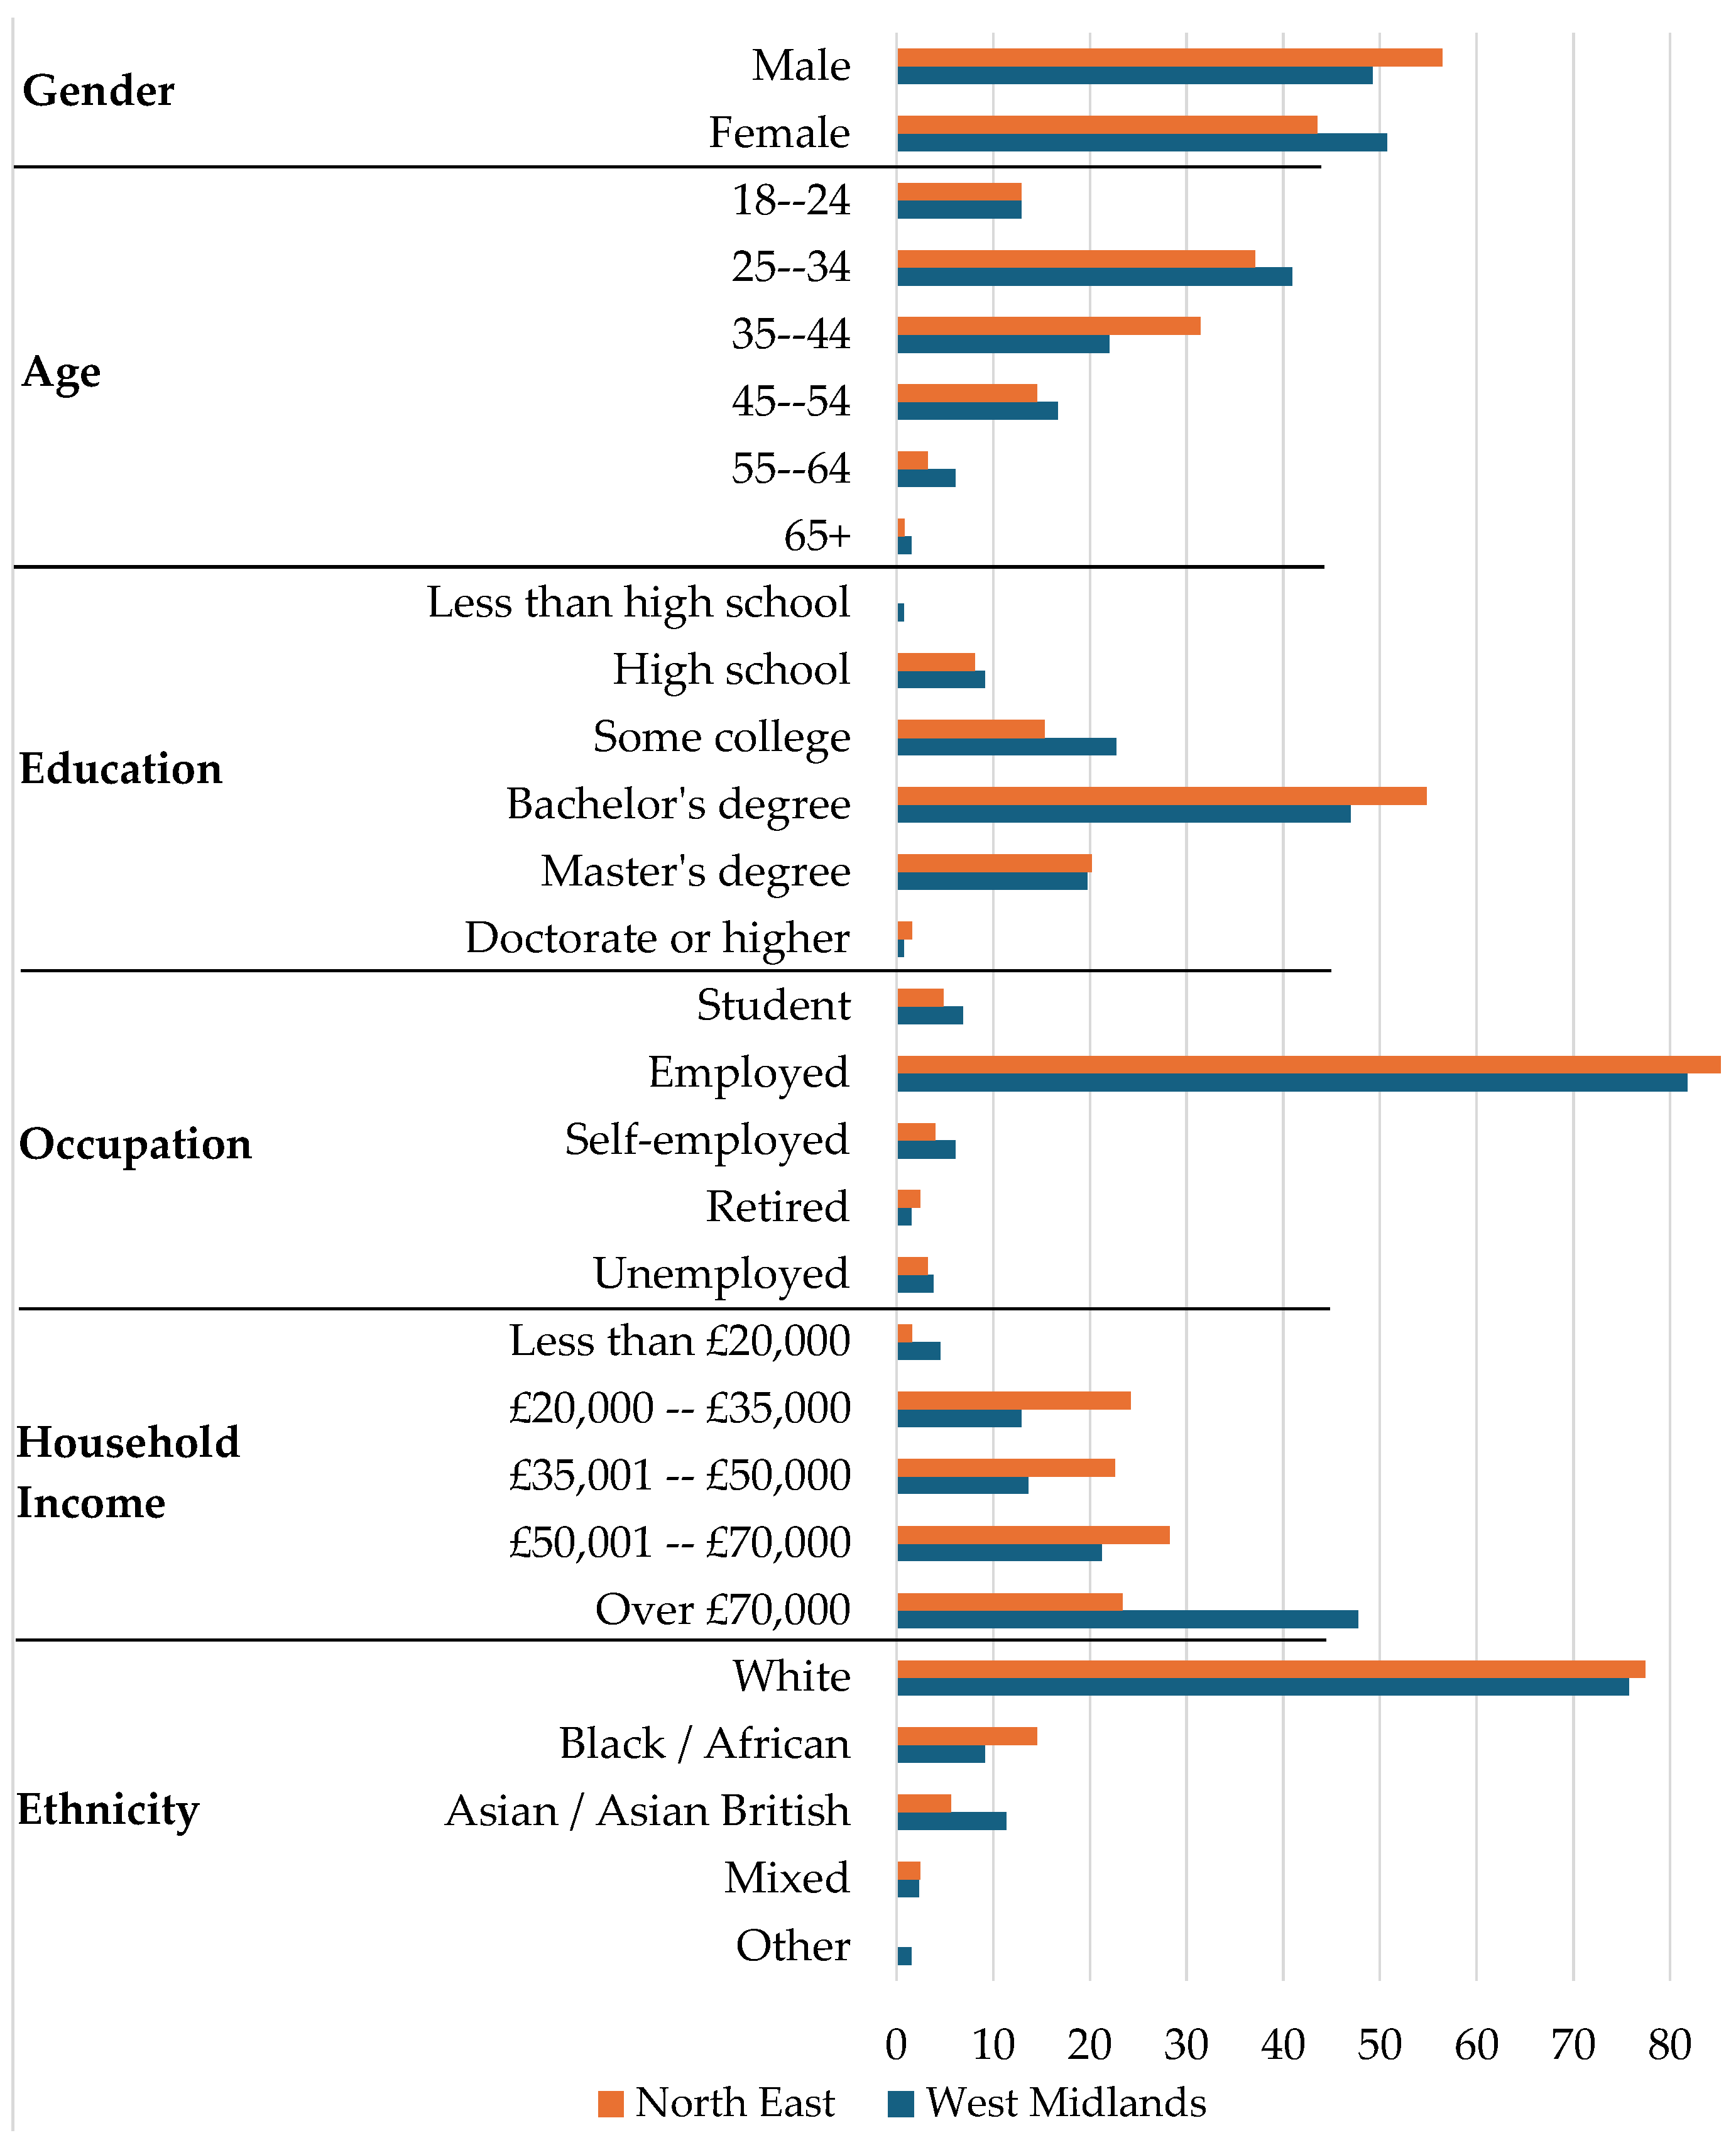
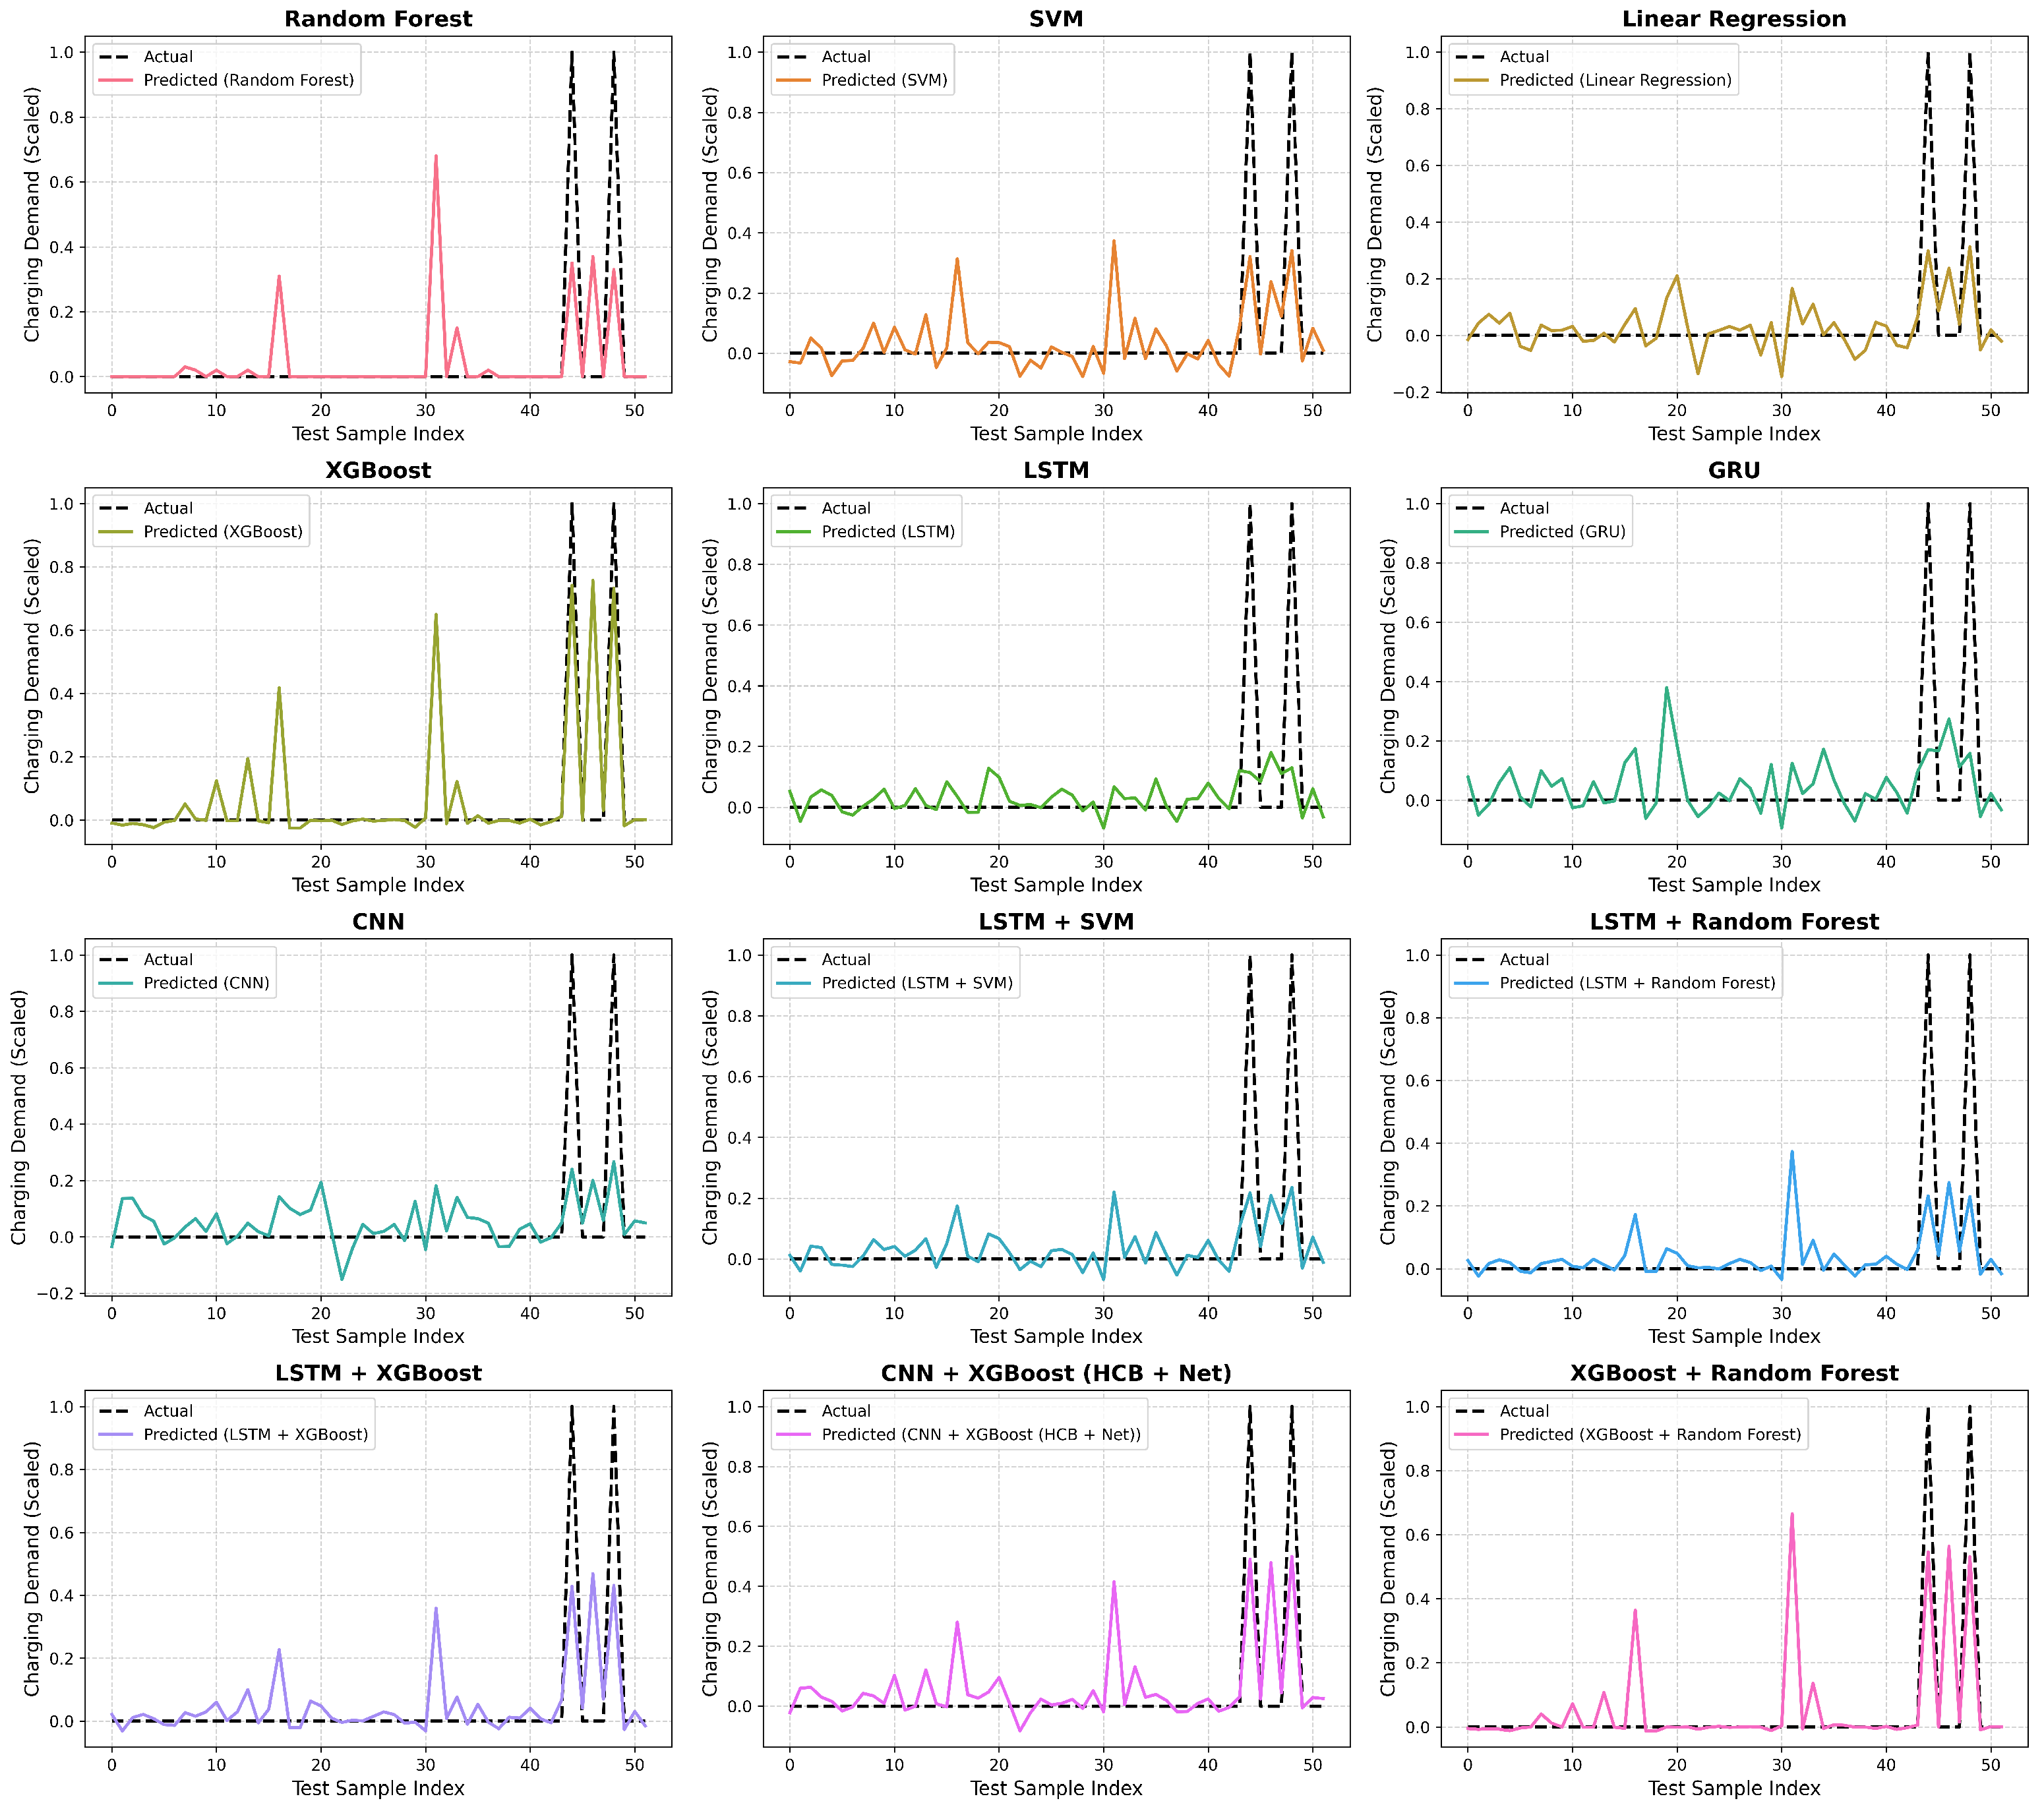
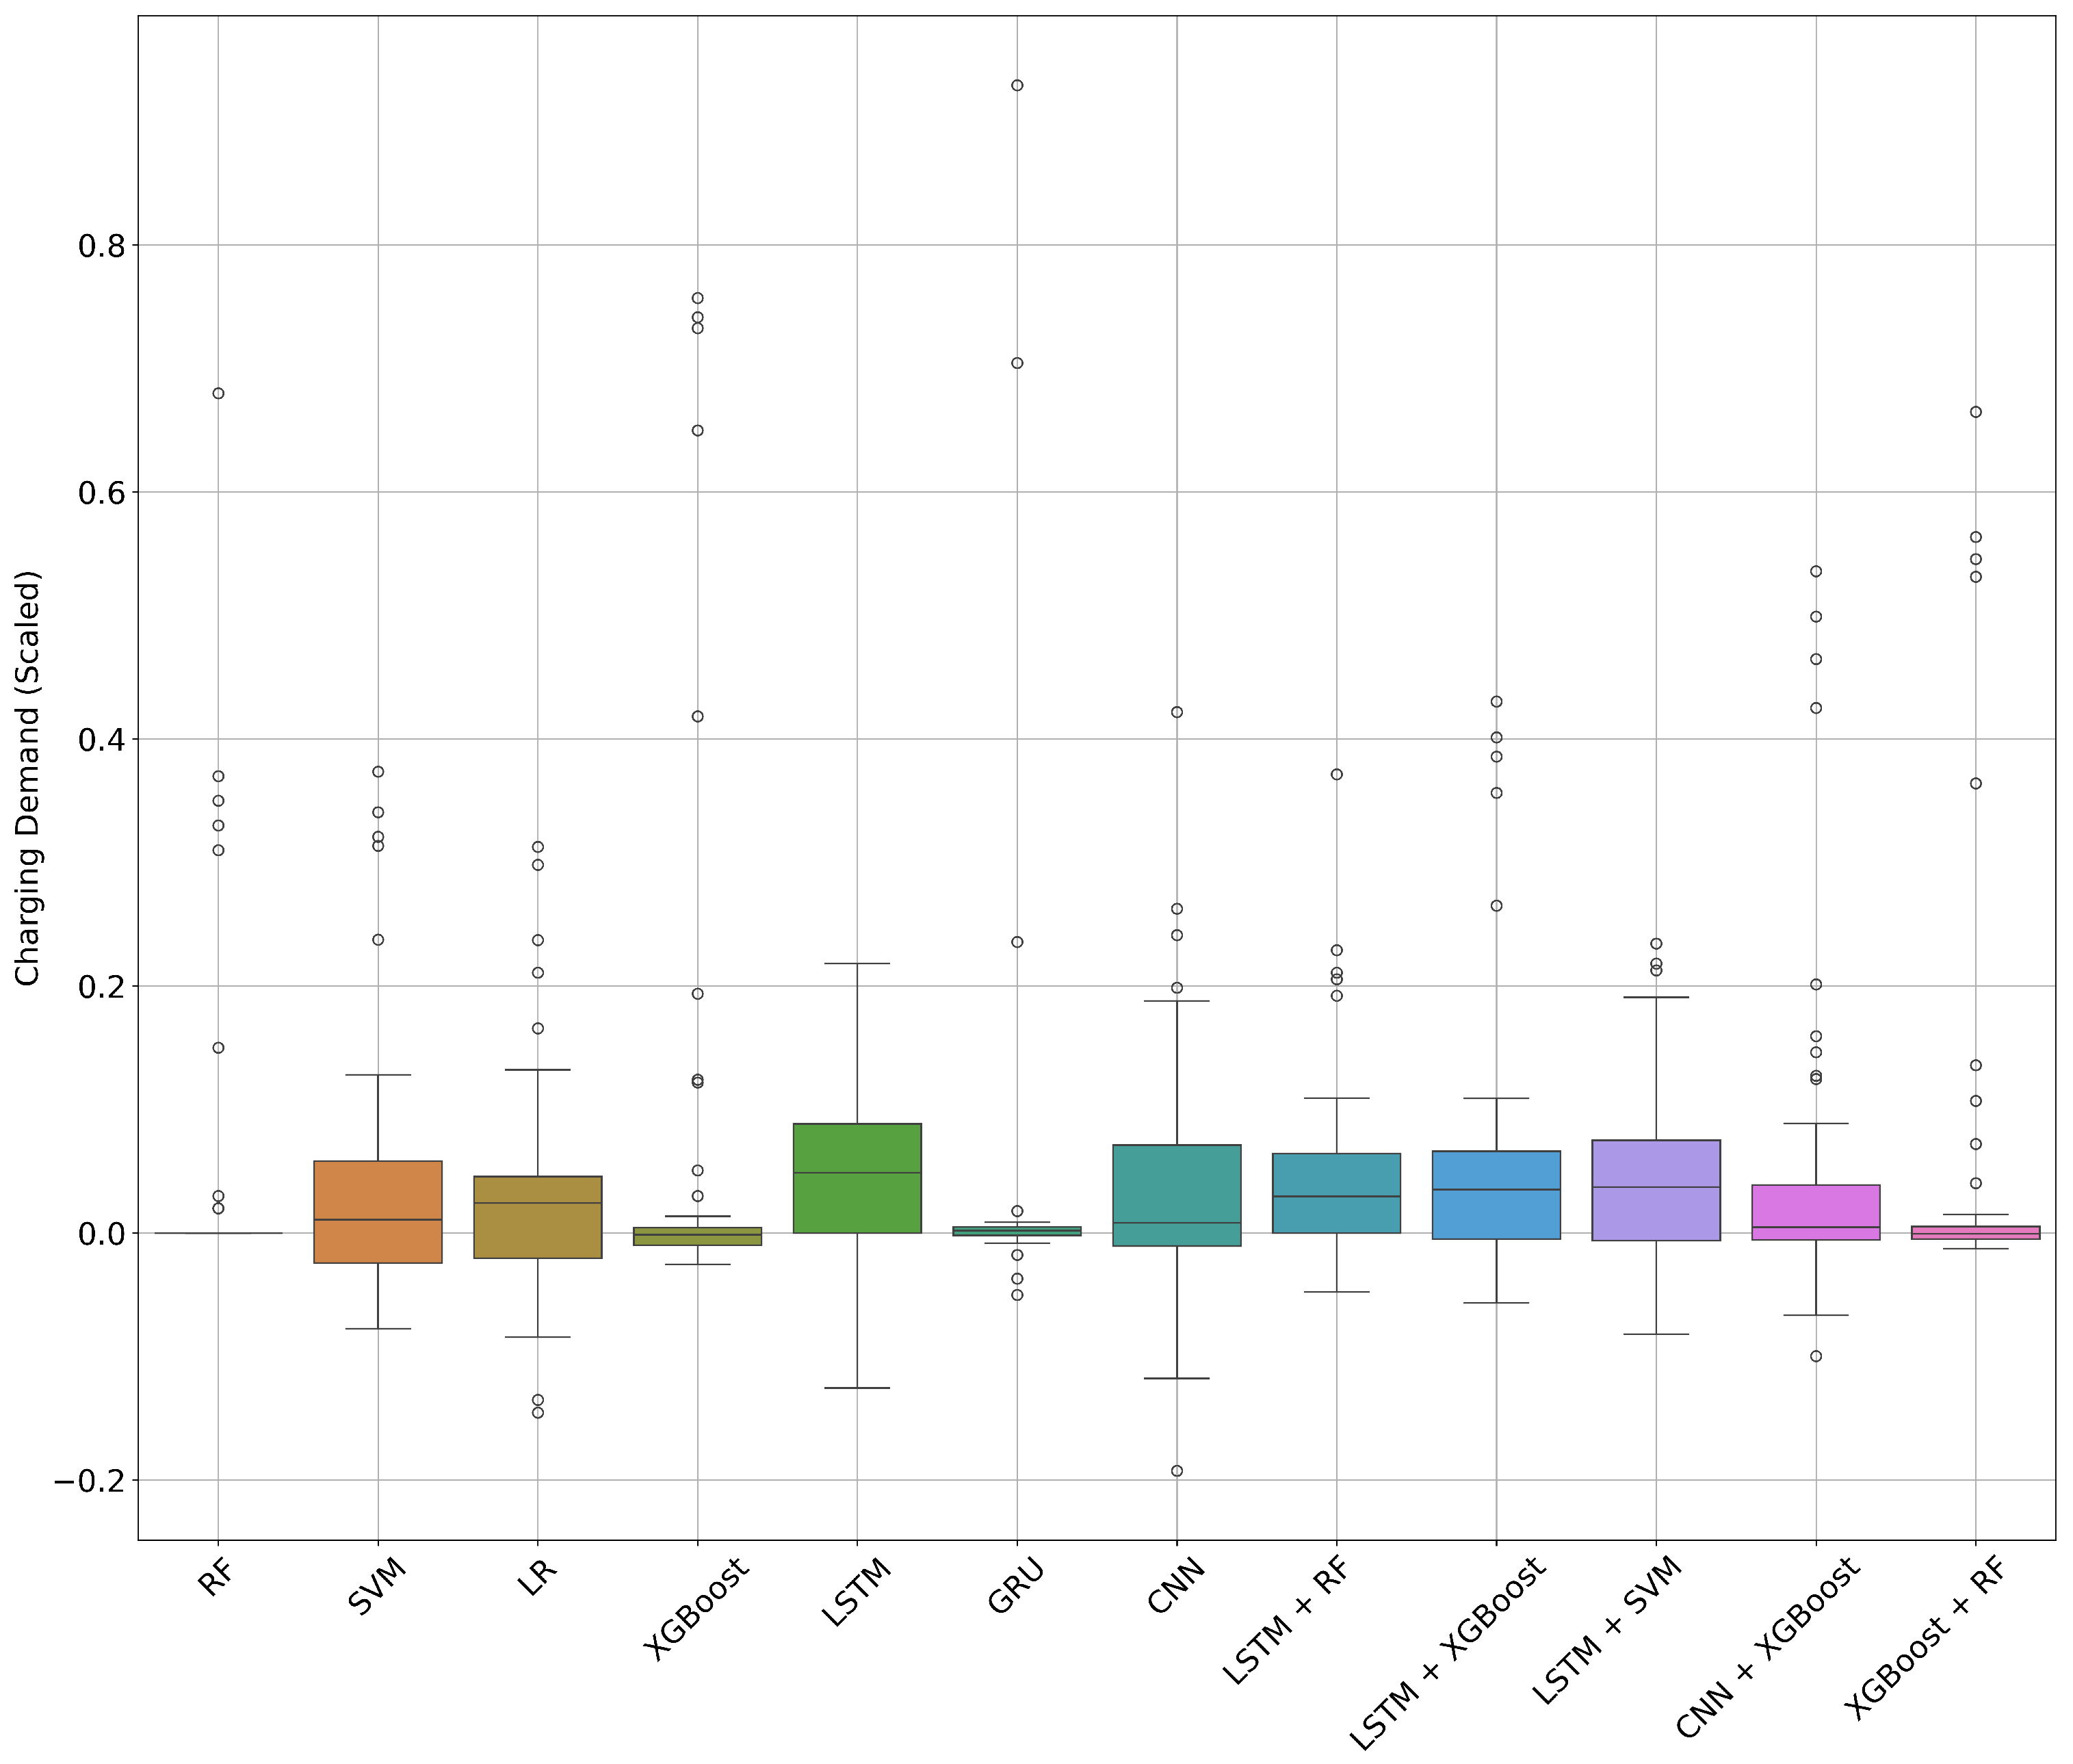

Disclaimer/Publisher’s Note: The statements, opinions and data contained in all publications are solely those of the individual author(s) and contributor(s) and not of MDPI and/or the editor(s). MDPI and/or the editor(s) disclaim responsibility for any injury to people or property resulting from any ideas, methods, instructions or products referred to in the content. |
© 2025 by the authors. Licensee MDPI, Basel, Switzerland. This article is an open access article distributed under the terms and conditions of the Creative Commons Attribution (CC BY) license (https://creativecommons.org/licenses/by/4.0/).