Article

2-Stage Design of E-Moped-Sharing Service for Accessibility, Greenhouse Gas Emissions, and Cost Through Station and Supplier Selections

1
Department of Informatics, The University of Electro-Communications, 1-5-1 Chofugaoka, Chofu 182-8585, Tokyo, Japan
2
Department of Informatics, Faculty of Engineering, Kindai University, 1 Takaya Umenobe, Higashi-Hiroshima 739-2116, Hiroshima, Japan
3
Sustainable Technologies Laboratory, Department of Electrical Engineering and Computer Sciences, Bochum University of Applied Sciences, Am Hochschulcampus 1, 44801 Bochum, Germany
*
Author to whom correspondence should be addressed.
Energies 2025, 18(7), 1644; https://doi.org/10.3390/en18071644
Submission received: 3 December 2024 / Revised: 12 February 2025 / Accepted: 27 February 2025 / Published: 25 March 2025
(This article belongs to the Special Issue Sustainable and Low Carbon Development in the Energy Sector)

Abstract

:
In recent years, there has been a call for a shift to transportation with lower greenhouse gas (GHG) emissions in order to combat global warming. One of the ecofriendly transportation methods is an electric moped scooter (e-moped)-sharing service that does not emit GHG when it runs. It is necessary to plan the location of charging stations and the material procurement through the manufacturing of e-mopeds in order to reduce the cost and GHG emissions and to improve the accessibility of the service. In this study, a two-stage design on the e-moped-sharing services is proposed to allocate charging stations and select material suppliers for e-mopeds using integer programming. The analysis method to determine the suitable charging station locations and sizes and supplier selection are also presented. Numerical experiments are conducted to illustrate the proposed design and analysis method by assuming Kumpan’s 1954 i model installation in Bochum city, Germany. In the numerical experiments, set covering and maximal covering location problems with small coverage radius of charging stations would be better by evaluating accessibility, GHG emissions, and cost comprehensively. Moreover, 11 prioritized demand points were picked out by introducing new indexes such as geographical and demand importance.

1. Introduction

To achieve carbon neutrality by 2050 in the EU [1], the EU plans to ban the sale of gasoline and diesel vehicles [2]. The International Energy Agency (IEA) reported that road transportation generated about 15% of the world’s total CO2 emissions [3]. According to NIKKEI, Honda Motor Co., Ltd., which is one of the largest moped manufactures in the world, will cease the production of gasoline mopeds with an engine displacement of 50 cc or less in May 2025 [4].
As a green transportation method, an electric moped scooter (e-moped) with little GHG emissions in use, unlike the gasoline moped, is spreading for short-distance travel [5]. By charging their battery from solar photovoltaic (PV) charging stations, the users can ride their e-moped with little GHG emissions in the usage phase. Moreover, e-moped-sharing services can also save GHG emissions for e-moped production because the volume of e-moped production can be saved by sharing users and potentially also substituting car rides. Thus, the e-moped-sharing service will become an attractive transportation to prevent global warming. UNU by emco reported that the number of scooters used for sharing globally increased by 58% from 66,000 in 2019 to 104,000 in 2020, and that the number of registered users also increased from 5 million to nearly 9 million over the same period despite COVID-19 [6]. There were more than 220 cities where moped sharing was installed in 2022 [7]. Then, 55% of e-mopeds were deployed in the Europe [7].
In addition to GHG reduction through the production and usage phases in e-mopeds, the e-moped-sharing services are useful as an alternative to short-distance transportation, and they help reduce traffic jam and pollution caused by automobiles [8]. For the e-moped-sharing service, accessibility from the demand point to the charging station is a very important factor to obtain users as well as cover demand [9]. As evaluation indexes of accessibility, the average and maximal distance from a demand point to a charging station can be adopted. Moreover, the available number of e-mopeds, which depends on the number and size of charging stations, is also an important accessibility index. If the number of e-mopeds per user is much lower, it leads to lost sales by losing opportunity of riding e-mopeds. In contrast, having many more e-mopeds per user is costly for e-mopeds sharing company. Therefore, locations and sizes of charging stations comprehensively should be determined based on accessibility, the number of e-mopeds, and cost. These types of decisions are called facility location problems [10].
The facility location problem is a mathematical model for finding a desirable location for a facility within a given space [10]. It is used in a wide range of fields such as applied mathematics, operations research, regional science, economic geography, and urban engineering [10]. The problem enables this study to estimate the accessibility, such as the average total distance and max distance. The set covering location problem and maximal covering location problem are major approaches for facility location problems. The set covering location problem minimizes the number of facilities to cover all user demands [11]. Meanwhile, the maximal covering location problem maximizes the cover demand based on the number of facilities and its coverage radius set in advance [11]. That is, the cover radius is static and set in advance in both approaches. The set covering location problem determines the locations and number of facilities to cover all demand, whereas the maximal covering location problem determines the locations of facilities to maximize demand under static number of facilities.
Actually, the e-moped-sharing service can reduce GHG emissions by installing PV charging stations and alleviating traffic jams, but GHG emissions during e-mopeds production cannot be avoided. In particular, material-based GHG emissions can account for a larger percentage against the production process, from material to distribution to users [12]. For example, SHARP reported that GHG emissions in the material manufacturing phase of the 4K LCD TV 2022 model accounted for 23% through its life cycle [12]. Similarly, 28% of GHG emissions come from manufacturing in the base case of the e-moped-sharing service [5]. Additionally, more than 71% of capital costs is from the purchase of the e-moped [13]. To achieve carbon neutrality in transportation, GHG emissions whole life cycle of e-moped needs to be considered. Both material-based GHG emissions and procurement cost differ among supplied countries due to different energy mix and economic situations. Material-based GHG emissions and procurement cost would be saved simultaneously by supplier selection [14].
To save GHG emissions and procurement costs simultaneously, supplier selections can be conducted with two objective functions: minimizing GHG emissions and procurement cost. The suppliers are selected by evaluating both objective functions simultaneously to satisfy the required material demand for e-moped production. Therefore, to install e-moped-sharing services in an environmentally friendly and economical way, two types of decisions, namely charging station location and material supplier selection, are required based on accessibility, GHG emissions, and cost. According to Liu et al. [15], optimizing several competing decision criteria is called a joint optimization problem. The introduction of joint optimization problems in the e-moped-sharing service may provide suggestions on how charging stations should be allocated and how suppliers for e-mopeds’ materials are chosen from a different approach of accessibility, GHG emissions, and cost. Its problem will consider the facility location problem in the 1st stage and the supplier selections in the 2nd stage, respectively. However, it is appropriate to apply a two-stage design instead of the joint optimization problem. This is because a two-stage design is not only easier to solve than the joint optimization problem, but also because it is difficult to guarantee that the optimal solution obtained by the joint optimization problem is a better choice in terms of accessibility, GHG emissions, and cost.
Here, research questions (RQs) about the e-moped-sharing service are proposed with as follows:
RQ1. Which charging station scenarios about coverage radius and GHG reduction target should be adopted for the e-moped-sharing service?
RQ2. How should charging stations and material supplier selections be combined for accessibility, GHG emissions, and cost?
RQ3. Which demand points should be prioritized to allocate charging stations through set covering and maximal covering location problems?
RQ4. Which suppliers should be selected for each material?
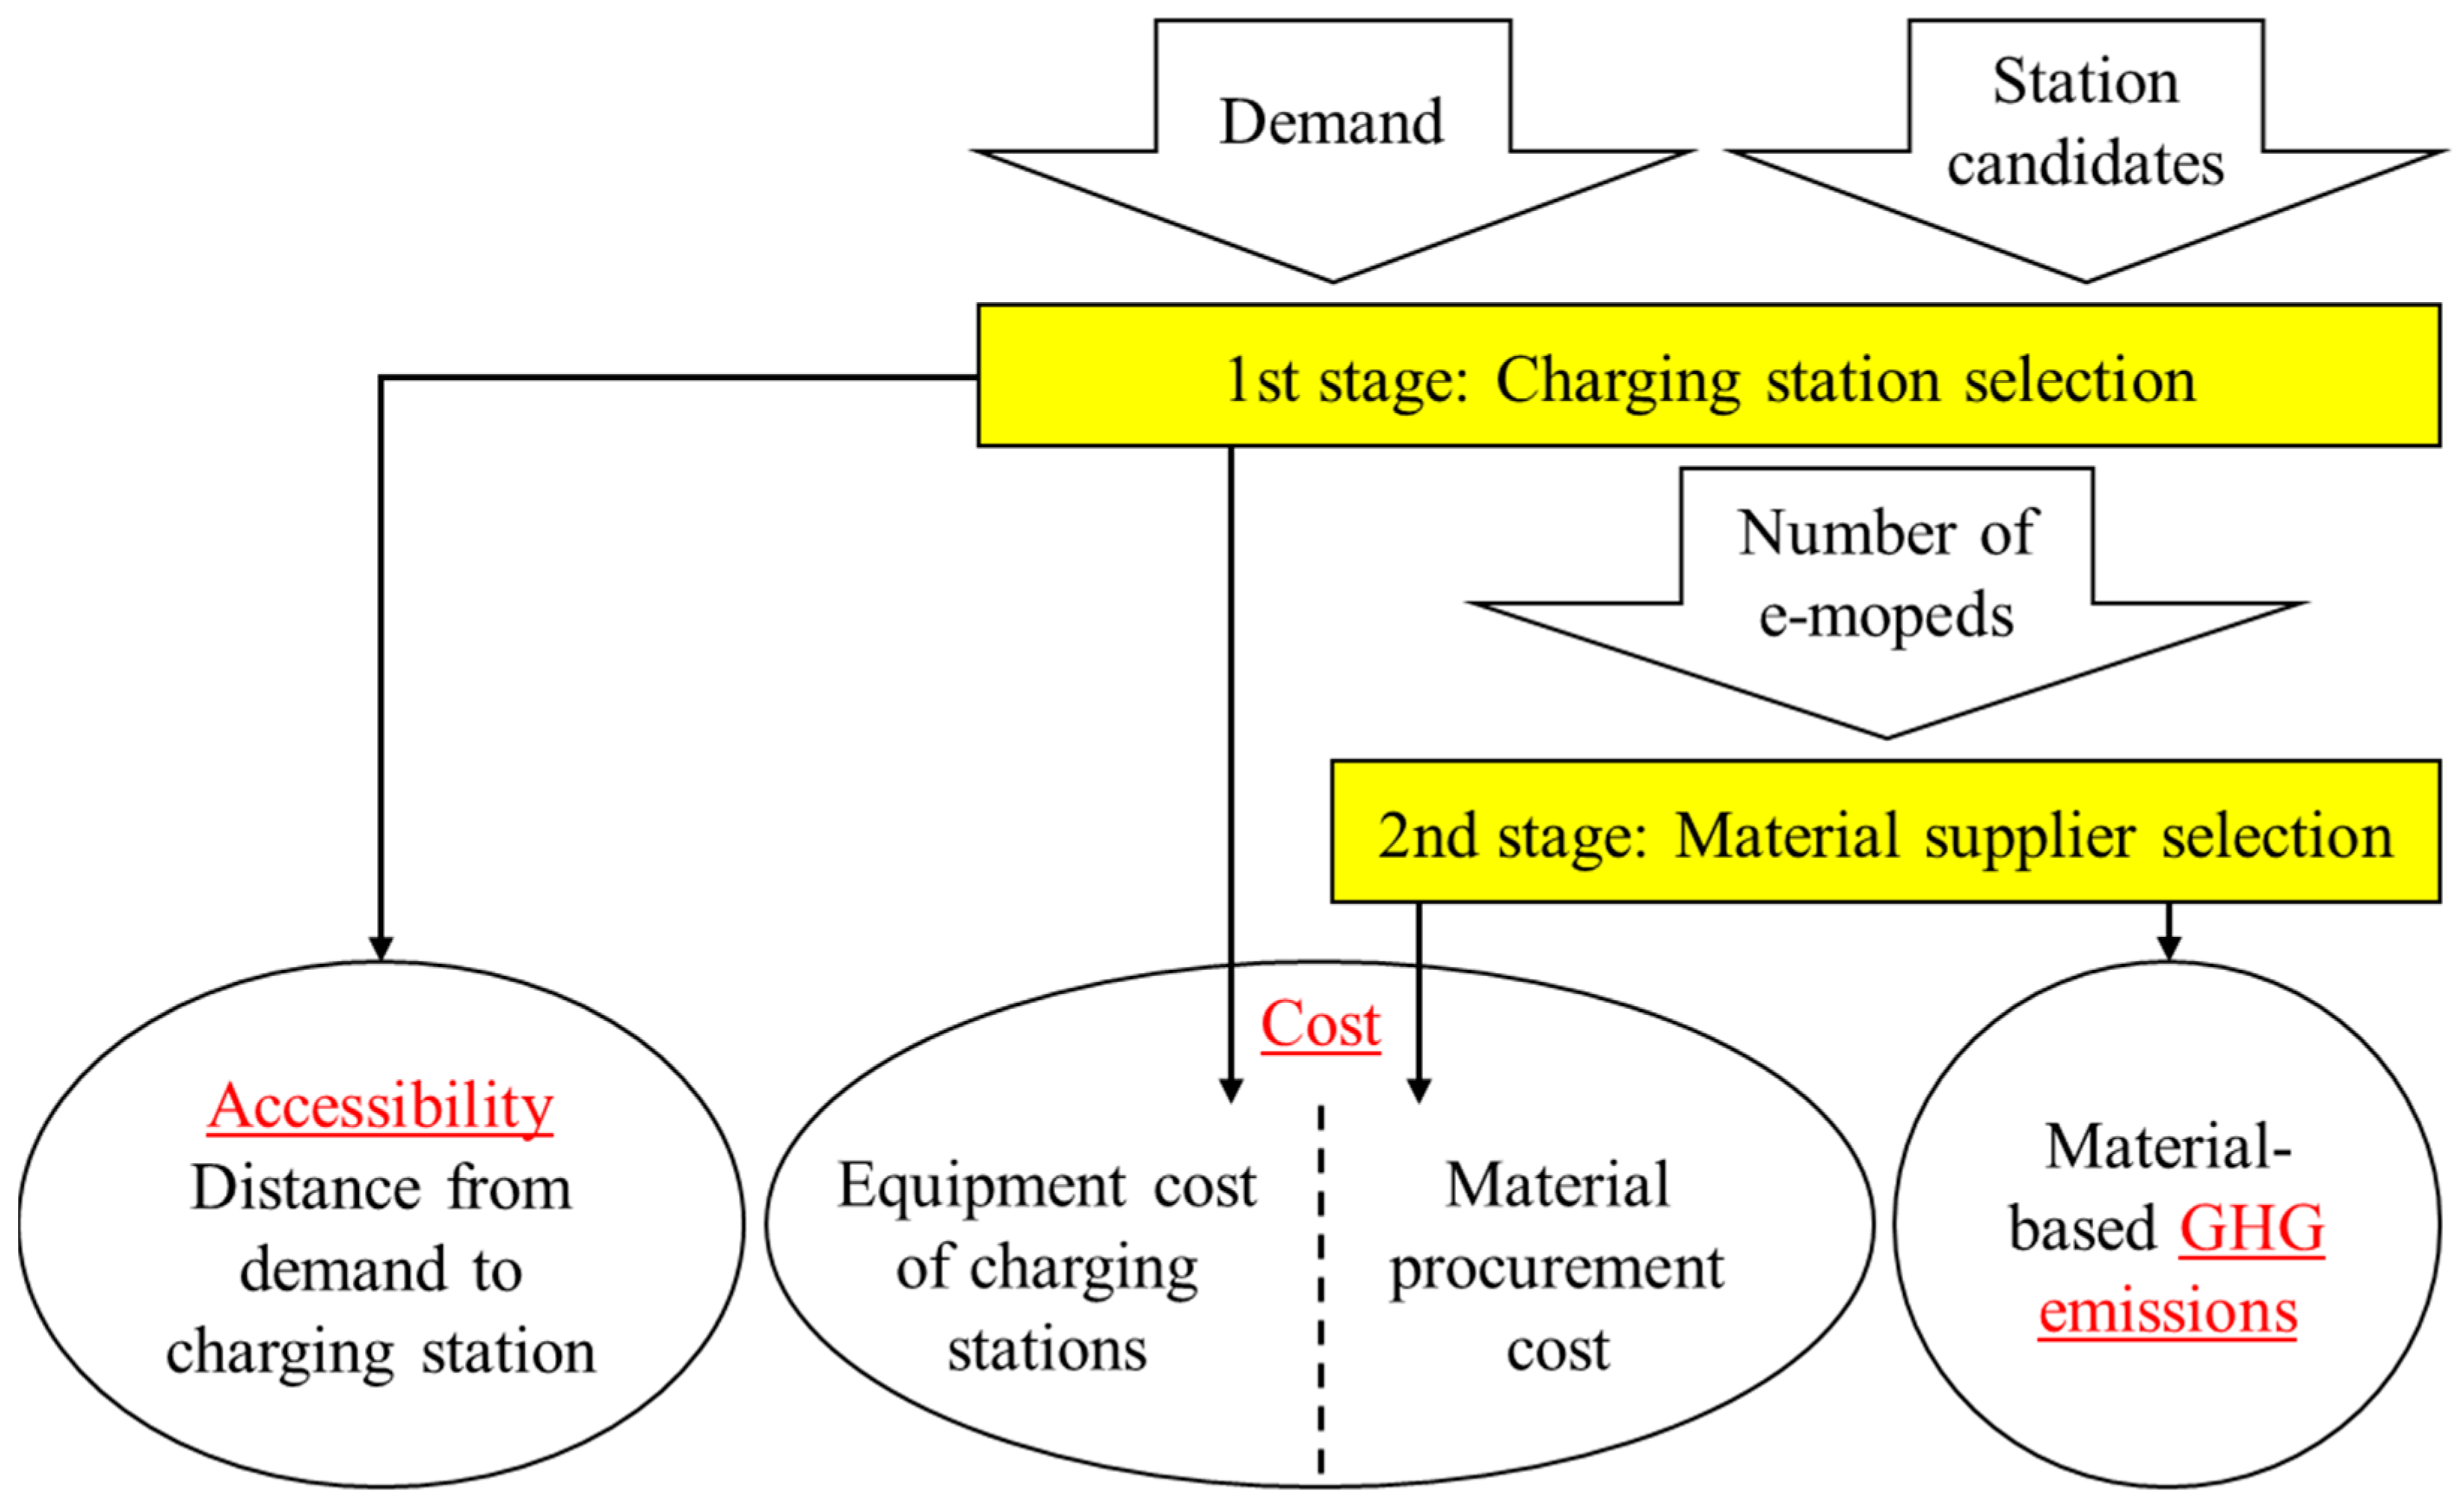
This study proposes a two-stage design of the e-moped-sharing service for accessibility, GHG emissions, and cost using integer programming. The 1st stage determines charging station locations and numbers based on demand and accessibility using set covering and maximal covering location problems. Because the required number of e-mopeds depends on the number of charging stations, the 1st stage also decides the number of e-mopeds. The 2nd stage determines material suppliers in different countries with different GHG emissions and procurement costs to balance the GHG emissions and cost. To determine the suitable charging station locations and material suppliers through the proposed 1st and 2nd stages, the analysis method is also presented.
The rest of this paper is composed as follows. Section 2 shows the literature review in terms of accessibility, GHG emissions, and cost. Section 3 represents the two-stage design of e-moped-sharing service using two facility location problems and supplier selection. Input data, assumptions of numerical experiments, and scenarios are explained, and results of the numerical experiments are shared in Section 4. Section 5 analyzes the selected locations of charging stations and material suppliers. Section 6 concludes the paper and suggest future studies.

2. Literature Review

Table 1 lists and summarizes related papers in terms of accessibility, GHG emissions, cost, and targets. The ✓ in Table 1 denotes the paper addressing the points. Csiszár et al. [16] developed a two-level charging station-locating method. This method evaluated the potential of electric vehicle use on a macro-level and the p locations of charging stations on a micro-level focused on the land-use using weighted multicriteria methods. This method was applied to a macro assessment of Hungary and a micro assessment of its capital, Budapest. The results showed that charging stations in the park and ride, with their centralized service and high-density areas, provided the city’s public charging supply better than gas stations. García et al. [17] investigated the usage and opinions of an e-moped-sharing service based on a web-based survey conducted in Spain. Kruskal–Wallis tests were conducted to find out the district of the urban population that was more likely to use the sharing service, and additional statistical mean differences in specific variables about the service were carried out. They found that age, occupation, income, and environmental awareness appeared to be the main reasons for expanding the service in the future. He et al. [9] developed a location-allocation model which considered the supply-and-demand estimation of EV charging, the government policy, and the spatial constraints in Hong Kong. The goal of their model was to minimize both the penalty for the lack of EV charging demand and the travel time to charging facilities, weighted for demand. Their study showed that the majority of new charging stations should be allocated to new towns and new development areas. Additionally, it is desirable to extend existing charging stations by adding more chargers compared to constructing new charging stations. Polo et al. [18] merged accessibility and location allocation models in geographic information systems as a proposed strategy to improve the spatial planning of public health services. To estimate the spatial accessibility, the two-step floating catchment area (2SFCA) model was conducted based on the Dijkstra’s algorithm and the vectorial analysis. Spatial accessibility improvement was estimated by the maximal coverage and the p-median location problems. It was found that the service replacement proposed by the maximal coverage location problem maximized its spatial accessibility more advantageously. Schelte et al. [19] analyzed not only energy supply means such as solar charging stations and battery swapping stations, but also user acceptance and behavior regarding e-moped- and stand-up scooter-sharing services. An online questionnaire was conducted based on the Unified Theory of Acceptance and Use of Technology to identify important factors influencing user acceptance. They clarified that 95% of respondents answered that the sustainability of sharing services was an important factor, and it affected the personal attitude of users. They discussed the user accessibility of the service depending on charging stations. However, these previous papers did not consider the installation cost, especially that of charging stations. It is essential for their owner to reduce its cost and to earn the station usage fee.
Vazifeh et al. [20] proposed a new methodology to conduct the data-driven optimization of EV charging station locations. They solved a discrete optimization problem on a geographical grid to cover the entire demand area and minimize the drivers’ total driving distance to charging stations, the related energy cost, and the number of charging stations based on the genetic algorithm. It was found that the algorithm enabled them to reduce the drivers’ total driving distance to charging stations, the related energy cost, and the number of charging stations compared to both a locally optimized solution and the current charging station placement in the Boston metro area. However, they did not include the cost of charging facilities and the materials of e-mopeds. Bai et al. [21] proposed a cell-based model which could decide locations, capacity options, and service types of EV charging stations such that all potential charging demand was covered. The bi-objective charging station location problem was conducted to minimize the total cost and to maximize service quality using a hybrid evolutionary algorithm that combined the non-dominated sorting genetic algorithm-II (NSGA-II) with linear programming and neighborhood search. They showed that the hybrid NSGA-II could obtain more Pareto solutions in a much shorter time for large-scale instances with good quality. They discussed the user accessibility and the cost of the service depending on charging stations. However, they did not consider the GHG emissions, especially those of e-mopeds. If charging stations are installed, the environmental analysis should also be evaluated whole the service.
Chen and Kockelman [22] investigated the life cycle inventory impacts on energy usage and GHG emissions based on candidate travelers using carsharing in US case. Three different scenarios were built to conduct the sensitivity analysis about the reduction in total life cycle energy and GHG emissions for a candidate. Their results showed that the average individual transportation energy use and GHG emissions could be reduced by approximately 51% if current carsharing members joined a carsharing organization. Schelte et al. [5] compared the e-moped-sharing to alternative transportation in terms of environmental impact and how it could be more reduced. They used the LCA data to estimate how the sharing affected the impact category global warming potential and developed five different usage scenarios of the service as the case study in a German city. Their results showed that the sharing had almost as much environmental impact on global warming potential per person and kilometer as the public transportation to move a lot of people if the e-mopeds have long lifetimes and efficient operation logistics are developed. Schelte et al. [23] indicated the potentials of smart charging stations for urban micromobility. Four different case studies were planned to analyze the usage and environmental influence of the solar charging station using life cycle assessments. It was found that the global warming potential per kilowatt-hour of energy supply would decrease by 73–88% compared to battery swapping with diesel vans if solar charging stations were utilized. They discussed the GHG emissions through the service depending on e-mopeds and renewable energy. However, they did not consider the installation cost, especially that of e-mopeds. It is essential for company to reduce its cost and to expand the service.
Baptista et al. [24] claimed that car sharing contributes to more efficient and rational mobility. The case study was conducted in Lisbon, Portugal, to estimate the reduction of energy and environmental impacts through car sharing. They found that those benefits would be reductions of 35 or 47% in terms of energy consumption and 35 and 65% for CO2 emissions in case of a shift to hybrid vehicles or to electric vehicles, respectively. Wortmann et al. [13] surveyed the possibility of an e-moped-sharing service if it replaced passenger travels by car and estimated the economic and environmental effects of the service. At first, they modeled three different e-moped scenarios for changing their numbers in Berlin, based on the multi-agent transport simulation framework. Then, the total cost for the service and a life cycle assessment were conducted. Their results showed that the service could replace a large part of all passenger car travel in Berlin. Takahashi et al. [25] evaluated the e-moped-sharing service in terms of GHG emissions and procurement costs during material production, as well as equipment costs for charging stations. They assumed two patterns about the number of e-mopeds; then, supplier selection was carried out to balance costs and GHG emissions for the both patterns. They discussed the GHG emissions and the cost of the service depending on charging stations and e-mopeds. However, they did not consider the user accessibility. A sharing service which ignores user accessibility make it difficult to maintain.
Wong et al. [26] conducted a survey in the USA to estimate willingness for the adoption of the smart charging program. It was determined that both financial and non-financial incentives were effective to participate in its program based on the survey. An incentive of USD 300–400 per year would guarantee that the majority of EV owners/leasers or buyers/leasers interested in EVs would certainly or probably participate in the program considering only the financial incentive. Carrese et al. [27] addressed the problem of optimally managing agents’ behavior specially hired by sharing companies to reposition electric scooters and guarantee the urban landscape. Repositioning is primarily intended to ensure a balanced distribution of vehicles within the service area to better meet demand and increase overall profits. The optimization model solution based on mathematical theory was shown to provide a high-value solution for commercial software. Saum et al. [28] suggested a new data-driven rebalancing framework of dockless shared e-scooters with Monte Carlo sampling to forecast demand. The framework was evaluated on real data from Minneapolis, Minnesota. It was found that overall demand and variance uncertainties were mitigated, and the driving distance and the rebalancing cost were smaller than those of the baseline case. In the above works, they did not address charging stations and supplier selection simultaneously. This study evaluates accessibility, GHG emissions, and cost in the e-moped sharing service by conducting charging station allocation and material supplier selection.

3. Methods

3.1. Overview of the Proposed 2-Stage Design of the E-Moped-Sharing Service

Figure 1 shows the overview of the proposed 2-stage design of e-moped-sharing service for accessibility, GHG emissions, and cost. The yellow and red highlight the decision makings and evaluation indexes in the proposed design method. The 1st stage determined the locations and number of charging stations based on the demand and a covered radius set in advance. The required number of e-mopeds was also determined because it depends on the number of charging stations. Conducting the 1st stage, accessibility such as average and maximal distances from demand points to the charging stations were calculated. The equipment cost of charging stations was also determined at the 1st stage.
The 2nd stage conducted the material supplier selection to satisfy material demands for the required number of e-mopeds decided at the 1st stage. Procurement costs and material-based GHG emissions were determined. The sum of equipment cost of charging stations and procurement cost was regarded as the total cost.
Finally, the results of charging station allocation and supplier selection were evaluated from the viewpoints of accessibility, GHG emissions, and cost.
Rigorous pseudocodes detailing the 2-stage approaches are as shown in Appendix A.

3.2. Formulation of the 1st Stage: Charging Station Allocation

The parameters, decision variables, and evaluation variables used in the set covering location problem and maximal covering location problem are as follows:
I ,   J Set of demand/charging station candidate points indexed by i ,   j
A i j 1 if the demand point i can be covered by candidate j , otherwise 0
W i User demand at demand point i
C s t a t i o n Cost to install a charging station
P Installed number of charging stations in maximal covering location problem
x j 1 if the charging station is installed at demand point j , otherwise 0
z i 1 if the demand point i is covered, otherwise 0
N s t a t i o n Number of charging stations
C D Cover demands
E C Equipment cost of charging stations

3.2.1. Set Covering Location Problem

The set covering location problem aims to minimize the number of facilities as all demand points are covered within a certain distance set as a parameter [11]. Feige [29] pointed out that the greedy algorithm and a linear programming relaxation were investigated as methods for solving the set covering location problem. Equation (1) is the objective function to minimize the number of charging stations N s t a t i o n . Equation (2) indicates the equipment cost of charging stations. Equation (3) ensures that all demand points must be covered.
N s t a t i o n = j J x j m i n
E C = C s t a t i o n N s t a t i o n
j J A i j x j 1 i I

3.2.2. Maximal Covering Location Problem

The maximal covering location problem aims to maximize the cover demand. In contrast to the set covering location problem, the number of stations is static and given as a parameter [11]. Equation (4) is the objective function to maximize the cover demands C D . Equation (5) expresses the equipment cost of charging stations, as well as the set covering location problem. Equation (6) ensures that the installed number of charging stations is equal to P . Equation (7) represents that at least 1 charging stations, which can cover demand point i , must be located if demand point i is covered.
C D = i I W i z i m a x
E C = C s t a t i o n P
j J x j = P
j J A i j x j z i i I

3.3. Formulation of the 2nd Stage: Supplier Selection

The parameters, decision variable, and evaluation variables used in supplier selection are as follows:
K Set of materials k
L Set of suppliers l
P C l k Procurement unit cost of material k in supplier l
E l k GHG emissions of material k in supplier l
N k Number of materials k required to produce one unit
N p r o d u c t Demand
E M a x GHG emissions in the baseline
ε Target reduction ratio of GHG emissions
f l k Amount of material k procured from supplier l
M C Material cost
E Total GHG emissions
Similar to Takahashi et al. [25], the supplier selection has a bi-objective function: minimizing material procurement cost and minimizing GHG emissions, as shown in Equations (8) and (9). The bi-objective supplier selection is solved using ε -constraint method [14,30]. Equation (10) represents the ε -constraint [30] for the total GHG emissions E . To obtain Pareto-optimal solutions, ε is gradually changed for each GHG-targeted reduction ratio.
Equation (11) shows that the sum of units’ amount of material k procured from supplier f l k is equal to the multiplied amount of material k required to produce one unit N k and the demand quantity N p r o d u c t . Demand N p r o d u c t depends on the number of charging stations determined at 1st stage. Thus, the results of charging station allocation at 1st stage affect the input parameter of supplier selection at 2nd stage. Equation (12) is a non-negative constraint.
M C = k K l L P C l k f l k m i n
E = k K l L E l k f l k
E ( 1 ε ) E M a x
l L f l k = N k N p r o d u c t k K
f l k 0 l L , k K

4. Numerical Experiments and Scenarios

4.1. Input Data and Assumptions of Numerical Experiments and Scenarios

Bochum city in Germany was used as a design example of the two-stage design of an e-moped-sharing service. It was assumed that there were three different sizes of a charging station determining operational e-mopeds per one charging station as shown in Table 2. The first stage was conducted based on the following six scenarios.
Treated facility location problems, namely the set covering and maximal covering location problems, require setting a cover radius in advance. Moreover, the maximal covering location problem also requires setting the number of charging stations. Scenarios small, middle, and large indicate the size of each charging station. The large charging station assumed that more e-mopeds could be installed and that cover radius was wilder, with more costs than small and middle ones.
Regarding the set covering location problems, only the cover radius is required to be set as a parameter to determine locations and number of charging stations. The cover radius was set 2, 4, and 6 (km) in the small, medium, and large stations, respectively. In the case of the maximal covering location problem, the cover radius and the number of charging stations are required to be set as parameters. In this numerical experiment, the cover radius was static, but the number of stations was changed among scenarios. As well as the set covering location problem, as the large station could install more e-mopeds, the number of charging stations was lower than the small and middle station scenarios. The difference between the set covering location problem and the maximal covering location problem in this paper is that the number of charging stations in the set covering location problem is unknown until it is solved, while the number of ones in the maximal covering location problem is static. Table 3 shows the assumptions and input data for each scenario.

4.2. Assumptions of Supplier Selection

Kumpan’s 1954 i model [5] was used to illustrate a design example. The 2nd stage was conducted based on three GHG reduction targets: 26%, 50%, and 70% reductions. As a result, 18 results were obtained through the 1st and 2nd stages. China, Japan, and Korea were assumed as material suppliers. GHG emissions and procurement costs were different among the three countries as shown in Table 4. The GHG emissions were estimated using the life cycle inventory (LCI) database with the Asian International Input-Output Table [31]. The procurement cost was estimated based on a census of manufacture and price level of each country using a decision support tool [32]. All 21 materials in e-mopeds could be supplied from the three countries with the same quality.

4.3. Results of Charging Station Allocations

  • Comparison of Accessibility
Table 5 represents the results of the accessibility for each scenario obtained at the 1st stage. Operational e-mopeds were calculated based on the number of charging stations N s t a t i o n / P . Cover rate C R represents the ratio of covered potential demands by installed charging stations against all potential demands in Bochum city. The e-mopeds per user were calculated by dividing the value of operational e-mopeds by the potential demands. Average distance A D and maximal distance M D were defined as the average distance and maximal distance between demand points and charging stations. From the perspective of accessibility, it is desirable that e-mopeds per user is greater and approaching one (unit/user). The number of e-mopeds per user becoming lower than one leads a risk of losing users as users cannot ride e-mopeds although they go to the charging stations. In the case of the set covering location problem, as all demands were satisfied, e-mopeds per user depends on only the number of operational e-mopeds. E-mopeds per user decreased as the number of stations and e-mopeds decreased in the set covering location problem. Then, the average distance A D and maximal distance M D increased in the set covering location problem because its cover area expanded.
In the case of the maximal covering location problem, users were changed among scenarios. In contrast to the set covering location problem, the number of stations decreased, and the number of e-mopeds increased in charging station scenarios from M1) and M2) to M3). Moreover, the covered users also decreased. There were trade-offs observed between operational e-mopeds, C R , e-mopeds per user, and A D . For example, operational e-mopeds and e-mopeds per user increased, and C R and A D decreased as charging stations decreased. This change means that users would have more opportunities to use e-mopeds, but more people would not benefit from the service. Additionally, more effort would be required to reach the charging stations. Thus, e-mopeds per user increased. Average distance A D increased in the maximal covering location problem as stations decreased.
The maximal distance M D , increased in the set covering location problem, whereas that in the maximal covering location problem was not changed as charging stations decreased. Additionally, over 75% demands were covered in scenarios M1), M2), and M3). Considering accessibility only, greater e-mopeds per user and shorter A D and M D are desirable. Therefore, it seems that scenario M1) should be adopted owing to the shortest A D and M D .
2.
Comparison of accessibility, GHG emissions, and cost
Figure 2 and Figure 3 represent the 18 results through the 1st and 2nd stages for the maximal distance against total costs per user and GHG emissions per user, respectively. As supplier selection in the 2nd stage was conducted using three GHG reduction ratios for each scenario, each one had three marks in Figure 2 and Figure 3, respectively. Scenario S1) had a lower total cost T C and GHG emissions E than scenarios M1), M2), and M3), as shown in Figure 2 and Figure 3. Moreover, scenario S1) achieved a larger reduction of maximal distance compared to scenarios S2) and S3), with a small increase of the total cost per user and GHG emissions per user, as shown in Figure 2 and Figure 3. The set covering location problem requires the additional installation cost of charging stations to cover the demand points with few users because all demand must be covered. In this study, the extra cost could be reduced by preparing smaller charging station scenarios.
Comparing the three results in scenario S1), the 70% GHG reduction target would be better than that of the 26% and 50% reductions because the total cost T C in the 70% reduction was 4.0% and 7.1%, which was only greater than that of 50% and 26% reductions.
ScenarioS1)S2)S3)M1)M2)M3)
ε 26%Energies 18 01644 i001Energies 18 01644 i002Energies 18 01644 i003Energies 18 01644 i004Energies 18 01644 i005Energies 18 01644 i006
50%Energies 18 01644 i007Energies 18 01644 i008Energies 18 01644 i009Energies 18 01644 i010Energies 18 01644 i011Energies 18 01644 i012
70%Energies 18 01644 i013Energies 18 01644 i014Energies 18 01644 i015Energies 18 01644 i016Energies 18 01644 i017Energies 18 01644 i018

5. Analysis of Charging Stations and Supplier Selections

This section analyzes the selected locations of charging stations and the selected suppliers in detail.

5.1. Analysis of Charging Stations in the First Stage

Figure 4, Figure 5 and Figure 6 show the results of set covering location problem. Red and blue points represent the demand/candidate for the charging stations. Red points are the demand points, where the charging stations were allocated. Blue points are the demand points, where the charging stations were NOT allocated. Grey circles represent the coverage radius.
In the case of scenario S1), most charging stations covered one demand point. Only one charging station was allocated in the center of Bochum city in spite of the high potential demand, and this may have caused a lost opportunity. Although the number of charging stations was no less than 12 units, there were non-covered areas, where areas were not colored by gray circles due to the small coverage radius. In the case of scenario S2), 4 charging stations were allocated in Bochum city, one in the east, west, north, and south areas, respectively. The western and northern charging stations covered six and seven demand points, whereas the southern and eastern ones covered two and four points, respectively. This was a little unbalanced in terms of where the charging stations were allocated. In the case of scenario S3), two charging stations were allocated by dividing the Bochum city into west and east areas. Covered users on the west side of Bochum city were at risk for lost opportunities because there were many demand points on the west side of Bochum city.
Figure 7, Figure 8 and Figure 9 show the allocation results of the charging station for the maximal covering location problem, where the number of them is a given value for each scenario. It is noted that the maximal covering location problem did not cover all demand points. In the case of scenario M1), almost all of Bochum city was covered by the covering area of the charging stations. Moreover, two charging stations were allocated in the central area in Bochum city, even though only one charging station could cover the demand points in the central area as shown in Figure 7. As shown in Figure 7, although the central area had the greatest potential demand, lost opportunity could be avoided by allocating two charging stations in the central area. In the case of scenario M2), 11 out of 12 demand points were covered by nine charging stations as shown in Figure 8. There was an area outside the coverage area in the southeastern region of the city. However, one non-covered demand point was relatively close to the allocated charging station in the southern area. In the case of scenario M3), charging stations were prioritized in the western area of the city, where there were many demand points. There were many non-covered demand points in the eastern area as shown in Figure 9.
Table 6 shows allocated charging stations for all scenarios. The ✓ represent the allocated charging stations. To pick out where demand points should be prioritized through the set covering and maximal covering location problems, two new indexes, namely geographical and demand importance, were introduced. Potential demand was assumed to be one-third of the population each district has [34].
The set covering location problem minimized the number of charging stations while satisfying all demand points. Thus, this allocation approach could prioritize the demand point in terms of the geographical viewpoint. Additionally, the selected demand points in scenarios S2) and S3) were considered as geographical importance points as shown in Table 6. On the other hand, as the demand was different, to obtain many users within the limited number of charging stations, the demand importance was introduced. The maximal covering location problem maximized the cover demand under a static number of charging stations. Then, the selected demand points in scenarios M2) and M3) were considered as demand importance points as shown in Table 6. Here, 11 demand points were picked out as geographical or demand importance points as shown in Table 6. The x in Table 6 denotes locations of geographical and demand importances. Comparing six scenarios, scenarios S1), M1), and M2) were better than the other scenarios as all of them allocated 9 out of 11 geographical and demand importance charging stations. The results in Section 4.1 show that scenario M1) was more appropriate than scenario M2) considering only accessibility. Therefore, next Section 5.2 will analyze the results of supplier selection for scenarios S1) and M1).

5.2. Analysis of Supplier Selections in the Second Stage

Figure 10 and Figure 11 show the breakdown of total cost T C and GHG emissions E for scenarios S1) and M1) with three GHG reduction targets. Section 4.3 stated that the 70% GHG reduction target should be adopted because the decrease of GHG emissions E was sharper than the increase of the total cost T C as the GHG reduction target increased. Figure 10 reveals that the equipment cost of charging stations E C , namely the fixed cost, accounted for more than 75% of the total cost T C .
In addition, material cost M C and GHG emissions E generated by supplier selections originated from China and Korea for the 26% and 50% GHG reduction targets. To achieve the 70% GHG reduction target, material suppliers were switched from China to Korea or Japan as shown in Figure 10 and Figure 11. As M C from Japan were little more than those from Korea at the 70% GHG reduction target, only little materials were procured. Perhaps, all materials could be supplied from Korea so as to save management efforts about procurement. Moreover, the supplier selections of scenarios S1) and M1) were almost the same behaviors. Therefore, it would be desirable to procure all materials from Korea to save M C , E , and management efforts for both scenarios S1) and M1).

5.3. Discussion

This section discusses research questions (RQs) in chapter 1 and their answers. The answers found from numerical experiments through 1st and 2nd stages are as follows:
RQ1. Which charging station scenarios about coverage radius and GHG reduction target should be adopted for the e-moped-sharing service?
The set covering and maximal covering location problems were conducted with different coverage radius depending on the charging stations. To compare six scenarios in terms of accessibility, A D , M D and e-mopeds per user were evaluated. As shown in Table 2, in the numerical experiments for the e-moped-sharing service in Bochum city, scenario M1), the maximal covering location problem with small charging stations should be adopted because the scenario had the lowest A D and M D . A D in scenario M1) became 0.54 (km) so that users could easily go to the charging station. Moreover, the scenario could cover all potential demands.
RQ2. How charging stations and material supplier selections should be combined for accessibility, GHG emissions, and cost?
The 1st stage obtained six results of charging station allocations by setting six scenarios of the coverage radius. The 2nd stage conducted material supplier selections with three different GHG reduction targets for each result obtained in the 1st stage. Then, 18 results through the 1st and 2nd stages were obtained. Total GHG emissions per user and total cost per user were compared as shown in Figure 2 and Figure 3. From Figure 2 and Figure 3, scenario S1) with a 70% GHG reduction target, was the most desirable for accessibility, GHG emissions, and cost. This is because scenario S1) had generally lower M D , GHG emissions, and cost per user as shown in Figure 2 and Figure 3. Moreover, the effects of decreasing GHG emissions with the 70% GHG reduction target were greater than those of increasing the total cost compared to the 26% and 50% GHG reduction targets.
RQ3. Which demand points should be prioritized to allocate charging stations through the set covering and maximal covering location problems?
To pick out prioritized demand points for geographical and demand satisfactory, geographical and demand importance were introduced as new indexes so that 11 demand points were prioritized as shown in Table 6. These 11 points, such as Bochum Hbf., Wattenscheid-Höntrop, and Bochum Langendreer, should be prioritized to set charging stations.
RQ4. Which suppliers should be selected for each material?
In the numerical experiments, Korean suppliers should be selected for all materials. By analyzing accessibility, GHG emissions, and cost through the 1st and 2nd stages, the 70% GHG reduction target would be better than the 26% and 50% ones. Although Japanese suppliers were also selected for little materials as shown in Figure 10 and Figure 11, all materials would be procured from Korean suppliers to save management efforts for contracting suppliers in different countries.

6. Conclusions

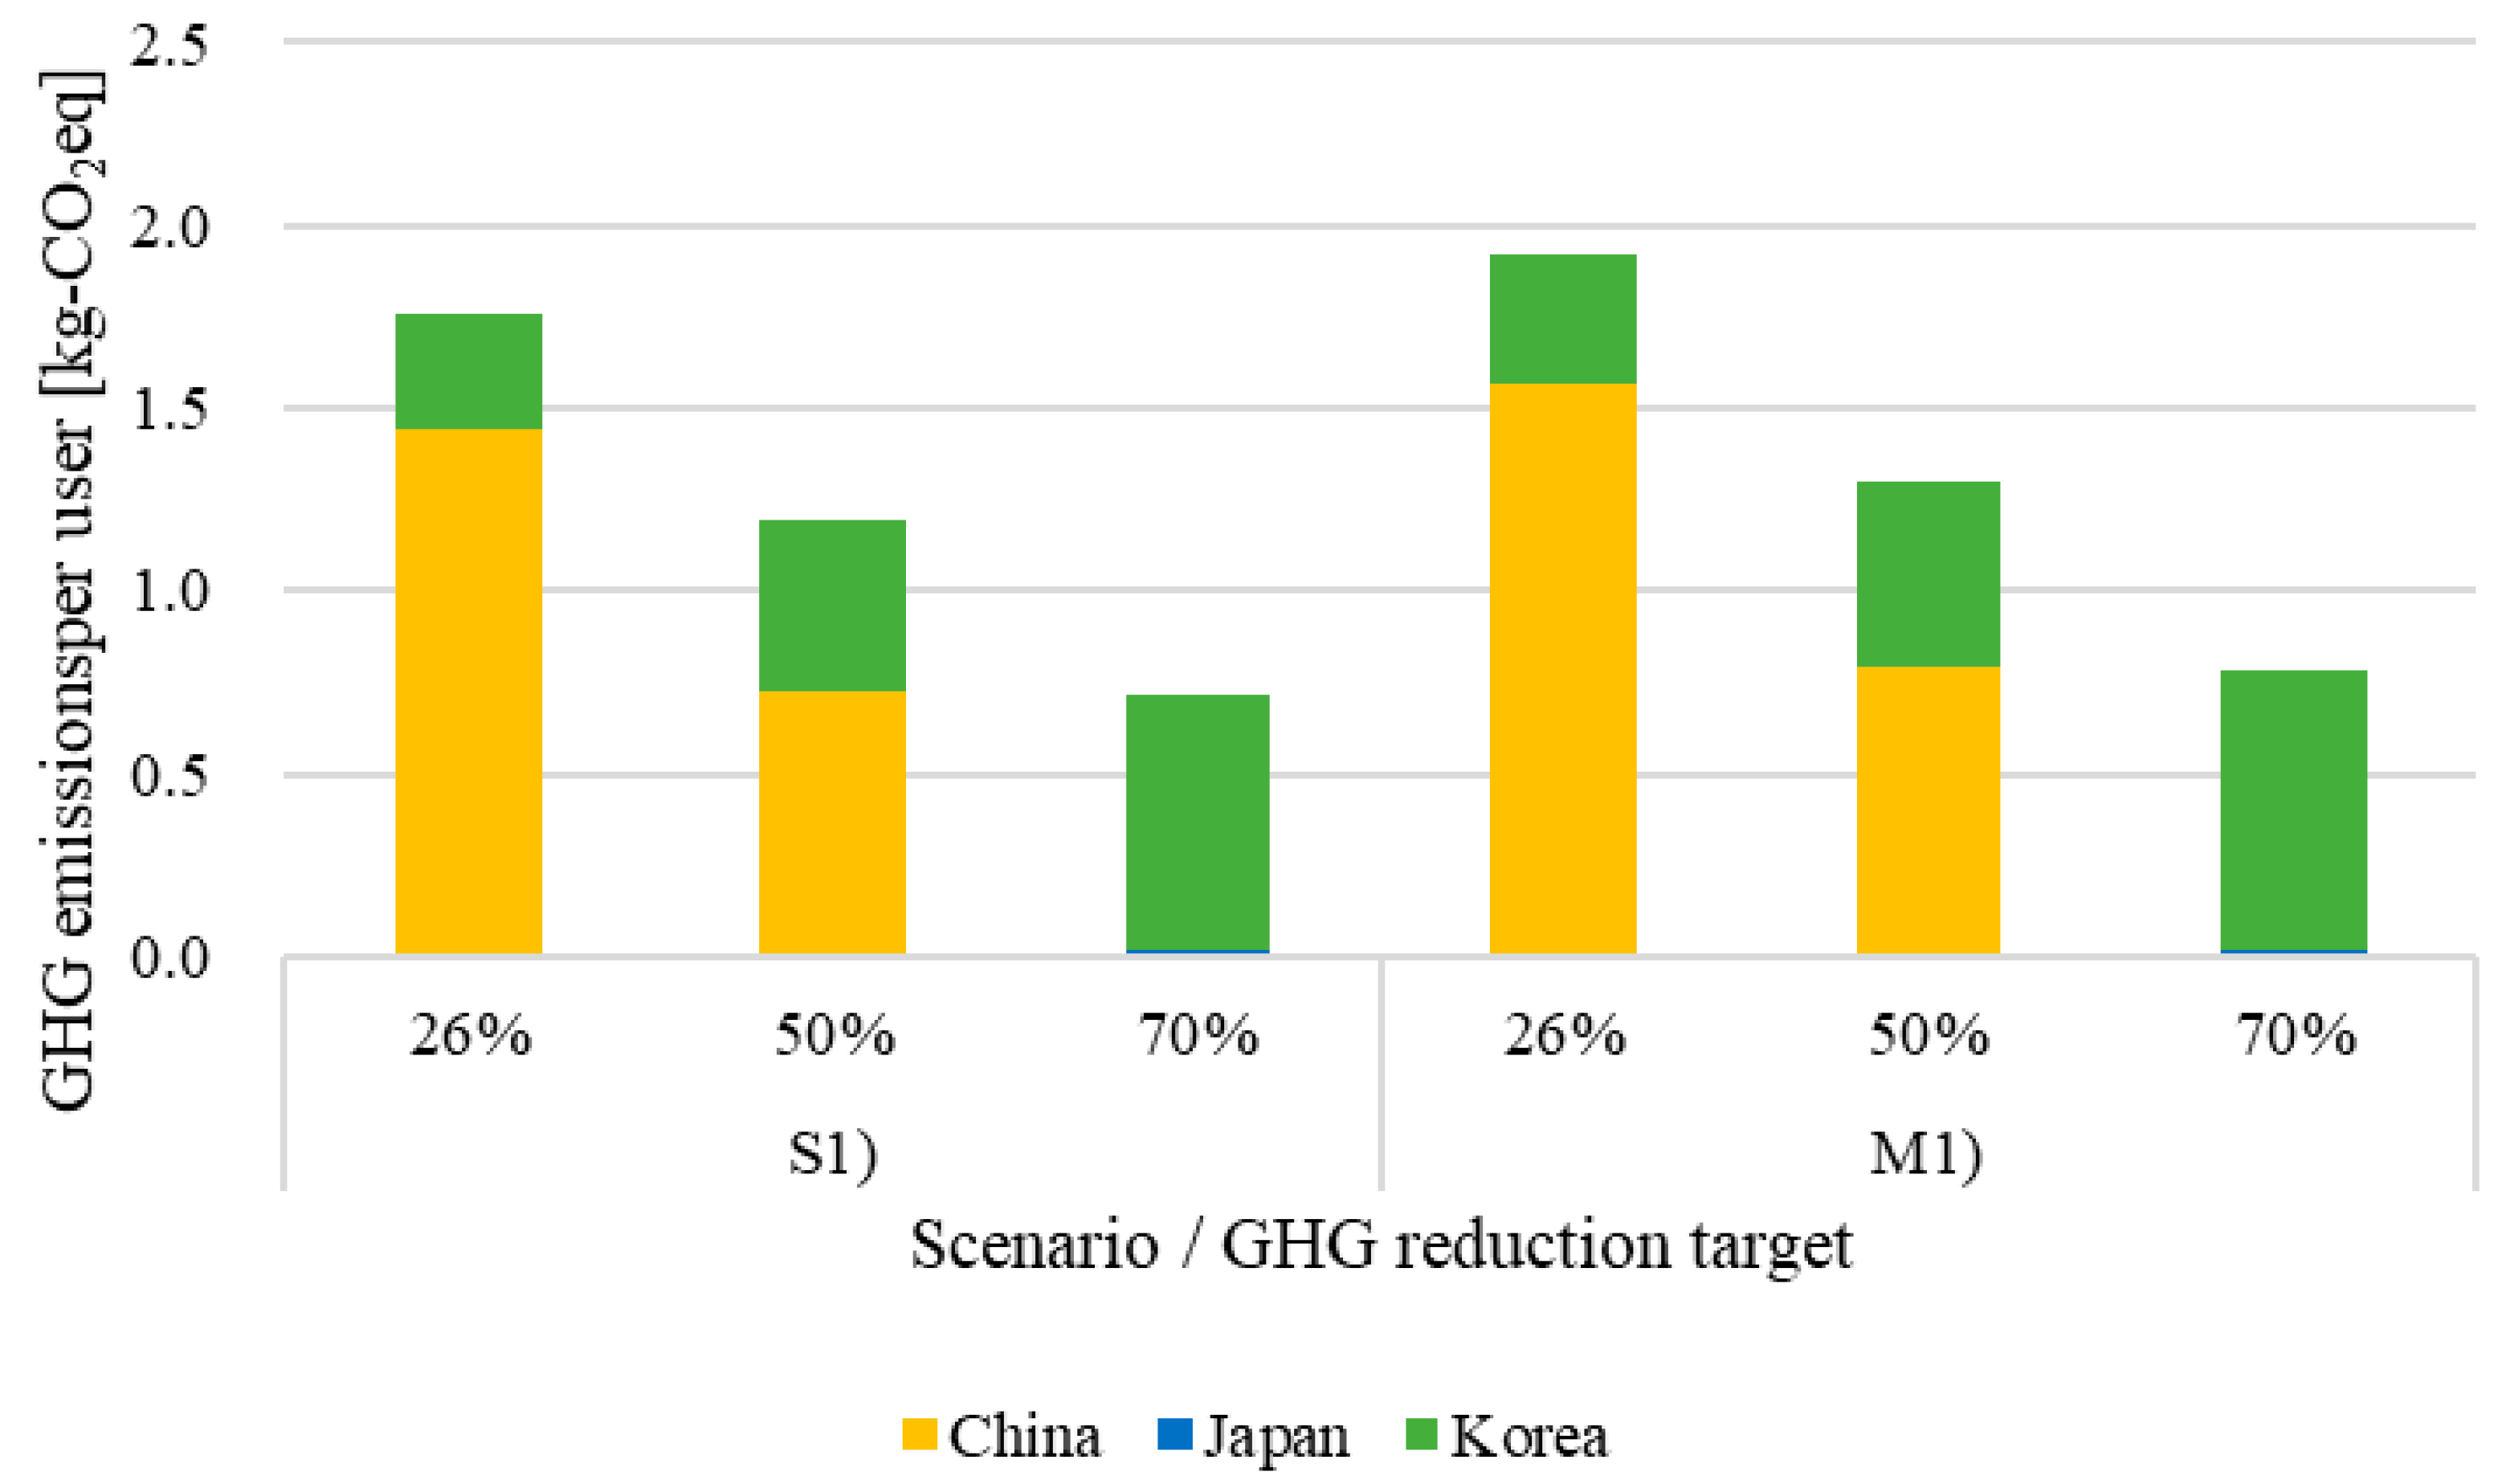
This study proposed a two-stage design of an e-moped-sharing service for accessibility, GHG emissions, and cost using integer programming. Moreover, analysis methods to determine the suitable demand points for charging stations and suppliers were presented and discussed to evaluate the e-moped-sharing service in the whole product life cycle. To illustrate a design example, installing the e-moped-sharing service in Bochum city was addressed, and Chinese, Japanese, and Korean suppliers were set to balance GHG emissions and procurement cost. One of the key findings is that in scenario M1), the maximal covering location problem with small charging stations should be adopted because the scenario had the lowest average and maximal distance.
The proposed two-stage design was designed for the e-moped-sharing service. The practical implications of this model are as follows:
  • One of the advantages is that the proposed method enables us to integrate and treat separated charging station and supplier selection problems together and to evaluate them in terms of accessibility, GHG emissions, and cost. The model can be also adopted to other sharing services such as car sharing and bike sharing. As long as geographic and population data are available, this two-stage planning is applicable in any country. To adjust adopted services, the coverage radius needs to be modified. Moreover, impacts of supplier selections in the 2nd stage will be dependent of adopted service features. For example, in the case of car sharing, the material supplier selections will be more important as cars require many materials. On the other hand, in a case of bike sharing, the importance of supplier selections will be decreased.
  • The proposed model also contributes to urban planning. Charging stations should be allocated to crowded areas such as train stations and shopping malls. Users of the e-moped-sharing service will move from a charging station to other stations. Thus, the charging station allocation could partially control flow of people so that traffic jam also could be decreased.
However, there are some limitations as follows:
  • All suppliers can provide all materials with the same quantity. Rare metals such as lithium and titanium are limited of their suppliers so that switching suppliers can be difficult. Therefore, additional constrains to limit supplier selections should be added to reflect these situations.
  • Only the same size of charging stations can be installed in 1st stage. Based on demand and land cost, it is desirable that their size should be adjusted. Based on the results in the 1st stage, a decisionmaker would be required to change the allocated station sizes manually.
  • Updating and maintenance processes were not considered. Both charging stations and e-mopeds are required to be updated and conducted the maintenance. The number of them will affect the GHG emissions and cost of these processes by replacing charging stations and e-mopeds.
Future studies should consider the manufacturing cost of e-mopeds and the land cost of charging stations. GHG emissions of the e-moped manufacturing and charging stations should also be added and evaluated. Furthermore, the facility location problem should be developed to install the different sizes of charging stations simultaneously so as to adjust their size based on demands of each point. In addition, the perspective of the real local traffic situation is lacking and should be investigated. If traffic jams are a regular problem near installed charging stations, this will have a negative impact on user accessibility. Also, tariff costs are not taken into account when procuring materials for e-mopeds. Free trade agreements (FTA) such as the EU and CPTPP will have a significant impact on where they are procured. Finally, the joint optimization problem should be applied to the e-moped-sharing service.

Author Contributions

S.T., Y.K. and T.Y. conceptualized the goals and aims of this study and provided resources. S.T. and T.Y. designed the methodology. T.Y. acquired funds. S.T. and N.S. generated metadata and formulated and operated the numerical experiments. Additionally, S.T. programmed and validated the formulation, visualized the results, and wrote the original draft. Y.K., S.S. and T.Y. managed this project and supervised the overall content and reviewed this paper. Finally, Y.K., N.S. and S.S. revised the paper. All authors have read and agreed to the published version of the manuscript.

Funding

This study was partially supported by the Japan Society for the Promotion of Science (JSPS), KAKENHI, Grant-in-Aid for Scientific Research (B), JP23K26329, from 2023 to 2025.

Data Availability Statement

The most of original contributions presented in the study are included in the article.

Acknowledgments

The authors would like to thank Thomas Spelten in the Bochum University of Applied Sciences for his fruitful comments.

Conflicts of Interest

The authors declare no conflicts of interest.

Appendix A. Rigorous Pseudocodes for the Proposed 2-Stage Design

Algorithm A1 1-A Set covering location problem
Input: i , j (demand point/charging station candidate), d i j (distance from i to j );
Output: x j (whether the charging station is allocated at j );
1: let x j denote the best solution found
2: R 2 //coverage radius
3: while R 6
4:  initialize square matrix A i j with size i × j
5:  if d i j R
6:      A i j = 1
7:  else
8:      A i j = 0
9:  end if
10:  run the exact search based on Equations (1) and (3) for x j
11:   R R + 2
12: end while
13: return x j
Algorithm A2 1-B Maximal covering location problem
Input: i , j (demand point/charging station candidate), d i j (distance from i to j ), W i (user demands at i );
Output: C D (cover demands);
1: let x j denote the best solution found
2: P = 6 //the number of charging stations
3: while P 12
4:  initialize square matrix A i j with size i × j
5:  if d i j 2
6:      A i j = 1
7:  else
8:      A i j = 0
9:  end if
10:  run the exact search based on Equations (4), (6) and (7) for x j
11:   P P + 3
12: end while
13: return C D
Algorithm A3 2 Material supplier selection
Input: P C l k (Procurement unit cost of material k in supplier l ), E l k (GHG emissions of material k in supplier l ), N k (Number of material k required to produce one unit), N p r o d u c t (Demand), E M a x (GHG emissions in the baseline);
Output: M C (material cost), E (total GHG emissions);
1: let f l k denote the best solution found
2: for ε = 0.26 , 0.5 , 0.7
3:  run the exact search based on Equations (8)–(12) for f l k
4: end for
5: return M C , E

References

  1. Going Climate-Neutral by 2050—A Strategic Long-Term Vision for a Prosperous, Modern, Competitive and Climate-Neutral EU Economy. Available online: https://op.europa.eu/en/publication-detail/-/publication/92f6d5bc-76bc-11e9-9f05-01aa75ed71a1/language-en (accessed on 21 November 2024).
  2. Regulation (EU) 2023/851 of the European Parliament and of the Council of 19 April 2023 Amending Regulation (EU) 2019/631 as Regards Strengthening the CO2 Emission Performance Standards for New Passenger Cars and New Light Commercial Vehicles in Line with the Union’s Increased Climate Ambition (Text with EEA Relevance). Available online: https://eur-lex.europa.eu/eli/reg/2023/851/oj (accessed on 21 November 2024).
  3. Cars, Planes, Trains: Where Do CO2 Emissions from Transport Come from? Available online: https://ourworldindata.org/co2-emissions-from-transport (accessed on 3 February 2023).
  4. Honda to End Production of 50cc Mopeds in May 2025 due to Stricter Regulations. Available online: https://www.nikkei.com/article/DGXZQOUC101QS0Q4A610C2000000/?msockid=2b44e3358b9c6a850ac3edc88a766bb9 (accessed on 16 October 2024). (In Japanese).
  5. Schelte, N.; Severengiz, S.; Schünemann, J.; Finke, S.; Bauer, O.; Metzen, M. Life cycle assessment on electric moped scooter sharing. Sustainability 2021, 13, 8297. [Google Scholar] [CrossRef]
  6. UNU Launches Global Moped Sharing Market Report 2020. Available online: https://unumotors.com/en-de/unu-launches-global-moped-sharing-market-report-2020/ (accessed on 28 November 2024).
  7. Global Moped Sharing Market Report 2022. Available online: https://go.invers.com/en/resources/global-moped-sharing-market-report-2022?utm_campaign=GMSMR%202022&utm_medium=mopedsharing.com&utm_source=referral (accessed on 21 November 2024).
  8. Wang, Y.J.; Kuo, Y.H.; Huang, G.Q.; Gu, W.; Hu, Y. Dynamic demand-driven bike station clustering. Transp. Res. Part E Logist. Transp. Rev. 2022, 160, 102656. [Google Scholar]
  9. He, S.Y.; Kuo, Y.H.; Sun, K.K. The spatial planning of public electric vehicle charging infrastructure in a high-density city using a contextualised location-allocation model. Transp. Res. Part A Policy Pract. 2022, 160, 21–44. [Google Scholar]
  10. Owen, S.H.; Daskin, M.S. Strategic facility location: A review. Eur. J. Oper. Res. 1998, 111, 423–447. [Google Scholar] [CrossRef]
  11. Daskin, M.S. What you should know about location modeling. Nav. Res. Logist. 2008, 55, 283–294. [Google Scholar]
  12. Sustainability Report 2023. Available online: https://global.sharp/corporate/eco/report/pdf/ssr2023_e.pdf?v=2023 (accessed on 16 October 2024).
  13. Wortmann, C.; Syré, A.M.; Grahle, A.; Göhlich, D. Analysis of electric moped scooter sharing in Berlin: A technical, economic and environmental perspective. World Electr. Veh. J. 2021, 12, 96. [Google Scholar] [CrossRef]
  14. Kondo, R.; Kinoshita, Y.; Yamada, T. Green Procurement Decisions with Carbon Leakage by Global Suppliers and Order Quantities under Different Carbon Tax. Sustainability 2019, 11, 3710. [Google Scholar] [CrossRef]
  15. Liu, Y.; Ji, Y.; Jiao, R.J. A Stackelberg Solution to Joint Optimization Problems: A Case Study of Green Design. Procedia Comput. Sci. 2013, 16, 333–342. [Google Scholar] [CrossRef]
  16. Csiszár, C.; Csonka, B.; Földes, D.; Wirth, E.; Lovas, T. Urban public charging station locating method for electric vehicles based on land use approach. J. Transp. Geogr. 2019, 74, 173–180. [Google Scholar]
  17. García, Á.A.; Gomez, J.; Sobrino, N.; Díaz, J.J.V. Moped scooter sharing: Citizens’ perceptions, users’ behavior, and implications for urban mobility. Sustainability 2021, 13, 6886. [Google Scholar] [CrossRef]
  18. Polo, G.; Acosta, C.M.; Ferreira, F.; Dias, R.A. Location-allocation and accessibility models for improving the spatial planning of public health services. PLoS ONE 2015, 10, e0119190. [Google Scholar] [CrossRef] [PubMed]
  19. Schelte, N.; Severengiz, S.; Finke, S.; Stommel, J. Analysis on user acceptance for light electric vehicles and novel charging infrastructure. In Proceedings of the IEEE European Technology and Engineering Management Summit, Bilbao, Spain, 9–11 March 2022. [Google Scholar]
  20. Vazifeh, M.M.; Zhanga, H.; Santia, P.; Ratti, C. Optimizing the deployment of electric vehicle charging stations using pervasive mobility data. Transp. Res. Part A Policy Pract. 2019, 121, 75–91. [Google Scholar] [CrossRef]
  21. Bai, X.; Chinc, K.S.; Zhou, Z. A bi-objective model for location planning of electric vehicle charging stations with GPS trajectory data. Comput. Ind. Eng. 2019, 128, 591–604. [Google Scholar] [CrossRef]
  22. Chen, T.D.; Kockelman, K.M. Carsharing’s life-cycle impacts on energy use and greenhouse gas emissions. Transp. Res. Part D Transp. Environ. 2016, 47, 276–284. [Google Scholar] [CrossRef]
  23. Schelte, N.; Straßberger, H.; Severengiz, S.; Finke, S.; Felmingham, B. Environmental impact of off-grid solar charging stations for urban micromobility services. In Proceedings of the IEEE European Technology and Engineering Management Summit, Dortmund, Germany, 18–20 March 2021. [Google Scholar]
  24. Baptista, P.; Meloa, S.; Rolim, C. Energy, environmental and mobility impacts of car-sharing systems. empirical results from Lisbon, Portugal. Procedia—Soc. Behav. Sci. 2014, 111, 28–37. [Google Scholar] [CrossRef]
  25. Takahashi, S.; Kinoshita, Y.; Schelte, N.; Spelten, T.; Severengiz, S.; Yamada, T. Comparison of different procurement options and influence on greenhouse gas emissions: Case of Bochum city. In Proceedings of the 7th Asian Conference of Management Science and Applications, Okinawa, Japan, 15–17 December 2023. [Google Scholar]
  26. Wong, S.D.; Shaheen, S.A.; Martin, E.; Uyeki, R. Do incentives make a difference? Understanding smart charging program adoption for electric vehicles. Transp. Res. Part C Emerg. Technol. 2023, 151, 104123. [Google Scholar] [CrossRef]
  27. Carrese, S.; D’Andreagiovanni, F.; Giacchetti, T.; Nardin, A.; Zamberlan, L. A Beautiful Fleet: Optimal Repositioning in E-scooter Sharing Systems for Urban Decorum. Transp. Res. Procedia 2021, 52, 581–588. [Google Scholar] [CrossRef]
  28. Saum, N.; Sugiura, S.; Piantanakulchai, M. Optimizing Shared E-Scooter Operations Under Demand Uncertainty: A Framework Integrating Machine Learning and Optimization Techniques. IEEE Access 2024, 12, 26957–26977. [Google Scholar] [CrossRef]
  29. Feige, U. A Threshold of ln n for Approximating Set Cover. J. ACM 1998, 45, 634–652. [Google Scholar] [CrossRef]
  30. Eskandarpour, M.; Dejax, P.; Miemczyk, J.; Péton, O. Sustainable supply chain network design: An optimization-oriented review. Omega 2015, 54, 11–32. [Google Scholar] [CrossRef]
  31. Horiguchi, K.; Tsujimoto, M.; Yamaguchi, H.; Itsubo, N. Development of greenhouse gases emission intensity in eastern Asia using Asian international input-output table. In Proceedings of the 7th Meeting of the Institute of Life Cycle Assessment, Chiba, Japan, 24–28 January 2011. [Google Scholar]
  32. Umeta, K.; Kondo, R.; Kinoshita, Y.; Yamada, T.; Yamada, S.; Inoue, M. Development of a decision support tool for GHG emissions and procurement costs with material recommendation. Jpn. Soc. Des. Eng. 2020, 55, 277–294. (In Japanese) [Google Scholar]
  33. OpenStreetMap®. Available online: https://www.openstreetmap.org/copyright/en (accessed on 27 November 2024).
  34. Die Wichtigsten Zahlen zur Bochumer Bevölkerung/Bevölkerung Aktuell. Available online: https://www.bochum.de/Referat-fuer-politische-Gremien-Buergerbeteiligung-und-Kommunikation/Statistik/Die-wichtigsten-Zahlen-zur-Bochumer-Bevoelkerung (accessed on 1 February 2024). (In German).
Figure 1. The overview of the proposed 2-stage design of an e-moped-sharing service for accessibility, GHG emissions, and cost.
Energies 18 01644 g001
Figure 2. Comparison of accessibility and cost through the 1st and 2nd stages.
Energies 18 01644 g002
Figure 3. Comparison of accessibility and GHG emissions through the 1st and 2nd stages.
Energies 18 01644 g003
Figure 4. Selected and covered demand in the 1st stage for scenario S1), map source: OpenStreetMap® [33].
Energies 18 01644 g004
Figure 5. Selected and covered demand in the 1st stage for scenario S2).
Energies 18 01644 g005
Figure 6. Selected and covered demand in the 1st stage for scenario S3).
Energies 18 01644 g006
Figure 7. Selected and covered demand in the 1st stage for scenario M1).
Energies 18 01644 g007
Figure 8. Selected and covered demand in the 1st stage for scenario M2).
Energies 18 01644 g008
Figure 9. Selected and covered demand in the 1st stage for scenario M3).
Energies 18 01644 g009
Figure 10. Breakdown of total cost T C for scenarios S1) and M1) with 3 target GHG reduction ratios.
Energies 18 01644 g010
Figure 11. Breakdown of GHG emissions E for scenarios S1) and M1) with 3 target GHG reduction ratios.
Energies 18 01644 g011
Table 1. Literature review on facility location problems and LCA.
ViewpointAccessibilityGHG EmissionsCostResearch Target
Evaluation IndicesDemandDistanceTimeProcurementUsageRenewable EnergyStationVehicle
Csiszár et al. [16] charging stations
García et al. [17] moped-style scooter sharing
He et al. [9] EV charging facilities
Polo et al. [18] public health services
Schelte et al. [19] user acceptance
Vazifeh et al. [20] public charging stations
Bai et al. [21] EV charging stations
Chen and Kockelman [22] car sharing
Schelte et al. [5] e-moped-sharing service
Schelte et al. [23] off-grid charging station
Baptista et al. [24] car sharing
Wortmann et al. [13] e-moped-sharing system
Takahashi et al. [25] e-moped-sharing service
Wong et al. [26] smart charging programs for EVs
Carrese et al. [27] reposition of e-scooters
Saum et al. [28] dockless shared e-scooters
This study charging stations and e-moped-sharing service
Table 2. The 6 scenarios of the 1st stage.
SmallMiddleLarge
Set covering location problemS1)S2)S3)
Maximal covering location problemM1)M2)M3)
Table 3. The assumptions and input data for each scenario.
ScenarioS1)S2)S3)M1)M2)M3)
Operational e-mopeds
per 1 charging station
169.5367.0565.0169.4345.1564.8
Cost to install a charging station Cstation (×104 USD)5121851118
Coverage radius (km)246222
Installed number of
charging stations P
---1296
Table 4. The BOM of e-mopeds.
No.Material NameWeights (g)Procurement Cost (USD)GHG Emissions (g-CO2eq)
ChinaJapanKoreaChinaJapanKorea
1Acrylonitrile10,1006141062,65814,07521,420
2Aluminum alloy18,500174027120,33318,44123,338
3Malleable iron pipe fittings
(including flange type)
230.070.160.11637119214
4Other nonferrous metals (from primary smelting and refining)40.010.020.0156911
5Copper wire93824311,35617402202
6Copper wire212132770011801493
7Copper wire410.350.820.562482380481
8Plain plate glass9024211,74822213081
9Light bulbs227151030,30351088563
10Synthetic Fiber Sewing Thread269253644817962593
11Lithium-ion battery6440790618,38612,50319,725,0725,707,1498,301,380
12Polycarbonate2100.260.610.421867471789
13Polyethylene8650.5310.8437739511595
14Methacrylic resin1460.170.380.261171295495
15Polypropylene12,3007171251,85513,07221,920
16Fluoropolymer31938523,41359029897
17Printed circuit board4290254636120592145
18Synthetic rubber
(Synthetic latex included)
89509221597,58121,91933,358
19Cast-iron pipe176025318,08133856077
20Tin free steel408025318,16234006104
21Zinc alloy150.010.020.01651013
Table 5. The results of the accessibility for 6 scenarios.
ScenarioS1)S2)S3)M1)M2)M3)
N s t a t i o n / P 11421296
Operational e-mopeds186414681130203331063389
C R (%)1001001001009276
E-mopeds per user (×10−2)0.500.390.300.550.901.19
A D (km)0.592.043.640.540.640.72
M D (km)1.773.895.791.771.771.77
Table 6. Allocated charging stations for each charging station scenarios.
City DistrictDemand Point/
Charging Station Candidate
Potential DemandScenarioGeographical ImportanceDemand Importance
S1)S2)S3)M1)M2)M3)
Bochum-MitteBochum Hbf.34,858 x
Vonovia Ruhrstadion34,858 x
Bochum Breslauer Str.34,858 x
Bochum-WattenscheidWattenscheid24,446
Wattenscheid-Höntrop24,446 xx
Bochum Ulrichstr.24,446 x
Bochum-NordHeinrichstraße11,837
Bochum Ruhr Park11,837
Bochum Nordbad11,837 x
Bochum-OstBochum Langendreer17,776xx
Bochum-Langendreer West17,776
Auf dem Jäger–Bochum17,776
Bochum-SüdBochum Ruhr-Universität17,006 x
Bochum-Ehrenfeld17,006
Bochum Haarstr.17,006 x
Bochum-SüdwestBochum Südbad18,362
Bochum Dahlhausen18,362 x
Bochum Weitmar Mitte18,362 xx
Disclaimer/Publisher’s Note: The statements, opinions and data contained in all publications are solely those of the individual author(s) and contributor(s) and not of MDPI and/or the editor(s). MDPI and/or the editor(s) disclaim responsibility for any injury to people or property resulting from any ideas, methods, instructions or products referred to in the content.

