Article

Enhancing the Energy Efficiency of a Proton Exchange Membrane Fuel Cell with a Dead-Ended Anode Using a Buffer Tank

by
Trung-Huong Tran
1,
Karthik Kannan
1,*,
Amornchai Arpornwichanop
2 and
Yong-Song Chen
1,*
1
Department of Mechanical Engineering, Advanced Institute of Manufacturing with High-tech Innovations, National Chung Cheng University, Chiayi 621301, Taiwan
2
Center of Excellence in Process and Energy Systems Engineering, Department of Chemical Engineering, Faculty of Engineering, Chulalongkorn University, Bangkok 10330, Thailand
*
Authors to whom correspondence should be addressed.
Energies 2025, 18(13), 3342; https://doi.org/10.3390/en18133342
Submission received: 23 April 2025 / Revised: 20 June 2025 / Accepted: 20 June 2025 / Published: 25 June 2025

Abstract

Enhancing energy efficiency is essential for proton exchange membrane fuel cells (PEMFCs) operating in a dead-ended anode (DEA) mode. This study proposes the integration of a buffer tank, positioned between the mass flow meter and the fuel cell, to reduce hydrogen loss during purge events. The buffer tank stores hydrogen when the purge valve is closed and releases it when the valve opens, thereby stabilizing anode pressure, minimizing hydrogen waste, and improving overall system efficiency. The effectiveness of the buffer tank is experimentally evaluated under varying load currents, hydrogen supply pressures, purge intervals, and purge durations. The objective is to determine the optimal purge duration that maximizes energy efficiency, both with and without the buffer tank. The results show that the buffer tank consistently improves energy efficiency. Under optimal conditions (0.1 bar, 8 A, 0.1 s purge duration, and 20 s purge interval), efficiency increases by 3.3%. Under non-optimal conditions (0.1 bar, 1 A, 0.1 s purge duration, and 20 s interval), the improvement reaches 71.9%, demonstrating the buffer tank’s effectiveness in stabilizing performance across a wide range of operating conditions.

1. Introduction

Clean, renewable, and reliable energy is increasingly displacing fossil fuels in applications such as electric vehicles, unmanned underwater vehicles (UUVs), and unmanned aerial vehicles (UAVs). Among competing technologies such as batteries, ultracapacitors, wireless charging, and nuclear sources, proton exchange membrane fuel cells (PEMFCs) stand out due to their low operating temperature, high power density, compactness, rapid start-up, and suitability for intermittent loads [1,2,3]. However, challenges related to fuel efficiency and hydrogen utilization persist.
To simplify system architecture, many PEMFCs adopt a DEA configuration, in which hydrogen is supplied through a pressure regulator at the anode inlet, and a normally closed solenoid valve at the outlet periodically opens to purge accumulated water and nitrogen [4,5]. This eliminates the need for a recirculation loop, reducing system complexity, weight, and cost. However, nitrogen and water vapor can diffuse from the cathode to the anode, accumulating and causing localized hydrogen starvation, voltage drop, and even catalyst degradation [6,7,8,9,10]. Regular anode purging mitigates these issues, but it also results in hydrogen loss, which compromises overall efficiency. The extent of hydrogen loss during purging depends on several factors, including anode pressure, temperature, purge interval, and flooding conditions. Due to residual hydrogen and water in the channel, fixed purge schedules often fail to achieve optimal performance [11]. Hence, it is critical to optimize both purge duration and interval to enhance energy efficiency [12].
Numerous studies have examined the role of the purge strategy in PEMFC performance. Yikang et al. [13] analyzed how current density, cathode flow rate, recirculation, and pressure affect voltage decay during purging. Stephan et al. [14] demonstrated that purging improves performance under wet conditions but causes voltage dips under dry conditions due to reduced hydrogen partial pressure. Tsai et al. [12] found that higher current densities require longer purge durations to maintain energy efficiency.
Several researchers have proposed purge strategies to improve PEMFC performance. Chen et al. [15] optimized purge intervals and cycle duration by regulating inlet pressure, reducing hydrogen loss. Heras et al. [16] showed that managing mass flow alone is insufficient for DEA systems, highlighting the need for system-level optimization. Choi et al. [17] found that tripling purge intervals significantly improved efficiency. Okedi et al. [18] developed a load-adaptive purge strategy. Gomez et al. [19] demonstrated that optimizing purge period, duration, and stoichiometry improves long-term performance. Hu et al. [4] confirmed that frequent purging stabilizes stack voltage but may increase hydrogen loss.
Recent works further refine purge control in DEA-PEMFCs. Yang et al. [20] investigated transient water dynamics during purging and highlighted the role of purge timing in performance stabilization. Zhang et al. [21] explored shutdown purge characteristics, identifying purge duration and timing as key to effective residual water removal. Yu et al. [22] conducted experimental studies on hydrogen utilization in air-cooled PEMFC stacks, demonstrating that a novel anode outlet design can significantly enhance hydrogen usage efficiency by reducing waste and improving fuel delivery under various operating conditions. Wang et al. [23] introduced a salp swarm optimization algorithm with chaotic mapping and dynamic learning to tune purge parameters, enhancing hydrogen utilization. Gong et al. [24] identified optimal conditions and control strategies in open-cathode, air-cooled PEMFCs. Liu et al. [25] proposed techniques to mitigate starvation under cyclic loading via purge control and flow field design.
Effective purge control is vital for enhancing the efficiency of DEA PEM fuel cell systems. While prior research has primarily focused on optimizing purge timing and duration, this study introduces a novel strategy: incorporating a buffer tank between the mass flow meter and the fuel cell. The buffer tank stores hydrogen during the closed phase of the purge valve cycle and releases it during purging, thereby stabilizing hydrogen pressure and reducing fuel loss. This configuration is evaluated systematically across a range of operating conditions, including different load currents, inlet pressures, purge durations, and intervals. Experimental results demonstrate that the buffer tank significantly enhances energy efficiency and overall system performance.

2. Experimental Section

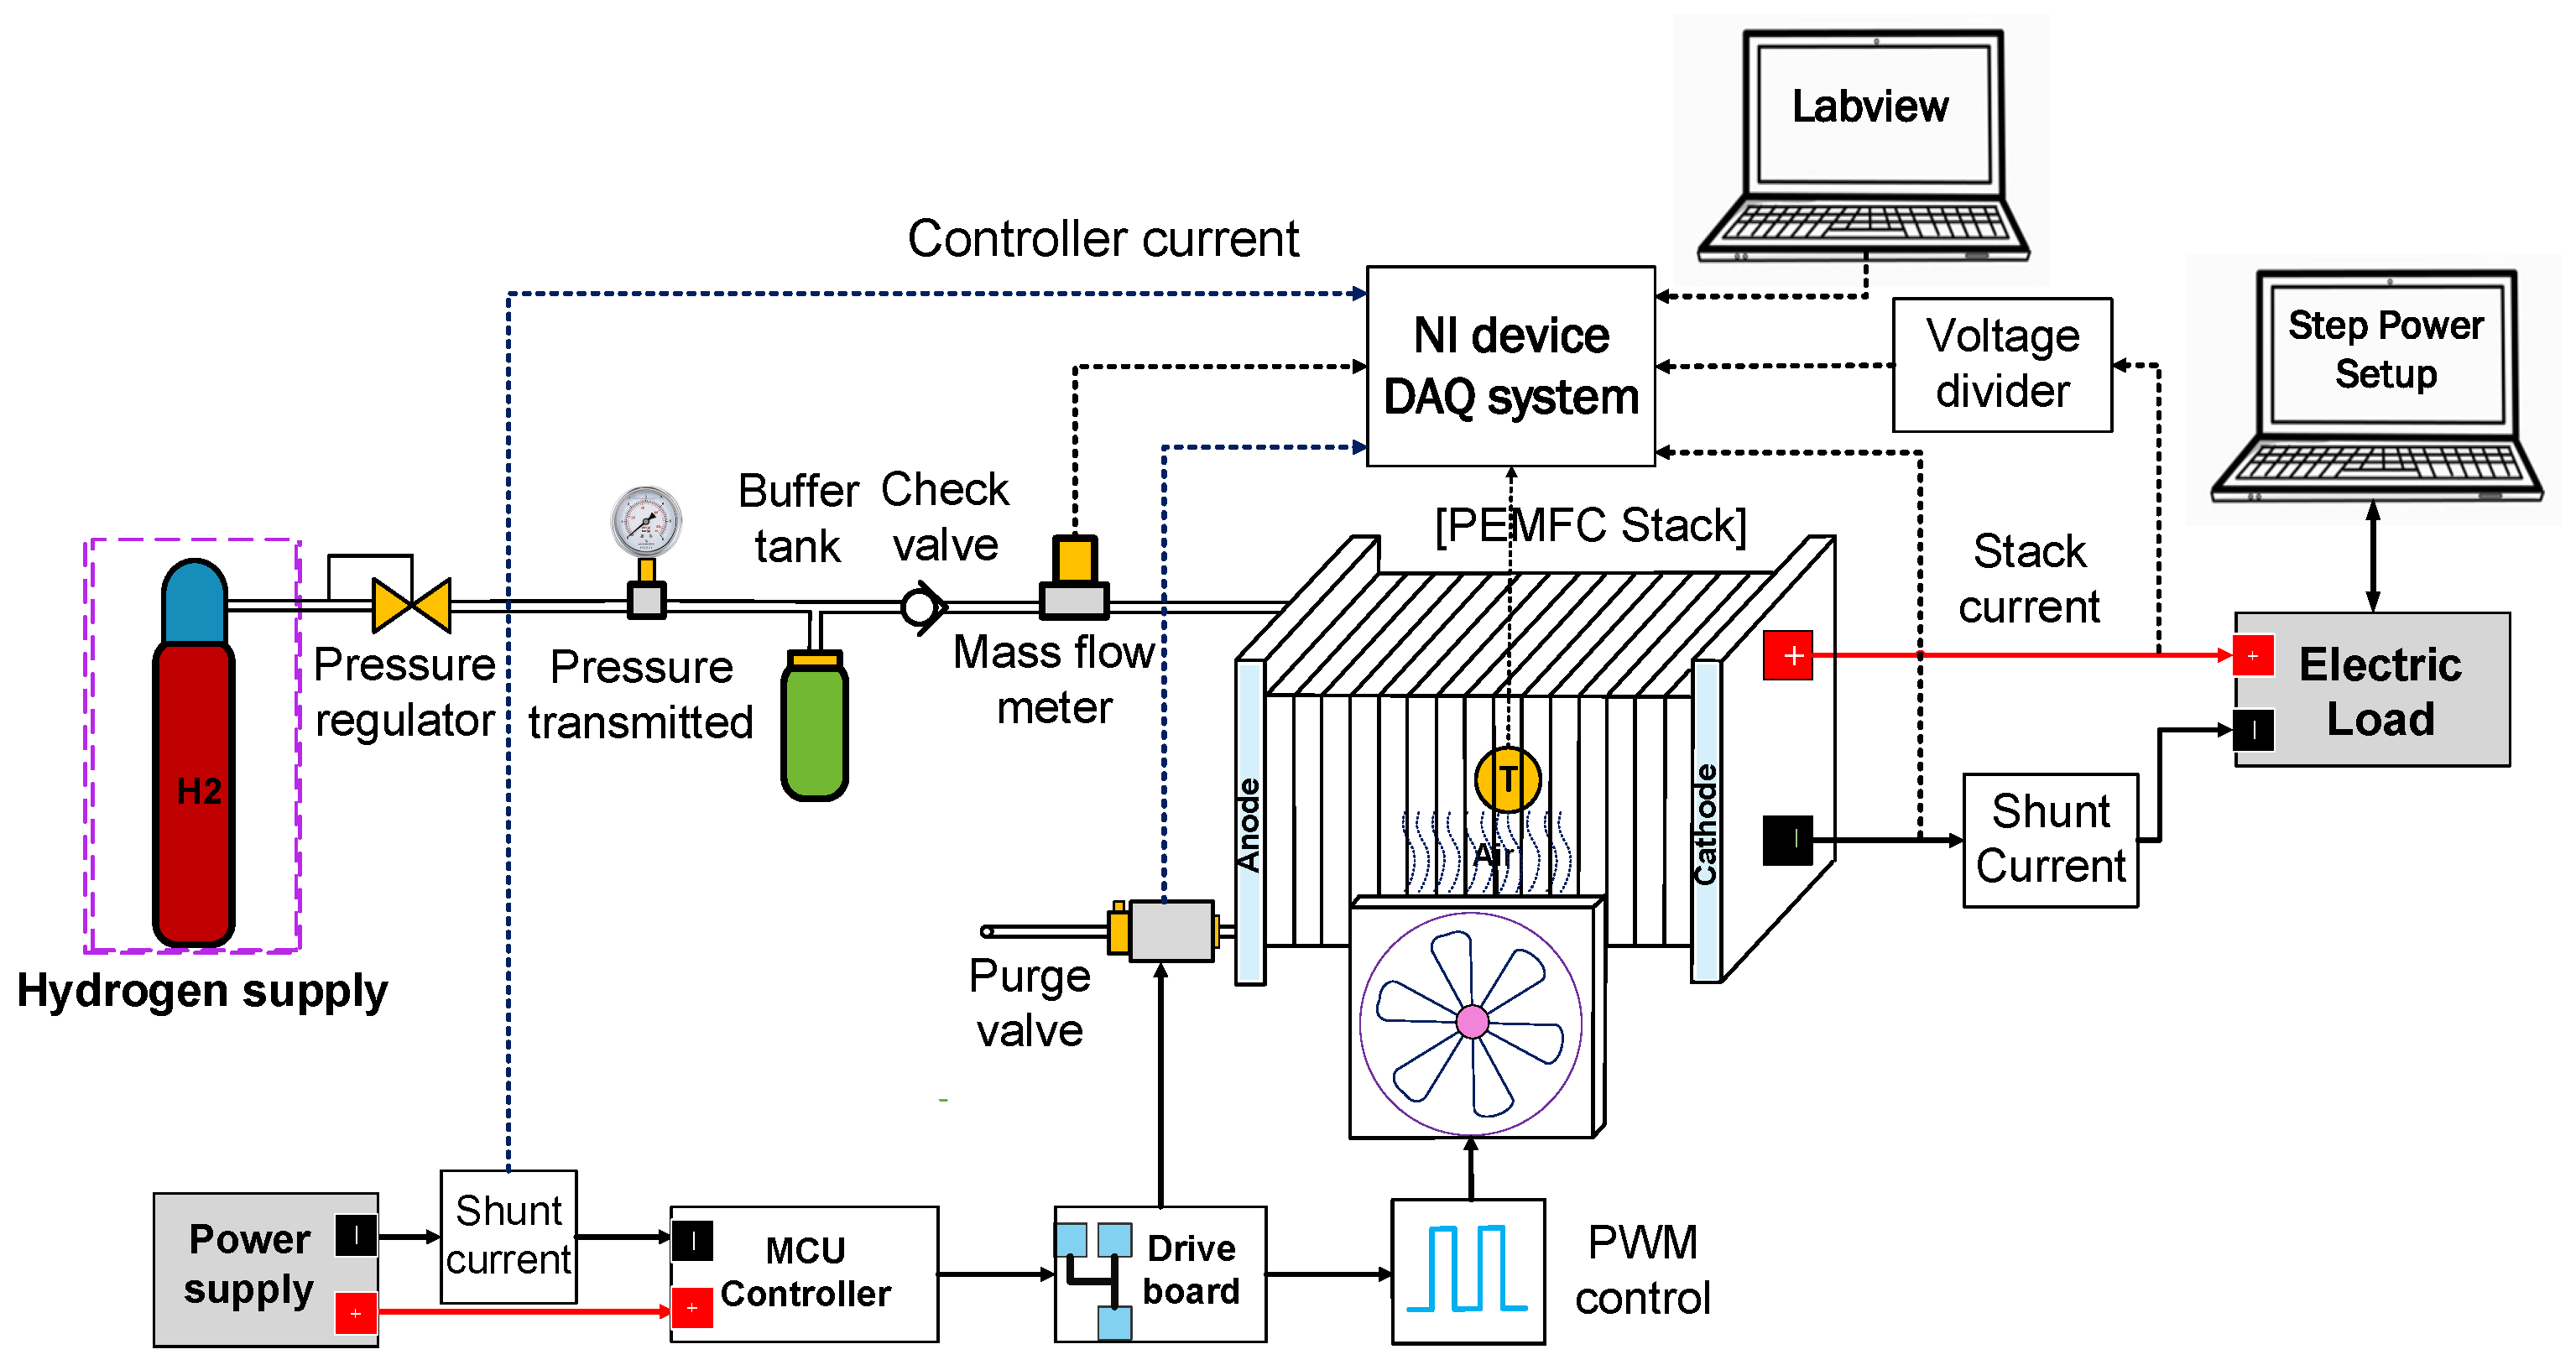
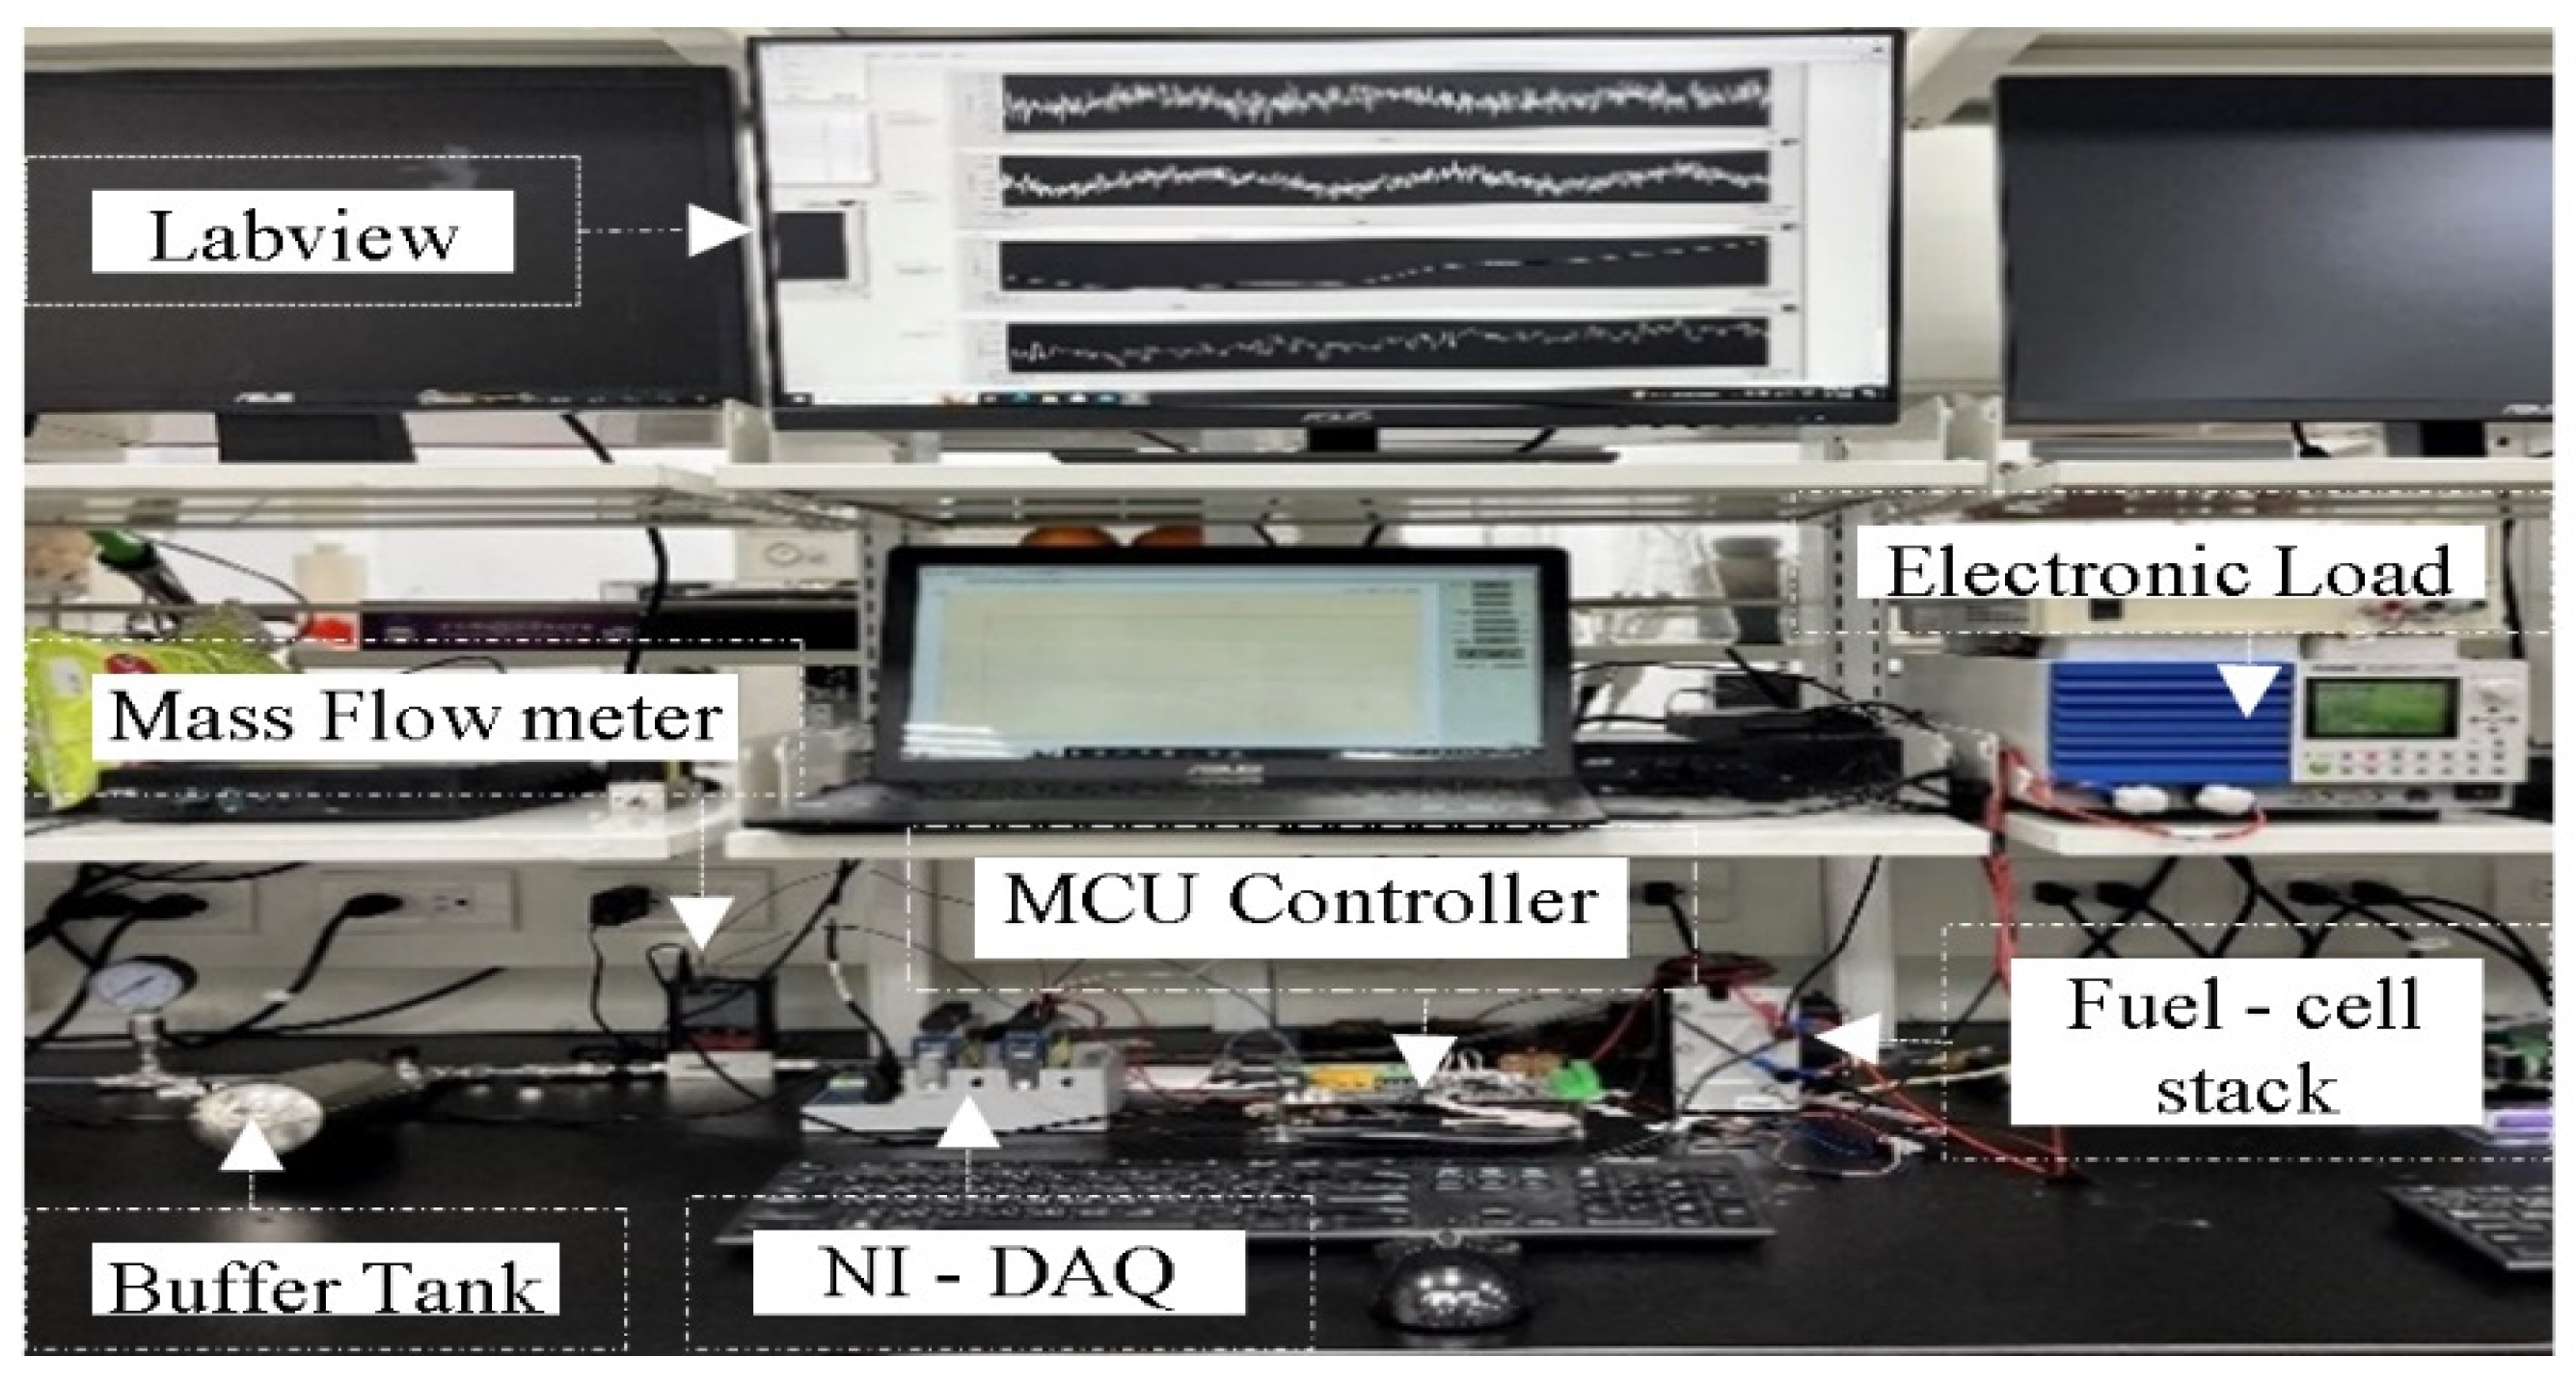
2.1. Experimental Setup

To evaluate the effectiveness of the proposed method, experiments were conducted using the test platform illustrated in Figure 1 and Figure 2. Figure 1 presents a schematic of the experimental setup, while Figure 2 shows a photograph of the actual system. The experiments were performed under two conditions: one with a buffer tank installed and one without. Other than the inclusion of the buffer tank, both setups were identical. The buffer tank, positioned after the mass flow meter and before the inlet of the fuel cell, served as a temporary hydrogen reservoir to support system performance during purge operations.
A commercial fuel cell system, specifically the H100 system (24V Horizontal Fuel Cell Technologies, Singapore), was employed. This system comprises a 20-cell stack with an active area of 22.5 cm2 and operates as an air-cooled, self-humidified PEMFC stack. Hydrogen with a purity of 99.995% (dry H2) is supplied from a hydrogen tank to the anode, while ambient air is supplied to the cathode. Control of the solenoid valve, situated at the anode outlet, to regulate purging intervals and durations, as well as the adjustment of cooling fan speed through pulse width modulation (PWM) signal, is overseen by a microcontroller unit (MCU).
A mass flow meter (M-20SLPM-D, Alicat Scientific, Tucson, AZ, USA) was installed at the hydrogen inlet to measure the hydrogen flow rate. Additionally, a thermocouple (5 TC-TT-T-36-72, Omega, Michigan City, IN, USA) was placed at the center of the stack to continuously monitor the operating temperature. Experimental data were recorded and collected during the operation using an NI 1919 card and LabVIEW 2014 software through data acquisition (DAQ) blocks. Subsequently, experiments were conducted under various combinations of operating parameters, such as load current, hydrogen supply pressure, purge duration, and purge interval. These experiments were carried out in two configurations: one with a buffer tank and the other without.

2.2. Experimental Procedure

To assess the optimization of operating power through adjustments in operating parameters, such as purge interval, cycle duration, and fan speed, the energy efficiency of the system is calculated as
η L H V = P n e t ( t ) d t Δ H m H 2 . ( t ) d t = I i V ( i ) Δ t Δ H n ( i ) Δ t .
where η L H V , P n e t , Δ H , and m . H 2 are the system efficiency, the net power output, the lower heating value of hydrogen, and hydrogen utilization, respectively. The net power output is calculated by
P n e t = P s t a c k P a u x i l i a r y
The purpose of this experiment was to investigate the impact of purge duration and interval on energy efficiency under various combinations of operating parameters, such as load current and hydrogen supply pressure. Additionally, a comparison was made between configurations with and without a buffer tank. The experimental setup parameters are summarized in Table 1. The experiments involved variations in purge durations (0.1, 0.2, 0.4, 0.6, 0.8, and 1 s), purge intervals (10 and 20 s), current levels (1, 5, and 8 A), and hydrogen supply pressures (0.1, 0.3, 0.5, and 0.7 bar). This resulted in a total of 144 cases for each configuration—with and without the buffer tank—yielding a combined total of 288 experimental cases.
In this study, the fuel cell system was operated at various stack power outputs ranging from 20 to 80 W. The current, voltage, stack temperature, hydrogen flow rate, and power consumption of auxiliary components were recorded at a sampling frequency of 15 Hz throughout the operating period.

3. Results and Discussion

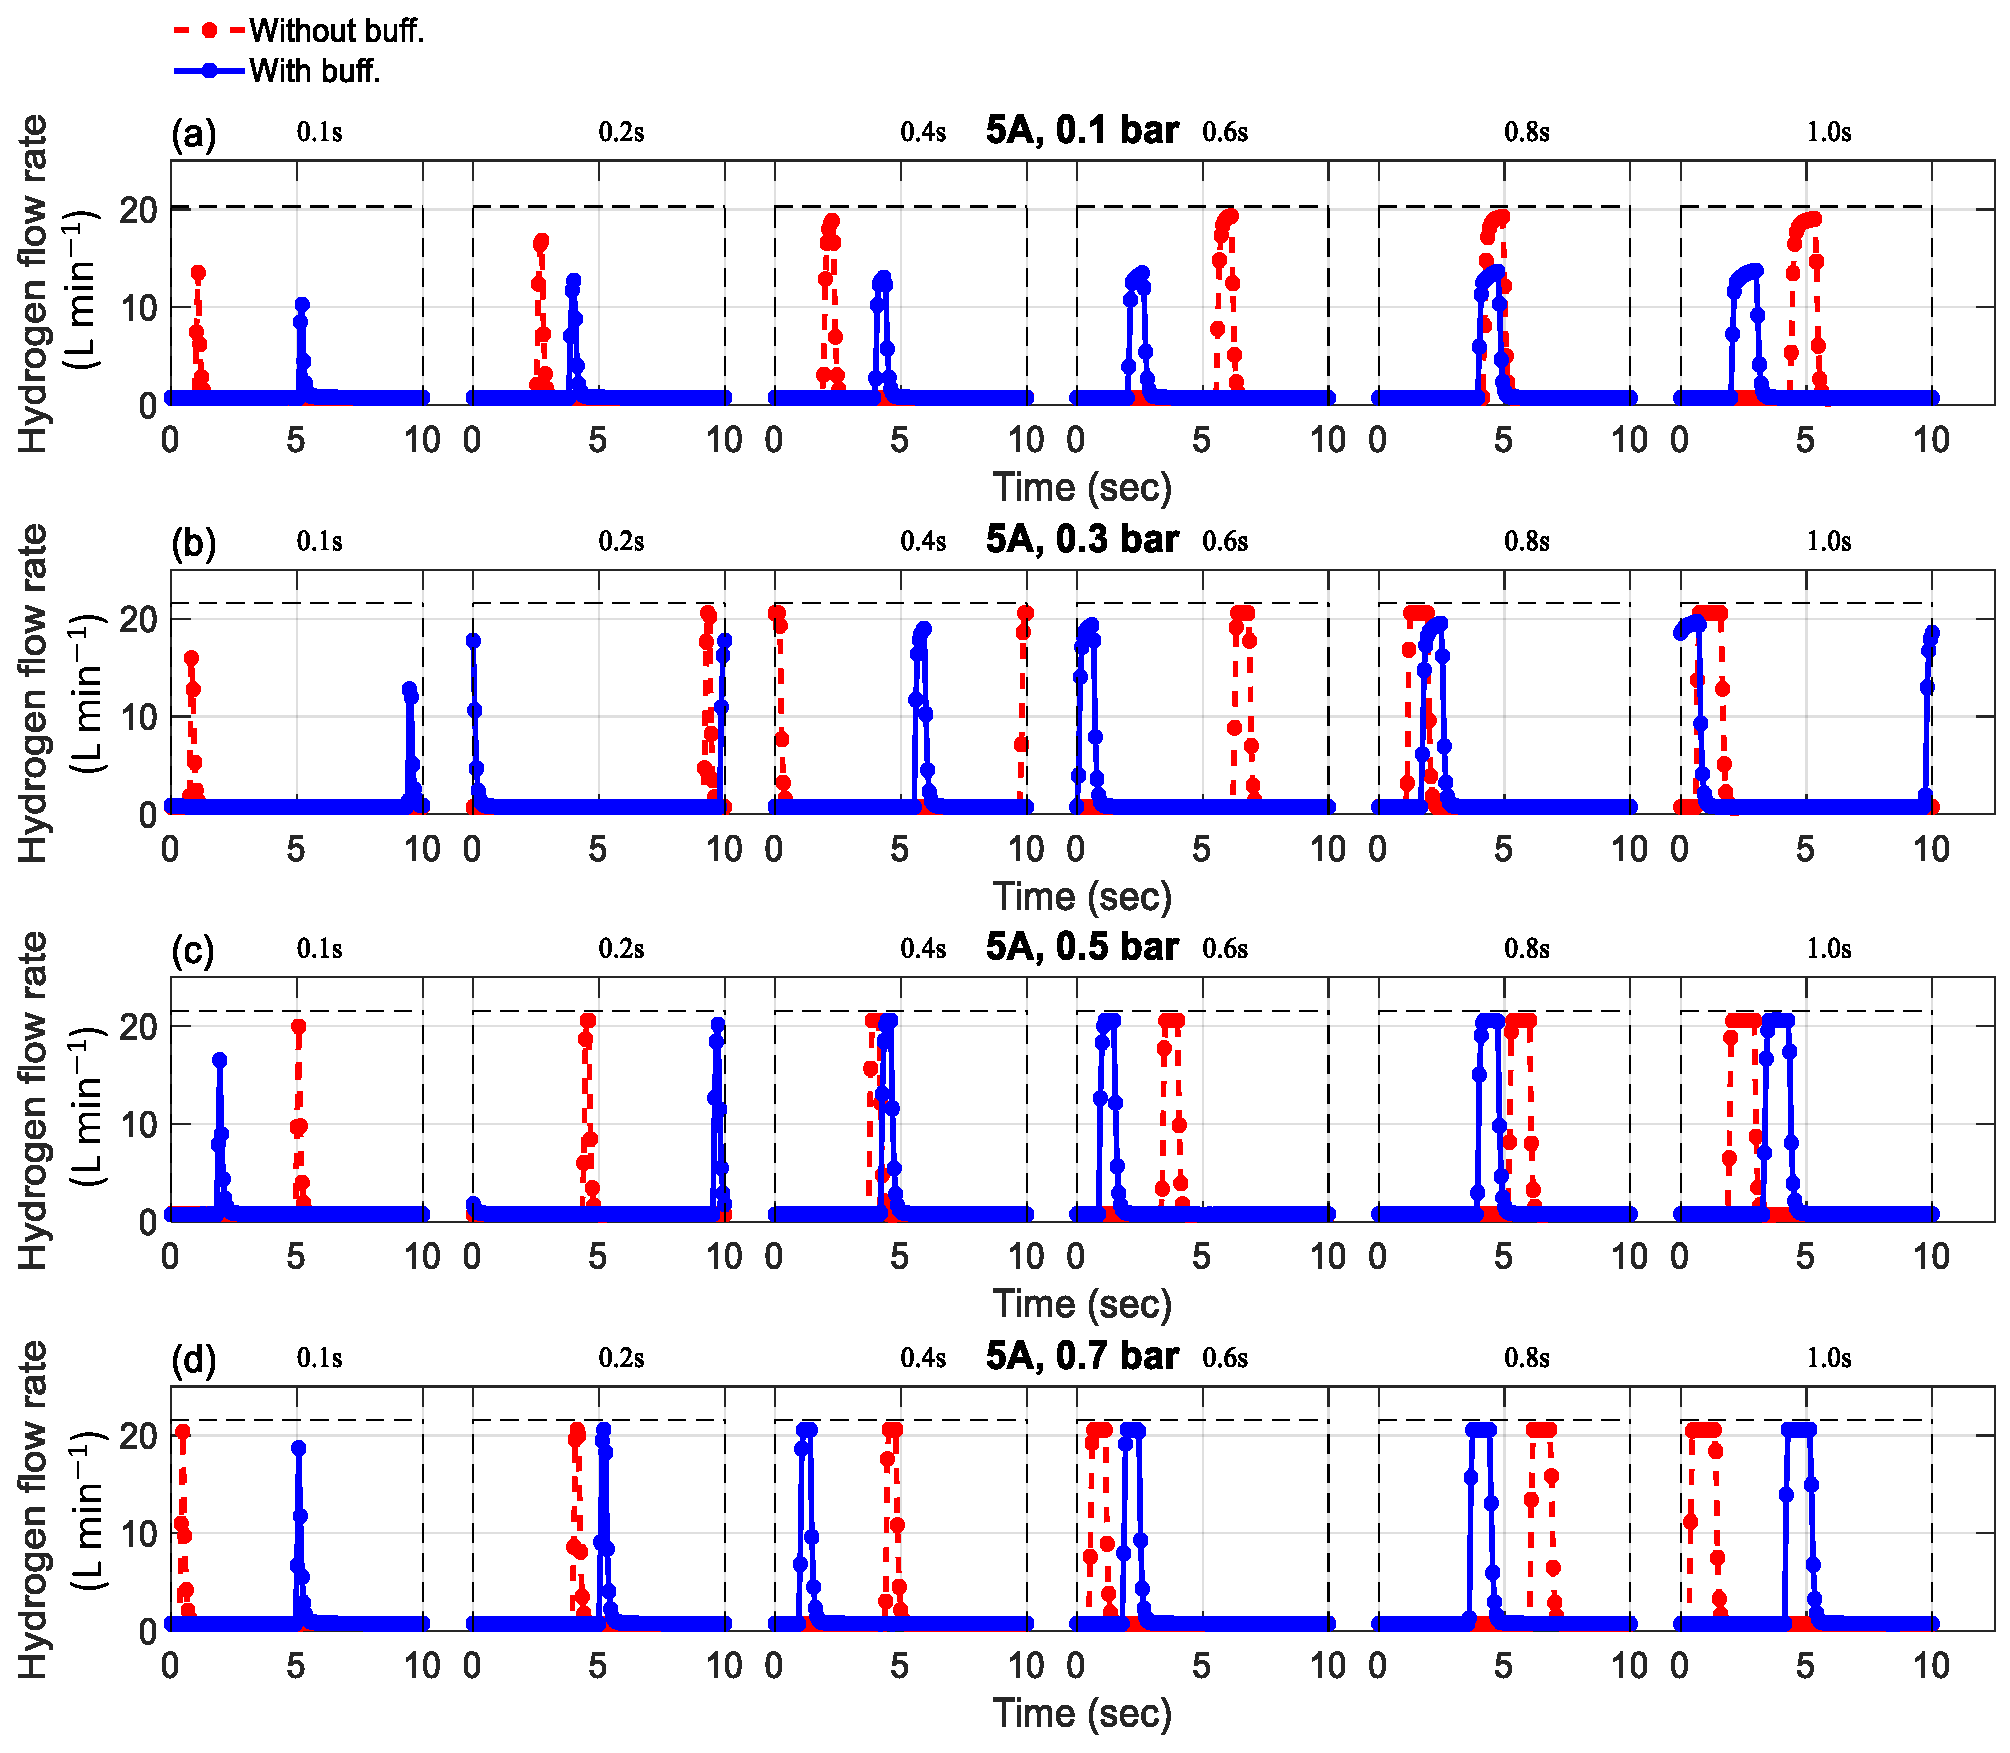
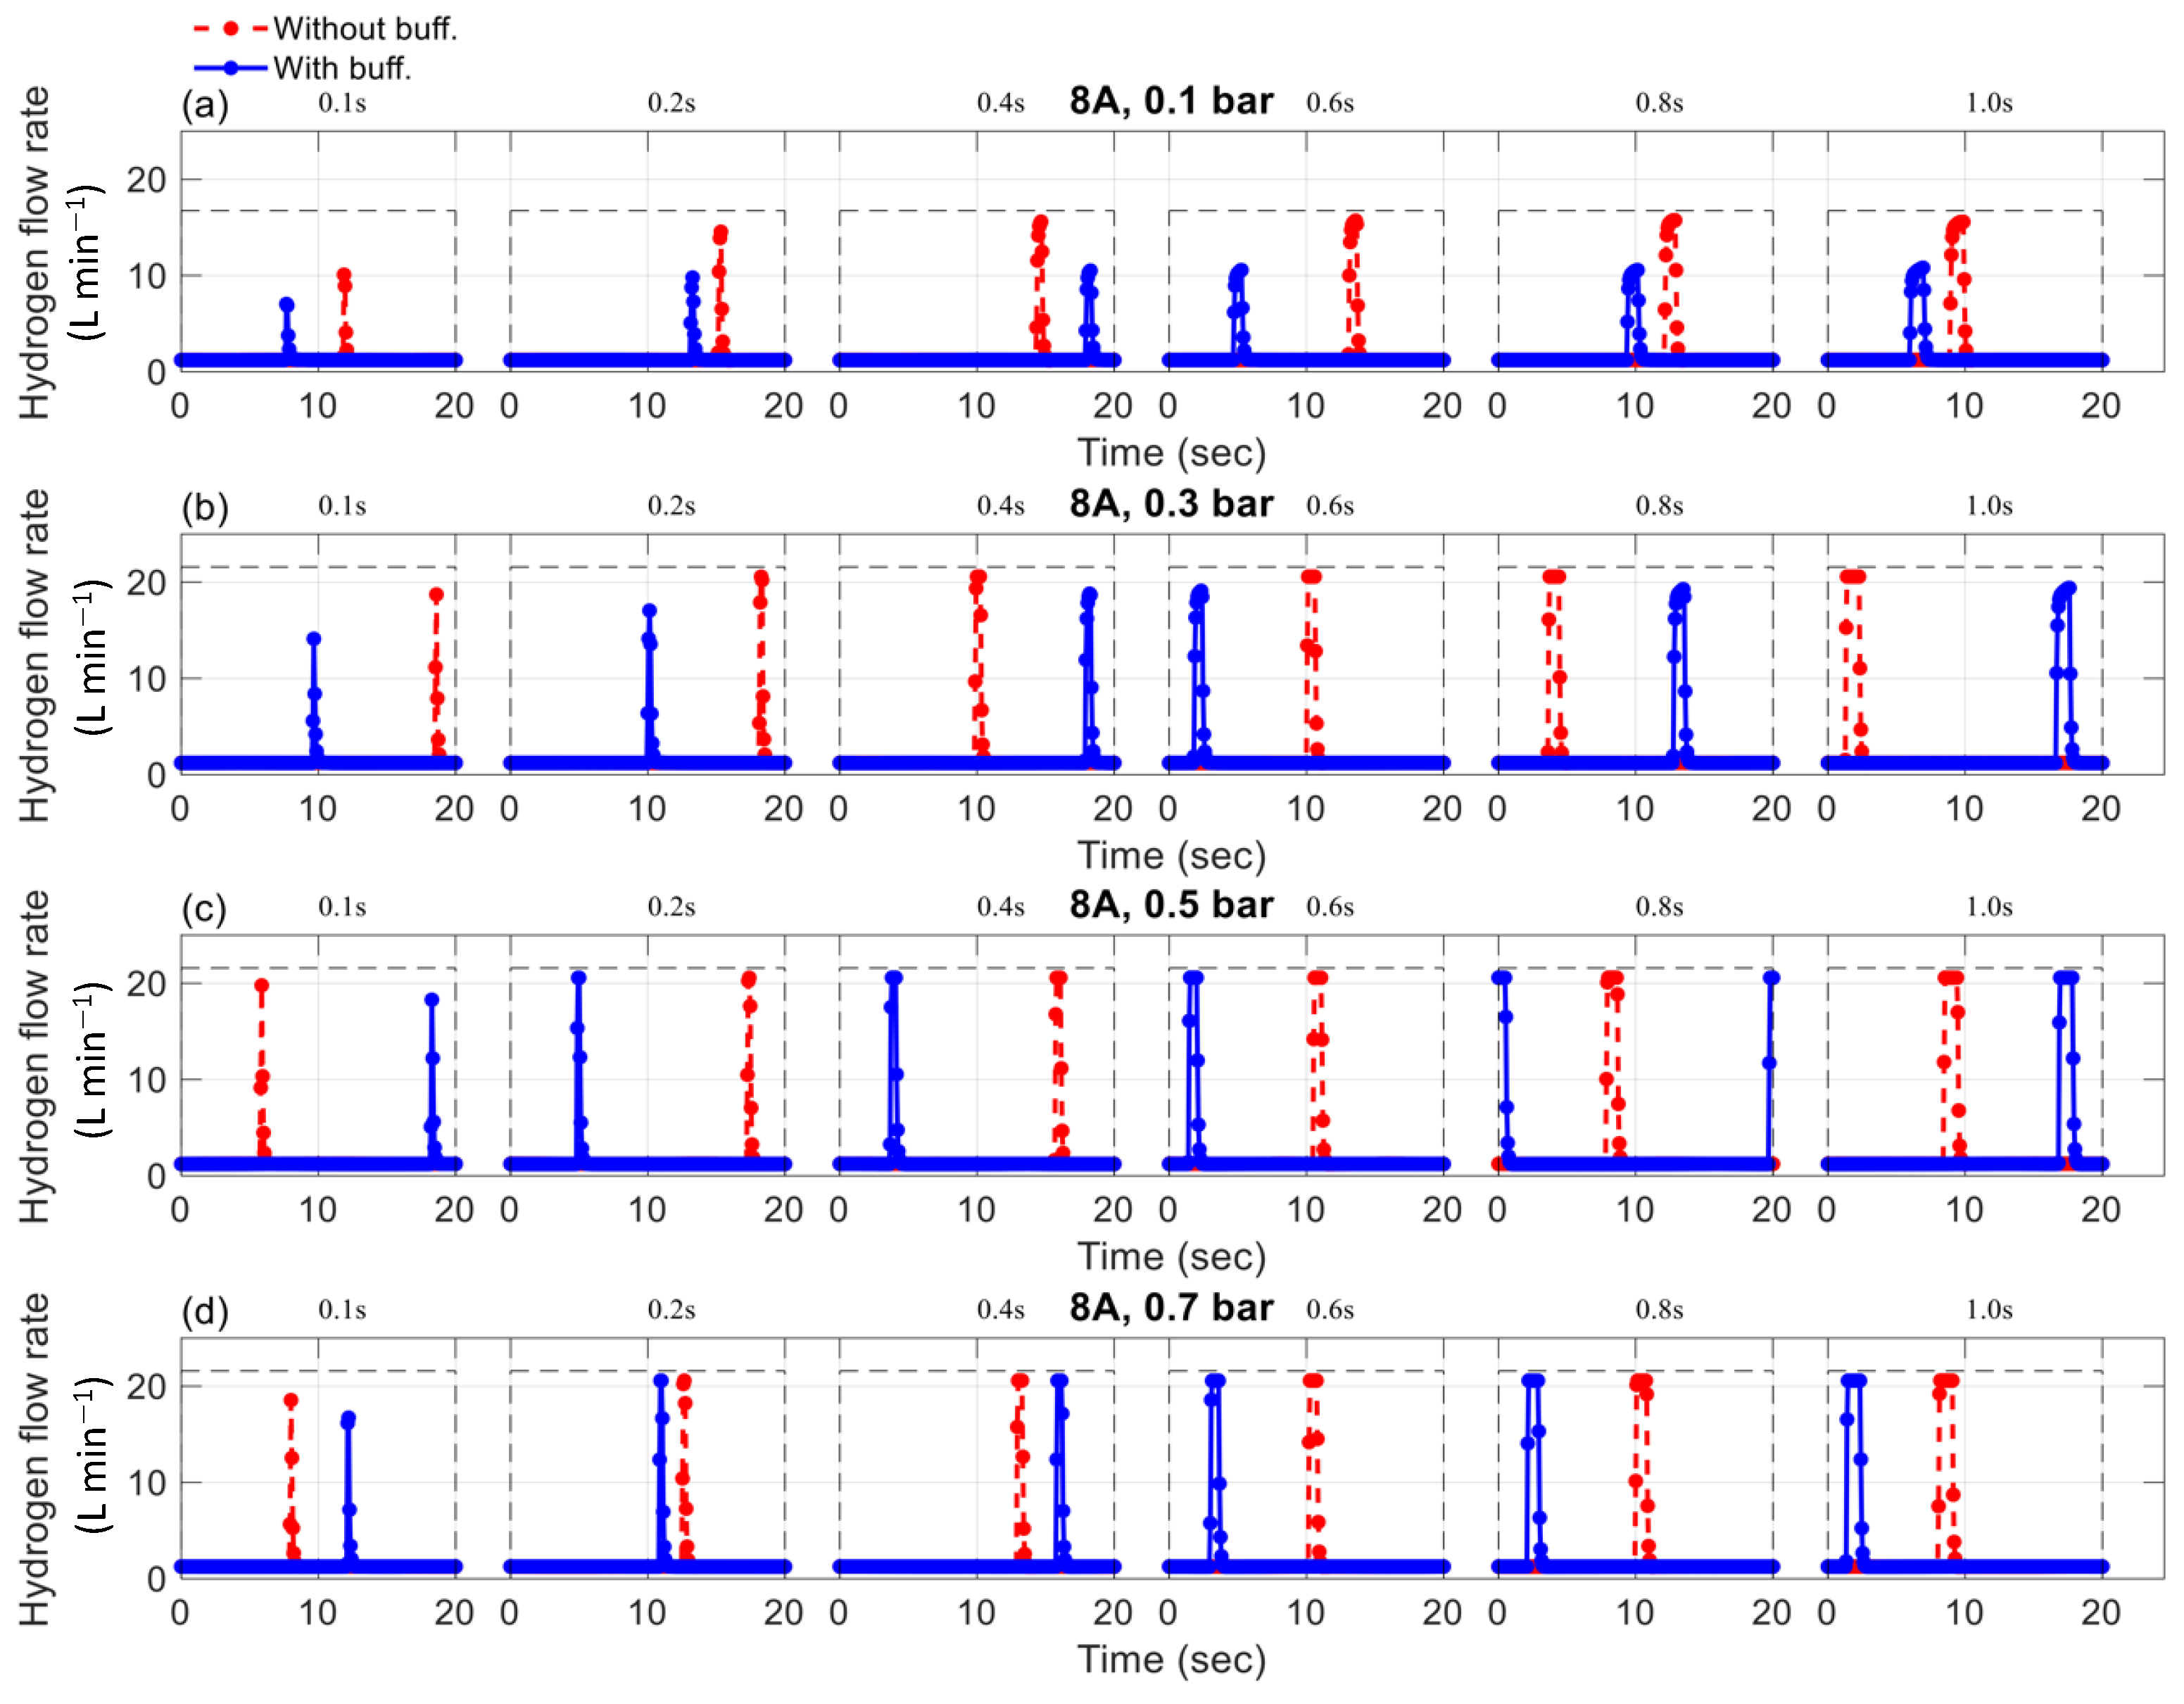
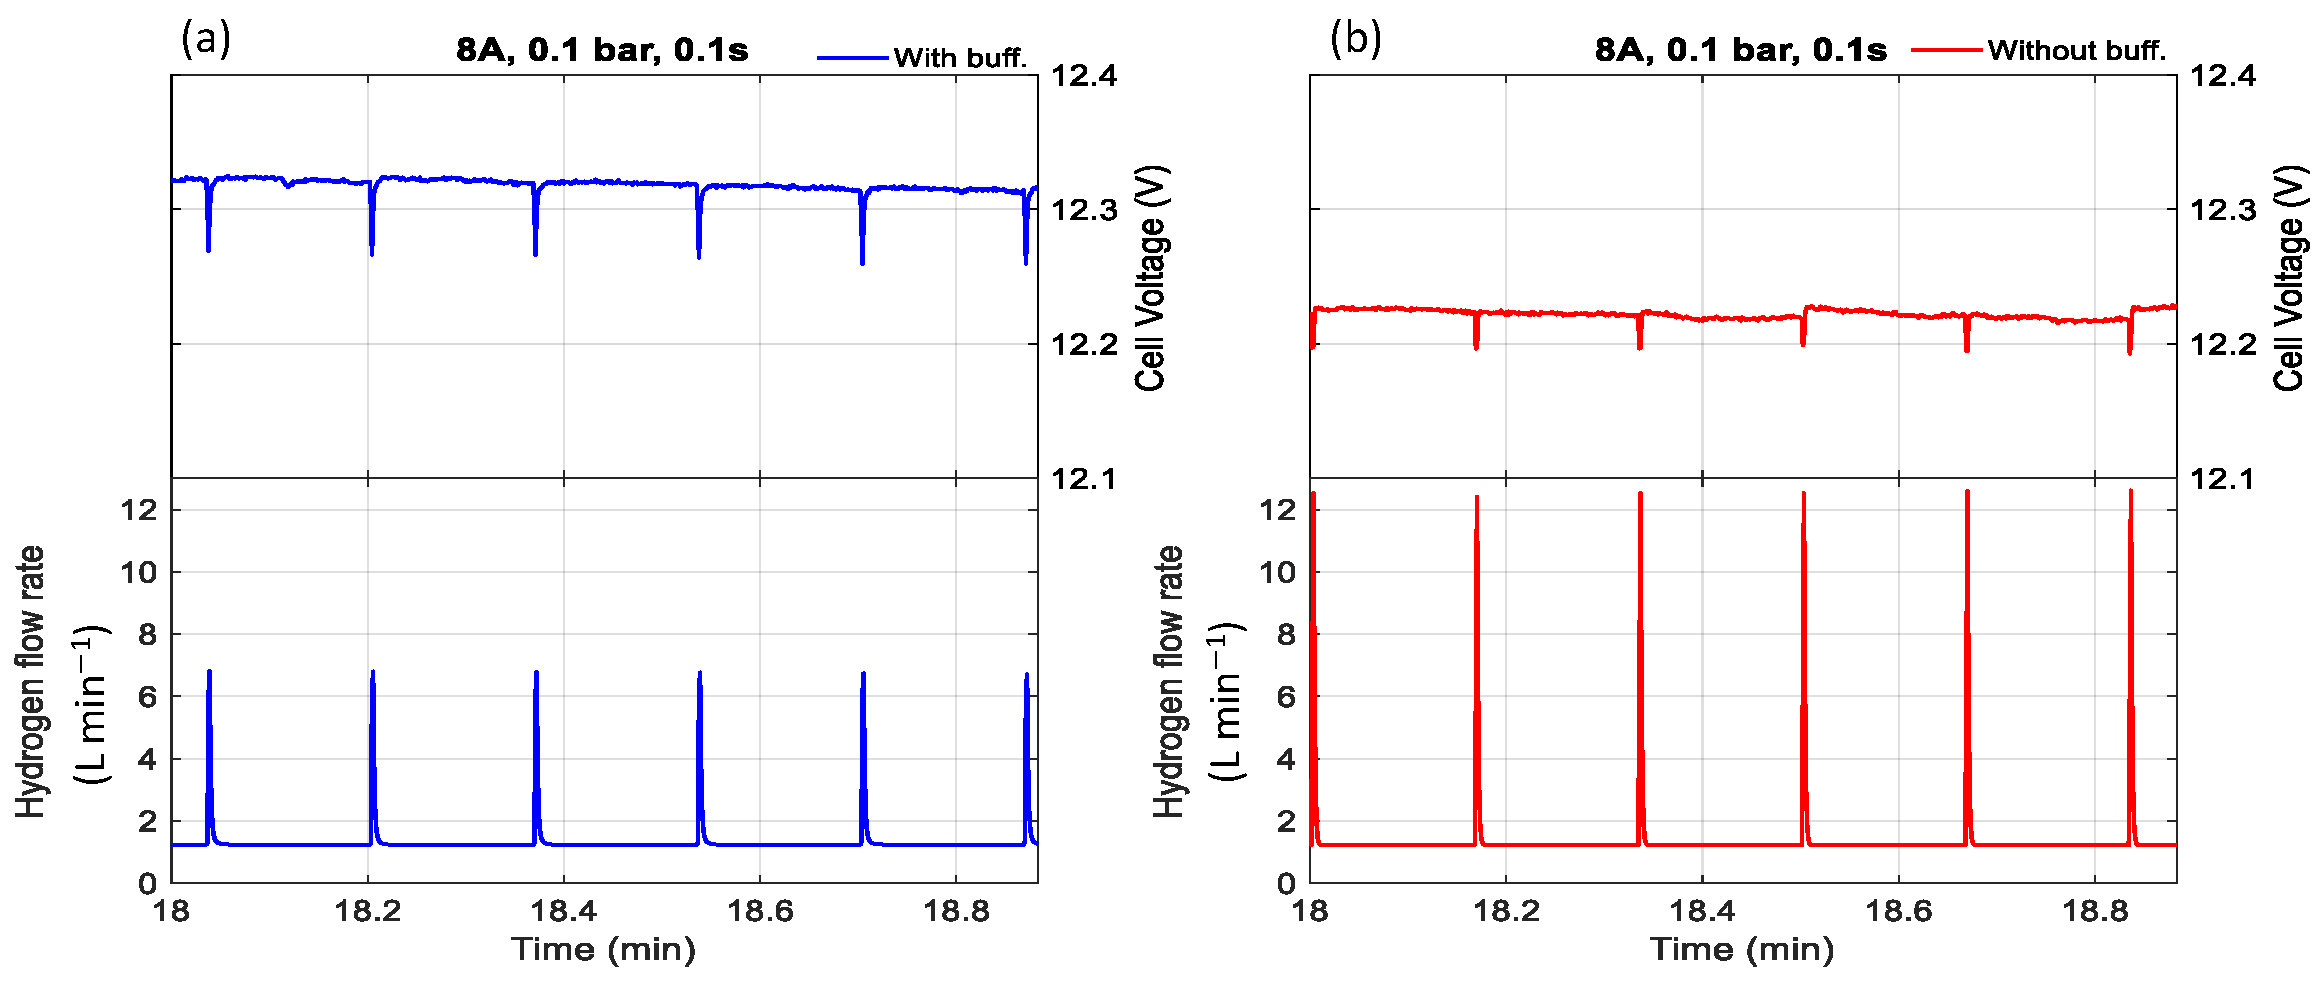
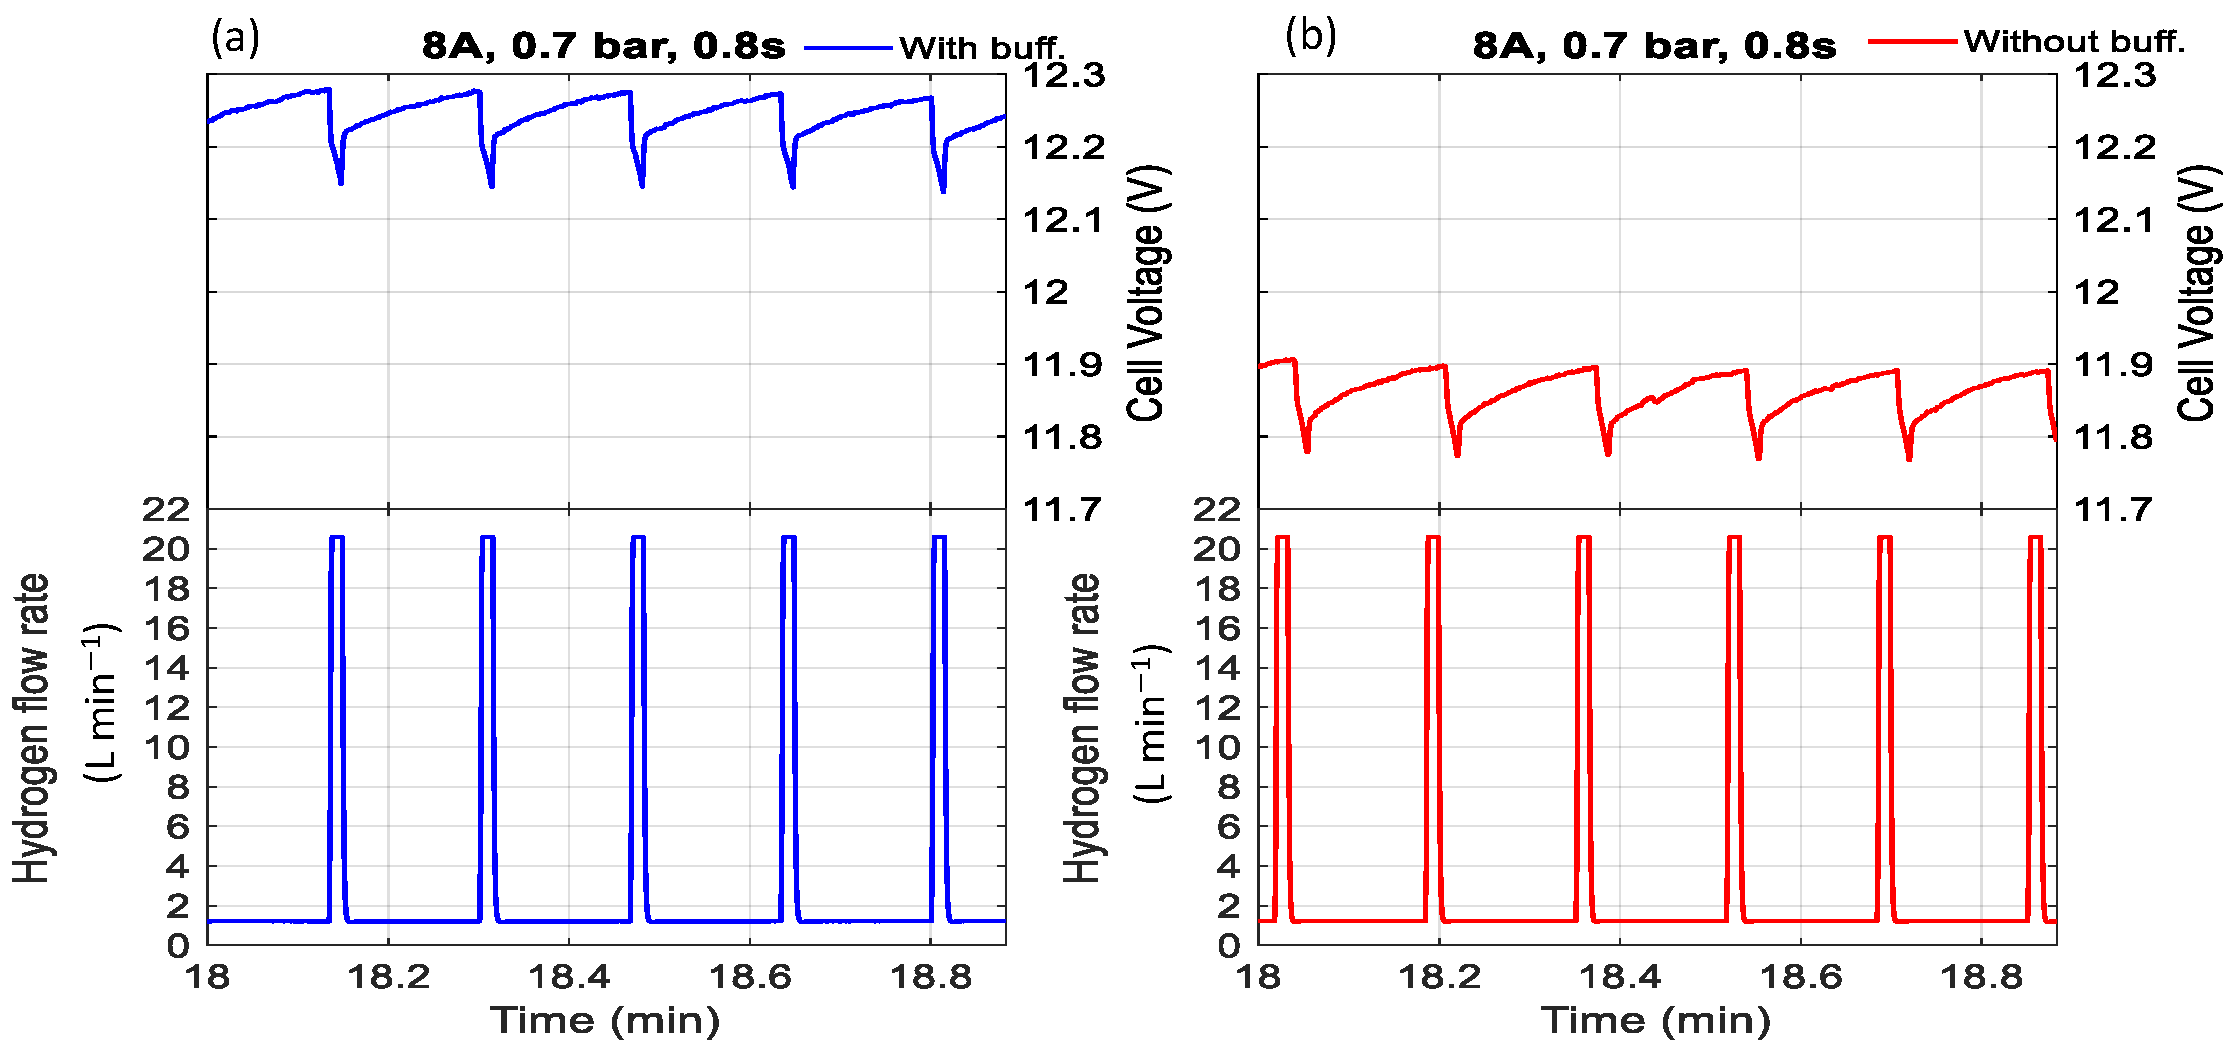
3.1. Effect of Purging Duration and Buffer Tank on the Mass Flowrate

For the experimental trials supporting this study, variations in hydrogen’s mass flow rate at the anode were set for cycles of 10 and 20 s at various purge durations (0.1, 0.2, 0.3, 0.8, and 10 s). Intuitively, as the purge duration decreases or the purge cycle increases, less hydrogen is released when the purge valve is opened. This suggests that conserving more hydrogen leads to higher energy efficiency, and vice versa. To further investigate the impact of purge duration and cycle on energy efficiency, experiments were conducted to compare energy consumption between setups without a buffer and those with a buffer. The buffer tank stored hydrogen during the closed phase of the purge valve cycle and released it during the open phase, thereby mitigating hydrogen loss typically associated with purging events. To enhance the performance of DEA fuel cells under variations in purge interval and duration, the study investigated the impact of the mass flow rate on the membrane fuel cell. The purge interval and purging duration were analyzed to evaluate cell performance.
The effects of purge duration on the mass flow rate, with a purge interval of 10 s for a current load of 5-A, are shown in Figure 3. Similarly, the effects of purge duration on the mass flow rate, with a purge interval of 20 s for a current load of 8 A, are shown in Figure 4. Although there are cases with 1 A and 8 A for 10 s and 1 A and 5 A for 20 s, only symbolic representations of 5 A for 10 s and 8 A for 20 s are given due to the limitations in this article. Since the control of purge duration and interval is independent of the current, the effects of purge duration on the mass flow rate at 1 A and 8 A for 10 s and 1 A and 5 A for 20 s were almost identical to those observed at 5 A for 10 s and 8 A for 20 s, respectively. The experiments were conducted to analyze pressure variations, with comparisons made between setups with and without a buffer tank for each studied case. The key observations are summarized below.
Observations indicate that when the purge valve is inactive, hydrogen consumption is proportional to the current load. Higher loads require more hydrogen to power the fuel cell. Interestingly, the mass flow rate remained unaffected by pressure and the presence of a buffer tank. Hydrogen consumption showed slight variation around 0.16 L/min for 1 A, 0.76 L/min for 5 A, and 1.23 L/min for 8 A, for both cases with and without a buffer tank. Although hydrogen consumption was theoretically influenced by supply pressure, the observed changes were negligible. Therefore, hydrogen consumption could be considered effectively constant across the tested pressure range of 0.1 to 0.7 bar.
During purged operation, the mass flow rate increased rapidly, and the pressure dropped quickly, reaching atmospheric pressure when the purge valve was active. Pressure, valve duration, and the presence of a buffer tank were observed to influence the mass flow rate. Increased hydrogen pressure resulted in a higher mass flow rate during the purging phase, aligning with observations made in previous studies [26,27]. These works emphasize that pressure is a key factor in facilitating flow through the anode channel, serving as the primary driving force behind hydrogen transport. During purging, this pressure is particularly influential in controlling the flow rate. Therefore, excessively high pressure can lead to increased hydrogen loss, reducing overall system efficiency. In contrast, insufficient pressure may not provide adequate propulsion for hydrogen to reach the catalyst layer and sustain the electrochemical reaction. This is because low pressure reduces the hydrogen partial pressure at the anode, weakening the driving force for hydrogen transport through the gas diffusion layer to the catalyst layer [28,29]. This can result in insufficient hydrogen availability for the electrochemical reaction, ultimately lowering the cell voltage. The duration of the purge also affects hydrogen consumption, with longer durations resulting in more hydrogen being purged during the open time.
Insufficient purge time may also fail to eliminate accumulated water in the fuel cell, which can reduce energy efficiency. This study aimed to determine the optimal purge time to minimize the open time for hydrogen conservation while maximizing energy efficiency. This optimization task will be addressed through detailed experimentation, as discussed in the next section.
Furthermore, it can be observed that under the same operating conditions, such as pressure, current load, and purge duration, the presence of a buffer tank led to a reduction in flow rate consumption during purge operations. For instance, at an operating condition of 5 A and 0.1 bar, the maximum mass flow rate during the purge process was 13.5, 16.7, 18.8, 19.3, 19.1, and 19.0 L/min for devices without a buffer tank. For devices with a buffer tank, mass flow rates of 10.3, 12.7, 13.1, 13.5, 13.7, and 13.8 L/min corresponded to purge durations of 0.1, 0.2, 0.4, 0.6, 0.8, and 1.0 s. The experiments show that the buffer tank helped to reduce hydrogen consumption during purge processes. Another noteworthy point is that the buffer tank may no longer be as effective in saving hydrogen during purge processes at relatively high pressure of the supplied hydrogen, i.e., at 0.5 and 0.7 bar. As can be seen in Figure 3, Figure 4 and Figure 5, the hydrogen consumption at a pressure of 0.5 and 0.7 bar was nearly identical for scenarios with and without a buffer tank.

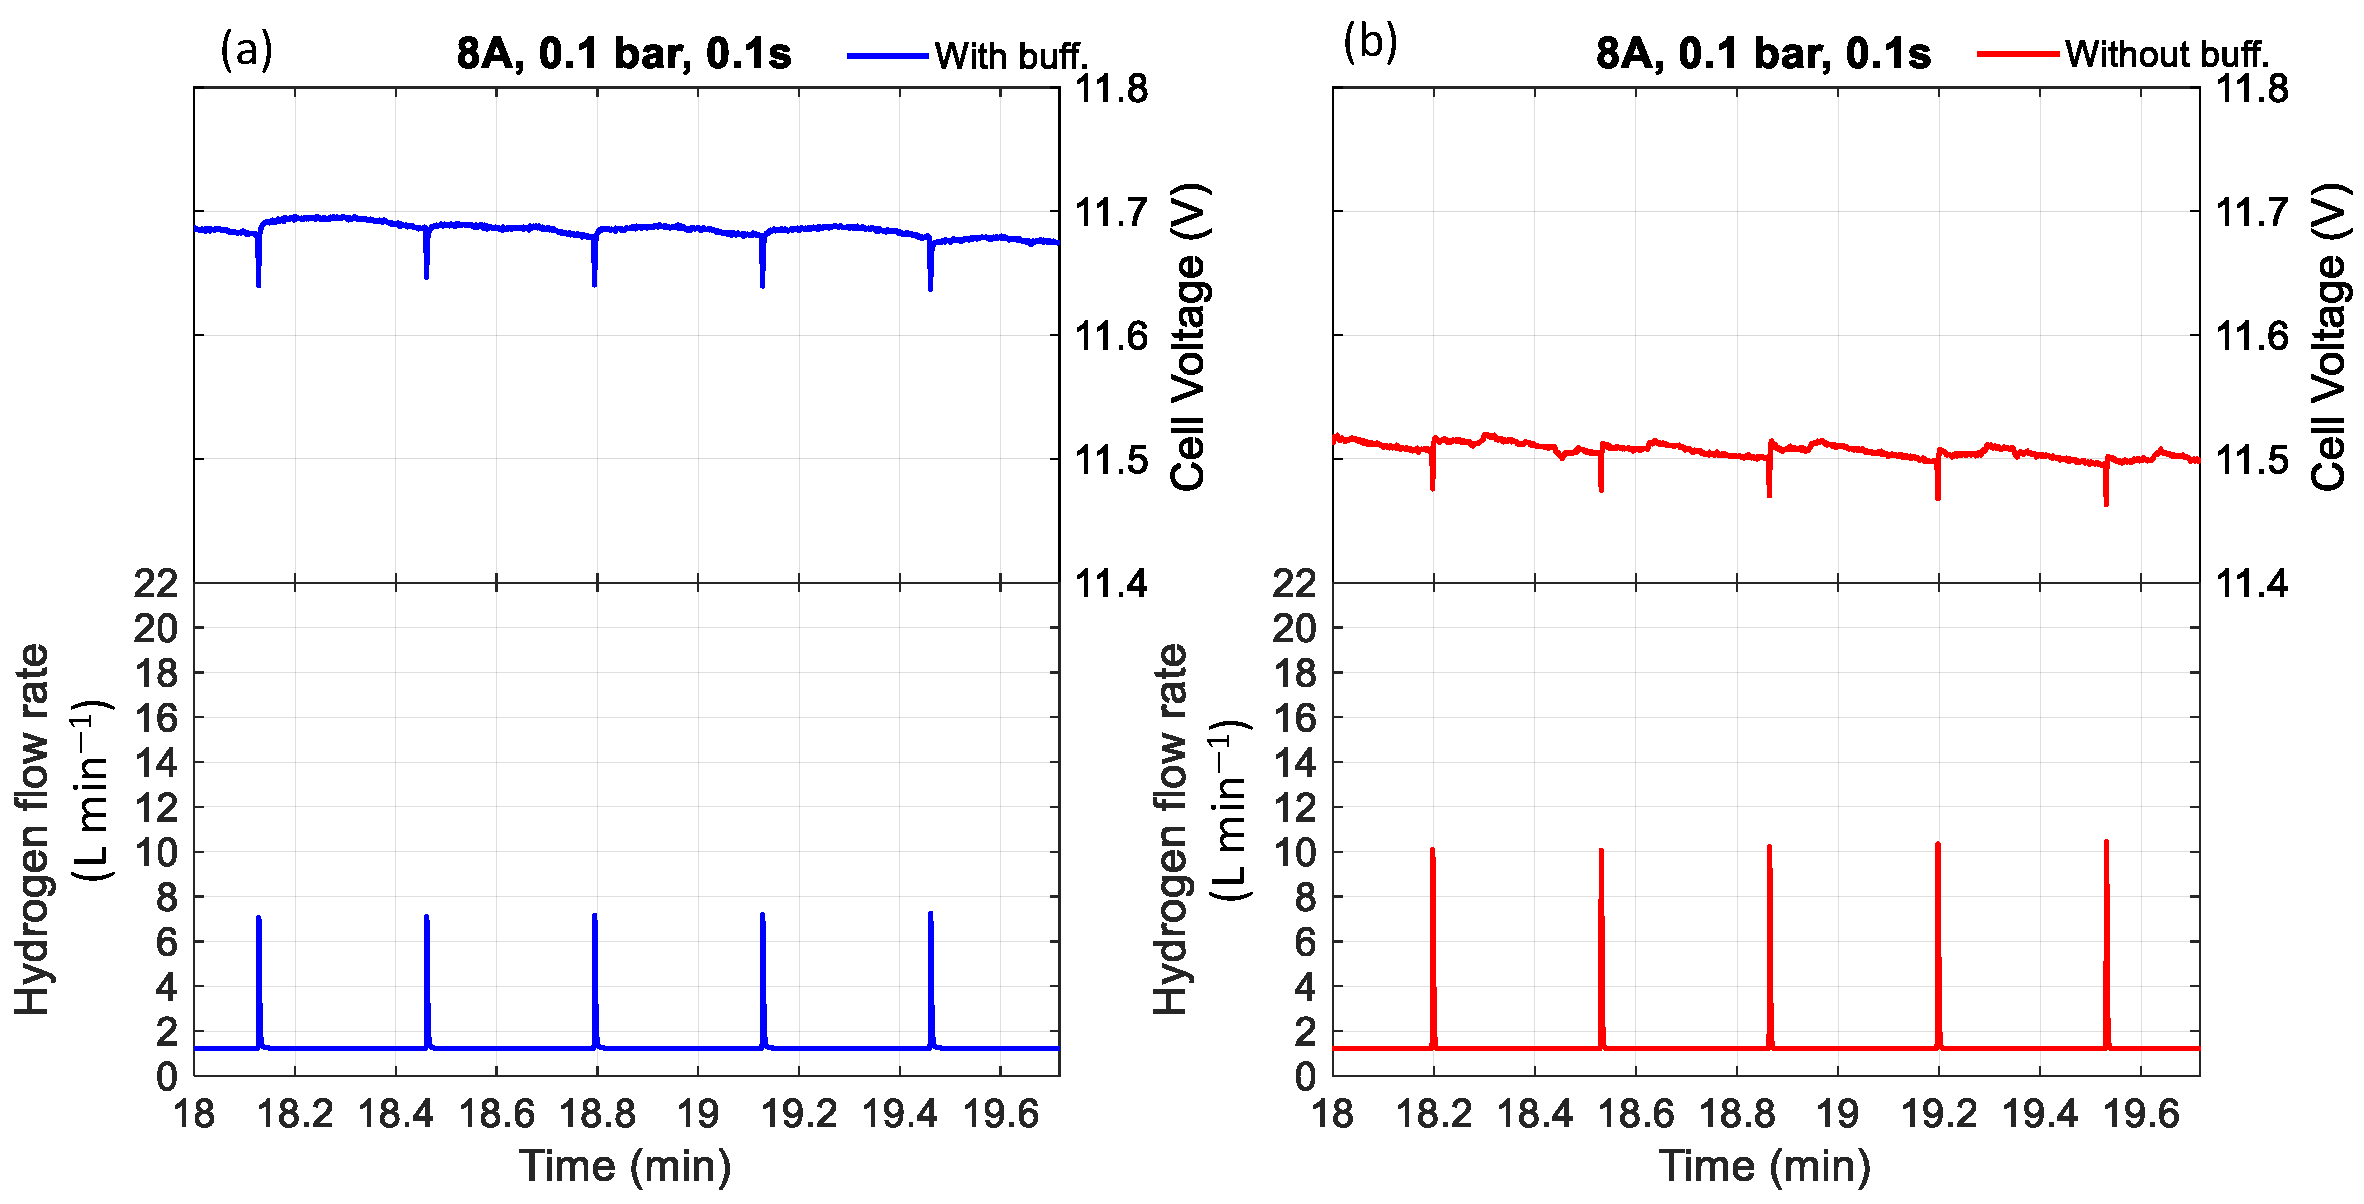
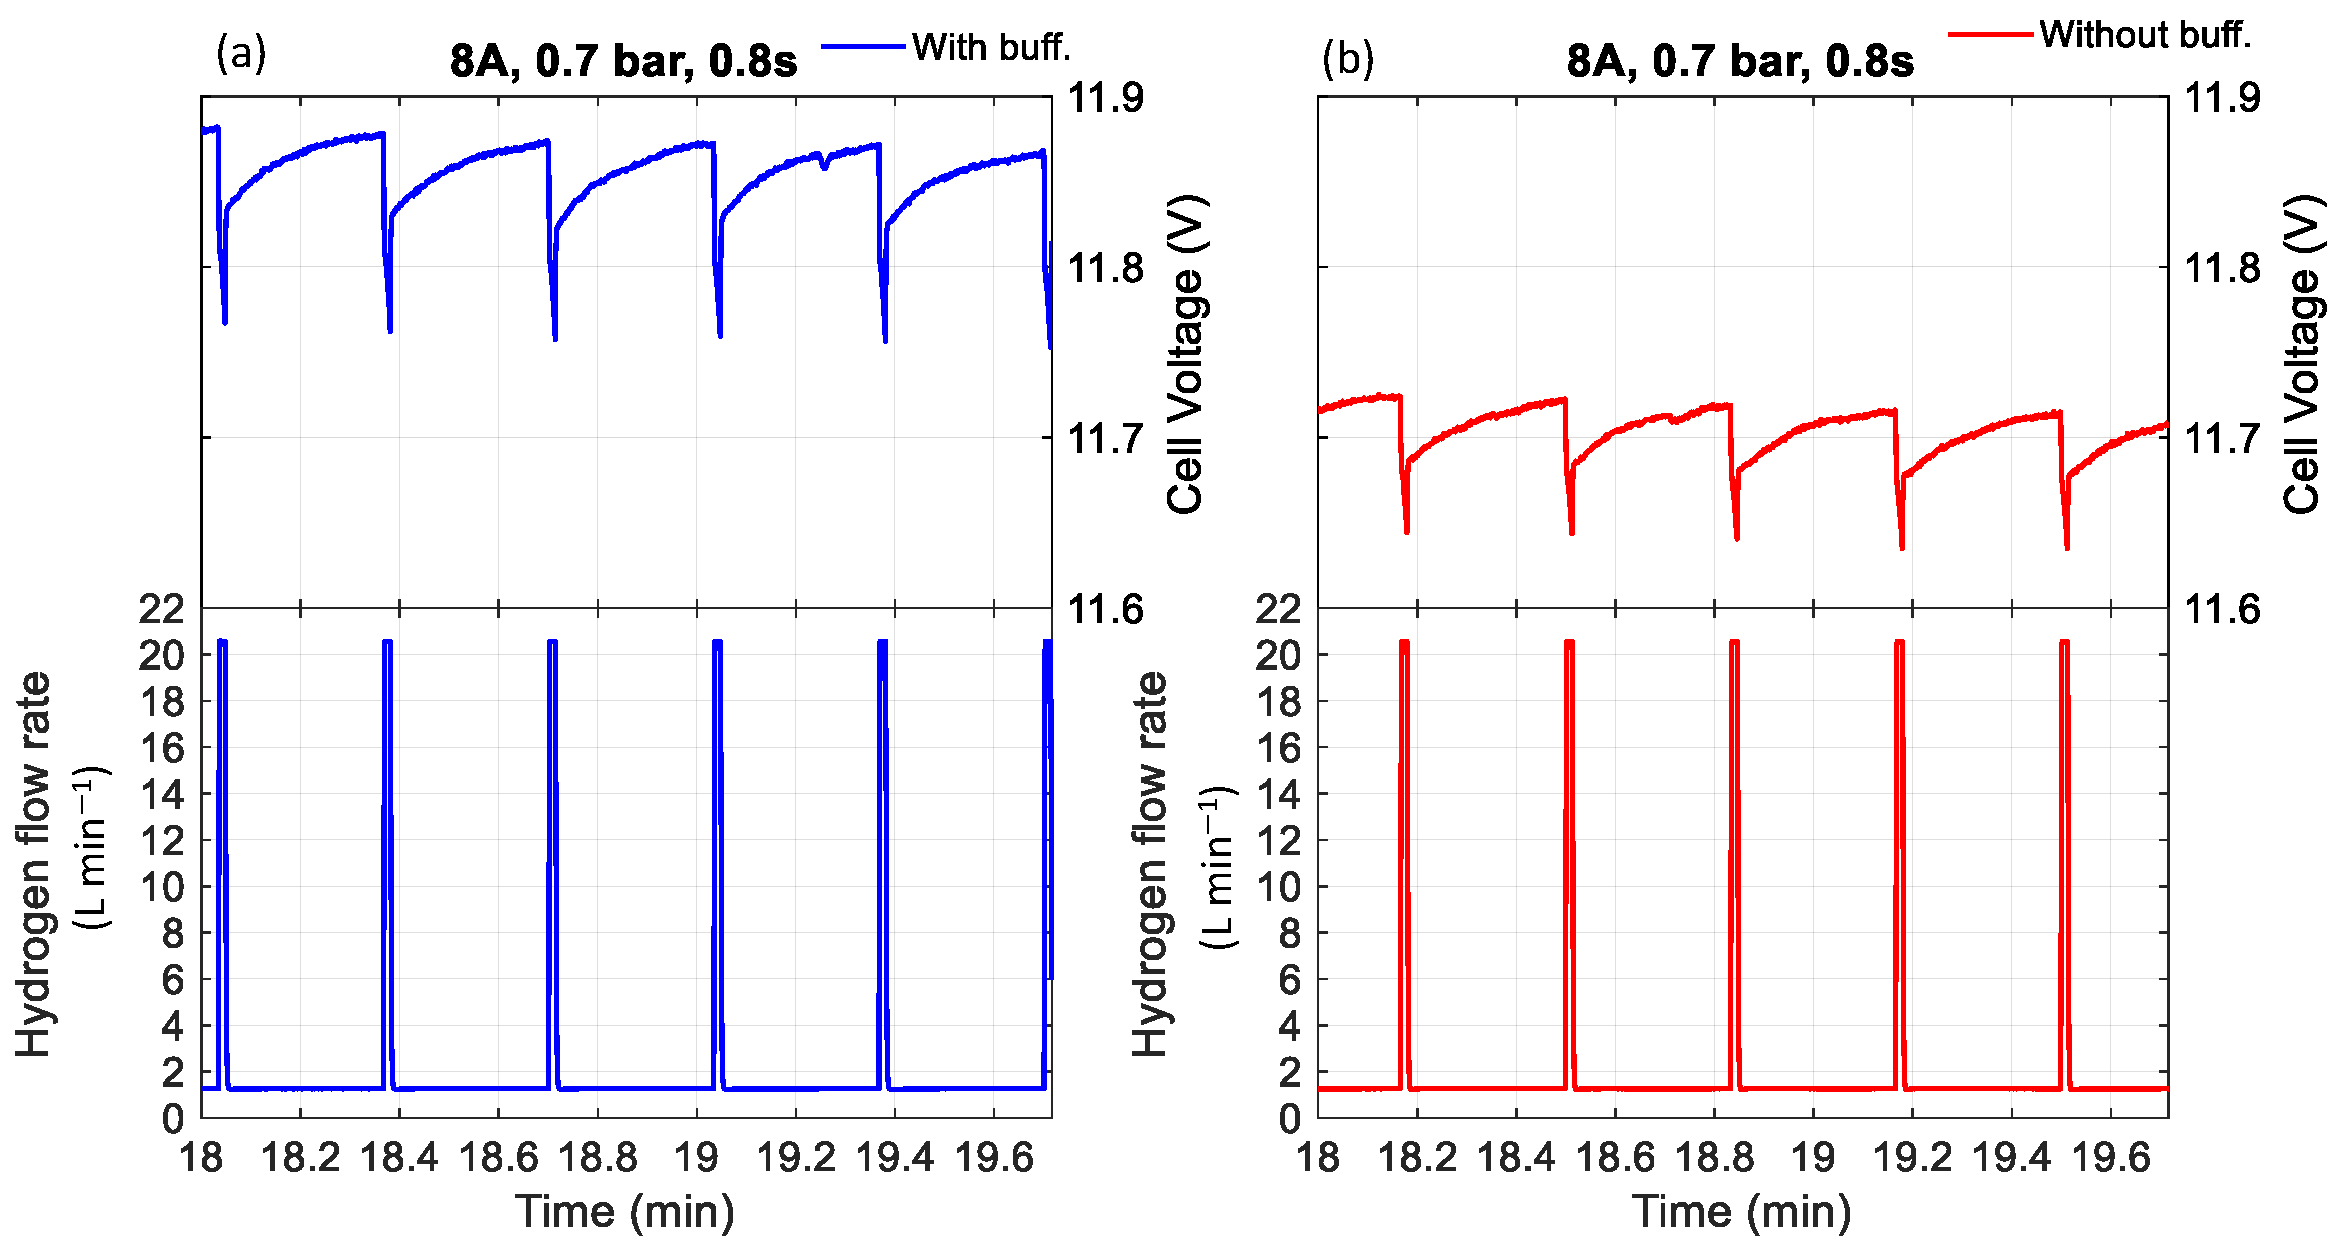
3.2. Effect of Purging Duration and Buffer Tank on the Cell Voltage

The effects of purge duration on the mass flow rate, with a purge interval of 10 s for a current load of 8 A, are illustrated in Figure 5 and Figure 6. Similarly, the effects of purge duration on the mass flow rate, with a purge interval of 20 s for a current load of 8A, are shown in Figure 7 and Figure 8. The experiments were conducted using various combinations of parameters, including a purge interval of 10 and 20 s; purge durations ranging from 0.1 s to 1 s; currents of 1 A, 5 A, and 8 A; and pressures of 1, 5, and 7 bar. This study highlights four representative cases, as presented in Figure 5, Figure 6, Figure 7 and Figure 8. The remaining cases are covered by the scenarios discussed.
It was observed that the cell voltage experienced a temporary drop during purging due to several interrelated factors. When the purge valve opened, it expelled accumulated inert gases such as nitrogen and water vapor from the anode channel. This sudden release also flushed out a portion of hydrogen, leading to a rapid decrease in hydrogen partial pressure at the anode catalyst layer. The reduced hydrogen availability lowered the Nernst potential and increased the concentration overpotential, as the electrochemical reaction became temporarily starved of fuel. Additionally, the opening of the purge valve caused a sharp pressure drop in the anode channel, disrupting the steady hydrogen supply and further contributing to the voltage decline [29,30,31]. As a result, the cell voltage dropped during purging but recovered once the hydrogen concentration and pressure stabilized, as observed in previous studies.
Regarding nitrogen accumulation, in our experimental setup, pure hydrogen was supplied to the anode, while ambient air was used at the cathode. Therefore, any nitrogen present at the anode was not introduced through the hydrogen supply. Instead, since ambient air consists of approximately 78% nitrogen and 21% oxygen, a portion of the nitrogen can diffuse through the proton exchange membrane (PEM) from the cathode to the anode—a phenomenon known as nitrogen crossover. As the PEM is not perfectly selective, it permits small amounts of nitrogen (N2) to permeate across [6,7,8,9,10,32,33].
Furthermore, experimental observations indicate that the cell voltage was consistently higher when a buffer tank was used compared to when it was absent. Regardless of whether the condition involved low pressure with a short purge duration (Figure 5 and Figure 7) or high pressure with a long purge duration (Figure 6 and Figure 8), the buffer tank helped maintain a more stable hydrogen pressure. This stabilization mitigated the fluctuations in hydrogen availability during purging and supported a more consistent supply to the catalyst layer, ultimately resulting in improved and more stable cell voltage performance. It can be observed from Figure 6 that the cell voltage did not fully recover to its maximum value before purging occurred, indicating premature purging in the absence of flooding. In contrast, Figure 5 shows the voltage reaching its peak before gradually decreasing, signaling flooding onset and the necessity of purging to maintain performance. Therefore, as shown in Figure 6, purging before flooding led to unnecessary hydrogen loss and performance degradation. Even without flooding, unnecessary purging wasted hydrogen and caused rapid anode pressure drops that reduced hydrogen partial pressure at the catalyst layer, resulting in voltage instability. Frequent purging can induce mechanical strain on the membrane, potentially leading to the formation of pinholes or cracks, which in turn cause gas crossover and a rapid decline in open-circuit voltage [34]. Additionally, it increases energy consumption due to repeated valve actuation during purge cycles.
Furthermore, excessive purging can dry out the membrane by stripping water vapor, particularly under low-humidity conditions, impairing proton conductivity. Controlled purging is thus critical to minimize hydrogen loss and ensure stable, durable fuel cell operation.

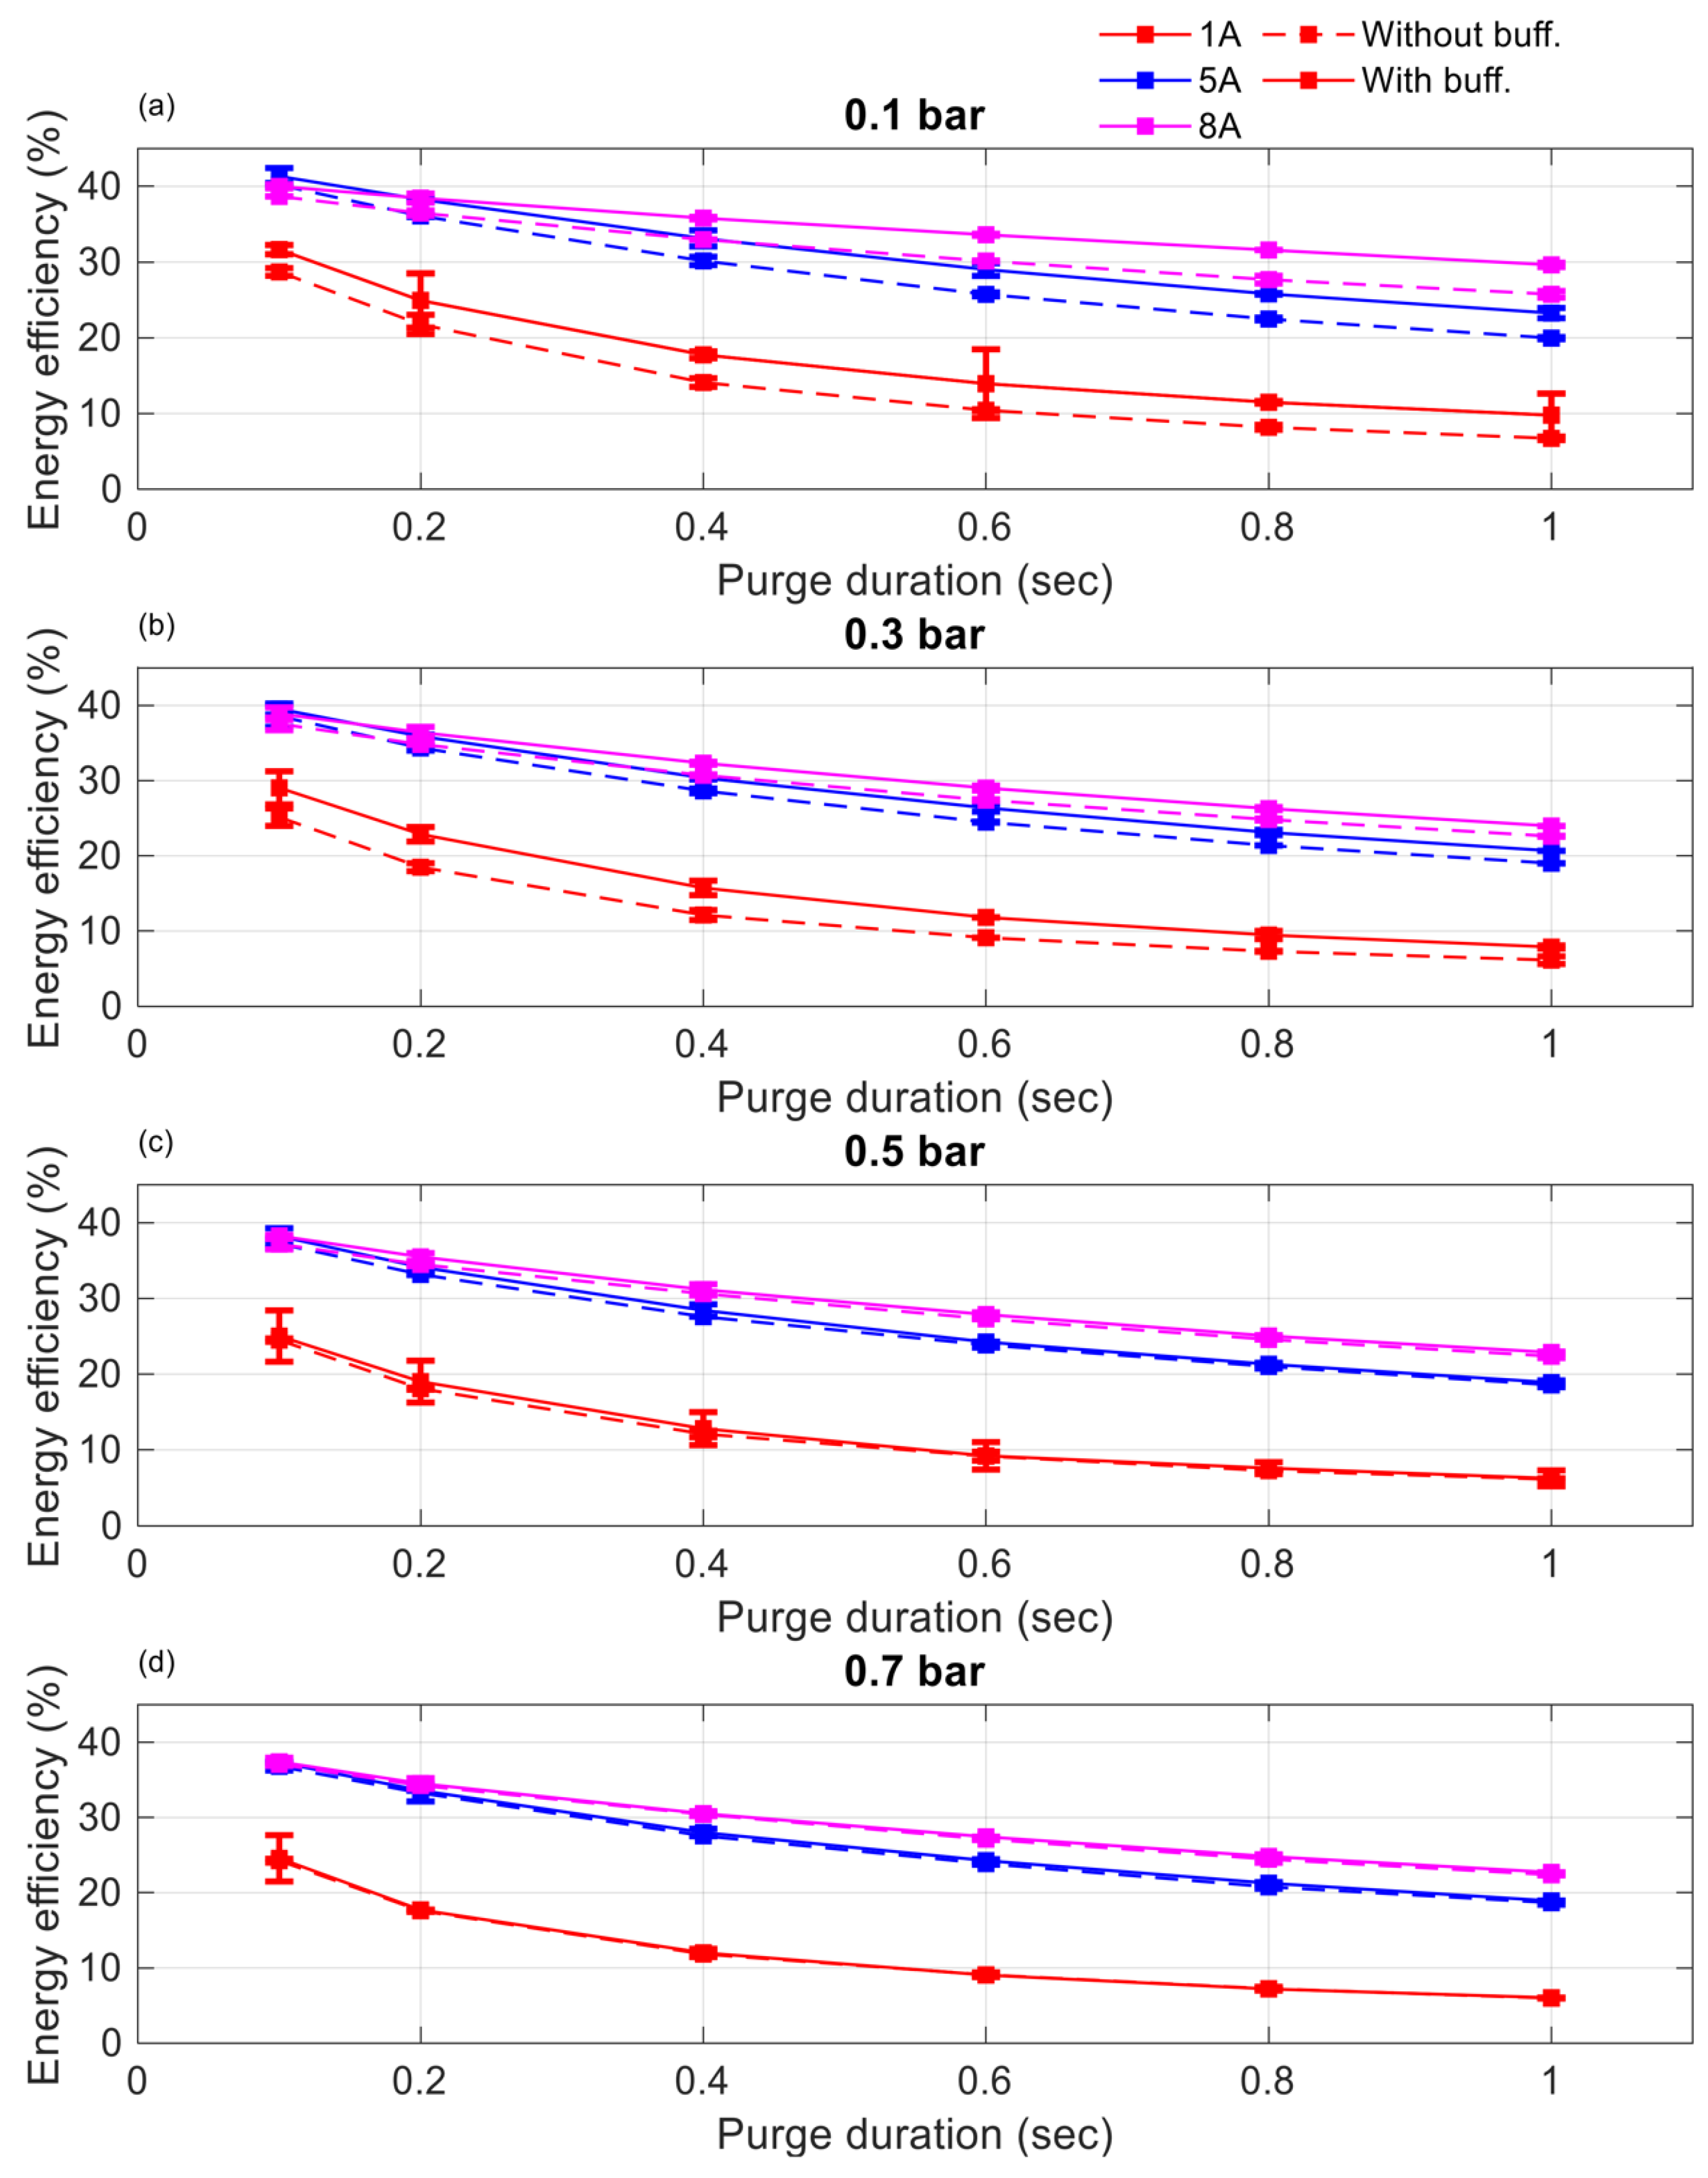
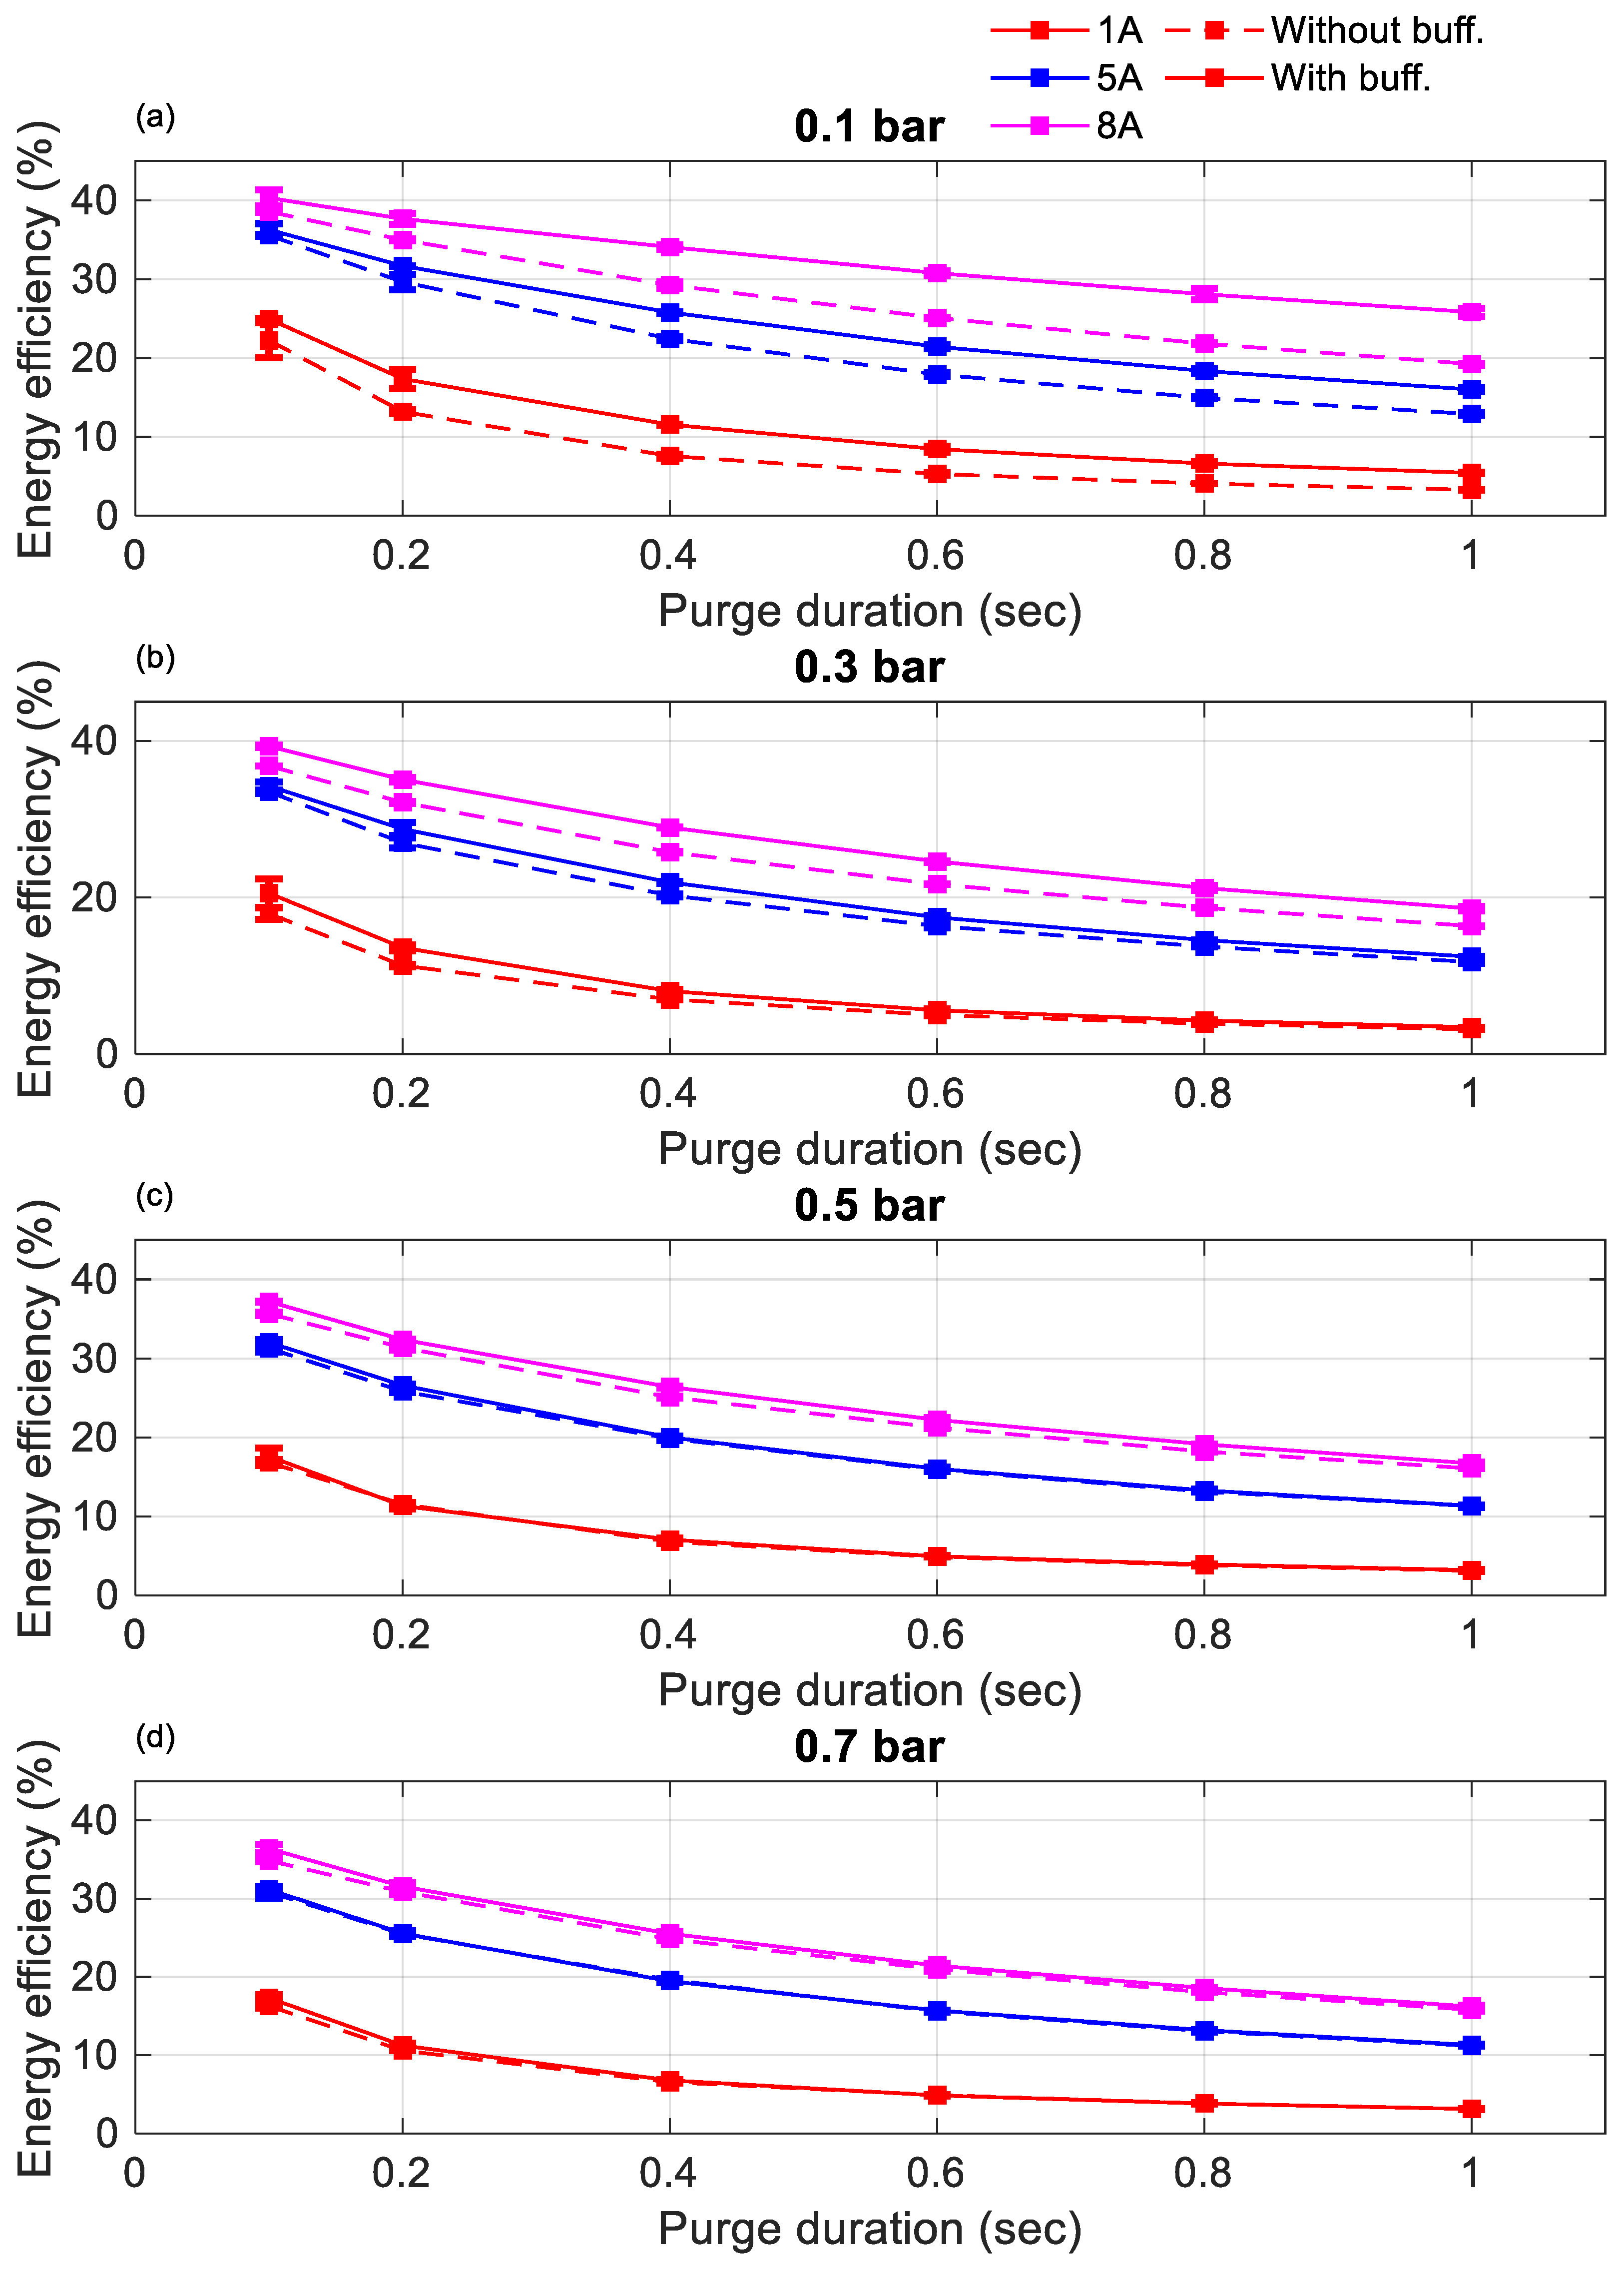
3.3. Effect of Purging Interval and Buffer Tank on Energy Efficiency

Figure 9 and Figure 10 present the impact of different supplied hydrogen pressures for purge intervals of 10 s and 20 s, respectively, comparing energy efficiency with and without a buffer tank. The results show that, at lower hydrogen pressures (0.1 and 0.3 bar), the buffer tank consistently enhanced energy efficiency across both purge intervals. However, at higher pressures (0.5 and 0.7 bar), energy efficiency was nearly identical regardless of the buffer’s presence. This observation aligns with the discussion in Section 3.1, indicating that the buffer tank became less effective at higher pressures, where it could not sufficiently conserve hydrogen during purge operations.
At elevated pressures, removing impurities such as accumulated nitrogen and water vapor from the anode was accelerated, resulting in faster voltage recovery. This observation aligns with the findings reported in [13]. However, the improved voltage recovery was accompanied by increased hydrogen loss during purging, which offset the voltage gains and reduced the overall energy efficiency. Although Figure 6 demonstrates that the buffer tank helped maintain a higher cell voltage than the non-buffered case, the additional hydrogen consumed during purging diminished this advantage. To optimize energy efficiency, an operational pressure range of 0.1–0.3 bar is recommended. Notably, the highest efficiency was observed at 0.1 bar, indicating that lower pressure, coupled with effective impurity and water management, provided the best balance between performance and hydrogen utilization.
Focusing on this low-pressure regime, the results across both 10 and 20 s purge intervals indicate that energy efficiency was consistently higher with a 20 s purge interval. This demonstrates that purge interval duration plays a critical role. In addition, energy efficiency is influenced by both purge duration and current load. However, a comprehensive analysis of these combined effects is beyond the scope of this manuscript and is reserved for future studies. The primary focus here was to evaluate the performance of the buffer tank under varying hydrogen pressure, purge configuration, and current load.
To further demonstrate the benefits of incorporating a buffer tank under optimal operating conditions, Table 2 presents a comparison of energy efficiency with and without a buffer at an anode pressure of 0.1 bar, evaluated across various current loads, purge intervals, and purge durations. Energy efficiency was calculated using Equation (1). The results clearly indicate that the buffer consistently enhanced energy efficiency under all tested conditions at this low-pressure setting.
To evaluate the effectiveness of this enhancement, the percentage of improvement was calculated by
P Impr = P w P w o P w o × 100 %
where Pw and Pwo denote the energy efficiency with and without a buffer, respectively. The result is presented in Table 3.
Observations indicate that the maximum energy efficiency was achieved with a purge duration of 0.1 s. However, it is noteworthy that the improvement in energy efficiency was lowest with the presence of the buffer. Additionally, higher currents resulted in higher energy efficiency, but the effectiveness of the buffer tank diminished, with improvements ranging from 2.0 to 4.4%, corresponding to 5 A and 8 A. This occurred as the fuel cell reached maximum energy efficiency under optimal operating conditions or a saturated state. However, under a current load of 1 A, although the energy efficiency was lower compared to the rates at 5 A and 8 A, the presence of the buffer tank was more effective, with improvements ranging from 10.1 to 12.1% compared to 5 A and 8 A.
Additionally, prolonged purge durations led to decreased energy efficiency, yet the presence of the buffer tank proved more effective. For instance, when considering a purge interval of 1.0 s, energy efficiency reached its lowest point due to the extended purge duration. However, notable enhancements in energy efficiency were observed, peaking at 33.7% for 8 A, 24% for 5 A, and 71% for 1 A. Similarly, in the case of a purge duration of 0.1 s, lower currents resulted in diminished energy efficiency, but the buffer tank’s effectiveness remained evident.
Thus, this comprehensive discussion has highlighted the effectiveness of the buffer tank. However, a deeper exploration of the effects of purge duration, purge interval, and load current is left for future studies. Generally, the presence of a buffer tank significantly enhances the energy efficiency of the fuel cell. However, it is most effective when the fuel cell has not reached optimal working conditions, which may be challenging to maintain in real operation. This result holds promise for future applications. It is applicable in real-world scenarios where energy-consuming devices may operate under variable loads rather than at a specific load, making it challenging to achieve optimal operating conditions.

4. Conclusions

This work presents a practical and effective method for enhancing the energy efficiency of PEMFCs operating in a dead-ended anode mode by integrating a buffer tank. Experimental comparisons across a wide range of purge intervals, durations, load currents, and hydrogen pressures demonstrate that the buffer tank offers the greatest benefit under non-optimal conditions—particularly at low pressures and low current loads. While efficiency gains under optimal conditions were modest (e.g., 3.3% at 8 A, 0.1 bar, and a purge duration of 0.1 s), substantial improvements of up to 71.9% were achieved at lower currents combined with longer purge durations. These findings underscore the buffer tank’s effectiveness in reducing hydrogen loss during purge events and stabilizing cell voltage. This approach is especially relevant for real-world applications where operating conditions fluctuate, making precise optimization challenging. Future research will focus on further optimizing purge strategies in conjunction with adaptive control methods to enhance overall system efficiency.

Author Contributions

T.-H.T.: conceptualization; methodology; software; writing—original draft preparation. K.K.: investigation; writing—review and editing. A.A.: conceptualization; methodology; software; writing—review and editing. Y.-S.C.: methodology; software; writing—review and editing; supervision; funding acquisition. All authors have read and agreed to the published version of the manuscript.

Funding

This study was funded by National Science and Technology Council, Taiwan, under Project Number 106-2221-E-194-033-MY3.

Data Availability Statement

The original contributions presented in the study are included in the article; further inquiries can be directed to the first/corresponding author.

Acknowledgments

The authors gratefully acknowledge the financial support from the National Science and Technology Council, Taiwan, under Project Number 106-2221-E-194-033-MY3.

Conflicts of Interest

The authors declare no conflicts of interest.

References

  1. Zhou, H.; Dai, J.; Chen, X.; Hu, B.; Wei, H.; Cai, H.H. Understanding innovation of new energy industry: Observing development trend and evolution of hydrogen fuel cell based on patent mining. Int. J. Hydrogen Energy 2024, 52, 548–560. [Google Scholar] [CrossRef]
  2. Zhou, Y.; Chen, B. Investigation of optimization and evaluation criteria for flow field in proton exchange membrane fuel cell: A critical review. Renew. Sustain. Energy Rev. 2023, 185, 113584. [Google Scholar] [CrossRef]
  3. Wee, J.-H. Applications of proton exchange membrane fuel cell systems. Renew. Sustain. Energy Rev. 2007, 11, 1720–1738. [Google Scholar] [CrossRef]
  4. Hu, B.; Qu, Z.; Tao, W. A comprehensive system-level model for performance evaluation of proton exchange membrane fuel cell system with dead-ended anode mode. Appl. Energy 2023, 347, 121327. [Google Scholar] [CrossRef]
  5. Liu, Y.; Zhao, J.; Tu, Z. Detecting performance degradation in a dead-ended hydrogen-oxygen proton exchange membrane fuel cell used for an unmanned underwater vehicle. Renew. Energy 2024, 222, 119950. [Google Scholar] [CrossRef]
  6. Lin, H.; Jian, Q.; Bai, X.; Huang, W.; Feng, S. Mitigating performance deterioration analysis of VC-PEMFC with dead-ended anode by pulsation fuel supplying mode. Int. J. Hydrogen Energy 2023, 48, 10144–10159. [Google Scholar] [CrossRef]
  7. Taghiabadi, M.M. Analysis of performance degradation in the dead-ended anode proton exchange membrane fuel cell under different load profiles. Fuel 2024, 57, 129879. [Google Scholar] [CrossRef]
  8. Baumgartner, W.R.; Parz, P.; Fraser, S.; Wallnöfer, E.; Hacker, V. Polarization study of a PEMFC with four reference electrodes at hydrogen starvation conditions. J. Power Sources 2008, 182, 413–421. [Google Scholar] [CrossRef]
  9. Chen, J.; Siegel, J.B.; Matsuura, T.; Stefanopoulou, A.G. Carbon corrosion in PEM fuel cell dead-ended anode operations. J. Electrochem. Soc. 2011, 158, B1164. [Google Scholar] [CrossRef]
  10. Abbou, S.; Dillet, J.; Spernjak, D.; Mukundan, R.; Fairweather, J.D.; Borup, R.L.; Maranzana, G.; Didierjean, S.; Lottin, O. Time evolution of local potentials during PEM fuel cell operation with dead-ended anode. ECS Trans. 2013, 58, 1631. [Google Scholar] [CrossRef]
  11. Yang, Y.; Zhang, X.; Guo, L.; Liu, H. Mechanisms of voltage spikes and mitigation strategies for proton exchange membrane fuel cells with dead-ended anode under pressure swing operation. Int. J. Hydrogen Energy 2017, 42, 28578–28587. [Google Scholar] [CrossRef]
  12. Tsai, S.-W.; Chen, Y.-S. A mathematical model to study the energy efficiency of a proton exchange membrane fuel cell with a dead-ended anode. Appl. Energy 2017, 188, 151–159. [Google Scholar] [CrossRef]
  13. Lu, Y.; Wang, X.; Yang, G.; Gong, D.; Xu, S. Experimental study on the influence of operating conditions on performance decline with periodic anode purges in a vehicular PEMFC stack. Int. J. Hydrogen Energy 2024, 69, 1276–1286. [Google Scholar] [CrossRef]
  14. Strahl, S.; Husar, A.; Riera, J. Experimental study of hydrogen purge effects on performance and efficiency of an open-cathode Proton Exchange Membrane fuel cell system. J. Power Sources 2014, 248, 474–482. [Google Scholar] [CrossRef]
  15. Chen, J.; Siegel, J.B.; Stefanopoulou, A.G.; Waldecker, J.R. Optimization of purge cycle for dead-ended anode fuel cell operation. Int. J. Hydrogen Energy 2013, 38, 5092–5105. [Google Scholar] [CrossRef]
  16. De las Heras, A.; Vivas, F.; Segura, F.; Andújar, J. How the BoP configuration affects the performance in an air-cooled polymer electrolyte fuel cell. Keys to design the best configuration. Int. J. Hydrogen Energy 2017, 42, 12841–12855. [Google Scholar] [CrossRef]
  17. Choi, J.W.; Hwang, Y.-S.; Cha, S.W.; Kim, M.S. Experimental study on enhancing the fuel efficiency of an anodic dead-end mode polymer electrolyte membrane fuel cell by oscillating the hydrogen. Int. J. Hydrogen Energy 2010, 35, 12469–12479. [Google Scholar] [CrossRef]
  18. Okedi, T.I.; Meyer, Q.; Hunter, H.M.; Shearing, P.R.; Brett, D.J. Development of a polymer electrolyte fuel cell dead-ended anode purge strategy for use with a nitrogen-containing hydrogen gas supply. Int. J. Hydrogen Energy 2017, 42, 13850–13859. [Google Scholar] [CrossRef]
  19. Gomez, A.; Sasmito, A.P.; Shamim, T. Investigation of the purging effect on a dead-end anode PEM fuel cell-powered vehicle during segments of a European driving cycle. Energy Convers. Manag. 2015, 106, 951–957. [Google Scholar] [CrossRef]
  20. Yang, G.; Meng, K.; Deng, Q.; Chen, W.; Chen, B. Numerical investigation and experimental verification of liquid water dynamic transfer characteristics in the flow field of PEMFC with dead-ended anode during gas purging. Chem. Eng. J. 2024, 491, 152082. [Google Scholar] [CrossRef]
  21. Zhang, Z.; Wei, H.; Xiao, Y.; Cheng, C.; Tian, J.; Li, X.; Liu, J.; Liu, Z. Research on shutdown purge characteristics of proton exchange membrane fuel cells: Purge parameters conspicuity and residual water. Appl. Therm. Eng. 2024, 249, 123437. [Google Scholar] [CrossRef]
  22. Yu, X.; Guan, Y.; Cai, S.; Tu, Z.; Chan, S.H. An experimental study on the hydrogen utilization in air-cooled proton exchange membrane fuel cell stack with a novel anode outlet design. Renew. Energy 2024, 231, 120990. [Google Scholar] [CrossRef]
  23. Wang, R.; Li, K.; Ming, Y.; Guo, W.; Deng, B.; Tang, H. An enhanced salp swarm algorithm with chaotic mapping and dynamic learning for optimizing purge process of proton exchange membrane fuel cell systems. Energy 2024, 308, 132852. [Google Scholar] [CrossRef]
  24. Gong, K.; Tian, C.; Guo, Z.; Chen, L.; Xu, W.; Tao, W.-Q. Experimental investigation on the open cathode air-cooled proton exchange membrane fuel cells: Optimum operating parameters and control strategies. Int. J. Hydrogen Energy 2024, 60, 1134–1146. [Google Scholar] [CrossRef]
  25. Liu, Y.; Zhao, J.; Tu, Z.; Chan, S.H. Optimization strategies to mitigate reactant starvation in a dead-ended hydrogen–oxygen proton exchange membrane fuel cell during cyclic loading. Fuel 2024, 357, 129886. [Google Scholar] [CrossRef]
  26. Jang, J.-H.; Yan, W.-M.; Chiu, H.-C.; Lui, J.-Y. Dynamic cell performance of kW-grade proton exchange membrane fuel cell stack with dead-ended anode. Appl. Energy 2015, 142, 108–114. [Google Scholar] [CrossRef]
  27. Lin, Y.-F.; Chen, Y.-S. Experimental study on the optimal purge duration of a proton exchange membrane fuel cell with a dead-ended anode. J. Power Sources 2017, 340, 176–182. [Google Scholar] [CrossRef]
  28. Bevilacqua, N.; Schmid, M.; Zeis, R. Understanding the role of the anode on the polarization losses in high-temperature polymer electrolyte membrane fuel cells using the distribution of relaxation times analysis. J. Power Sources 2020, 471, 228469. [Google Scholar] [CrossRef]
  29. Smith, P.J.; Bennett, W.R.; Jakupca, I.J.; Gilligan, R.P.; Edwards, L.G. Effect of Reactant Pressure on Proton Exchange Membrane Fuel Cell Performance. NASA/TP-20205011192. 2021. Available online: https://ntrs.nasa.gov/citations/20205011192 (accessed on 22 April 2025).
  30. Khotseng, L. Fuel cell thermodynamics. In Thermodynamics and Energy Engineering; IntechOpen: London, UK, 2019; pp. 25–75. [Google Scholar]
  31. Matsuura, T.; Chen, J.; Siegel, J.B.; Stefanopoulou, A.G. Degradation phenomena in PEM fuel cell with dead-ended anode. Int. J. Hydrogen Energy 2013, 38, 11346–11356. [Google Scholar] [CrossRef]
  32. Matsuura, T.; Chen, J.; Siegel, J.B.; Stefanopoulou, A.G. Analysis of the behavior and degradation in proton exchange membrane fuel cells with a dead-ended anode. J. Power Sources 2014, 246, 90–99. [Google Scholar] [CrossRef]
  33. Yang, C.-W.; Chen, Y.-S. A mathematical model to study the performance of a proton exchange membrane fuel cell in a dead-ended anode mode. Appl. Energy 2014, 130, 113–121. [Google Scholar] [CrossRef]
  34. Wu, B.; Parkes, M.A.; de Benedetti, L.; Marquis, A.J.; Offer, G.J.; Brandon, N.P. Real-time monitoring of proton exchange membrane fuel cell stack failure. J. Appl. Electrochem. 2016, 46, 25–36. [Google Scholar] [CrossRef]
Figure 1. A schematic representation of the experimental setup.
Energies 18 03342 g001
Figure 2. A photograph of the in-house experimental setup used in this study.
Energies 18 03342 g002
Figure 3. The effect of purging duration and buffer tank on the mass flow rate with a purge interval of 10 s and a current of 5 A (a) 0.1 bar, (b) 0.3 bar, (c) 0.5 bar, (d) 0.7 bar.
Energies 18 03342 g003
Figure 4. The effect of purging duration and buffer tank on the mass flow rate with a purge interval of 20 s and current of 8 A (a) 0.1 bar, (b) 0.3 bar, (c) 0.5 bar, (d) 0.7 bar.
Energies 18 03342 g004
Figure 5. The effect of purging duration and buffer tank on voltage with a purge interval of 10 s, current of 8 A, pressure of 0.1 bar, and purge duration of 0.1 s (a) with buffer tank, (b) without buffer tank.
Energies 18 03342 g005
Figure 6. The effect of purging duration and buffer tank on voltage with a purge interval of 10 s, current of 8 A, pressure of 0.7 bar, and purge duration of 1 s (a) with buffer tank, (b) without buffer tank.
Energies 18 03342 g006
Figure 7. The effect of purging duration and buffer tank on voltage with a purge interval of 20 s, current of 8 A, pressure of 0.1 bar, and purge duration of 0.1 s (a) with buffer tank, (b) without buffer tank.
Energies 18 03342 g007
Figure 8. The effect of purging duration and buffer tank on voltage with a purge interval of 20 s, current of 8 A, pressure of 0.7 bar, and purge duration of 1 s (a) with buffer tank, (b) without buffer tank.
Energies 18 03342 g008
Figure 9. Energy efficiency comparison between cases without a buffer tank and with a buffer tank with a purge interval of 10 s at 1 A, 5 A, and 8 A (a) 0.1 bar, (b) 0.3 bar, (c) 0.5 bar, (d) 0.7 bar.
Energies 18 03342 g009
Figure 10. Energy efficiency comparison between cases without a buffer tank and with a buffer tank with a purge interval of 20 s at 1 A, 5 A, and 8 A (a) 0.1 bar, (b) 0.3 bar, (c) 0.5 bar, (d) 0.7 bar.
Energies 18 03342 g010
Table 1. The setting parameter used in this study.
Purge interval 10 s, 20 s
Purge duration0.1, 0.2, 0.4, 0.6, 0.8, and 1.0 s
Current load1 A, 5 A, 8 A
Anode pressure0.1 bar, 0.3 bar, 0.5 bar, and 0.7 bar
Hydrogen pressure0.1 bar, 0.3 bar, 0.5 bar, 0.7 bar
Temperature64 °C
Buffer tankWithout a buffer tank and with a buffer tank
Table 2. The comparison of energy efficiency with and without a buffer at a hydrogen pressure of 0.1 bar across various load currents, purge intervals, and purge durations.
Operating ConditionPurge Duration
0.1 s0.2 s0.4 s0.6 s0.8 s1.0 s
Current LoadPurge IntervalWWoWWoWWoWWoWWoWWo
8 A10 s40.338.637.735.034.929.330.825.128.121.825.819.3
20 s4038.738.536.535.833.033.630.031.627.729.625.7
5 A10 s36.335.631.729.725.822.521.417.918.415.016.012.9
20 s41.340.138.336.133.130.129.025.725.822.523.320
1 A10 s2522.317.413.211.67.68.55.36.64.15.53.2
20 s31.628.724.521.817.814.114.010.411.58.210.06.7
Table 3. The improvement in energy efficiency with a buffer at a hydrogen pressure of 0.1 bar across various load currents, purge intervals, and purge durations.
Operating ConditionPurge Duration
Current LoadPurge Interval0.1 s0.2 s0.4 s0.6 s0.8 s1.0 s
8 A10 s4.47.719.122.728.933.7
20 s3.45.58.512.014.115.2
5 A10 s2.06.714.719.622.724.0
20 s3.06.110.012.814.716.5
1 A10 s12.131.852.660.461.071.9
20 s10.112.426.234.640.249.3
Disclaimer/Publisher’s Note: The statements, opinions and data contained in all publications are solely those of the individual author(s) and contributor(s) and not of MDPI and/or the editor(s). MDPI and/or the editor(s) disclaim responsibility for any injury to people or property resulting from any ideas, methods, instructions or products referred to in the content.

