Article

Renewable Energy and CO2 Emissions: Analysis of the Life Cycle and Impact on the Ecosystem in the Context of Energy Mix Changes

1
Doctoral School, Military University of Technology, 00-908 Warsaw, Poland
2
3rd School Battalion, Military University of Technology, 00-908 Warsaw, Poland
3
Faculty of Security, Logistics and Management, Military University of Technology, 00-908 Warsaw, Poland
*
Authors to whom correspondence should be addressed.
Energies 2025, 18(13), 3332; https://doi.org/10.3390/en18133332
Submission received: 5 June 2025 / Revised: 19 June 2025 / Accepted: 23 June 2025 / Published: 25 June 2025
(This article belongs to the Section B: Energy and Environment)

Abstract

This study provides a comprehensive life-cycle assessment (LCA) of renewable energy sources, focusing on the CO 2 emissions and ecological impacts associated with photovoltaic (PV) systems and wind energy technologies. The research evaluates emissions from raw material extraction, production, operation, and disposal, as well as the role of energy-storage systems. Photovoltaic systems exhibit life-cycle CO 2 emissions ranging between 28–100 [g CO 2 eq/kWh], influenced by factors like production energy mix and panel efficiency. Wind turbines demonstrate lower emissions, approximately 7–38 [g CO 2 eq/kWh], with variations based on turbine type and operational conditions. Despite low operational emissions, the full environmental impact of renewables includes biodiversity disruptions, land use changes, and material recycling challenges. The findings highlight that while renewable technologies significantly reduce CO 2 emissions compared to fossil fuels, their ecological footprint necessitates integrated sustainability strategies. The analysis supports policymakers and stakeholders in making informed decisions for a balanced energy transition, emphasizing the need for continued innovation in renewable technology life-cycle management.

1. Introduction

In response to the escalating climate crisis and the imperative to cut greenhouse gas emissions, renewable energy is increasingly recognized as a crucial component of the energy transition. Technologies like solar, wind, and hydroelectric power are becoming vital alternatives to fossil fuels, which are significant contributors to carbon dioxide ( CO 2 ) emissions. While renewable energy sources (RES) have low CO 2 emissions during operation, their complete environmental impact is fully understood only through a life-cycle assessment (LCA). The available literature is based on the assessments within the life-cycle analysis, but there is a lack of studies for Poland’s case that would assess the impact of RES throughout the entire life cycle of the system—from the acquisition of raw materials and the production of components to their disposal or recycling. This research gap has therefore become the focus of this article.
The aim of the study is to conduct a comprehensive life-cycle analysis (LCA) of renewable energy technologies, with particular emphasis on photovoltaics and wind energy, in the context of CO 2 emissions. Additionally, the paper analyses the impacts of these technologies on local ecosystems, including land use and potential disruption to biodiversity. This study is based on following key research questions:
  • What are the total life-cycle CO 2 emissions of photovoltaic and wind energy, taking into account Poland’s specific conditions and the country’s electric energy demand?
  • What are the environmental impacts, beyond CO 2 emissions, resulting from the operation of photovoltaic systems and wind farms?
  • Within what timeframe, can Poland achieve the targeted level of installed capacity in renewable energy sources?
In response to the research questions posed and the stated aim of study, a specific research methodology was adopted. The overall research framework and methodological sequence are illustrated in Figure 1.
Poland was selected as the geographical focus of this study in order to contextualize the life-cycle assessment of renewable energy technologies within a specific national framework. To conduct the analyses presented in this paper, the most relevant and credible data sources were selected. The selection process was guided by criteria such as data recency, geographical relevance, institutional reliability, and the transparency of data aggregation and presentation. The study focused on compiling and synthesizing existing information on CO 2 emissions from a range of publicly available sources, including reports by international organizations, governmental publications, and statistical databases, in order to present a coherent overview tailored to the Polish context.
The article is structured into several sections. The study begins with an introduction to the research topic. This section also outlines the research objective and its significance, as well as formulates the research questions. Next, in chapter two, the theoretical basis of the study is presented, taking into account the assumption of zero-emission renewable energy and analyzing CO 2 emissions in energy production from RES. The third chapter analyses the implementation of photovoltaic and wind energy technologies in terms of their life-cycle CO 2 emissions and wider environmental impacts within the case study of Poland. The fourth chapter compares the life-cycle emissions of conventional energy and renewable energy sources with reference to Poland’s annual energy demand. Then, three different mathematical models are developed to analyze the trends in the use of renewable energy sources in Poland and to estimate the time needed to achieve the planned capacity. Finally, the study ends with a general summary, a presentation of contribution, discussion of limitations, and potential directions for future research.
The approach adopted provides an objective evaluation of the “greenness” of renewable energy sources, taking into account not only emissions but also broader environmental impacts. It is expected that the analysis will provide a balance sheet that will be the real impact on the environment from the entire life cycle from production to use. This balance sheet was used to assess how RES actually contributed to the impact on CO 2 emissions in Poland. This study is designed not only to compare the CO 2 emissions associated with different types of renewable energy, but also to provide a broader picture of their impact on the environment. The analysis focused on the two most widely used technologies: photovoltaics and wind energy. This selection is based on several factors. Firstly, both photovoltaic installations and wind farms are among the fastest-growing segments of the global renewable energy market. Their growing popularity is driven by the need to reduce greenhouse gas emissions and achieve energy independence in many countries [1]. Secondly, both technologies have relatively low CO 2 emissions throughout their entire life cycle, from the production of components to operation and disposal. Thirdly, while they are considered environmentally friendly, they actually impact the environment in various ways. This complexity of impact makes the study of photovoltaic and wind energy systems not only justified but also necessary for the conscious planning of future energy and environmental policies. The results can provide valuable support to policymakers, spatial planners, and investors, allowing them to make more informed and sustainable decisions about the development of the energy sector.

2. Theoretical Foundations of Research

2.1. Discussion on the Assumption of Zero-Emission Renewable Energy
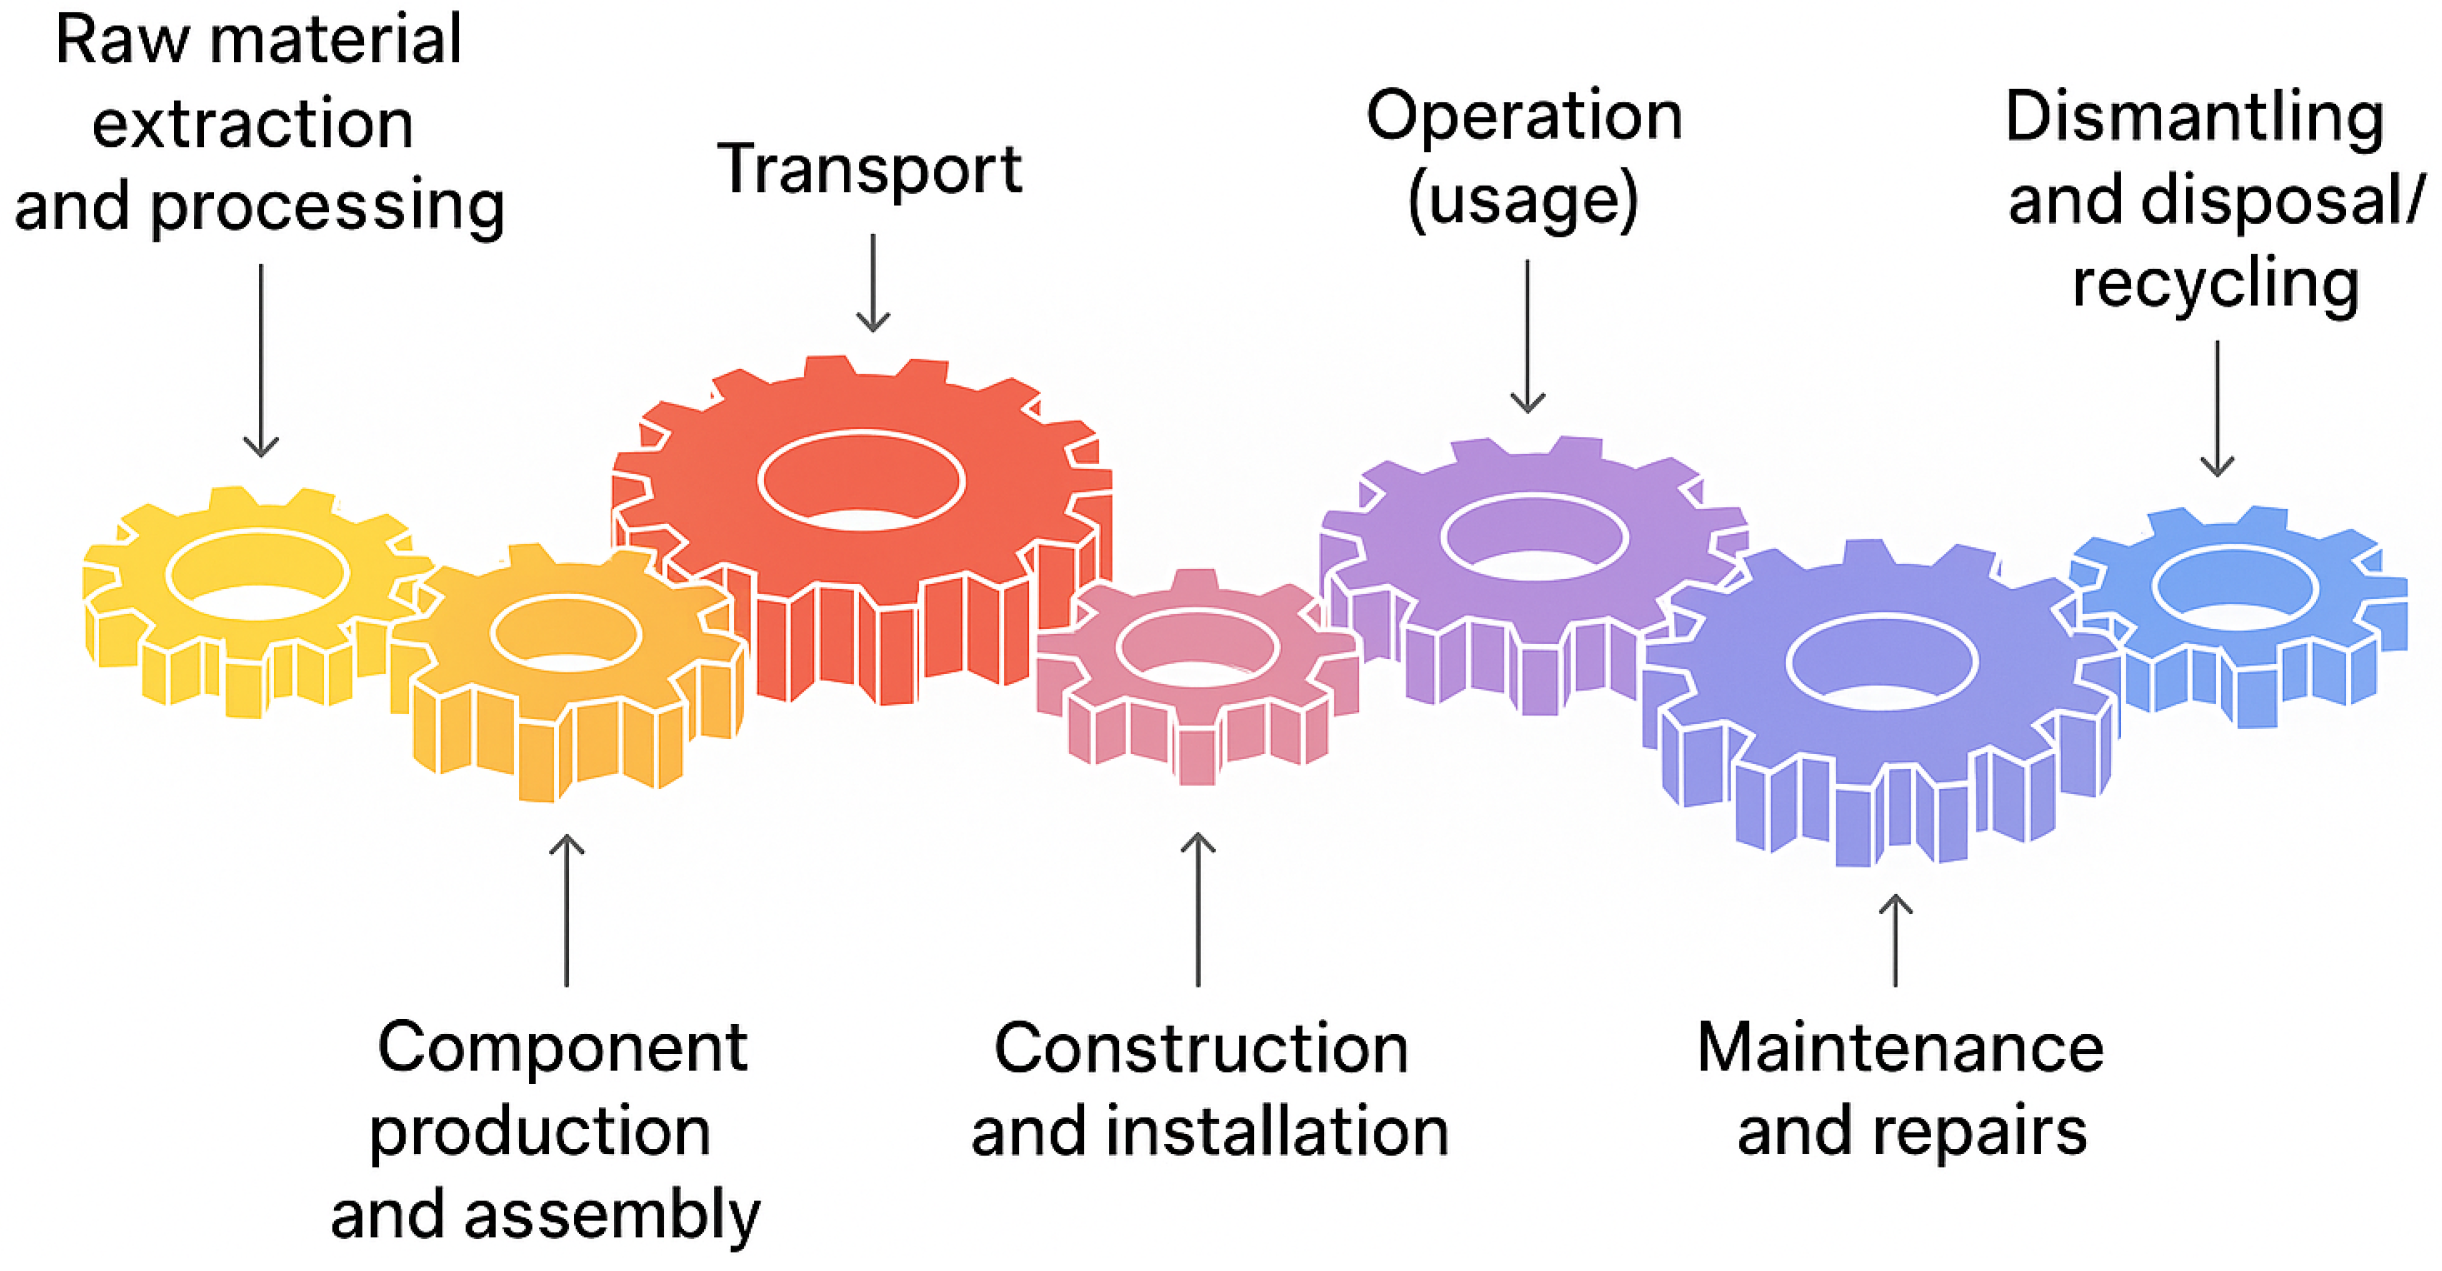
In the face of the growing climate crisis and the need to reduce greenhouse gas emissions, renewable energy (RES) is gaining importance as a key element of the global energy transition [2,3]. Governments, international organizations and the public increasingly perceive renewable energy sources as “clean” and “green” energy sources that, unlike fossil fuels, do not contribute to global warming during their operation [4,5]. This narrative posits that numerous renewable energy sources, including wind and solar, convert natural resources into electricity without directly burning fuels. Consequently, it is widely assumed that the production of renewable energy is environmentally beneficial and virtually devoid of carbon dioxide emissions, particularly during the power generation process [6,7]. This argument is frequently presented in the context of the direct operation of renewable energy installations, such as solar panels that convert sunlight into electricity and wind turbines that convert wind energy into electricity, without releasing carbon dioxide ( CO 2 ) into the atmosphere. However, such a simplified view ignores the complexity of the processes involved in the entire life cycle of renewable technologies [8,9].
Current research on the environmental impact of solar energy has focused primarily on life-cycle assessment (LCA) analysis, with a main focus on greenhouse gas emissions and energy payback time [10,11,12,13]. Much less attention was paid to other factors, such as emissions of hazardous substances [14,15], pressure on proper land usage [16,17], usage of water resources [18,19], impact on living nature [20,21], or changes to albedo [22,23]. The LCA methodology allows for a detailed representation of material and energy flows throughout the entire life cycle of the system—from extraction of raw materials and the production of components, through their installation and operation, to the final phase of disassembly, recycling or disposal. The stages of installation and use of photovoltaic systems are still poorly documented, and the available studies on the operational phase are few and mostly do not contain quantitative data [24,25]. While a number of environmental reports have been published in recent years, including programmatic statements of BLM (Bureau of Land Management) and DOE (PEIS) (Department of Energy (Programmatic Environmental Impact Statement (PEIS)) agencies in the United States [26,27], with the increasing scale of solar investments—covering tens of thousands of acres—it becomes necessary to conduct in-depth environmental analyses of the installation and operation phases. In addition, the impact of solar systems on local ecosystems remains poorly understood [28,29]. In the light of the above, the need for a systemic approach to the environmental impacts of solar energy is becoming particularly urgent. Therefore, the intention of this article is to make a critical analysis of the zero-emission of RES by examining emissions generated at all stages of the life cycle of renewable energy technologies, including during the extraction of raw materials, production of components, transport, installation, operation, and disposal or recycling. In addition, the article will address the issue of the potential impact of renewable energy production on ecosystems, which is often overlooked in discussions focusing exclusively on CO 2 emissions. Relying on an incomplete picture of the environmental consequences of RES development can lead to inappropriate strategies and, as a result, hinder the achievement of a truly sustainable energy system. Another motivation for the research is that the simplistic perception of renewable energy as completely emission-free may inadvertently discourage in-depth analysis of its less obvious environmental burdens. As a result, the potential negative impacts may be overlooked or underestimated, hindering the development of truly sustainable solutions. The urgent need to combat climate change means that renewable energy is often presented as the main solution. However, this urgency should not come at the expense of rigorous scientific analysis. If the public and policymakers believe that renewable energy is unconditionally emission-free it could reduce the incentive to address the emissions associated with its production and disposal, as well as its ecological impacts. This could delay the identification and mitigation of these issues, potentially undermining the long-term sustainability of the energy transition. Achieving true sustainability in the energy sector requires a paradigm shift from a simple focus on operational emissions to a holistic life-cycle perspective. This change requires increased transparency with regard to environmental trade-offs related to all energy sources, including renewable energy. By fostering a more informed understanding, it is possible to encourage responsible consumption, stimulate innovation towards minimizing the overall environmental footprint of energy technologies, and make more effective policy decisions. Current discourse often highlights the contrast between undesirable fossil fuels and emission-free renewables, relying mainly on operational emissions. However, in order to make truly informed decisions about the energy future, it is essential to move beyond this binary divide and take an inquisitive stance on the environmental impact throughout the life cycle of all energy technologies. This includes recognizing the emissions and environmental impacts associated with the production, use, and disposal of both fossil fuels and renewable energy. Only through a comprehensive perspective is it possible to foster a more responsible and effective approach to building a sustainable energy system.

2.2. Life-Cycle Analysis of CO 2 Emissions in Renewable Energy Production

2.2.1. Life-Cycle CO 2 Emissions of Photovoltaic Systems

The carbon footprint of photovoltaic (PV) systems is the result of greenhouse gas emissions generated at every stage of their life, from raw material extraction to disposal [30]. The life cycle of solar panels includes the extraction and processing of raw materials (incl. silicon, silver, aluminum, copper, and tellurium), the production of modules and components, transport, installation, operation and, at the end of their useful life, recycling, or disposal [30,31]. Understanding emissions at each of these stages is crucial to assessing the true environmental impact of photovoltaics. The production process of polysilicon, the basic material for the production of solar cells, is particularly energy-intensive. The high temperatures (1500–2000 °C) required to refine silicon from quartz result in significant energy consumption, which in many regions, especially in China, a major producer of polysilicon, comes from coal-fired power plants, thus generating significant CO 2 emissions [32]. In addition, the downstream production steps, such as wafer manufacturing, cell production and module assembly, are also characterized by high energy consumption and the use of chemicals that can emit CO 2 [33]. The life-cycle CO 2 emissions of PV systems are estimated to be between around 28 and 100 [g/kWh] of electricity generated [34]. These values vary depending on a number of factors, such as the location of production (and therefore the energy mix used for production), the technology used (e.g., monocrystalline vs. polycrystalline panels), the efficiency of the panels, and the level of sunlight at the installation site. Nevertheless, the transportation of solar panels around the world, often from production sites to remote installation sites, also generates CO 2 emissions from the combustion of fuels by ships, trains, and cars. However, it should be emphasized that solar panels do not emit CO 2 during the operation phase [34]. It is the lack of direct emissions during energy generation that is the main advantage of photovoltaics over conventional energy sources. An important indicator is the so-called “carbon payback time”, i.e., the period during which a solar panel will produce enough clean energy to offset the CO 2 emissions generated during its production and transport. The payback time depends on many factors, such as the panel technology, the location of the installation and the CO 2 intensity of the energy mix of the region.
For example, for modern PV utility systems in the US, a 2023 National Renewable Energy Laboratory (NREL) study found [35] that for industrial-scale in the U.S., the payback time for CO 2 emissions is between 0.5 and 1.2 years, depending on location and intensity of sunlight. An analysis of PV systems in California indicates a CPBT in the range of 7 to 13 months, depending on the technology used, such as Multi-Si, PERC, PST, or TOPCon [36]. For BIPV systems, the CO 2 payback time can be between 3.0 and 7.4 years, which is still significantly shorter than the typical lifetime of these systems [37]. Panels based on CdTe technology have the shortest CO 2 payback time of less than 1 year. However, there are potential environmental risks associated with cadmium toxicity [38]. Taking into account that the lifespan of solar panels is estimated at 25–30 years [39], they generate energy with zero operational emissions for most of their lifetime, contributing to the reduction of the overall carbon footprint of the energy system. In addition, there is the potential to recycle most materials used in solar panels, such as glass, aluminum, silicon, and copper [40]. Efficient recycling can significantly reduce the final environmental impact of panels and reduce the need for new raw materials, which in turn will contribute to reducing emissions associated with their extraction and processing. The variability in the estimated CO 2 emissions over the entire life cycle of photovoltaics, which ranges from around 28 to 100 g [ CO 2 eq/kWh], highlights the importance of considering the specific production processes, geographical location of production and the efficiency of solar technology when assessing its environmental impact. Panels produced using cleaner energy sources in the manufacturing process and with higher efficiency will have a lower overall carbon footprint. A wide range of estimates suggests that “solar energy” is not homogeneous in terms of environmental impact. Factors such as the energy mix used in production (carbon-based vs. renewable), the specific type of solar cell technology (thin-film vs. silicon, monocrystalline vs. polycrystalline), and even the intensity of sunlight at the installation site (affecting the amount of electricity generated over the life of the panel) all play a significant role in determining the overall carbon footprint.
Although the carbon payback time for photovoltaics is relatively short (2–5 years), the initial emissions during production represent a “carbon debt” that needs to be taken into account in the short and medium term, especially in the context of urgent climate action. The rapid deployment of solar energy will initially lead to an increase in production-related emissions, which will only be offset over time when the panels generate clean electricity. This temporal aspect of the carbon footprint is crucial for understanding the immediate and long-term effects of a large-scale transition to solar energy. It may therefore be necessary to focus on optimizing production processes, using cleaner energy in production, and prioritizing the implementation of the most efficient technologies to minimize this initial carbon debt and accelerate the transition to net-zero emissions.
The increasing emphasis on recycling solar panel materials at the end of their life represents a significant opportunity to further reduce the environmental impact of solar energy. By recovering valuable materials such as silicon, silver and aluminum, it is possible to reduce the need for primary resources, the extraction of which is often associated with high energy consumption and environmental degradation during mining and processing. Establishing efficient and widespread recycling infrastructure and technologies will be key to realizing the full potential of solar energy as a truly sustainable and circular energy solution. The current lifespan of solar panels (25–30 years) means that there will soon be a huge problem with the increasing number of used panels that need to be disposed of. If these panels simply end up in landfills, they will not only be a waste of valuable resources, but they can also pose environmental risks due to the presence of certain hazardous materials. Investing in advanced recycling technologies that can efficiently recover various solar panel components, along with establishing robust collection and treatment systems, will be essential to closing the loop and minimizing the long-term environmental footprint of the solar energy industry. This will not only reduce the need for energy-intensive raw material extraction, but also reduce the potential for pollution and resource depletion associated with the linear take-make-dispose model. The European WEEE (Waste Electrical and Electronic Equipment) directive already obliges manufacturers of PV panels to be responsible for their disposal, which is conducive to the creation of dedicated treatment plants [41]. As a result, the CO 2 emissions and environmental impact of photovoltaics, although dependent on the energy source used in the production process, are now quite well controlled (better than in the case of turbine blade recycling).

2.2.2. Life-Cycle CO2 Emissions of Wind Turbines

As with photovoltaics, assessing the carbon footprint of wind energy requires an analysis of emissions at all stages of the life cycle of wind turbines. These stages include the extraction of raw materials (mainly steel, concrete, aluminum, and copper), the production of turbine components (blades, tower, nacelle), transport, installation, operation, and disassembly and disposal. The manufacturing process, and in particular the production of the steel and concrete used in the construction of the tower and foundations, accounts for a significant proportion (often more than 80%) of the total emissions over the entire life cycle of a wind turbine [42]. Both the production of steel and cement, the main component of concrete, are highly energy-intensive processes, which translates into a high carbon footprint. The transport of large and heavy turbine components, especially in the case of offshore wind farms, also contributes significantly to emissions [43]. Large-scale components require specialized means of transport and often travel long distances, which involves burning large amounts of fossil fuels. Lifetime CO2 emissions of wind power are estimated to be between around 7 and 38 [g/kWh] of electricity generated [44,45]. These values may vary depending on the type of turbine (onshore vs. offshore), the location of the wind farm (affecting the strength and stability of the wind), the production technology, and the efficiency of the turbine [44,45]. Like solar panels, wind turbines do not emit CO2 during their operation. Wind energy is a renewable source that does not generate greenhouse gases in the process of generating energy. The energy payback time for wind turbines is relatively short, typically between 6 and 17 months for offshore turbines, and even less for onshore turbines [45,46]. This means that wind turbines offset the energy used for their production and transport in a very short period of time, resulting in energy savings and emission reductions over their lifetime, which is typically 20–25 years [47]. Most wind turbine components, including steel, aluminium and copper, are recyclable. Recycling these materials reduces the need for primary raw materials and reduces emissions associated with their production. The recycling of turbine blades remains a challenge. They are made of polymer composites reinforced with glass or carbon fiber, which are characterized by high strength and lightness, but at the same time difficult to recycle. Their recycling requires technologically advanced processes, such as pyrolysis, mechanical shredding, or thermal processing, which are expensive, energy intensive, and not always profitable [48]. In practice, most of the used blades end up in landfills or are co-incinerated in cement plants, which does not solve the problem of material recovery, but only partially minimizes emissions [48,49]. With the growing number of end-of-life turbines, the scale of the problem will increase exponentially—global blade end-of-life could exceed 43 million tons by 2050, according to a BloombergNEF analysis [50], posing a major challenge to the sustainability of the wind energy industry [48]. The answer to this problem may be research into new, easier to recycle composite materials, as well as the development of fiber recovery technologies and the introduction of regulations enforcing the responsibility of manufacturers for the entire life cycle of turbines. Only a circular approach, taking into account both energy efficiency and waste minimization, can ensure the real “greenness” of renewable energy in the long term. For example, research into thermoplastic epoxy resins is promising, which, unlike currently used thermosetting resins, can be remelted and formed [51]. Innovative approaches such as pyrolysis and solvolysis (chemical decomposition of composites using organic solvents) also offer the potential to recover valuable materials, although they remain costly and not available on an industrial scale [49]. Further development of these technologies and the creation of an appropriate legal and economic framework will be crucial to reducing the environmental footprint of wind energy. An innovative approach to reducing the carbon footprint of wind turbines is the use of wood to build towers. Wooden towers can reduce emissions by up to 90% compared to traditional steel towers, due to carbon sequestration by wood during tree growth [52]. In addition, initiatives are being taken to use low-carbon steel in turbine construction, which further contributes to reducing the carbon footprint of raw materials [53]. The dominant share of raw material production (steel and concrete) in the life-cycle emissions of wind turbines underlines the importance of focusing on the decarbonization of these energy-intensive industries to further increase the environmental sustainability of wind energy. Innovations in steel and concrete production, such as the use of renewable energy in production processes and the development of lower-carbon formulations, could significantly reduce the overall carbon footprint of wind energy. The relatively high share of transport in wind turbine emissions, especially for offshore projects, suggests that logistics optimization, exploration of alternative transport fuels, and potentially the production of components closer to their deployment sites could create significant opportunities to reduce the carbon footprint of wind energy. The enormous size and weight of turbine parts require efficient and low-emission transport solutions. Although the energy payback time for wind turbines is impressively short, the disposal of turbine blades at the end of their life, mainly made of difficult-to-recycle composite materials, is a growing environmental challenge. Developing effective and scalable solutions for recycling these blades is key to ensuring the long-term circularity and sustainability of the wind energy sector and preventing a future waste problem. This requires innovation in materials science and recycling technologies, as well as the establishment of appropriate infrastructure and policies.

2.2.3. Energy-Storage Needs in RES Systems

In the case of RES technologies, it is also important that due to the fact that they are based on solar and wind energy, they face a significant limitation—high dependence on weather conditions—which translates into the variability in energy production. This phenomenon is referred to as the variability in renewable sources (intermittency) and is one of the key challenges in the integration of RES with energy systems based on stable supplies. In the case of solar energy, energy production depends not only on the daily cycle of sunlight, but also on cloud cover, the angle of incidence of rays, and atmospheric pollution. As research shows, even in regions with high solar potential, such as southern Europe, the annual variability in PV production can reach even 30%, which is important for planning backup capacity and storage systems [54,55]. In addition, in winter and during prolonged periods of cloud cover (the so-called “dark silence”), PV systems can deliver only a small fraction of the nominal power [56]. Similar problems apply to wind energy. Although turbines can operate both day and night, their efficiency is directly dependent on wind speed, which can change dynamically not only from day to day, but also over the course of hours. Studies show that in onshore areas in Europe, the hourly variability in wind capacity can be as high as ±70% per day, which requires a rapid response of the balancing system [57,58]. Moreover, the Dunkelflaute phenomenon, both from PV and wind, poses a serious threat to security of supply during the winter months. This variability not only increases the need for energy storage, but also forces the modernization of grid infrastructure and the development of intelligent demand management systems. In models based mainly on RES, it is also necessary to maintain the so-called reserve capacity in the form of flexible sources (e.g., gas-fired power plants or battery storage), which affects the total cost of the energy transition and may indirectly increase CO2 emissions at times of peak demand.
It is worth following the example of Spain to assess the problem of weather volatility directly affecting the instability of energy production from photovoltaics and wind, posing a real threat to energy security. Spain is a country that invests heavily in renewable energy sources. Already in 2021, the Spanish media and authorities warned of the risk of a wide-ranging power outage, resulting from a high increase in dependence on unstable renewable sources and irregular energy supplies from abroad. And despite the fact that Spain, thanks to its geographical location, has an exceptionally high potential for renewables—in 2023, more than 50% of electricity production came from renewable sources, mainly wind, and solar, and on 16 April 2025, Spain reached a historic milestone—for the first time on a working day, 100% of energy came from renewable sources [59], just a few days later, on 28 April 2025. Spain and Portugal experienced a serious blackout, caused by a sudden loss of RES capacity and outdated, inflexible energy infrastructure that could not cope with the overproduction of energy from photovoltaic farms. The high proportion of non-synchronous sources, such as wind and solar, made the system more susceptible to interference and frequency instability. As a result, millions of people were left without electricity, and domestic transport and communications were paralyzed [60].
As the situation in Spain shows, energy-storage facilities are of key importance in the context of assessing the efficiency of systems based on renewable energy sources and CO2 emissions. Their role is to balance the variability in energy production and ensure continuity of supply. However, both the production and operation of energy-storage facilities are associated withCO2 emissions, which should be taken into account in the assessment of their impact on environment. Therefore, only taking this element into account gives a full picture of emissions from a given type of system (Figure 2).
The efforts of many countries, and now especially European Union countries, to increase the share of renewable energy sources, such as photovoltaics and wind energy, in their energy mix mean that the variability in energy production characteristic of RES poses challenges to the stability of the national power grid. In this context, energy-storage facilities play a key role in balancing this variability and ensuring continuity of energy supply. Nevertheless, both the production and operation of energy-storage facilities are associated with carbon dioxide emissions, which must be taken into account in the environmental impact assessment to provide a complete view of the situation. Therefore, in the further part of the study, a detailed analysis of CO2 emissions was made, also taking into account the need for energy storage. Poland was chosen as a point of reference—a case study—one of the European countries, which is the authors’ home country. For individual systems, energy demand forecasts were taken into account, including energy storage, and a comprehensive assessment of CO2 emissions related to their life cycle, covering the period up to 2050.

3. RES—Case Study in Poland

To provide a coherent overview of the methodological approach adopted in the case study, the following section is structured around a sequence of analytical steps reflecting the key stages of the investigation. These include the assessment of the current status and implementation of renewable energy sources in Poland, the identification of infrastructure-related challenges, emissions from electricity storage, comprehensive life-cycle assessments of photovoltaic and wind energy systems, as well as an evaluation of their potential impact on ecosystems. This multi-stage procedure is summarized in Figure 3.

3.1. Current Implementation Status and Challenges in the Field of Renewable Energy Sources

The RES sector in Poland, especially photovoltaics and wind energy, is developing dynamically [61]. In 2023, RES accounted for 27% of electricity production, which is a record result [62]. Despite this growth, coal remains the dominant source of electricity in Poland, accounting for 60.5% of total production in 2023 [62]. This disproportion emphasizes the scale of the energy transition that still needs to be implemented in Poland to meet the expectations of European standards. Currently, a significant share in the development of photovoltaics is held by entities (individuals or enterprises) that produce electricity for their own needs only from renewable energy sources. In 2023, they accounted for about 80% of the total PV electricity production supplied to the national grid [61]. This decentralization of energy production has important implications for grid management and the need for energy storage. By the end of 2023, the installed RES capacity reached 28.6 [GW] [62]. Photovoltaics played a leading role in this growth, accounting for about 60% of the installed RES capacity [63]. However, the growing share of RES variables poses challenges to the stability of the national power grid. Grid operators even had to temporarily shut down photovoltaic capacity due to oversupply of energy [64]. Poland, as a member of the European Union, is obliged to increase the share of renewable energy sources and achieve climate neutrality by 2050. The EU RED III directive sets a target of 42.5% RES share by 2030, encouraging member states to aim for 45% [62]. For Poland, this means achieving a 31.5% share of RES in total energy consumption by 2030 [62]. Poland’s “Energy Policy until 2040” originally assumed achieving 20 [GW] of installed capacity in photovoltaics by 2040; however, the Institute for Renewable Energy predicts that this goal may be achieved as early as 2025 [65]. According to the latest draft of the National Plan for Energy and Climate (NECP), the installed RES capacity is expected to reach 57 [GW] by 2030 and exceed 90 [GW] by 2040 [66]. An even more ambitious scenario in the NECP update assumes a 32.6% share of RES in gross final energy consumption by 2030, with 56% of electricity to come from RES [67]. Poland also plans to significantly develop offshore wind energy, with the goal of reaching 5.9 [GW] by 2030 and up to 11 [GW] by 2040. The installed capacity in photovoltaics is expected to increase to 5–7 [GW] in 2030 and 10–16 [GW] in 2040. Some reports even suggest the possibility of reaching 100 [GW] of installed RES capacity by 2040 [68].

3.2. Challenges in Grid Infrastructure and Integration of Renewable Energy Sources

The integration of such a large share of variable RES requires a significant modernization of the Polish energy infrastructure. Grid operators face difficulties in adapting to the rapid growth of renewables, leading to connection refusals and reductions in renewable energy production [64]. This highlights the limitations of the current network. The increasing variability in energy production from RES requires investments in flexible technologies, such as energy storage and gas generation [69]. The Polish Transmission System Operator (PSE S.A.) sees the need to significantly expand its energy-storage capabilities in order to improve power balancing [70]. PSE plans to build more than 5400 km of new 400 kV lines and 31 new transformer stations by 2037 to facilitate the integration of RES [71]. Solar potential is highest in southern and central Poland, which can lead to regional differences in grid congestion and energy-storage needs. Currently, energy-storage capacity in Poland (data as of 2023 [61]) was minimal compared to the installed RES capacity. The largest energy-storage facilities are pumped-storage power plants, with a total installed capacity of 1464.5 [MW], which is 85% of the registered storage capacity [72]. The market for battery-based energy storage in Poland is basically non-existent [73]. However, this situation is expected to change quickly. Projected scenarios for 2030 indicate a significant increase in energy-storage capacity. According to a report by the Instrat, the capacity of energy storage of all kinds is expected to reach 27.3 [GW] by 2040, and Poland has already issued connection conditions for about 7 [GW] of energy-storage capacity [73]. By the end of October 2024, this figure had risen to 24 [GW] for grid connections, with a potential of more than 31 [GW], including projects in distribution networks by 2030 [74]. Therefore, estimates indicate the need to provide 20–30 [GW] of storage capacity by 2040, with an average storage depth of 4 h (that is 80–120 [GWh] of storage capacity) [75]. Forum Energii emphasizes the urgent need for flexible technologies, such as battery storage, to offset the increasing variability in generation from RES [69]. It is estimated that Poland needs at least 2–3 [GW] of storage capacity by 2030 to effectively manage fluctuations in renewable energy production [61]. As a result of the capacity market auctions for 2021–2028, energy storage contracts with a total capacity of 9.5 [GW] were concluded [72]. A significant part of this capacity (1.9 [GW]) is for new battery-based energy-storage units to be built [72]. If the reserve capacity currently provided by the rotating reserve were to be replaced by energy storage, an installed capacity of around 3300 [MW] (3.3 [GW]) would be needed [76].

3.3. Photovoltaics and Its Importance in the Context of RES and LCA

By 2050, the installed capacity of photovoltaics in Poland is expected to increase to 55 [GW], which is a significant increase compared to the current situation. It is estimated that RES in Poland will be responsible for 68% of electricity production in 2050, and photovoltaics will be one of the main sources. As of 2023, the photovoltaic capacity was 17.03 [GW]. Based on the data made available from Eurostat, the lifetime CO2 emissions of photovoltaic panels were assessed using the linear interpolation method, which finally allowed to estimate the contribution of photovoltaic panels to the reduction of CO2 emissions by 2050.
C = P + M + K + U
where:
  • C—the number of emissions in the life cycle of the panels,
  • P—the amount of emissions that were generated in the production of photovoltaic systems,
  • M—the amount of emissions that constant in the process of storing energy from photovoltaic systems,
  • K—emission during conversion of solar energy to electricity = 0,
  • U—the amount of emissions that arise during the disposal of photovoltaic panels—it should be taken into account that part of the resources is disposed of and part of the recycling.
U = E u + E r
where:
  • Eu—emission of disposal,
  • Er—emission of recycled material.
CO2 emissions in the energy conversion process were assumed to be zero [77,78].

3.3.1. Production of Photovoltaic (PV) Panels

In this study, it was assumed that the panels are divided into crystalline silicon PV modules and thin-film PV modules. Considering that the market share of crystalline silicon PV modules is much higher than thin-film modules, this part only discusses the production of crystalline silicon modules.
P = i = 1 n E i R e S
where:
  • Ei—amount of energy used in the production of 1 [m2] of the panel [kWh/m2],
  • Re—emission factor for electricity [kg/kWh],
  • S—panel area [m2].
Eurostat data shows that in 2023 the area of photovoltaic panels in Poland was 3067.862 [106*m2], the amount of energy used for the production of panels is 1.4 [kWh/m2], Re = 0.8 [kg/kWh].
P = 1.4 0.8 3067.862 = 3436.005 [ t ]

3.3.2. Energy Storage from Photovoltaic (PV) Panels

Energy storage from photovoltaic panels is synonymous with the use of lithium-ion batteries. The same applies to the production of electric vehicles. The share of such warehouses in Poland is still at a low level. The emissions associated with the production of batteries are generated in the manufacturing process. The total amount of emissions produced by the production of batteries can be determined from equation [77]:
M = i = 1 n R i R i R
where:
  • Ri—material ratio [t],
  • RiR—CO2 emission factor [t CO2/kg].
Eurostat has a determined value of M emissions taking into account the percentage share of photovoltaics for 2023, which for Poland amounted to M = 5117.295 [t].

3.3.3. Decommissioning of Photovoltaic (PV) Panels

The process of decommissioning photovoltaic panels can be threefold. The first is related to landfill and, despite the drastic consequences for the environment, is considered zero-emission. The second way is gradual disposal using thermal recycling technology. Thermal recycling technology is an efficient recycling method, on the basis of manual disassembly of the aluminum alloy frame, where the glass and battery have been separated by high temperature, and then the silver will be recycled through chemical treatment. The recycled material can be directly used in the production of cells. Other recycled materials (such as glass, aluminum alloy frame, and silver) are calculated at 10% depreciation to offset CO2 emissions. The third variant is related to the utilization of the material [77]. Utilization emission is expressed by the equations:
E u = i = 1 n R i u R i R S
E r = i = 1 n R i s R i R S
where:
  • Riu—material to be recycled [t],
  • Ris—material to be cleaned [t],
  • RiR—CO2 emission factor [t CO2/kg],
  • S—area [m2].
According to Eurostat data, the value of CO2 emissions during the recycling of photovoltaic panels is 5254.36 [t], while during the disposal of panels 8641.52 [t] of CO 2 is emitted.

3.3.4. LCA Balance per Total Power Obtained from Photovoltaic Panels

Eurostat data show that in 2023, the total capacity obtained from photovoltaic panels was 17.03 [GW], which allows the LCA to be calculated for the capacity of 60 [GW] estimated in 2050 (Table 1).

3.4. Wind Calculations

According to a report by the Polish Wind Energy Association (PWEA), Poland has the potential to install more than 50 [GW] of onshore and offshore wind capacity by 2050. This means that wind could cover up to 40% of the country’s electricity demand [79]. In combination with other promising solutions, such as photovoltaic panels, this would allow to meet the objectives of the NECP and achieve the EU’s climate goals assuming climate neutrality by 2050 [62]. In 2023, the total capacity of wind farms in Poland was 9.3 [GW] (+1.8 [GW] under construction) and was entirely installed onshore [80]. According to the proposed update of the PEP2040, the planned capacity of onshore wind farms would be 14.5 [GW] in 2030 and 20 [GW] in 2040 [80,81]. By 2050, onshore installed capacity could reach 35–41.4 [GW] [82,83]. It should be noted, however, that in addition to onshore farms, Poland has significant potential for the development of offshore wind energy. According to the proposal to update the PEP2040, their capacity would amount to 14 [GW] in 2030 and 20 [GW] in 2040 [80]. By 2050, Polish-owned offshore wind farms could have a capacity of 28–33 [GW] [84,85]. For the purposes of this analysis, in order to maintain comparability of results with other energy sources, it was assumed that in 2050 the onshore and offshore capacity will be 30 [GW] each, creating a system with an installed capacity of 60 [GW]. In addition, based on the report [86], it was assumed that the power of one turbine installed onshore is 4.6 [MW], and its CF-capacity factor is 38%. For the offshore turbine, on the other hand, a capacity of 10.1 [MW] and an efficiency factor of 50% were included. This means that the wind at sea is more stable and less variable, which means that the turbine works longer and more often. In addition, there are no space constraints for offshore turbines, which allows for more optimal placement, the use of higher power solutions, and thus greater utilization of wind potential [87]. Assuming a 25-year life cycle, one onshore wind turbine is able to generate the following amount of electricity:
E o n s h o r e = 4.6 [ MW ] 219144 [ h ] 38 % = 383063712 [ kWh ] 383.06 [ GWh ]
An offshore turbine, on the other hand:
E o f f s h o r e = 10.1 [ MW ] 219144 [ h ] 50 % = 1106677200 [ kWh ] 1106.68 [ GWh ]
The above assumptions and the calculations made are the basis for further calculations related to the assessment of CO2 emissions from the life cycle of wind turbines (LCA). This will allow us to estimate the contribution of the use of wind turbines to the reduction of carbon dioxide emissions by 2050. As mentioned earlier, wind turbines do not emit CO2 in the power generation process [88], so this component is omitted from the overall equation for life-cycle emissions:
C = P + T + M + U
where:
  • C—the lifetime amount of emissions of one wind turbine [g CO 2 /kWh],
  • P—the amount of emissions that were generated in the production of the wind turbine,
  • T—the amount of emissions associated with transporting the turbine from the production site to the place of operation,
  • M—the amount of emissions from the energy storage process from the wind turbine,
  • U—the amount of emissions that have arisen from the disposal of the wind turbine.

3.4.1. Wind Turbine Production

The proportions of materials used in the manufacture of wind turbines can vary depending on the make and model. Based on [89,90], it can be assumed that the turbine consists mainly of steel (70% of the total mass), iron (15%), composite materials (12%), copper (2%), and aluminum (1%). In addition, the weight of the 4.6 [MW] turbine itself is about 400 [t] (cf. Vestas V163-4.5 [MW]), and the power of 10.1 [MW] is even about 1200 [t] (cf. Siemens Gamesa SG 10.0-193 DD). Taking into account the quoted data, CO 2 emissions at the production stage of onshore and offshore turbines were estimated (Table 2).
In addition, emissions resulting from the location of the turbine at the target location (F) were also included in this stage. It was assumed that about 1000 [t] of concrete and 165 [t] of steel were needed to make the foundation for the onshore turbine [92]. In the case of offshore turbines, as a rule, steel structure monopiles are used for mounting, which may correspond to the use of approx. 1200 [t] of steel [93,94]. Therefore:
F o n s h o r e = 1000 0.9 [ CO 2 / t ] + 165 2.2 [ CO 2 / t ] = 1263 [ t CO 2 ]
F o f f s h o r e = 1200 2.2 [ CO 2 / t ] = 2640 [ t CO 2 ]
Consequently, for a single onshore turbine, the CO 2 emissions generated during the production phase will be:
P o n s h o r e = ( ( 956000 + 1263000 ) [ kg CO 2 ] ) / ( 383063712 [ kWh ] ) 5.79 [ g CO 2 / kWh ]
For an offshore turbine, it will be:
P o f f s h o r e = ( ( 2869000 + 2640000 ) [ kg CO 2 ] ) / ( 1106677200 [ kWh ] ) 4.98 [ g CO 2 / kWh ]

3.4.2. Wind Turbine Transport

Transporting a wind turbine typically requires at least 15 trucks, or even more, depending on the specific turbine and route [95]. Blades can be transported individually by one vehicle, while elements such as the nacelle and, above all, the tower require even several trucks [96]. Taking into account the weight and dimensions of the turbines in question, it was assumed that 15 vehicles will be used for onshore transport, and as many as 35 vehicles for offshore (emission level 60 [g CO 2 /t km] [97]). In recent years, the industry related to the production of wind turbines has been developing dynamically in Poland, as exemplified by the establishment of new production plants in the West Pomeranian Voivodeship [98,99]. Therefore, for the purposes of this analysis, it was assumed that the transport of the onshore turbine will take place over a distance of only 300 [km]—from the production site in the country to the region where there are favorable weather conditions for the effective operation of the turbines—the northern part of Poland (coastal belt region). In the case of an offshore turbine, it is also necessary to take into account the distance to the port of loading (additional 50 [km]) and maritime transport using five transport units with an average distance from the shore of 30 [km] [100,101] (emissions at the level of 19 [g CO 2 /t km] [102]). Taking into account the presented assumptions, CO 2 emissions were calculated at the transport stage:
T o n s h o r e = ( 1565 t 300 km 6.0 10 ( 5 ) [ t CO 2 / t km ] 15 ) / ( 383063712 kWh ) 1.10 [ g CO 2 / kWh ]
For an offshore turbine:
T o f f s h o r e = ( ( 2400 t 350 km 6.0 10 ( 5 ) [ t CO 2 / t km ] 35 ) + ( 2400 t 30 km 1.9 10 ( 5 ) [ t CO 2 / t km ] 5 ) ) / ( 1106677200 kWh ) = ( ( 1764 + 6.84 ) [ t CO 2 ] ) / ( 1106677200 kWh ) 1.60 [ g CO 2 / kWh ]

3.4.3. Storing Energy from a Wind Turbine

An effective and stable power supply system for a given region is conditional not only on the needs-based capacity of the installation, but also on the ability to store energy in the event of a decrease in current production. Therefore, in the analyzed scenario, emissions related to electricity storage were also included in the life-cycle emissions of wind turbines. Currently, lithium-ion (Li-Ion) batteries remain the dominant technology in this matter—mainly due to their high energy density and technological maturity. Therefore, the focus was solely on this technology [103]. As some studies suggest, at the production stage of such storage facilities, CO 2 emissions are in the range of 150–200 [kg CO 2 /kWh] [78]. In general, Li-Ion batteries do not burn fuels or emit CO 2 during operation, but each cycle results in a small loss of energy (about 5–15%) and therefore more energy must be generated. In addition, if the storage is charged from RES, it is zero-emission charging [104]. When it comes to decommissioning batteries, the least desirable method of proceeding is to deposit them in landfills. A much more sustainable approach is recycling, which allows you to recover up to 90% of materials (lithium, cobalt, nickel, aluminum). Although the recycling process itself involves additional emissions of 10–20 [kg CO 2 /kWh], the use of recycled materials in the production of new batteries significantly contributes to reducing the footprint of subsequent batteries—by up to 30–40% [105]. Energy-storage facilities are integrated with wind farms, enabling stable supply of energy to the grid, reduction of excess energy losses, as well as support for system services such as frequency control, power reserve and shifting supplies to peak demand hours. However, contrary to the intuitive approach, the design of storage facilities that fully correspond to the installed capacity, i.e., 60 [GW] with an average storage depth of 4 [h] (i.e., 240 [GWh] of capacity), may not reflect the actual needs of the system. Taking into account the considered wind energy production profiles (30 [GW] onshore, CF = 38% and 30 [GW] offshore, CF = 50%), the average available capacity from 60 [GW] is approx. 26.4 [GW]. Therefore, the analysis assumes a total capacity of energy storage at the level of 120 [GWh], which will fully allow the system to be balanced at much lower investment and environmental costs. However, it should be noted that many years of operation, including successive charging/discharging cycles, reduce the amount of energy that the storage can store. Therefore, a 15% decrease in capacity over the entire life cycle was assumed. The assumed values of CO 2 emissions in individual stages of the life cycle of lithium-ion energy storage combined with wind energy are shown in Table 3.
In accordance with the above assumptions, the calculation of unit CO 2 emissions at the energy storage stage in the case of onshore turbine power supply was carried out:
M o n s h o r e = ( ( 1.2 10 8 [ kWh ] 175 [ kg CO 2 / kWh ] ) + ( 1.02 10 8 [ kWh ] 0.04 [ kg CO 2 / kWh ] ) + ( 1.2 10 8 [ kWh ] 15 [ kg CO 2 / kWh ] ) ) / ( 6522 383063712 [ kWh ] ) 9.13 [ g CO 2 / kWh ]
And for offshore turbines:
M o f f s h o r e = ( ( 1.2 10 8 [ kWh ] 175 [ kg CO 2 / kWh ] ) + ( 1.02 10 8 [ kWh ] 0.04 [ kg CO 2 / kWh ] ) + ( 1.2 10 8 [ kWh ] 15 [ kg CO 2 / kWh ] ) ) / ( 2970 1106677200 [ kWh ] ) 6.94 [ g CO 2 / kWh ]
In total, for an onshore/offshore system with a total installed capacity of 60 [GW]:
M = ( ( 1.2 10 8 [ kWh ] 175 [ kg CO 2 / kWh ] ) + ( 1.02 10 8 [ kWh ] 0.04 [ kg CO 2 / kWh ] ) + ( 1.2 10 8 [ kWh ] 15 [ kg CO 2 / kWh ] ) ) / ( ( 6522 383063712 [ kWh ] + 2970 1106677200 [ kWh ] ) ) 3.942 [ g CO 2 / kWh ]

3.4.4. Wind Turbine Disposal

A typical wind turbine consists of a tower, nacelle, rotor (including hub and blades), as well as the foundation. Individual structural elements are made of different materials, which determines how they are disposed of and the potential impact on emissions [107]. The tower and hub, usually made of steel and cast iron, as well as the nacelle components containing metals such as copper and aluminum, can be recycled [108]. This process allows for a significant reduction in CO 2 emissions in subsequent production cycles, by reducing the demand for primary raw materials [109]. The foundation of an onshore turbine, usually made of reinforced concrete, can be shredded secondary aggregate [110]. In some cases, however, it happens that it remains in place and gets backfilled, which reduces emissions associated with dismantling but may limit future land development opportunities [111]. Turbine components containing composite materials, in particular rotor blades, pose a major environmental and technological challenge. Blades are typically manufactured from glass fiber reinforced polymer composites (GFRP) or carbon fiber (CFRP), which gives them high mechanical strength at a relatively low weight [112]. This is achieved by using a special structure, the so-called “sandwich”, in which the core is permanently connected (chemically and mechanically) to the outer reinforced layers. Such a structure is difficult to separate into individual materials, which significantly complicates the recycling process [113]. As a consequence, the recycling of wind turbine blades remains costly, energy-intensive and technologically complex. Therefore, the currently dominant methods of dealing with used blades are their storage or co-incineration, which only partially reduces emissions, while not ensuring a closed loop of materials [114]. CO 2 emissions at the stage of disposal of the onshore turbine, together with the division into structural elements and materials used in their production, are presented in Table 4.
Taking into account the results from the table above, CO 2 emissions at the onshore turbine disposal stage were determined:
U o n s h o r e = ( 346.5 [ t ] ) / ( 383063712 [ kWh ] ) 0.90 [ g CO 2 / kWh ]
An analysis was then carried out for an offshore turbine. The CO 2 emissions at the stage of disposal of this turbine, together with the breakdown into individual components and materials used in them, are shown in Table 5.
Taking into account the results from the table above, CO 2 emissions at the offshore turbine disposal stage were calculated:
U o f f s h o r e = ( 1242 [ t ] ) / ( 1106677200 [ kWh ] ) 1.12 [ g CO 2 / kWh ]

3.4.5. Total CO2 Emissions from Wind Farms and Energy Storage over the Entire Life Cycle

According to the assumptions, the installed capacity in onshore farms is to be 30 [GW], therefore the number of onshore turbines needed (Nonshore) has been determined:
N o n s h o r e = ( 30 [ GW ] ) / ( 4.6 [ MW ] ) = 6522
Then, the amount of energy generated over the entire life cycle of onshore wind farms was calculated:
T E o n s h o r e = 6522 383063712 [ kWh ] = 2498341529664 [ kWh ]
The above calculations made it possible to determine CO 2 emissions at specific stages of the life cycle of onshore wind farms with an installed capacity of 30 [GW] combined with an energy-storage facility:
T P o n s h o r e = P o n s h o r e T E o n s h o r e 14465397.460 [ t ]
T T o n s h o r e = T o n s h o r e T E o n s h o r e 2748175.680 [ t ]
T P o n s h o r e = M o n s h o r e T E o n s h o r e 22809858.170 [ t ]
T P o n s h o r e = U o n s h o r e T E o n s h o r e 2248507.377 [ t ]
The results of CO 2 emissions per 1 [kWh] and in individual stages of the life cycle of onshore farms are presented in Table 6.
A similar calculation algorithm was used for offshore farms. The number of offshore turbines needed (Noffshore) was determined first:
N o f f s h o r e = ( 30 [ GW ] ) / ( 10 , 1 [ MW ] ) = 2970
Then, the amount of energy generated over the entire life cycle of offshore wind farms was calculated:
T E o f f s h o r e = 2970 1106677200 [ kWh ] = 3286831284000 [ kWh ]
These calculations have made it possible to determine CO 2 emissions at specific stages of the life cycle of offshore wind farms with an installed capacity of 30 [GW] combined with energy storage:
T P o f f s h o r e = P o f f s h o r e T E o f f s h o r e 16368419.79 [ t ]
T T o f f s h o r e = T o f f s h o r e T E o f f s h o r e 5258930.05 [ t ]
T M o f f s h o r e = M o f f s h o r e T E o f f s h o r e 22810609.11 [ t ]
T U o f f s h o r e = U o f f s h o r e T E o f f s h o r e 3681251.04 [ t ]
The results of CO 2 emissions per 1 [kWh] and at individual stages of the life cycle of offshore farms are presented in Table 7.
The final step was to determine the life-cycle emissions of wind farms with a total capacity of 60 [GW], assuming that 30 [GW] each was deployed onshore and offshore. The combination of this energy source with Li-Ion storage facilities with a nominal capacity of 120 [GWh] is also taken into account. The results are shown in Table 8.

3.5. Life-Cycle CO 2 Emissions of Energy-Storage Technology

Energy-storage facilities are of key importance for stabilizing the operation of renewable energy sources, the production of which depends on weather conditions and are the basis of a modern energy system [73]. Flexible technologies such as battery storage play an important role in mitigating generation fluctuations and maintaining system balance [69]. Storage facilities can capture surplus electricity generated during periods of high production from RES, limiting the need to reduce this production [64]. They can also provide essential ancillary services such as frequency regulation and voltage support, increasing grid stability [73]. In addition, energy storage can help optimize grid infrastructure investments by reducing peak loads and congestion [115]. They also facilitate the integration of distributed energy sources, increasing grid stability at the local level [61]. The life-cycle assessment of such storage facilities should be based on three main segments (production, operation, disposal) [116].

3.5.1. CO2 Emissions in the Lithium-Ion Battery Manufacturing Process

The production of lithium-ion batteries commonly used in stationary energy storage for RES is very material intensive. The extraction and processing of raw materials such as lithium, cobalt, and nickel, as well as the production of batteries, require significant amounts of energy, often from fossil fuels, which contributes to CO 2 emissions [117]. The energy mix of the country where production takes place has a significant impact on the total greenhouse gas emissions, as production is energy intensive. China, the dominant manufacturer of lithium-ion batteries, relies heavily on carbon, which is highly carbon-intensive. It is estimated that the CO 2 emissions associated with the production of an 80 [kWh] lithium-ion battery (such as for an electric vehicle) can range from 2400 [kg] to 16,000 [kg] (2.4 to 16 [t]) [117]. Some reviews suggest a range of 150–200 [kg CO 2 eq/kWh] of battery for current production [118]. The largest share in emissions is the production of batteries (including cells) and the processing of materials to battery quality (about 50% each). Electrodes are the dominant component in terms of environmental impact. Aluminum used in battery packs is an energy-intensive material, accounting for a significant part of the battery’s carbon footprint [118,119]. Energy-storage systems are scaled from small home installations to large industrial systems. Typical ranges and associated emissions are presented in Table 9.
Assuming that the new energy-storage facilities will be based on lithium-ion battery technology, it is possible to estimate the CO 2 emissions associated with their production. Assuming that emissions are about 150–200 [kg CO 2 eq] per 1 [kWh] of battery capacity, for storage facilities with a total capacity of 30 [GW], i.e., 120 [GWh], these emissions would amount to 18 million tonnes of [ CO 2 eq] for the 150 [kg CO 2 eq/kWh] variant, and 24 million tonnes of [ CO 2 eq] for the 200 [kg CO 2 eq/kWh] variant. This is the equivalent of the annual CO 2 emissions of the capital of the country under study (Warsaw). Of course, this is an emission that occurs once in the production of batteries—then for 10–20 years, storage facilities help stabilize RES and reduce emissions. The typical lifespan of lithium-ion batteries in energy storage is 3000–8000 charge/discharge cycles, so the service life is about 10–20 years, after about 10 years there is a decrease in capacity by about 20%, so after taking into account these assumptions, if the storage performs 1 full cycle per day, it “pays off” environmentally in 8–12 years, and then brings pure climate profit.

3.5.2. CO2 Emissions During Battery Operation and Disposal

In general, lithium-ion batteries do not burn fuels or emit CO 2 during operation, nevertheless, each cycle results in a small loss of energy (5–15%) and therefore more energy needs to be produced (with different CO 2 footprints). If the storage is charged from RES, it is zero-emission charging [104]. Optimizing battery performance to replace the more carbon-intensive generation is key [103]. When it comes to battery disposal, the worst option is to store them in landfills, which can lead to the release of toxins and pose a fire risk [119]. Recycling is a key solution, but it faces challenges related to battery chemistry and the hazardous nature of the process [119]. Recycling makes it possible to recover valuable and rare materials such as cobalt, nickel, and lithium, reducing the need for primary raw materials and associated emissions [120]. Currently, 50–90% of materials (lithium, cobalt, nickel, aluminum) are recovered in this way. It is estimated that recycling can add 10–20 [kg CO 2 eq/kWh] (i.e., 5–10% of production emissions), but the recovered materials reduce the footprint in subsequent batteries, by up to 30–40%. The share of individual stages is presented in Table 10.
As lithium-ion batteries remain the dominant technology due to their high energy density and technological maturity, [103] focused solely on this technology. Pumped storage plants have relatively low operational emissions but significant initial environmental impacts [121]. Flow batteries can have lower material costs and lower environmental impact in some aspects compared to lithium-ion batteries [122]; however, traditional lithium-ion batteries offer a higher energy density, and are more efficient in terms of storing energy in relation to volume and weight, making them more suitable for this type of application.

3.6. Potential Impact of Renewable Energy Production on Ecosystems

3.6.1. Impact of Wind Farms on Ecosystems

Wind farms, while helping to reduce greenhouse gas emissions, can have a negative impact on ecosystems. One of the most visible effects is the direct impact on wildlife, especially birds and bats, which can collide with rotating turbine blades, often leading to injury or death [123]. In North America alone, it is estimated that tens to hundreds of thousands of bats die annually as a result of collisions with wind turbines [124]. In addition, the construction of wind farms and associated infrastructure, such as access roads and transmission lines, can lead to habitat loss and fragmentation [125]. Cutting down forests or transforming other natural areas for wind installations deprives animals of nesting sites, feeding grounds and shelter. The presence and operation of turbines can also cause birds and mammals to be scared away from their natural habitats, even if there is no direct mortality [125]. Studies have shown that most of the studied bird and mammal species are displaced from their habitats by wind farms [126]. Some studies suggest that large wind farms can affect the local climate by causing changes in temperature, humidity, and precipitation, although this issue still requires further research [127]. In addition, wind farms can have a negative visual impact on the landscape, which is perceived as an environmental problem by part of society [125]. Noise generated by operating turbines can also be a problem for both humans and some animal species [123]. In the case of offshore wind farms, their construction changes the characteristics of the seabed, introducing artificial structures. Such changes can result in the displacement of native species or the introduction of invasive organisms. It has also been noted that underwater farm structures can create the so-called reef effect, providing shelter and feeding for some species of marine animals, which can contribute to increasing biodiversity in these areas [128,129] and, in addition, no-fishing zones around farms can have a positive impact on the recovery of some fish populations, but also change local food chains [130]. The behavior of fish and marine mammals can also interfere with the installation of turbines, especially driving piles into the seabed, generates strong underwater noise, which can cause some species, e.g., porpoises, to avoid the area. In the long term, operating turbines can alter water flows and hydrodynamic conditions, affecting the spread of nutrients and larvae of aquatic organisms [131,132]. Similarly to onshore wind turbines, offshore wind turbines can interfere with bird migration routes, leading to collisions, especially in poor visibility conditions. Some birds may avoid farm areas, resulting in the loss of foraging habitat. While there are strategies to minimize the negative impact of wind farms on wildlife and ecosystems, such as carefully choosing the location of wind farms, avoiding areas of high biodiversity and animal migration routes, minimizing land occupation during construction, using bird and bat deterrents, and developing technologies to control blade speed during periods of increased animal activity [123], but the long-term effects on ecosystems will only be known in the future and may be much more negative. Therefore, it is necessary to understand and mitigate them in depth, as well as to introduce long-term ecological monitoring and adaptive management strategies.

3.6.2. Impact of Photovoltaic Farms on Ecosystems

Large-scale solar farms, like wind farms, can have a significant impact on ecosystems, mainly by occupying large areas of land, which can lead to the loss and fragmentation of natural habitats [133]. The conversion of natural or agricultural land for solar installations can cause the movement of wildlife, changes in vegetation, and affect soil and water resources [133]. Some studies suggest that light reflection from solar panels can disorient birds and insects, increasing the risk of collision, although other sources indicate minimal risks from electromagnetic radiation [134]. Large solar farms can also affect the local microclimate, as dark panels absorb and emit heat, which can lead to changes in temperature and humidity in their surroundings [134]. During the construction and operation of photovoltaic farms, soil degradation and erosion may also occur [135]. However, properly designed and managed solar farms can also have a positive impact on ecosystems. They can create habitats for pollinators, support the growth of native vegetation and provide shelter for wildlife [136]. The integration of agricultural crops with photovoltaics (agriphotovoltaics) and the planting of native vegetation and the creation of ecological corridors within solar farms are examples of activities that can minimize the negative impact and increase the benefits for biodiversity [137]. It is also important to dispose of used solar panels, which contain potentially hazardous materials such as cadmium and lead. As mentioned earlier, improper waste handling can lead to environmental pollution [134]. The literature also points to the potential of solar panels to blind wild animals, especially birds and insects. The issue of reflected light and its potential to disorient or even harm flying animals requires careful consideration when designing and locating large-scale solar farms. This can include applying anti-reflective coatings to the panels or positioning them to minimize glare on sensitive areas. Long-term sustainability of solar energy depends not only on reducing emissions during production and maximizing clean energy generation, but also on addressing the challenges of land use and end-of-life utilization. As solar energy continues to grow, responsible land planning that prioritizes the use of brownfield land, minimizes habitat conversion and takes ecological aspects into account will be key to mitigating negative impacts on ecosystems.

4. Comparison of CO2 Emissions over the Life Cycle of Different Energy Sources

Comparing the life-cycle CO 2 emissions of different energy sources is essential to understand the relative environmental benefits of switching from fossil fuels to renewable sources. Data from various studies and reports indicate that renewable energy, despite its life-cycle emissions, has a much lower carbon footprint compared to coal and natural gas [11]. The significant differences highlight the advantage of renewable energy in mitigating climate change, even after taking into account emissions associated with the production and disposal of renewable energy technologies. However, it should be noted that the exact life-cycle emission values may vary depending on the methodologies adopted, specific technologies and regional factors such as the energy mix used in production processes. Electricity demand in Poland is increasing—in 2023 it amounted to 167.52 [TWh], and in 2024 it reached 168.96 [TWh] [138]. It is estimated that by 2050, due to the progressive electrification of various branches of the economy, the total demand may reach the level of up to 330–360 [TWh] [139]. In addition, there is also increasing peak demand, which poses a particular challenge to the energy system. In 2021, a record peak demand of 27.6 [GW] was recorded, and in 2024 another record was set in excess of 28.6 [GW] [140]. These trends indicate that in addition to the expansion of generation sources, it is important to ensure flexibility and stability in both energy production and distribution. The entire system should be able to respond quickly to sudden changes in demand and network congestion to prevent major disruptions and their consequences. The latest example of a blackout in Portugal highlights the importance of preparing infrastructure for such events [141]. In Poland, electricity still comes largely from fossil fuels—mainly coal (hard coal and lignite) and natural gas. The two sources differ in terms of greenhouse gas emissions, energy conversion efficiency, and operational flexibility. Average carbon dioxide emissions in the life cycle of coal are in the range of 740–1000 [g CO 2 /kWh], and natural gas emissions 410–650 [g CO 2 /kWh] [45,142]. For the analysis according to [143,144,145] averaged values were adopted—820 [g CO 2 /kWh] for coal and 490 [g CO 2 /kWh] for natural gas. These are relatively high values, which is why in the face of the need to reduce CO 2 emissions, renewable energy sources (RES)—in particular photovoltaics and wind energy—are gaining in importance. According to available reports, photovoltaics generate an average of 40–60 [g CO 2 /kWh], and wind energy only 10–20 [g CO 2 /kWh] [146,147]. On the basis of the life-cycle emission assessment (LCA), 54.5 [g CO 2 /kWh] for solar power plants and 11.7 [g CO 2 /kWh] for wind farms were obtained, respectively. As shown (Section 3.3 and Section 3.4), these sources are practically emission-free at the stage of energy production (operation), but their unstable nature requires the use of energy-storage systems. For example, in the absence of wind or cloudiness, it is necessary to have backup power or energy reserves to maintain continuity of supply. Such a solution is therefore associated with additional costs, not only investment, but also environmental costs, which was taken into account in the LCA. For comparison, conventional sources such as coal or gas power plants do not require energy storage, because they are the so-called dispatchable sources. This means that they can produce energy exactly when it is needed and even regulate power throughout the day. In addition, when producing energy “on demand”, there is no surplus situation, as in the case of wind and photovoltaics, which sometimes generate more than the grid can take [148]. In order to reliably compare the environmental impact of the different power technologies, the total CO 2 emissions from conventional and renewable energy sources were compared, assuming an installed capacity of 60 [GW] and a 25-year service life. Emissions in the full life cycle have been taken into account—from the construction of the installation (production), through transport, operation, energy storage, to the disposal of the power source. The analyses show the following emissions for Poland in Table 11.
Moreover, to illustrate the impact of the energy mix on climate, it is reasonable to relate CO 2 emissions generated by various sources to the annual national energy demand, which for Poland is at the level of 170 [TWh] [138,149]. For this purpose, emissions were recalculated in the full life cycle of individual sources, assuming an installed capacity of 60 [GW]. This made it possible to compare the total emissions generated by each energy source if it were to cover Poland’s annual energy demand on its own and to determine whether it would be able to achieve it within one year. The estimated amounts of these emissions along with the number of days of operation of the energy source are shown in Table 12.
The capacity factor values shown in Table 12 correspond to the optimal use of the power and assume favorable operating conditions for the sources. In practice, in the Polish reality, they are usually lower—especially for gas and coal power plants, which are increasingly operating in the regulatory mode. With the increase in the share of RES, which are characterized by lower variable costs and have priority in access to the grid, conventional power plants are gradually being pushed out of the market. This leads to a reduction in the number of hours they work per year, which translates into a decrease in their capacity utilization factor. Therefore, in recent years, the actual CF for conventional power plants in Poland has oscillated between 32–55%, which means that it was close to the current potential of wind farms [138,150]. In the case of photovoltaics, for countries such as Poland, the capacity utilization factor ranges between 10 and 15% per year [151]. The results presented in the table reflect the impact of the choice of energy source on the total CO 2 emissions generated to cover the national energy demand. In particular, the comparison of the number of days of operation of the source with emissions over the full life cycle shows significant differences between conventional and renewable technologies. Coal, with 215 days of operation per year, is responsible for the emission of about 139 million tons of CO 2 , which confirms its dominant share in national greenhouse gas emissions. Natural gas, despite its lower unit emissions, requires longer operation and generates over 83 million tonnes of CO 2 per year. Both sources, despite the relatively short operating time needed to generate the required amount of energy, are associated with a very high carbon footprint and thus contribute to a serious burden on the climate. On the other hand, RES need more working days—in particular photovoltaics—which is due to these sources due to weather conditions. Despite this, their CO 2 emissions are many times lower: only 9.3 million tons for photovoltaics and less than 2 million tons for wind energy. The results clearly indicate that although RES are characterized by lower availability and require broader systemic support (incl. energy storage), their implementation remains crucial for reducing CO 2 emissions and mitigating pressure on the environment. In the context of changes in the Polish energy mix, the gradual replacement of fossil fuel-based sources with renewable solutions seems not only justified, but also necessary in the light of meeting EU requirements and reducing dependence on energy imports.

5. Discussion of Results

In conclusion, renewable energy, while offering significant benefits in terms of reducing greenhouse gas emissions during operation, is not free from environmental impacts. The assumption that it is zero-emission is a significant simplification that does not take into account emissions related to the entire life cycle of RES technologies. A life-cycle analysis of PV systems and wind turbines showed that CO 2 emissions are generated during the production, storage and disposal stages, and that their negative impacts on ecosystems, including wildlife and habitats, are significant and not fully studied in terms of long-term consequences. Wind farms can cause bird and bat collisions, habitat loss and fragmentation, and animal disturbance. Solar farms also occupy large areas of land, which can also lead to habitat loss and changes in biodiversity. An important element in the context of interpreting the results obtained is also the analysis of trends in the use of renewable energy sources in Poland and the estimation of the time in which—assuming the continuation of current activities and the pace of development of the sector—it will be possible to achieve the planned level of installed RES capacity at the level of 60 [GW]. According to the draft update of the Polish Energy Policy, by 2040 (PEP2040 [152]), Poland is planned to achieve a 56% share of RES in the energy mix, which requires significant investments and acceleration of the development of renewable sources. However, in accordance with the RED II Directive [153], EU Member States are to achieve at least a 32% share of renewable energy in gross final energy consumption by 2030, with the possibility of increasing this target to 42.5%. In order to assess Poland’s potential for the development of renewable energy sources (RES), selected mathematical models were used, which—based on current trends—made it possible to forecast the growth rate of installed capacity and estimate in which year it will be possible to reach the planned level of 60 [GW]. The analysis used a linear regression model, an exponential regression model and an ARIMA (AutoRegressive Integrated Moving Average) model. First, the linear regression model was estimated and its parameters are presented in the Table 13.
All parameters of the regression model were found to be statistically significant. The linear regression model shows a very good fit with empirical data. The coefficient of determination R 2 is 0.8819, which means that about 88% of the variation of the dependent variable can be explained by the independent variable. The F statistic is 82.12, which indicates that the model as a whole is statistically significant. A low p-value (1.96 × 10⁻⁶) confirms that there is a very strong relationship between the independent variable and the dependent variable. The fit of this model to the empirical data is shown in Figure 4. The estimated parameters of the next of the proposed models, the exponential regression model (after logarithmic transformation), are presented in Table 14.
The results of the model estimation show a very strong and statistically significant relationship between the year and the dependent variable. The directional coefficient is 0.09657, which means that with each subsequent year the value of the dependent variable increases on average by about 9.66%. The R 2 coefficient = 0.9544 indicates a very high fit of the model to the data—as much as 95% of the variability of the data is explained by the independent variable. The t-statistic for both coefficients is very high (14.39 and 15.16, respectively), and the accompanying p-values are very low, which clearly confirms the statistical significance of the parameters. The statistic F = 230 also indicates the very high significance of the entire model. Such an F-level at such a low p-value indicates that the resulting model clearly outperforms the model without any predictors. The fit of the model to the empirical data is presented in Figure 4. The ARIMA model was the last to be presented. The ARIMA(0,2,0) model, which is an autoregressive model with twice the difference of the time series, without an autoregressive (AR) component and without a moving average (MA) component, turned out to be the best fit. This means that the data had to be differentiated twice to achieve stationarity (i.e., stable mean level and variance over time), and further model components were unnecessary. Such a model is relatively simple, but it has proven to be effective in the case of data in which trend is the dominant feature and there is no seasonality or complex autocorrelation structure. This allows the model to be used to compare them with other alternative models. A list of all models is presented in Figure 4.
The year of reaching the planned level of 60 [GW] of emissions from renewable energy sources varies significantly depending on the forecast model used. According to linear regression, this goal will be reached in 2066. On the other hand, exponential regression points to a much earlier date—the year 2036. The ARIMA model predicts that this level will be reached similarly, namely in 2035.

6. Conclusions

6.1. General Summary

The aim of the study was to conduct a comprehensive life-cycle analysis (LCA) of renewable energy technologies, with particular emphasis on photovoltaics and wind energy, in the context of CO 2 emissions and wider environmental impacts. The analysis covered the full life cycle—from the extraction of raw materials, through production, transport, operation, to disposal, also taking into account the aspect of energy storage. The focus was not only on the climate benefits of low operational emissions, but also on the potential risks to ecosystems and the challenges of recycling and energy storage.
The results confirm that renewables have a significantly lower life-cycle carbon footprint compared to fossil fuels, reinforcing the scientific basis for the ongoing energy transition as a key strategy to combat climate change. Even with the embedded carbon in these technologies, their long-term benefits in terms of avoided emissions are significant. This clearly shows that investing in the development and deployment of renewable energy technologies is a necessary step towards a low-carbon future. At the same time, it was shown that the real environmental impact of RES is not limited to gas emissions only, but includes wider ecological consequences such as land occupation, variability in energy production, and problems related to the recycling and disposal of components. The study demonstrates also that Poland is on a realistic trajectory to meet its renewable energy targets. Based on current development trends, planned infrastructure expansion, and national energy policy forecasts, it is feasible to achieve planned 60 [GW] of installed RES, including a balanced share of both photovoltaic and wind energy systems. According to obtained forecasts, this goal can be reached even before 2040 under optimal regulatory and investment conditions. However, realizing this potential will require sustained investments in grid modernization, large-scale energy-storage solutions, and material recycling systems.
To conclude, the pursue to increase the use of renewable energy sources should therefore be based on a balanced approach that takes into account both the significant potential of RES in terms of electricity production and CO 2 emissions reduction, as well as the wide range of potential environmental drawbacks associated with the entire life cycle of these technologies.

6.2. Theoretical and Practical Contributions

From a theoretical point of view, the study brings to the scientific literature a detailed and comparative assessment of the life cycle of photovoltaics and wind energy, including their interaction with energy-storage systems taking into account the conditions specific to Poland. It also stresses the need to move away from the simplistic perception of RES as completely “clean” energy sources and the need for a full assessment covering all stages of the life cycle. In turn, the practical contribution of the work is the identification of areas requiring optimization, taking into account Polish and European conditions. These include production processes, the development of recycling technologies or the design of more sustainable installations that can significantly reduce the environmental footprint of RES. The results of the study provide useful input for policymakers, spatial planners and investors, thus supporting more informed and sustainable decision making.

6.3. Limitations and Directions for Further Research

This study has several limitations. The most significant one is the large variability in CO 2 emission estimates in the RES life cycle for each of the energy sources considered. This highlights the need for further research and standardization of life-cycle assessment methodologies. Improving the accuracy and comparability of these assessments will be crucial to making informed decisions about energy policy and tracking progress in efforts to reduce the environmental impact of different energy technologies. This includes improving data on production processes, transport, and disposal, as well as taking into account regional differences in energy mix and technological efficiency. The fact that different studies on the same renewable energy technology can give different estimates of emissions over the life cycle highlights the complexity of these analyses and the impact of different assumptions and data sources. To ensure that these assessments are genuinely informative and reliable for policymakers and investment decisions, there is a need for greater transparency of the methodologies used, more comprehensive data collection at all stages of the life cycle, and potentially the development of standardized guidelines and protocols for carrying out life-cycle assessments in the energy sector. The conducted research can be additionally extended to include the economic factor. Production, transport, storage and disposal involve a significant outlay in the use of electricity. The European statistical office Eurostat has data on electricity balances and prices. Such an analysis will allow for checking the feasibility of RES energy production also from an economic perspective compared to conventional energy sources. Taking these aspects into account would allow for a better assessment not only of the emissions but also of the cost-effectiveness of implementing individual technologies in different scenarios energy policy. This would provide a more robust scientific basis for the transformation towards a sustainable energy future. In addition, future research should include a quantitative analysis of the impact of RES on local ecosystems, which is particularly important in the case of large-scale expansion of wind and solar farms. Attention should also be paid to the development of technologies for recycling components that are difficult to process, such as composite turbine blades, and to the search for alternative materials for production of RES, that would be easier to recover. Further work is also needed on optimizing the location of RES installations and energy management models that could minimize the risk of grid overloads and overproduction during peak periods. Given the growing role of intermittent renewable sources such as photovoltaics or wind power, it is also necessary to better understand the impact of energy-storage technologies in terms of both emissions and system costs. Only a comprehensive and transparent approach, combining environmental assessment with economic and spatial analysis, will enable making sound decisions that support a sustainable energy transformation. However, achieving this goal requires not only further wide research, but also active support from public policy, industry involvement and sustained investment in innovation in materials, production processes, recycling, and environmental design.

Author Contributions

Conceptualization, S.S., A.J. and A.B.; methodology, A.B.; software, M.M.; validation, S.S., A.J., M.M. and A.B.; formal analysis, S.S. and A.J.; investigation, M.M. and A.B.; resources, A.B.; data curation, S.S., A.J. and A.B.; writing—original draft preparation, S.S., A.J., M.M. and A.B.; writing—review and editing, M.M. and A.B.; visualization, A.J.; supervision, A.B.; project administration, A.B.; All authors have read and agreed to the published version of the manuscript.

Funding

This study was financed by the Faculty of Security, Logistics and Management, Military University of Technology, Research grant no. 065/2025.

Institutional Review Board Statement

Not applicable.

Conflicts of Interest

The authors declare no conflicts of interest.

References

  1. Nugent, D.; Sovacool, B.K. Assessing the lifecycle greenhouse gas emissions from solar PV and wind energy: A critical meta-survey. Energy Policy 2014, 65, 229–244. [Google Scholar] [CrossRef]
  2. Gielen, D.; Boshell, F.; Saygin, D.; Bazilian, M.D.; Wagner, N.; Gorini, R. The role of renewable energy in the global energy transformation. Energy Strategy Rev. 2019, 24, 38–50. [Google Scholar] [CrossRef]
  3. Hassan, Q.; Viktor, P.; Al-Musawi, T.J.; Mahmood Ali, B.; Algburi, S.; Alzoubi, H.M.; Khudhair Al-Jiboory, A.; Zuhair Sameen, A.; Salman, H.M.; Jaszczur, M. The renewable energy role in the global energy Transformations. Renew. Energy Focus 2024, 48, 100545. [Google Scholar] [CrossRef]
  4. IRENA. Global Energy Transformation: A Roadmap to 2050, 2019 ed.; International Renewable Energy Agency: Abu Dhabi, United Arab Emirates, 2019. [Google Scholar]
  5. Bogdanov, D.; Ram, M.; Aghahosseini, A.; Gulagi, A.; Oyewo, A.S.; Child, M.; Caldera, U.; Sadovskaia, K.; Farfan, J.; De Souza Noel Simas Barbosa, L.; et al. Low-cost renewable electricity as the key driver of the global energy transition towards sustainability. Energy 2021, 227, 120467. [Google Scholar] [CrossRef]
  6. Ali, M.; Seraj, M. Nexus between energy consumption and carbon dioxide emission: Evidence from 10 highest fossil fuel and 10 highest renewable energy-using economies. Environ. Sci. Pollut. Res. 2022, 29, 87901–87922. [Google Scholar] [CrossRef]
  7. Fischer, C.; Torvanger, A.; Shrivastava, M.K.; Sterner, T.; Stigson, P. How Should Support for Climate-Friendly Technologies Be Designed? Ambio 2012, 41, 33–45. [Google Scholar] [CrossRef]
  8. Lund, H.; Mathiesen, B.V.; Connolly, D.; Ostergaard, P.A. Renewable energy systems—A smart energy systems approach to the choice and modelling of 100% renewable solutions. Chem. Eng. Trans. 2014, 39, 1–6. [Google Scholar] [CrossRef]
  9. Cherubini, F.; Strømman, A.H. Life cycle assessment of bioenergy systems: State of the art and future challenges. Bioresour. Technol. 2011, 102, 437–451. [Google Scholar] [CrossRef]
  10. Ferdous, J.; Bensebaa, F.; Hewage, K.; Bhowmik, P.; Pelletier, N. Use of process simulation to obtain life cycle inventory data for LCA: A systematic review. Clean. Environ. Syst. 2024, 14, 100215. [Google Scholar] [CrossRef]
  11. Khatri, P.; Bergman, R.; Nepal, P.; Nicholls, D.; Gray, A. Evaluating life cycle greenhouse gas emissions from alternative forest residue utilization: Energy and product pathways. Biomass Bioenergy 2025, 201, 108059. [Google Scholar] [CrossRef]
  12. Xu, X.; Chen, X.; Wang, H.; Zhao, L.; Wang, Z.; Chen, W.Q. Silicon-related materials demand and embodied greenhouse gas emissions of photovoltaic systems in China’s regions. Resour. Conserv. Recycl. 2025, 215, 108076. [Google Scholar] [CrossRef]
  13. Affandi, N.A.A.; Ludin, N.A.; Welch, S.; Junedi, M.M.; Purvis-Robert, K.L. Green hydrogen-solar photovoltaic system hybrid: Life cycle assessment and potential application in Malaysia and Thailand. Int. J. Hydrogen Energy 2024, 110, 32–43. [Google Scholar] [CrossRef]
  14. Daniela-Abigail, H.L.; Vega-De-Lille, M.I.; Sacramento-Rivero, J.C.; Ponce-Caballero, C.; El-Mekaoui, A.; Navarro-Pineda, F. Life cycle assessment of photovoltaic panels including transportation and two end-of-life scenarios: Shaping a sustainable future for renewable energy. Renew. Energy Focus 2024, 51, 100649. [Google Scholar] [CrossRef]
  15. Dong, L.; Gu, Y.; Cai, K.; He, X.; Song, Q.; Yuan, W.; Duan, H. Unveiling lifecycle carbon emissions and its mitigation potentials of distributed photovoltaic power through two typical case systems. Sol. Energy 2024, 269, 112360. [Google Scholar] [CrossRef]
  16. Van Boven, F.; Van Vliet, B.; Bush, S.; Stremke, S. Inclusive intent, instrumental outcomes: How developer rationales shape participation in solar energy projects. Energy Res. Soc. Sci. 2025, 125, 104110. [Google Scholar] [CrossRef]
  17. Adebayo, T.S.; Eweade, B.S.; Özkan, O. Examining the impact of small-scale solar photovoltaic adoption and energy prices on energy-related CO2 emissions in the United States. Renew. Energy 2025, 253, 123638. [Google Scholar] [CrossRef]
  18. Biliroğlu, C.; Demirel, B.; Kılınç, G.E.; Açar, Y.; Şensoy, F. Environmental reflections of traditional and improved recipes: Assessing greenhouse gas and water footprints. Int. J. Gastron. Food Sci. 2025, 41, 101205. [Google Scholar] [CrossRef]
  19. Berger, M.; Gerbens-Leenes, W.; Karandish, F.; Aldaya, M.M.; Boulay, A.M.; Hogeboom, R.J.; Link, A.; Manzardo, A.; Mialyk, O.; Motoshita, M.; et al. Complementary strengths of water footprint and life cycle assessments in analyzing global freshwater appropriation and its local impacts—Recommendations from an Interdisciplinary discussion series. Ecol. Indic. 2025, 174, 113458. [Google Scholar] [CrossRef]
  20. Osmani, F.; Salari, T.E. Asymmetric effects of financial and technological development on green energies: Evidence from solar, wind and renewable electricity with an emphasis on crisis conditions. Results Eng. 2025, 26, 105123. [Google Scholar] [CrossRef]
  21. Karban, C.C.; Lovich, J.E.; Grodsky, S.M.; Munson, S.M. Predicting the effects of solar energy development on plants and wildlife in the Desert Southwest, United States. Renew. Sustain. Energy Rev. 2024, 205, 114823. [Google Scholar] [CrossRef]
  22. Dong, C.; Zhong, Q. Evaluating solar photovoltaic potential of buildings based on the installation parameters of photovoltaic modules. Sol. Energy 2025, 288, 113304. [Google Scholar] [CrossRef]
  23. Fan, C.; Huang, X. Monte-Carlo-based simulations of radiative transfer in photovoltaic solar farms: Towards fast and accurate parameterizations in weather and climate models. J. Quant. Spectrosc. Radiat. Transf. 2025, 338, 109417. [Google Scholar] [CrossRef]
  24. Hao, W.; Wang, X.; Liu, W.; Ma, J.; Liu, C.; Wang, L. Research on the performance and life cycle assessment of photovoltaic/thermal hybrid solar dryer: Comparative analysis with direct and mixed-mode. Appl. Therm. Eng. 2025, 272, 126425. [Google Scholar] [CrossRef]
  25. Ullah, F.; Hasrat, K.; Iqbal, S.; Kumar, S.; Wang, S.; Mu, M.; Lu, W. Evaluating the global warming potential of a 4.6 kWp solar PV system in Karak-KPK: A life cycle assessment. Appl. Therm. Eng. 2025, 266, 125790. [Google Scholar] [CrossRef]
  26. Cormos, C.C. Solar-based calcium looping power plant with thermo-chemical energy storage capability: A techno-economic and environmental (LCA) analysis. Renew. Energy 2025, 251, 123431. [Google Scholar] [CrossRef]
  27. Ibrahim, T.; Durillon, B.; Faraj, J.; Ali, S.; Saudemont, C.; Harion, J.L.; Khaled, M. A comprehensive review of solar energy systems: Technical, economic, and environmental perspectives for sustainable development. Int. Commun. Heat Mass Transf. 2025, 165, 109095. [Google Scholar] [CrossRef]
  28. Dunlap, A.A.; Sovacool, B.K.; Novakovic, B. “Our town is dying”: Exploring utility-scale and rooftop solar energy injustices in Southeastern California. Geoforum 2024, 156, 104120. [Google Scholar] [CrossRef]
  29. Cellura, M.; Luu, L.Q.; Guarino, F.; Longo, S. A review on life cycle assessment of concentrating solar energy technologies. Renew. Energy 2025, 249, 123203. [Google Scholar] [CrossRef]
  30. InfoLink Consulting. Understanding the Carbon Footprint of Solar Panel Manufacturing: A Sustainable Perspective. Available online: https://www.infolink-group.com/energy-article/Carbon-Footprint-of-Solar-Panel-Manufacturing (accessed on 13 April 2025).
  31. Davidsson, S.; Höök, M. Material requirements and availability for multi-terawatt deployment of photovoltaics. Energy Policy 2017, 108, 574–582. [Google Scholar] [CrossRef]
  32. Jusnes, K.F. Phase Transformations and Thermal Degradation in Industrial Quartz. Ph.D. Thesis, NTNU, Trondheim, Norway, 2020. [Google Scholar]
  33. Solaris Renewables. What Is the Carbon Footprint of Solar Panel Manufacturing? Available online: https://solarisrenewables.com/blog/what-is-the-carbon-footprint-of-solar-panel-manufacturing/ (accessed on 13 April 2025).
  34. Solarbe Global. Understanding the Carbon Footprint of Solar Panel Manufacturing. Available online: https://www.solarbeglobal.com/understanding-the-carbon-footprint-of-solar-panel-manufacturing/ (accessed on 13 April 2025).
  35. National Renewable Energy Laboratory (NREL). Energy and Carbon Payback Times for Modern U.S. Utility Photovoltaic Systems; National Renewable Energy Laboratory (NREL): Golden, CO, USA, 2024. [Google Scholar]
  36. Nain, P.; Yuan, L.; Anctil, A. Carbon Payback Time (CPBT) and Energy Payback Time (EPBT) of Residential Solar Photovoltaic Repowering. In Proceedings of the 2024 IEEE 52nd Photovoltaic Specialist Conference (PVSC), Seattle, WA, USA, 9–14 June 2024; pp. 1221–1224. [Google Scholar] [CrossRef]
  37. Huang, D.; Yu, T. Study on Energy Payback Time of Building Integrated Photovoltaic System. Procedia Eng. 2017, 205, 1087–1092. [Google Scholar] [CrossRef]
  38. Silveira Camargo, P.S.; Petroli, P.A.; Andrade De Souza, R.; Kerpen, F.S.; Veit, H.M. CdTe photovoltaic technology: An overview of waste generation, recycling, and raw material demand. Curr. Opin. Green Sustain. Chem. 2024, 47, 100904. [Google Scholar] [CrossRef]
  39. Tan, V.; Dias, P.R.; Chang, N.; Deng, R. Estimating the Lifetime of Solar Photovoltaic Modules in Australia. Sustainability 2022, 14, 5336. [Google Scholar] [CrossRef]
  40. Preet, S.; Smith, S.T. A comprehensive review on the recycling technology of silicon based photovoltaic solar panels: Challenges and future outlook. J. Clean. Prod. 2024, 448, 141661. [Google Scholar] [CrossRef]
  41. 8MSolar. Solar Panels and Wildlife—Lessening Environmental Impacts. Available online: https://8msolar.com/solar-panels-and-wildlife-lessening-environmental-impacts/ (accessed on 13 April 2025).
  42. Guezuraga, B.; Zauner, R.; Pölz, W. Life cycle assessment of two different 2 MW class wind turbines. Renew. Energy 2012, 37, 37–44. [Google Scholar] [CrossRef]
  43. Farina, A.; Anctil, A. Material consumption and environmental impact of wind turbines in the USA and globally. Resour. Conserv. Recycl. 2022, 176, 105938. [Google Scholar] [CrossRef]
  44. Smoucha, E.A.; Fitzpatrick, K. Life Cycle Analysis of the Embodied Carbon Emissions from 14 Wind Turbines with Rated Powers between 50 KW and 3.4 MW. J. Fundam. Renew. Energy Appl. 2016, 6, 1000211. [Google Scholar] [CrossRef]
  45. North Coast Offshore Wind. Turbine Lifecycle Emissions|North Coast Offshore Wind FAQs. Available online: https://www.northcoastoffshorewind.org/faq-turbine-carbon-lifecycle (accessed on 13 April 2025).
  46. Feng, J.; Feng, L.; Wang, J.; King, C.W. Evaluation of the onshore wind energy potential in mainland China—Based on GIS modeling and EROI analysis. Resour. Conserv. Recycl. 2020, 152, 104484. [Google Scholar] [CrossRef]
  47. Toja-Silva, F.; Colmenar-Santos, A.; Castro-Gil, M. Urban wind energy exploitation systems: Behaviour under multidirectional flow conditions—Opportunities and challenges. Renew. Sustain. Energy Rev. 2013, 24, 364–378. [Google Scholar] [CrossRef]
  48. Liu, P.; Barlow, C.Y. Wind turbine blade waste in 2050. Waste Manag. 2017, 62, 229–240. [Google Scholar] [CrossRef]
  49. Chen, J.; Wang, J.; Ni, A. Recycling and reuse of composite materials for wind turbine blades: An overview. J. Reinf. Plast. Compos. 2019, 38, 567–577. [Google Scholar] [CrossRef]
  50. BloombergNEF. Wind Turbine Blade Recycling: The Next Challenge for the Wind Industry; BloombergNEF: New York, NY, USA, 2021. [Google Scholar]
  51. Cousins, D.S.; Suzuki, Y.; Murray, R.E.; Samaniuk, J.R.; Stebner, A.P. Recycling glass fiber thermoplastic composites from wind turbine blades. J. Clean. Prod. 2019, 209, 1252–1263. [Google Scholar] [CrossRef]
  52. Adhikari, R.; Wood, D.; Sudak, L. Low-cost bamboo lattice towers for small wind turbines. Energy Sustain. Dev. 2015, 28, 21–28. [Google Scholar] [CrossRef]
  53. Joint Research Centre-European Commission. Substitution of Critical Raw Materials in Low-Carbon Technologies: Lighting, Wind Turbines and Electric Vehicles; Joint Research Centre-European Commission: Brussels, Belgium, 2016. [Google Scholar]
  54. Graabak, I.; Korpås, M. Variability Characteristics of European Wind and Solar Power Resources—A Review. Energies 2016, 9, 449. [Google Scholar] [CrossRef]
  55. Frank, C.; Fiedler, S.; Crewell, S. Balancing potential of natural variability and extremes in photovoltaic and wind energy production for European countries. Renew. Energy 2021, 163, 674–684. [Google Scholar] [CrossRef]
  56. Li, B.; Basu, S.; Watson, S.J.; Russchenberg, H.W.J. A Brief Climatology of Dunkelflaute Events over and Surrounding the North and Baltic Sea Areas. Energies 2021, 14, 6508. [Google Scholar] [CrossRef]
  57. WindEurope Business Intelligence. Wind Energy in Europe in 2019—Trends and Statistics; Technical Report; WindEurope: Brussels, Belgium, 2020. [Google Scholar]
  58. Ren, G.; Liu, J.; Wan, J.; Guo, Y.; Yu, D. Overview of wind power intermittency: Impacts, measurements, and mitigation solutions. Appl. Energy 2017, 204, 47–65. [Google Scholar] [CrossRef]
  59. Enerad. 100% Energii z Odnawialnych w Dzień Roboczy w Hiszpanii. Available online: https://enerad.pl/100-energii-z-odnawialnych-w-dzien-roboczy-w-hiszpanii/ (accessed on 13 April 2025).
  60. Farmer.pl. Wiemy, co Spowodowało Blackout w Hiszpanii i Portugalii. To Sygnał Ostrzegawczy Dla Całej Europy. Available online: https://www.farmer.pl/energia/oze/wiemy-co-spowodowalo-blackout-w-hiszpanii-i-portugalii-to-sygnal-ostrzegawczy-dla-calej-europy,160673.html (accessed on 13 April 2025).
  61. MDPI. Development of Renewable Energy Sources in Poland and Stability of Power Grids—Challenges, Technologies, and Adaptation Strategies. Available online: https://www.mdpi.com/1996-1073/18/8/2036 (accessed on 5 May 2025).
  62. European Climate Initiative (EUKI). Mapping Renewable Energy Sources Potential, Challenges, and Opportunities in Poland. Available online: https://www.euki.de/wp-content/uploads/2024/10/Mapping-Renewable-Energy-Sources-potential-challenges-and-opportunities-in-Poland.pdf (accessed on 5 May 2025).
  63. Instytut Energetyki Odnawialnej. RYNEK FOTOWOLTAIKI W POLSCE 2024 Raport Instytutu Energetyki Odnawialnej. Available online: https://cdn.bsbox.pl/files/hestia_elearning/NGE7MDA_/documents/raport_rynek_fotowoltaiki_2024.pdf (accessed on 5 May 2025).
  64. pv-magazine.com. Polish Grid Operator Switches off Gigawatts of PV. Available online: https://www.pv-magazine.com/2024/03/27/polish-grid-operator-switches-off-gigawatts-of-pv/ (accessed on 5 May 2025).
  65. Mordor Intelligence. Poland Renewable Energy Market Growth|Industry Analysis, Size. Available online: https://www.mordorintelligence.com/industry-reports/poland-renewable-energy-market (accessed on 5 May 2025).
  66. Forum Energii. Polish Grids 2040—Ready for 90 GW of Renewables. Available online: https://www.forum-energii.eu/en/polish-grids-2040 (accessed on 5 May 2025).
  67. Clean Air Task Force. What the Public Consultation Reveals About Poland’s Updated National Energy and Climate Plan. Available online: https://www.catf.us/resource/what-public-consultation-reveals-about-polands-updated-national-energy-climate-plan/ (accessed on 5 May 2025).
  68. Ember. PEP2040: Progress or Disappointment? Available online: https://ember-energy.org/latest-insights/pep2040-progress-or-disappointment/ (accessed on 5 May 2025).
  69. Strategic Energy. 120 GW Deficit: Poland’s Capacity Market and the Urgent Need to Balance Renewables with Flexible Generation. Available online: https://strategicenergy.eu/120-gw-deficit-polands-capacity-market-and-the-urgent-need-to-balance-renewables-with-flexible-generation/ (accessed on 5 May 2025).
  70. DiVA Portal. Potential and Challenges of Battery Energy Storage (BESS): The Case of Poland. Available online: https://www.diva-portal.org/smash/get/diva2:1824442/FULLTEXT01.pdf (accessed on 5 May 2025).
  71. Strategic Energy. The 400 kV Project to Integrate Renewable Energy into the Polish Grid. Available online: https://strategicenergy.eu/400-kv-project-renewable-energy-polish-grid/ (accessed on 5 May 2025).
  72. Urząd Regulacji Energetyczności. Electrical Energy Storage—First Report Issued by the President of URE. Available online: https://www.ure.gov.pl/en/communication/news/389,Electrical-energy-storage-first-report-issued-by-the-President-of-URE.html (accessed on 5 May 2025).
  73. ResearchGate. Energy Storage Management Using Artificial Intelligence to Maximize Polish Energy Market Profits. Available online: https://www.researchgate.net/publication/384424558_Energy_Storage_Management_Using_Artificial_Intelligence_to_Maximize_Polish_Energy_Market_Profits (accessed on 5 May 2025).
  74. WysokieNapiecie.pl. Magazyny Energii Kontra Gaz. Kto Wygra Rynek Mocy w 2024 Roku? Available online: https://wysokienapiecie.pl/106302-magazyny-energii-kontra-gaz-kto-wygra-rynek-mocy-w-2024-roku/ (accessed on 5 May 2025).
  75. Ministerstwo Klimatu i Środowiska. Polityka Energetyczna Polski 2040 (PEP2040); Ministerstwo Klimatu i Środowiska: Warsaw, Poland, 2021. [Google Scholar]
  76. Elektro.info. Wpływ Rozbudowy Infrastruktury Magazynów Energii na Rozwój Gospodarczy—Prognoza do 2040 r. Available online: https://www.elektro.info.pl/artykul/rynek-energii/208332,wplyw-rozbudowy-infrastruktury-magazynow-energii-na-rozwoj-gospodarczy-prognoza-do-2040-r (accessed on 5 May 2025).
  77. Guo, X.; Dong, Y.; Ren, D. CO2 emission reduction effect of photovoltaic industry through 2060 in China. Energy 2023, 269, 126692. [Google Scholar] [CrossRef]
  78. Soler, D.; Rigamonti, L.; Gazbour, N.; Fuentealba, E. Environmental performance of a 1 MW photovoltaic plant in the Atacama Desert: A life cycle assessment study. Sol. Energy 2025, 292, 113454. [Google Scholar] [CrossRef]
  79. Electrum. Energy That Blows: The Potential of Wind Farms in Poland. Available online: https://electrum.pl/en/energy-that-blows-the-potential-of-wind-farms-in-poland/ (accessed on 23 May 2025).
  80. WindIndustry.pl. Rozwój Przemysłu Onshore i Offshore Wind w Polsce. Available online: https://www.windindustry.pl/wp-content/uploads/2024/01/WIH_raport_PL.pdf (accessed on 23 May 2025).
  81. PSEW. Energetyka Wiatrowa na Nowo: Niezbędne Zmiany Legislacyjne i Analiza Potencjału Onshore. Available online: https://www.psew.pl/wp-content/uploads/2024/09/Psew_2024_Energia_na_nowo_poprawione.pdf (accessed on 23 May 2025).
  82. Poland, T. Onshore Wind Energy in Poland, Report 2021. Available online: https://www.energy-tomorrow.eu/wp-content/uploads/sites/15/2021/09/TPA-Poland-Ladowa-energetyka-wiatrowa-w-Polsce-2021.pdf (accessed on 23 May 2025).
  83. BalticWind. 41.4 GW from Onshore Wind Power by 2040 is Possible—as PWEA Estimated. Available online: https://balticwind.eu/41-4-gw-from-onshore-wind-power-by-2040-is-possible-as-pwea-estimated/ (accessed on 23 May 2025).
  84. PSEW. Offshore Wind Energy—An Opportunity for the Polish Shipbuilding Industry. Available online: https://www.psew.pl/en/offshore-wind-energy-an-opportunity-for-the-polish-shipbuilding-industry/ (accessed on 23 May 2025).
  85. PSEW. Nowy Potencjał Bałtyku: 33 GW Mocy i 20 Nowych Obszarów Pod MFW (RAPORT). Available online: https://www.psew.pl/nowy-potencjal-baltyku-33-gw-mocy-i-20-nowych-obszarow-pod-mfw-raport/ (accessed on 23 May 2025).
  86. Wind Europe. Wind Energy in Europe: 2024 Statistics and the Outlook for 2025–2030. Available online: https://windeurope.org/intelligence-platform/product/wind-energy-in-europe-2024-statistics-and-the-outlook-for-2025-2030/ (accessed on 23 May 2025).
  87. Tauron. Farmy Wiatrowe—Najtańsze Źródło Energii Odnawialnej. Available online: https://lepiej.tauron.pl/zielona-energia/farmy-wiatrowe-najtansze-zrodlo-energii-odnawialnej/#:~:text=Turbiny%20offshore%20Wiatraki%20offshore%20produkuj%C4%85%20wi%C4%99cej%20pr%C4%85du%2C,i%20z%20wi%C4%99ksz%C4%85%20si%C5%82%C4%85%20ni%C5%BC%20na%20l%C4%85dzie (accessed on 23 May 2025).
  88. Sun Valley. Turbina Wiatrowa—Budowa i Ich Ekologiczny Wpływ Na Środowisko. Available online: https://www.sunvalley.pl/pl/post/turbiny-wiatrowe-budowa-i-ich-ekologiczny-wp%C5%82yw-na%C5%82%C4%99dzie#:~:text=Odnawialne%20%C5%BAr%C3%B3d%C5%82a%20energii%2C%20takie%20jak%20turbiny%20wiatrowe,podczas%20eksploatacji%2C%20co%20czyni%20je%20bardziej%20ekolog (accessed on 23 May 2025).
  89. USGS. What Materials Are Used to Make Wind turbines? Available online: https://www.usgs.gov/faqs/what-materials-are-used-make-wind-turbines (accessed on 23 May 2025).
  90. Tota-Maharaj, K.; McMahon, A. Resource and waste quantification scenarios for wind turbine decommissioning in the United Kingdom. Waste Dispos. Sustain. Energy 2021, 3, 117–144. [Google Scholar] [CrossRef]
  91. Li, Y.F.; Yu, C.C.; Chen, S.Y.; Sainey, B. The Carbon Footprint Calculation of the GFRP Pedestrian Bridge at Tai-Jiang National Park. Int. Rev. Spat. Plan. Sustain. Dev. 2013, 1, 13–28. [Google Scholar] [CrossRef]
  92. Union of Concerned Scientists. How Are Wind Turbines Made? Available online: https://blog.ucs.org/charlie-hoffs/how-are-wind-turbines-made/#:~:text=The%20foundation:%20Once%20developers%20select,and%20165%20tons%20of%20steel (accessed on 23 May 2025).
  93. Power, B. Pierwsze Fundamenty na Morskiej Farmie Baltic Power Zainstalowane. Available online: https://balticpower.pl/aktualnosci/pierwsze-fundamenty-na-morskiej-farmie-baltic-power-zainstalowane/ (accessed on 23 May 2025).
  94. Mikinia, K.; Więcławski, P. Projektowanie Posadowienia Morskich Elektrowni Wiatrowych Na Morzu Bałtyckim Według Przepisów I Zaleceń Europejskich. Zagadnienia Aktual. Poruszane Przez Młodych Nauk. 2018, 12, 131–136. [Google Scholar]
  95. Department of Public Service, NY. Wind Turbine Component Delivery Vehicles. Available online: https://documents.dps.ny.gov/public/Common/ViewDoc.aspx?DocRefId=%7BB4CCEEB4-3F84-4722-8655-C1DB61173CD9%7D#:~:text=The%20following%20component%20deliveries%20are%20required%20for,the%20hub%20height%20and%20the%20turbine%20design (accessed on 23 May 2025).
  96. Naiborhu, M.A.; Purwanti, D.R.; Kumalasari, S.D.; Idris, M.K.; Dwisa, C.B.P.; Elkhomei, A.S.; Purnawanti, Y.N. Transportation challenges for onshore wind turbine power plant development in Indonesia. IOP Conf. Ser. Earth Environ. Sci. 2025, 1464, 012002. [Google Scholar] [CrossRef]
  97. ICCT. CO2 Emissions from Trucks in the EU: An Analysis of the Heavy-Duty CO2 Standards Baseline Data. Available online: https://theicct.org/publication/co2-emissions-from-trucks-in-the-eu-an-analysis-of-the-heavy-duty-co2-standards-baseline-data/#:~:text=Urban%20delivery%20trucks%20with%20a,gCO_2/t%2Dkm (accessed on 23 May 2025).
  98. Energetyka24. Vestas Otworzy w Szczecinie nie Jedną, a Dwie Fabryki. Miasto Stanie się „Offshore’ową Stolicą Polski”. Available online: https://energetyka24.com/oze/wiadomosci/vestas-otworzy-w-szczecinie-nie-jedna-a-dwie-fabryki-miasto-stanie-sie-offshoreowa-stolica-polski#google_vignette (accessed on 23 May 2025).
  99. Vestas. Nowa Fabryka Gondoli dla Morskich Turbin Wiatrowych w Szczecinie. Available online: https://www.vestas.com/en/pages/szczecin-visit-polish (accessed on 23 May 2025).
  100. Power, B. Baltic Power—O Projekcie. Available online: https://balticpower.pl/o-projekcie/ (accessed on 23 May 2025).
  101. Energy, B. Baltica Two and Three. Available online: https://baltica.energy/en/baltica-two-and-three (accessed on 23 May 2025).
  102. Climate Action Accelerator. Shift from Air to Sea freight. Available online: https://climateactionaccelerator.org/solutions/sea_freight/ (accessed on 23 May 2025).
  103. EPRI. Overview of Emissions Impacts from Grid-Connected Battery Energy Storage. Available online: https://restservice.epri.com/publicdownload/000000003002020074/0/Product (accessed on 5 May 2025).
  104. DiVA Portal. Lifecycle Assessment of a Lithium-Ion Battery Storage System for Frequency Regulation in a Real-World Application. Available online: https://uu.diva-portal.org/smash/get/diva2:1740324/FULLTEXT01.pdf (accessed on 5 May 2025).
  105. Gaines, L. The future of automotive lithium-ion battery recycling: Charting a sustainable course. Sustain. Mater. Technol. 2014, 1–2, 2–7. [Google Scholar] [CrossRef]
  106. Forum Energii. Energy Transformation in Poland. Edition 2024—Report. Available online: https://www.forum-energii.eu/en/yearbook-energy-data-1 (accessed on 23 May 2025).
  107. Hall, R.; João, E.; Knapp, C.W. Environmental impacts of decommissioning: Onshore versus offshore wind farms. Environ. Impact Assess. Rev. 2020, 83, 106404. [Google Scholar] [CrossRef]
  108. Topham, E.; McMillan, D.; Bradley, S.; Hart, E. Recycling offshore wind farms at decommissioning stage. Energy Policy 2019, 129, 698–709. [Google Scholar] [CrossRef]
  109. Jensen, J.P. Evaluating the environmental impacts of recycling wind turbines. Wind Energy 2019, 22, 316–326. [Google Scholar] [CrossRef]
  110. Clean Grid Alliance. Wind Turbine Recycling and Disposal. Available online: https://cleangridalliance.org/blog/137/wind-turbine-recycling-and-disposal (accessed on 23 May 2025).
  111. Vougioukas, E.; Stamos, A.; Pappa, C.; Lagaros, N.D. Enhancing Onshore Wind Tower Foundations: A Comprehensive Automated Design Approach. CivilEng 2024, 5, 736–759. [Google Scholar] [CrossRef]
  112. Spini, F.; Bettini, P. End-of-Life wind turbine blades: Review on recycling strategies. Compos. Part B Eng. 2024, 275, 111290. [Google Scholar] [CrossRef]
  113. Group, W.B.W. Decommissioned Wind Turbine Blade Management Strategies. Available online: https://cleanpower.org/wp-content/uploads/gateway/gateway/2023/01/ACP_BladeRecycling_WhitePaper_240905.pdf (accessed on 23 May 2025).
  114. Jensen, J.; Skelton, K. Wind turbine blade recycling: Experiences, challenges and possibilities in a circular economy. Renew. Sustain. Energy Rev. 2018, 97, 165–176. [Google Scholar] [CrossRef]
  115. DNV. Grid Congestion in the Polish Power Grid. Available online: https://www.dnv.com/article/grid-congestion-in-the-polish-power-grid/ (accessed on 5 May 2025).
  116. Turney, D.; Fthenakis, V. Environmental impacts from the installation and operation of large-scale solar power plants. Renew. Sustain. Energy Rev. 2011, 15, 3261–3270. [Google Scholar] [CrossRef]
  117. MIT Climate Portal. How Much CO2 Is Emitted by Manufacturing Batteries? Available online: https://climate.mit.edu/ask-mit/how-much-co2-emitted-manufacturing-batteries (accessed on 5 May 2025).
  118. Energimyndigheten. The Life Cycle Energy Consumption and Greenhouse Gas Emissions from Lithium-Ion Batteries. Available online: https://www.energimyndigheten.se/globalassets/forskning–innovation/transporter/c243-the-life-cycle-energy-consumption-and-co2-emissions-from-lithium-ion-batteries-.pdf (accessed on 5 May 2025).
  119. Institute for Energy Research (IER). Environmental Impacts of Lithium-Ion Batteries. Available online: https://www.instituteforenergyresearch.org/renewable/environmental-impacts-of-lithium-ion-batteries/ (accessed on 5 May 2025).
  120. Liang, Y.; Su, J.; Xi, B.; Yu, Y.; Ji, D.; Sun, Y.; Cui, C.; Zhu, J. Life Cycle Assessment of Lithium-Ion Batteries for Greenhouse Gas Emissions. Available online: https://linkinghub.elsevier.com/retrieve/pii/S0921344916302324 (accessed on 18 June 2025). [CrossRef]
  121. Zhang, K.; Mo, J.; Liu, Z.; Yin, W.; Wu, F.; You, J. Life cycle environmental and economic impacts of various energy storage systems: Eco-efficiency analysis and potential for sustainable deployments. Integr. Environ. Assess. Manag. 2025, vjaf035. [Google Scholar] [CrossRef] [PubMed]
  122. California Energy Commission (CEC). Life Cycle Assessment of Environmental and Human Health Impacts of Flow Battery Energy Storage Production and Use. Available online: https://www.energy.ca.gov/sites/default/files/2021-12/CEC-500-2021-051.pdf (accessed on 5 May 2025).
  123. ADECE ESG. Environmental Impacts of Renewable Energy Sources. Available online: https://www.adecesg.com/resources/blog/environmental-impacts-of-renewable-energy-sources/#:~:text=Long%2Dterm%20environmental%20impacts%20vary,routes%20and%20impact%20habitat%20quality (accessed on 13 April 2025).
  124. U.S. Geological Survey. Can Wind Turbines Harm Wildlife? Available online: https://www.usgs.gov/faqs/can-wind-turbines-harm-wildlife (accessed on 13 April 2025).
  125. BlueWatt. Czy Turbiny Wiatrowe Mają Wpływ na Środowisko Naturalne? Available online: https://bluewatt.pl/turbiny-wiatrowe-wplyw-na-srodowisko/ (accessed on 13 April 2025).
  126. Discover Wildlife. Blown Away: Almost 70% of Animals Displaced from Homes by Wind-Power Developments. Available online: https://www.discoverwildlife.com/news/wildlife-avoids-wind-power-developments (accessed on 13 April 2025).
  127. Stopwiatrakom.eu. Farmy Wiatrowe Niszczą Naturalne Ekosystemy. Available online: https://stopwiatrakom.eu/blog-barbary-lebiedowskiej/2218-farmy-wiatrowe-niszcz%C4%85-naturalne-ekosystemy.html (accessed on 13 April 2025).
  128. Polskie Stowarzyszenie Energetyki Wiatrowej. Morskie Elektrownie Wiatrowe—Jak Wpływają na Środowisko? Available online: https://www.psew.pl/morskie-elektrownie-wiatrowe-jak-wplywaja-na-srodowisko/ (accessed on 13 April 2025).
  129. Wilhelmsson, D.; Malm, T. Fouling assemblages on offshore wind power plants and adjacent substrata. Estuar. Coast. Shelf Sci. 2008, 79, 459–466. [Google Scholar] [CrossRef]
  130. Inger, R.; Attrill, M.J.; Bearhop, S.; Broderick, A.C.; James Grecian, W.; Hodgson, D.J.; Mills, C.; Sheehan, E.; Votier, S.C.; Witt, M.J.; et al. Marine renewable energy: Potential benefits to biodiversity? An urgent call for research. J. Appl. Ecol. 2009, 46, 1145–1153. [Google Scholar] [CrossRef]
  131. Thomsen, F.; Lüdemann, K.; Kafemann, R.; Piper, W. Effects of Offshore Wind Farmnoise on Marine Mammals and Fish; Biola: Hamburg, Germany; COWRIE Ltd.: Middlesex, UK, 2006. [Google Scholar]
  132. Rezaei, F.; Contestabile, P.; Vicinanza, D.; Azzellino, A. Towards understanding environmental and cumulative impacts of floating wind farms: Lessons learned from the fixed-bottom offshore wind farms. Ocean Coast. Manag. 2023, 243, 106772. [Google Scholar] [CrossRef]
  133. Endangered Species Coalition. How Renewable Energy Impacts Biodiversity. Available online: https://www.endangered.org/how-renewable-energy-impacts-biodiversity/ (accessed on 13 April 2025).
  134. Kinute. Does Solar Have a Dark Side? Solar Impacts on Rural landscapes and the Family Farm. Available online: https://kinute.com/stories/653951956-does-solar-have-a-dark-side-solar-impacts-on-rural-landscapes-and-the-family-farm (accessed on 13 April 2025).
  135. Środowisko.pl. Jak Farmy Fotowoltaiczne Wpływają na Środowisko? Available online: https://www.srodowisko.pl/wiadomosci-i-komunikaty/jak-farmy-fotowoltaiczne-wplywaja-na-srodowisko–222954-10 (accessed on 13 April 2025).
  136. RatedPower. Examining the Ecological Trends in UK Solar Farms. Available online: https://ratedpower.com/blog/economical-trends-uk-solar-farms/ (accessed on 13 April 2025).
  137. Aspiration. The Environmental Impact of Solar Energy: Is It Truly Worth It? Available online: https://www.aspiration.com/resources/the-environmental-impact-of-solar-energy (accessed on 13 April 2025).
  138. Polskie Sieci Elektroenergetyczne. Raport 2024 KSE. Available online: https://www.pse.pl/dane-systemowe/funkcjonowanie-kse/raporty-roczne-z-funkcjonowania-kse-za-rok/raporty-za-rok-2024#t1_1 (accessed on 27 May 2025).
  139. Centrum Analiz Klimatyczno-Energetycznych. Polska Net-Zero 2050 Transformacja Sektora Energetycznego Polski i UE do 2050 Roku. Available online: https://climatecake.ios.edu.pl/wp-content/uploads/2022/06/CAKE_Transformacja-sektora-energetycznego_27.06.2022_final.pdf (accessed on 27 May 2025).
  140. Wysokie Napięcie. Padł Rekord Zapotrzebowania na Moc—Blisko 29 GW. Available online: https://wysokienapiecie.pl/96259-padl-rekord-zapotrzebowania-na-moc-blisko-29-gw/ (accessed on 27 May 2025).
  141. The Guardian. What Caused the Blackout in Spain and Portugal and Did Renewable Energy Play a Part? Available online: https://www.theguardian.com/environment/2025/apr/29/what-caused-the-blackout-in-spain-and-portugal-and-did-renewable-energy-play-a-part (accessed on 27 May 2025).
  142. Gagnon, L.; Belanger, C.; Uchiyama, Y. Life-cycle assessment of electricity generation options: The status of research in year 2001. Energy Policy 2002, 30, 1267–1278. [Google Scholar] [CrossRef]
  143. World Nuclear Association. Carbon Dioxide Emissions from Electricity. Available online: https://world-nuclear.org/information-library/energy-and-the-environment/carbon-dioxide-emissions-from-electricity (accessed on 27 May 2025).
  144. Planete Energies. Electricity Generation and CO2 Emissions. Available online: https://www.planete-energies.com/en/media/article/electricity-generation-and-related-co2-emissions (accessed on 27 May 2025).
  145. UNECE. Life Cycle Assessment of Electricity Generation Options. Available online: https://unece.org/sites/default/files/2021-09/202109_UNECE_LCA_1.2_clean.pdf (accessed on 27 May 2025).
  146. Redondo de la Mata, A. Life-Cycle and Sustainable Assessment of Integrated Photovoltaic Roof Systems: Potential for Regenerative Carbon Footprint Roofs in the Current Situation of Denmark. Master’s Thesis, Universidad de Cantabria, Cantabria, Spain, 2014. [Google Scholar]
  147. Arvesen, A.; Hertwich, E.G. Assessing the life cycle environmental impacts of wind power: A review of present knowledge and research needs. Renew. Sustain. Energy Rev. 2012, 16, 5994–6006. [Google Scholar] [CrossRef]
  148. PCI Energy Solutions. Understanding the Differences Between Non-Dispatchable and Dispatchable Generation. Available online: https://www.pcienergysolutions.com/2024/05/01/understanding-the-differences-between-non-dispatchable-and-dispatchable-generation/ (accessed on 27 May 2025).
  149. Rynek Elektryczny. Produkcja Energii Elektrycznej. Raport Roczny 2024. Available online: https://www.rynekelektryczny.pl/produkcja-energii-elektrycznej-raport-roczny/ (accessed on 27 May 2025).
  150. Forum Energii. 2024_Wrapped od Forum Energii, Czyli Błyskawiczny Przegląd Najciekawszych Danych z Elektroenergetyki. Available online: https://www.forum-energii.eu/2024_wrapped#:~:text=Wsp%C3%B3%C5%82czynnik%20wykorzystania%20mocy%20dla%20w%C4%99gla%20kamiennego%20systematycznie,wi%C4%99cej%20tyle%20samo%20czasu%2C%20ile%20%C5%BAr%C3%B3d%C5%82a%20wiatrowe (accessed on 27 May 2025).
  151. POLON. Bezprecedensowy Marsz Fotowoltaiki w Polsce. To nie Tylko Zalety ale też Wady. Available online: https://www.polon.pl/energia-i-klimat/bezprecedensowy-marsz-fotowoltaiki-w-polsce-to-nie-tylko-zalety-ale-tez-wady/ (accessed on 27 May 2025).
  152. Portal Interoperacyjności i Architektury. Polityka Energetyczna Polski do 2040 r. (PEP2040). Available online: https://www.gov.pl/web/ia/polityka-energetyczna-polski-do-2040-r-pep2040 (accessed on 27 May 2025).
  153. EUR-Lex. Directive (EU) 2018/2001 of the European Parliament and of the Council of 11 December 2018 on the Promotion of the Use of Energy from Renewable Sources. Available online: https://eur-lex.europa.eu/legal-content/EN/ALL/?uri=CELEX%3A32018L2001 (accessed on 27 May 2025).
Figure 1. Graphic representation of the study’s methodological framework.
Energies 18 03332 g001
Figure 2. Energy technology life cycle.
Energies 18 03332 g002
Figure 3. Individual steps of the procedures carried out throughout the case study of Poland.
Energies 18 03332 g003
Figure 4. Energy technology life cycle.
Energies 18 03332 g004
Table 1. LCA conversion for 60 [GW] estimated in 2050.
For 17.03 [GW] For 60 [GW]
CO 2 emissions from production [t]3436.005 CO 2 emissions from production [t]12,105.712
CO 2 emissions from storage [t]5117.295 CO 2 emissions from storage [t]180,096.165
CO 2 emissions from decommissioning and utilization [t]13,895.880 CO 2 emissions from decommissioning and utilization [t]48,957.886
Table 2. CO 2 emissions in the production phase of onshore and offshore wind turbines.
MaterialOnshore Turbine
(4.6 [MW]) [t CO 2 ]
Offshore Turbine
(10.1 [MW]) [t CO 2 ]
Steel6161848
Iron132396
Composite (e.g., GFRP [91])126379
Copper2266
Aluminum60180
Total9562869
Table 3. Assumed CO 2 emissions from Li-Ion energy storage combined with wind energy.
StageEmissions
[kg  CO 2 /kWh]
Comments
Production175Depending on the size of the warehouse and its purpose
Operation0Energy comes exclusively from wind
System losses0.04It increases the demand for energy from the grid by about 5–15%. An increase in demand of 10% was assumed, and the level of emissions from energy production was assumed to be 400 [g  CO 2 /kWh] [106]
Disposal and recycling15It allows you to recover raw materials and reduce the footprint in subsequent warehouses produced by up to 30–40%
Table 4. CO 2 emissions at the disposal stage of an onshore wind turbine.
ElementMaterialEstimated Mass [t]Disposal Method CO 2 Emissions
FoundationConcrete1000Crushing50
Steel165Recycling82.5
TowerSteel180Recycling90
Iron30 15
GondolaSteel100Recycling50
Copper8 3.2
Aluminium4 2.4
Composite/Plastics3Co-Firing2.4
RotorComposite
(e.g., GFRP)
45Co-Firing36
Iron30Recycling15
Table 5. CO 2 emissions at the disposal stage of an offshore wind turbine.
ElementMaterialEstimated Mass [t]Disposal Method CO 2 Emissions
FoundationSteel1200Recycling600
TowerSteel500Recycling250
Iron100 50
GondolaSteel340Recycling170
Copper24 9.6
Aluminium12 7.2
Composite/Plastics24Co-Firing19.2
RotorComposite
(e.g., GFRP)
120Co-Firing96
Iron80Recycling40
Table 6. Life-cycle CO 2 emissions of onshore wind farms connected to 120 [GWh] of energy storage.
Specific Emissions
[g  CO 2 /kWh]
Life-Cycle Emissions of
Wind Farms [t CO 2 ]
Production (Ponshore)5.79Production (TPonshore)14,465,397.46
Transportation (Tonshore)1.10Transportation (TTonshore)2,748,175.68
Storage (Monshore)9.13Storage (TMonshore)22,803,612.31
Disposal (Uonshore)0.90Disposal (TUonshore)2,248,507.377
Total Emission (Conshore)16.92Total Emission (TConshore)42,265,692.83
Table 7. Life-cycle CO 2 emissions of offshore wind farms connected to 120 [GWh] of energy storage.
Specific Emissions
[g  CO 2 /kWh]
Life-Cycle Emissions of
Wind Farms [t CO 2 ]
Production (Poffshore)4.98Production (TPoffshore)16,368,419.79
Transportation (Toffshore)1.60Transportation (TToffshore)5,258,930.05
Storage (Moffshore)6.94Storage (TMoffshore)22,803,823.88
Disposal (Uoffshore)1.12Disposal (TUoffshore)3,681,251.04
Total Emission (Coffshore)14.64Total Emission (TCoffshore)48,112,424.76
Table 8. Life-cycle CO 2 emissions of farms with a total capacity of 60 [GW] combined with 120 [GWh] of energy storage.
Specific Emissions
[g  CO 2 /kWh]
Life-Cycle Emissions of
Wind Farms [t CO 2 ]
Production (P)5.33Production (TP)30,833,817.250
Transportation (T)1.38Transportation (TT)8,007,105.730
Storage (M)3.94Storage (TM)22,805,151.230
Disposal (U)1.03Disposal (TU)5,929,758.417
Total Emission (C)11.68Total Emission (TC)67,575,832.630
Table 9. Typical ranges of energy-storage facilities and the associated CO 2 emissions.
System ScaleMid-Range CapacityUseCapacity for CalculationsEmissions
(150 [kg/kWh])
Home5–15 [kWh]Home warehouses (e.g., Tesla Powerwall)10 [kWh]1.5 [t CO 2 eq]
Commercial/
Small RES
100–500 [kWh]Small PV farms, multi-family buildings250 [kWh]37.5 [t CO 2 eq]
Industrial1–10 [MWh]Medium-sized PV/Wind farms2 [MWh]300 [t CO 2 eq]
Large-scale50–1000+ [MWh]Grid storage, power plants100 [MWh]15,000 [t CO 2 eq]
Table 10. CO 2 emissions of energy storage.
Stage CO 2 EmissionsComments
Production150–200 [kg/kWh]The largest share
OperationSource dependentZero if it uses RES
System losses5–15% energyThey increase the demand for energy from the grid
Disposal and recycling15 [kg/kWh]It enables the recovery of raw materials and contributes to the reduction of emissions in the future.
Table 11. Comparison of CO 2 emissions in the life cycle of selected energy sources in the case of Poland.
Energy SourceProduction [kt  CO 2 ]Transport [kt  CO 2 ]Exploitation [kt  CO 2 ]Storage [kt  CO 2 ]Disposal [kt  CO 2 ]Total Energy Source Life-Cycle Emissions [kt  CO 2 ]
Coal585,771.91115,708.035,107,063.260121,493.435,930,036.63
Natural gas309,256.01216,479.212,467,736.76099,088.153,092,560.13
Photovoltaics12.11-0180.1048.96241.16
Wind30,833.828007.11022,805.155929.7667,575.83
Table 12. CO 2 emissions from annual electricity production depending on the power source.
Energy SourceCapacity Factor [%]Average Actual Power [GW]Required Number of Days of Operation of the Energy SourceUnit Emissions [g  CO 2 /kWh]Emissions from the Production of 170 TWh of Energy [kt  CO 2 ]
Coal5533215820139,400
Natural gas4828.824649083,300
Photovoltaics15978754.59265
Wind4426.426811.71989
Table 13. Linear regression model parameters.
EstimateStd. Errort ValuePr(>|t|)
Intercept−4,668,996.1517,869.8−9.0162.06 × 10−6
Slope2326.7256.89.0621.96 × 10−6
Table 14. Exponential regression model parameters.
EstimateStd. Errort ValuePr(>|t|)
Intercept−1.848 × 10212.84−14.391.77 × 10−8
Slope9.657 × 10−26.368 × 10−315.161.02 × 10−8
Disclaimer/Publisher’s Note: The statements, opinions and data contained in all publications are solely those of the individual author(s) and contributor(s) and not of MDPI and/or the editor(s). MDPI and/or the editor(s) disclaim responsibility for any injury to people or property resulting from any ideas, methods, instructions or products referred to in the content.

